Embed Size (px)
Citation preview
Seventh Northwest Conservation and Electric Power Plan
nwcouncil.org/7thplan 13-1
CHAPTER 13: GENERATING RESOURCES
Contents Key Findings ..................................................................................................................................... 3 Introduction ....................................................................................................................................... 4
Role of Generating Resources in the Power Plan .......................................................................... 5 Generating Resource Classifications ............................................................................................. 5
Environmental Effects and Quantified Environmental Costs .............................................................. 6 Primary Resources ............................................................................................................................ 7
Transmission ............................................................................................................................... 12 Natural Gas Generating Technologies ......................................................................................... 13
Combined Cycle Combustion Turbine ...................................................................................... 15 Reciprocating Engine ............................................................................................................... 16 Simple Cycle Gas Turbines ...................................................................................................... 17 Environmental Effects of Natural Gas Technologies ................................................................. 19
Solar Technologies ...................................................................................................................... 21 Utility-Scale Solar Photovoltaic ................................................................................................. 23 Distributed Solar Photovoltaic .................................................................................................. 26 Environmental Effects of Solar Technologies ........................................................................... 27
Wind Power ................................................................................................................................. 27 Utility-scale, Onshore ............................................................................................................... 28 Utility–Scale, Offshore .............................................................................................................. 30 Environmental Effects of Onshore Wind Power Technologies .................................................. 30
Secondary Resources ..................................................................................................................... 32 Hydroelectric Power ..................................................................................................................... 32
Pumped Storage ...................................................................................................................... 33 Combined Heat and Power .......................................................................................................... 35 Geothermal Power Generation .................................................................................................... 36
Conventional Geothermal Power Generation ........................................................................... 36 Enhanced Geothermal Systems ............................................................................................... 37
Biomass ....................................................................................................................................... 38 Energy Storage Technologies ...................................................................................................... 39
Battery Technologies ............................................................................................................... 40 Long-term Potential, Emerging Technologies .................................................................................. 43
Wave Energy ............................................................................................................................... 43 Small Modular Reactors ............................................................................................................... 44
Chapter 13: Generating Resources
nwcouncil.org/7thplan 13-2
List of Figures and Tables
Table 13 - 1: Classification of Generating Resources* ....................................................................... 6 Table 13 - 2: Summary of Natural Gas Generating Resources – with Service Year of 2020 .............. 9 Figure 13 - 1: Levelized Cost of Energy for Natural Gas Resources - with Service Year of 2020 ..... 10 Table 13 - 3: Summary of Renewable Resources – with Service Year of 2020 ............................... 11 Figure 13 - 2: Levelized Cost of Energy for Renewable Resources – with Service Year of 2020 ..... 12 Table 13 - 4: Natural Gas Pipelines ................................................................................................. 14 Table 13 - 5: Combined Cycle Combustion Turbine Reference Plants ............................................ 16 Figure 13 - 3: Least Cost Gas Plant Solution by Energy Requirement ............................................. 19 Figure 13 - 4: Forecast of Capital Costs for Utility-Scale Solar PV ................................................... 25 Figure 13 - 5: LCOE Forecast Range for Utility-Scale Solar PV ....................................................... 26 Figure 13 - 6: Example of Utility-Scale Solar PV and Battery Storage System ................................. 43
Chapter 13: Generating Resources
nwcouncil.org/7thplan 13-3
KEY FINDINGS Hydroelectric power is the cornerstone of the existing regional power generating system. Proven technologies which could be added to the system over the next twenty years include highly efficient combined cycle combustion turbines, super flexible reciprocating engines and aeroderivative gas turbines, and clean and renewable solar, wind power, and geothermal.
For assessment purposes, generating resource technologies have been classified into three categories: primary, secondary, and long-term. Primary resources are commercially proven technologies that have the potential to be developed within the twenty year planning horizon and play a major role in the future regional power system. For the Seventh Power Plan, the primary generating resources include: natural gas-fired simple cycle and combined cycle turbines and reciprocating engines, solar photovoltaic, and onshore wind. The Council developed model reference plants with estimated costs and performance characteristics for each of the primary resources as inputs to the Regional Portfolio Model.
Natural gas-fired technologies in the region benefit from a robust existing natural gas infrastructure system and inexpensive fuel supply. Regional pipelines have the ability to tap prolific gas supply basins in the United States and Canada, and gas storage is available in several geographic locations. Combined cycle combustion turbines are the largest and most efficient of the gas technologies. Heat rates (efficiency) and operational performance for this technology continues to improve. These versatile power plants have the ability to replace baseload coal power, act as a firming resource for variable renewable generation, and fill in gaps from reduced hydro production during low water years. Combined cycle combustion turbine plants also emit carbon dioxide at significantly lower rates than coal plants, and may play a role in helping to reduce overall carbon dioxide emissions as proposed in the Federal Clean Power Plan.
Natural gas-fired reciprocating engine technology has improved in recent years and has become a valuable resource for enhancing system flexibility. Reciprocating engine generating sets are highly modular, are quick starting, and offer the best efficiency compared to simple cycle combustion turbines, especially when partially loaded. As a result, these gas plants may run more frequently than other typical peaking gas turbines.
Costs for solar photovoltaic technology have dropped significantly in the five years since the Sixth Plan was developed. Investments into research and development have paid dividends in improved solar cell efficiency, and high-tech module manufacturing on a large scale has brought solar costs down far enough to rival other variable energy resources. Photovoltaic systems (utility-scale and distributed) are relatively simple and quick to install, have no emissions, and have a generation pattern that matches favorably with summer loads in the region. However, solar does not produce at night, and during daylight hours, generation can vary due to atmospheric conditions such as cloud cover. As lower cost battery storage systems emerge, the combination of solar power with storage could offer an economical solution to these issues. Solar installations are wide spread and rapidly growing in the U.S., and, though not as common in the Northwest, activity is picking up. Future solar costs are forecast to continue to decline over the next 20 years. However there is a wide band of uncertainty around the cost of solar; actual costs may come in much lower (or higher) than expected.
Chapter 13: Generating Resources
nwcouncil.org/7thplan 13-4
Wind technology has continued to advance, resulting in higher levels of generation per turbine. The region has experienced significant wind power build-out in the Columbia Basin of Oregon and Washington, and while wind development in Montana has been limited, that region offers a generous wind resource potential. Wind generation patterns in the two areas are complementary: Columbia Basin typically produces more wind in the spring and early summer, while Montana offers better winter month wind generation. However the lack of available transmission to bring Montana wind to the load centers of Western Oregon and Washington is a significant challenge to extensive development.
Secondary resources are classified as commercially available but are limited in terms of developable potential, by cost or site limitations. Storage technologies can fall into both secondary and long-term resources. Battery storage systems may be an important component of the future power system, especially when paired with variable renewable generating resources such as solar. The manufacturing and use of battery technologies, particularly Lithium-ion batteries, is beginning to ramp up which may bring the costs down, making it a more attractive resource.
Conventional geothermal, while classified as a secondary resource for the Seventh Power Plan due to its limited development to date and limited potential, is a viable alternative renewable resource to wind and solar, as well as a baseload resource competitive with natural gas technologies.
Long-term resources include technologies that are not yet commercially available but may have significant potential. Enhanced geothermal systems, which essentially mine the earth’s heat, is a promising emerging technology which could provide renewable baseload power with little to no greenhouse gas emissions and has tremendous potential in the Northwest.
INTRODUCTION This chapter describes the proven generating and energy storage alternatives that are commercially available and deployable to the Pacific Northwest to meet energy and capacity needs during the power plan’s 20-year planning period and the process in which these resources were evaluated and estimated for the Seventh Power Plan. Additional detailed information on generating resources is available in Appendix H and information on environmental effects, environmental regulations, and compliance actions is available in Appendix I.
The Northwest Power Act requires priority be given to resources that are cost-effective, defined as resources that are available at the estimated incremental system cost no greater than that of the least-cost similarly reliable and available alternative.1 Since there are sufficient resources using reliable, commercially available technologies to meet the region’s forecast needs over the 20-year planning period, unproven resources, including those whose availability and quantity is poorly understood or that depend on immature technology, were not considered for the portfolio risk analysis. Certain unproven and emerging resources, including offshore wind power, wave energy, tidal currents, enhanced geothermal, and some energy storage technologies have substantial
1 Northwest Power Act 3.(4)(A)
Chapter 13: Generating Resources
nwcouncil.org/7thplan 13-5
Northwest potential. Actions to monitor and support development of these technologies are included in the Action Plan in Chapter 4.
Role of Generating Resources in the Power Plan The identification and assessment of generating resources provides options for the Regional Portfolio Model (RPM) when selecting the most cost-effective, least-risk power plan for the region. Resource technologies are assessed based on their cost, operating and performance characteristics, and developable potential in the region. Resources that are deemed proven and likely available to meet future needs in the region are further developed into reference plants – with a designated plant size and configuration representative for the Pacific Northwest, characteristics and performance attributes, cost estimates (capital, operating and maintenance, levelized), and other attributes such as an estimated construction schedule and economic life. These reference plants become inputs to the RPM as options for selection to fulfill future resource needs.
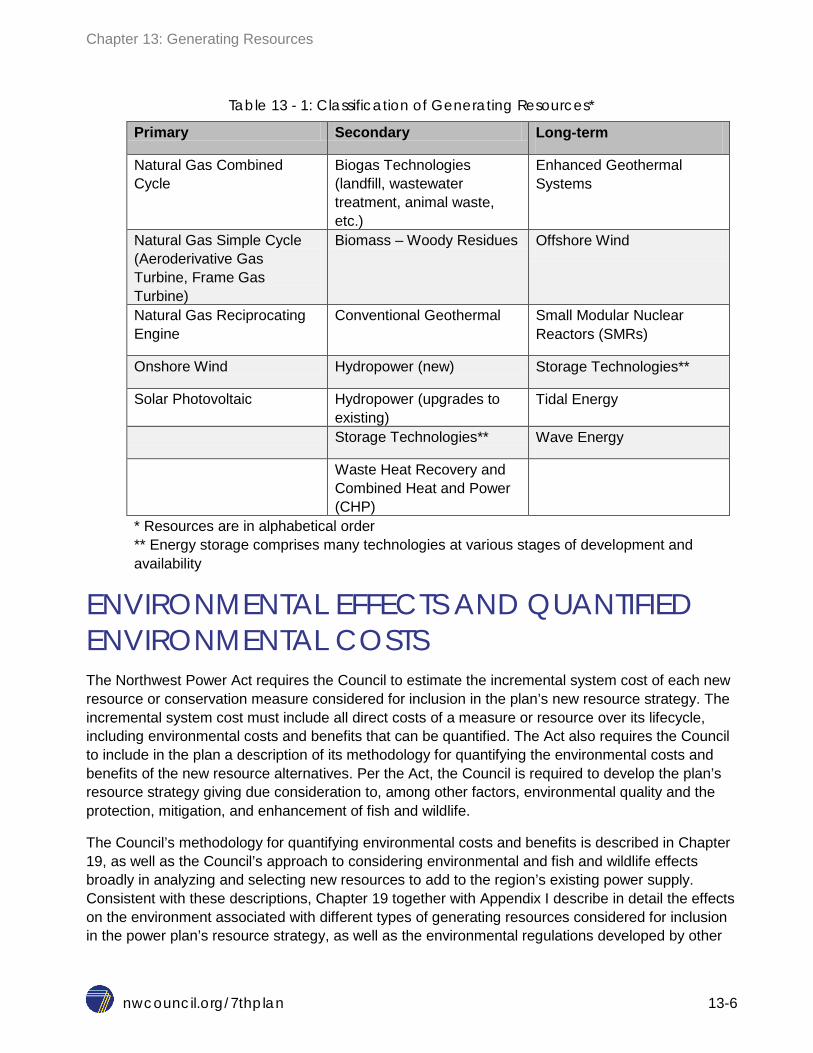
Generating Resource Classifications The Council prioritized and categorized generating resources based on a resource’s commercial availability, constructability, and quantity of developable potential in the Pacific Northwest during the 20-year planning period. The classifications of resources analyzed for the Seventh Power Plan are: primary, secondary, and long-term (see Table 13 - 1). The definitions and levels of assessment are as follows:
Primary: Significant resources that are deemed proven, commercially available, and deployable on a large scale in the Pacific Northwest at the start of the power planning period. These resources have the potential to play a major role in the future regional power system. Primary resources receive an in-depth, quantitative assessment to support system integration and risk analysis modeling. Primary resources are modeled in the RPM.
Secondary: Commercially available resources with limited, or small-scale, developmental potential in the Pacific Northwest. While secondary resources are currently in-service or available for development in the region, they generally have limited potential in terms of resource availability or typical plant size. Secondary resources receive at least a qualitative assessment to estimate status and potential and sometimes a quantitative assessment to estimate cost. While secondary resources are not explicitly modeled in the RPM, they are still considered viable resource options for future power planning needs.
Long-term: Emerging resources and technologies that have a long-term potential in the Pacific Northwest but are not commercially available or deployable on a large scale at the beginning of the power planning period. Long-term resources receive a qualitative assessment and if available, quantification of key attributes.
Chapter 13: Generating Resources
nwcouncil.org/7thplan 13-6
Table 13 - 1: Classification of Generating Resources*
Primary Secondary Long-term
Natural Gas Combined Cycle
Biogas Technologies (landfill, wastewater treatment, animal waste, etc.)
Enhanced Geothermal Systems
Natural Gas Simple Cycle (Aeroderivative Gas Turbine, Frame Gas Turbine)
Biomass – Woody Residues Offshore Wind
Natural Gas Reciprocating Engine
Conventional Geothermal Small Modular Nuclear Reactors (SMRs)
Onshore Wind Hydropower (new) Storage Technologies**
Solar Photovoltaic Hydropower (upgrades to existing)
Tidal Energy
Storage Technologies** Wave Energy
Waste Heat Recovery and Combined Heat and Power (CHP)
* Resources are in alphabetical order ** Energy storage comprises many technologies at various stages of development and availability
ENVIRONMENTAL EFFECTS AND QUANTIFIED ENVIRONMENTAL COSTS The Northwest Power Act requires the Council to estimate the incremental system cost of each new resource or conservation measure considered for inclusion in the plan’s new resource strategy. The incremental system cost must include all direct costs of a measure or resource over its lifecycle, including environmental costs and benefits that can be quantified. The Act also requires the Council to include in the plan a description of its methodology for quantifying the environmental costs and benefits of the new resource alternatives. Per the Act, the Council is required to develop the plan’s resource strategy giving due consideration to, among other factors, environmental quality and the protection, mitigation, and enhancement of fish and wildlife.
The Council’s methodology for quantifying environmental costs and benefits is described in Chapter 19, as well as the Council’s approach to considering environmental and fish and wildlife effects broadly in analyzing and selecting new resources to add to the region’s existing power supply. Consistent with these descriptions, Chapter 19 together with Appendix I describe in detail the effects on the environment associated with different types of generating resources considered for inclusion in the power plan’s resource strategy, as well as the environmental regulations developed by other
Chapter 13: Generating Resources
nwcouncil.org/7thplan 13-7
agencies of government to address those effects. Estimates of the capital and operating costs to comply with existing and proposed regulations are identified in the total resource costs for each resource. Chapter 9 (Existing Resources) and Appendix I also describe the environmental effects and issues related to the generating plants already in the region’s power supply.
Environmental standards, the actions required for compliance, and the associated costs vary by geographic location and by the circumstances of different resources. These are best represented in the Council’s planning process by representative plants characteristic of those that could be expected to be developed in the Northwest. With few exceptions, the sources of cost information for these plants available to the Council aggregate all of the costs of the plants, making it difficult to break out the embedded cost of environmental compliance. However, because the resource cost estimates are based on recently constructed or proposed plants, the Council assumes that the costs do include the cost of compliance with current and near-term planned environmental regulation.
PRIMARY RESOURCES Detailed cost and performance estimates were developed for new resources in the primary classification – solar, wind, and natural gas technologies. These estimates were used to define new generating resource reference plants, which are used in the Council’s modeling efforts, including the RPM. Each reference plant resembles a realistic and likely implementation of a given technology within the region. Additional information regarding the cost and performance of generating resources and the reference plants is available in Appendix H.
The key estimated cost and performance characteristics used to develop the reference plants include:
1. Plant size (megawatt) – the unit size or installed capacity of an individual plant 2. Capital cost ($ per kilowatt) – an estimate of the project development and construction cost
in constant year dollars ($2012), normalized by plant size 3. Fixed O&M ($ per kilowatt-year) – estimate of the fixed operations and maintenance cost for
the plant 4. Variable O&M ($ per megawatt-hour) – estimate for the variable operations and
maintenance cost 5. Heat rate (British thermal units per kilowatt-hour) – when applicable, an estimate for the fuel
conversion efficiency of the plant 6. Capacity Factor (%) – an estimate of the ratio of the actual annual output to the potential
annual output if the plant is operated at full capacity 7. Fixed fuel cost ($ per kilowatt-year) and variable fuel cost ($ per million British thermal units)
– when applicable, estimates for the cost of firm pipeline transmission and fuel commodity cost
8. Transmission and Integration cost ($ per kilowatt-year) – estimate of the cost for long-distance transmission and integration
9. Plant sponsor – the cost and structure of project financing may vary depending on the sponsor, such as for an Investor Owned Utility (IOU), an Independent Power Producer (IPP), or a Public Utility District/Municipality (PUD)
Chapter 13: Generating Resources
nwcouncil.org/7thplan 13-8
A financial revenue requirements model – Microfin - was used to calculate the levelized fixed cost and the full levelized cost of energy (LCOE) for each reference plant. The finance model calculates the annual cash flows which will satisfy revenue requirements over the plant lifetime. The annual cash flows are compressed and discounted into a single dollar value – Net Present Value (NPV). The NPV is then converted into a level, annualized payment (like a home mortgage payment). Two main cost values are output from the model:
1. Levelized fixed cost ($ per kilowatt-year) represents the cost of building and maintaining a power plant over its lifetime and is a primary cost input to RPM
2. LCOE ($ per megawatt-hour) is the cost per unit of energy the plant is expected to produce and which also includes variable costs such as fuel, and variable O&M.
The key financial inputs used in the model for calculating levelized costs include:
1. Discount rate – 4%2 2. Debt Percentage - 50% for IOU, 60 % for IPP 3. Debt service – ranges from 15 to 30 years depending on project and sponsor 4. Return on Equity – 10% for IOU, 12% for IPP sponsor 5. Federal Tax – 35%, State Tax – 5% 6. Federal Investment Tax Credit – 30%/10%3 7. Capacity factor
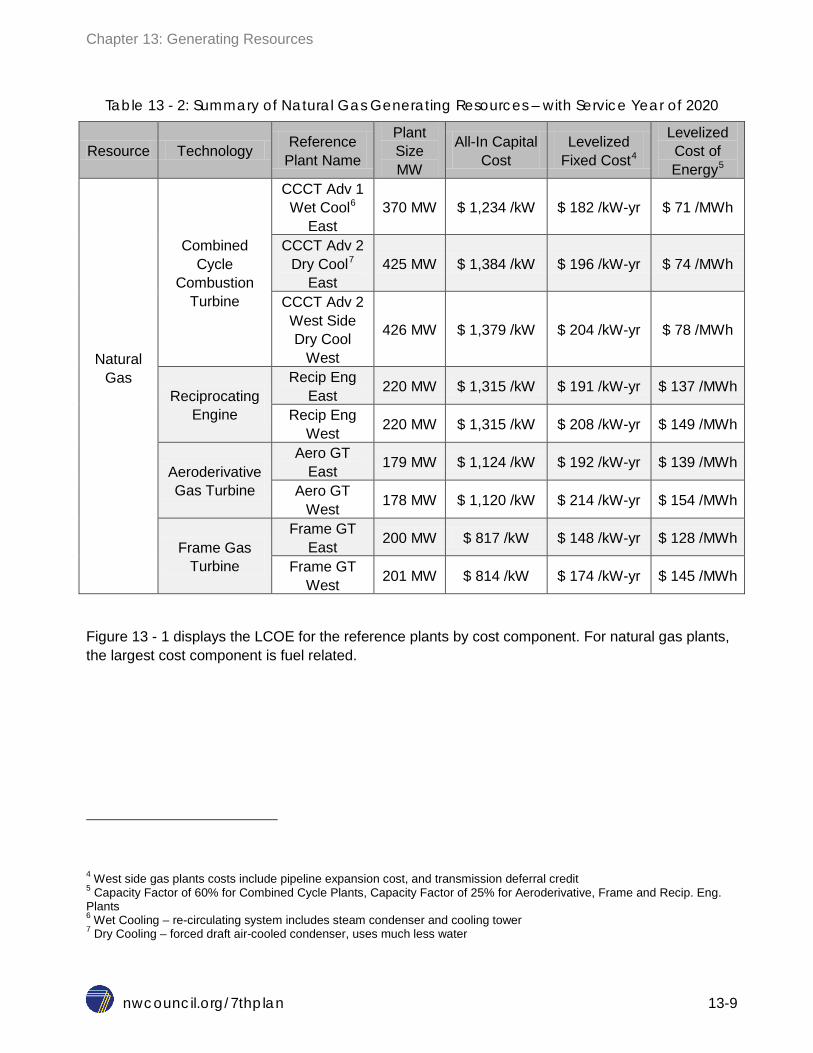
The cost characteristics for natural gas technologies and associated reference plants are summarized in Table 13 - 2. The levelized cost of energy value captures the overall cost (capital, fixed and variable O&M, fixed and variable fuel) on a per unit of production basis. Since the energy production value is in the denominator of the equation, the more energy the resource produces, the lower the cost will be given a set of fixed costs. Therefore, the value that is selected for the capacity factor variable has a large impact on the resulting cost. For illustrative purposes, a 60 percent capacity factor was used for the combined cycle combustion turbine plants, and 25 percent for the simple cycle turbines and reciprocating engines. Actual utilization of gas plants can vary, but in general, a combined cycle plant would be expected to run at a higher capacity factor than a simple cycle plant or reciprocating engine. The Council’s medium natural gas price forecast was used for fuel cost calculations.
2 See Appendix A: Financial Assumptions for more information 3 ITC for Solar – 30% through year 2019, 26% through 2020, 22% through 2021, 10% for 2022 - 2034
Chapter 13: Generating Resources
nwcouncil.org/7thplan 13-9
Table 13 - 2: Summary of Natural Gas Generating Resources – with Service Year of 2020
Resource Technology Reference Plant Name
Plant Size MW
All-In Capital Cost
Levelized Fixed Cost4
Levelized Cost of Energy5
Natural Gas
Combined Cycle
Combustion Turbine
CCCT Adv 1 Wet Cool6
East 370 MW $ 1,234 /kW $ 182 /kW-yr $ 71 /MWh
CCCT Adv 2 Dry Cool7
East 425 MW $ 1,384 /kW $ 196 /kW-yr $ 74 /MWh
CCCT Adv 2 West Side Dry Cool
West
426 MW $ 1,379 /kW $ 204 /kW-yr $ 78 /MWh
Reciprocating Engine
Recip Eng East 220 MW $ 1,315 /kW $ 191 /kW-yr $ 137 /MWh
Recip Eng West 220 MW $ 1,315 /kW $ 208 /kW-yr $ 149 /MWh
Aeroderivative Gas Turbine
Aero GT East 179 MW $ 1,124 /kW $ 192 /kW-yr $ 139 /MWh
Aero GT West 178 MW $ 1,120 /kW $ 214 /kW-yr $ 154 /MWh
Frame Gas Turbine
Frame GT East 200 MW $ 817 /kW $ 148 /kW-yr $ 128 /MWh
Frame GT West 201 MW $ 814 /kW $ 174 /kW-yr $ 145 /MWh
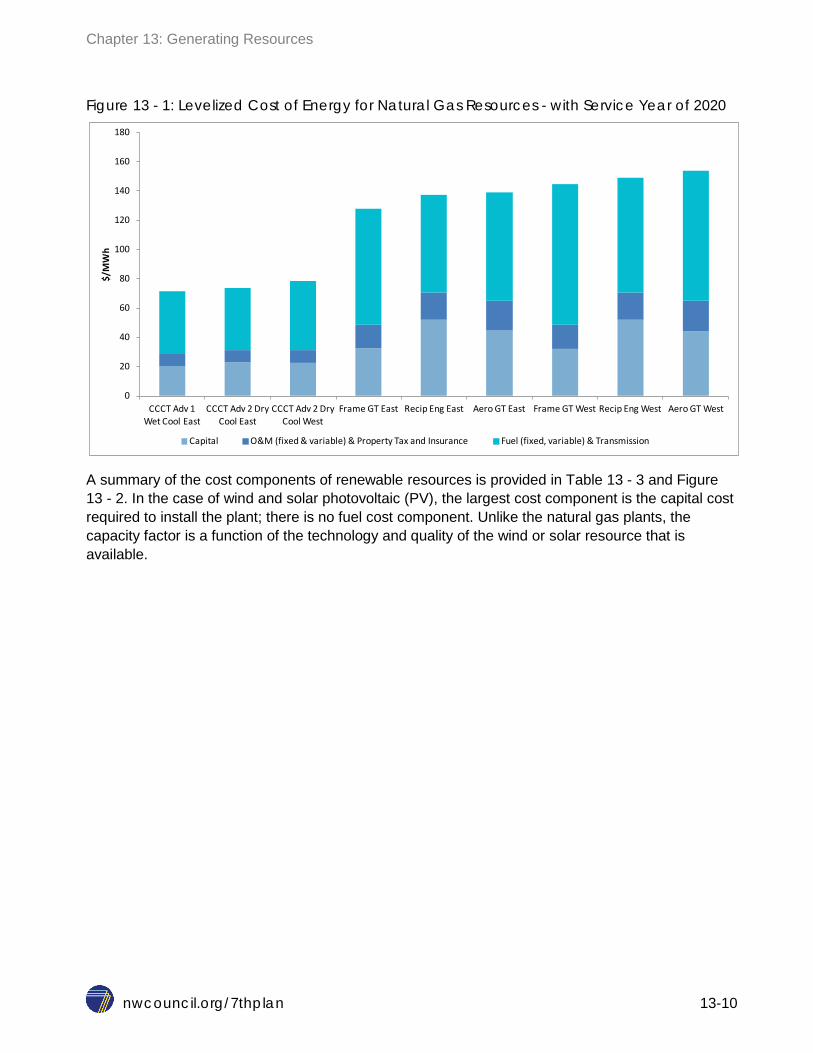
Figure 13 - 1 displays the LCOE for the reference plants by cost component. For natural gas plants, the largest cost component is fuel related.
4 West side gas plants costs include pipeline expansion cost, and transmission deferral credit 5 Capacity Factor of 60% for Combined Cycle Plants, Capacity Factor of 25% for Aeroderivative, Frame and Recip. Eng. Plants 6 Wet Cooling – re-circulating system includes steam condenser and cooling tower 7 Dry Cooling – forced draft air-cooled condenser, uses much less water
Chapter 13: Generating Resources
nwcouncil.org/7thplan 13-10
Figure 13 - 1: Levelized Cost of Energy for Natural Gas Resources - with Service Year of 2020
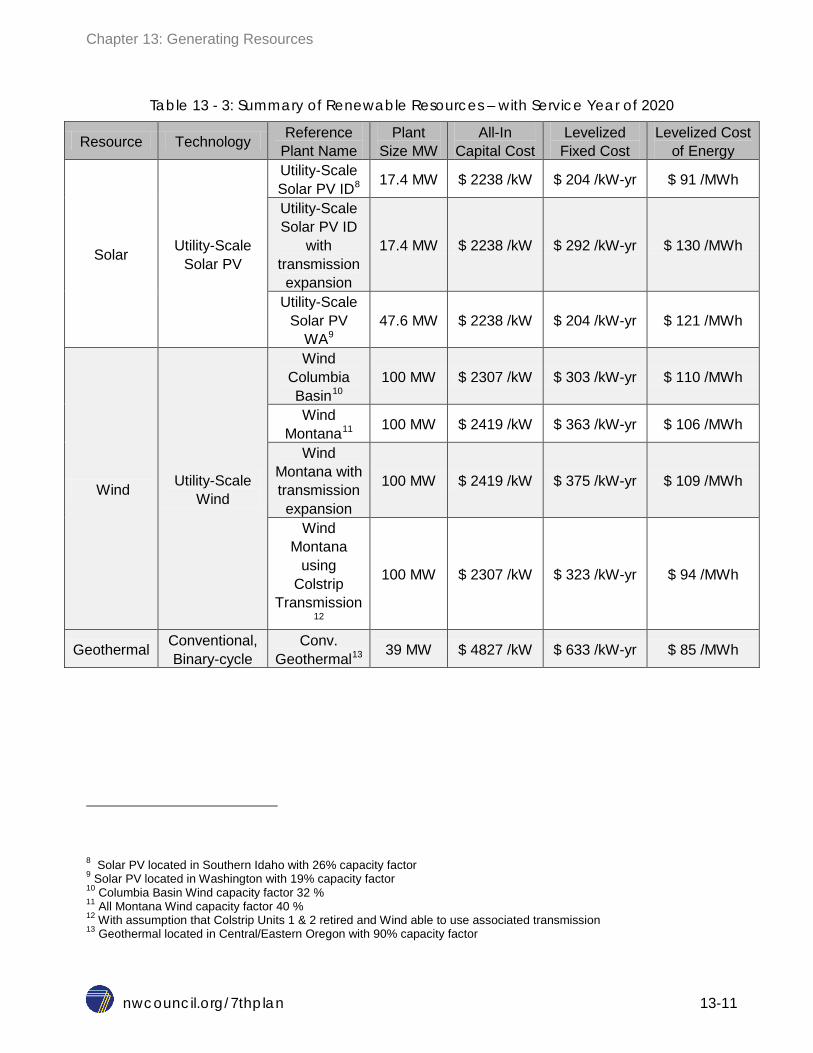
A summary of the cost components of renewable resources is provided in Table 13 - 3 and Figure 13 - 2. In the case of wind and solar photovoltaic (PV), the largest cost component is the capital cost required to install the plant; there is no fuel cost component. Unlike the natural gas plants, the capacity factor is a function of the technology and quality of the wind or solar resource that is available.
0
20
40
60
80
100
120
140
160
180
CCCT Adv 1 Wet Cool East
CCCT Adv 2 Dry Cool East
CCCT Adv 2 Dry Cool West
Frame GT East Recip Eng East Aero GT East Frame GT West Recip Eng West Aero GT West
$/M
Wh
Capital O&M (fixed & variable) & Property Tax and Insurance Fuel (fixed, variable) & Transmission
Chapter 13: Generating Resources
nwcouncil.org/7thplan 13-11
Table 13 - 3: Summary of Renewable Resources – with Service Year of 2020
Resource Technology Reference Plant Name
Plant Size MW
All-In Capital Cost
Levelized Fixed Cost
Levelized Cost of Energy
Solar Utility-Scale Solar PV
Utility-Scale Solar PV ID8 17.4 MW $ 2238 /kW $ 204 /kW-yr $ 91 /MWh
Utility-Scale Solar PV ID
with transmission expansion
17.4 MW $ 2238 /kW $ 292 /kW-yr $ 130 /MWh
Utility-Scale Solar PV
WA9 47.6 MW $ 2238 /kW $ 204 /kW-yr $ 121 /MWh
Wind Utility-Scale Wind
Wind Columbia Basin10
100 MW $ 2307 /kW $ 303 /kW-yr $ 110 /MWh
Wind Montana11 100 MW $ 2419 /kW $ 363 /kW-yr $ 106 /MWh
Wind Montana with transmission expansion
100 MW $ 2419 /kW $ 375 /kW-yr $ 109 /MWh
Wind Montana
using Colstrip
Transmission12
100 MW $ 2307 /kW $ 323 /kW-yr $ 94 /MWh
Geothermal Conventional, Binary-cycle
Conv. Geothermal13 39 MW $ 4827 /kW $ 633 /kW-yr $ 85 /MWh
8 Solar PV located in Southern Idaho with 26% capacity factor 9 Solar PV located in Washington with 19% capacity factor 10 Columbia Basin Wind capacity factor 32 % 11 All Montana Wind capacity factor 40 % 12 With assumption that Colstrip Units 1 & 2 retired and Wind able to use associated transmission 13 Geothermal located in Central/Eastern Oregon with 90% capacity factor
Chapter 13: Generating Resources
nwcouncil.org/7thplan 13-12
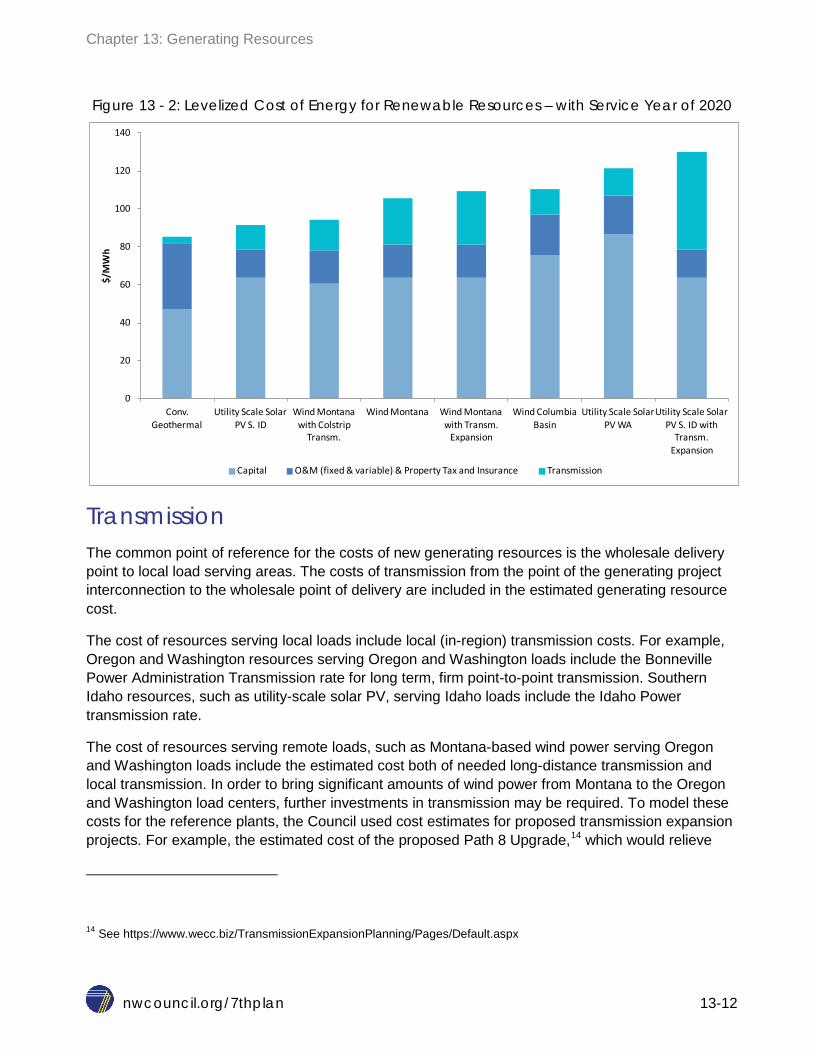
Figure 13 - 2: Levelized Cost of Energy for Renewable Resources – with Service Year of 2020
Transmission The common point of reference for the costs of new generating resources is the wholesale delivery point to local load serving areas. The costs of transmission from the point of the generating project interconnection to the wholesale point of delivery are included in the estimated generating resource cost.
The cost of resources serving local loads include local (in-region) transmission costs. For example, Oregon and Washington resources serving Oregon and Washington loads include the Bonneville Power Administration Transmission rate for long term, firm point-to-point transmission. Southern Idaho resources, such as utility-scale solar PV, serving Idaho loads include the Idaho Power transmission rate.
The cost of resources serving remote loads, such as Montana-based wind power serving Oregon and Washington loads include the estimated cost both of needed long-distance transmission and local transmission. In order to bring significant amounts of wind power from Montana to the Oregon and Washington load centers, further investments in transmission may be required. To model these costs for the reference plants, the Council used cost estimates for proposed transmission expansion projects. For example, the estimated cost of the proposed Path 8 Upgrade,14 which would relieve
14 See https://www.wecc.biz/TransmissionExpansionPlanning/Pages/Default.aspx
0
20
40
60
80
100
120
140
Conv. Geothermal
Utility Scale Solar PV S. ID
Wind Montana with Colstrip
Transm.
Wind Montana Wind Montana with Transm.
Expansion
Wind Columbia Basin
Utility Scale Solar PV WA
Utility Scale Solar PV S. ID with
Transm. Expansion
$/M
Wh
Capital O&M (fixed & variable) & Property Tax and Insurance Transmission
Chapter 13: Generating Resources
nwcouncil.org/7thplan 13-13
congestion on Path 8 and provide additional transmission for renewable power from Broadview, Montana to the Mid-Columbia area, was used as a proxy for the transmission cost of bringing significant quantities of Montana wind power to Oregon and Washington.
Appendix I contains a discussion of the environmental effects and issues associated with the development of transmission to serve the region’s generating facilities.
Natural Gas Generating Technologies Natural gas is a fossil fuel typically found in deep underground reservoirs of porous and permeable rocks, or gas rich shale formations. Primarily composed of methane (CH4), natural gas also contains lesser amounts of other hydrocarbon gases, including ethane, propane, and butane. It is the cleanest burning fossil fuel, producing lesser amounts of combustion by-products and CO2 emissions than coal or refined oil products.
Natural gas is useful for a wide variety of applications. It is used directly for numerous residential and commercial end uses, such as water heating and space heating. It is also used intensively for industrial end uses and is increasingly used as a fuel to generate electricity using steam, gas turbine, and reciprocating engine technologies. Natural gas is also the principal feedstock in the manufacture of ammonia and ammonia-based fertilizers.
The natural gas resource base in North America is enormous. Recent estimates for the total amount of technically recoverable natural gas in the U. S. alone are over 2,500 trillion cubic feet (Tcf).15 Production continues to exceed expectations as extraction technologies improve, boosting efficiencies and cost effectiveness. In the last ten years, hydraulic fracturing combined with horizontal drilling has enabled producers to tap large gas resources previously locked up in shale rock. Hydraulic fracturing uses water, sand, and chemicals under high pressure to fracture rock, which then releases trapped gas. Horizontal drilling allows fracturing to follow long veins of gas-rich shale. Nearly all new wells that are drilled today are fractured.
The Northwest is situated between two prolific natural gas producing regions – the U.S. Rocky Mountains (Rockies), and the Western Canadian Sedimentary Basin (WCSB). In any given year, as much as two thirds of the gas purchased for use in the region is sourced from the Alberta and British Columbia Provinces of Canada. Historically, natural gas prices have been volatile, and there have been sustained periods of high prices. More recently, with the abundance of supply, natural gas spot prices at the three primary regional pricing hubs have remained relatively low and are expected to remain low in the future. The average spot price16 (2012 dollars per million British thermal units) for the years 2010 through 2014 was:
SUMAS (British Columbia) $3.75 AECO (Alberta) $3.36
15 Potential Gas Committee, April 8, 2015 16 SNL Financial
Chapter 13: Generating Resources
nwcouncil.org/7thplan 13-14
OPAL (U.S. Rockies) $3.71
While sustained low prices are expected going forward, prices may spike due to weather conditions or unexpected supply issues.
The natural gas delivery system is made up of:
Producing wells (that may be far away from the end use) Gathering pipelines - carry gas to processing plants and then on to large transmission
pipelines Transmission pipelines - deliver gas to the city gate station and local distribution companies
o Gas-fired power plants may offload gas from the transmission pipelines o Storage facilities – above-ground liquefied natural gas (LNG) tanks and underground
gas storage may draw on the transmission pipelines Distribution systems -deliver gas to end-use customers such as residences, businesses,
industrial plants, and power plants
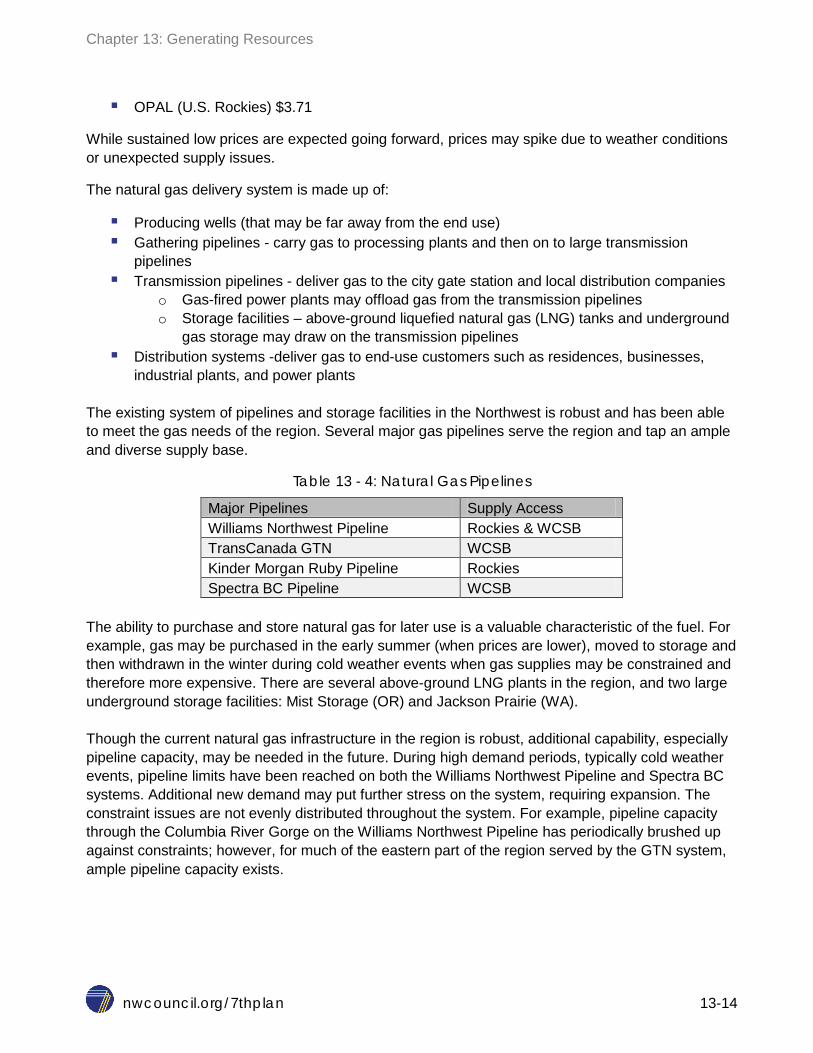
The existing system of pipelines and storage facilities in the Northwest is robust and has been able to meet the gas needs of the region. Several major gas pipelines serve the region and tap an ample and diverse supply base.
Table 13 - 4: Natural Gas Pipelines
Major Pipelines Supply Access Williams Northwest Pipeline Rockies & WCSB TransCanada GTN WCSB Kinder Morgan Ruby Pipeline Rockies Spectra BC Pipeline WCSB
The ability to purchase and store natural gas for later use is a valuable characteristic of the fuel. For example, gas may be purchased in the early summer (when prices are lower), moved to storage and then withdrawn in the winter during cold weather events when gas supplies may be constrained and therefore more expensive. There are several above-ground LNG plants in the region, and two large underground storage facilities: Mist Storage (OR) and Jackson Prairie (WA). Though the current natural gas infrastructure in the region is robust, additional capability, especially pipeline capacity, may be needed in the future. During high demand periods, typically cold weather events, pipeline limits have been reached on both the Williams Northwest Pipeline and Spectra BC systems. Additional new demand may put further stress on the system, requiring expansion. The constraint issues are not evenly distributed throughout the system. For example, pipeline capacity through the Columbia River Gorge on the Williams Northwest Pipeline has periodically brushed up against constraints; however, for much of the eastern part of the region served by the GTN system, ample pipeline capacity exists.
Chapter 13: Generating Resources
nwcouncil.org/7thplan 13-15
Combined Cycle Combustion Turbine
Combined cycle combustion turbine (CCCT) plants are highly efficient power sources that run on natural gas and can provide baseload and dispatchable power. This increasingly versatile technology can be used both as a replacement of baseload coal power, and as a complementary firming power source to renewable generation from wind and solar. With the reliable North American natural gas supply system, planned coal plant retirements, and increasing levels of renewable generation, combined cycle combustion turbines may play an important role in the future power generation landscape.
A CCCT plant consists of one or two gas turbine generators each exhausting to a heat recovery steam generator (HRSG). The steam produced in the HRSG is supplied to a steam turbine generator and condenser. The productive use of the gas turbine exhaust energy greatly increases the efficiency of CCCT plants as compared to simple-cycle gas turbines. The primary fuel is natural gas, though fuel oil may be used as a backup. The heat recovery steam generators are often equipped with natural gas burners to boost the peak output of the steam turbine (duct firing). Plants may be equipped with bypass exhaust dampers to allow the independent operation of the gas turbines to generate electricity.
The high efficiency of combined cycle plants coupled with the low carbon content of natural gas results in the lowest carbon dioxide (CO2) production rate of any fossil fuel power generating technology. A new CCCT plant emits roughly 800 pounds of CO2 per megawatt-hour of electricity produced. An older coal plant emits approximately 2,300 pounds of CO2 of per megawatt-hour, nearly three times the rate of a CCCT. One element of the proposed Clean Power Plan (111d) calls for states to substitute coal-fired generation with existing combined cycle gas plants, requiring CCCT units to operate at capacity factors above 70 percent.
In the Northwest, utilization of existing CCCT plants can depend on variable hydro conditions. During low water years, CCCT plants may run at high capacity factors to make up for the lower amount of hydroelectric power. During high water years, utilization of CCCT plants may drop. There are many other factors that may impact regional CCCT utilization, such as load, renewable power generation levels, plant outages, fuel prices, and wholesale electricity prices.
There are three types of cooling used for the steam turbine/ heat recovery steam generator used in CCCT plants:
1. Once through cooling (OTC) – no longer used for new plants 2. Wet cooling – a recirculation system with a steam surface condenser and wet cooling
tower 3. Dry cooling – forced draft air-cooled condenser
Chapter 13: Generating Resources
nwcouncil.org/7thplan 13-16
Regional permitting constraints may require the dry cooling option for a new plant. Implementation of dry cooling technology results in higher capital costs (14 percent higher) for the plant, slightly higher heat rates, but 96 percent less water consumption than for a wet cooled plant.17
Overall heat rates continue to improve for advanced, state-of-the-art CCCT technologies. A few other observations on state-of-the-art CCCT technologies include:
Economies of scale (the larger the unit, the less expensive it is on a dollar per kilowatt basis) Plants are becoming more flexible with faster start times and better efficiencies at part and
minimum loads
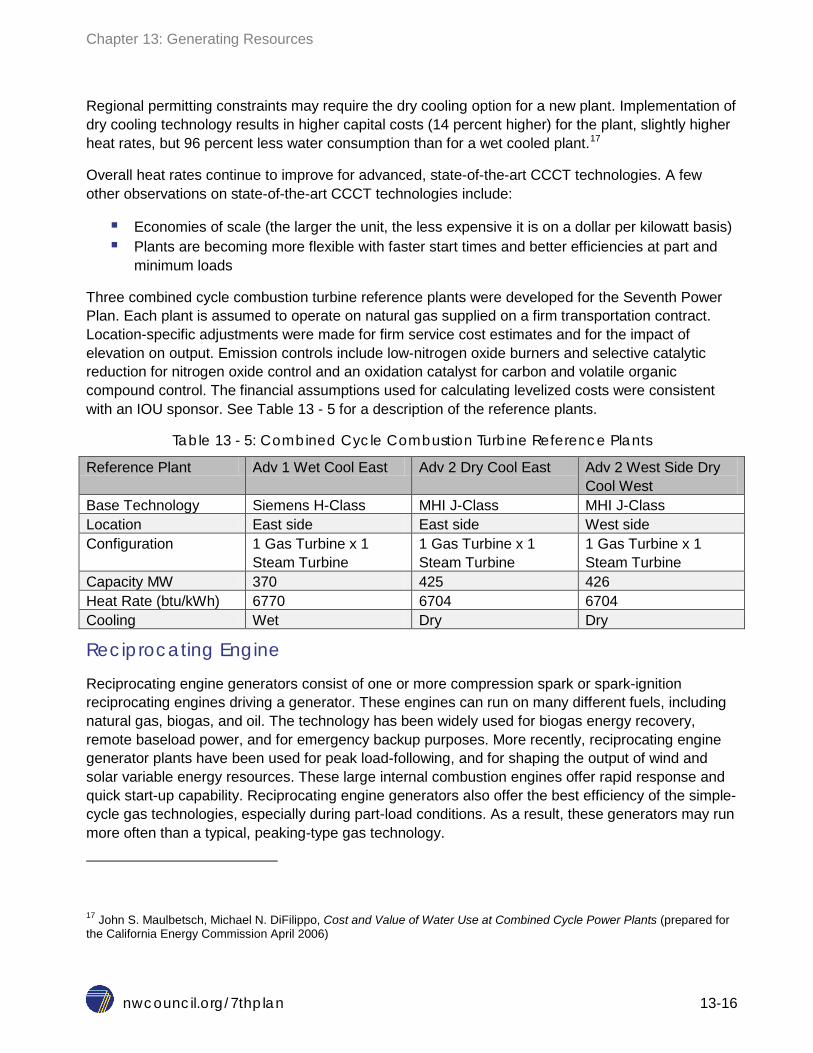
Three combined cycle combustion turbine reference plants were developed for the Seventh Power Plan. Each plant is assumed to operate on natural gas supplied on a firm transportation contract. Location-specific adjustments were made for firm service cost estimates and for the impact of elevation on output. Emission controls include low-nitrogen oxide burners and selective catalytic reduction for nitrogen oxide control and an oxidation catalyst for carbon and volatile organic compound control. The financial assumptions used for calculating levelized costs were consistent with an IOU sponsor. See Table 13 - 5 for a description of the reference plants.
Table 13 - 5: Combined Cycle Combustion Turbine Reference Plants
Reference Plant Adv 1 Wet Cool East Adv 2 Dry Cool East Adv 2 West Side Dry Cool West
Base Technology Siemens H-Class MHI J-Class MHI J-Class Location East side East side West side Configuration 1 Gas Turbine x 1
Steam Turbine 1 Gas Turbine x 1 Steam Turbine
1 Gas Turbine x 1 Steam Turbine
Capacity MW 370 425 426 Heat Rate (btu/kWh) 6770 6704 6704 Cooling Wet Dry Dry
Reciprocating Engine
Reciprocating engine generators consist of one or more compression spark or spark-ignition reciprocating engines driving a generator. These engines can run on many different fuels, including natural gas, biogas, and oil. The technology has been widely used for biogas energy recovery, remote baseload power, and for emergency backup purposes. More recently, reciprocating engine generator plants have been used for peak load-following, and for shaping the output of wind and solar variable energy resources. These large internal combustion engines offer rapid response and quick start-up capability. Reciprocating engine generators also offer the best efficiency of the simple-cycle gas technologies, especially during part-load conditions. As a result, these generators may run more often than a typical, peaking-type gas technology.
17 John S. Maulbetsch, Michael N. DiFilippo, Cost and Value of Water Use at Combined Cycle Power Plants (prepared for the California Energy Commission April 2006)
Chapter 13: Generating Resources
nwcouncil.org/7thplan 13-17
Highly modular, a typical utility-scale installation is composed of multiple natural gas-fired units that range in size from six megawatts to 20 megawatts. The major components of a typical plant include one or two engine halls housing the engine-generator sets, one or more wet or dry cooling towers, individual or combined exhaust stacks, and a switchyard. Emission controls include selective catalytic reduction and oxidation catalysts.
Reciprocating-engine generators are excellent for providing flexibility; they start quickly (less than ten minutes), and follow load well. An advantage of the engines for load-following and variable resource shaping applications is the relatively flat heat rate curve of individual units. The multiple, independently dispatched units in a multi-unit facility provide additional flattening of the heat rate curve, allowing the plant to be operated over a wide range of output without significant loss of efficiency. Reciprocating engine generators also maintain output at increasing elevations, unlike combustion turbines.
Three reference plants were developed for reciprocating engine generator technologies, one for the east side of the region, and two for the west side. Each plant was based on the Wärtsilä 18V50SG natural gas engine. The plants are configured with 12 modules, providing 220 megawatts of capacity overall, with a heat rate of 8370 British thermal units per kilowatt-hour. A firm gas transport contract is assumed. West side reference plants were defined with and without new build out of the west-side gas pipeline system. There is assumed to be sufficient natural gas capacity on the east side. Air emission controls include a combined selective catalytic reduction and oxidation catalyst to reduce nitrogen oxides (NOx), carbon monoxide and volatile organic compound emissions. The reference plant can provide regulation and load-following, contingency reserves, and other ancillary services. Due to the plant’s high efficiency, it can also economically serve peak and intermediate load levels. The financial assumptions used for calculating levelized costs were consistent with an IOU sponsor.
Simple Cycle Gas Turbines
A simple-cycle gas turbine generator plant consists of a combustion gas turbine (sometimes multiples) driving an electric power generator, mounted on a common frame and enclosed in an acoustic enclosure. Other major components can include fuel gas compressors, fuel oil storage facilities (if used), a switchyard, a cooling tower (intercooled turbines only), a water treatment system (intercooled units and units using water injection for NOx control) and a control and maintenance building. Emission controls on new units include low-NOx combustors, water injection, selective catalytic reduction, and oxidation catalysts. All existing simple-cycle gas turbines in the Northwest use natural gas as a primary fuel, though fuel oil is used as a backup at some plants.
Simple-cycle gas turbines have been used for several decades to serve peak loads. Peaking units are generators that can ramp up and down quickly to meet sharp spikes in demand. Newer, more flexible and efficient models can also be used to follow the variable output of wind and solar resources. Because of the availability of hydropower, relatively few simple-cycle combustion turbines have been constructed in the Northwest, compared to regions with a predominance of thermal-electric capacity. As wind capacity has increased, simple-cycle gas turbine plants are beginning to be constructed in the Northwest for augmenting the wind-following capability of the hydropower system.
Three gas turbine technologies are marketed:
Chapter 13: Generating Resources
nwcouncil.org/7thplan 13-18
Aeroderivative turbines are based on engines developed for aircraft propulsion and are characterized by light weight, high efficiency and operational flexibility.
Frame turbines are heavy-duty machines designed specifically for stationary applications where weight is less of a concern. While rugged and reliable, frame machines tend to have lower efficiency and less operational flexibility than Aeroderivative machines.
Intercooled gas turbines are a hybrid of frame and Aeroderivative technologies, and include an intercooler between compression stages to improve thermodynamic efficiency. Intercooled machines are expressly designed for operational flexibility and high efficiency. The intercooler requires an external cooling water supply.
Three reference plants were developed for Aeroderivative gas turbines, one for the east side of the region, and two on the west side. Each plant is based on the GE LM6000 PF with four 47 megawatts (nominal) turbine generators, providing 178 megawatts of overall capacity, with a heat rate of 9,477 British thermal units per kilowatt-hour. A firm gas transport contract is assumed. West side reference plants were defined with and without new build out of the west-side gas pipeline system. There is assumed to be sufficient natural gas capacity on the east side. Air emission controls include water injection and selective catalytic reduction for nitrogen oxide control and an oxidation catalyst for carbon and volatile organic compound reduction. This type of plant would normally serve peak load. Its rapid startup (less than 10 minutes) capability would also allow it to provide rapid-response reserves while shutdown. The financial assumptions used for calculating levelized costs were consistent with an IOU sponsor.
Three reference plants were developed for Frame gas turbines, one for the east side of the region, and two on the west side. Each plant is based on the GE 7F5S with a single 216 megawatts (nominal) turbine generator, providing 200 megawatts of overall capacity, with a heat rate of 10,266 British thermal units per kilowatt-hour. A firm gas transport contract is assumed. West side reference plants were defined with and without new build out of the west-side gas pipeline system. There is assumed to be sufficient natural gas capacity on the east side. The Frame gas turbine plant has lower upfront capital costs than the Aeroderivative, but runs at a lower efficiency and is less flexible. The financial assumptions used for calculating levelized costs were consistent with an IOU sponsor.
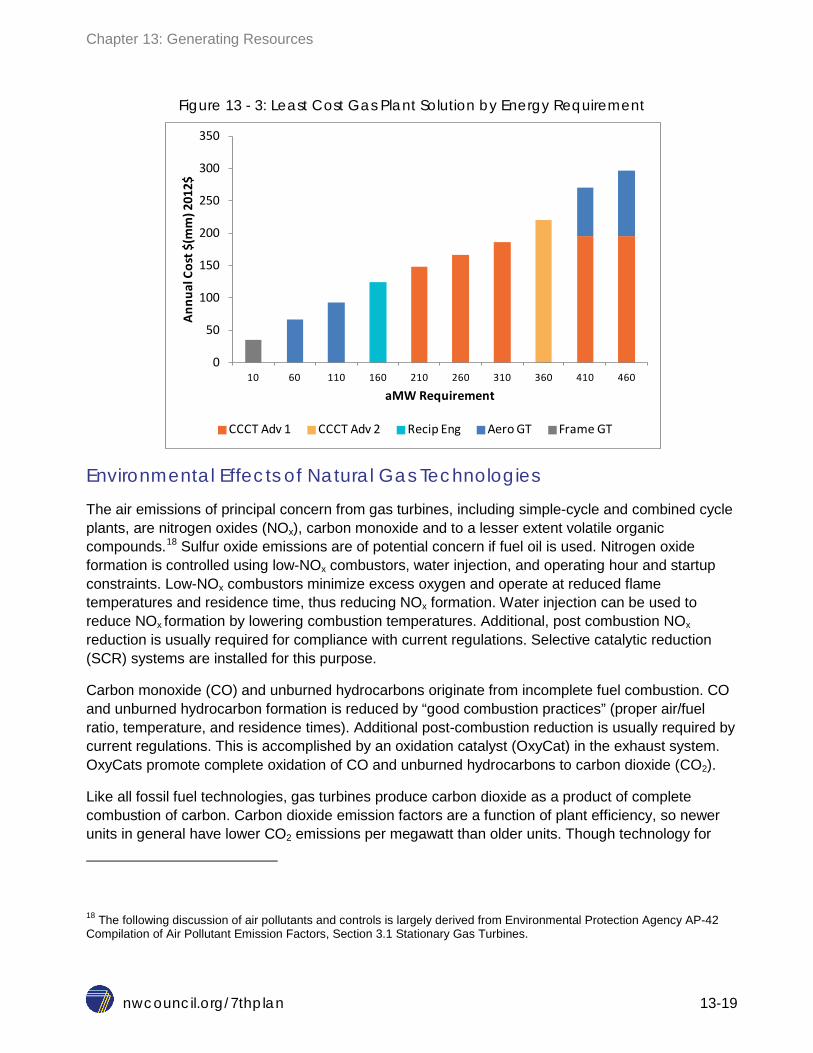
Each of the gas-fired technologies has different size, cost and operating characteristics. The CCCT plants are larger in size (megawatts), the most expensive in terms of fixed cost ($), and the most efficient to run. The simple cycle gas plants (Recip Eng, Aero GT, Frame GT) are smaller in size, have lower fixed costs, are less efficient to run, but have faster ramp rates (cold start to full load). The less efficient the plant, the more fuel is required to generate electricity; therefore variable costs increase for the same output level. If energy (average megawatts) requirements are limited, the simple cycle technologies are the least expensive option due to their lower capital cost. As energy requirements increase, the combined cycle technologies become least expensive. And further up the energy curve, various combinations of simple cycle and combined cycle plants result in the least expensive solution. Figure 13 - 3 shows the overall least cost gas plant option for a given energy requirement (average megawatts). For example, at an average megawatt requirement around 410, the least cost solution would be to install a combined cycle unit and an aero unit. These results only factor in cost, size, and plant efficiencies, but not other performance characteristics which would be fully considered before building a new gas plant.
Chapter 13: Generating Resources
nwcouncil.org/7thplan 13-19
Figure 13 - 3: Least Cost Gas Plant Solution by Energy Requirement
Environmental Effects of Natural Gas Technologies
The air emissions of principal concern from gas turbines, including simple-cycle and combined cycle plants, are nitrogen oxides (NOx), carbon monoxide and to a lesser extent volatile organic compounds.18 Sulfur oxide emissions are of potential concern if fuel oil is used. Nitrogen oxide formation is controlled using low-NOx combustors, water injection, and operating hour and startup constraints. Low-NOx combustors minimize excess oxygen and operate at reduced flame temperatures and residence time, thus reducing NOx formation. Water injection can be used to reduce NOx formation by lowering combustion temperatures. Additional, post combustion NOx
reduction is usually required for compliance with current regulations. Selective catalytic reduction (SCR) systems are installed for this purpose.
Carbon monoxide (CO) and unburned hydrocarbons originate from incomplete fuel combustion. CO and unburned hydrocarbon formation is reduced by “good combustion practices” (proper air/fuel ratio, temperature, and residence times). Additional post-combustion reduction is usually required by current regulations. This is accomplished by an oxidation catalyst (OxyCat) in the exhaust system. OxyCats promote complete oxidation of CO and unburned hydrocarbons to carbon dioxide (CO2).
Like all fossil fuel technologies, gas turbines produce carbon dioxide as a product of complete combustion of carbon. Carbon dioxide emission factors are a function of plant efficiency, so newer units in general have lower CO2 emissions per megawatt than older units. Though technology for
18 The following discussion of air pollutants and controls is largely derived from Environmental Protection Agency AP-42 Compilation of Air Pollutant Emission Factors, Section 3.1 Stationary Gas Turbines.
0
50
100
150
200
250
300
350
10 60 110 160 210 260 310 360 410 460
Annu
al C
ost $
(mm
) 201
2$
aMW Requirement
CCCT Adv 1 CCCT Adv 2 Recip Eng Aero GT Frame GT
Chapter 13: Generating Resources
nwcouncil.org/7thplan 13-20
separating CO2 from the plant exhaust is available, as a practical matter it is unlikely that CO2 removal technology would be employed for simple-cycle gas turbines because of the relatively low carbon content of natural gas and the relatively small size and limited hours of operation of these units. Newer units are likely to comply with the CO2 performance standards of the proposed Clean Power Plan and will continue to serve loads, and to an increasing extent, shaping of variable output renewable resources.
Simple-cycle gas turbines do not employ a steam cycle so require no condenser cooling. Intercooled turbines do require cooling of the air intercooler. This is accomplished using a circulating water system cooled by evaporative or dry mechanical draft cooling towers. Other uses of water include water injection for NOx control and power augmentation and for inlet air evaporative cooling systems to increase power output during warm conditions. Sulfur oxide emissions from units with fuel oil firing capability are controlled by use of ultra-low sulfur fuel oil and fuel oil consumption limits.
Air emissions of concern for natural gas reciprocating engine plants are nitrogen oxides, carbon monoxide, volatile organic compounds, particulates, and carbon dioxide. Engines utilizing fuel oil for compression ignition or backup purposes may also produce sulfur dioxides. Nitrogen oxides are produced by oxidation of atmospheric nitrogen during the fuel combustion process. NOx formation is suppressed by “low-NOX” combustion design. Selective catalytic converters in the exhaust system for additional NOx removal are usually needed to meet permit limits.
Other concerns of natural gas generating technologies are water use, noise, and solid waste. Waste heat removal is usually accomplished using closed-cycle dry or evaporative cooling. Evaporative cooled plants are more efficient than dry-cooled, but evaporative cooling consumes water. While reciprocating engines are inherently very noisy, perimeter noise levels are controlled by acoustic enclosures and air intake and exhaust noise suppression. Solid waste production is limited to household and maintenance wastes and periodic catalyst replacement. Catalyst materials are recycled.
Methane (CH4), the primary component of natural gas, is a potent greenhouse gas. Though it has a much shorter lifespan (around twelve years) in the atmosphere than carbon dioxide, methane has a significantly higher capacity to trap heat. The Global Warming Potential (GWP) metric is used to compare the cumulative effect on temperature of a greenhouse gas to that of carbon dioxide on a per unit basis. Estimates for the GWP of methane range from 28 to 3619; meaning that one unit of methane is the equivalent of over twenty units of carbon dioxide in the atmosphere over one hundred years.
The oil and gas industry accounts for 29 percent of the overall methane emissions in the U.S.20 Methane emissions can occur at each segment of the natural gas system as the fuel reaches its end use at a house, business, industrial site, or power plant. These segments include production,
19 http://www3.epa.gov/climatechange/ghgemissions/gases/ch4.html 20 ibid
Chapter 13: Generating Resources
nwcouncil.org/7thplan 13-21
gathering and processing, transmission, storage, and distribution. The emissions include both unplanned gas leaks (fugitive emissions) and intentionally vented gas.
There are various sources of methane emissions within each segment of the natural gas system. For instance, in the production segment, raw gas may be vented as the well goes through “completion.” Pneumatic devices used in the gathering and processing segment also vent gas during operations. During transmission, pipelines may leak gas, and compressor stations may also vent gas during normal operations. Gas leaks can occur in the distribution segment from pipelines and metering and regulating stations. Recent studies have indicated that fugitive emissions of methane from some natural gas production areas and existing gas pipelines could be as high as ten percent. However, overall methane emission rate estimates from the natural gas system in the U.S. range from one percent to three percent.
A pair of studies have recently been released which identified the most cost-effective methods to reduce methane emissions from the natural gas and oil industries in the U.S.21 and Canada.22 The key finding of the studies is that significant reductions in methane emissions could be made at a very low resulting cost. The value of the recovered gas helps to make the reduction efforts inexpensive – less than $0.01 per Mcf of gas produced23, which is well within the Council’s natural gas price forecast range. In the U.S., projected methane emissions could be reduced by 40 percent by 2018, which would result in an overall emission rate of around one percent. In Canada, projected emissions could be reduced by 45 percent, which also results in an overall emission rate of around one percent.
For more detailed information on the environmental effects and regulation of methane emissions, please see Appendix I.
Solar Technologies There are two basic types of solar electricity generating technologies: solar photovoltaic (PV) and concentrated solar power (CSP).
Solar PV cells convert sunlight directly into electricity. The first modern solar cell was developed in Bell Labs in 1954.24 In the 1960s, the space industry was an early adopter of the technology and spurred further development. Today, solar PV cells are manufactured from a variety of semiconductor materials and are significantly more efficient at turning sunlight into electricity.
PV is considered a variable renewable energy resource since generation requires sunlight and therefore does not generate power during the nighttime. Electricity generation can also be affected
21 Economic Analysis of Methane Emission Reduction Opportunities in the U.S. Onshore Oil and Natural Gas Industries, March 2014, Prepared by ICF International for Environmental Defense Fund 22 Economic Analysis of Methane Emission Reduction Opportunities in the Canadian Oil and Natural Gas Industries, September 2015, Prepared by ICF International for Environmental Defense Fund 23 ibid 24 John Perlin, The Silicon Solar Cell Turns 50 (NREL Report No. BR-520-33947, August 2004)
Chapter 13: Generating Resources
nwcouncil.org/7thplan 13-22
by changing atmospheric conditions such as cloud cover. In the future, this issue may be alleviated by pairing solar PV installations with emerging storage technologies such as batteries. Battery technologies are rapidly improving, and in the future could be a key component of PV systems. Battery systems could firm up variability in generation, and shift delivery into early morning or evening/nighttime as needed. See the Storage section later in this chapter for more discussion on battery storage.
CSP technologies typically redirect and focus sunlight in order to generate the thermal energy required to drive a steam turbine to generate electricity. CSP can be configured as a firm generation source by adding thermal storage capabilities.
Solar power is riding a strong wave of popularity. Over 5,000 megawatts of solar capacity was added in the U.S. alone in 2014, representing a record year.25 Growth in new solar power development is expected to continue to be strong since the 30 percent Federal Investment Tax Credit (ITC) was extended to the year 2019. California and Arizona have strong solar insolation characteristics and have led the way in solar build-outs in the U.S. Additionally, California has an aggressive renewable portfolio standard (RPS), which is helping to drive builds.
A few reasons for solar power’s popularity include:
Clean and renewable source of electricity Convenient and relatively simple to install (solar PV) Shrinking costs to produce power coupled with improving technology and performance Prime generation coincident with summer demand peaks Financial incentives and state RPS
Recently, some very large CSP projects have come on-line, such as the Ivanpah Solar Power Facility (392 megawatts) in the California desert. CSP projects have longer construction times and higher costs per watt than PV systems. Solar resource requirements may limit these large scale U.S. plants to locations in the southwest. Though CSP could play a future role in the Northwest due to the technology’s ability to provide dispatchable power, for the Seventh Power Plan, the focus was on PV.
PV can be divided into two categories: utility-scale systems and distributed systems. Utility-scale PV refers to relatively large systems (from a few megawatts to several hundred megawatts) installed on the ground, generating electricity for the wholesale market. The largest PV facility currently operating in the Northwest is the 50 acre, 5.7 megawatt Outback Solar Project in Christmas Valley, Oregon. Several large PV projects have been installed recently in California and Arizona, such as the California Valley Solar Ranch near San Luis Obispo (250 megawatts) and the Agua Caliente Solar Project (290 megawatts) in Yuma County, Arizona. In the Northwest, the best solar resource areas are in the inter-mountain basins of south-central and southeastern Oregon, and the Snake River plateau of southern Idaho.
25 Miriam Makyhoun, Ryan Edge, Nick Esch, Utility Solar Market Snapshot Sustained Growth in 2014 (SEPA, May 2015)

Chapter 13: Generating Resources
nwcouncil.org/7thplan 13-23
Smaller PV systems can also be deployed as a distributed power sources to generate electricity on-site for residences and commercial businesses. In this case, the modules are often mounted on top of roofs or other building structures.
The US Department of Energy’s SunShot Initiative was launched in 2011 in order to coordinate scientific efforts at reducing the cost structure of solar power. The stated goal of the initiative is to reduce solar PV costs to $1.00 per watt (direct current) by 2020 for utility-scale, $1.25 per watt (direct current) for commercial rooftop, and $1.50 per watt (direct current) for residential rooftop.26 This would represent a 75 percent drop from the cost of solar PV in 2010. While module prices have steadily declined, costs for the other system components have not dropped as sharply. Further declines in cost across all components and/or significant improvements in power efficiencies will be required to meet the target.
Utility-Scale Solar Photovoltaic For utility-scale installations, PV cells are assembled into modules, ground mounted to fixed plates or tracking mechanisms on large land sites, and connected to the electricity grid. There are three main cost components for a utility-scale PV system:
1. PV module 2. Power Electronics 3. Balance of System (BOS)
PV modules are typically manufactured from semiconductor materials. Some commonly used materials include crystalline silicon (c-Si), and for thin film PV, cadmium tellurium (CdTe). Efficiencies for commercially available c-Si cells range from 14 to 16 percent, and 9 to 12 percent for thin film. Though thin film technologies tend to be more flexible for installations, c-Si systems are currently the most common choice. Efficiencies for both have been improving. Since 1976, costs for globally manufactured PV modules have been dropping by 20 percent for every doubling of production.27 More recently, solar PV manufacturing has piggybacked on advances in the computer chip manufacturing industry. As a result, module prices have been declining at a faster pace than the other cost components, and are now estimated to comprise a little under half of the overall cost of a solar installation. Inverters, which are required to convert electricity from direct to alternating current for the grid, are the main cost driver in the power electronics category. Like PV modules, inverters are sold on the world market. Balance of system (BOS) catches the remaining costs, such as hardware to hold the panels, tracking mechanisms (single or dual-axis), land, and permitting. Utility-scale solar PV project financing is complex due to the high upfront capital costs involved, the dynamic costing landscape, and the capability of the sponsor to best utilize available tax incentives. Federal incentives for solar projects come in two forms:
26 SunShot Vision Study (DOE/GO-102012-3037 February 2012) 27 ibid
Chapter 13: Generating Resources
nwcouncil.org/7thplan 13-24
Accelerated tax depreciation (MACRS)28 Investment tax credit (ITC)
These two factors push tax savings early on in the project financing; both reduce costs when the time value of money is at its highest. The challenge for the project sponsor becomes how to fully capture the value of both of these tax benefits in order to lower the overall cost of financing the project. The Federal Investment Tax Credit (ITC) stands at 30 percent, and was scheduled to drop to 10 percent starting in 2017. However, through the Consolidated Appropriations Act signed in December 2015, the ITC has been amended to extend the 30 percent credit for solar PV until 2019 and then incorporate gradual step downs in the credit to reach 10% in 2022 and each year thereafter. The cost savings attributed to these two tax incentives can vary depending on the “tax appetite” of the sponsor and the project financial model type, resulting in a range of potential value for the plant’s expected levelized cost of energy.29 Utility-scale solar PV plants can be built in a wide range of sizes, from under 3 megawatts to greater than 500 megawatts – but a commonly installed size is around 20 megawatts.
The reference plant is defined as a 20 megawatt (alternating current) solar PV installation located in southern Idaho using c-Si modules mounted on single-axis trackers. It is assumed to be located on low-grade or distressed agricultural land or other disturbed site with little existing or potential ecological value and no threatened or endangered species present. The plant is sited or shielded to avoid unacceptable visual impacts. The plant is assumed to have a 30 year lifetime, with an annual average degradation of 1 percent. The solar calculator PVWatts® (available on the NREL website) was used to estimate the annual capacity factor. Prime generation months occur from April through September. The expected fixed operations and maintenance (O&M) include inverter replacements at 15 years, along with periodic cleaning of the modules. To be consistent with utility-scale PV development across the country, the project sponsor is assumed to be an independent power producer (IPP). A second reference plant was defined with additional cost estimates required to bring power from the same Southern Idaho location to the west side of the region, which would likely require an expansion of the Bonneville transmission system. A third solar reference plant was defined for a location west of the Cascade Mountains, near Kelso, Washington. This plant was designed to be large in size (50 megawatts), but similar to the other reference plants in terms of configuration. Access to the Bonneville transmission system was assumed. The plant is modeled to have a lower capacity factor than the reference plant in Idaho, due to the lower solar resource that is available in Western Washington.
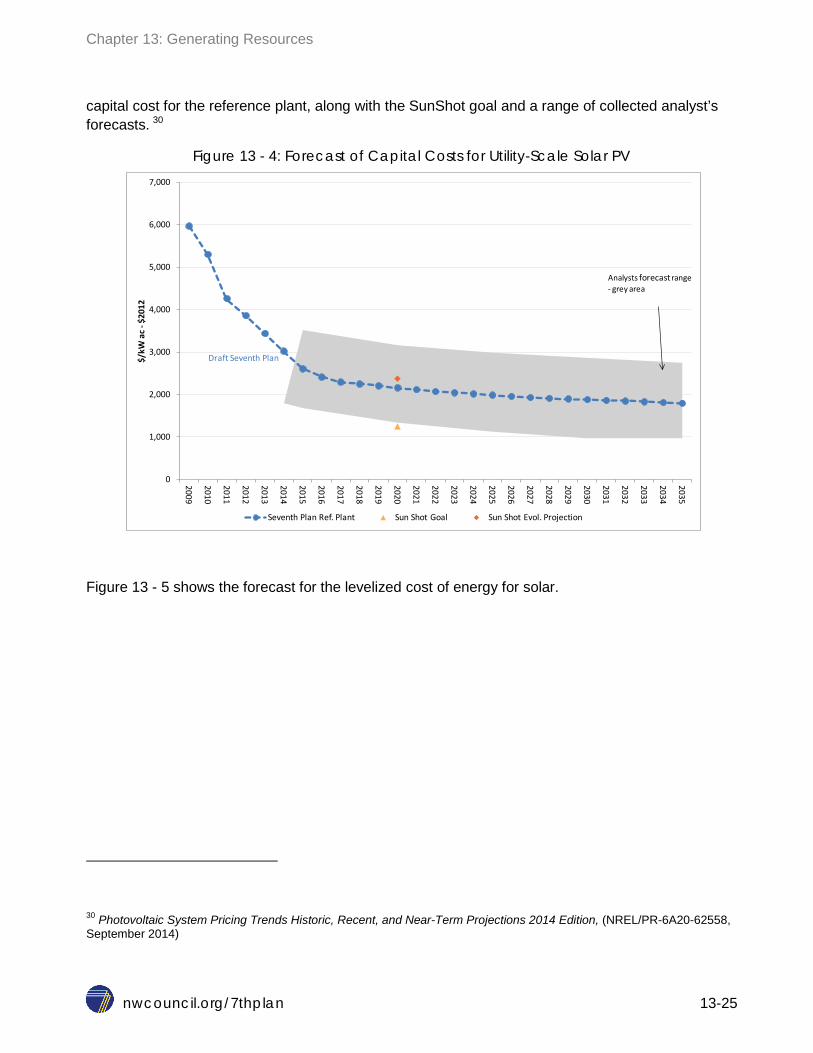
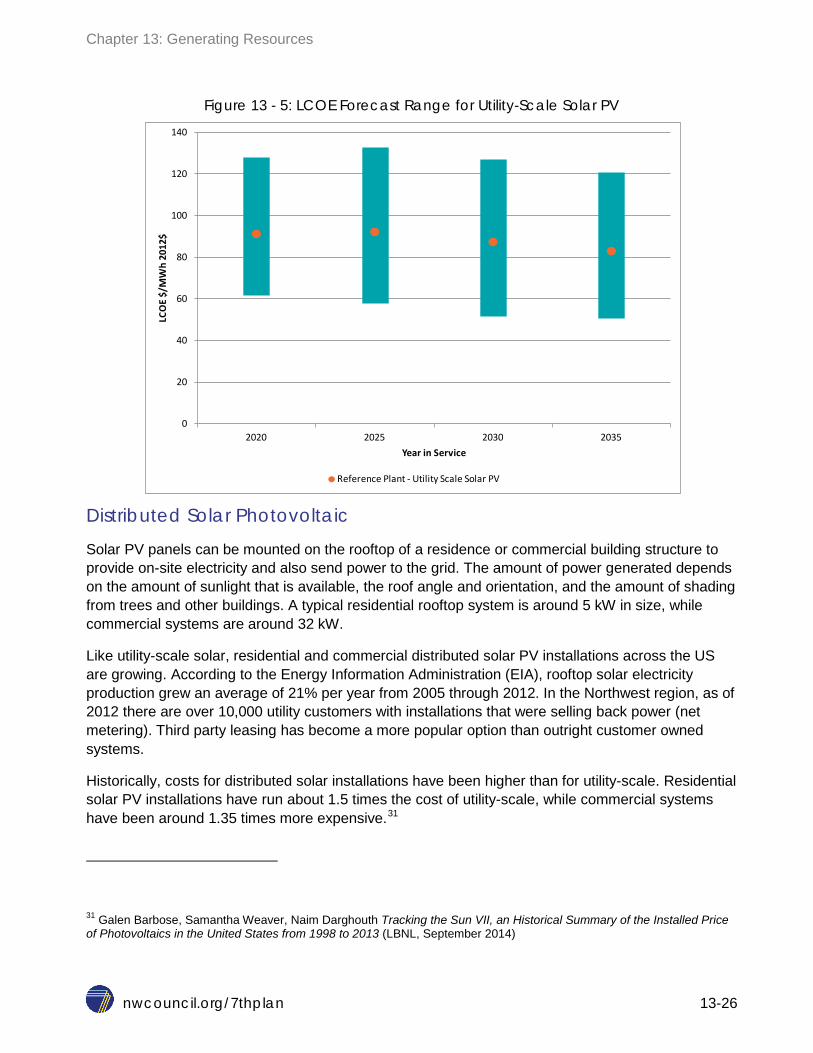
Due to the rapidly changing cost environment for solar technology, the Council developed a forecast of system installation costs across the planning horizon, using historic data and forward looking analysis. From this, the Council developed a forecast of the fixed capital costs, and levelized cost of energy for the solar PV reference plant. Figure 13 – 4 displays the forecast of expected overnight
28 Modified Accelerated Cost Recovery System – tax depreciation as defined by the Internal Revenue Service 29 Mark Bolinger, An Analysis of the Costs, Benefits, and Implications of Different Approaches to Capturing the Value of Renewable Tax Incentives (LBNL-6610E, May 2014)
Chapter 13: Generating Resources
nwcouncil.org/7thplan 13-25
capital cost for the reference plant, along with the SunShot goal and a range of collected analyst’s forecasts. 30
Figure 13 - 4: Forecast of Capital Costs for Utility-Scale Solar PV
Figure 13 - 5 shows the forecast for the levelized cost of energy for solar.
30 Photovoltaic System Pricing Trends Historic, Recent, and Near-Term Projections 2014 Edition, (NREL/PR-6A20-62558, September 2014)
0
1,000
2,000
3,000
4,000
5,000
6,000
7,000
2009
2010
2011
2012
2013
2014
2015
2016
2017
2018
2019
2020
2021
2022
2023
2024
2025
2026
2027
2028
2029
2030
2031
2032
2033
2034
2035$/
kW a
c -$2
012
Seventh Plan Ref. Plant Sun Shot Goal Sun Shot Evol. Projection
Draft Seventh Plan
Analysts forecastrange - grey area
Chapter 13: Generating Resources
nwcouncil.org/7thplan 13-26
Figure 13 - 5: LCOE Forecast Range for Utility-Scale Solar PV
Distributed Solar Photovoltaic
Solar PV panels can be mounted on the rooftop of a residence or commercial building structure to provide on-site electricity and also send power to the grid. The amount of power generated depends on the amount of sunlight that is available, the roof angle and orientation, and the amount of shading from trees and other buildings. A typical residential rooftop system is around 5 kW in size, while commercial systems are around 32 kW.
Like utility-scale solar, residential and commercial distributed solar PV installations across the US are growing. According to the Energy Information Administration (EIA), rooftop solar electricity production grew an average of 21% per year from 2005 through 2012. In the Northwest region, as of 2012 there are over 10,000 utility customers with installations that were selling back power (net metering). Third party leasing has become a more popular option than outright customer owned systems.
Historically, costs for distributed solar installations have been higher than for utility-scale. Residential solar PV installations have run about 1.5 times the cost of utility-scale, while commercial systems have been around 1.35 times more expensive.31
31 Galen Barbose, Samantha Weaver, Naim Darghouth Tracking the Sun VII, an Historical Summary of the Installed Price of Photovoltaics in the United States from 1998 to 2013 (LBNL, September 2014)
0
20
40
60
80
100
120
140
2020 2025 2030 2035
LCO
E $/
MW
h 20
12$
Year in Service
Reference Plant - Utility Scale Solar PV
Chapter 13: Generating Resources
nwcouncil.org/7thplan 13-27
See Chapter 12 for further information on distributed solar PV.
Environmental Effects of Solar Technologies
Potentially significant environmental impacts of utility-scale solar plants include visual impact, air particulate release during construction, land use conversion, habitat loss, and direct avian mortality. Other, less significant, impacts may include minor greenhouse gas releases during construction and operation, disturbance of archeological and other cultural resources, preemption of recreational features and mineral resources, energy consumption during construction and operation, release of hazardous materials, noise during project construction, socio-economic impacts of construction and operational personnel, transportation impacts during construction, and consumption of water.32
The visual character of the site of a utility-scale PV plant is changed from agricultural or natural use to an extensive array of solar modules and ancillary facilities. While the plant profile is low, the modules are highly reflective and can produce severe glare at great distances. The glare may affect road, rail, and air transportation safety, create nuisance for nearby residential and other uses, and may impact the visual integrity of historic, recreational, and natural sites. Visual impacts are mitigated by careful site selection, shielding, and module positioning restrictions.
While no significant air emissions occur during operation, particulates can be released by grading and other construction activities. These are typically controlled by watering susceptible surfaces.
PV plant construction results in conversion of a former agricultural or natural site to one largely covered with photovoltaic modules and ancillary facilities. While vegetative ground cover can be maintained under a portion of the arrays, loss of potentially productive agricultural land or natural habitat may occur. Utility-scale photovoltaic plants require about 6 - 8 acres of land per megawatt of capacity,33 so the reference plant will occupy about 160 acres. Significant land use impacts can be avoided by use of low-grade agricultural and other disturbed sites. In the long-term, because modules are usually supported on driven piles or screw mounts, the site of a photovoltaic plant could be restored to previous condition without excessive difficulty.
Further details concerning the environmental effects of solar generation and the environmental regulations and compliance actions associated with those effects are described in Appendix I.
Wind Power There are two primary forms of wind power resources - the established terrestrial, utility-scale onshore wind power and the emergent offshore wind power. A third form is distributed generation wind power, which typically comprises small output (average of 100 kilowatt) turbines used directly by the end-user to power a residence or commercial entity.
32 List of potentially significant and less significant impacts adapted from Merced County (California) Planning Department. Notice of Preparation of an Environmental Impact Report for the Quinto Solar Photovoltaic Project. December 2010. 33 6 acres from NREL, 8 is average of a sample of 13 WECC PV plants ranging from 5 to 250 MWac.
Chapter 13: Generating Resources
nwcouncil.org/7thplan 13-28
Utility-scale, onshore wind power is classified as a primary resource for the Seventh Power Plan, and therefore received an in-depth, quantitative analysis for modeling purposes. Offshore wind, while an established technology in other parts of the world, is still emerging in the United States and therefore is classified as a resource with long-term potential for the Pacific Northwest.
Wind power is a naturally occurring, renewable form of energy that is harnessed and transferred into electricity through power plants made up of individual turbines. Wind turbines primarily consist of a tower, two or three blades, hub and rotor, and a nacelle (consisting of interconnected shafts (low and high speed), a gear box, and a generator). As the wind blows, the turbine blades (connected at the hub and attached to the rotor) are rotated, with the rotor causing the low speed shaft to spin within the nacelle. Housed in the gearbox, the low speed shaft is connected to the high speed shaft, which increases the speed of the rotation. The gearbox is attached to the generator, which produces the electricity. Wind turbines typically possess weather vanes and anemometers (an instrument to measure wind speed) that transfer information to a controller. Between the controller computer system and remote operators, a wind turbine can be turned on and off depending on the wind speed as well as positioned depending on the wind direction. Today’s wind turbines typically cannot operate in winds higher than 55 miles per hour, and are therefore shut down to preserve the equipment when wind reaches that speed.
Wind power is a variable energy resource that produces intermittent generation output and little firm capacity; therefore, wind power often requires supplemental firm capacity and balancing reserves in order to integrate it into a power system. An existing surplus of balancing reserves and firm capacity within the Pacific Northwest enabled the early growth of wind power without the need or cost of additional capacity reserves. However, significant recent development and the concentration of installed wind capacity within a single balancing area has led to a few substantial ramping events, putting pressure on the balancing area’s ability to integrate the wind power without, for example, displacing other must-run resources. Additional wind power development will need to take this into consideration. Measures such as improved load forecasting, up-ramp curtailment, and sub-hourly scheduling can reduce the amount of flexibility required to integrate a given amount of wind capacity.
Utility-scale, Onshore
Since the first wind turbine technologies were developed in the 1980’s, there has been a significant reduction in capital cost and subsequent increase in performance as the technology has been streamlined and improved. Capital costs rose from 2003-2010 due to rising global commodity and raw materials prices, increased labor costs, and the economic recession that peaked in the US in 2008-2009. Since then, costs have again begun to decline and performance has continued to improve. As the diameter of the rotors and the hub heights have both increased, the nameplate capacity per turbine has increased. The ability of these turbines to achieve a greater wind sweep area has improved efficiency and capacity factors, allowing for development in areas that may have suboptimal wind resources.
Over the past decade, wind development both regionally and nationally has grown significantly. According to the American Wind Energy Association (AWEA), there was 65,879 megawatts installed nameplate capacity of wind in service in the United States at the end of 2014. In the Pacific Northwest, about 8,700 megawatts nameplate capacity of wind has been developed since the first project in 1998. Regional development trends have mirrored national trends, with development
Chapter 13: Generating Resources
nwcouncil.org/7thplan 13-29
waxing and waning with the expiration and renewal of tax incentives and the onset of state renewable portfolio standards (RPS). To date, 2012 has been the strongest year for wind development for the region and nation, with development dropping off since then.
The rapid rate of development reflects the fundamental attributes of wind power as an abundant, mature, relatively low-cost source of low-carbon energy with local economic benefits. These attributes, combined with an array of market and financial incentives and strong political and societal support within the Northwest and elsewhere in the Western Electricity Coordinating Council (WECC) region spurred the development over the past decade. Developing and purchasing wind power to meet state RPS requirements has arguably been the largest driver of development to-date. With the federal tax incentives set to wind down and expire over the next 5-7 years34, and many near-term RPS targets met, wind power will have to stand on its own economic and operational strengths when compared to other new resource options.
The wind power reference plant for the Seventh Power Plan is a 100 megawatt nameplate capacity plant consisting of arrays of conventional three-blade, 2.5 megawatt wind turbine generators. The plant is assumed to have in-plant electrical and control systems, interconnection facilities and on-site roads, meteorological towers, and support facilities. The economic life of the reference plant has improved since the Sixth Power Plan, from 20 years to 25 years, based on improved technologies. The capital cost for projects in 2012 dollars is $2,307 per kilowatt. There are two locations (and capacity factors) for the reference plant – one is located in the Columbia River Gorge and the other in Central Montana with delivery into the Bonneville Power Administration service territory. The capacity factor in the Columbia basin is 32 percent, while in central Montana where the wind resource is very high, the capacity factor is 40 percent.
Five wind resource blocks were defined to use as inputs to the RPM.
1. Columbia Basin wind with Bonneville transmission 2. Montana wind with existing transmission 3. Montana wind with a potentially new 230kV transmission line 4. Montana wind with a potentially large upgrade to the transmission system 5. Montana wind using transmission available if Colstrip Units 1 and 2 were retired at
some future date
The levelized costs for each wind resource were developed assuming that the Production Tax Credit would not be renewed after its expiration in 2014. Although it has since been renewed by the Consolidated Appropriations Act in December 2015, the levelized costs remain nearly unchanged. The financial assumptions used for calculating levelized costs were consistent with an IOU sponsor. See Figure 13 - 2 for levelized costs of wind compared with solar PV.
34 See discussion on amended PTC and ITC in Chapter 9.
Chapter 13: Generating Resources
nwcouncil.org/7thplan 13-30
Utility–Scale, Offshore
Offshore wind potential off the coasts of the United States and in the Great Lakes is estimated to be as significant as 4,000 gigawatts. Realistically, feasible potential is likely to be much less when barriers such as competing economic enterprises, maritime traffic, and environmental issues and wildlife refuges are taken into consideration. While there is about 7,000 megawatts of offshore wind capacity installed globally, primarily off the coasts of Northwestern Europe and China, there are no operating plants installed in the United States as of mid-2015. There are, however, fourteen projects considered to be in advanced development on the East Coast, with two projects totaling about 530 megawatts under construction and expected to be commercially operable in 2016.
Offshore wind turbines tend to be larger in both size and energy output than their terrestrial counterparts. The average offshore turbine has a capacity between four to five megawatts compared to 1.5 to three megawatts onshore. When the turbine capacity is combined with the higher offshore wind speeds, the capacity factors tend to also be higher than onshore plants. Due to the logistics of being offshore, wind turbines and their surrounding structures need to be able to withstand harsh environmental conditions as maintenance has proven to be difficult and costly. There are currently many offshore wind turbine prototypes and proven technologies, ranging from turbines that are designed to be drilled into the ocean floor and turbines that can float and therefore be placed further out in the ocean.
The estimated capital cost of offshore wind is between $5,000 and $6,000 per kilowatt, more than double the average cost of onshore wind projects. In addition to the challenge of making offshore wind more cost-competitive with onshore wind and other renewable energy sources, the Department of Energy has identified a lack of infrastructure (e.g. transmission) and an uncertain regulatory environment as significant barriers to development in the near term.35
Environmental Effects of Onshore Wind Power Technologies
The proliferation of wind facilities has the potential to cause a variety of impacts, including harm to wildlife, plants, water and air quality, human health, and cultural and historical resources.
Wind turbines have the potential to affect a variety of wildlife, including birds, bats, and non-flying animal species. This impact may occur in at least three ways: direct contact with the turbine blades, contact with areas of rapidly changing pressure near spinning turbines, and habitat disruption from the construction and operation of turbines.
Wind facilities kill an estimated 140,000 to 328,000 birds annually in the U.S., although those figures are subject to considerable debate.36 Bird deaths are primarily the result of direct contact with
35 “Offshore Wind Market and Economic Analysis: 2014 Annual Market Assessment.” Navigant report prepared for U.S. Department of Energy, 2014. 36 http://www.sciencedirect.com/science/article/pii/S0006320713003522. That figure represents only a fraction of the birds killed by domestic cats, buildings, and transportation. http://www.nytimes.com/2011/03/21/science/21birds.html?_r=0.

Chapter 13: Generating Resources
nwcouncil.org/7thplan 13-31
spinning wind turbines, the tips of which can travel at speeds ranging from 150 to 200 miles per hour.37 The average wind project reports fewer than four bird fatalities per megawatt (nameplate capacity) per year, the majority of which are songbirds.38
Eagles and other raptors may be affected by the operation of wind facilities in and around their soaring locations, through direct contact with spinning turbine blades. Raptor mortality from wind development, however, does not appear to be as significant a concern in the Northwest as it is in California.39 Wind developers and project owners can limit a facility’s impact on raptors by engaging in a pre-development site evaluation to determine raptor abundance, siting in areas of low prey density, and mitigation measures designed to curtail turbine operation when raptors are present.40 Another avian species of concern to wind development is the Greater Sage Grouse because its range coincides with prime wind resources in the region.41
Many bat species are also affected by wind energy development, through both contact with the spinning blades and contact with areas of rapidly changing pressure caused by the turbines. Abrupt changes in pressure may cause barotrauma in bats, resulting in internal hemorrhaging that can be fatal.42 Wind turbines kill an estimated 600,000 to 900,000 bats annually in the United States. Risk to bats can be reduced significantly by curtailing operation during wind speeds at which bats are active, typically below 7.8 miles per hour.43
Wind power development may have adverse impacts on water quality during construction, operation, and decommissioning phases, depending on the location of the project and its proximity to surface waters; however, these water quality impacts are not likely to be significant. In addition, wind power development and operation may result in a variety of human health impacts and impacts to cultural and historical resources. Primary human health impacts include aesthetic and noise disturbances, shadow flicker, and aviation safety lighting.
Further detail on environmental effects, environmental regulations, and compliance actions will be found in Appendix I. Appendix I also contains a discussion of the environmental effects and issues associated with the development of transmission facilities to serve the development of renewable resources across the region’s landscape. See also the discussion of the region’s existing generating resources in Chapter 9.
37 http://www.aweo.org/windmodels.html. 38 http://www1.eere.energy.gov/wind/pdfs/birds_and_bats_fact_sheet.pdf. 39 Ibid. 40 Ibid. 41 http://www.pnl.gov/main/publications/external/technical_reports/PNNL-18567.pdf at 2.2. 42 http://www1.eere.energy.gov/wind/pdfs/birds_and_bats_fact_sheet.pdf. 43 http://www.popsci.com/blog-network/eek-squad/wind-turbines-kill-more-600000-bats-year-what-should-we-do, see also http://www.smithsonianmag.com/smart-news/scientists-save-bats-and-birds-from-wind-turbine-slaughter-130262849/.
Chapter 13: Generating Resources
nwcouncil.org/7thplan 13-32
SECONDARY RESOURCES The following resources were deemed to be secondary in terms of analysis for the Seventh Power Plan. While these resources have potential in the Pacific Northwest and utilize technologies that are commercially available, the quantity of the potential compared to the primary resources is less. The secondary resources were not explicitly modeled in the Regional Portfolio Model, though they are still considered viable resource options for future power planning needs within the region.
Hydroelectric Power The Pacific Northwest power system is dominated by hydroelectric power. Stemming from the mountains of the Pacific Northwest and British Columbia, the heavy precipitation experienced there (often in the form of snow) produces large volumes of annual runoff. About 360 hydroelectric projects have been developed in the Columbia River and its associated tributaries to capture that runoff, providing about 33,000 megawatts nameplate capacity to the region and accounting for over half of the energy generated in the region each year.
The region has been undergoing renovations and upgrades to many of its existing hydroelectric dams, often resulting in increased efficiency (average megawatts) of existing nameplate capacity or the added nameplate capacity through the addition of turbines and new equipment. Renovations to restore the original capacity and energy production of existing hydropower projects, and upgrades to yield additional energy and capacity are often much less costly than developing new projects. Most existing projects date from a time when the value of electricity was lower and equipment efficiency less than now, and it is often feasible to implement upgrades such as advanced turbines, generator rewinds, and spillway gate calibration and seal improvement. Even a slight improvement in equipment efficiency at a large project can yield significant energy.
New small hydropower projects have also been assessed for feasibility in the Pacific Northwest. Snohomish PUD developed its 7.5 megawatt installed capacity Youngs Creek small hydro project in 2011. It was the first new hydroelectric project in Washington in twenty years. Recent regulatory actions have helped pave the way for future small hydro development at existing non-powered dams. President Obama signed into law the Hydropower Regulatory Efficiency Act of 201344, of which one of its goals is to streamline the licensing process for development of conduit projects and small hydroelectric projects at existing non-powered dams. In some cases, projects meeting certain criteria are exempt from having to secure a license at all.
The Council’s last major assessment of hydroelectric potential was conducted during the development of the Fourth Power Plan in 1994. That plan identified 480 megawatts of additional nameplate capacity, producing about 200 average megawatts of energy. Since then, there have been numerous regional and national studies that speculate that large amounts of hydroelectric potential remain to be developed in the region. These studies vary in scope, objective and
44 http://www.ferc.gov/legal/fed-sta/bills-113hr267enr.pdf
Chapter 13: Generating Resources
nwcouncil.org/7thplan 13-33
methodology, and use different parameters and screens to narrow down and define hydroelectric potential. One of the most prevalent reports was a 2014 Department of Energy (DOE) hydropower potential assessment45 that identified almost 85,000 megawatts of physical developable hydropower in new stream reaches in the United States. The largest of this potential – 25,000 megawatts - was identified in the Pacific Northwest. Other studies looked at potential at existing non-powered dams, upgrades to existing hydroelectric facilities, and varying size, site, or region-specific assessments.
In order to gain a better understanding of Pacific Northwest potential for new hydroelectric development and upgrades to existing units, and the costs associated with that potential development, the Council commissioned a scoping study in 201446 to review the published reports and estimates and determine if a realistic, reasonable assumption could be derived from the existing work.
The results of the scoping study identified 211 megawatts of potential new capacity at existing non-powered dams, conduit and hydrokinetic sites, and from general assessments. In addition, in a survey of the region’s hydroelectric owners, it identified 388 megawatts new capacity in upgrades to existing projects. Finally, the scoping study identified an additional 2,640 megawatts of new pumped storage capacity in the region.
Not included in these results is the potential identified by the 2014 DOE study because that report was not site-specific. However, while working with StreamNet47 and the Oak Ridge National Laboratory (who developed the DOE report), it was determined that only about 12 percent of the potential identified was located in sites that were outside of the Protected Areas. Extensive further analysis would need to be done on this remaining potential to determine if any of it would be economically and environmentally feasible to develop. In all likelihood, economics and environmental barriers would diminish this potential significantly. In addition, the remaining studies reviewed likely duplicate these areas and that potential was found to be extremely low. For more detail, see the Council’s Regional Hydropower Scoping Study.48
Because the results of the Council’s scoping study determined that there was not significant new hydropower capacity available for development in the Pacific Northwest, it was omitted as a new resource choice option in the RPM. However, small hydropower and upgrades to existing units should be evaluated on a site-by-site basis by owners and prospective developers.
Pumped Storage
Pumped storage hydropower is an established and commercially mature technology. However the Council considers it as an emerging technology because new advances in technology have expanded its role from primarily shifting energy to providing additional ancillary services and capabilities that are beneficial in today’s power system which has increasing amounts of variable
45 http://energy.gov/articles/energy-dept-report-finds-major-potential-grow-clean-sustainable-us-hydropower 46 http://www.nwcouncil.org/energy/grac/hydro/ 47 http://www.streamnet.org/ 48 http://www.nwcouncil.org/media/7149312/final-nwha-power-council-11-17-14_v2.pdf
Chapter 13: Generating Resources
nwcouncil.org/7thplan 13-34
output resources, such as wind. Most existing pumped-storage projects were designed to shift energy from off-peak hours or low demand periods to times of peak demand. Advances in technology, for example adjustable speed and ternary units instead of fixed speed pumping units, have made it possible for pumped storage to better provide capacity, frequency regulation, voltage and reactive support, load following, and longer-term shaping of energy from variable-output resources. In addition, pumped storage is able to provide these services without the fuel consumption, carbon dioxide production, and other environmental impacts associated with thermal generating resources providing similar services. Importantly for the Pacific Northwest, pumped storage could provide within-hour incremental and decremental response to large amounts of variable energy generation.
A typical project consists of an upper reservoir and a lower reservoir connected by a water transfer system with reversible pump-generators. Energy is stored by pumping water from the lower reservoir to the upper reservoir using the pump-generators in motor-pumping mode. Energy is recovered by discharging the stored water through the pump-generators operating in turbine-generator mode. Current pumped storage projects have cycle efficiencies ranging from 70 percent to 85 percent. Pumped-storage projects require suitable topography and geologic conditions for constructing upper and lower reservoirs at significantly different elevations within close proximity. Subsurface lower reservoirs are technically feasible, though much more expensive. A water supply is required for initial reservoir charge and makeup.
The Pacific Northwest has one existing pumped storage project - the six-unit, 314 megawatt Grand Coulee pumped-generator at Banks Lake. This plant is primarily used for pumping water up to Banks Lake, the headworks of the Columbia Basin Irrigation System. There are 17 projects with existing FERC permits located in the Pacific Northwest, with a few that are in active development including EDF Renewable Energy’s Swan Lake North Pumped Storage Project and the Banks Lake North Dam Pump/Generation Project. Recently, Klickitat County PUD announced the decision to stop work on the licensing effort for the John Day Pool Pumped Storage Project due to unsuccessful efforts to obtain necessary financing to complete the licensing effort. The efforts of Klickitat PUD highlight one of the biggest barriers to development that pumped storage projects face – these projects are usually larger in size than one party alone needs, but collaborating with multiple parties to commit financing can prove very difficult. Included in that issue is the fact that pumped storage facilities no longer just provide straight capacity – there are many values to the power system inherent in pumped storage projects that don’t provide direct compensation. Some of the benefits of storage are reflected in the system as a whole, not just solely to a specific power purchaser or end-user, and therefore it can be difficult to raise funds for storage projects if the purchaser is not directly benefiting from all of the services, or is paying for a service that benefits others who are not also contributing funds. For example, if a pump storage project that provides load following and up and down regulation is not compensated – there is not a revenue stream that can help in the financing of a pumped storage project for that service. Action item ANLYS-15 attempts to address this issue.
The Council’s 2014 hydropower scoping study identified 2,640 megawatts capacity of pumped storage potential in three projects that were considered realistic in terms of development outlook. These projects were the John Day (JD) Pool Pumped Storage Project at the John Day Dam, Swan Lake North Pumped Storage Project near Klamath Falls, Oregon, and Banks Lake Pumped Storage Project at Banks Lake and Lake Roosevelt in Washington. Since the Council’s study was published, the developers of the JD Pool project (led by Klickitat PUD) have suspended their FERC licensing
Chapter 13: Generating Resources
nwcouncil.org/7thplan 13-35
efforts due to limited time for the necessary studies in the licensing process to be completed and a lack of co-funders. The estimated cost for new pumped storage projects range from $1,800 per kilowatt to $3,500 per kilowatt of installed capacity. The range in cost is driven by the length of tunnel needed for the project, the overall head (the higher the head, the smaller the machine dimensions and thus the lower the cost), the amount of above ground infrastructure required, and the variable speed technology selected for the pump/turbines.
Combined Heat and Power An on-site generation option, often owned by the facility and not the utility, is combined heat and power (CHP), at usually less than 10 megawatts nameplate capacity. CHP uses a generator (often a reciprocating engine) to produce electricity, while capturing the waste heat to use for water heating loads, increasing the overall efficiency up to 80 percent. Given this, CHP units are most applicable to facilities that have coincident thermal and electric loads. Most industrial manufacturing, hospitals, lodging, universities, and prisons would benefit. Except for biogas or biomass systems, CHP generators use natural gas, and thus the operating cost of these units is highly dependent on fuel costs. The uncertainty in future costs is a major barrier to adoption; however, significant potential remains with short payback periods. The potential identified relies on a 2014 study by Oregon Department of Energy, a 2010 (rev 2013) assessment for Washington by the Northwest CHP Technical Assistance Partnerships. This group also provides estimates for Idaho and Montana potential.49 Based on these studies, the total technical potential region-wide is nearly 6,000 megawatts nameplate capacity.
While there may be a significant amount of technical potential in the region, there are also significant barriers to development. The full benefits of CHP are rarely seen by the individual parties (utility, host facility, developer) involved in the decision to develop CHP. Many of the barriers to CHP stem from these differing perspectives and include:
The required return on investment of the host facility is often higher than that of a utility Unless participating as an equity partner, the utility sees no return, and a loss of load Limited capital and competing investment opportunities often constrain the host facility’s
ability to develop CHP Energy savings benefitting the host facility may not be worth the hassle of installing and
operating a CHP plant. Difficulty establishing a guaranteed fuel supply for wood residue plants. Uncertainties regarding the long-term economic viability of the host facility. The location value of CHP is often not reflected in electricity buy-back prices. The relative complexity of permitting and environmental compliance for small plants.
Information on the environmental effects of CHP generation can be found in Appendix I.
49 http://www.northwestchptap.org/Markets.aspx
Chapter 13: Generating Resources
nwcouncil.org/7thplan 13-36
Geothermal Power Generation The crustal heat of the earth, produced primarily by the decay of naturally occurring radioactive isotopes, may be used for power generation. Conventional geothermal electricity generation requires the coincidental presence of fractured or highly porous rock at temperatures of about 300 degrees
Fahrenheit or higher and water at depths of about 10,000 feet or less. Enhanced geothermal systems (EGS) involve engineering to build the necessary conditions for generation by creating micro fractures in hot rock and pumping an external water supply through the created pathway.
With nameplate capacity of 28.5 megawatts, the Neal Hot Springs geothermal project in South Eastern Oregon is the largest conventional geothermal plant operating in the Northwest. Basin and range geothermal resources have been developed for generation in Nevada, Utah, and California, and recently in Idaho as well. There are no commercially proven EGS projects as of yet; however, the most promising EGS research project currently underway in the U.S. is in Oregon at the Newberry Crater.
Conventional Geothermal Power Generation
Depending on resource temperature, flashed-steam or binary-cycle geothermal technologies could be used with the liquid-dominated hydrothermal resources of the Pacific Northwest. A preference for binary-cycle or heat-pump technology is emerging because of modularity, applicability to lower temperature geothermal resources, and the environmental advantages of a closed geothermal-fluid cycle. In binary plants, the geothermal fluid is brought to the surface using wells and passed through a heat exchanger where the energy is transferred to a low boiling point fluid. The vaporized low boiling point fluid is used to drive a turbine generator, then condensed and returned to the heat exchanger. The cooled geothermal fluid is re-injected to the geothermal reservoir. This technology operates as a baseload resource. Flashed steam plants typically release a small amount of naturally occurring carbon dioxide from the geothermal fluid, whereas the closed-cycle binary plants release no carbon dioxide.
A 2008 U.S. Geological Survey assessment50 of moderate (90° to 150° C) and high (greater than 150° C) temperature hydrothermal resources identified roughly 1,400 average megawatts of potential resource in the Northwest. However, geothermal development has historically been constrained by high-risk, low-success exploration and well field confirmation. See Appendix H for a more detailed description of the available and estimated potential.
While conventional geothermal is categorized as a secondary resource, a reference plant was created for inclusion in the RPM to provide a potentially cost-competitive, dispatchable renewable resource option. Historically, conventional geothermal has seen limited deployments in the Pacific Northwest, but with resource potential identified, it is seen as an alternative to both renewable resources and baseload thermal resources. The reference plant is based primarily off of the
50 United States Geological Survey. Assessment of Moderate- and High-Temperature Geothermal Resources of the United States, 2008.
Chapter 13: Generating Resources
nwcouncil.org/7thplan 13-37
estimates made for the Sixth Power Plan, as there have not been significant changes in terms of cost and potential.
The reference plant consists of three 13 megawatt units, creating a total plant installed nameplate capacity of 39 megawatts. The plant is assumed to use closed-loop organic Rankine cycle binary technology suitable for low geothermal temperatures. The reference plant is located in central Oregon, with existing transmission.
Not fully captured in the estimates of capital cost and the levelized cost of energy of conventional geothermal is the cost of exploration to find a suitable plant site. Initial exploration above ground is required before developers drill a production well underground to determine if a water source exists at the site. If a water source is not available, the well is known as a “dry hole” and conventional geothermal is not feasible. Developers must weigh the risk of drilling dry holes when considering construction of a conventional geothermal plant. This initial testing of a geothermal site can equal about 40% of the total project cost.51
Enhanced Geothermal Systems
Enhanced geothermal systems (EGS) essentially mine the earth’s stored thermal energy. EGS involves drilling to depth and stimulating or fracturing rock in order to allow fluid flow and heat transfer. Water is pumped down and run through the fractures to collect heat. A production well connects to the created reservoir and completes the loop by bringing the heated fluid to surface in order to drive a steam turbine that generates electricity. Since there are no commercially proven projects to date, EGS is considered an emerging technology in the Seventh Power Plan.
EGS could provide renewable, baseload power with little to no greenhouse gas emissions. The potential in the Northwest is very large as hot dry rock is widely available in the region at depths of 3 to 5 kilometers. The Northwest contains two very high-grade resource regions - the Snake River Plain of Idaho and the Oregon Cascade mountain range. Levelized cost of energy estimates for sites in the region range from $175 to $240 per megawatt-hour, with a mature technology estimate of $50 to $52 per megawatt-hour.52
The four basic steps to developing an EGS project include:
1. Identifying and characterizing a suitable site; 2. Drilling injection wells into hot dry rock, stimulating or fracturing the rock to create flow rates
at sufficient temperatures and volumes; 3. Drilling production wells to close the loop; and, 4. Generating electricity using a steam turbine or binary plant power system.
51 Research and Development in Geothermal Exploration and Drilling, Geothermal Energy Association, 2009. https://www.novoco.com/energy/resource_files/reports/geo_rd_1209.pdf 52 The Future of Geothermal Energy – Impact of Enhanced Geothermal Systems on the United States in the 21st Century (Massachusetts Institute of Technology, 2006)
Chapter 13: Generating Resources
nwcouncil.org/7thplan 13-38
Hydraulic fracturing produces tiny crack-like networks that combine with existing fractures and faults in the rock to create a flow network. It is difficult creating optimal flow. If the cracks are too large, fluid passes through without reaching high enough temperatures. If the cracks are too small, it requires a higher pressure drop between wells.53 EGS stimulation differs from the hydro-fracking methods used for oil and natural gas production in that EGS involves deep vertically drilling only and not horizontal drilling. In addition, EGS fractures the rock at lower pressures using water only, and not chemical-water slurry. There are a number of technological challenges to overcome before EGS can become commercially feasible. Research and development in EGS is focused on three main categories:
1. Imaging and characterization of the resource; 2. Deep well drilling techniques; and, 3. Improvement of flow and extending well lifetimes.
Were breakthroughs to occur in each of these categories, the development of enhanced geothermal power could be significant and rapid, especially in the Northwest.
Information on the environmental effects of geothermal generation can be found in Appendix I.
Biomass Before wind and solar PV became the renewable powerhouses they are today, biomass was the largest renewable generating resource in the United States. While still a valuable baseload energy alternative, the potential for biomass in the Pacific Northwest is varied depending on fuel and average size of a typical plant. Because of this, it was not treated as a primary resource and assessed in the Regional Portfolio Model. A few small biomass plants have been developed in the last five years, primarily landfill gas recovery projects and animal waste projects on dairy farms. Overall, the potential resource has remained unchanged since the Sixth Power Plan assessment – see Chapter 6 of the Sixth Power Plan for a detailed breakdown of resource potential by fuel.54
Portland General Electric is suspending coal operations at its Boardman power plant in 2020. As a potential alternative, PGE is evaluating the possibility of re-using the boiler and generating equipment and transforming Boardman into a biomass plant. Along with determining the cost-effectiveness, operating logistics, and environmental effects of this alternative, PGE is studying and testing various biofeedstocks to determine their viability as an alternative fuel to coal. Should PGE determine that this is a course of action they wish to pursue, Boardman could become the biggest biomass plant in the country.
53 Enhanced Geothermal Systems (The MITRE Corporation, December 2013) 54 http://www.nwcouncil.org/media/6371/SixthPowerPlan_Ch6.pdf
Chapter 13: Generating Resources
nwcouncil.org/7thplan 13-39
Energy Storage Technologies Energy storage systems convert electricity into a storable form of energy at one point in time and release the energy back as electricity at a later point in time. Storage systems may be located at various locations including:
1. Customer site 2. Distribution system 3. Transmission system 4. Generation site
Energy storage systems also have many applications, such as:
1. Electric energy time shifting 2. Renewable generation capacity firming 3. Peak capacity 4. Quick response ancillary services – frequency regulation and voltage support 5. Transmission and distribution system deferral
Some storage systems, such as pumped hydro and compressed air storage systems require specific geographies to operate. Battery storage systems are not geographically dependent and can be utilized at multiple locations and for a variety of applications.
The ability to store and release energy can make renewable generation more valuable. For example, a portion of the solar electricity generation that peaks during the afternoon could be stored and released to the grid during the nighttime. The ability of storage to respond quickly to needs would allow the grid to operate more efficiently, and not just for renewable resources, but anything connected to the grid. Storage can be used to defer infrastructure upgrades to the transmission system by reducing wear and tear from operating in overloaded conditions.
Mechanical types of storage include hydro pumped storage, compressed air energy storage, and flywheels. Electrochemical technologies include conventional battery types such as lithium-ion, nickel cadmium, and lead acid. Flow batteries – vanadium redox and zine bromine – are another evolving electrochemical technology. Since not every type of storage is suitable for every application, a storage portfolio may be required. Individual technology characteristics are important for deciding which storage technology to deploy for a particular application,55 such as:
Response time – how quickly can the storage device discharge when needed Duration – the period of time the device can discharge in a single cycle Frequency – the number of charge-discharge cycles per unit of time Depth – the fraction of the device’s total capacity that can be called on in a single cycle Efficiency – the ratio of energy output to energy input for a single cycle
55 Utility Scale Energy Storage Systems (State Utility Forecasting Group, June 2013)

Chapter 13: Generating Resources
nwcouncil.org/7thplan 13-40
Pumped hydro storage is an established, large-scale technology. It can provide discharge times in the tens of hours and at a large scale, up to 1,000 megawatts.56 A pumped hydro system uses off-peak electricity to pump water from one reservoir to another reservoir at a higher elevation. When electricity is needed, water is released from the upper reservoir and run through a hydroelectric turbine to generate electricity. Compressed air energy storage (CAES) is another large scale storage technology that stores energy in the form of pressurized air in underground caverns. Both of these technologies require very specific physical geographies.
Electrochemical battery technologies convert electricity to chemical potential to store, and then convert back to electricity as needed. These technologies are smaller in scale and provide shorter discharge times, anywhere from a few seconds to around six hours. Battery technologies can be more easily sited and built, but have not enjoyed widespread deployment yet due to power performance, limited lifetimes, and high system cost.
A common constraint to deploying energy storage systems is that the project developer is unable to capture the full value of the system’s services. The generation, transmission and distribution sectors may each realize benefits, but it is often difficult for the developer of a storage project to fully capture the benefits of the project.
Battery storage systems may be an important component of the future power system since battery technologies are rapidly improving, manufacturing is ramping, and costs are expected to decline.
Battery Technologies
Conventional batteries are composed of cells which contain two electrodes - a cathode and an anode - and electrolyte in a sealed container. During discharge a reduction-oxidation reaction occurs in the cell and electrons migrate from the anode to the cathode. During recharge, the reaction is reversed through the ionization of the electrolyte. Many different combinations of electrodes and electrolytes have been developed. Three common battery storage technologies include lead-acid, nickel cadmium, and lithium-ion.57
Lead acid batteries are the most mature of the technologies. They are the low cost solution, though they suffer from short life cycles, high maintenance requirements, and toxicity. Green Mountain Power, a Vermont public utility, is currently constructing the Stafford Hill Solar Farm and micro-grid. This project will pair two megawatts of solar PV with four megawatts of lead-acid battery storage.
Nickel cadmium batteries are known as dry cell batteries. They have better life expectancy and higher power delivery capabilities than the lead acid batteries, but are higher in cost.
Lithium-ion (Li-ion) batteries are composed of a graphite negative electrode, a metal-oxide positive electrode, and organic electrolyte with dissolved lithium ions and a micro-porous polymer separator.
56 Grid Energy Storage (U.S. Department of Energy, December 2013) 57 Utility Scale Energy Storage Systems (State Utility Forecasting Group, June 2013)
Chapter 13: Generating Resources
nwcouncil.org/7thplan 13-41
When the battery is charging, lithium ions flow from the positive metal oxide electrode to the negative graphite electrode, and when discharging the flow of ions is reversed.58
Lithium-ion battery technology has long been used in the consumer electronics and electric vehicles. Now Li-ion battery systems are quickly emerging as a favored choice for grid-scale storage systems in the U.S. Li-ion systems typically provide less than four hours of storage. The battery technology is scalable and can be used both on utility-scale of several megawatts, and small residential applications.
In the Northwest, Puget Sound Energy (PSE), Portland General Electric (PGE), and the Snohomish County Public Utility District (SnoPUD) are establishing storage projects using lithium-ion battery technology. PSE’s Glacier Battery Storage Project (2 megawatts and 4.4 megawatt-hours) will serve as a backup power source, reduce system load during high demand periods, and help integrate intermittent renewable generation on the grid. The project is expected to come on-line in late 2015. PGE’s Smart Power Project (5 megawatt) is a working smart grid demonstration. It will also test the ability of battery storage to provide dispatchable backup power, provide demand response, and integrate solar power. SnoPUD is currently installing a battery storage system comprised of three lithium-ion batteries and one flow battery. The project is being developed to improve reliability and integrate variable resources.
Advantages for the technology include a good cycle life and high charge and discharge efficiencies. Challenges include high manufacturing cost and intolerance to deep discharges. Large scale manufacturing of Li-ion batteries could result in lower overall cost battery packs.
Vanadium redox flow batteries (VRB) are a type of flow battery. It’s a developing technology that utilizes vanadium ions. Flow batteries have a unique cell construction. The electrolyte material is stored in tanks, external to the electrodes. During discharge and charge, electrolyte is pumped from its container into the cell to interact with the electrodes. They are capable of going from zero to full output within milliseconds. The technology can be used for megawatt-scale applications and has been demonstrated in large-scale field trials. Typically, flow batteries have a longer life cycle and can perform a high number of discharge cycles, but have a complicated design and are costly to construct. They are a battery option when discharge duration requirements exceed five hours. VRB could be a useful technology for utility applications requiring long discharge durations with rated power between 100 kilowatts and 10 megawatts, and could be used for peak shaving and renewable resource balancing. Costs for VRB systems are relatively high, but could fall as the technology matures.
Battery storage systems may be especially valuable when used in combination on-site with a renewable resource such as solar PV. During the day, dynamic cloud conditions can hamper solar PV electricity generation, resulting in variable output. An integrated battery storage system could smooth the solar output to provide a steadier source of electricity. With an integrated battery storage system, a solar PV plant could provide electricity over wider range of hours, such as the evening or
58 Ibid.
Chapter 13: Generating Resources
nwcouncil.org/7thplan 13-42
nighttime. By strategically charging a battery storage system during the day when solar PV production is high, storing the energy and discharging in the evening or night, a solar PV plant could cover an expanded range of load conditions.
The U.S. Department of Energy has developed near term and long term cost and performance targets for battery systems, including lithium-ion, flow, and other battery technologies. The near term capital cost target is $1,750 per kilowatt, and the longer term target is $1,250 per kilowatt.59 Currently, lithium-ion systems fall in a cost range from around $2000 to $4000 per kilowatt.60
Figure 13 - 6 displays an example of a utility-scale solar PV plant with an integrated battery storage system. The solar PV plant in the example is modeled as a grid connected, 50 megawatt (alternating current) single-axis tracker plant in Western Washington. The battery storage system is modeled as a 10 megawatt Lithium-ion system with discharge capability of up to 4 hours. The chart shows how the solar PV and storage system might be utilized over a winter day in order to provide generation after the sun has set. The grey line shows a typical hourly load pattern for a winter day in the region with peaks in the morning and evening. The dashed yellow line displays the expected solar PV generation, with peak generation in the early afternoon and dropping to zero in the early evening. In this case, the battery storage system could be charged in the afternoon using solar PV generation, and discharged in the evening time to provide output for the evening peak. The orange line shows the overall system output.
59 Grid Energy Storage, U.S. Department of Energy, December 2013 60 DOE/EPRI Electricity Storage Handbook, February 2015
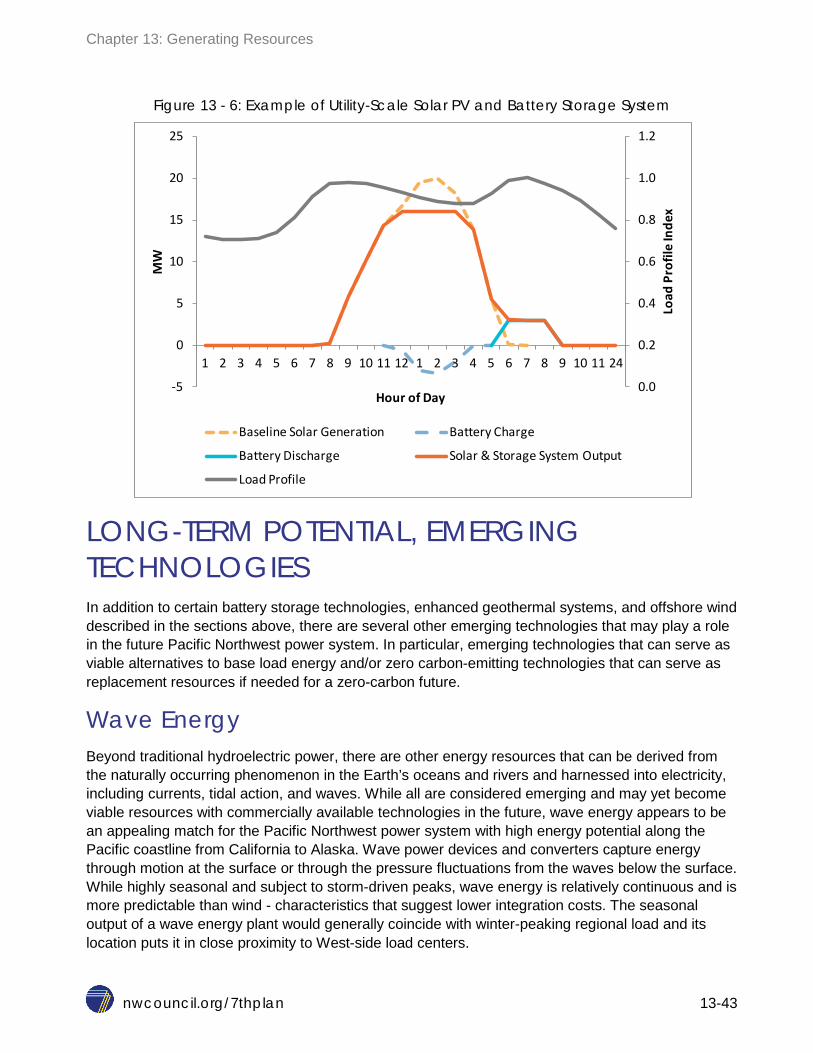
Chapter 13: Generating Resources
nwcouncil.org/7thplan 13-43
Figure 13 - 6: Example of Utility-Scale Solar PV and Battery Storage System
LONG-TERM POTENTIAL, EMERGING TECHNOLOGIES In addition to certain battery storage technologies, enhanced geothermal systems, and offshore wind described in the sections above, there are several other emerging technologies that may play a role in the future Pacific Northwest power system. In particular, emerging technologies that can serve as viable alternatives to base load energy and/or zero carbon-emitting technologies that can serve as replacement resources if needed for a zero-carbon future.
Wave Energy Beyond traditional hydroelectric power, there are other energy resources that can be derived from the naturally occurring phenomenon in the Earth’s oceans and rivers and harnessed into electricity, including currents, tidal action, and waves. While all are considered emerging and may yet become viable resources with commercially available technologies in the future, wave energy appears to be an appealing match for the Pacific Northwest power system with high energy potential along the Pacific coastline from California to Alaska. Wave power devices and converters capture energy through motion at the surface or through the pressure fluctuations from the waves below the surface. While highly seasonal and subject to storm-driven peaks, wave energy is relatively continuous and is more predictable than wind - characteristics that suggest lower integration costs. The seasonal output of a wave energy plant would generally coincide with winter-peaking regional load and its location puts it in close proximity to West-side load centers.
0.0
0.2
0.4
0.6
0.8
1.0
1.2
-5
0
5
10
15
20
25
1 2 3 4 5 6 7 8 9 10 11 12 1 2 3 4 5 6 7 8 9 10 11 24
Load
Pro
file
Inde
x
MW
Hour of Day
Baseline Solar Generation Battery Charge
Battery Discharge Solar & Storage System Output
Load Profile
Chapter 13: Generating Resources
nwcouncil.org/7thplan 13-44
The Electric Power Research Institute (EPRI) released a study in 201161 estimating the potential of wave energy in the United States. The Pacific Northwest ranks highly in terms of resource potential, with an estimate of 7,600 – 11,900 average megawatts of technically recoverable potential on the inner continental shelf of the ocean off the coast of Oregon and Washington.62 This potential would be moderated by competing economic enterprises, maritime traffic, and environmental issues and wildlife refuges, along with other barriers. The realistic potential is likely much less, however further assessment needs to be done to determine this.
Recognizing the relative merits of wave energy, several Northwest utilities have supported the development of marine hydrokinetic projects or research and development efforts. This includes Snohomish PUD, PNGC Power, Douglas County PUD, and Portland General Electric. Although these efforts have been undertaken in coordination or collaboration with some other partners, they have generally not represented investments in regionally coordinated objectives or cross utility cost and benefit sharing.
A Flink Energy Consulting report for the Oregon Wave Energy Trust (OWET) delves into the wave energy industry and its potential in the Pacific Northwest, developing technologies, and barriers to successful deployment, and identifies recommendations within the region to collaborate and help make wave energy a reality.63 Chief among the recommendations was to foster better coordination of utility efforts across the utility community in collaboration with wave energy developers and other stakeholders.
Numerous and diverse wave energy conversion concepts have been proposed and are in various stages of development ranging from conceptualization to pre-commercial demonstration. Wave energy conversion devices will need to perform reliably in a high-energy, corrosive environment, and demonstration projects will be needed to perfect reliable and economic designs. Successful technology demonstration will be followed by commercial pilot projects that could be expanded to full-scale commercial arrays. The Pacific Marine Energy Center South Energy Test Site (PMEC SET) is being developed off the coast of Newport, Oregon. Planned to be operational in 2018, this facility will enable wave energy conversion device testing through interconnection with the local grid and provide device certifications.
Small Modular Reactors Nuclear power plants produce electricity from energy released by the controlled fission of certain isotopes of heavy elements such as uranium, thorium, and plutonium. Nuclear is a source of
61 “Mapping and Assessment of the United States Ocean Wave Energy Resource,” EPRI, 2011. http://www1.eere.energy.gov/water//pdfs/mappingandassessment.pdf 62 See EPRI report for analysis specifics. The inner continental shelf is considered to be within tens of kilometers off the coast at a depth of 50 meters. An additional 8,400 – 14,500 average megawatts potential is identified at the outer continental shelf – up to 50 miles off the coast at a depth of 200 meters. This potential would require extensive transmission builds. 63 “Wave Energy Industry Update: A Northwest Perspective.” Flink Energy Consulting for Oregon Wave Energy Trust, 2015.
Chapter 13: Generating Resources
nwcouncil.org/7thplan 13-45
dependable capacity and baseload zero-carbon energy that is largely immune to high natural gas prices and climate policy. However, a new conventional nuclear unit would entail the risks of construction delay to an already lengthy construction lead time, escalating costs, and the reliability risk associated with a large single-shaft machine. Rather, the emerging small modular reactor (SMR) technology’s smaller size (300 megawatts or less) and modular construction is intended to reduce capital cost and investment risk by utilizing a greater degree of factory assembly, shortening construction lead time, and better matching plant size to customer needs and finances through scaling of multiple units. The smaller plant size of SMRs may also permit greater siting flexibility, load following capability, and cogeneration potential and can benefit system reliability through reduction in “single shaft” outage risk.
While there are multiple SMR designs being developed and tested, one of the leading developers is NuScale Power, headquartered in Corvallis, Oregon. In 2013 NuScale was the recipient of a U.S. Department of Energy cost-sharing award in which they receive funding from DOE to support their SMR technology and move the design certification with the Nuclear Regulatory Commission (NRC) forward with the goal of commercialization.
NuScale is working with Energy Northwest and the Utah Associated Municipal Power System (UAMPS) on siting the first SMR at the Idaho National Laboratory in Idaho Falls, Idaho. Assuming key design certification and development milestones are met along the way, Energy Northwest and UAMPS intend to submit a combined construction and operating license application (COLA) to the Nuclear Regulatory Commission by early 2018. To aid in this application, the U.S. DOE recently awarded NuScale and UAMPS $16 million to complete the COLA. It is estimated that the first module will be operational in 2023 and the full 12-module, 600 megawatt SMR plant will be operational in 2024. Energy Northwest and UAMPS estimate that the capital cost of this first plant will be around $2.9 billion, with a full plant levelized cost of electricity around $75 per megawatt-hour.