Embed Size (px)
Citation preview
1
Chamras Glendale Community College
Organic Chemistry 105
Exam 4 Materials ________________________________________________________________________
Chapter 13
SPECTROSCOPY Definition: Types to Be Covered:
A) Infrared Spectroscopy (IR) B) Nuclear Magnetic Resonance Spectroscopy (NMR) C) Ultra-Violet Spectroscopy (UV)
______________________________________________________________________ Electromagnetic Radiation Spectrum:
R.F.----µ-wave----I.R. (Heat)------Visible------U.V.------X-Ray------γ-Ray
3 x 102 cm--------------------------------------------------------------------------------------10-10cm

2
Energy for Electromagnetic Radiation:
E = h.ν E = ν.λ Proportionalities of: a) Energy & Frequency: b) Wavelength & Frequency: c) Energy & Wavelength: ________________________________________________________________________
Inrfared Spectroscopy * First hand information is about the bond types present in the sample compound. * The information then could be used to conclude about the functional group(s) present in the sample compound. * Based on the vibrations of bonds as a result of absorbing the IR radiation. * Modes of Vibration:
1. Stretching: symmetric and asymmetric
c
H H
R R
c
H H
R R

3
2. Bending: Scissoring, rocking, wagging, and twisting * How many vibrational modes does a molecule (with n atoms) have? EXAMPLE: * How does IR spectroscopy work?
c
H H
R R
c
H H
R R
c
H H
R R
c
H H
R R

4
IR Beam Generator IR beam CollectorSample
* The Axes on an IR spectrum: % Transmittance vs. wavenumber % Transmittance: Wavenumber:

5
* Typical Window of IR Wavenumbers: * Change of Energy across the spectral Wavenumber: * Two Main Regions on IR Spectrum: Fingerprint & Functional Group regions.
The spectrum of wavenumbers (IR radiation range) sweeps the sample. Variations in Bond Strength & Modes of Vibration:

6
Important Stretching Frequencies SAMPLE INFRARED SPECTRA: Ethylbenzene
Bond Type Wavenumber (cm–1) Intensity C=N 2260-2220 Medium
C=C 2260-2100 Medium to weak C=C 1680-1600 Medium Aromatic C=C 1600-1500 Strong C=O 1650-1800 Strong C–O 1250-1050 Strong C–N 1230-1020 Medium O–H (alcohol) 3650-3200 Strong O–H (acid) 3300-2500 Strong N–H 3500-3300 Medium Aromatic C–H 3300-3000 Medium Aliphatic C–H 3000-2700 Medium

7
Cyclohexene 1-Hexanol Pentanoic acid

8
Additional Points on IR Spectroscopy 1. Energy needed for stretching vs. bending 2. Stretching wavenumber for different carbonyl double bonds:
O
O
H
O
O
O
O
H
C=O stretch (cm–1):
C=O stretch (cm–1):
17271717
1712 1742
C=O stretch (cm–1):
C=O stretch (cm–1):
1822* 1783
1747 1716
OO
O
O

9
1H–NMR Spectroscopy Basic Physics Principles: For a molecule: To simplify: There is a net magnetic moment. …Now let’s consider this on a statistical scale:
N
SN
S
C
H
H
H
O
H
C
H
H
H
O
H
C
H
H
H
O
H
C
H
H
H
O
H
CH
H
C
H
H
H
O
C
H
H
H
O
H
C
H
H
H
O
H
C
H
H
H
O
H
H
C
H
H
H
O
H
CH
HH
O
H
CH
HH
O
H
CH
HH
O
H
CH
HH
O
H
CH
HH
O
H
CH
H
HOH
CH
H
HOH
CH
H
HOH
CH
H
HOH
CH
H
OHH
CH
H
H
OHCH
H
H
OH
CH
H
H
OH
CH
H
H
OH
CH
H
H
OH
CH
H
H
OHCH
H
H
OH
CH
H
H CH
H
H
CH
H
H
OH
H
C
H
H
H
O
HC
H
H
O
H
C
H
H
H
O
H
H
O
H
C
H
HH
O
H
C
H
HH
O
H
C
H
H
O
H
H
CH
H
H
OH
C
H
H
O
CH
H
H
OH
CH
H
H
OH
CH
H
H
OH
CH
H
H
OH
H
CH
H
H
OH
CH
H
H
OH
C
H H
HOH
C
HOH
C
H
H
H
O
H
C
H
H
H
O
H
CH
H
C
H
H
H
O
H
C
H
H
H
O
H
H
C
H
H
H
O
H
C
H
H
H
O
HH
C
H
H
H
C
H
H
H
O
H
C
H
H
H
O
H
C
H
H
H
O
H
C
H
H
H
O
H
CH
HH
O
H
CH
HH
O
H
CH
HH
O
H
CH
HH
O
H
CH
HH
O
HC
HH
HO H C
HH
HO H
CH
H
HO H
CH
H
HO H
H
H
10
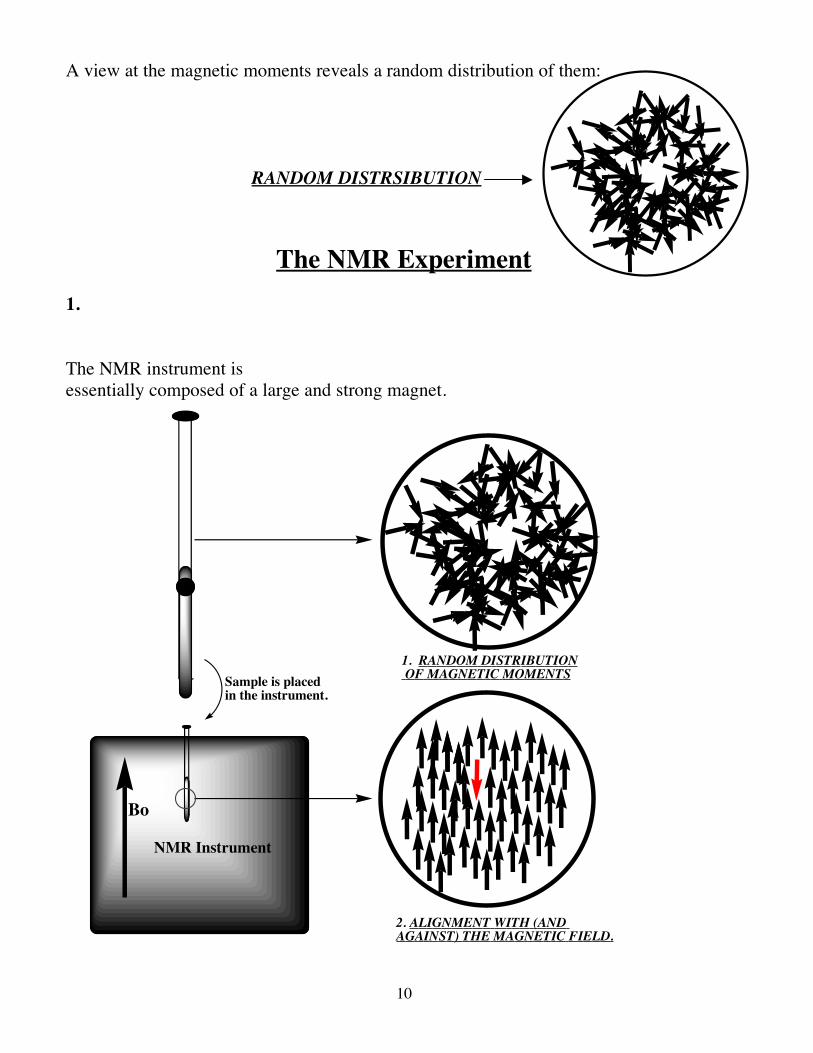
A view at the magnetic moments reveals a random distribution of them: RANDOM DISTRSIBUTION
The NMR Experiment 1. The NMR instrument is essentially composed of a large and strong magnet.
H
HH
H
H
H
H
H
Bo
NMR Instrument
H
HH
H
H
H
H
H
1. RANDOM DISTRIBUTION OF MAGNETIC MOMENTS
2. ALIGNMENT WITH (AND AGAINST) THE MAGNETIC FIELD.
Sample is placed in the instrument.

11
2. 3. 4. For every type of resonance a peak will appear on the NMR spectrum. Also, every electronically different type of proton (hydrogen) in the given sample, produces a peak at a different frequency.
Electronically Different Types of Protons Label the electronically different types of protons in the structures below:
BoEWith
Against
E
With
Against
R.F.
Excitation
De-Excitation
RESONANCE
OH
O
H2N
Cl
Cl
Cl
O
O

12
Information Sources on the 1H-NMR Spectrum Information Source Helps Learn About…
1. IHD (Index of Hydrogen Deficiency)-------------The degree of unsaturation in the sample molecule. 2. Chemical Shift--------------------------------------- Type of proton. 3. Integration---------------------------------------------Relative number of protons giving rise to the peak. 4. Multiplicity-------------------------------------------The number of protons on the immediately neighboring atoms. _____________________________________________________________________ 1. IHD: If the molecular formula is given, the IHD could be calculated via the following equation: EXAMPLE: IHD: _______
Rings: IHD: _______ _______ _______ _______ p-bonds: IHD: __________
IHD =2C - H + 2 - X + N
2
Cl
O

13
2. Chemical Shift: Where the peak appears on the X-axis of the NMR window (in units of ppm), could indicate what type of proton gives rise to the peak. A table of the most common 1H-NMR chemical shifts is shown below: The Effect of Neighboring atoms on Chemical Shift:
O H
C H H
H

14
EXAMPLE: ________________________________________________________________________ 3. Integration: Relative number of protons giving rise to a peak. Definition of Integral: Three forms integration appears on NMR spectra:
1. As calculated areas under peaks:
2. As lines over the peaks:
0123
PPM
0123
PPM
56.488 28.012
I
3.2 ppm
1.8 ppm
1.4 ppm
I
I5.3 ppm
1.6 ppm Cl
3.4 ppm
1.7 ppm
1.4 ppm
15
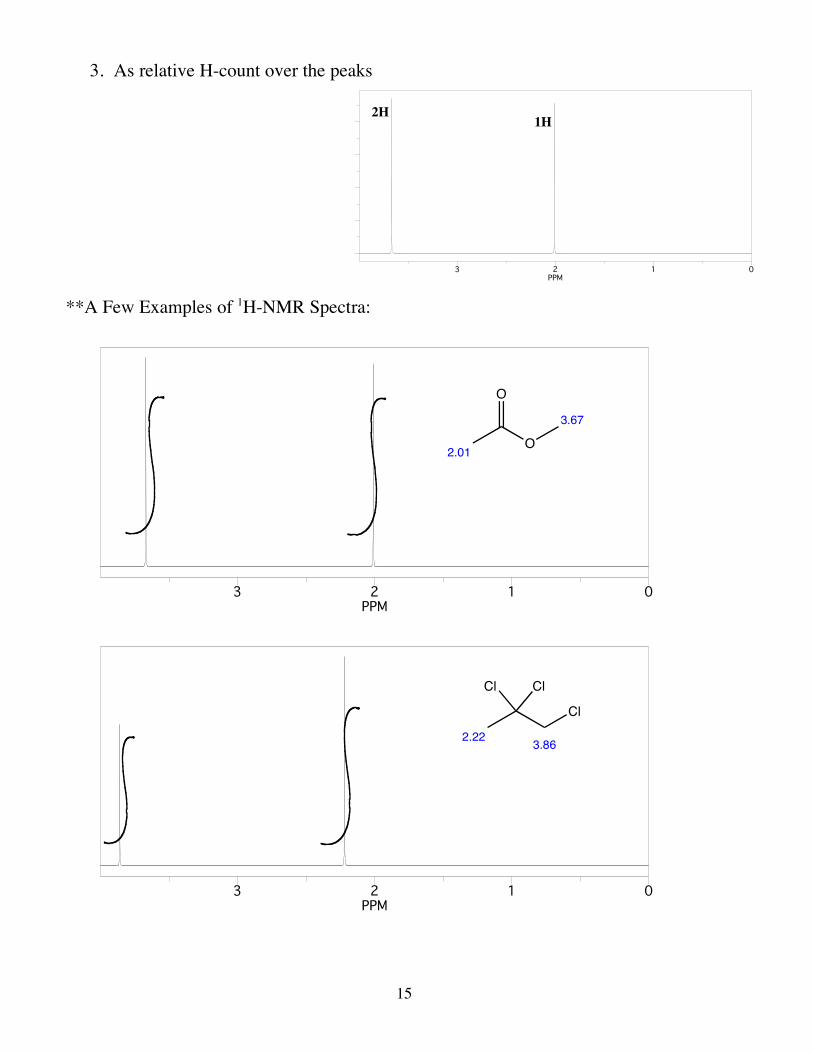
3. As relative H-count over the peaks **A Few Examples of 1H-NMR Spectra:
0123
PPM
2H1H
O
O
2.01
3.67
0123
PPM
ClCl
Cl
2.223.86
0123
PPM

16
**Hydrogens Bonded to Heteroatoms:
OH
1.21
1.21
1.21
2.0
012
PPM0.599 5.380

17
4. Multiplicity: Spin-Spin Splitting WHY A TRIPLET???
C
H
C
HA
HB
By HA
Split 1
By HB
Split 2
DOUBLET DOUBLET of DOUBLET
TRIPLET
C
H
C
H
50:50
No neighboring H A SINGLET
Splitting by each neighboring H
Resulting in a DOUBLET
Bo
18
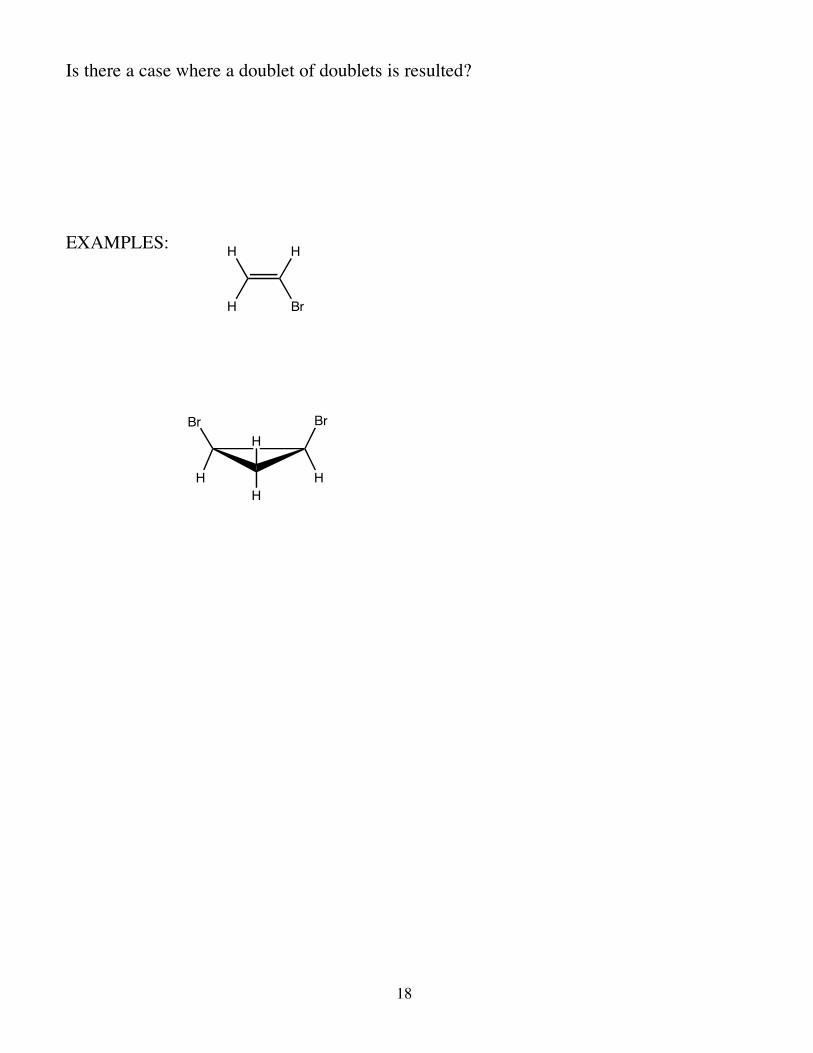
Is there a case where a doublet of doublets is resulted? EXAMPLES:
H
Br
H
H
Br
H
H
Br
H
H

19
Examples of 1H-NMR Spectra with Multiplicity: Solving the Spectrum: Given the spectrum and the structure, the peaks should be:
a) assigned to different types of protons in the molecule b) the multiplicities of the peaks should be consistent with the corresponding assigned
protons c) the relative number of protons elucidated from the NMR spectrum should be
consistent with the ratios present in the molecule. Labeled Structure
H-Type Approx. Chem. Shift (ppm)
Multiplicity Integration
O
O
01234
PPM

20
H-Type Approx. Chem. Shift (ppm)
Multiplicity Integration
O
O
01234
PPM

21
Molec. Formula: C5H9ClO2
IHD:
H-Type Approx. Chem. Shift (ppm)
Multiplicity Integration
0123456
PPM

22
The Difference Between PREDICTING and INTERPRETING 1H-NMR Spectra: Predict the 1H-NMR spectrum for benzoic acid:
Predicted Spectrum: 11 10 9 (ppm) 8 7 6 5 4 3 2 1 0
H-Type Approx. Chem. Shift (ppm)
Multiplicity Integration
O OH
23
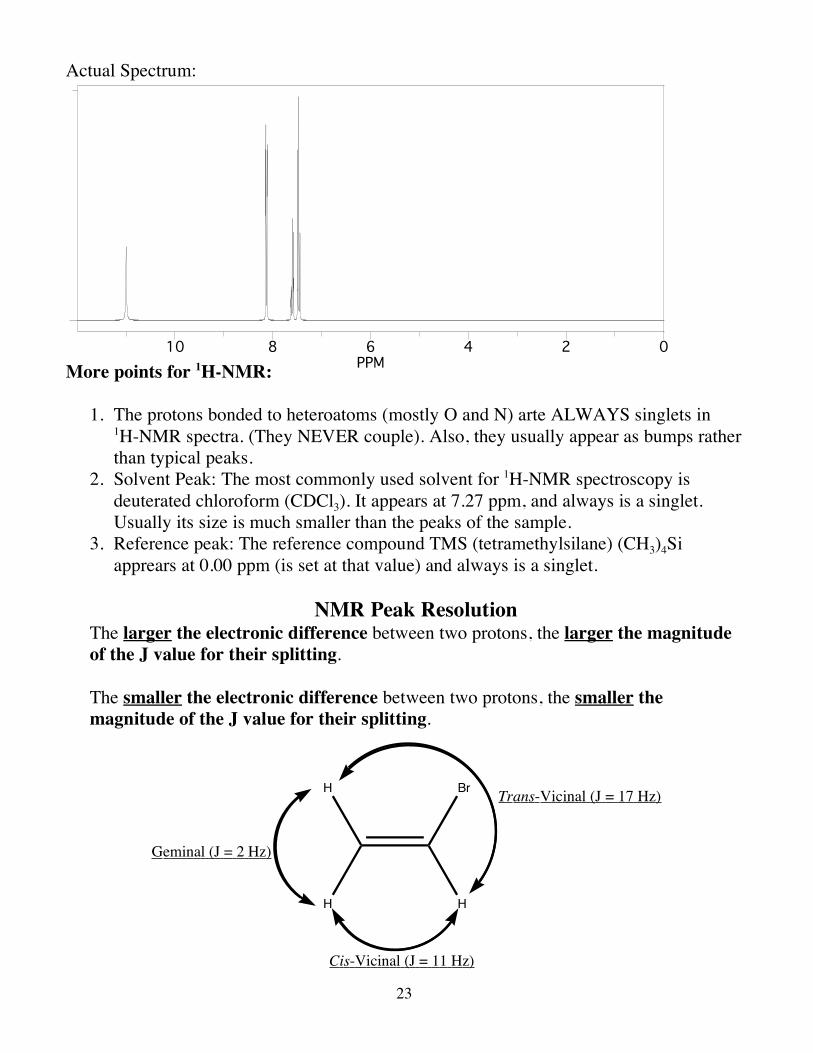
Actual Spectrum: More points for 1H-NMR:
1. The protons bonded to heteroatoms (mostly O and N) arte ALWAYS singlets in 1H-NMR spectra. (They NEVER couple). Also, they usually appear as bumps rather than typical peaks.
2. Solvent Peak: The most commonly used solvent for 1H-NMR spectroscopy is deuterated chloroform (CDCl3). It appears at 7.27 ppm, and always is a singlet. Usually its size is much smaller than the peaks of the sample.
3. Reference peak: The reference compound TMS (tetramethylsilane) (CH3)4Si apprears at 0.00 ppm (is set at that value) and always is a singlet.
NMR Peak Resolution
The larger the electronic difference between two protons, the larger the magnitude of the J value for their splitting. The smaller the electronic difference between two protons, the smaller the magnitude of the J value for their splitting.
0246810
PPM
Br
H
H
H
Trans-Vicinal (J = 17 Hz)
Cis-Vicinal (J = 11 Hz)
Geminal (J = 2 Hz)

24
13C-NMR Spectroscopy
C-13 Vs. C-12:
Comparison-Contrast with 1H-NMR: 1. Isotopic abundance: 2. Peak size: 3. Integration (area vs. height): 4. Coupling: 5. Multiplicity: 6. Spectral window and chemical shift: 7. CDCl3 peak:
25
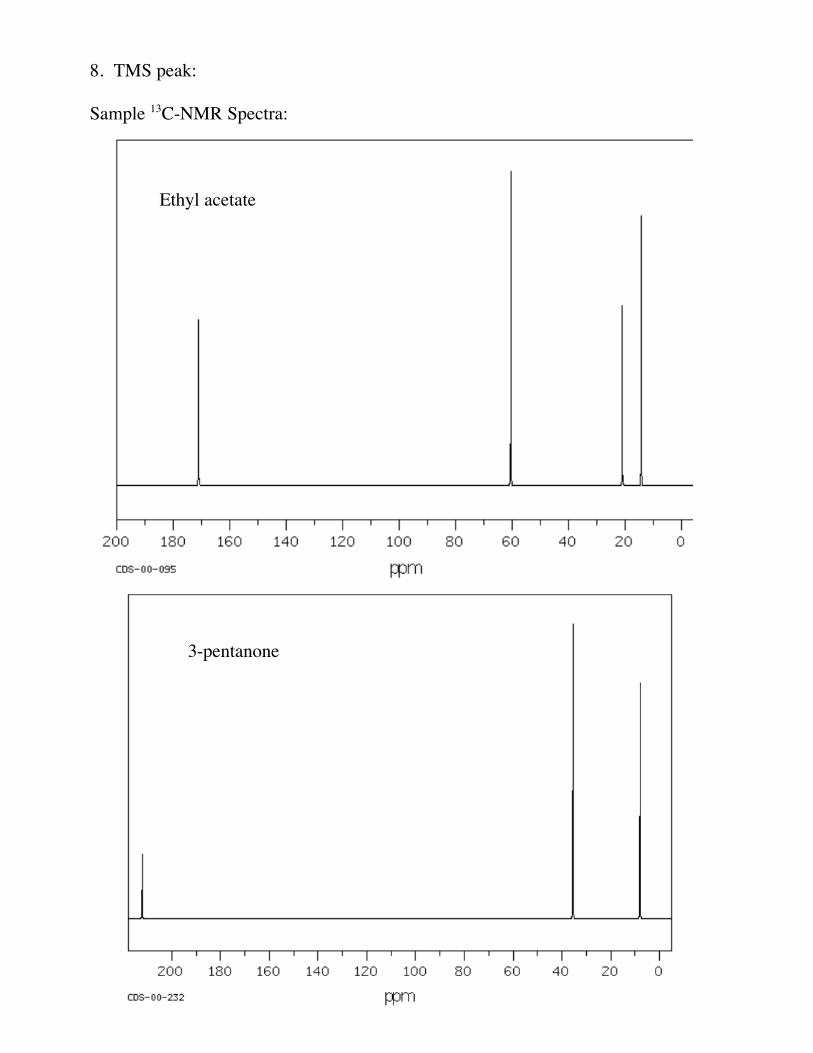
8. TMS peak: Sample 13C-NMR Spectra:
Ethyl acetate
3-pentanone

26
1-phenyl-2-propyn-1-ol

27
UV-Vis (Ultraviolet-Visible) Spectroscopy
Excites the p-bonds (weaker than s, therefore excitable with UV-Vis light. Conjugation and the wavelength for the UV-Vis energy for excitation:
Alkene UV-Vis Wavelength Ethylene ---------------------------------- 1,3-butadiene ---------------------------------- 2,4,6-octatriene ------------ lycopene --------------------------------------------------------------