Embed Size (px)
Citation preview
© 2013 Pearson Education, Inc.Lectures by Edward J. Zalisko
PowerPoint® Lectures forCampbell Essential Biology, Fifth Edition, andCampbell Essential Biology with Physiology,
Fourth Edition– Eric J. Simon, Jean L. Dickey, and Jane B. Reece
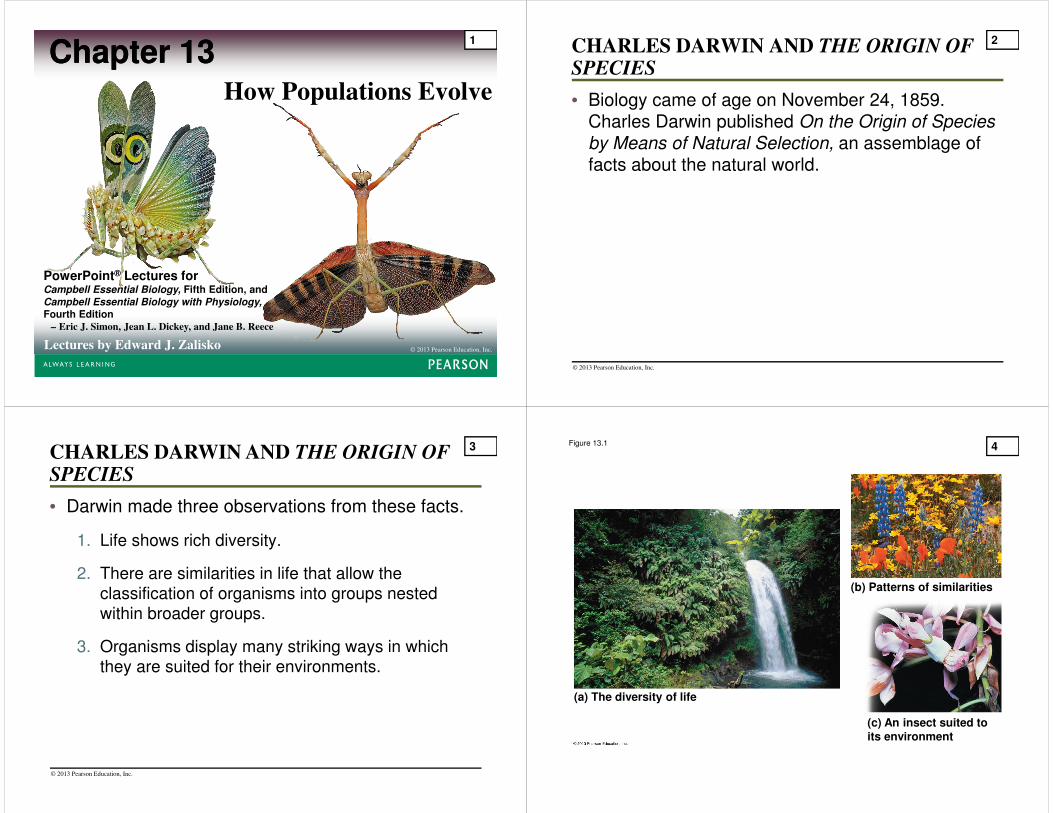
Chapter 13Chapter 13How Populations Evolve
1 CHARLES DARWIN AND THE ORIGIN OF SPECIES
• Biology came of age on November 24, 1859.
Charles Darwin published On the Origin of Species
by Means of Natural Selection, an assemblage of
facts about the natural world.
© 2013 Pearson Education, Inc.
2
• Darwin made three observations from these facts.
1. Life shows rich diversity.
2. There are similarities in life that allow the classification of organisms into groups nested within broader groups.
3. Organisms display many striking ways in which they are suited for their environments.
CHARLES DARWIN AND THE ORIGIN OF SPECIES
© 2013 Pearson Education, Inc.
3 Figure 13.1
(a) The diversity of life
(b) Patterns of similarities
(c) An insect suited toits environment
4
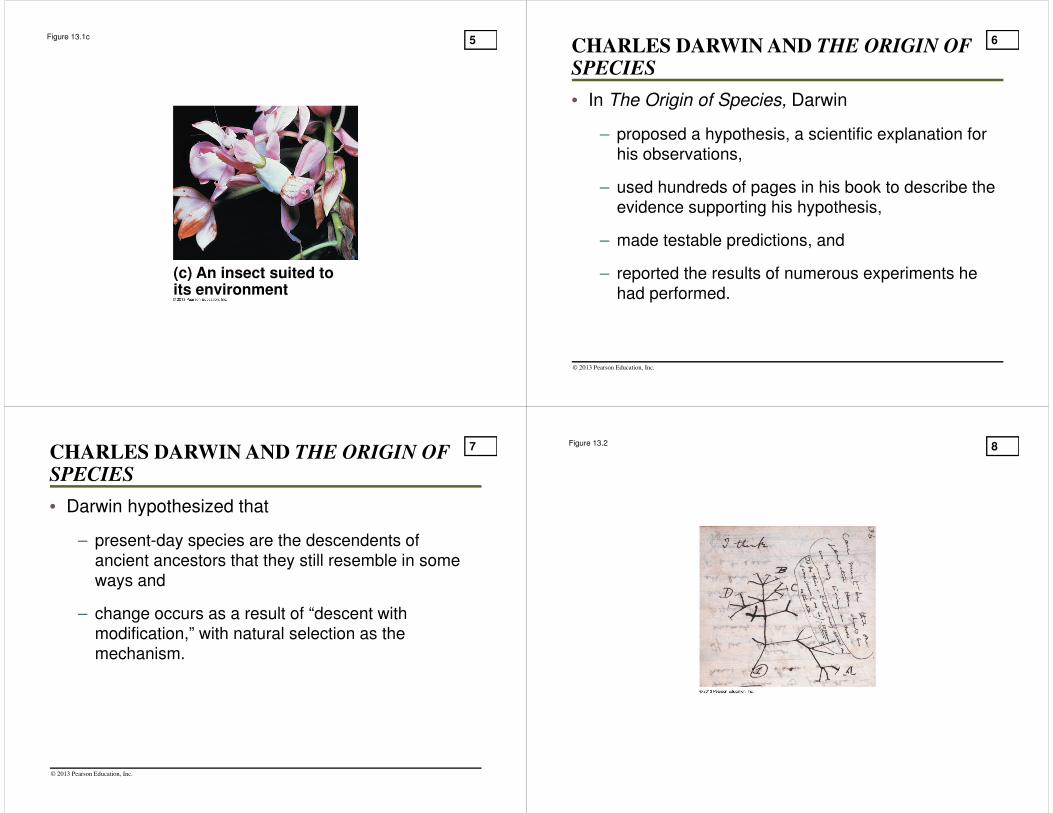
Figure 13.1c
(c) An insect suited toits environment
5
• In The Origin of Species, Darwin
– proposed a hypothesis, a scientific explanation for his observations,
– used hundreds of pages in his book to describe the evidence supporting his hypothesis,
– made testable predictions, and
– reported the results of numerous experiments he had performed.
CHARLES DARWIN AND THE ORIGIN OF SPECIES
© 2013 Pearson Education, Inc.
6
• Darwin hypothesized that
– present-day species are the descendents of ancient ancestors that they still resemble in some ways and
– change occurs as a result of “descent with modification,” with natural selection as the mechanism.
CHARLES DARWIN AND THE ORIGIN OF SPECIES
© 2013 Pearson Education, Inc.
7 Figure 13.2 8
• Natural selection is a process in which organisms
with certain inherited characteristics are more likely
to survive and reproduce than are individuals with
other characteristics.
• As a result of natural selection, a population, a
group of individuals of the same species living in
the same place at the same time, changes over
generations.
CHARLES DARWIN AND THE ORIGIN OF SPECIES
© 2013 Pearson Education, Inc.
9
• Natural selection leads to evolutionary adaptation,
a population’s increase in the frequency of traits
suited to the environment.
• Natural selection thus leads to evolution, seen
either as
– a change in the genetic composition of a population over time or
– on a grander scale, the entire biological history, from the earliest microbes to the enormous diversity of organisms that live on Earth today.
CHARLES DARWIN AND THE ORIGIN OF SPECIES
© 2013 Pearson Education, Inc.
10
• Natural selection leads to
– a population (a group of individuals of the same species living in the same place at the same time) changing over generations and
– evolutionary adaptation.
• In one modern definition of evolution, the genetic
composition of a population changes over time.
CHARLES DARWIN AND THE ORIGIN OF SPECIES
© 2013 Pearson Education, Inc.
11 Darwin’s Cultural and Scientific Context
• The Origin of Species was fundamentally different
from the prevailing scientific and cultural views of
Darwin’s time.
• Let’s place Darwin’s ideas in their historical
context.
© 2013 Pearson Education, Inc.
12
The Idea of Fixed Species
• The Greek philosopher Aristotle held the belief that species are fixed and do not evolve.
• The Judeo-Christian culture fortified this idea with
– a literal interpretation of the biblical book of Genesis and
– the suggestion that Earth may only be 6,000 years old.
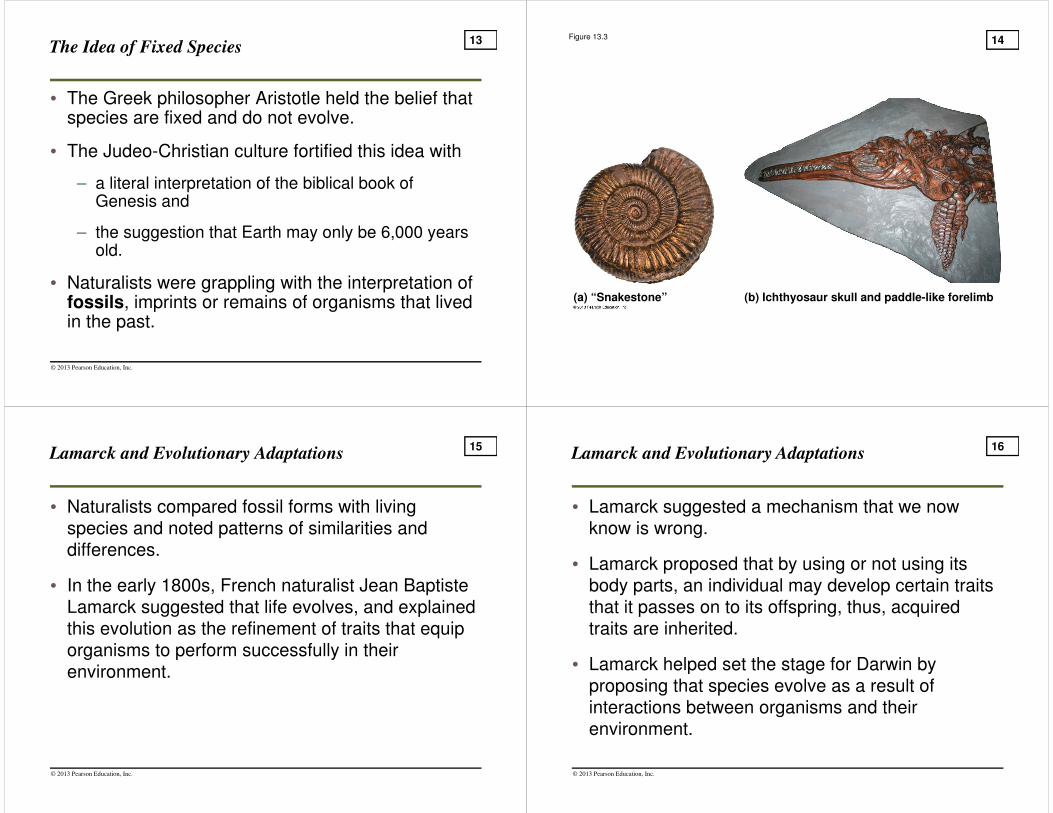
• Naturalists were grappling with the interpretation of fossils, imprints or remains of organisms that lived in the past.
© 2013 Pearson Education, Inc.
13 Figure 13.3
(a) “Snakestone” (b) Ichthyosaur skull and paddle-like forelimb
14
Lamarck and Evolutionary Adaptations
• Naturalists compared fossil forms with living
species and noted patterns of similarities and
differences.
• In the early 1800s, French naturalist Jean Baptiste
Lamarck suggested that life evolves, and explained
this evolution as the refinement of traits that equip
organisms to perform successfully in their
environment.
© 2013 Pearson Education, Inc.
15
• Lamarck suggested a mechanism that we now
know is wrong.
• Lamarck proposed that by using or not using its
body parts, an individual may develop certain traits
that it passes on to its offspring, thus, acquired
traits are inherited.
• Lamarck helped set the stage for Darwin by
proposing that species evolve as a result of
interactions between organisms and their
environment.
Lamarck and Evolutionary Adaptations
© 2013 Pearson Education, Inc.
16
The Voyage of the Beagle
• Darwin was born on February 12, 1809, the same
day that Abraham Lincoln was born.
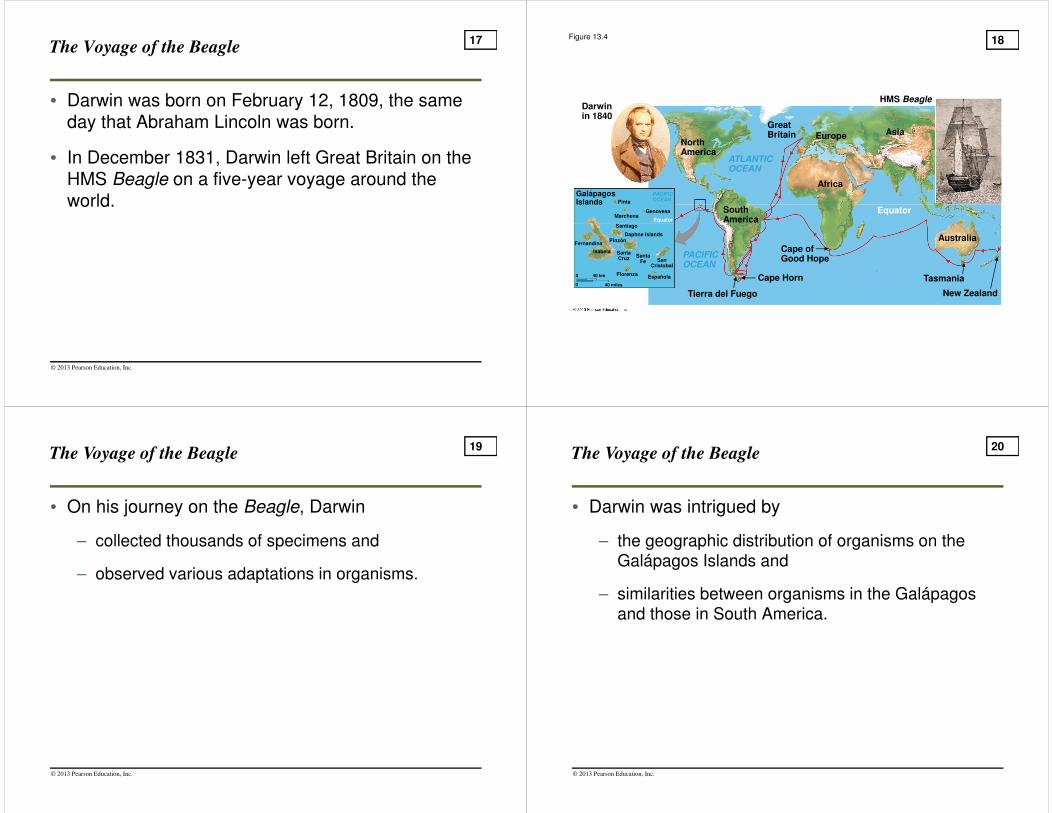
• In December 1831, Darwin left Great Britain on the
HMS Beagle on a five-year voyage around the
world.
© 2013 Pearson Education, Inc.
17 Figure 13.4
Darwin in 1840
NorthAmerica
Great Britain Europe Asia
Africa
SouthAmerica
Cape of Good Hope
Cape Horn
Tierra del Fuego
Australia
Tasmania
New Zealand
HMS Beagle
ATLANTICOCEAN
PACIFICOCEAN
EquatorEquator
PACIFICOCEAN
Fernandina
Isabela
Pinta
Marchena
Santiago
PinzónDaphne Islands
Genovesa
FlorenzaEspañola
SantaCruz
SantaFe San
Cristobal
40 km
40 miles
0
0
GalápagosIslands
18
• On his journey on the Beagle, Darwin
– collected thousands of specimens and
– observed various adaptations in organisms.
The Voyage of the Beagle
© 2013 Pearson Education, Inc.
19
• Darwin was intrigued by
– the geographic distribution of organisms on the Galápagos Islands and
– similarities between organisms in the Galápagos and those in South America.
The Voyage of the Beagle
© 2013 Pearson Education, Inc.
20
• Darwin was strongly influenced by the writings of
geologist Charles Lyell.
• Lyell suggested that Earth
– is very old and
– was sculpted by gradual geological processes that continue today.
The Voyage of the Beagle
© 2013 Pearson Education, Inc.
21
• Darwin reasoned that the extended time scale
would allow for gradual changes to occur
– in species and
– in geologic features.
The Voyage of the Beagle
© 2013 Pearson Education, Inc.
22
Descent with Modification
• Darwin made two main points in The Origin of
Species.
1. Organisms inhabiting Earth today descended from ancestral species.
2. Natural selection is the mechanism for descent with modification.
© 2013 Pearson Education, Inc.
23 EVIDENCE OF EVOLUTION
• Evolution leaves observable signs.
• We will examine five of the many lines of evidence
in support of evolution:
1. the fossil record,
2. biogeography,
3. comparative anatomy,
4. comparative embryology, and
5. molecular biology.
© 2013 Pearson Education, Inc.
24
The Fossil Record
• Fossils are
– imprints or remains of organisms that lived in the past
– often found in sedimentary rocks.
© 2013 Pearson Education, Inc.
25 The Fossil Record
• The fossil record
– is the ordered sequence of fossils as they appear in rock layers,
– reveals the appearance of organisms in a historical sequence, and
– fits with the molecular and cellular evidence that prokaryotes are the ancestors of all life.
© 2013 Pearson Education, Inc.
26
Figure 13.6 27 Figure 13.7-1 29
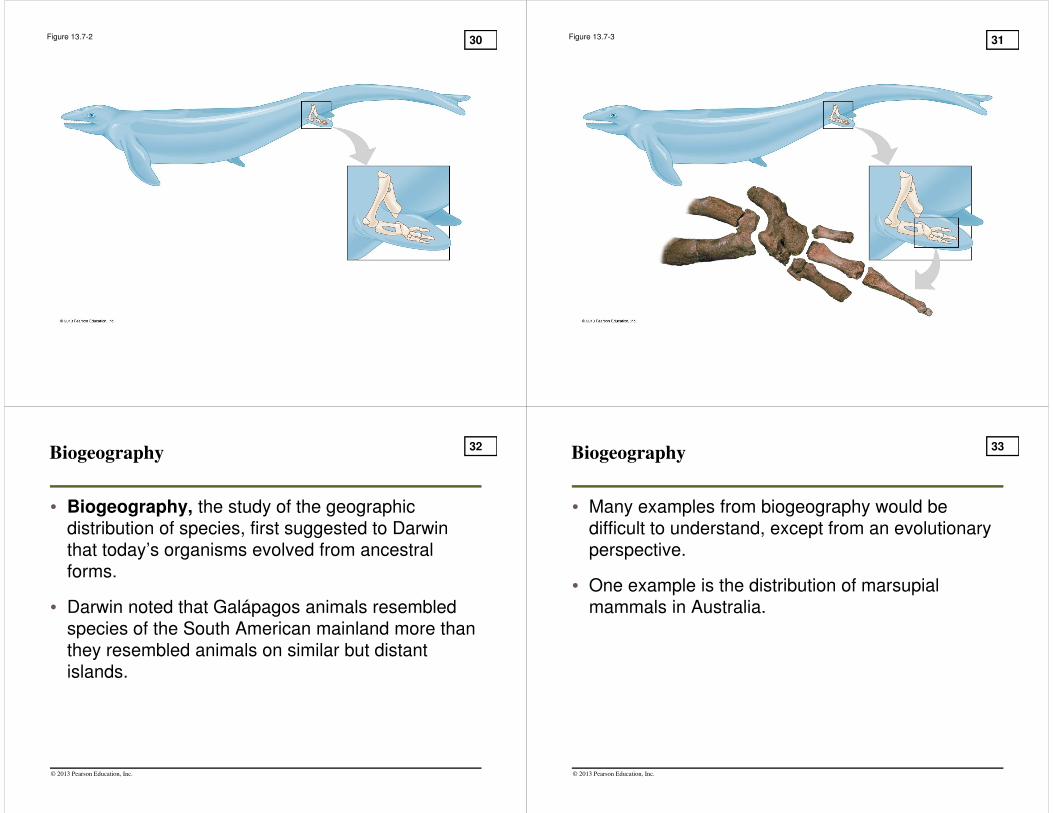
Figure 13.7-2 30 Figure 13.7-3 31
Biogeography
• Biogeography, the study of the geographic
distribution of species, first suggested to Darwin
that today’s organisms evolved from ancestral
forms.
• Darwin noted that Galápagos animals resembled
species of the South American mainland more than
they resembled animals on similar but distant
islands.
© 2013 Pearson Education, Inc.
32
• Many examples from biogeography would be
difficult to understand, except from an evolutionary
perspective.
• One example is the distribution of marsupial
mammals in Australia.
Biogeography
© 2013 Pearson Education, Inc.
33
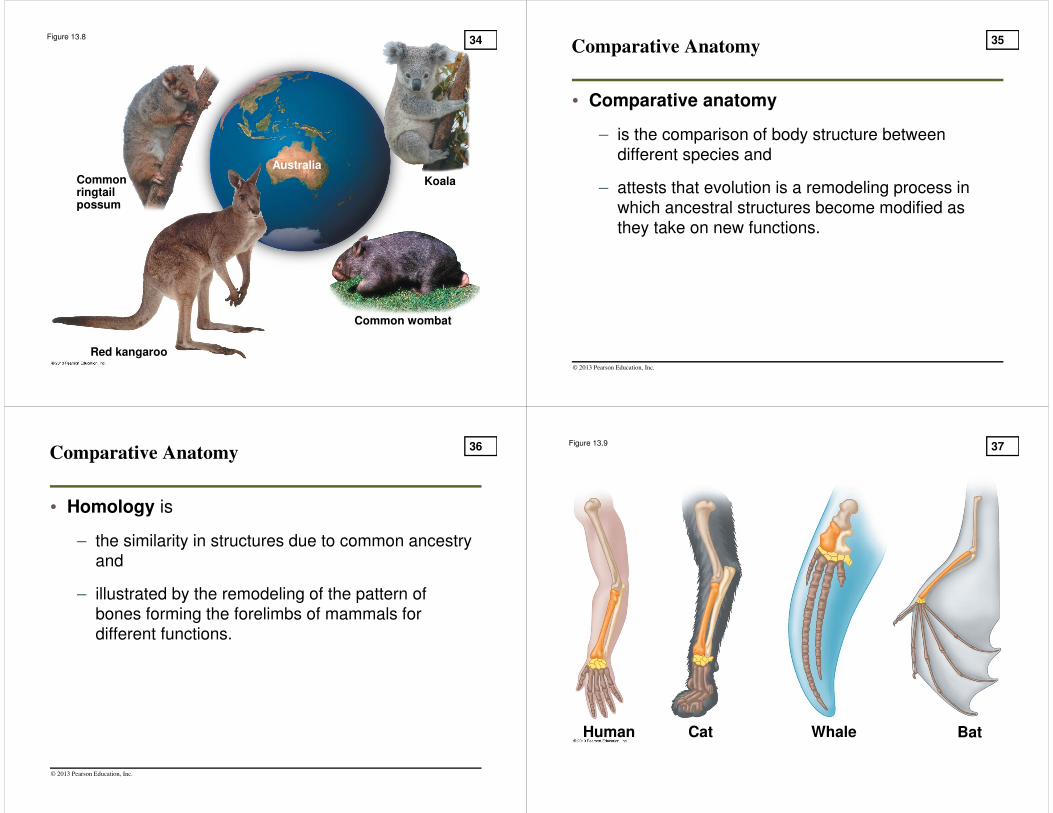
Figure 13.8
Commonringtailpossum
Red kangaroo
Common wombat
Australia
Koala
34 Comparative Anatomy
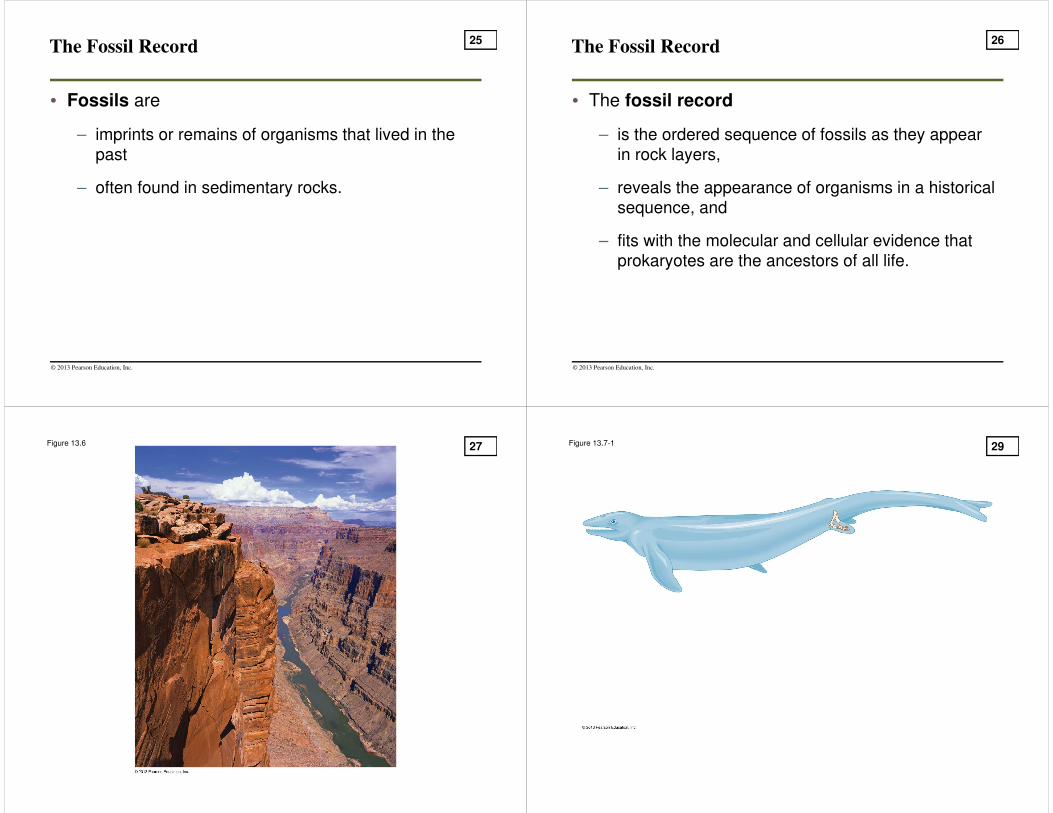
• Comparative anatomy
– is the comparison of body structure between different species and
– attests that evolution is a remodeling process in which ancestral structures become modified as they take on new functions.
© 2013 Pearson Education, Inc.
35
Comparative Anatomy
• Homology is
– the similarity in structures due to common ancestry and
– illustrated by the remodeling of the pattern of bones forming the forelimbs of mammals for different functions.
© 2013 Pearson Education, Inc.
36 Figure 13.9
Human Cat Whale Bat
37

• Vestigial structures
– are remnants of features that served important functions in an organism’s ancestors and
– now have only marginal, if any, importance.
Comparative Anatomy
© 2013 Pearson Education, Inc.
38 Comparative Embryology
• Early stages of development in different animal
species reveal additional homologous
relationships.
– For example, pharyngeal pouches appear on the side of the embryo’s throat, which
– develop into gill structures in fish and
– form parts of the ear and throat in humans.
– Comparative embryology of vertebrates supports evolutionary theory.
© 2013 Pearson Education, Inc.
39
Figure 13.10
Post-analtail
Chicken embryo
Pharyngealpouches
Human embryo
40 Molecular Biology
• The hereditary background of an organism is
documented in
– its DNA and
– the proteins encoded by the DNA.
• Evolutionary relationships among species can be
determined by comparing
– genes and
– proteins of different organisms.
© 2013 Pearson Education, Inc.
41
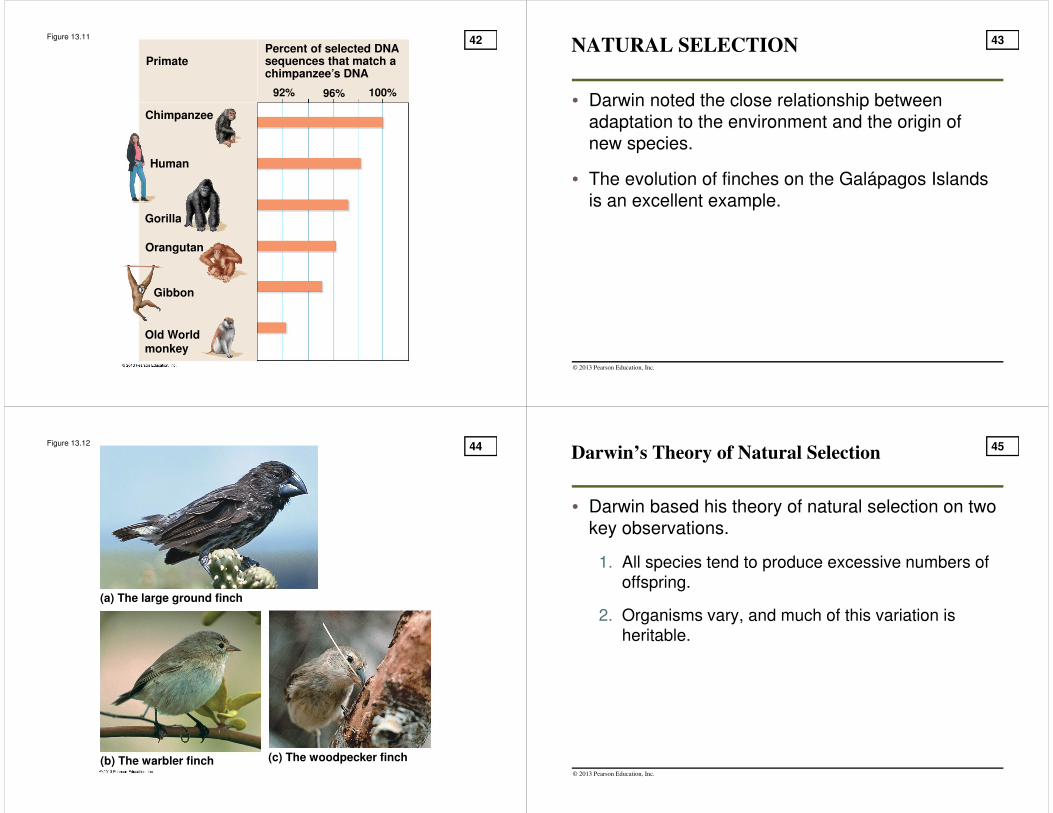
Figure 13.11
Percent of selected DNA sequences that match a chimpanzee’s DNA
Chimpanzee
100%96%92%
Human
Gibbon
Orangutan
Gorilla
Primate
Old Worldmonkey
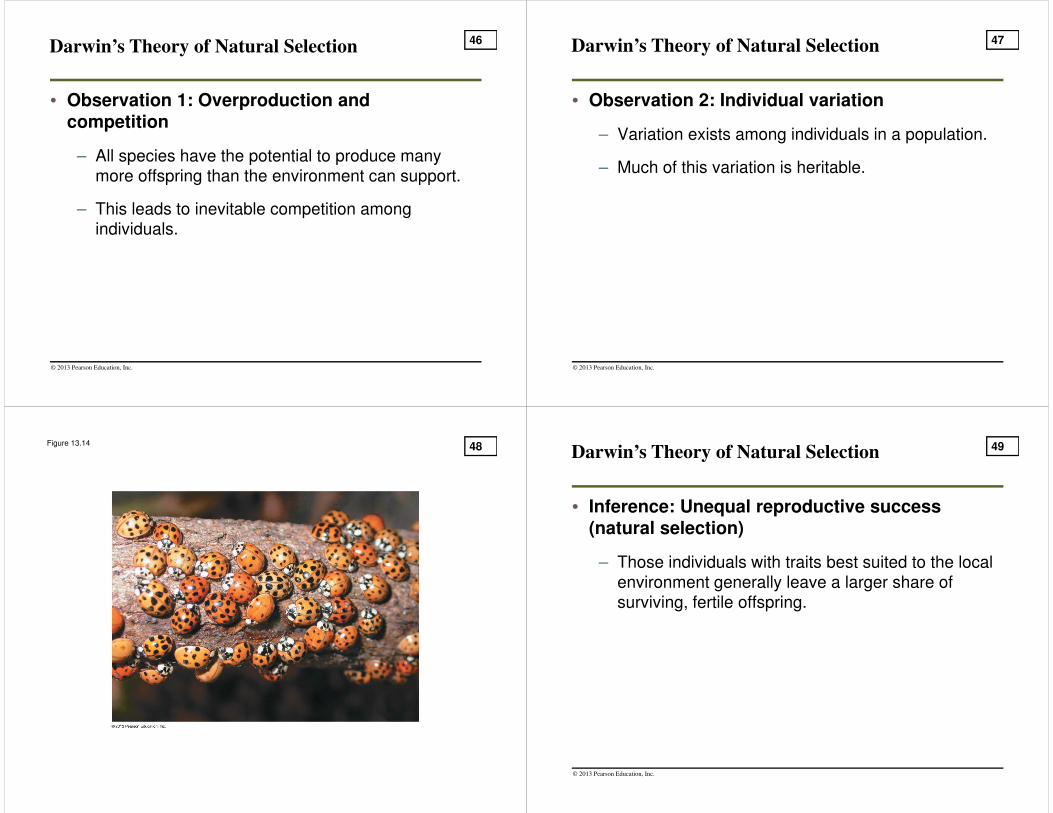
42 NATURAL SELECTION
• Darwin noted the close relationship between
adaptation to the environment and the origin of
new species.
• The evolution of finches on the Galápagos Islands
is an excellent example.
© 2013 Pearson Education, Inc.
43
Figure 13.12
(a) The large ground finch
(b) The warbler finch (c) The woodpecker finch
44 Darwin’s Theory of Natural Selection
• Darwin based his theory of natural selection on two
key observations.
1. All species tend to produce excessive numbers of offspring.
2. Organisms vary, and much of this variation is heritable.
© 2013 Pearson Education, Inc.
45
• Observation 1: Overproduction and competition
– All species have the potential to produce many more offspring than the environment can support.
– This leads to inevitable competition among individuals.
Darwin’s Theory of Natural Selection
© 2013 Pearson Education, Inc.
46
• Observation 2: Individual variation
– Variation exists among individuals in a population.
– Much of this variation is heritable.
Darwin’s Theory of Natural Selection
© 2013 Pearson Education, Inc.
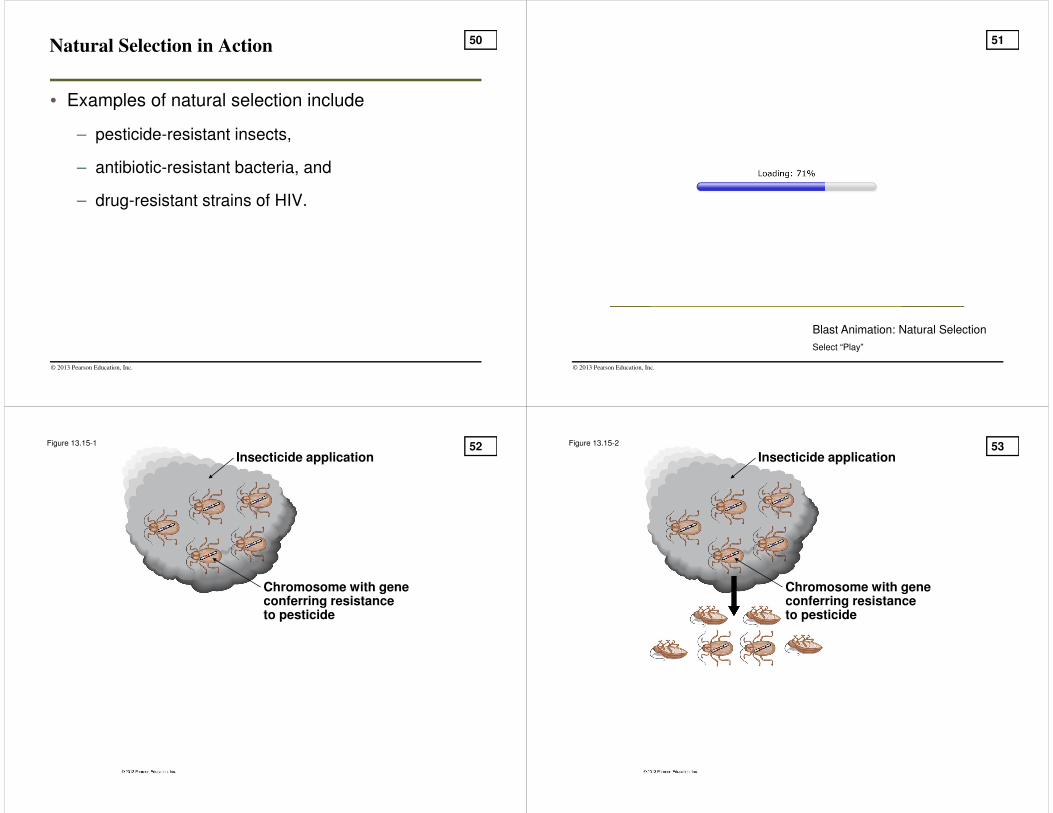
47
Figure 13.14 48
• Inference: Unequal reproductive success(natural selection)
– Those individuals with traits best suited to the local environment generally leave a larger share of surviving, fertile offspring.
Darwin’s Theory of Natural Selection
© 2013 Pearson Education, Inc.
49
Natural Selection in Action
• Examples of natural selection include
– pesticide-resistant insects,
– antibiotic-resistant bacteria, and
– drug-resistant strains of HIV.
© 2013 Pearson Education, Inc.
50
© 2013 Pearson Education, Inc.
Blast Animation: Natural Selection
Select “Play”
51
Figure 13.15-1
Chromosome with geneconferring resistanceto pesticide
Insecticide application52 Figure 13.15-2
Chromosome with geneconferring resistanceto pesticide
Insecticide application53
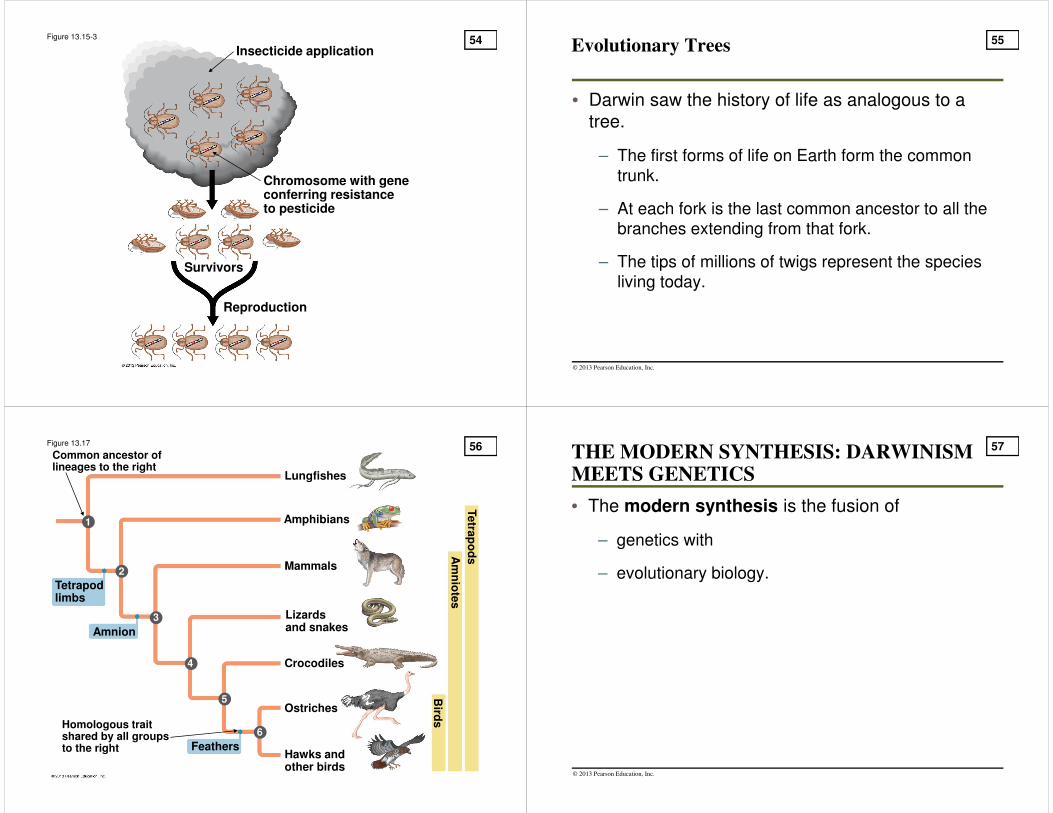
Figure 13.15-3
Chromosome with geneconferring resistanceto pesticide
Reproduction
Survivors
Insecticide application54 Evolutionary Trees
• Darwin saw the history of life as analogous to a
tree.
– The first forms of life on Earth form the common trunk.
– At each fork is the last common ancestor to all the branches extending from that fork.
– The tips of millions of twigs represent the species living today.
© 2013 Pearson Education, Inc.
55
Figure 13.17
Tetrapodlimbs
Amnion
Feathers
Lungfishes
Mammals
Amphibians
Lizardsand snakes
Crocodiles
Hawks and other birds
Ostriches
Am
nio
tes
Tetra
po
ds
Bird
s
Common ancestor oflineages to the right
Homologous traitshared by all groupsto the right
2
1
3
4
6
5
56 THE MODERN SYNTHESIS: DARWINISM MEETS GENETICS
• The modern synthesis is the fusion of
– genetics with
– evolutionary biology.
© 2013 Pearson Education, Inc.
57
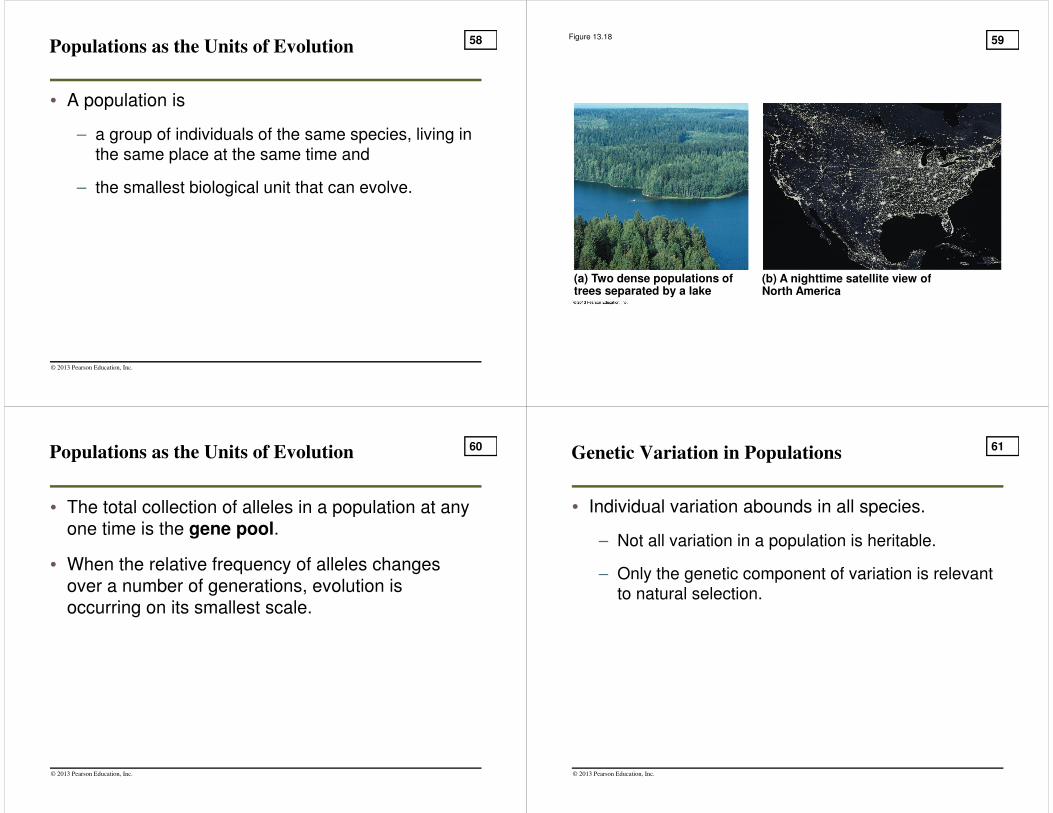
Populations as the Units of Evolution
• A population is
– a group of individuals of the same species, living in the same place at the same time and
– the smallest biological unit that can evolve.
© 2013 Pearson Education, Inc.
58 Figure 13.18
(a) Two dense populations oftrees separated by a lake
(b) A nighttime satellite view of North America
59
• The total collection of alleles in a population at any
one time is the gene pool.
• When the relative frequency of alleles changes
over a number of generations, evolution is
occurring on its smallest scale.
Populations as the Units of Evolution
© 2013 Pearson Education, Inc.
60 Genetic Variation in Populations
• Individual variation abounds in all species.
– Not all variation in a population is heritable.
– Only the genetic component of variation is relevant to natural selection.
© 2013 Pearson Education, Inc.
61
• Variable traits in a population may be
– polygenic, resulting from the combined effects of several genes, or
– determined by a single gene.
• Polygenic traits tend to produce phenotypes that
vary more or less continuously.
• Single-gene traits tend to produce only a few
distinct phenotypes.
Genetic Variation in Populations
© 2013 Pearson Education, Inc.
62 Sources of Genetic Variation
• Genetic variation results from processes that both
involve randomness:
1. mutations, changes in the nucleotide sequence of DNA, and
2. sexual recombination, the shuffling of alleles during meiosis.
© 2013 Pearson Education, Inc.
63
Sources of Genetic Variation
• For any given gene locus, mutation alone has little
effect on a large population in a single generation.
• Organisms with very short generation spans, such
as bacteria, can evolve rapidly with mutation as the
only source of genetic variation.
© 2013 Pearson Education, Inc.
64 Analyzing Gene Pools
• A gene pool
– consists of all the alleles in a population at any one time and
– is a reservoir from which the next generation draws its alleles.
• Alleles in a gene pool occur in certain frequencies.
© 2013 Pearson Education, Inc.
65

• Alleles can be symbolized by
– p for the relative frequency of the dominant allele in the population,
– q for the frequency of the recessive allele in the population, and
– p + q = 1.
• Note that if we know the frequency of either allele
in the gene pool, we can subtract it from 1 to
calculate the frequency of the other allele.
Analyzing Gene Pools
© 2013 Pearson Education, Inc.
66 Figure 13.20 70
Figure 13.21
Allele frequencies
Genotype frequencies
Sperm
Eggs
p ==== 0.8(R)
q ==== 0.2(r)
p ==== 0.8
R
q ==== 0.2
r
RR
p ==== 0.8
R
q ==== 0.2
r
p2==== 0.64
rR pq ==== 0.16 q2
==== 0.04 rr
pq ==== 0.16 Rr
(RR)
p2==== 0.64 q2
==== 0.04
(rr)2pq ==== 0.32
(Rr)
71 MECHANISMS OF EVOLUTION
• The main causes of evolutionary change are
– genetic drift,
– gene flow, and
– natural selection.
– (sexual selection is a form of natural selection)
• Natural selection is the most important, because it
is the only process that promotes adaptation.
© 2013 Pearson Education, Inc.
72
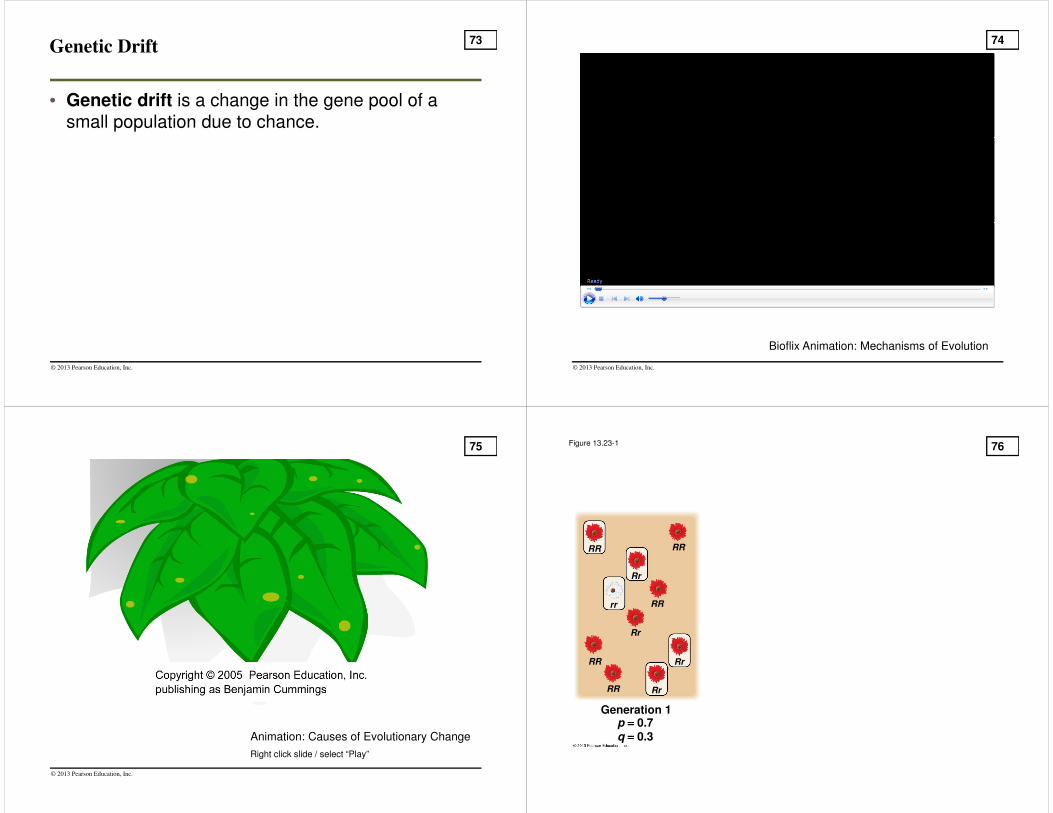
Genetic Drift
• Genetic drift is a change in the gene pool of a
small population due to chance.
© 2013 Pearson Education, Inc.
73
© 2013 Pearson Education, Inc.
Bioflix Animation: Mechanisms of Evolution
74
© 2013 Pearson Education, Inc.
Animation: Causes of Evolutionary Change
Right click slide / select “Play”
75 Figure 13.23-1
RR
rr
Rr
RR
RR
RR Rr
RR
Rr
Rr
Generation 1p ==== 0.7q ==== 0.3
76
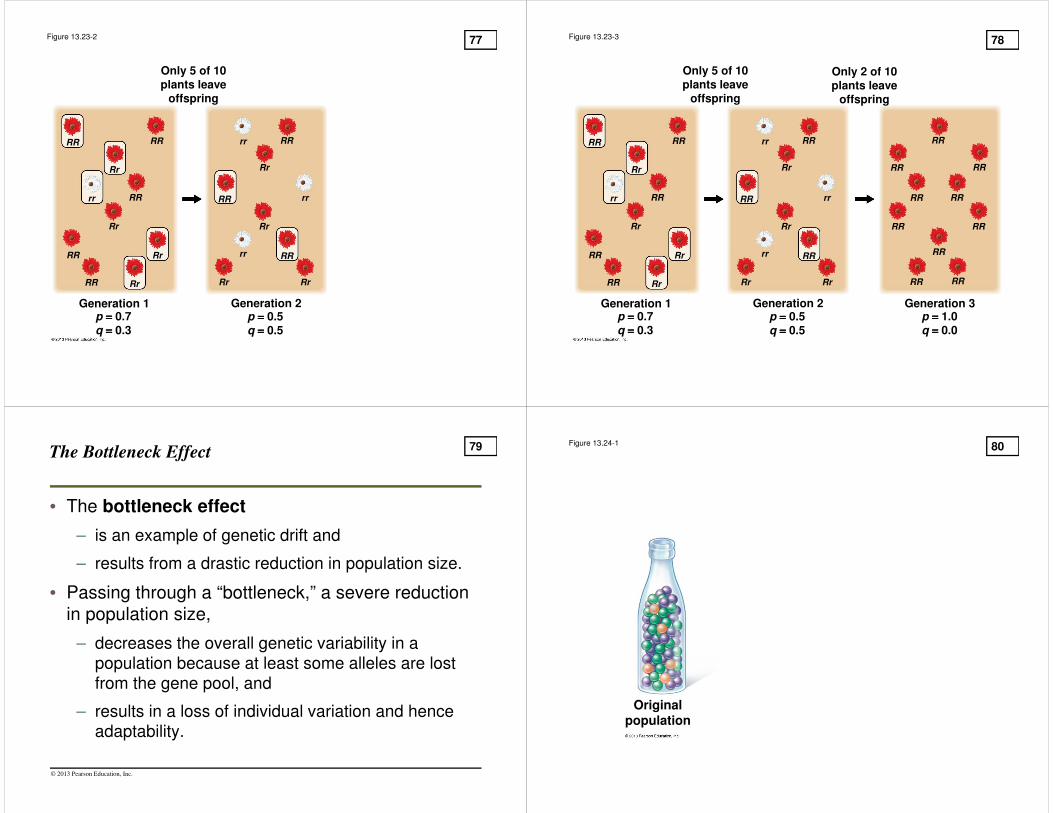
Figure 13.23-2
Only 5 of 10plants leave
offspring
RR
rr
Rr
RR
RR
RR
RR Rr
RR
Rr
Rr
rr RR
Rr
rr
RR
Rr
Rr Rr
rr
Generation 1p ==== 0.7q ==== 0.3
Generation 2p ==== 0.5q ==== 0.5
77 Figure 13.23-3
Only 5 of 10plants leave
offspring
RR
rr
Rr
RR
RR
RR
RR Rr
RR
Rr
Rr
Only 2 of 10plants leave
offspring
RR
rr RR
Rr
rr
RR
Rr
Rr Rr
rr
RR
RR
RR
RR
RR
RR
RR
RR RR
Generation 1p ==== 0.7q ==== 0.3
Generation 2p ==== 0.5q ==== 0.5
Generation 3p ==== 1.0q ==== 0.0
78
The Bottleneck Effect
• The bottleneck effect
– is an example of genetic drift and
– results from a drastic reduction in population size.
• Passing through a “bottleneck,” a severe reduction
in population size,
– decreases the overall genetic variability in a population because at least some alleles are lost from the gene pool, and
– results in a loss of individual variation and hence adaptability.
© 2013 Pearson Education, Inc.
79 Figure 13.24-1
Originalpopulation
80
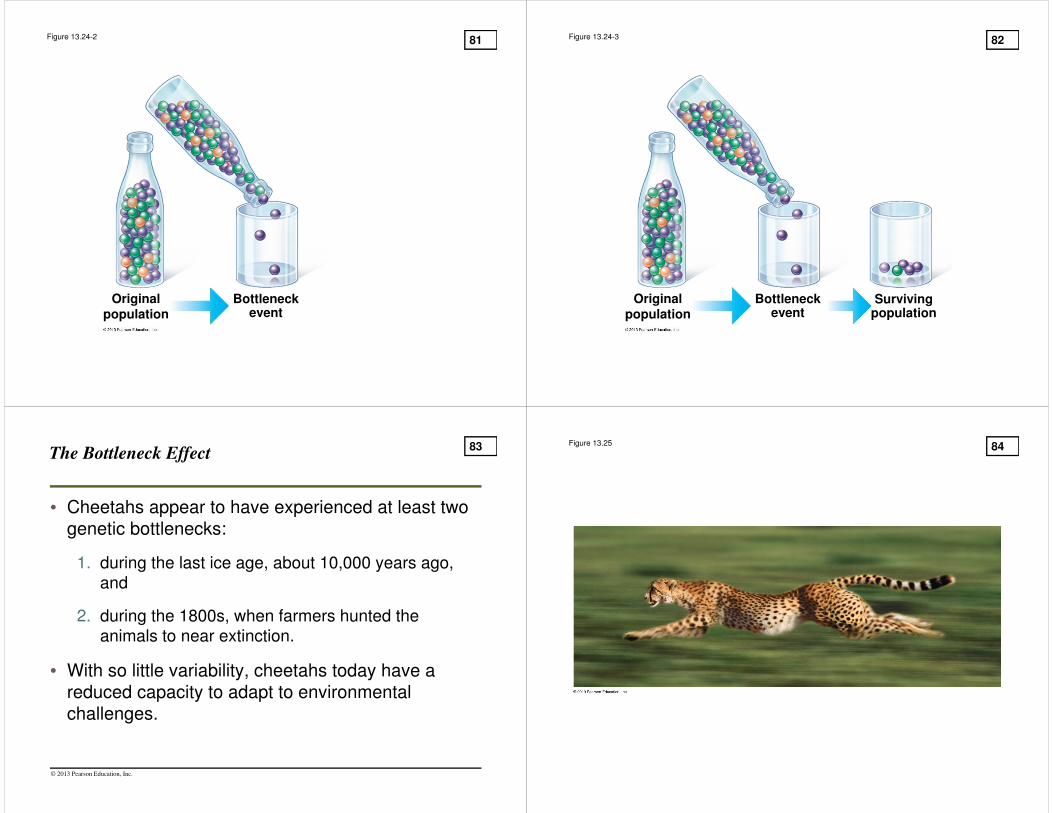
Figure 13.24-2
Originalpopulation
Bottleneckevent
81 Figure 13.24-3
Originalpopulation
Bottleneckevent
Survivingpopulation
82
• Cheetahs appear to have experienced at least two
genetic bottlenecks:
1. during the last ice age, about 10,000 years ago, and
2. during the 1800s, when farmers hunted the animals to near extinction.
• With so little variability, cheetahs today have a
reduced capacity to adapt to environmental
challenges.
The Bottleneck Effect
© 2013 Pearson Education, Inc.
83 Figure 13.25 84
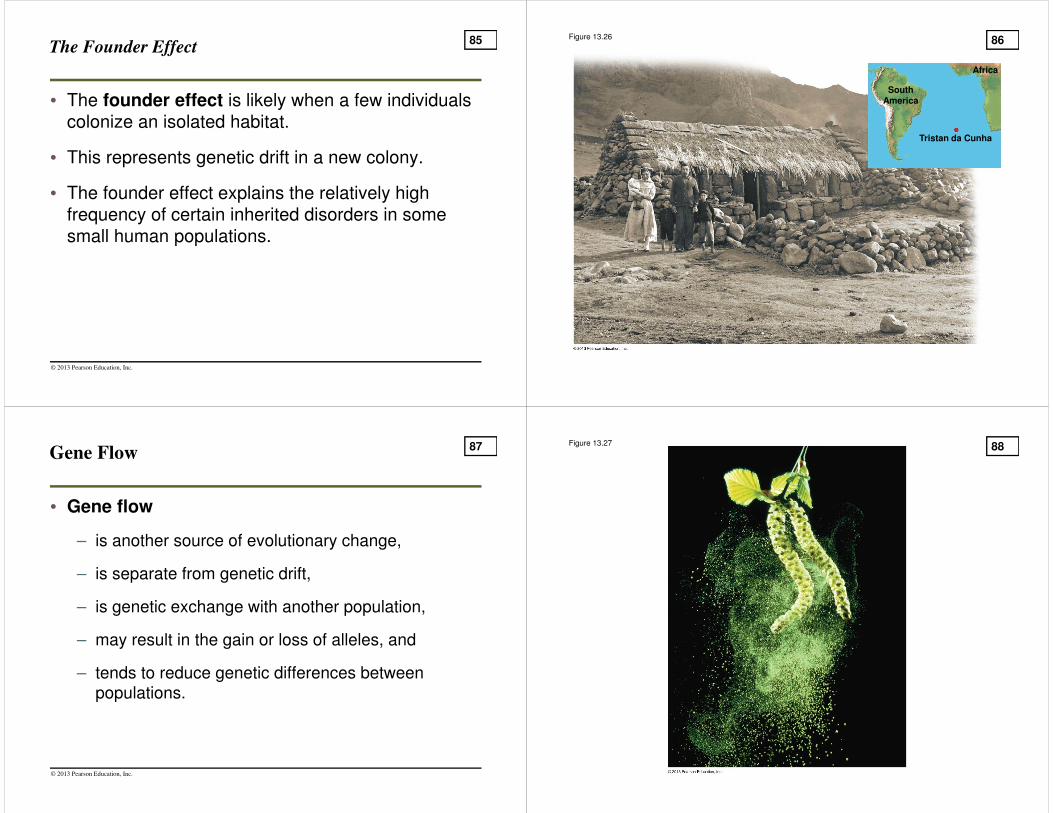
The Founder Effect
• The founder effect is likely when a few individuals
colonize an isolated habitat.
• This represents genetic drift in a new colony.
• The founder effect explains the relatively high
frequency of certain inherited disorders in some
small human populations.
© 2013 Pearson Education, Inc.
85 Figure 13.26
SouthAmerica
Tristan da Cunha
Africa
86
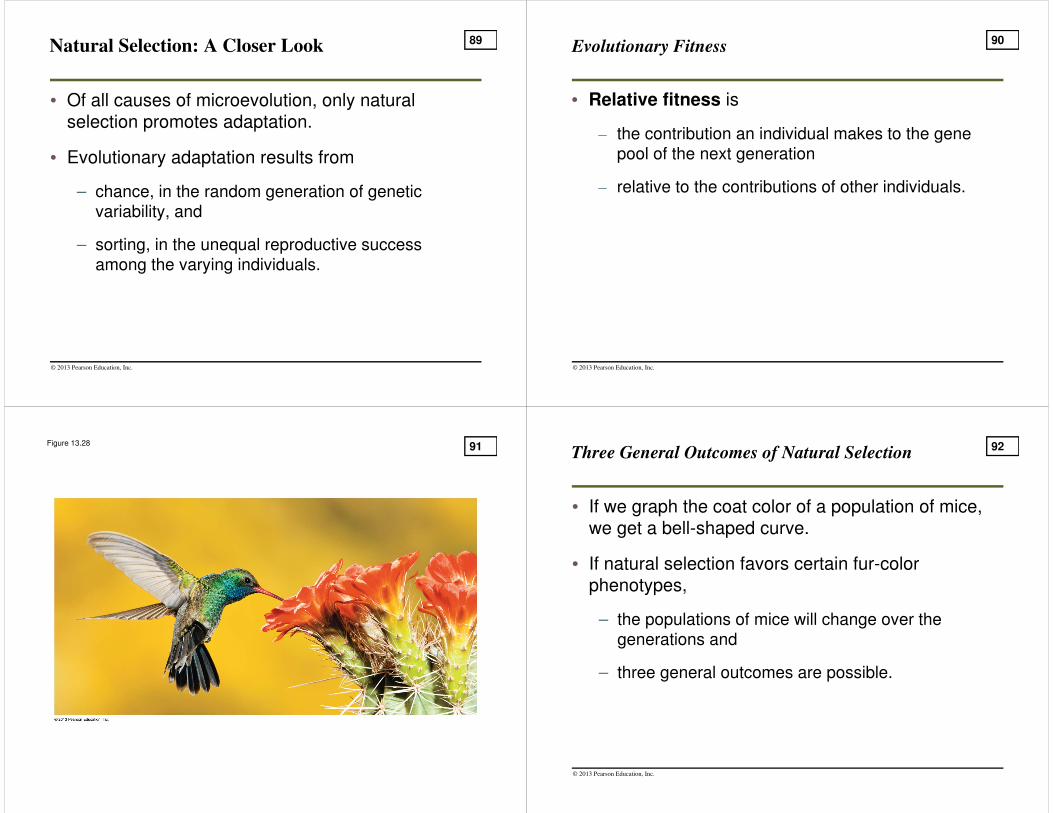
Gene Flow
• Gene flow
– is another source of evolutionary change,
– is separate from genetic drift,
– is genetic exchange with another population,
– may result in the gain or loss of alleles, and
– tends to reduce genetic differences between populations.
© 2013 Pearson Education, Inc.
87 Figure 13.27 88
Natural Selection: A Closer Look
• Of all causes of microevolution, only natural
selection promotes adaptation.
• Evolutionary adaptation results from
– chance, in the random generation of genetic variability, and
– sorting, in the unequal reproductive success among the varying individuals.
© 2013 Pearson Education, Inc.
89 Evolutionary Fitness
• Relative fitness is
– the contribution an individual makes to the gene pool of the next generation
– relative to the contributions of other individuals.
© 2013 Pearson Education, Inc.
90
Figure 13.28 91 Three General Outcomes of Natural Selection
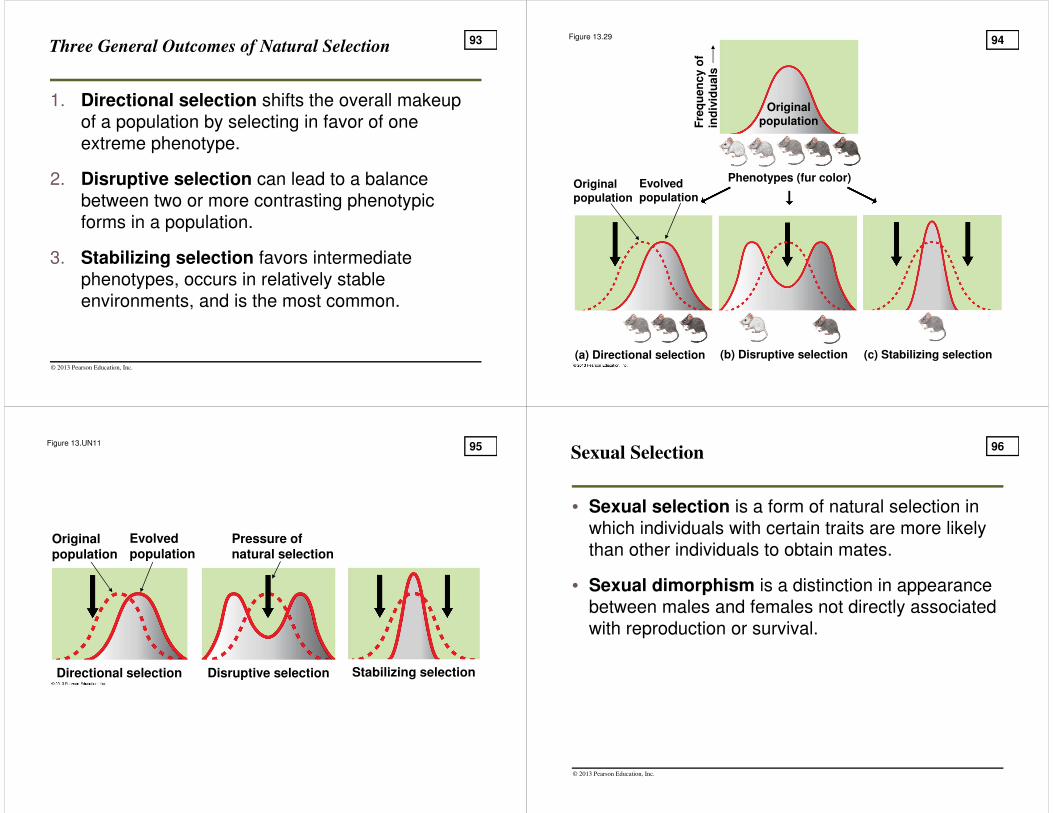
• If we graph the coat color of a population of mice,
we get a bell-shaped curve.
• If natural selection favors certain fur-color
phenotypes,
– the populations of mice will change over the generations and
– three general outcomes are possible.
© 2013 Pearson Education, Inc.
92
1. Directional selection shifts the overall makeup
of a population by selecting in favor of one
extreme phenotype.
2. Disruptive selection can lead to a balance
between two or more contrasting phenotypic
forms in a population.
3. Stabilizing selection favors intermediate
phenotypes, occurs in relatively stable
environments, and is the most common.
Three General Outcomes of Natural Selection
© 2013 Pearson Education, Inc.
93 Figure 13.29
(a) Directional selection (b) Disruptive selection (c) Stabilizing selection
Originalpopulation
Evolvedpopulation
Originalpopulation
Phenotypes (fur color)
Fre
qu
en
cy o
fin
div
idu
als
94
Figure 13.UN11
Originalpopulation
Evolvedpopulation
Pressure ofnatural selection
Directional selection Disruptive selection Stabilizing selection
95 Sexual Selection
• Sexual selection is a form of natural selection in
which individuals with certain traits are more likely
than other individuals to obtain mates.
• Sexual dimorphism is a distinction in appearance
between males and females not directly associated
with reproduction or survival.
© 2013 Pearson Education, Inc.
96
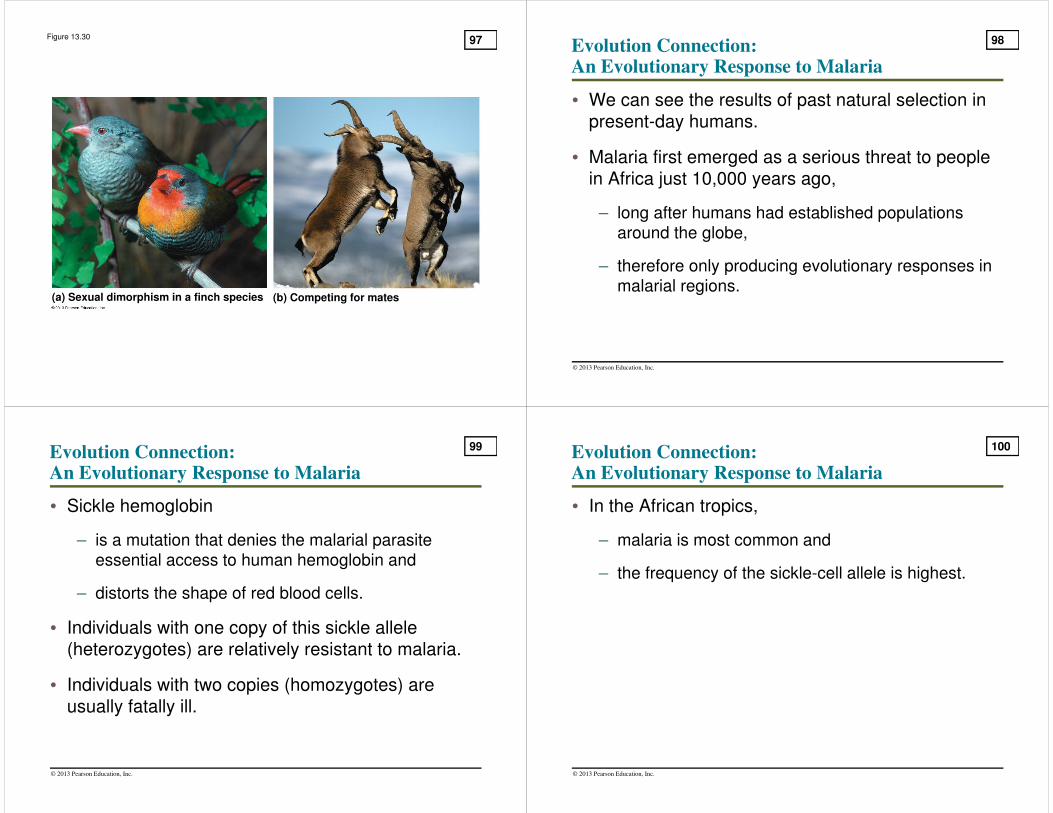
Figure 13.30
(a) Sexual dimorphism in a finch species (b) Competing for mates
97 Evolution Connection: An Evolutionary Response to Malaria
• We can see the results of past natural selection in
present-day humans.
• Malaria first emerged as a serious threat to people
in Africa just 10,000 years ago,
– long after humans had established populations around the globe,
– therefore only producing evolutionary responses in malarial regions.
© 2013 Pearson Education, Inc.
98
• Sickle hemoglobin
– is a mutation that denies the malarial parasite essential access to human hemoglobin and
– distorts the shape of red blood cells.
• Individuals with one copy of this sickle allele
(heterozygotes) are relatively resistant to malaria.
• Individuals with two copies (homozygotes) are
usually fatally ill.
Evolution Connection: An Evolutionary Response to Malaria
© 2013 Pearson Education, Inc.
99
• In the African tropics,
– malaria is most common and
– the frequency of the sickle-cell allele is highest.
Evolution Connection: An Evolutionary Response to Malaria
© 2013 Pearson Education, Inc.
100
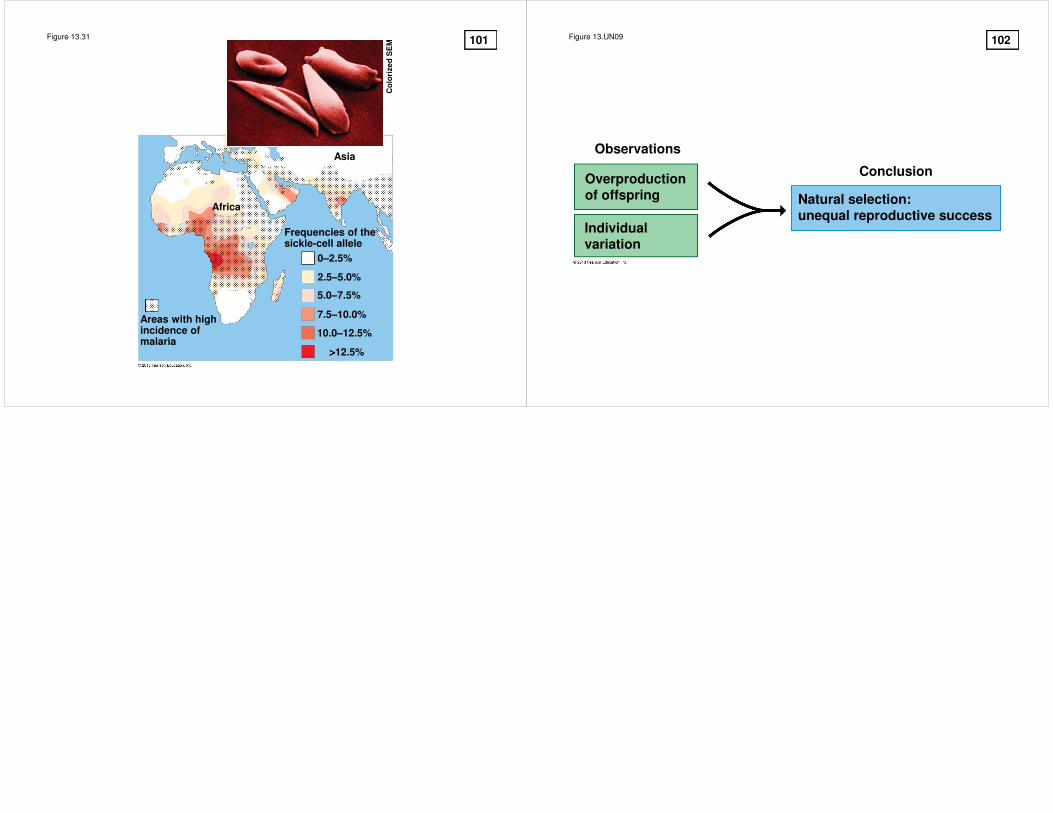
Figure 13.31
Areas with highincidence ofmalaria
Frequencies of thesickle-cell allele
0–2.5%
10.0–12.5%
2.5–5.0%
5.0–7.5%
7.5–10.0%
>>>>12.5%
Co
lori
ze
d S
EM
Africa
Asia
101 Figure 13.UN09
Individualvariation
Overproductionof offspring
Observations
Conclusion
Natural selection:unequal reproductive success
102


![01 Lecture Presentation PC v2 [Read-Only]profwelday.weebly.com › uploads › 2 › 3 › 0 › 0 › 23005790 › lec_01-06...Campbell Essential Biology, Fifth Edition, and Campbell](https://img.pdfslide.us/doc/110x75/5f04d94c7e708231d41003a1/01-lecture-presentation-pc-v2-read-only-a-uploads-a-2-a-3-a-0-a-0-a.jpg)