Embed Size (px)
Citation preview
Chapter 12: The Changing Face of the Land
Li-Hung Lin
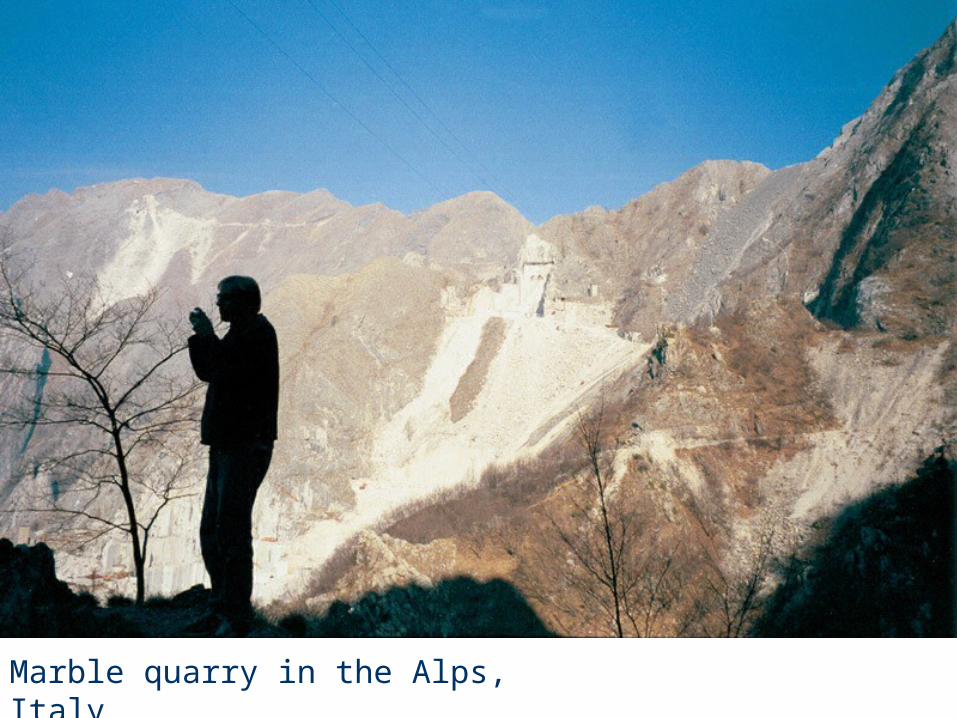
Marble quarry in the Alps, Italy
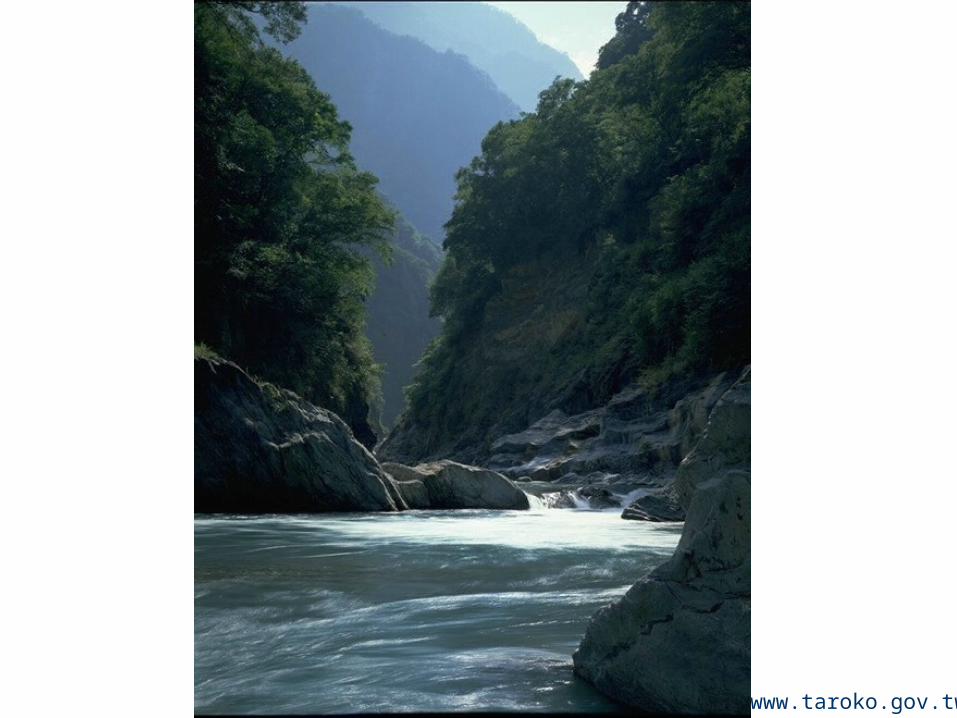
www.taroko.gov.tw
Introduction: Earth’s Varied Landscapes
Uplift:
Processes that raise topography
Byproduct of plate tectonics and thermal convection
Introduction:Earth’s Varied landscapes
Exhumation and denudation are closely related terms that imply different perspectives on erosional processes
Exhumation Gradual exposure of subsurface rocks by stripping
off (eroding) the surface layers Denudation
The transport of eroded material to another location Geomorphology:
The study of Earth’s landforms.
Factors changing the landscape
Interplay between the forces that raise the lithosphere (tectonic and isostatic uplift, volcanism) and the forces that level it (gravity, physical and chemical weathering processes)
Is steady state reached? What is the topographic consequence when
uplift dominates over denudation or vise versa?

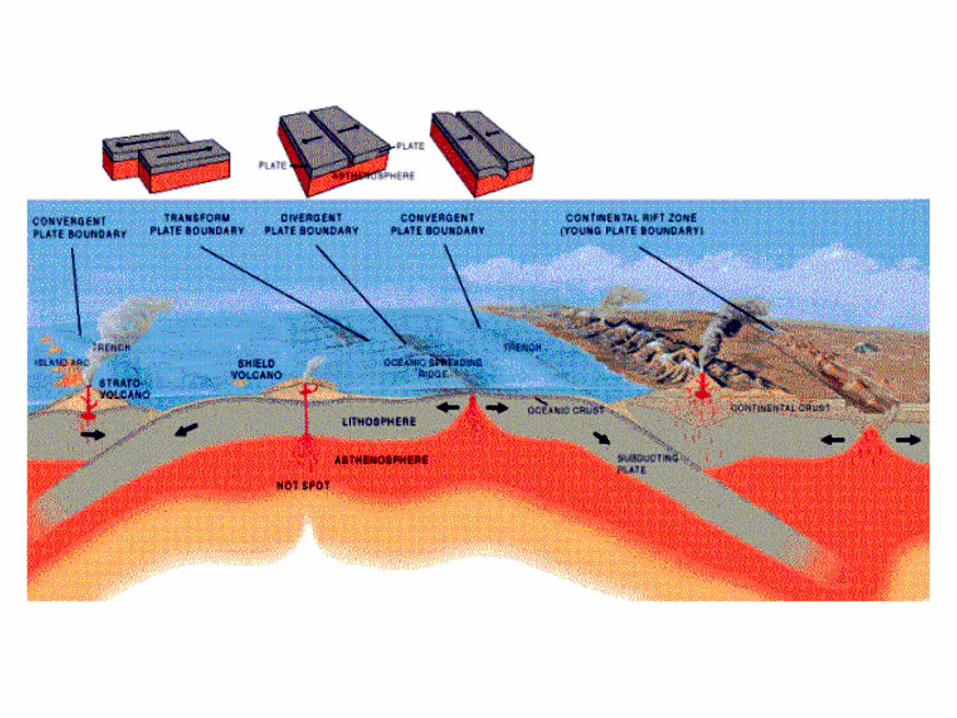
Factors Controlling Uplift
Uplift occurs as a byproduct of mantle convection and plate tectonics
We can identify several types of uplift: Collisional uplift Isostatic uplift Extensional uplift
Collisional Uplift
The most natural uplifted landscape would be a long, narrow orogen that forms along a convergent plate boundary
Results from compression of relatively light crustal rock atop a continental plate
When an oceanic plate subducts beneath a continental plate, an orogen can form from a rising wedge of marine sediments scraped from the downgoing plate
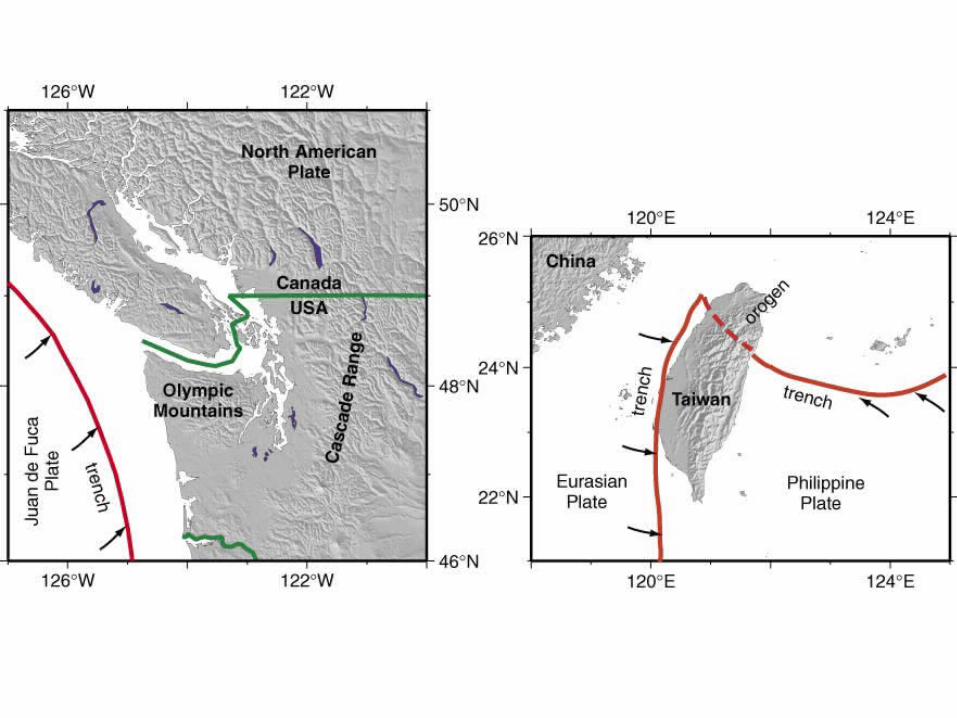
The island of Taiwan and the Olympic mountains of Washington State are examples of such orogens
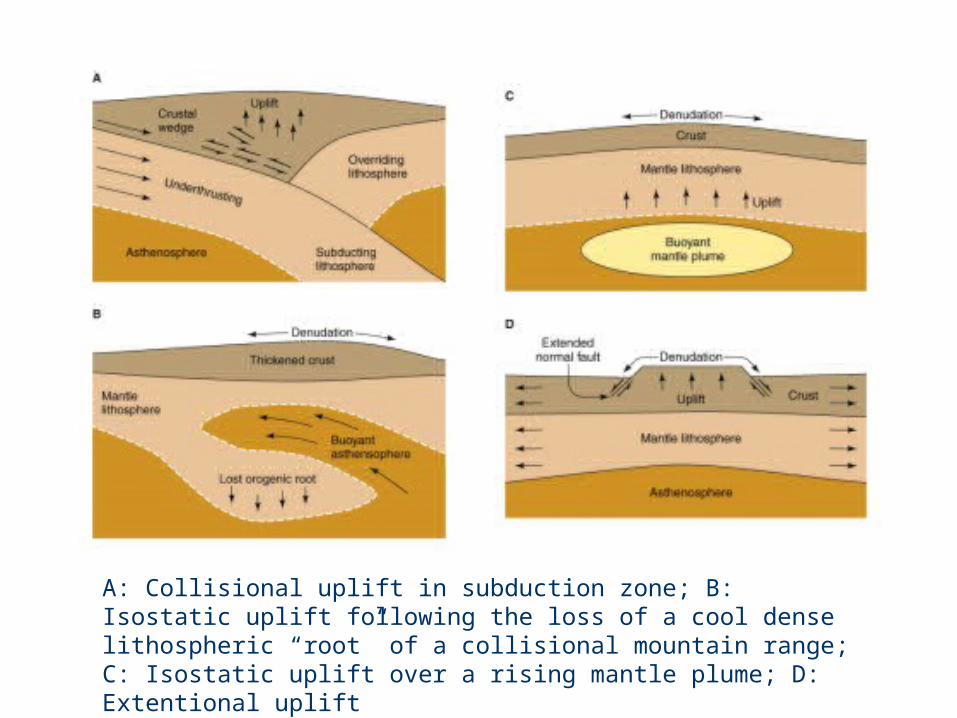
A: Collisional uplift in subduction zone; B: Isostatic uplift following the loss of a cool dense lithospheric “root” of a collisional mountain range; C: Isostatic uplift over a rising mantle plume; D: Extentional uplift
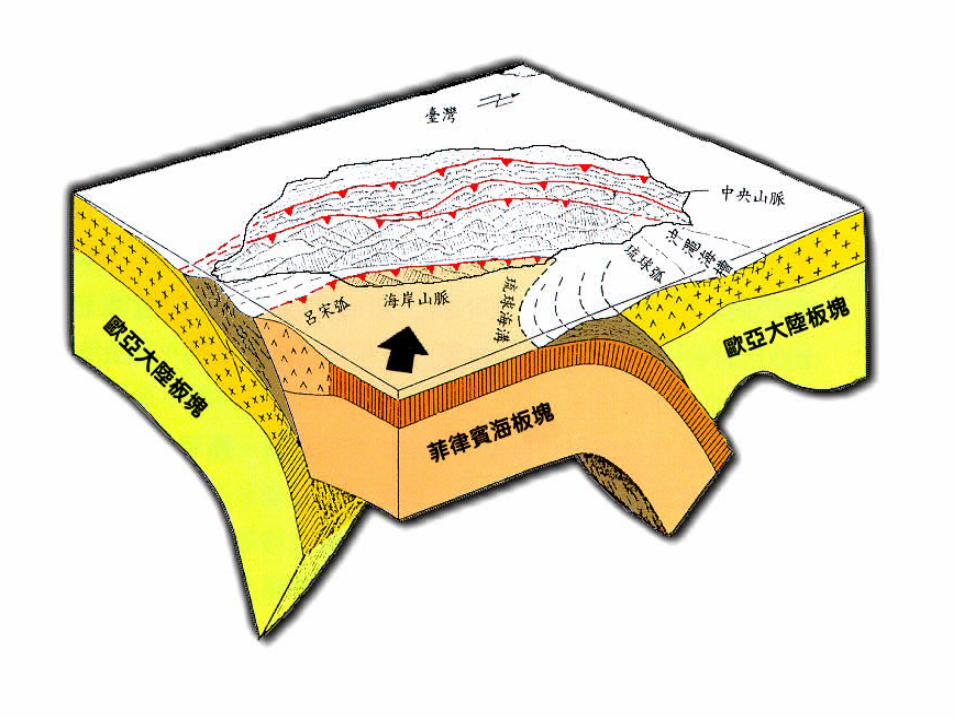
Taiwan’s cross section
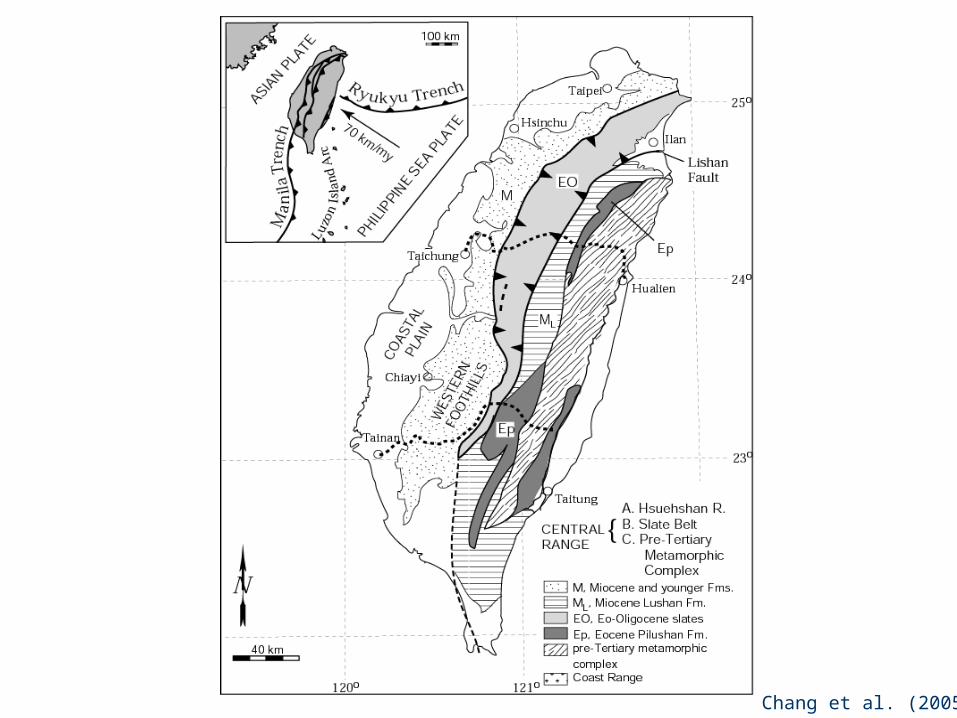
Chang et al. (2005)
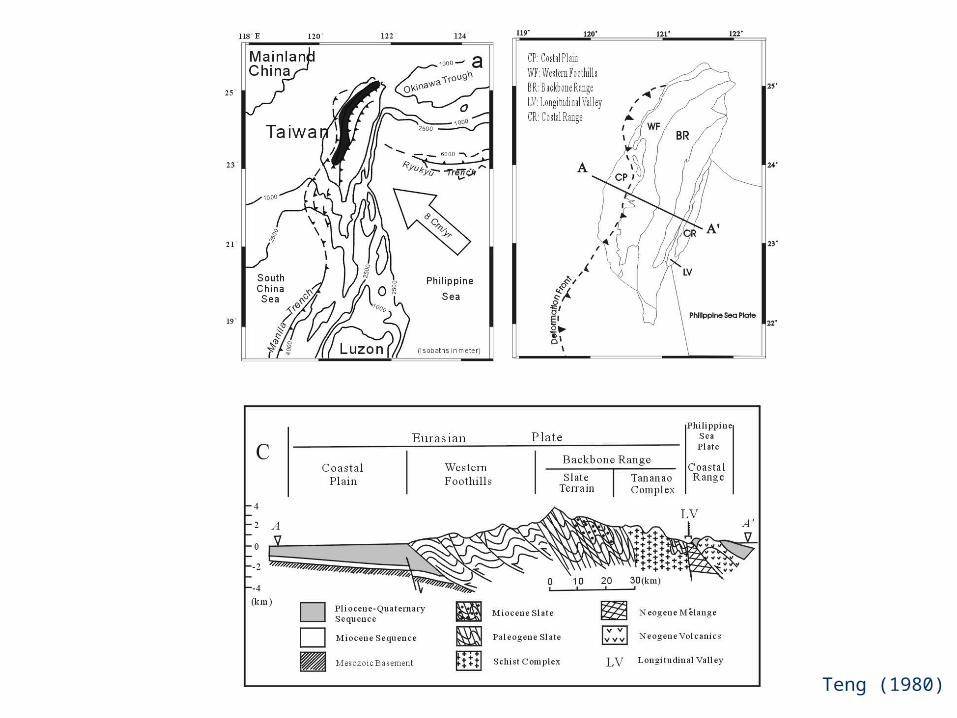
Teng (1980)

Isostatic Uplift
When continents collide, their plate boundaries tend to crumple somewhat, so the lithosphere locally thickens
The dense mantle lithosphere of a thickened plate boundary can peel off and be replaced by hot buoyant asthenosphere
Isostatic uplift occurs locally wherever a hot, buoyant mantle plume rises to the lithosphere, as beneath the Hawaiian Island or Yellowstone National Park
Uplift will occur to compensate for eroded materials
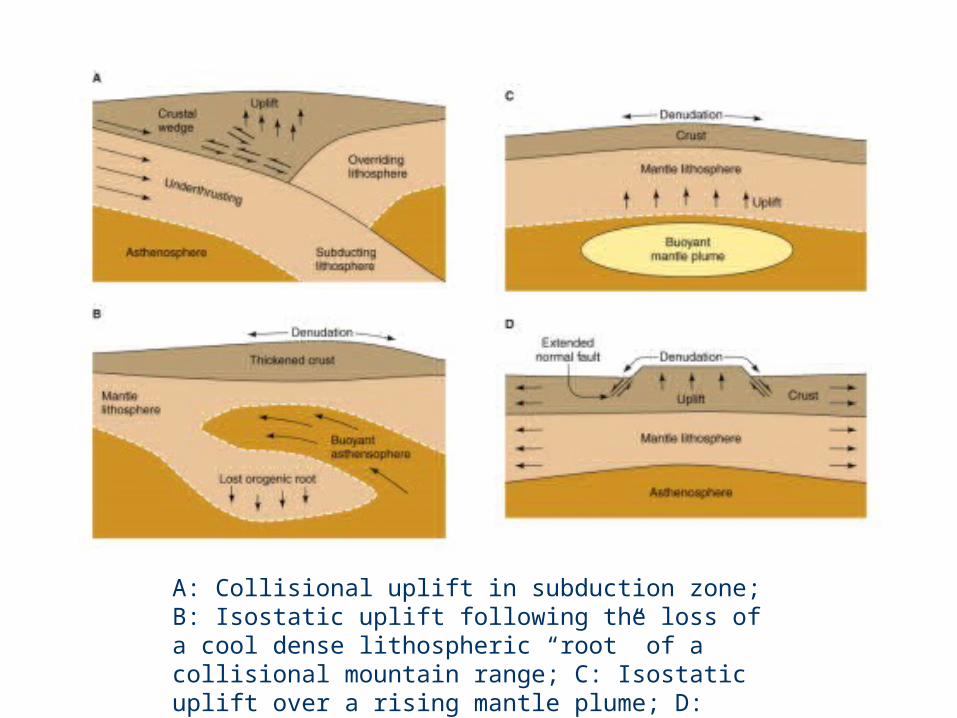
A: Collisional uplift in subduction zone; B: Isostatic uplift following the loss of a cool dense lithospheric “root” of a collisional mountain range; C: Isostatic uplift over a rising mantle plume; D: Extentional uplift
Isostatic Uplift
Many geologists argue that the dense mantle
lithosphere of a thickened plate boundary can peel off
and be replaced by hot buoyant asthenosphere,
followed with isostatic uplift
Isostatic uplift occurs wherever a hot, buoyant mantle
plume rises to the base of the lithosphere, as beneath
the Hawaiian Island or Yellowstone National Park.
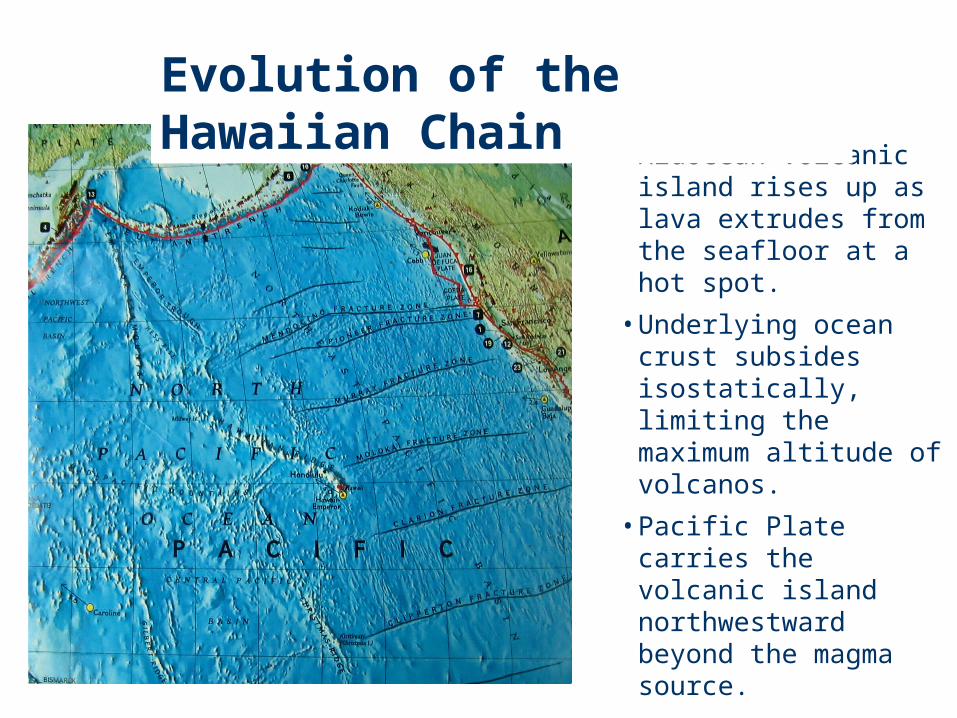
• Midocean volcanic island rises up as lava extrudes from the seafloor at a hot spot.
• Underlying ocean crust subsides isostatically, limiting the maximum altitude of volcanos.
• Pacific Plate carries the volcanic island northwestward beyond the magma source.
Evolution of the Hawaiian Chain
Extensional Uplift
Extensional uplift occurs in regions where the ascent of hot
buoyant mantle at the base of continental lithosphere induces
broad uplift and stretching of crust
Isostatic uplift can induce short-scale topographic relief by
extension and normal faulting
Bathymetric scarps parallel the midocean ridges
The Grand Teton Range of northwest Wyoming
The Basin and Range Province (Nevada, Utah, Arizona)
Horst-and-graben structures

A: Collisional uplift in subduction zone; B: Isostatic uplift following the loss of a cool dense lithospheric “root” of a collisional mountain range; C: Isostatic uplift over a rising mantle plume; D: Extentional uplift
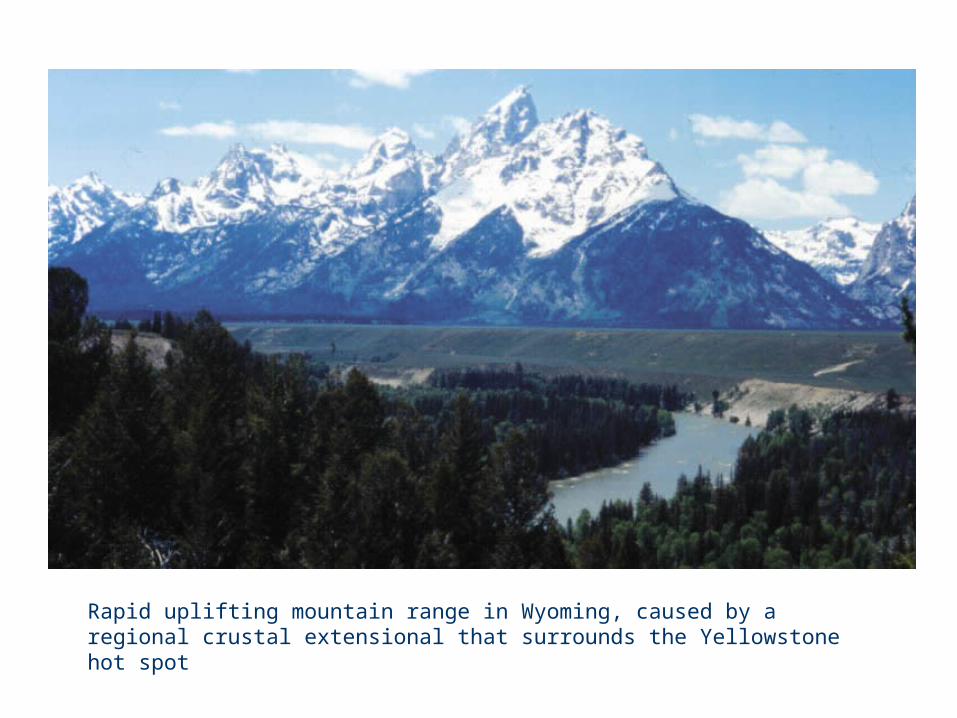
Rapid uplifting mountain range in Wyoming, caused by a regional crustal extensional that surrounds the Yellowstone hot spot
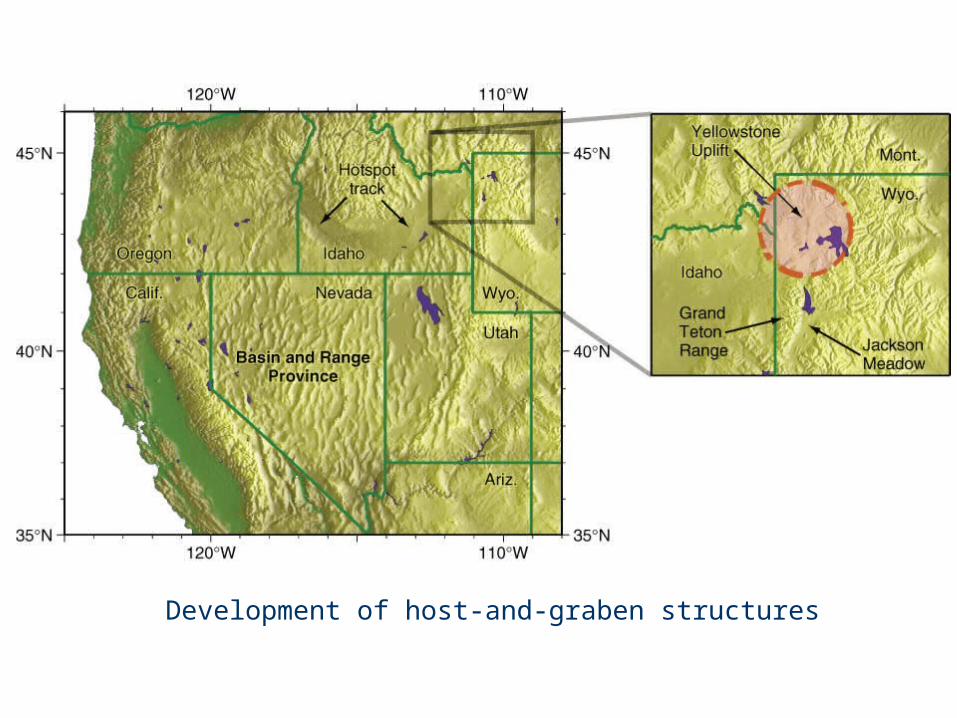
Development of host-and-graben structures
www.whoi.edu
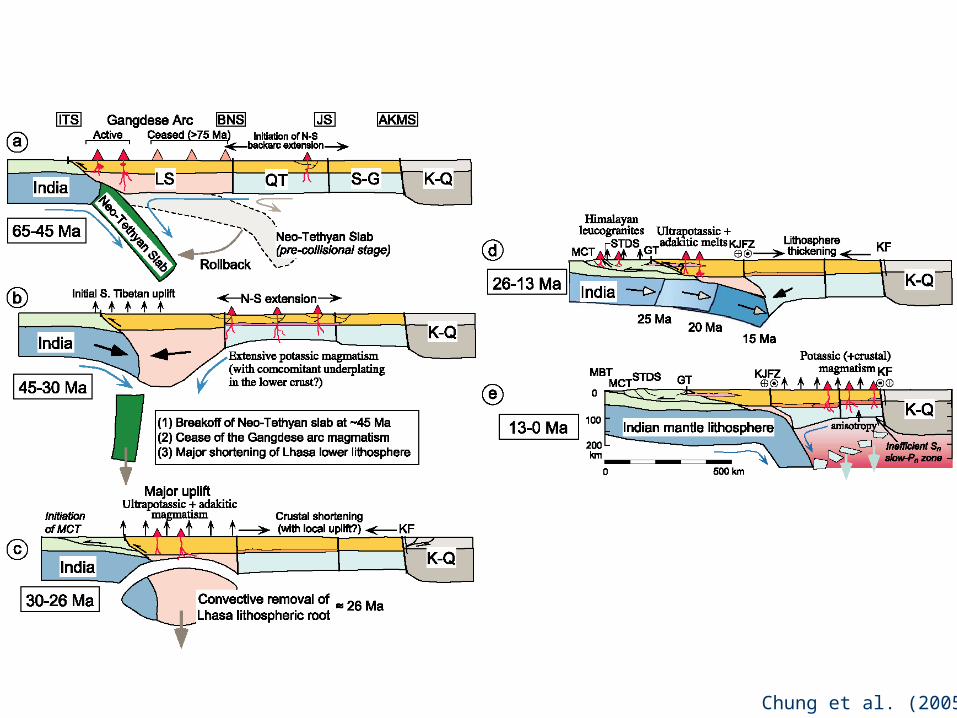
Chung et al. (2005)
www.whoi.edu

Factors Controlling Denudation
Climate Lithology Relief
Factors Controlling Denudation: Climate
Streams may be the primary agent that moves and deposits sediment in humid climates
Wind assumes the dominant role in arid regions Glaciers are dominant in high latitudes and high
altitudes regions Climate controls vegetation cover Modern landscapes may reflect former
conditions, such as glaciation, rather than current processes
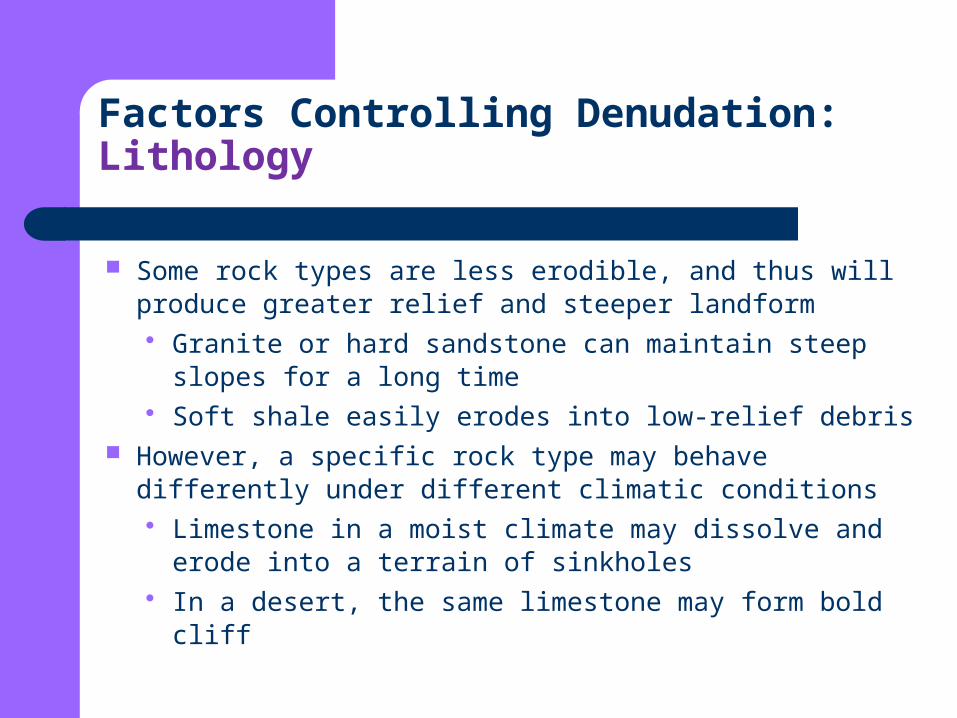
Some rock types are less erodible, and thus will produce greater relief and steeper landform Granite or hard sandstone can maintain steep slopes
for a long time Soft shale easily erodes into low-relief debris
However, a specific rock type may behave differently under different climatic conditions Limestone in a moist climate may dissolve and erode
into a terrain of sinkholes In a desert, the same limestone may form bold cliff
Factors Controlling Denudation: Lithology
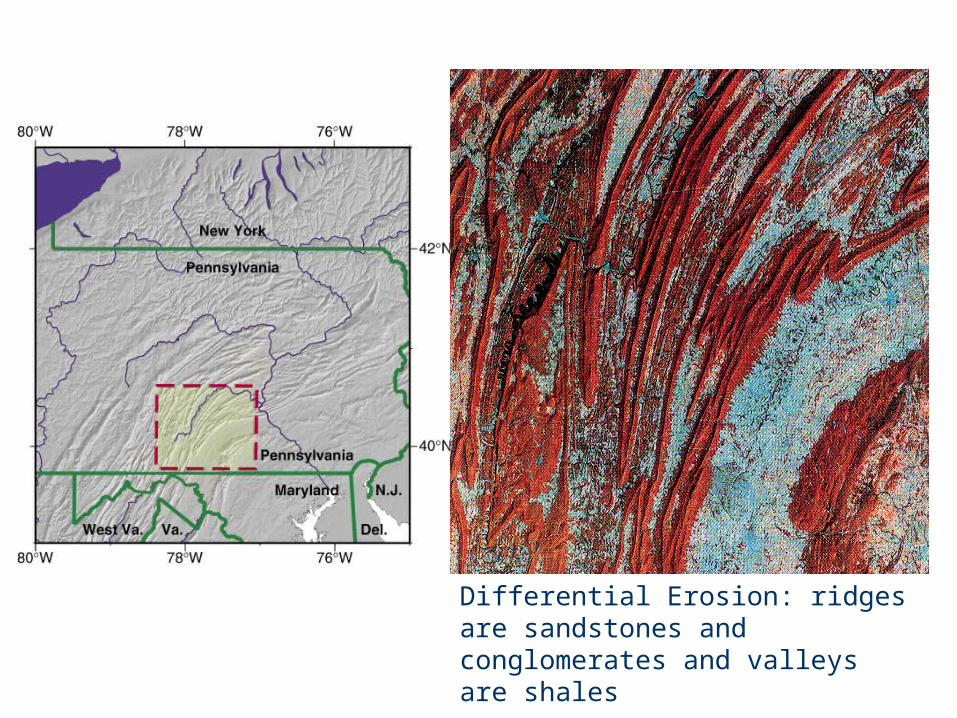
Differential Erosion: ridges are sandstones and conglomerates and valleys are shales
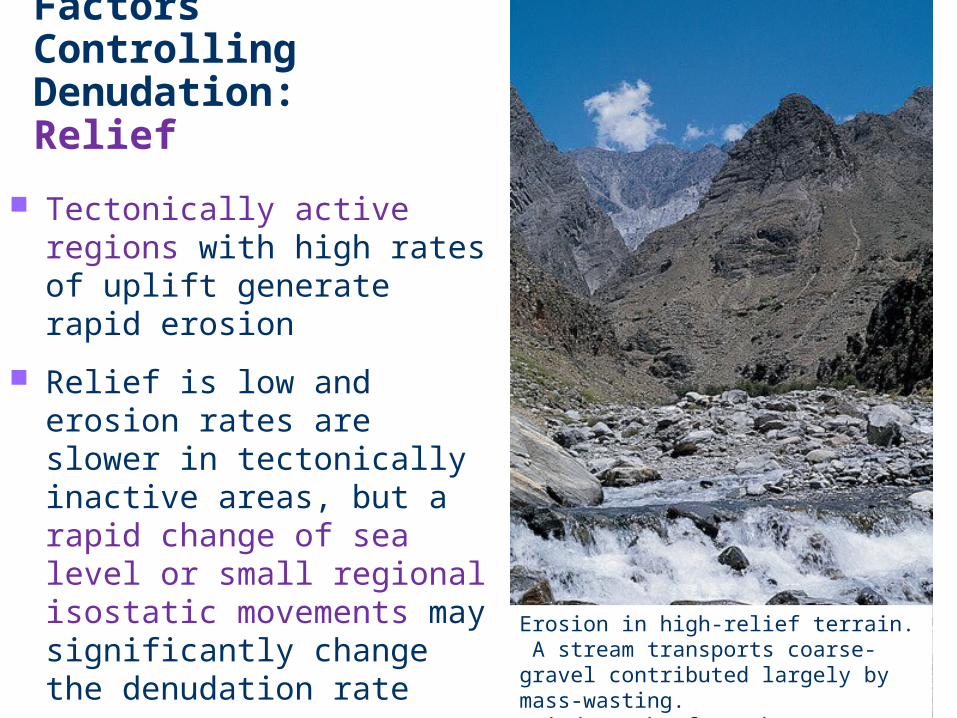
Factors Controlling Denudation: Relief
Tectonically active regions with high rates of uplift generate rapid erosion
Relief is low and erosion rates are slower in tectonically inactive areas, but a rapid change of sea level or small regional isostatic movements may significantly change the denudation rate
Erosion in high-relief terrain. A stream transports coarse-gravel contributed largely by mass-wasting. (Hindu-Kush of northern Pakistan)
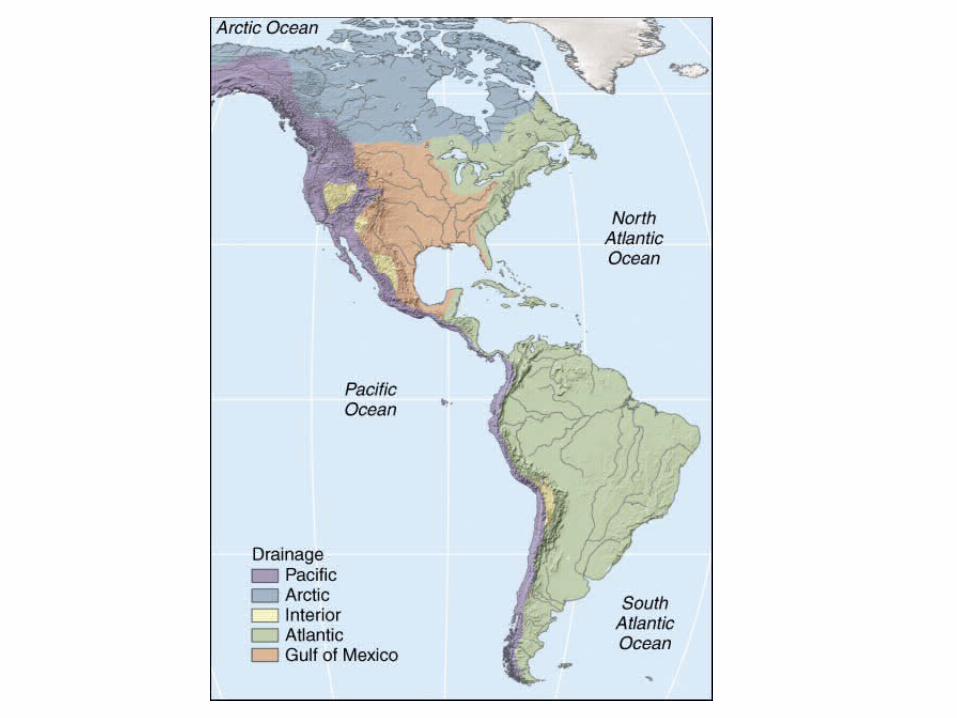
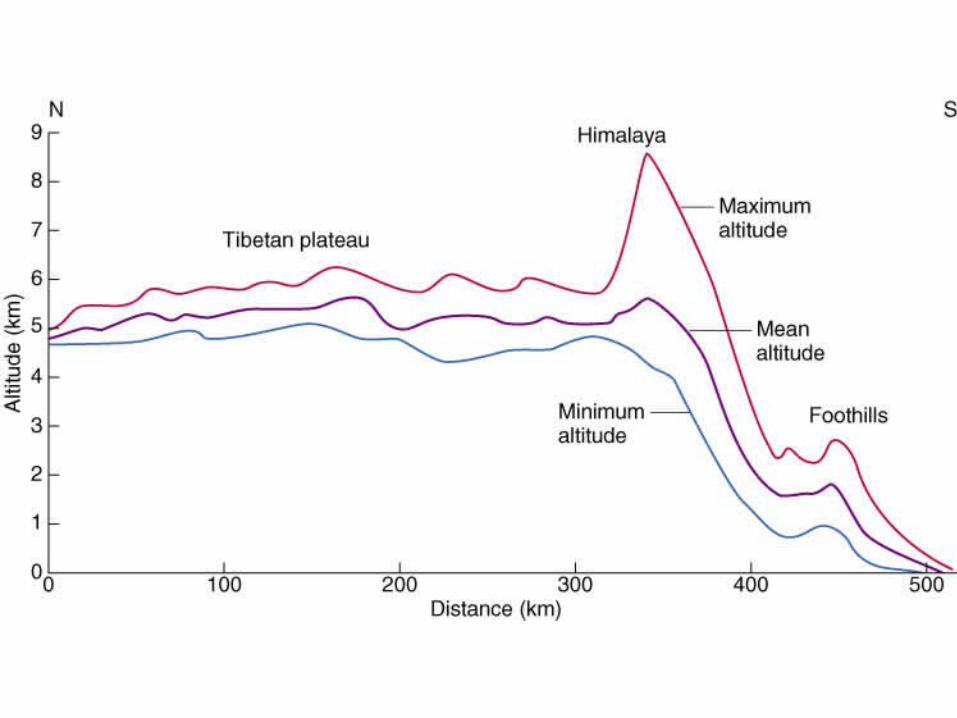
Tectonic and Climatic Control of Continental Divides
The line separating any two major drainage basins is a continental divide In North America, continental divides lies at the
head of major streams that drain into the Pacific, Atlantic, and Arctic oceans
Because continental divides often coincide with the crests of mountain ranges, and because mountain ranges are the result of uplift associated with the interaction of tectonic plates, a close relationship exists between plate tectonics and the location of primary stream divides and drainage basins
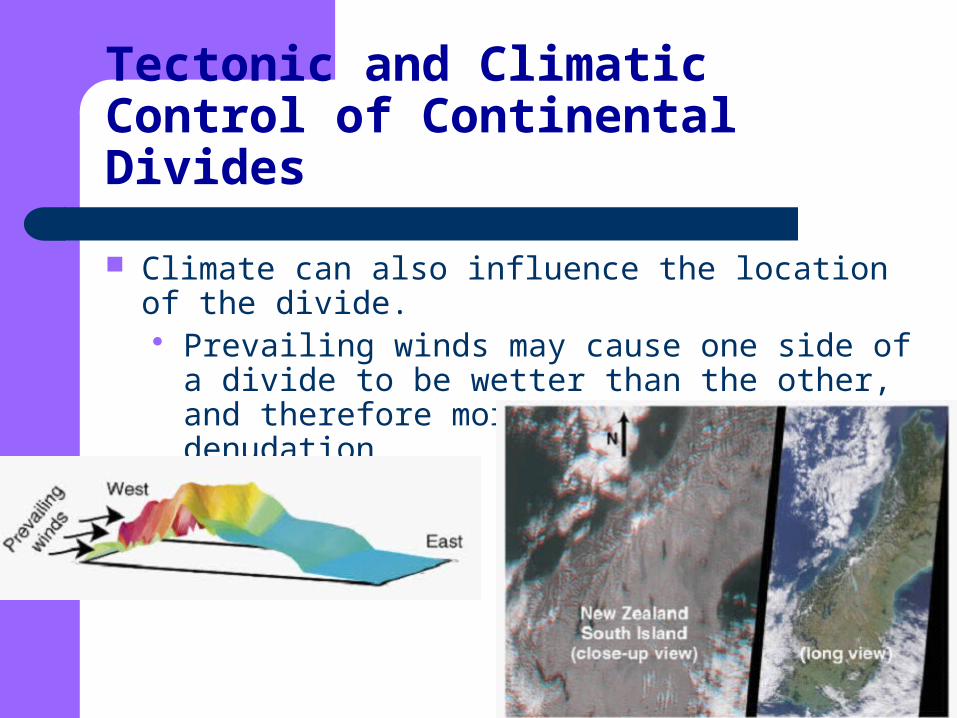
Tectonic and Climatic Control of Continental Divides
Climate can also influence the location of the divide. Prevailing winds may cause one side of a divide to
be wetter than the other, and therefore more subject to denudation
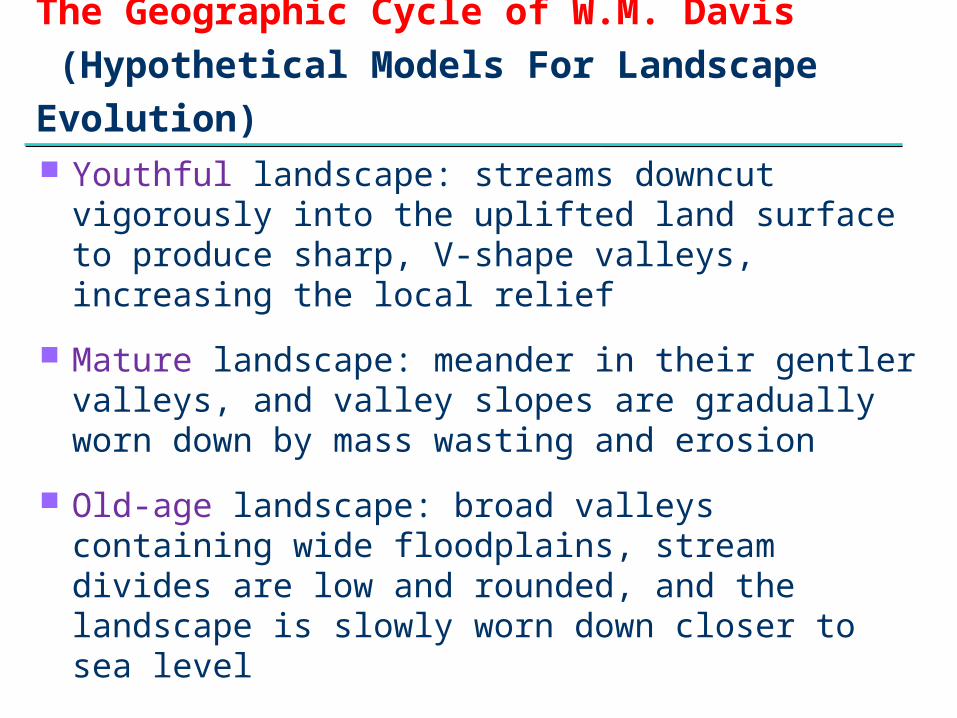
The Geographic Cycle of W.M. Davis
(Hypothetical Models For Landscape Evolution) Youthful landscape: streams downcut vigorously
into the uplifted land surface to produce sharp, V-shape valleys, increasing the local relief
Mature landscape: meander in their gentler valleys, and valley slopes are gradually worn down by mass wasting and erosion
Old-age landscape: broad valleys containing wide floodplains, stream divides are low and rounded, and the landscape is slowly worn down closer to sea level
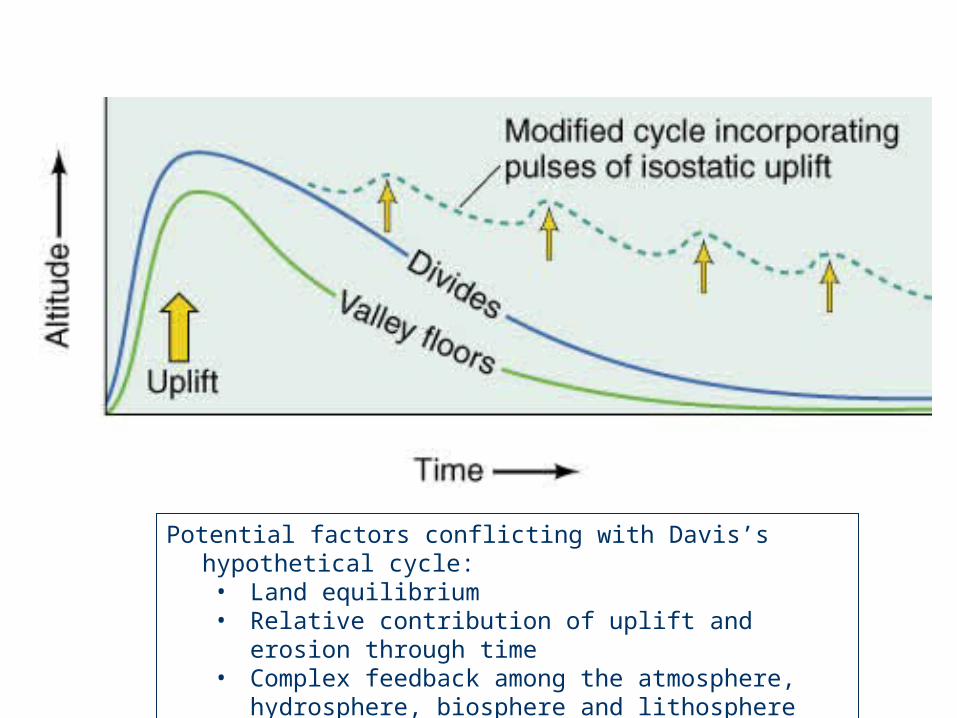
Potential factors conflicting with Davis’s hypothetical cycle:• Land equilibrium• Relative contribution of uplift and erosion through time• Complex feedback among the atmosphere,
hydrosphere, biosphere and lithosphere
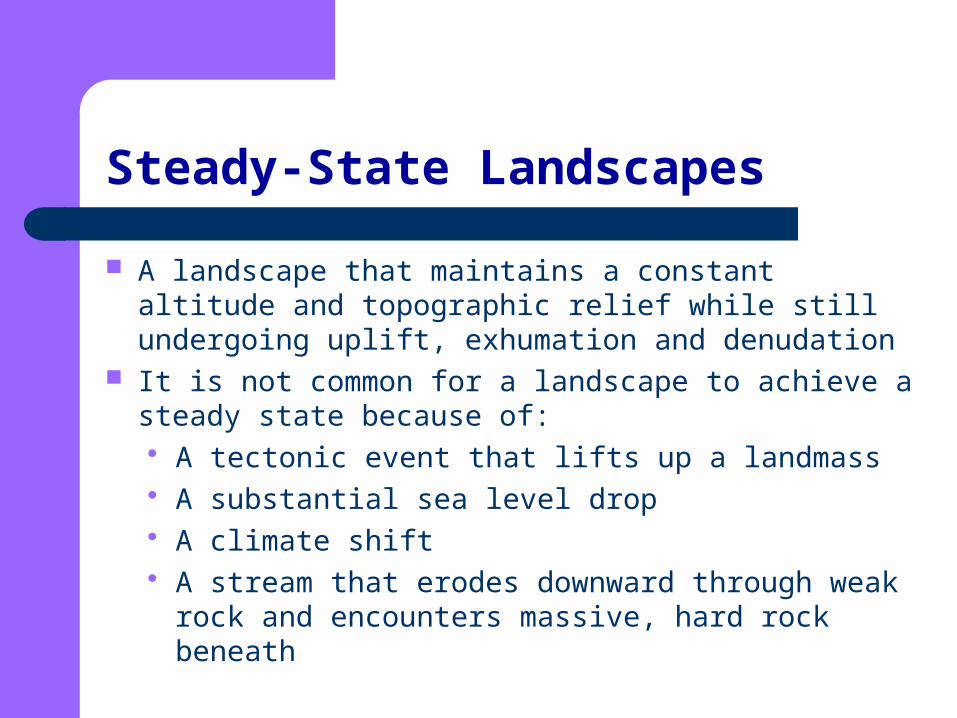
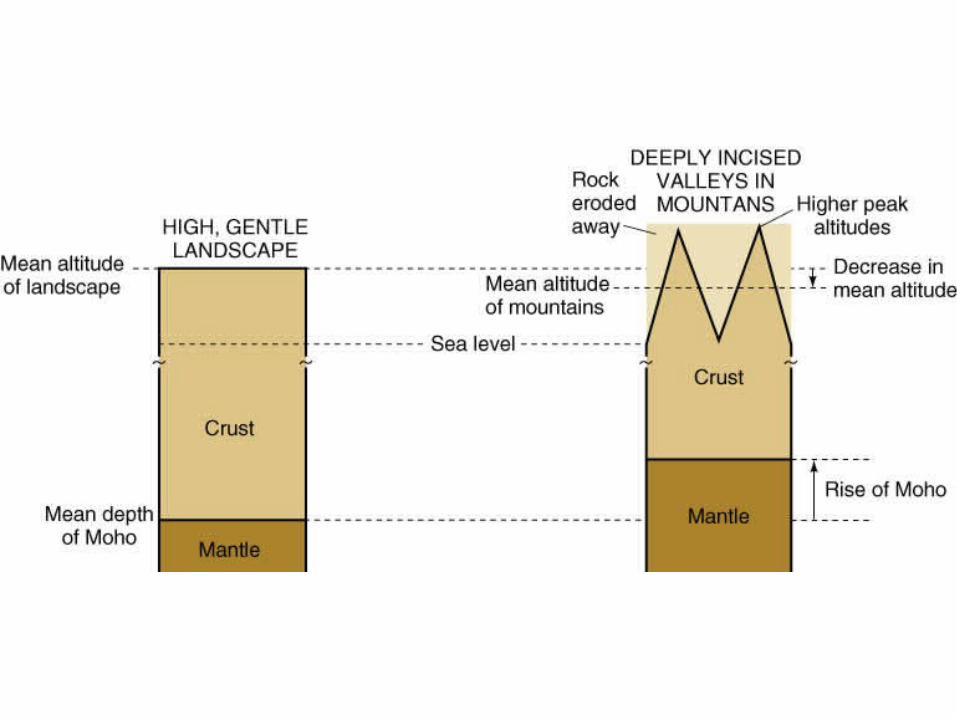
Steady-State Landscapes
A landscape that maintains a constant altitude and topographic relief while still undergoing uplift, exhumation and denudation
It is not common for a landscape to achieve a steady state because of: A tectonic event that lifts up a landmass A substantial sea level drop A climate shift A stream that erodes downward through weak rock
and encounters massive, hard rock beneath
Steady-State Landscapes
If rates of denudation and uplift are stable for long periods, the landscape can adjust itself to a steady state
A steady state landscape maintains a constant altitude and topographic relief while still undergoing change
If uplift ceases altogether, the average rate of change gradually decreases as the land surface is progressively eroded toward sea level
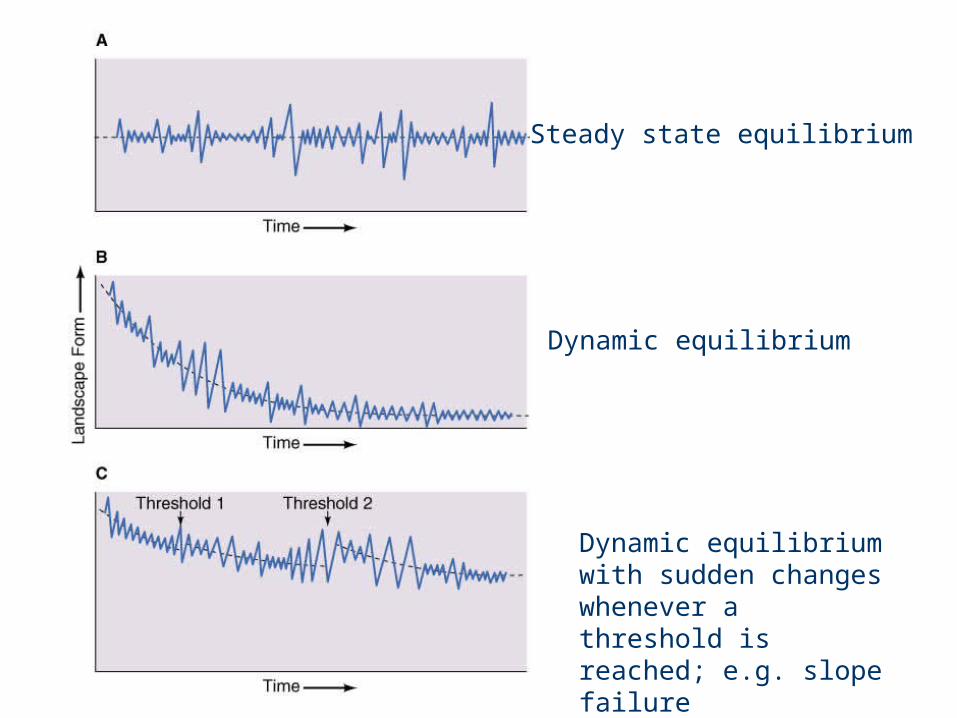
Steady state equilibrium
Dynamic equilibrium
Dynamic equilibrium with sudden changes whenever a threshold is reached; e.g. slope failure
Rapid landscape Changes: Threshold Effects
Sudden changes can occur once a critical threshold
condition is reached
A threshold effect implies that landscape development,
rather than being progressive and steady, can be
punctuated by occasional abrupt changes
A landscape in near-equilibrium may undergo a sudden
change if a process operating on it reaches a threshold
level
How Can We Calculate Uplift Rates?
Three methods are used to calculate uplift rates: Extrapolation from earthquake displacements Measurement of warped strata Measurement of river terraces
Extrapolation from Earthquake Displacements
Measure how much local uplift occurred during historical large earthquakes
Extrapolate the recent rates of uplift back in time This is based on the risky assumption that the brief
historical record is representative of longer intervals of geologic time
Organic processes can supplement historical record. In New Zealand, for instance, lichens grow on
newly exposed rock surfaces at a predictable rate for several centuries, providing information about the age of the surface
Calculation from Warped Strata
This technique measures the warping (vertical dislocation) of originally horizontal strata of known age
For this method, we need to know: The altitude difference between where the stratum
is today and where it was at its formation A radiometric age for the stratum
Calculation from River Terraces
Rivers tend to carry material eroded from steep slopes and deposit it along flatter portions of river valleys
In an uplift region, a river may form a sequence of abandoned depositional surfaces called river terraces
As uplift raises a river valley, the river erodes into its former depositional surface and its terraces are abandoned
Calculation from River Terraces
If we can determine the age of the last sediment deposited, abandonment times and uplift rates can be calculated
However, interpretation requires some caution: Climate changes can alter streambed erosion rates
and cause river terraces to form as well Measured uplift rates in tectonic belts are quite
variable through time
秀姑巒溪河階
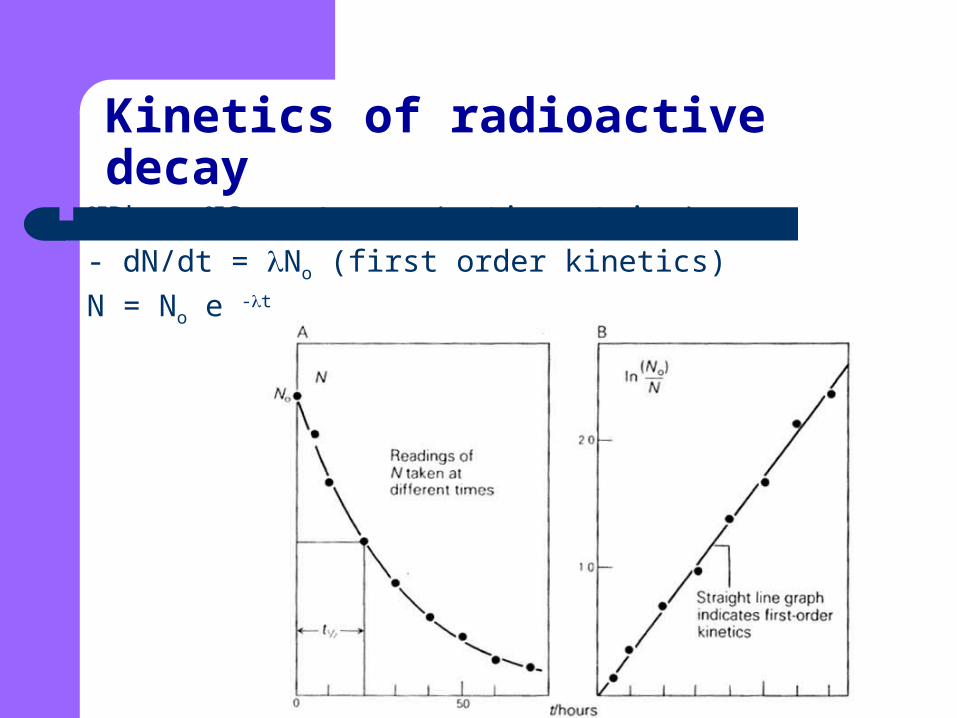
Kinetics of radioactive decay 87Rb 87Sr + - + (anti-neutrino) - dN/dt = No (first order kinetics) N = No e -t

Kinetics of radioactive decay: the U-Pb system
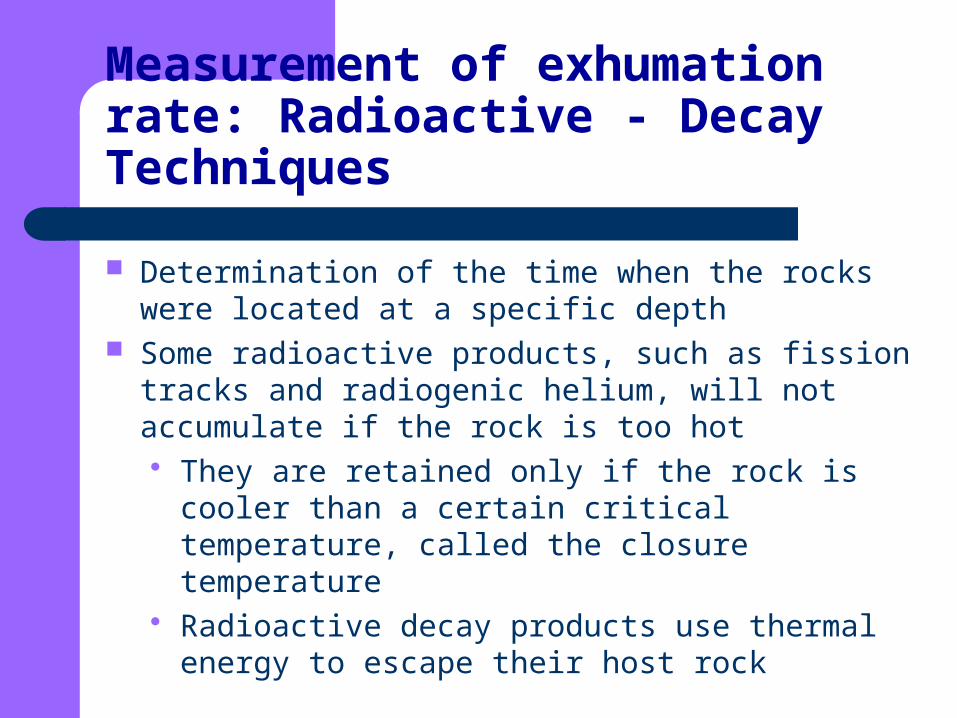
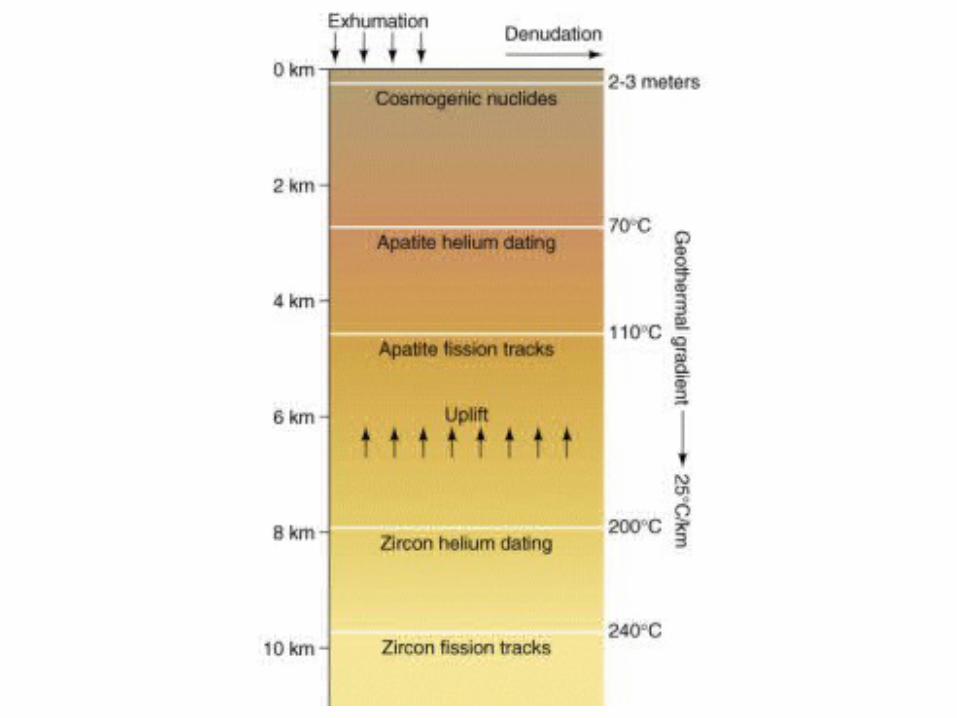
Measurement of exhumation rate: Radioactive - Decay Techniques
Determination of the time when the rocks were located at a specific depth
Some radioactive products, such as fission tracks and radiogenic helium, will not accumulate if the rock is too hot They are retained only if the rock is cooler than a
certain critical temperature, called the closure temperature
Radioactive decay products use thermal energy to escape their host rock
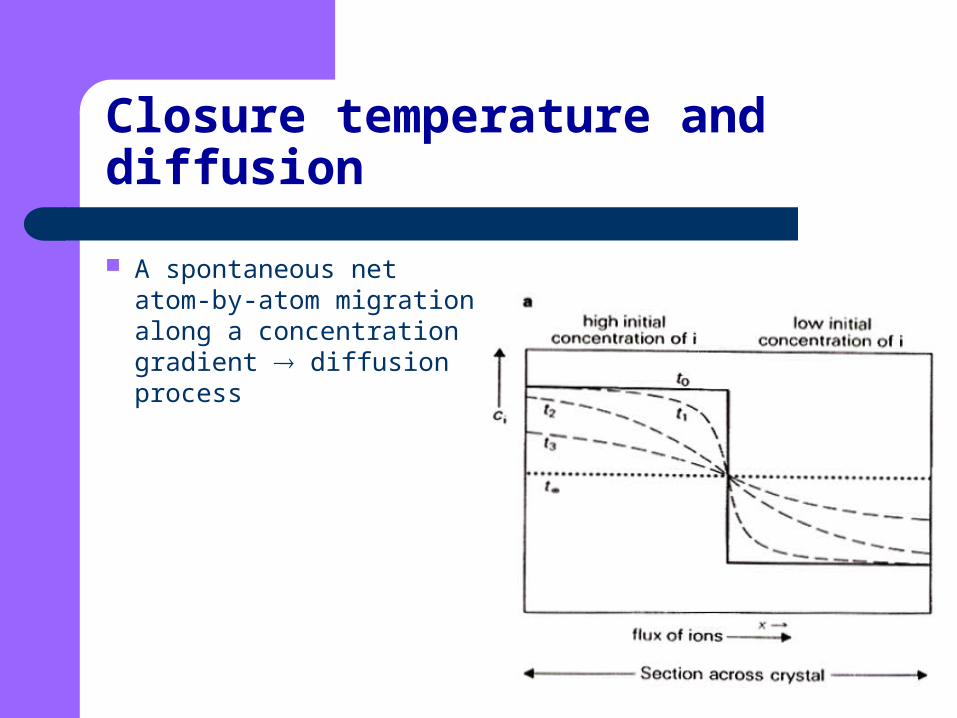
Closure temperature and diffusion
A spontaneous net atom-by-atom migration along a concentration gradient diffusion process
Radioactive - Decay Techniques
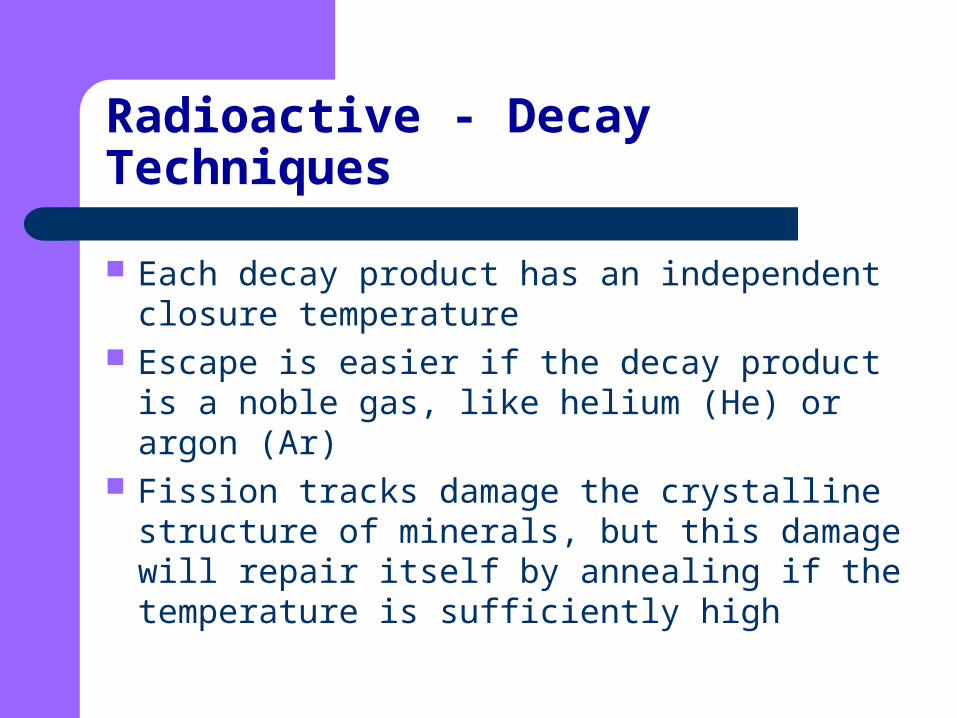
Each decay product has an independent closure temperature
Escape is easier if the decay product is a noble gas, like helium (He) or argon (Ar)
Fission tracks damage the crystalline structure of minerals, but this damage will repair itself by annealing if the temperature is sufficiently high
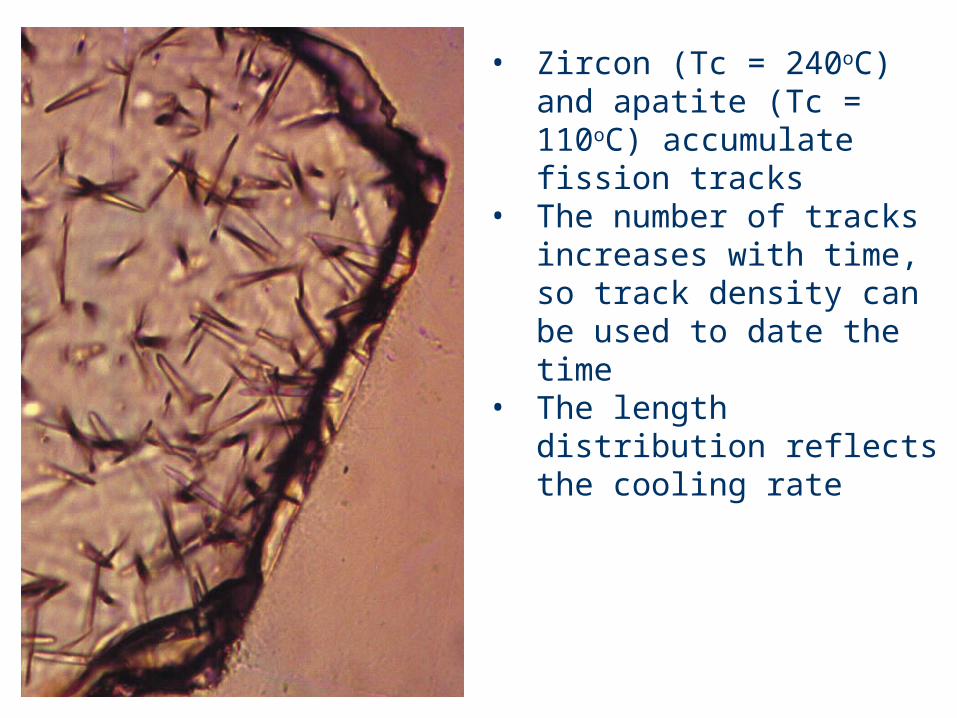
• Zircon (Tc = 240oC) and apatite (Tc = 110oC) accumulate fission tracks
• The number of tracks increases with time, so track density can be used to date the time
• The length distribution reflects the cooling rate
Cosmogenic Nuclides
Cosmogenic nuclides are radioactive isotopes that are not present in a rock at its formation, but rather are generated by high-energy subatomic particles emitted by the sun
Cosmic ray convert some atoms to rare isotopes, such as 36Cl, 26Al, 10Be, but the accumulation of cosmogenic nuclides is limited by the depth of burial.
Their abundance in a surface rock can tell us how long a rock has been exposed to such radiation
Denudation Rates
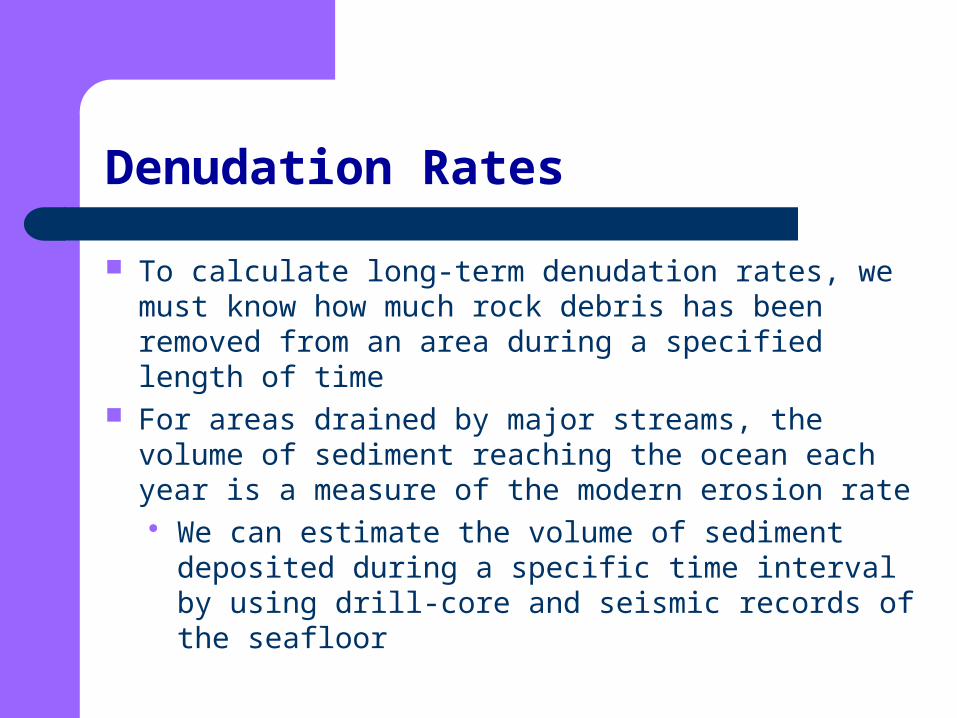
To calculate long-term denudation rates, we must know how much rock debris has been removed from an area during a specified length of time
For areas drained by major streams, the volume of sediment reaching the ocean each year is a measure of the modern erosion rate We can estimate the volume of sediment deposited
during a specific time interval by using drill-core and seismic records of the seafloor
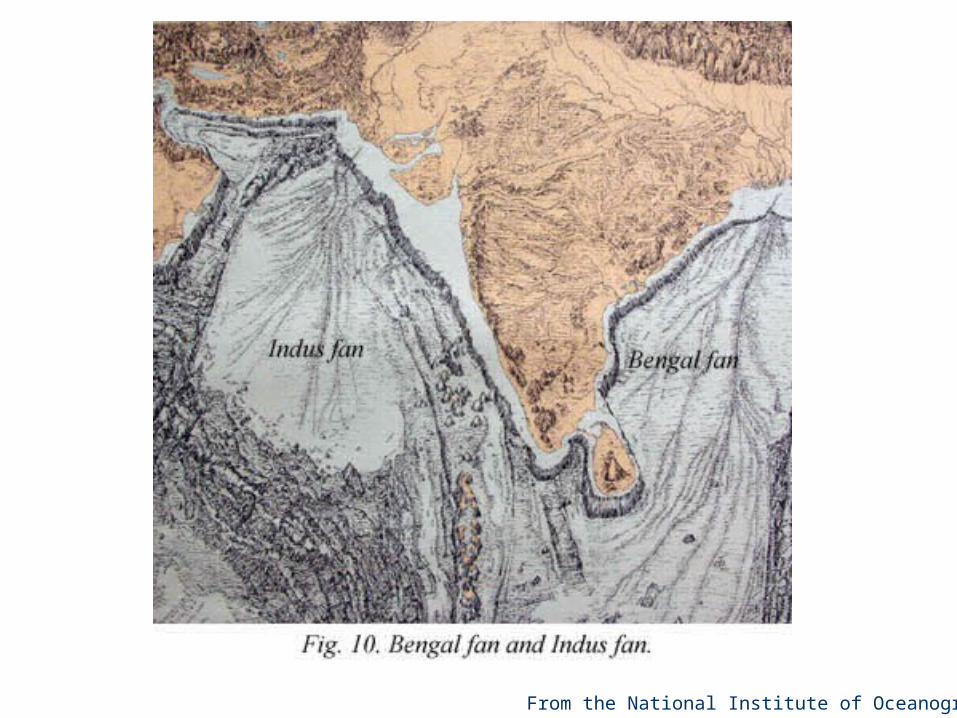
From the National Institute of Oceanography
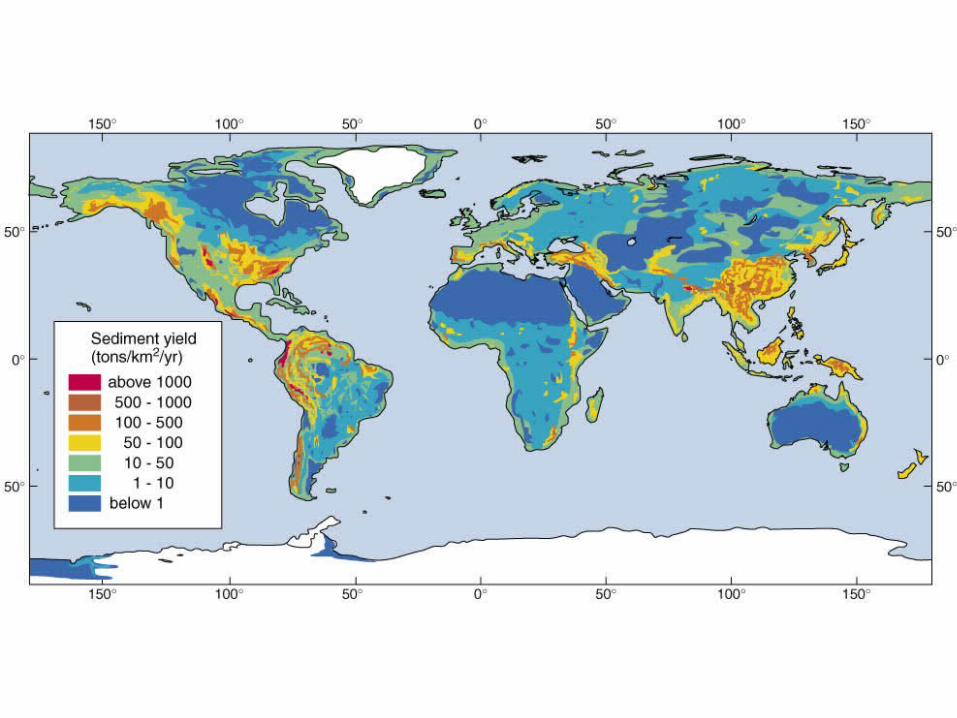
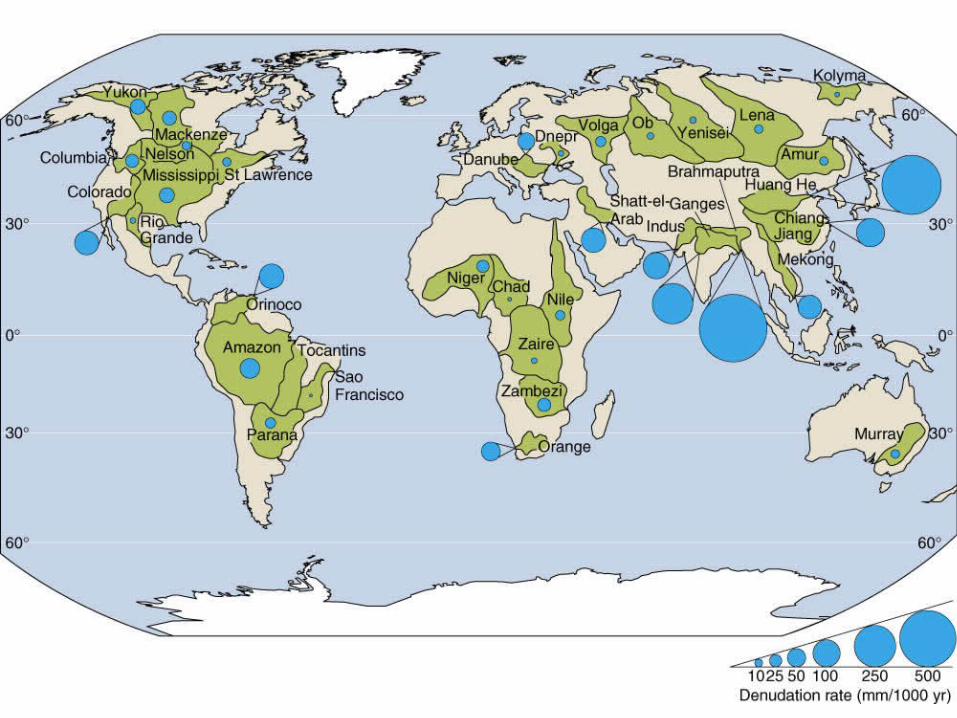
World Sediment Yields
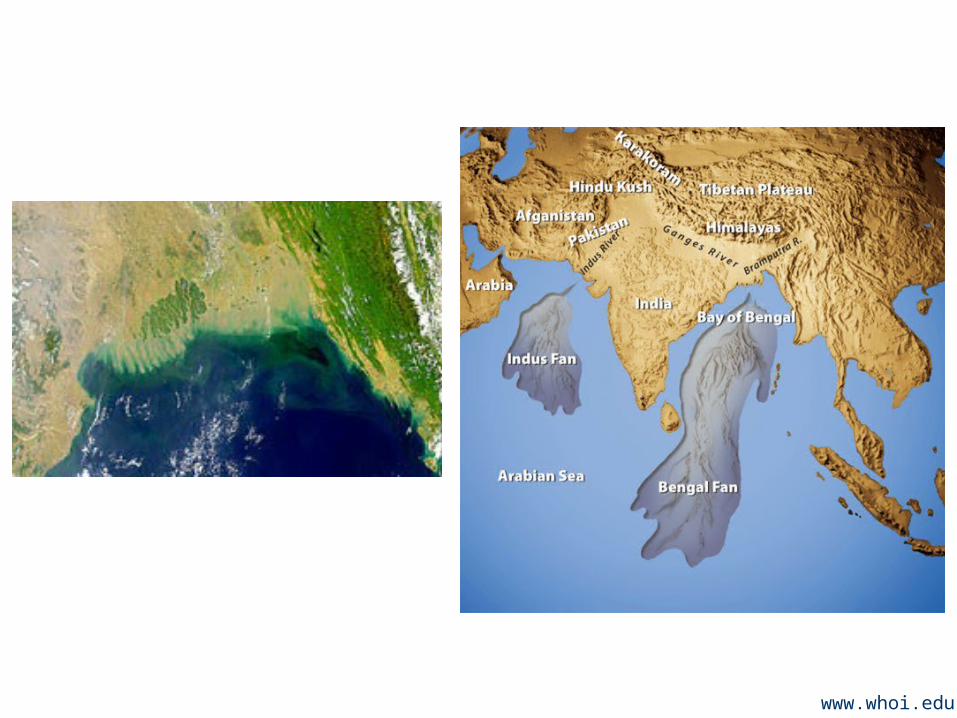
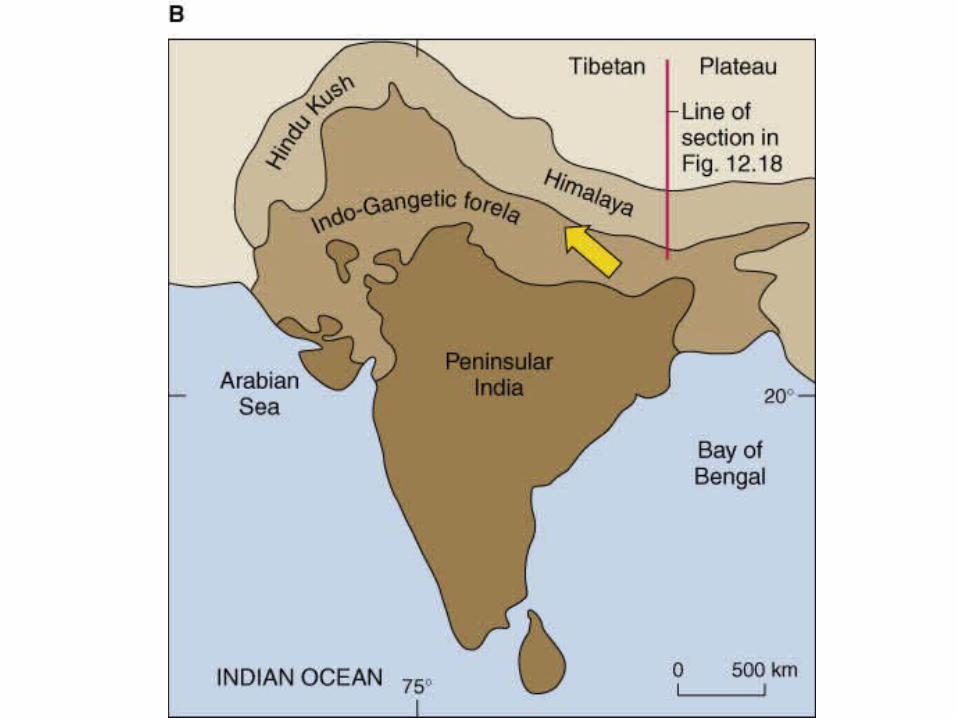
The highest measured sediment yields are from: The humid region of southeastern Asia and Oceania Basins that drain steep, high-relief mountains of
young orogenic belts, such as the Himalayas, the Andes, and the Alps
Low sediment yields are from: Deserts The polar and subpolar sectors of the northern
continents
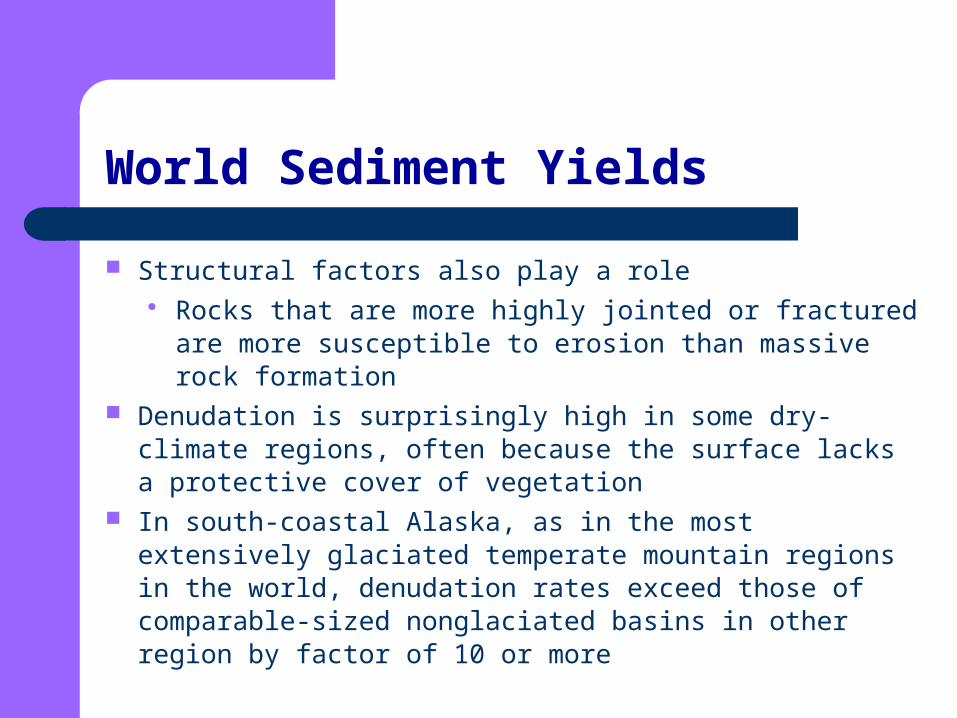
World Sediment Yields
Structural factors also play a role Rocks that are more highly jointed or fractured are more
susceptible to erosion than massive rock formation Denudation is surprisingly high in some dry-climate regions,
often because the surface lacks a protective cover of vegetation
In south-coastal Alaska, as in the most extensively glaciated temperate mountain regions in the world, denudation rates exceed those of comparable-sized nonglaciated basins in other region by factor of 10 or more
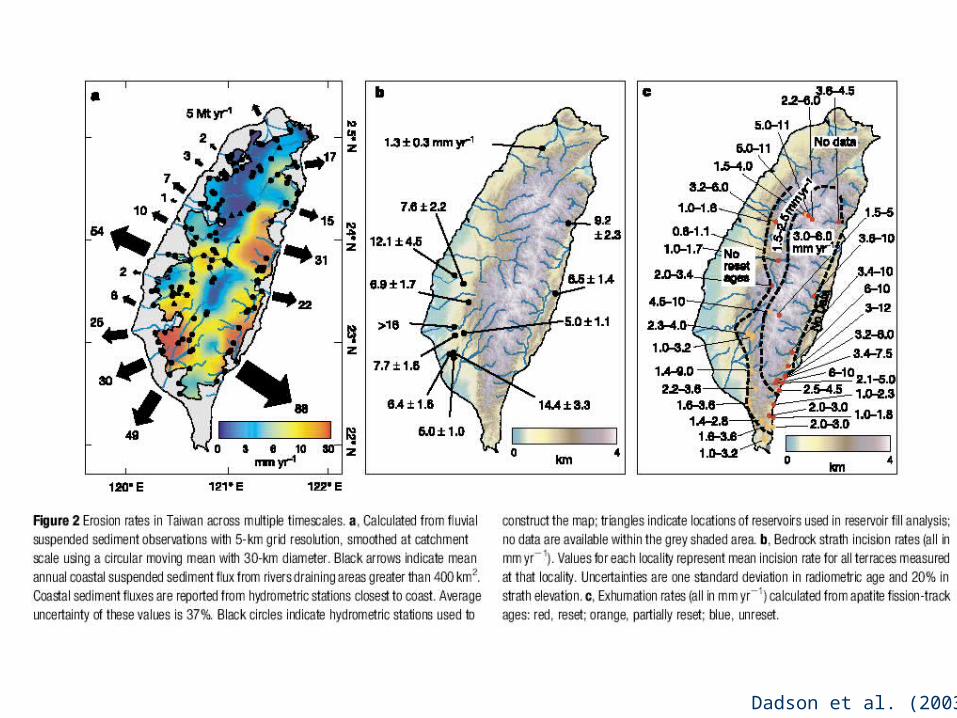
Dadson et al. (2003)
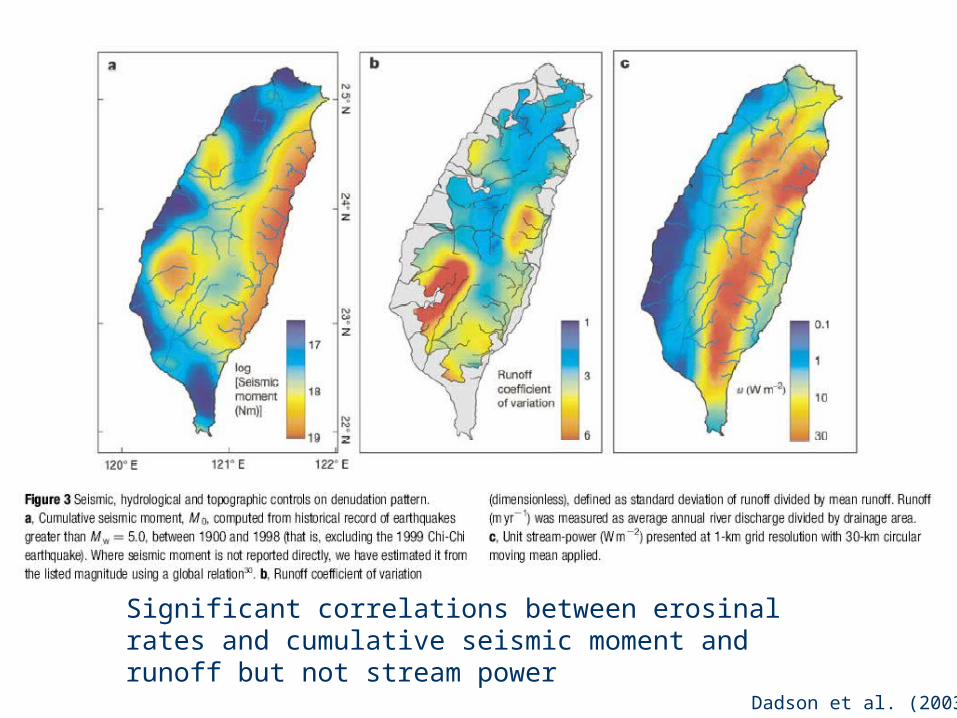
Significant correlations between erosinal rates and cumulative seismic moment and runoff but not stream power
Dadson et al. (2003)
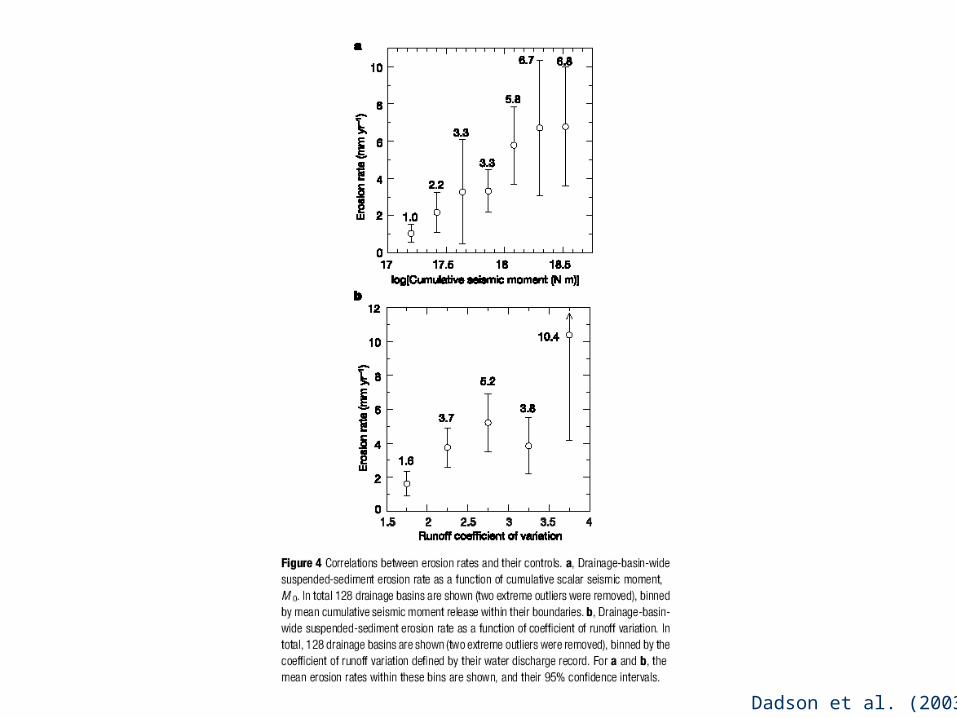
Dadson et al. (2003)
Human Impact on Denudation
Humans increase the rate of denudation by: Clearing forests Developing cultivated land Damming streams Building cities
Human Impact on Denudation
Areas cleared for construction produce 10 to 100 times more sediment than comparable rural areas or natural areas that are vegetated.
The high Aswan Dam on the Nile River intercepts most of the sediment that the Nile previously carried to the Mediterranean sea
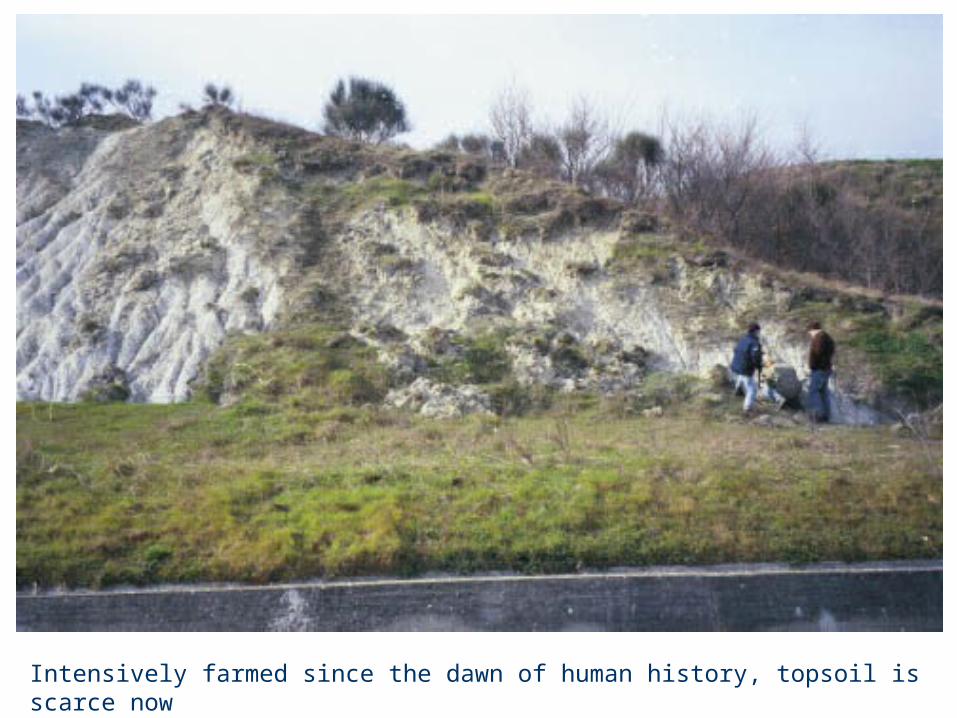
Intensively farmed since the dawn of human history, topsoil is scarce now
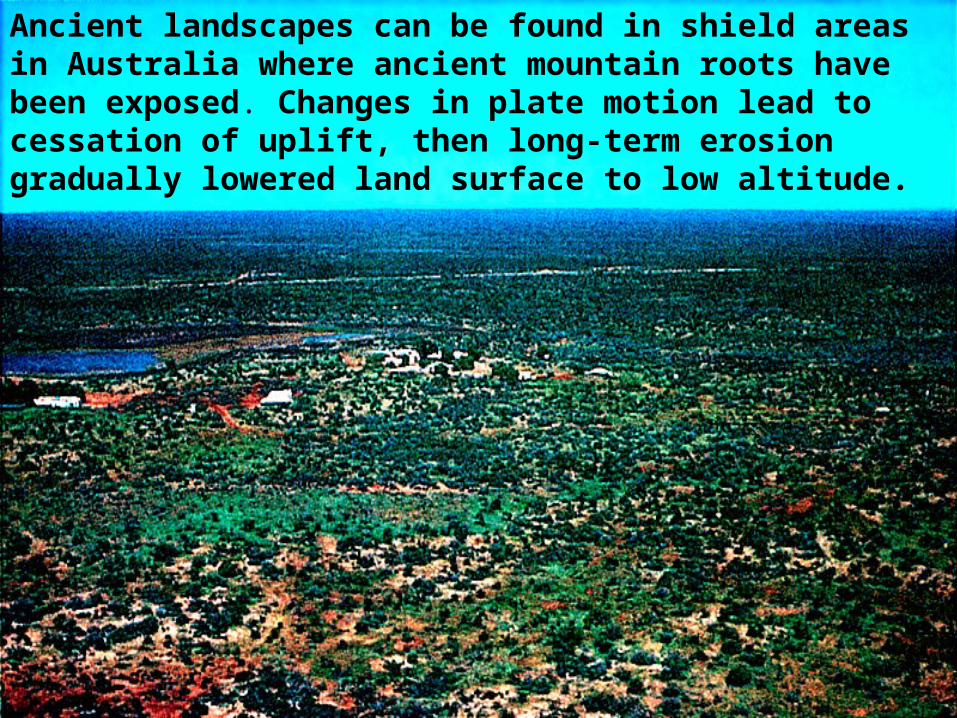
Ancient landscapes can be found in shield areas in Australia where ancient mountain roots have been exposed. Changes in plate motion lead to cessation of uplift, then long-term erosion gradually lowered land surface to low altitude.
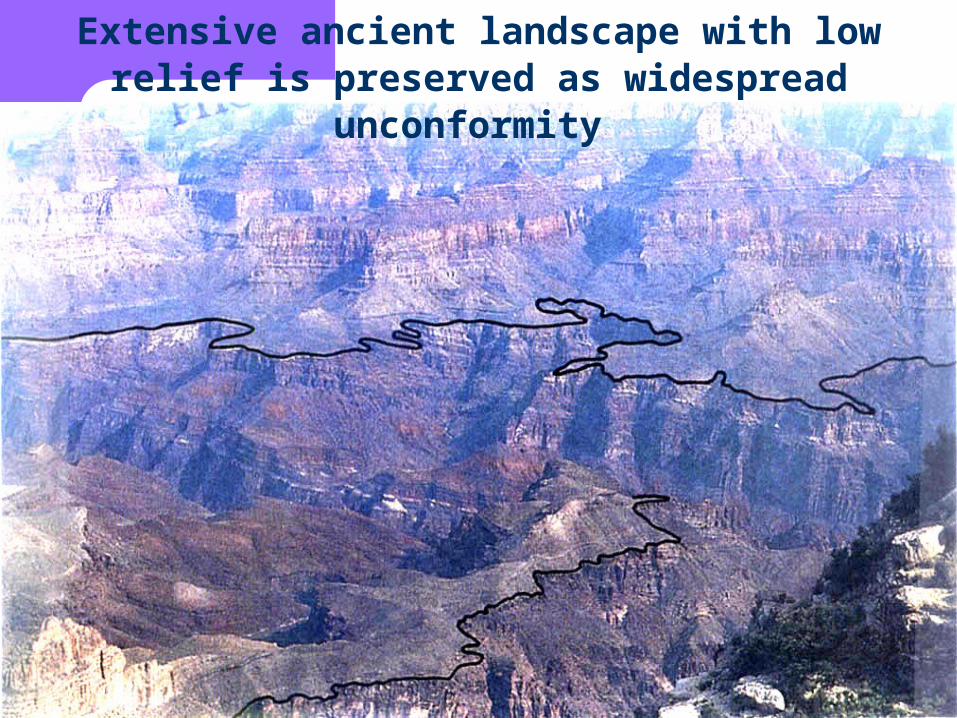
Extensive ancient landscape with low relief is preserved as widespread unconformity
The Carbon Cycle
The carbon cycle on Earth is driven by plate tectonic motions
Uplift and exhumation are among the most important factors in determining the level of CO2 in the atmosphere
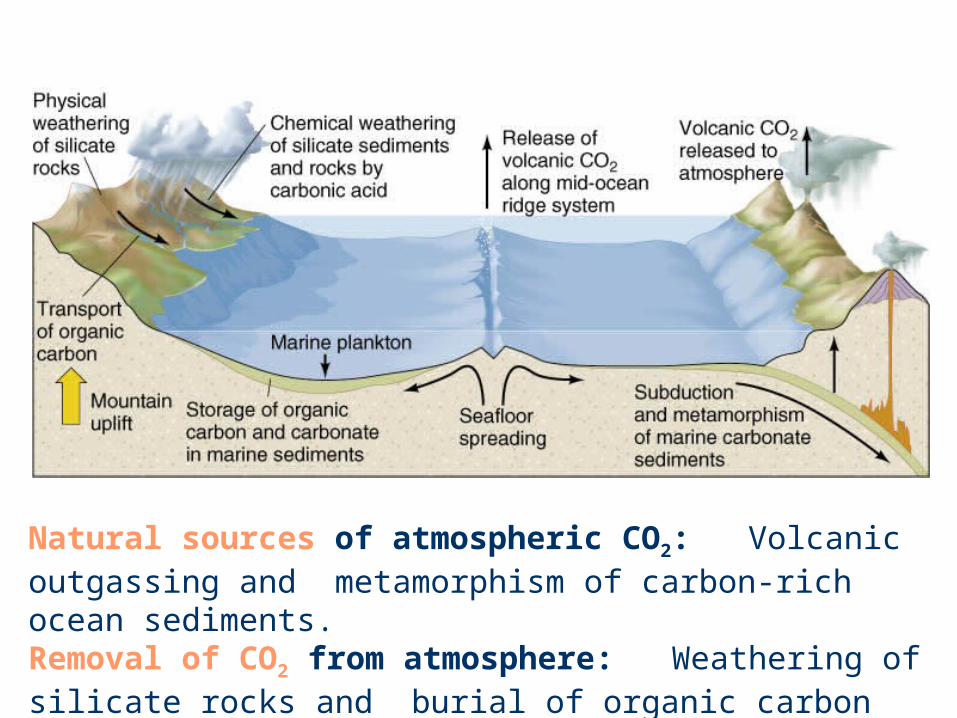
Natural sources of atmospheric CO2: Volcanic outgassing and metamorphism of carbon-rich ocean sediments.Removal of CO2 from atmosphere: Weathering of silicate rocks and burial of organic carbon
The Carbon Cycle: Sources of CO2
Global volcanism adds CO2 to the atmosphere from Earth’s interior.
CO2 is released from metamorphism of carbon-rich marine sediments carried downward in subduction zones.
Utilization of oil gas and coal.
The Carbon Cycle
CO2 is removed from the atmosphere by weathering of surface silicate rocks Rainwater combines with CO2 to form carbonic
acid (H2CO3), and this acid weathers silicate rocks:
CaSiO3 + H2CO3 CaCO3 + SiO2 + H2O
The Carbon Cycle
Land plants synthesize other carbon-based acids in their roots to leach chemical nutrients from rocks
Streams transport weathering products to the ocean There the carbonate and silica are used by marine
organisms and their remains accumulate on the seafloor, stored as sediment
High spreading rate -> high CO2 emission -> warm up the Earth’s surface -> Accelerate the weathering -> Increase CO2 removal
The Carbon Cycle: An Alternate View
An alternative hypothesis: uplift could increase the removal rate for atmospheric CO2, because it generates faulting, which exposes fresh, fractured rock to chemical weathering A trend over the past 100 million years toward
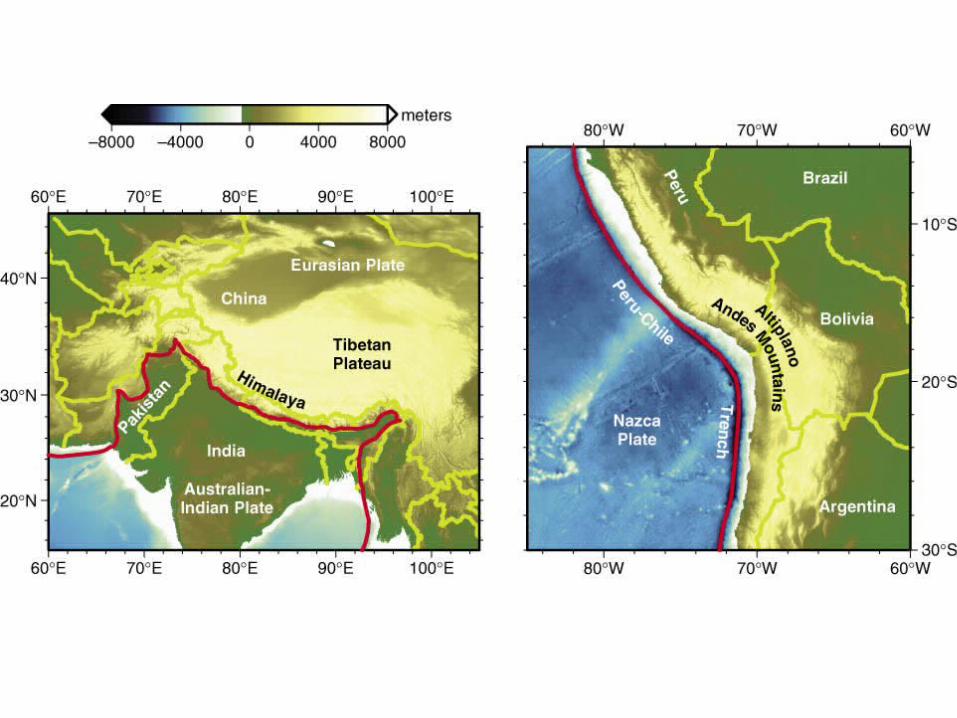
cooler global temperatures and reduced atmospheric CO2 has occurred at the same time as the uplift and erosion of several major continental plateaus, including Tibet in central Asia, the Altiplano in South America, and the Laramide uplift (Rocky Mountains) in North America


![HUNG-GAY FUNG Address Office School of Business ... · Quantitative Finance and Accounting (Li-Hsun Wang, Chu-Hsiung Lin, Erin Kao, and Hung-Gay Fung), forthcoming. [179] “A Comparison](https://img.pdfslide.us/doc/110x75/5ea1ba14431390335e68f236/hung-gay-fung-address-office-school-of-business-quantitative-finance-and-accounting.jpg)