Embed Size (px)
Citation preview

CHAPTER 12
TechnologicalProgress andGrowth
TechnologicalProgress andGrowth
CHAPTER 12
Prepared by:
Fernando Quijano and Yvonn Quijano
Copyright © 2009 Pearson Education, Inc. Publishing as Prentice Hall • Macroeconomics, 5/e • Olivier Blanchard
2 of 30Cha
pter
12:
T
echn
olog
ica
l Pro
gres
s an
d G
row
th
Copyright © 2009 Pearson Education, Inc. Publishing as Prentice Hall • Macroeconomics, 5/e • Olivier Blanchard
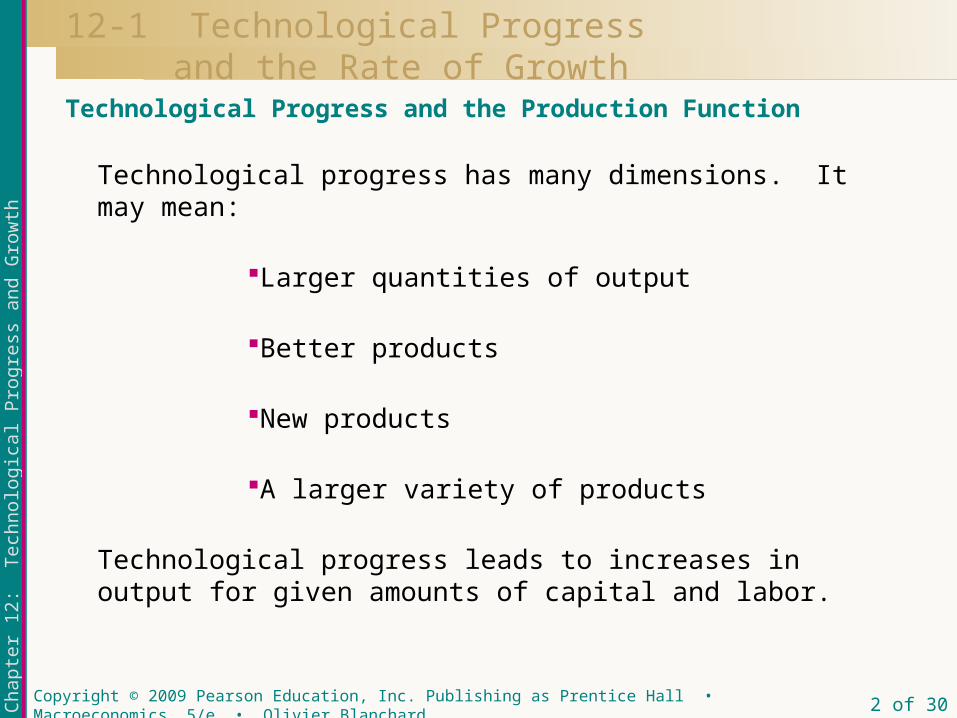
Technological progress has many dimensions. It may mean:
Larger quantities of output
Better products
New products
A larger variety of products
Technological progress leads to increases in output for given amounts of capital and labor.
12-1 Technological Progress and the Rate of Growth
Technological Progress and the Production Function

3 of 30Cha
pter
12:
T
echn
olog
ica
l Pro
gres
s an
d G
row
th
Copyright © 2009 Pearson Education, Inc. Publishing as Prentice Hall • Macroeconomics, 5/e • Olivier Blanchard
Let’s denote the state of technology by A and rewrite the production function as:
Y F K N A ( , , )(+ + + )
A more restrictive but more convenient form is
Y F K A N ( , )
Output depends on both capital and labor (K and N), and on the state of technology (A).
12-1 Technological Progressand the Rate of Growth
Technological Progress and the Production Function

4 of 30Cha
pter
12:
T
echn
olog
ica
l Pro
gres
s an
d G
row
th
Copyright © 2009 Pearson Education, Inc. Publishing as Prentice Hall • Macroeconomics, 5/e • Olivier Blanchard
Technological progress reduces the number of workers needed to achieve a given amount of output.
Technological progress increases AN, which we can think of as the amount of effective labor, or labor in “efficiency units” in the economy.
With constant returns to scale,
2 (2 , 2 ) Y F K AN
More generally,
( , ) xY F xK xAN
12-1 Technological Progressand the Rate of Growth
Technological Progress and the Production Function

5 of 30Cha
pter
12:
T
echn
olog
ica
l Pro
gres
s an
d G
row
th
Copyright © 2009 Pearson Education, Inc. Publishing as Prentice Hall • Macroeconomics, 5/e • Olivier Blanchard
The relation between output per effective worker and capital per effective worker is:
Y Kf
AN AN
In words: Output per effective worker is a function of capital per effective worker.
, 1Y K
FAN AN
which we can redefine as
12-1 Technological Progressand the Rate of Growth
Technological Progress and the Production Function
6 of 30Cha
pter
12:
T
echn
olog
ica
l Pro
gres
s an
d G
row
th
Copyright © 2009 Pearson Education, Inc. Publishing as Prentice Hall • Macroeconomics, 5/e • Olivier Blanchard
12-1 Technological Progressand the Rate of Growth
Technological Progress and the Production Function
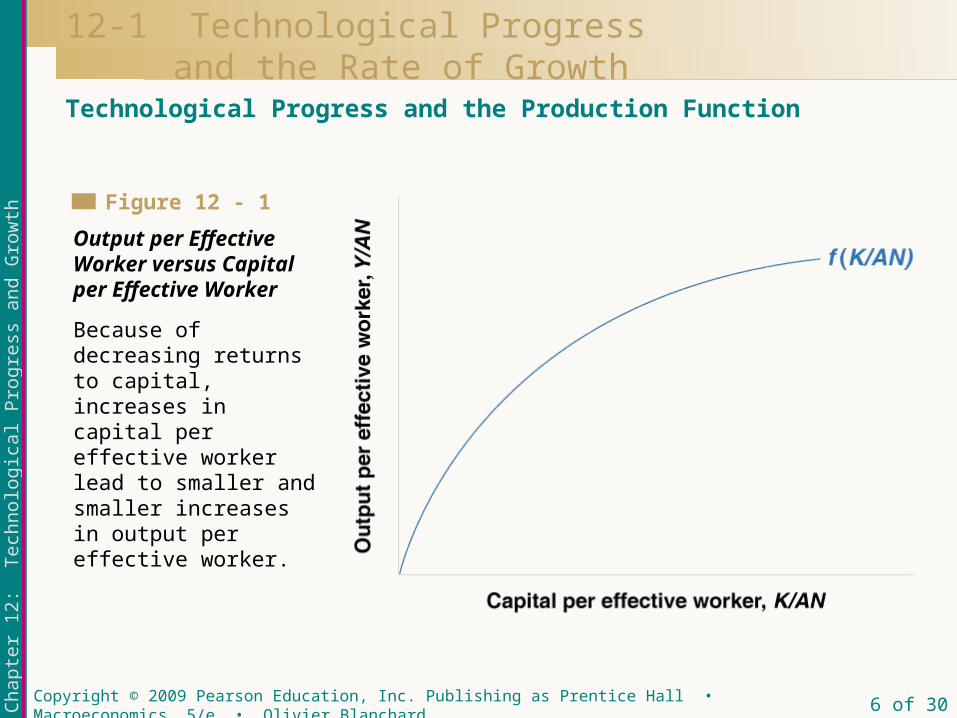
Because of decreasing returns to capital, increases in capital per effective worker lead to smaller and smaller increases in output per effective worker.
Output per Effective Worker versus Capital per Effective Worker
Figure 12 - 1

7 of 30Cha
pter
12:
T
echn
olog
ica
l Pro
gres
s an
d G
row
th
Copyright © 2009 Pearson Education, Inc. Publishing as Prentice Hall • Macroeconomics, 5/e • Olivier Blanchard
The dynamics of output and capital per worker involve:
The relation between output per worker and capital per worker.
I S sY
I
A Ns
Y
A N
Dividing both sides by AN, we get
12-1 Technological Progressand the Rate of Growth
Interactions between Output and Capital

8 of 30Cha
pter
12:
T
echn
olog
ica
l Pro
gres
s an
d G
row
th
Copyright © 2009 Pearson Education, Inc. Publishing as Prentice Hall • Macroeconomics, 5/e • Olivier Blanchard
Y
A Nf
K
A N
Given thatI
A Nsf
K
A N
then,
The dynamics of output and capital per worker involve:
The relation between investment per worker and capital per worker.
Interactions between Output and Capital
12-1 Technological Progressand the Rate of Growth

9 of 30Cha
pter
12:
T
echn
olog
ica
l Pro
gres
s an
d G
row
th
Copyright © 2009 Pearson Education, Inc. Publishing as Prentice Hall • Macroeconomics, 5/e • Olivier Blanchard
K g g KA N ( )
( ) g g KA Nor or equivalently
( ) g gK
A NA N
The amount of investment per effective worker needed to maintain a constant level of capital per effective worker is
Interactions between Output and Capital
12-1 Technological Progressand the Rate of Growth
The dynamics of output and capital per worker involve:
The relation between depreciation per worker—equivalently, the investment per worker needed to maintain a constant level of capital per worker—and capital per worker.
10 of 30Cha
pter
12:
T
echn
olog
ica
l Pro
gres
s an
d G
row
th
Copyright © 2009 Pearson Education, Inc. Publishing as Prentice Hall • Macroeconomics, 5/e • Olivier Blanchard
12-1 Technological Progressand the Rate of Growth
Interactions between Output and Capital
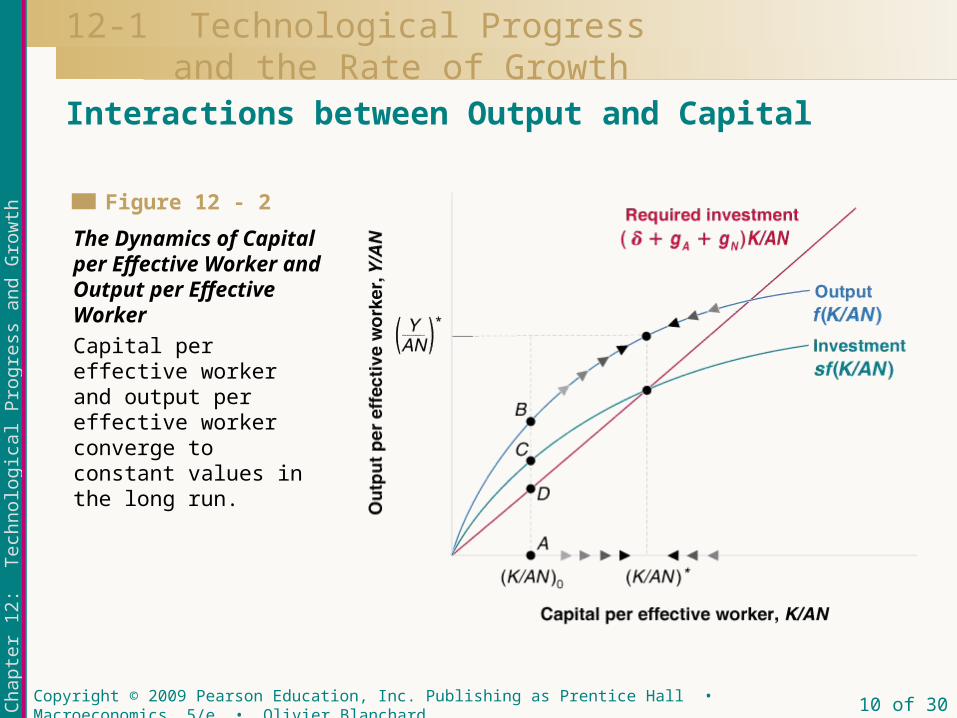
Capital per effective worker and output per effective worker converge to constant values in the long run.
The Dynamics of Capital per Effective Worker and Output per Effective Worker
Figure 12 - 2

11 of 30Cha
pter
12:
T
echn
olog
ica
l Pro
gres
s an
d G
row
th
Copyright © 2009 Pearson Education, Inc. Publishing as Prentice Hall • Macroeconomics, 5/e • Olivier Blanchard
This figure focuses on output, capital, and investment per effective worker, rather than per worker:
Output per effective worker increases with capital per effective worker, but at a decreasing rate.
12-1 Technological Progressand the Rate of Growth
Interactions between Output and Capital

12 of 30Cha
pter
12:
T
echn
olog
ica
l Pro
gres
s an
d G
row
th
Copyright © 2009 Pearson Education, Inc. Publishing as Prentice Hall • Macroeconomics, 5/e • Olivier Blanchard
This figure focuses on output, capital, and investment per effective worker, rather than per worker:
The relation between investment per effective worker and capital per effective worker is drawn as the upper curve, multiplied by the saving rate, s.
12-1 Technological Progressand the Rate of Growth
Interactions between Output and Capital

13 of 30Cha
pter
12:
T
echn
olog
ica
l Pro
gres
s an
d G
row
th
Copyright © 2009 Pearson Education, Inc. Publishing as Prentice Hall • Macroeconomics, 5/e • Olivier Blanchard
This figure focuses on output, capital, and investment per effective worker, rather than per worker:
Finally, now that we allow for technological progress (so A increases over time), the number of effective workers (AN) increases over time.
12-1 Technological Progressand the Rate of Growth
Interactions between Output and Capital

14 of 30Cha
pter
12:
T
echn
olog
ica
l Pro
gres
s an
d G
row
th
Copyright © 2009 Pearson Education, Inc. Publishing as Prentice Hall • Macroeconomics, 5/e • Olivier Blanchard
We can now give a graphical description of the dynamics of capital per effective worker and output per effective worker:
Because actual investment exceeds the investment level required to maintain the existing level of capital per effective worker, K/AN increases.
Starting from (K/AN)0, the economy moves to the right, with the level of capital per effective worker increasing over time.
In the long run, capital per effective worker reaches a constant level, and so does output per effective worker.
This implies that output (Y) is growing at the same rate as effective labor (AN).
12-1 Technological Progressand the Rate of Growth
Dynamics of Capital and Output

15 of 30Cha
pter
12:
T
echn
olog
ica
l Pro
gres
s an
d G
row
th
Copyright © 2009 Pearson Education, Inc. Publishing as Prentice Hall • Macroeconomics, 5/e • Olivier Blanchard
In steady state, output (Y) grows at the same rate as effective labor (AN); effective labor grows at a rate (gA+gN); therefore, output growth in steady state equals (gA+gN). Capital per effective worker also grows at a rate equal to (gA+gN).
The growth rate of output is independent of the saving rate.
Because output, capital, and effective labor all grow at the same rate, (gA+gN), the steady state of the economy is also called a state of balanced growth.
12-1 Technological Progressand the Rate of Growth
Dynamics of Capital and Output

16 of 30Cha
pter
12:
T
echn
olog
ica
l Pro
gres
s an
d G
row
th
Copyright © 2009 Pearson Education, Inc. Publishing as Prentice Hall • Macroeconomics, 5/e • Olivier Blanchard
Table 12-1 The Characteristics of Balanced Growth
Rate of growth of:
1 Capital per effective worker 0
2 Output per effective worker 0
3 Capital per worker gA
4 Output per worker gA
5 Labor gN
6 Capital gA + gN
7 Output gAW + gN
12-1 Technological Progressand the Rate of Growth
Dynamics of Capital and Output

17 of 30Cha
pter
12:
T
echn
olog
ica
l Pro
gres
s an
d G
row
th
Copyright © 2009 Pearson Education, Inc. Publishing as Prentice Hall • Macroeconomics, 5/e • Olivier Blanchard
On the balanced growth path (equivalently: in steady state, or in the long run):
Capital per effective worker and output per effective worker are constant.
Equivalently, capital per worker and output per worker are growing at the rate of technological progress, gA.
Or, in terms of labor, capital, and output: Labor is growing at the rate of population growth, gN; capital and output are growing at a rate equal to the sum of population growth and the rate of technological progress, (gA + gN).
12-1 Technological Progressand the Rate of Growth
Dynamics of Capital and Output

18 of 30Cha
pter
12:
T
echn
olog
ica
l Pro
gres
s an
d G
row
th
Copyright © 2009 Pearson Education, Inc. Publishing as Prentice Hall • Macroeconomics, 5/e • Olivier Blanchard
12-1 Technological Progressand the Rate of Growth
The Effects of the Saving Rate
An increase in the saving rate leads to an increase in the steady-state levels of output per effective worker and capital per effective worker.
The Effects of an Increase in the Saving Rate: I
Figure 12 - 3

19 of 30Cha
pter
12:
T
echn
olog
ica
l Pro
gres
s an
d G
row
th
Copyright © 2009 Pearson Education, Inc. Publishing as Prentice Hall • Macroeconomics, 5/e • Olivier Blanchard
12-1 Technological Progressand the Rate of Growth
The Effects of the Saving Rate
The increase in the saving rate leads to higher growth until the economy reaches its new, higher, balanced growth path.
The Effects of an Increase in the Saving Rate: II
Figure 12 - 4

20 of 30Cha
pter
12:
T
echn
olog
ica
l Pro
gres
s an
d G
row
th
Copyright © 2009 Pearson Education, Inc. Publishing as Prentice Hall • Macroeconomics, 5/e • Olivier Blanchard
“Technological progress” in modern economies is the result of firms’ research and development (R&D) activities. The outcome of R&D is fundamentally ideas.
Spending on R&D depends on:
The fertility of the research process, or how spending on R&D translates into new ideas and new products,
and
the appropriability of research results, or the extent to which firms benefit from the results of their own R&D.
12-2 The Determinants of TechnologicalProgress

21 of 30Cha
pter
12:
T
echn
olog
ica
l Pro
gres
s an
d G
row
th
Copyright © 2009 Pearson Education, Inc. Publishing as Prentice Hall • Macroeconomics, 5/e • Olivier Blanchard
The determinants of fertility include:
The interaction between basic research (the search for general principles and results) and applied research (the application of results to specific uses).
The country: some countries are more successful at basic research; others are more successful at applied research and development.
Time: It takes many years, and often many decades, for the full potential of major discoveries to be realized.
12-2 The Determinants of TechnologicalProgress
The Fertility of the Research Process

22 of 30Cha
pter
12:
T
echn
olog
ica
l Pro
gres
s an
d G
row
th
Copyright © 2009 Pearson Education, Inc. Publishing as Prentice Hall • Macroeconomics, 5/e • Olivier Blanchard
Information Technology, the New Economy, and Productivity Growth
Figure 1 Moore’s Law: Number of Transistors per Chip, 1970 to 2000

23 of 30Cha
pter
12:
T
echn
olog
ica
l Pro
gres
s an
d G
row
th
Copyright © 2009 Pearson Education, Inc. Publishing as Prentice Hall • Macroeconomics, 5/e • Olivier Blanchard
If firms cannot appropriate the profits from the development of new products, they will not engage in R&D. Factors at work include:
The nature of the research process. Is there a payoff in being first at developing a new product?
Legal protection. Patents give a firm that has discovered a new product the right to exclude anyone else from the production or use of the new product for a period of time.
12-2 The Determinants of Technological Progress
The Appropriability of Research Results

24 of 30Cha
pter
12:
T
echn
olog
ica
l Pro
gres
s an
d G
row
th
Copyright © 2009 Pearson Education, Inc. Publishing as Prentice Hall • Macroeconomics, 5/e • Olivier Blanchard
The Diffusion of New Technology: Hybrid Corn
Figure 1 Percentage of Total Corn Acreage Planted with Hybrid Seed, Selected U.S. States, 1932 to 1956

25 of 30Cha
pter
12:
T
echn
olog
ica
l Pro
gres
s an
d G
row
th
Copyright © 2009 Pearson Education, Inc. Publishing as Prentice Hall • Macroeconomics, 5/e • Olivier Blanchard
12-3 The Facts of Growth Revisited
Capital Accumulation versus Technological Progressin Rich Countries since 1950
Fast growth may come from two sources:
A higher rate of technological progress. If gA is higher, balanced output growth (gY=gA+gN) will also be higher. In this case, the rate of output growth equals the rate of technological progress.
Adjustment of capital per effective worker, K/AN, to a higher level. In this case, the growth rate of output exceeds the rate of technological progress.
26 of 30Cha
pter
12:
T
echn
olog
ica
l Pro
gres
s an
d G
row
th
Copyright © 2009 Pearson Education, Inc. Publishing as Prentice Hall • Macroeconomics, 5/e • Olivier Blanchard
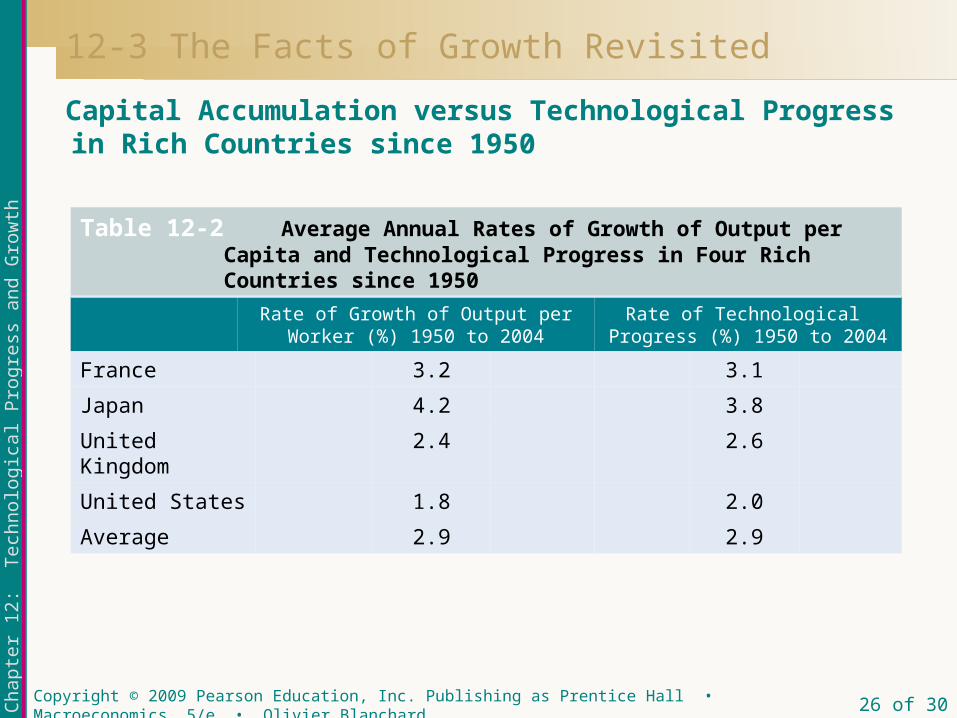
Table 12-2 Average Annual Rates of Growth of Output per Capita and Technological Progress in Four Rich Countries since 1950
Rate of Growth of Output per Worker (%) 1950 to 2004
Rate of Technological Progress (%) 1950 to 2004
France 3.2 3.1
Japan 4.2 3.8
United Kingdom 2.4 2.6
United States 1.8 2.0
Average 2.9 2.9
12-3 The Facts of Growth Revisited
Capital Accumulation versus Technological Progressin Rich Countries since 1950

27 of 30Cha
pter
12:
T
echn
olog
ica
l Pro
gres
s an
d G
row
th
Copyright © 2009 Pearson Education, Inc. Publishing as Prentice Hall • Macroeconomics, 5/e • Olivier Blanchard
Table 12-2 illustrates two main facts:
First, growth since 1950 has been a result of rapid technological progress, not unusually high capital accumulation.
Second, convergence of output per worker across countries has come from higher technological progress, rather than from faster capital accumulation, in the countries that started behind.
12-3 The Facts of Growth Revisited
Capital Accumulation versus Technological Progressin Rich Countries since 1950
28 of 30Cha
pter
12:
T
echn
olog
ica
l Pro
gres
s an
d G
row
th
Copyright © 2009 Pearson Education, Inc. Publishing as Prentice Hall • Macroeconomics, 5/e • Olivier Blanchard
Going beyond growth in OECD countries, one of the striking facts in Chapter 10 was the high growth rates achieved by a number of Asian countries. This raises again the same questions we just discussed: Do these high growth rates reflect fast technological progress, or do they reflect unusually high capital accumulation?
To answer the questions, I shall focus on China because of its size and because of the astonishingly high output growth rate, nearly 10%, it has achieved since the early 1980s.
12-3 The Facts of Growth Revisited
Capital Accumulation versus Technological Progress in China since 1980

29 of 30Cha
pter
12:
T
echn
olog
ica
l Pro
gres
s an
d G
row
th
Copyright © 2009 Pearson Education, Inc. Publishing as Prentice Hall • Macroeconomics, 5/e • Olivier Blanchard
12-3 The Facts of Growth Revisited
Capital Accumulation versus Technological Progress in China since 1980
Table 12-3 Average Annual Rate of Growth of Output per Worker and Technological Progress in China, 1983 to 2003
Rate of Growth of Output (%)
Rate of Growth of Output per Worker (%)
Rate of Technological Progress (%)
9.7 8.0 8.2
The nature of technological progress is likely to be different in more and less advanced economies. The more advanced economies, being by definition at the technological frontier, need to develop new ideas, new processes, and new products.
It is easier for the less advanced economies to imitate rather than innovate new technologies. This can explain why convergence, both within the OECD and in the case of China and other countries, typically takes the form of technological catch-up.

30 of 30Cha
pter
12:
T
echn
olog
ica
l Pro
gres
s an
d G
row
th
Copyright © 2009 Pearson Education, Inc. Publishing as Prentice Hall • Macroeconomics, 5/e • Olivier Blanchard
Key Terms
effective labor, or labor in efficiency units
balanced growth research and development
(R&D) fertility of research appropriability of research
Information technology revolution New Economy Moore’s law patent technology frontier technological catch-up