Embed Size (px)
Citation preview
169
Ralf Pörtner (ed.), Animal Cell Biotechnology: Methods and Protocols, Methods in Molecular Biology, vol. 1104, DOI 10.1007/978-1-62703-733-4_12, © Springer Science+Business Media, LLC 2014
Chapter 12
Monitoring Cell Growth, Viability, and Apoptosis
Michael Butler, Maureen Spearman, and Katrin Braasch
Abstract
The accurate determination of cell growth and viability is pivotal to monitoring a bioprocess. Direct methods to determine the cell growth and/or viability in a bioprocess include microscopic counting, electronic particle counting, image analysis, in situ biomass monitoring, and dieletrophoretic cytometry. These methods work most simply when a fixed volume sample can be taken from a suspension culture. Manual micro-scopic counting is laborious but affords the advantage of allowing cell viability to be determined if a suitable dye is included. Electronic particle counting is a rapid total cell count method for replicate sam-ples, but some data distortion may occur if the sample has significant cell debris or cell aggregates. Image analysis based on the use of digital camera images acquired through a microscope has advanced rapidly with the availability of several commercially available software packages replacing manual microscopic counting and viability determination. Biomass probes detect cells by their dielectric properties or their internal concentration of NADH and can be used as a continuous monitor of the progress of a culture. While the monitoring of cell growth and viability is an integral part of a bioprocess, the monitoring of apoptosis induction is also becoming more and more important in bioprocess control to increase volumet-ric productivity by extending bioprocess duration. Different fluorescent assays allow for the detection of apoptotic characteristics in a cell sample.
Indirect methods of cell determination involve the chemical analysis of a culture component or a measure of metabolic activity. These methods are most useful when it is difficult to obtain intact cell samples. However, the relationship between these parameters and the cell number may not be linear through the phases of a cell culture. The determination of nucleic acid (DNA) or total protein can be used as an estimate of biomass, while the depletion of glucose from the media can be used as an estimate of cellular activity. The state of cellular viability may be measured by the release of an enzyme such as lactate dehydrogenase or more directly from the intracellular adenylate energy charge from cell lysates. Alternatively, radioactive techniques may be used for an accurate determination of cellular protein synthesis.
Key words Hemocytometer, Nuclei counting, Coulter counter, Biomass monitor, Dielectrophoretic (DEP) cytometer, Protein determination, DNA determination, Viability assays, Apoptosis, Flow cytometer
1 Introduction
The growth of mammalian cells in culture can be monitored by a number of parameters related to the increase of cellular biomass over time. The simplest method is by cell counting at regular intervals.
170
In routine cultures, this would be performed once a day, which corresponds to the approximate doubling time of mammalian cells during the exponential growth phase. This would establish an over-all growth profile of a culture. More frequent counts would be required to follow more subtle changes that may, for example, be associated with the cell growth cycle.
The direct cell counting methods that are used routinely are based on visual examination through a microscope or image analyzer or electronically by a particle counter. These methods depend upon obtaining a sample of an even distribution of cells in suspension. Therefore, it is extremely important to ensure that the culture is well mixed by stirring or shaking before taking a sample.
More advanced direct cell counting methods include in situ probes that allow for constant biomass monitoring during an ongoing bioprocess. This provides the advantage of being able to monitor the biomass constantly without sample drawing. Hence, a better control of the bioprocess is possible.
Indirect methods of estimating cell growth rely on the measure-ment of an intracellular cell component such as DNA or protein or alternatively an extracellular change such as nutrient depletion or an enzyme activity released by the cells. Indirect methods of growth estimation depend upon a relationship between the measured parameter and cell concentration. However, it is important to realize that these relationships are rarely linear over the course of a culture. It is well documented that the total protein content and specific enzyme activity levels measured on a per-cell basis vary substantially over the course of a culture due to changes in the growth rate and composition of the culture medium.
In some situations as may occur, for example, in immobilized cell bioreactor systems, an indirect measurement of cell growth may be the only option available. This can be used to monitor the progress of a culture. However, care must be taken if such data is used in comparative analysis between cultures, as differences may be a reflection of changes in metabolic or functional activity rather than of cell concentration.
Viability is a measure of the metabolic state of a cell population, which is indicative of the potential of the cells for growth. One of the simplest assay types is dye exclusion, which is an indication of the ability of the cell membrane to exclude a dye. This may be included in the protocol for microscopic cell counting and for the image analyzer. More sophisticated measures involve the ability of cells for DNA or protein synthesis. A further metabolic assay measures the intracellular adenylate nucleotide concentrations. This allows the determination of the energy charge, which is an index of the metabolic state of the cells. These viability assays are described in Subheading 1.3.
Although viability is a good indicator of the metabolic status of a cell population during a bioprocess, the definition of viability varies
Michael Butler et al.
171
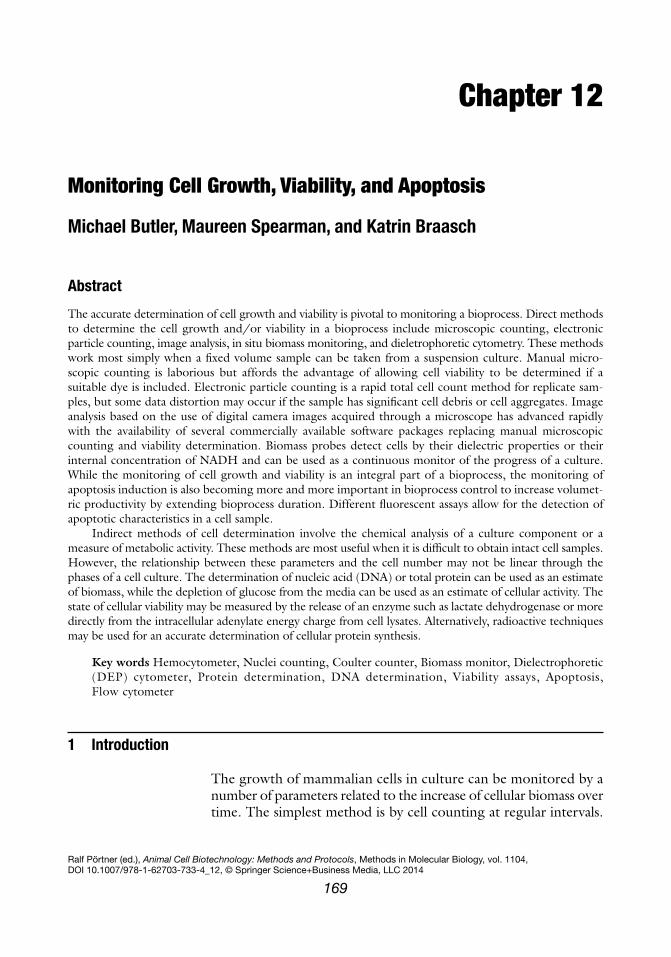
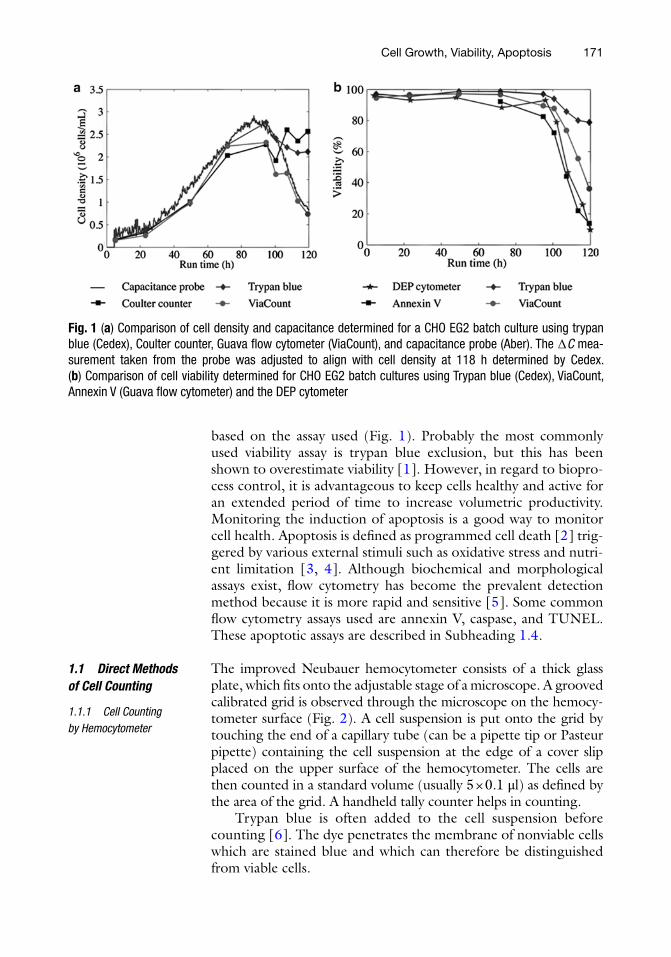
based on the assay used (Fig. 1). Probably the most commonly used viability assay is trypan blue exclusion, but this has been shown to overestimate viability [1]. However, in regard to biopro-cess control, it is advantageous to keep cells healthy and active for an extended period of time to increase volumetric productivity. Monitoring the induction of apoptosis is a good way to monitor cell health. Apoptosis is defined as programmed cell death [2] trig-gered by various external stimuli such as oxidative stress and nutri-ent limitation [3, 4]. Although biochemical and morphological assays exist, flow cytometry has become the prevalent detection method because it is more rapid and sensitive [5]. Some common flow cytometry assays used are annexin V, caspase, and TUNEL. These apoptotic assays are described in Subheading 1.4.
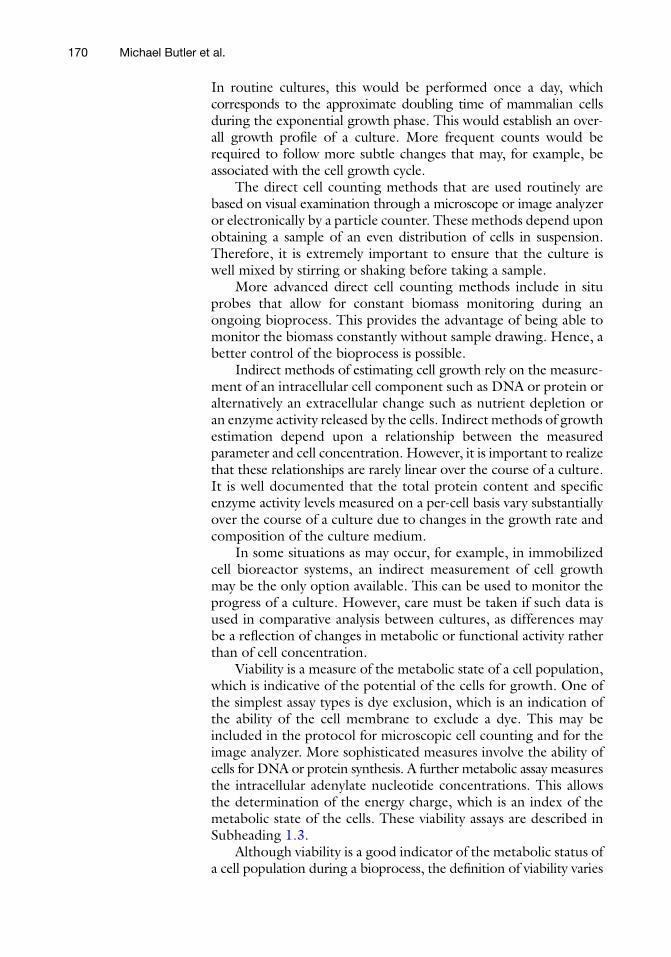
The improved Neubauer hemocytometer consists of a thick glass plate, which fits onto the adjustable stage of a microscope. A grooved calibrated grid is observed through the microscope on the hemocy-tometer surface (Fig. 2). A cell suspension is put onto the grid by touching the end of a capillary tube (can be a pipette tip or Pasteur pipette) containing the cell suspension at the edge of a cover slip placed on the upper surface of the hemocytometer. The cells are then counted in a standard volume (usually 5 × 0.1 μl) as defined by the area of the grid. A handheld tally counter helps in counting.
Trypan blue is often added to the cell suspension before counting [6]. The dye penetrates the membrane of nonviable cells which are stained blue and which can therefore be distinguished from viable cells.
1.1 Direct Methods of Cell Counting
1.1.1 Cell Counting by Hemocytometer
Fig. 1 (a) Comparison of cell density and capacitance determined for a CHO EG2 batch culture using trypan blue (Cedex), Coulter counter, Guava flow cytometer (ViaCount), and capacitance probe (Aber). The ∆C mea-surement taken from the probe was adjusted to align with cell density at 118 h determined by Cedex. (b) Comparison of cell viability determined for CHO EG2 batch cultures using Trypan blue (Cedex), ViaCount, Annexin V (Guava flow cytometer) and the DEP cytometer
Cell Growth, Viability, Apoptosis
172
A modification of the hemocytometer method involves counting nuclei. Incubation of cell samples in a mixture of citric acid and crystal violet causes cells to lyse and the released nuclei to stain purple [7]. Nuclei counting is a well-suited method for the deter-mination of anchorage-dependent cells, for example, when attached to microcarriers.
Macroporous microcarriers such as Cytopore (GE Healthcare) entrap the cells making whole cell removal difficult. Under this condition, nuclei counting is possible [8]. The nuclei are stained with crystal violet, which is added as a hypertonic reagent contain-ing detergent. The reagent causes lysis of cells, and the nuclei are stained during continuous, gentle agitation. To facilitate removal of nuclei from the beads, hydraulic pressure may be applied by forcing the treated microcarriers through a syringe needle. This should be performed in multiple steps until a minimal number of nuclei remain within the microcarriers as observed through a light microscope. The “empty” microcarriers sediment to the bottom of the sample tube. The stained nuclei may be counted in the liquid suspension that remains.
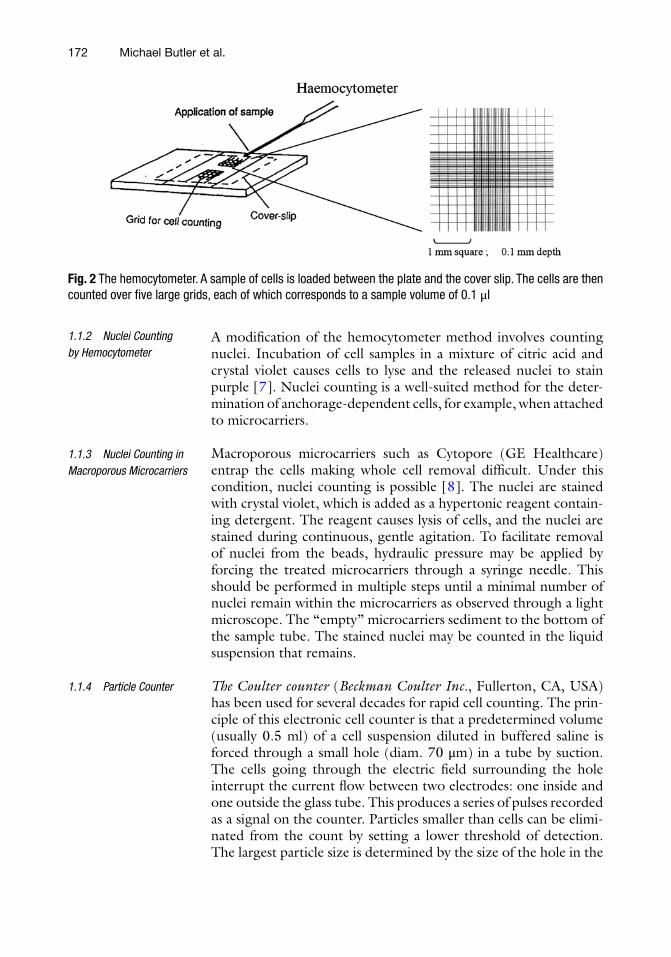
The Coulter counter (Beckman Coulter Inc., Fullerton, CA, USA) has been used for several decades for rapid cell counting. The prin-ciple of this electronic cell counter is that a predetermined volume (usually 0.5 ml) of a cell suspension diluted in buffered saline is forced through a small hole (diam. 70 μm) in a tube by suction. The cells going through the electric field surrounding the hole interrupt the current flow between two electrodes: one inside and one outside the glass tube. This produces a series of pulses recorded as a signal on the counter. Particles smaller than cells can be elimi-nated from the count by setting a lower threshold of detection. The largest particle size is determined by the size of the hole in the
1.1.2 Nuclei Counting by Hemocytometer
1.1.3 Nuclei Counting in Macroporous Microcarriers
1.1.4 Particle Counter
Fig. 2 The hemocytometer. A sample of cells is loaded between the plate and the cover slip. The cells are then counted over five large grids, each of which corresponds to a sample volume of 0.1 μl
Michael Butler et al.
173
tube. Since several cells passing through the sensing field at the same time only count as one signal, the cell sample should be suffi-ciently diluted to avoid underestimating the cell count.
The CASY particle counter (Roche Applied Science, Mannheim, Germany) is an alternative high-resolution counter that combines the resistance measurements of the traditional Coulter counter with pulse area signal processing. Here each cell passes through a capillary in which a change of electrical resistance is recorded. The electrical signal is scanned, and the data from each particle is processed into a series of values that can be interpreted by pulse area analysis. This allows a particle size range to be recorded for each sample that can be interpreted as viable cell, dead cells, cell debris, and cell aggregates.
Several systems are available that are capable of analyzing particles or shapes in a preset field of view through a microscope. This is based on image capture through a charge-coupled device (CCD) camera and transfer of data to suitable software on a computer. Several systems are available commercially. These include the following:
1. Sorcerer Automatic Image Analysis System (Perceptive Instruments, Steeple Bumpstead, Suffolk, UK)
2. MetaMorph Imaging System (Molecular Devices Corp., Sunnyvale, CA, USA)
3. Northern Eclipse Image Analysis (Empix Imaging, Cary, NC, USA)
4. AxioVision (Carl Zeiss Microimaging Inc., Thornwood, NY, USA)
5. Cedex Image Analyzer (Innovatis AG, Bielefeld, Germany)
The standard equipment for image acquisition is a color or monochrome CCD camera with variable zoom and fixed-focus lenses adapted to a standard light microscope. The image is trans-mitted to a computer screen and displayed through the specific software containing processing tools, which allows the operator to choose various parameters for analysis including the particle size and shape for analysis. The images are recognized by virtue of their contrast with the background. Information from such a system includes but is not limited to number, size, and shape of any particles (or cells) in a predefined field of view. The measurements are rapid and can be suitable for replacing manual counting from the field of view of a hemocytometer. The commands through the software allow specific images to be selected or deselected from analysis based upon a number of size or shape parameters. Therefore, such a system can be suitable for the analysis of specific cell types in a mixed population.
1.1.5 Image Analysis
Cell Growth, Viability, Apoptosis
174
Biomass monitors based on measurements of electrical capacitance are commercially available (Aber Instruments, Aberystwyth, Wales and Fogale Nanotech, Nîmes, France). The monitor consists of a sterilizable probe that can be inserted through a headplate port of a bioreactor. The probe incorporates four platinum annular or flush electrodes in an inert polymeric matrix. During operation the probe applies a low-current radio-frequency field within 20–25 mm of the electrodes. Within this field, cells with intact plasma mem-branes can accumulate an electrical charge and act as tiny capaci-tors. The radio-frequency impedance that can be measured from this probe can be converted to measurements of capacitance (pF/cm) or relative permittivity (dimensionless) that have been shown to correlate well with the viable cell concentration in the culture. In addition, the newer biomass monitor 220 can perform a radio- frequency scan from 0.1 to 20 MHz, allowing for additional process parameters to be collected.
The value of this technique is that the dielectric properties monitored are dependent upon cells with an intact plasma membrane. Therefore, the measurements of changes in capacitance can be related directly to the viable cell concentration of the culture. This allows growth profiles to be determined in animal or insect cell cultures where the viability can vary, even if there is a high degree of cell clumping [9]. Furthermore, measurements can be made in microcarrier cultures when off-line cell concentration determina-tions may be difficult [10].
A detailed study of this type of capacitance measurement shows that the cell size and cell metabolism can also influence the values obtained. For hybridomas a good correlation has been shown between the specific capacitance and the specific amount of nucle-otide triphosphates in the cell [11]. Thus, during a batch culture, the cell-specific capacitance changes by as much as 45 % with the highest value occurring at the maximum growth rate.
The presence of reduced NAD (NADH) in the cell enables fluores-cence measurements to be made following excitation with a UV source of light. This property allows cells to be monitored in cul-ture by use of an in situ autoclavable fiber optic-based probe. This provides information about the metabolic activity as well as changes in cell concentration or biomass. Custom Sensors & Technology (CST, Fenton, MO, USA) produces a photometric transmitter and in situ probe for such measurements. The monitor delivers excita-tion energy from a pulsed UV lamp and monitors the amount of fluorescence form the cell culture. The reading is based on the amount of fluorescence from the viable cell suspension compared to a reference signal. In this device, the ratio of fluorescence inten-sity to excitation intensity is scaled over a 4–20 mA output. This probe and photometric transmitter allows continuous monitoring of fluorescence during cell culture and enables a profile of cell growth to be determined.
1.1.6 On-Line Cell Concentration Determination by a Biomass Monitor
1.1.7 On-Line Fluorescence Probe
Michael Butler et al.
175
The dielectrophoretic (DEP) Cytometer prototype was developed at the University of Manitoba (Winnipeg, Canada) [12]. During the measurement with the DEP prototype, a cell suspension diluted in low conductivity medium is passed through a microfluidic channel. While in the channel, individual cells pass over an electrode array, which individually detects and actuates the cells. By detecting the cells before and after they are actuated, a vertical displacement of the cells can be detected, which is in direct relation to the cell’s polarizability. This in turn has been shown to be related to the cell’s metabolic health and can be used as a direct measurement of the viability of a cell population.
There are a number of colorimetric methods based on the mea-surement of cell components. These are relatively simple methods and suitable for multiple samples. However, the contents of cells can vary dramatically during culture. For example, the protein and enzyme content per cell will be high during exponential growth but lower in the lag or stationary phases.
Total cell protein can be used as a measure of biomass (total cellular material). The protein content of a mammalian cell is typically 100–500 pg/cell. These measurements are also useful in the deter-mination of specific enzyme activities, which are commonly expressed as the maximum measured reaction velocity of an enzyme per total cell protein.
The most common colorimetric assays are the Lowry and Bradford methods. Of these the Bradford assay is favored because of speed, sensitivity, and negligible interference from other cell components [13]. By this method, lysed cells are added to the reagent, Coomassie blue. A blue color, which develops within 10 min, can be measured by a colorimeter or spectrophotometer and compared with standard proteins.
A commonly used protocol involves treatment of the solubilized cells with fluorescent reagents that bind to DNA. Fluorescence detection offers high sensitivity with reagents such as Hoechst 33258 [14] or 4′,6-diamidino-2-phenylindole (DAPI [15]) from Sigma-Aldrich.
Cell growth can be monitored by changes in the concentration of key components of the culture medium. The rate of change in the glucose content of the medium may be suitable for such an assay as an indirect measure of cell concentration. Alternatives include measurement of lactic acid production or oxygen consumption.
Correlations have been shown between cell concentration and rates of consumption or production of these components. This relationship may be constant for a particular cell line under a given
1.1.8 The Dielectrophoretic (DEP) Cytometer
1.2 Indirect Methods of Cell Determination
1.2.1 Protein Determination
1.2.2 DNA Determination
1.2.3 Glucose Determination
Cell Growth, Viability, Apoptosis
176
set of conditions. However, if the cell line or any of the culture conditions are altered, the relationship between substrate con-sumption or product formation and cell number will change.
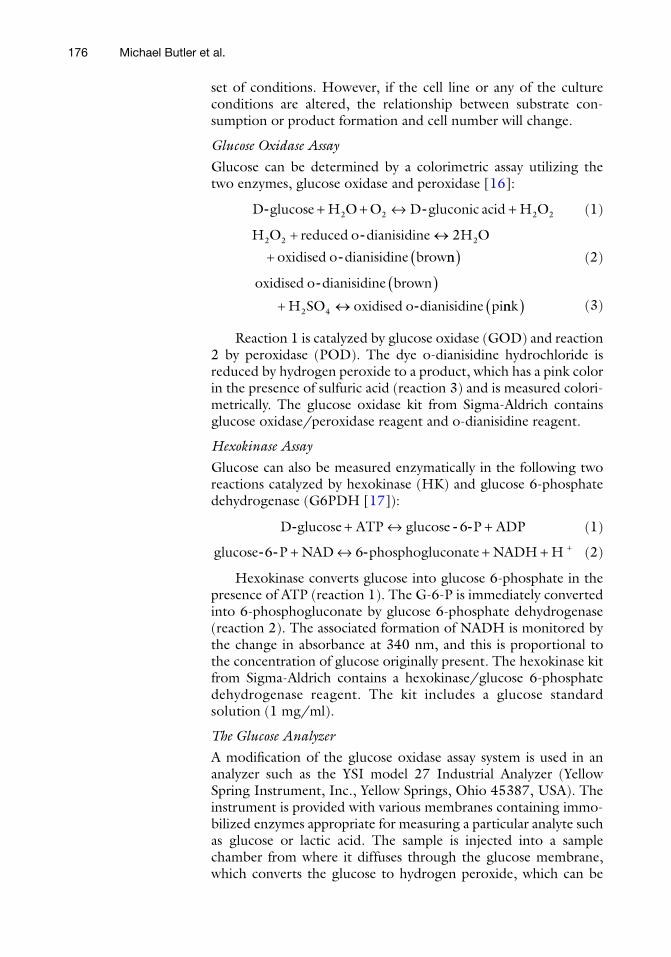
Glucose Oxidase AssayGlucose can be determined by a colorimetric assay utilizing the two enzymes, glucose oxidase and peroxidase [16]:
D H O O D H O- -glucose gluconic acid+ + ↔ +2 2 2 2 (1)
H O o H O
o2 2 22+ «
+
reduced dianisidine
oxidised dianisidine brow
-
- nn( ) (2)
oxidised dianisidine brown
H SO oxidised dianisidine pi
o
o
-
-
( )+ «2 4 nnk( ) (3)
Reaction 1 is catalyzed by glucose oxidase (GOD) and reaction 2 by peroxidase (POD). The dye o-dianisidine hydrochloride is reduced by hydrogen peroxide to a product, which has a pink color in the presence of sulfuric acid (reaction 3) and is measured colori-metrically. The glucose oxidase kit from Sigma-Aldrich contains glucose oxidase/peroxidase reagent and o-dianisidine reagent.
Hexokinase AssayGlucose can also be measured enzymatically in the following two reactions catalyzed by hexokinase (HK) and glucose 6- phosphate dehydrogenase (G6PDH [17]):
D P- - -glucose ATP glucose ADP+ ↔ +6 (1)
glucose NAD phosphogluconate NADH- - -6 6P H+ ↔ + + + (2)
Hexokinase converts glucose into glucose 6-phosphate in the presence of ATP (reaction 1). The G-6-P is immediately converted into 6-phosphogluconate by glucose 6-phosphate dehydrogenase (reaction 2). The associated formation of NADH is monitored by the change in absorbance at 340 nm, and this is proportional to the concentration of glucose originally present. The hexokinase kit from Sigma-Aldrich contains a hexokinase/glucose 6-phosphate dehydrogenase reagent. The kit includes a glucose standard solution (1 mg/ml).
The Glucose AnalyzerA modification of the glucose oxidase assay system is used in an analyzer such as the YSI model 27 Industrial Analyzer (Yellow Spring Instrument, Inc., Yellow Springs, Ohio 45387, USA). The instrument is provided with various membranes containing immo-bilized enzymes appropriate for measuring a particular analyte such as glucose or lactic acid. The sample is injected into a sample chamber from where it diffuses through the glucose membrane, which converts the glucose to hydrogen peroxide, which can be
Michael Butler et al.
177
determined by a sensor system based on a Clark electrode. The latter consists of a platinum electrode, which measures the hydrogen peroxide amperometrically:
H O H O e2 2 22 2« + ++ -
(1)
AgCl Ag Cl+ « +- -e (2)
Current flow in the platinum anode is linearly proportional to the local concentration of hydrogen peroxide. This electrode is maintained at an electrical potential of 0.7 V with respect to a silver/silver chloride reference electrode, the potential of which is deter-mined by reaction 2 above. The signal current, which is propor-tional to the quantity of injected glucose, is converted to a voltage by the instrument circuitry.
Viability is a measure of the proportion of live, metabolically active cells in a culture, as indicated by the ability of cells to divide or to perform normal metabolism. The viability is measured by an indi-cator of the metabolic state of the cells (such as energy charge) or by a functional assay based on the capacity of cells to perform a specific metabolic function.
A viability index may be determined from simple assays such as dye exclusion where cells are designated as either viable or non- viable. The index is usually expressed as a % of viable cells in a population:
viability index = (number of viable cells/total number of cells) × 100.
Cell counting by hemocytometer or image analyzer as described earlier in this chapter can be adapted to measure viability. The most common is the dye exclusion method in which loss of viability is recognized by membrane damage resulting in the penetration of the dye, trypan blue. Other dyes that can be used include erythro-sin B, nigrosin, and fluorescein diacetate.
The tetrazolium assay is a measure of cellular oxidative metabo-lism. The tetrazolium dye MTT (3-(4,5-dimethylthiazol-2-yl)-2,5-diphenyltetrazolium bromide) is cleaved to a colored product by the activity of NAD(P)H-dependent dehydrogenase enzymes, and this indicates the level of energy metabolism in cells [18]. The color development (yellow to blue) is proportional to the number of metabolically active cells. The assay response may vary consider-ably between cell types. Cells of biotechnological importance such as CHO cells and hybridomas can be monitored with the MTT assay.
The most precise of all the methods of viability measurement is the colony-forming assay. Here the ability of cells to grow is measured directly [19]. A known number of cells at low density are allowed to attach and grow on the surface of petri dish. If the cell density is kept low, each viable cell will divide and give rise to a colony or
1.3 Viability Measurements
1.3.1 Dye Exclusion
1.3.2 Tetrazolium Assay
1.3.3 Colony-Forming Assay
Cell Growth, Viability, Apoptosis
178
cluster of cells. From this the “plating efficiency” is determined as the number of colonies scored per 100 cells plated × 100. Although the colony-forming assay is time-consuming, it has been widely used in cytotoxicity studies.
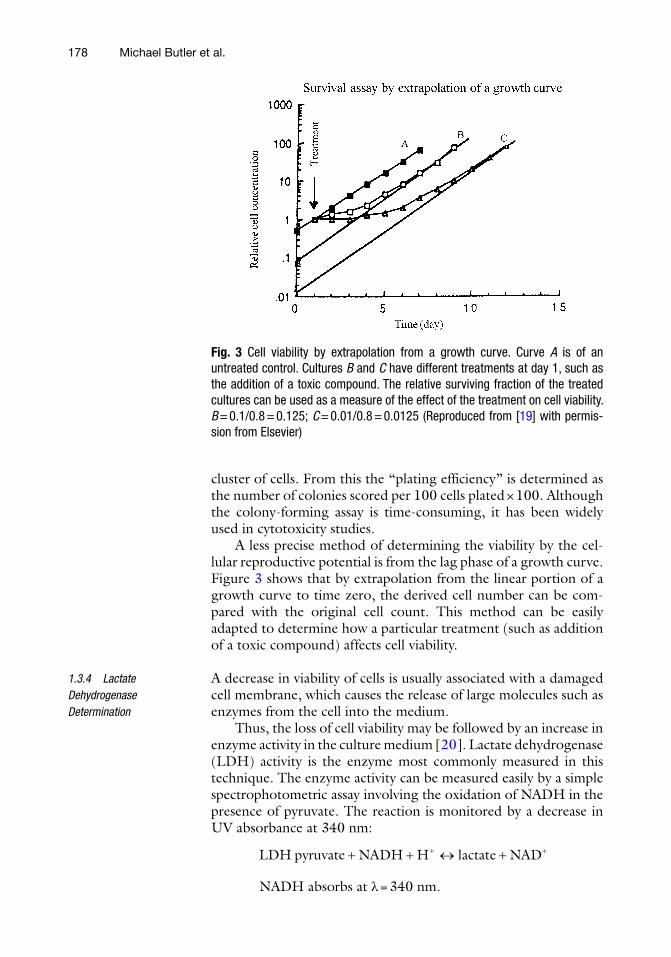
A less precise method of determining the viability by the cel-lular reproductive potential is from the lag phase of a growth curve. Figure 3 shows that by extrapolation from the linear portion of a growth curve to time zero, the derived cell number can be com-pared with the original cell count. This method can be easily adapted to determine how a particular treatment (such as addition of a toxic compound) affects cell viability.
A decrease in viability of cells is usually associated with a damaged cell membrane, which causes the release of large molecules such as enzymes from the cell into the medium.
Thus, the loss of cell viability may be followed by an increase in enzyme activity in the culture medium [20]. Lactate dehydrogenase (LDH) activity is the enzyme most commonly measured in this technique. The enzyme activity can be measured easily by a simple spectrophotometric assay involving the oxidation of NADH in the presence of pyruvate. The reaction is monitored by a decrease in UV absorbance at 340 nm:
LDH pyruvate NADH lactate NAD+ + « ++ +H
NADH absorbs at λ = 340 nm.
1.3.4 Lactate Dehydrogenase Determination
Fig. 3 Cell viability by extrapolation from a growth curve. Curve A is of an untreated control. Cultures B and C have different treatments at day 1, such as the addition of a toxic compound. The relative surviving fraction of the treated cultures can be used as a measure of the effect of the treatment on cell viability. B = 0.1/0.8 = 0.125; C = 0.01/0.8 = 0.0125 (Reproduced from [19] with permis-sion from Elsevier)
Michael Butler et al.

179
The adenylate energy charge (AEC) is an index based on the measurement of the intracellular levels of the nucleotides, AMP, ADP, and ATP:
AEC = ([ATP] + 0.5 × [ADP])/([ATP] + [ADP] + [AMP]).
It is based on the interconversion of the three adenylate nucle-otides in the cell: AMP ↔ ADP ↔ ATP. This index varies between the theoretical limits of 0 and 1. For normal cells, values of 0.7 to 0.9 would be expected, but a gradual decrease in the value gives an early indication of loss of viability by a cell population.
These nucleotide concentrations can be measured by chroma-tography (HPLC) or by luminescence using the luciferin-luciferase enzyme system [21, 22]. The luminescence assay is dependent upon the emission of light resulting from the enzymatic oxidation of luciferin, a reaction requiring ATP:
ATP + LH2 + O2 ↔ AMP + PPi + CO2 + L + lightADP and AMP can also be measured by the luciferase assay after
conversion to ATP by coupled enzymatic reactions:Pyruvate kinase: ADP + PEP ↔ ATP + pyruvateMyokinase: AMP + CTP ↔ ADP + CDP
The rate of protein synthesis of intact cells can be measured by incubation in standard culture medium to which a radioactively labelled amino acid is added. Any radioactive amino acid is suitable, but those most commonly used are 3H-leucine or 35S-methionine.
Apoptosis detection is a measure of the proportion of cells going through early-, mid-, or late-stage apoptosis. The different stages are identified based on the detection of stage-specific structures and proteins labelled by fluorescent probes. The methods described below include general staining procedures.
In the early stage of apoptosis, cells lose their ability to maintain membrane phospholipid asymmetry. Because of this, phosphatidyl-serine (PS) is increasingly exposed on the outer membrane of the cell and not on the inner membrane surface as normally expected [23]. The exposed PS molecule can be labelled with annexin V molecules conjugated with a fluorescent dye, such as fluorescein isothiocyanate (FITC) [24] or R-phycoerythrin (PE). In addition the cell sample is stained with propidium iodide (PI) or 7- aminoactinomycin D (7-AAD) to further distinguish between early apoptotic and necrotic cells, which may also be stained by annexin V due to membrane injury. In the method (Subheading 3.15), a general staining procedure is described, but commercial kits for detection of PS externalization are also avail-able (e.g., Millipore, Fig. 4).
1.3.5 Intracellular Adenylate Energy Charge
1.3.6 Rate of Protein Synthesis
1.4 Apoptosis Detection
1.4.1 Annexin V
Cell Growth, Viability, Apoptosis
180
Several caspase proteins play a role in the apoptotic pathway by initiating the apoptotic cascade, causing cellular breakdown and processing cytokines. These can be detected by fluorescently label-ling the activated caspase proteins either by an antibody against a fragment of the specific caspase [25] or by using an inhibitor of multiple caspases such as sulforhodamine-valyl-alanyl-aspartyl-fluoromethyl- ketone (SR-VAD-FMK) [26]. In both cases, the antibody or SR-VAD-FMK are fluorescently labelled using a fluo-rochrome. The method described (Subheading 3.16) is designed specifically for the detection of caspase-3 activation. However, fluorescent- labelled antibodies against other caspase proteins are also available and can be used interchangeably in the protocol. In addition, commercial kits are available (e.g., Millipore), which use a caspase inhibitor with an active site-binding peptide allowing for the detection of specific or multiple active caspase proteins.
One of the basic biochemical assays of apoptosis is DNA gel elec-trophoresis to detect DNA laddering that occurs during late-stage apoptosis. This can also be observed by labelling the exposed
1.4.2 Caspase
1.4.3 TUNEL
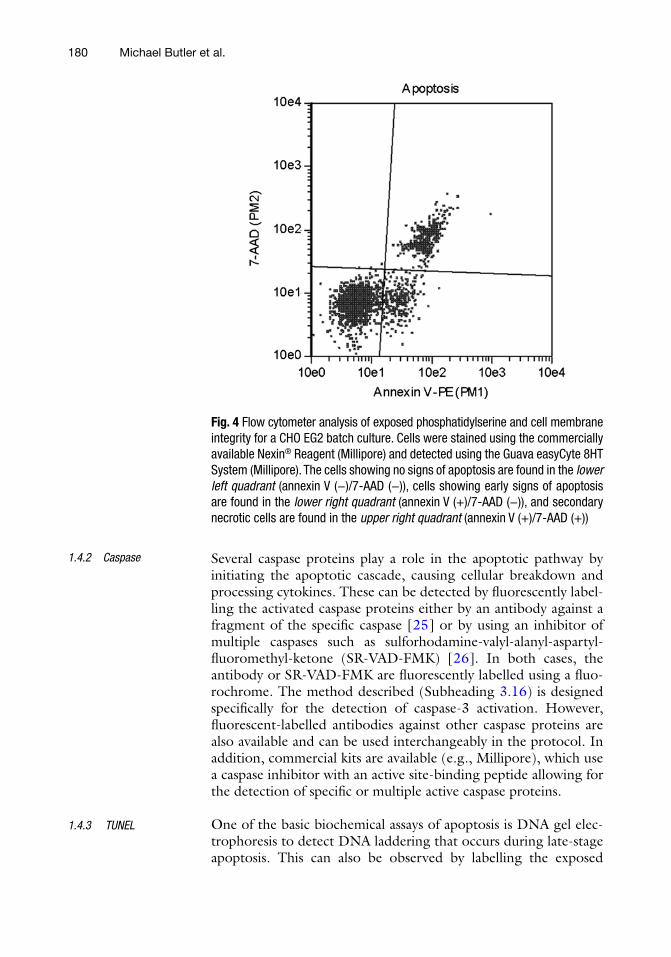
Fig. 4 Flow cytometer analysis of exposed phosphatidylserine and cell membrane integrity for a CHO EG2 batch culture. Cells were stained using the commercially available Nexin® Reagent (Millipore) and detected using the Guava easyCyte 8HT System (Millipore). The cells showing no signs of apoptosis are found in the lower left quadrant (annexin V (−)/7-AAD (−)), cells showing early signs of apoptosis are found in the lower right quadrant (annexin V (+)/7-AAD (−)), and secondary necrotic cells are found in the upper right quadrant (annexin V (+)/7-AAD (+))
Michael Butler et al.
181
3′hydroxyl ends of the fragmented DNA. Before cells can be fluorescently labelled, they must be fixed and permeabilized [27]. Terminal deoxynucleotidyl transferase (TdT) [27] or DNA poly-merase [28] is then used to catalyze the incorporation of fluores-cein, digoxigen in, biotin, or 5-bromo-conjugated nucleotide triphosphate (usually uridine) at the 3′hydroxyl end of the frag-mented DNA. The fluorescein-conjugated nucleotide triphosphate can be detected directly. Biotin-dUTP can be detected by labelled streptavidin or avidin, whereas digoxigen in -dUTP or Br-dUTP can be detected using their respective labelled antibodies [29, 30]. In Subheading 3.17 we describe a general staining procedure using biotin-dUTP, which is then labelled with fluoresceinated avidin. Commercial kits for the TUNEL assay are available taking advantage of the different mechanisms described above (e.g., Millipore—Br-dUTP).
2 Materials
1. Phosphate-buffered saline: 0.1 M NaCl, 8.5 mM KCl, 0.13 M Na2HPO4, 1.7 mM KH2PO4, pH 7.4.
2. Trypan blue reagent: 0.4 % w/v trypan blue (Invitrogen).
Crystal violet reagent: 0.1 % w/v crystal violet in 0.1 M citric acid.
Crystal violet reagent: 0.2 % w/v crystal violet and 2 % w/v Triton/X-100 in 0.2 M citric acid.
1. Saline solution: 0.7 % NaCl, 1.05 % citric acid, 0.1 % mercuric chloride in distilled water.or
2. Phosphate-buffered saline: 0.1 M NaCl, 8.5 mM KCl, 0.13 M Na2HPO4, 1.7 mM KH2PO4, pH 7.4, containing 1 mM EDTA.
3. Coulter counter (Beckman-Coulter Inc.,).
Bradford’s reagent: Dissolve 100 mg of Coomassie Brilliant Blue G (Sigma-Aldrich) in 95 % ethanol (50 ml) and 85 % phosphoric acid (100 ml). After the dye dissolves, make the solution up to 1 l with distilled water. Alternatively, a dye (Coomassie) reagent liquid concentrate can be purchased from Bio-Rad.
1. Buffer: 0.05 M NaPO4, 2.0 M NaCl, 2 mM EDTA pH 7.4. 2. Hoechst reagent: 0.1 μg/ml Hoechst 33258 in buffer. 3. Standard DNA solution: 8 mg/ml of calf thymus DNA (Sigma-
Aldrich) in distilled water.
2.1 Cell Counting by Hemocytometer
2.2 Nuclei Counting by Hemocytometer
2.3 Nuclei Counting in Macroporous Microcarriers
2.4 Particle Counter
2.5 Protein Determination
2.6 DNA Determination/Hoechst Method
Cell Growth, Viability, Apoptosis
182
1. Buffer: 5 mM HEPES, 10 mM NaCl pH 7. 2. DAPI reagent: A stock solution (×100) contains 300 mg DAPI
(4′,6-diamidino-2-phenylindole) in buffer. 3. Standard DNA solution: 8 mg/ml of calf thymus DNA (Sigma-
Aldrich) in distilled water.
1. Glucose oxidase/peroxidase reagent: Dissolve the contents of a reagent capsule from Sigma in 39.2 ml of distilled water. Each capsule contains 500 U of glucose oxidase and 100 U of peroxidase.
2. o-Dianisidine reagent: Dissolve the contents of a vial of o- dianisidine (Sigma-Aldrich) in 1 ml of dissolved water. Each vial contains 5 mg of o-dianisidine dihydrochloride.
3. Assay reagent: Mix 0.8 ml of o-dianisidine reagent with 39.2 ml of glucose oxidase/peroxidase reagent.
4. Glucose standard solution: 1 mg/ml of d-glucose. 5. 12 M Sulfuric acid.
1. Glucose (HK) assay reagent: Dissolve the contents of a reagent vial (Sigma-Aldrich) into 20 ml of distilled water. The dissolved reagent contains 1.5 mM NAD, 1.0 mM ATP, 1 U/ml hexoki-nase, and 1 U/ml glucose 6-phosphate dehydrogenase.
2. Glucose standard solution: 1 mg/ml of d-glucose.
1. YSI model 27 Industrial Analyzer (Yellow Spring Instrument, Inc., Yellow Springs, Ohio 45387, USA).
2. Glucose standard solution: 2–5 g/l of d-glucose.
1. Tris–HCl (0.2 M) pH 7.3. 2. NADH (6.6 mM). 3. Sodium pyruvate (30 mM). 4. Standard LDH enzyme (Sigma-Aldrich). 5. Spectrophotometer with a UV wavelength of 340 nm.
1. MTT reagent: 5 mg/ml of the tetrazolium dye (Sigma-Aldrich), MTT (3-(4,5-dimethylthiazol-2-yl)-2,5-diphenyltet-razolium bromide) in phosphate-buffered saline (PBS) pH 7.4.
2. SDS reagent: 10 % w/v sodium dodecyl sulfate (SDS), 45 % w/v N,N-dimethyl formamide in water adjusted to pH 4.5 with glacial acetic acid.
1. ATP monitoring reagent/ATP-MR (Bio-Orbit, P.O. Box 36, 20521 Turku, 52 Finland) contains a lyophilized mixture of firefly luciferase, d-luciferin, bovine serum albumin, magnesium
2.7 DNA Determination/DAPI Method
2.8 Glucose Determination/Glucose Oxidase Assay
2.9 Glucose Determination/Hexokinase Assay
2.10 The Glucose Analyzer
2.11 Lactate Dehydrogenase Determination
2.12 Viability/Tetrazolium Assay
2.13 Intracellular Energy Charge
Michael Butler et al.
183
acetate, and inorganic pyrophosphate. Reconstitute each vial with 4 ml buffer plus 1 ml potassium acetate (1 M).
2. ATP standards (Bio-Orbit): ATP (0.1 μmol) and magnesium sulfate (2 μmol).
3. Buffer: 0.1 M Tris–acetate pH 7.75. 4. PK-PEP reagent: 55 μl tricyclohexylammonium salt of phos-
phoenolpyruvate (0.2 M) + 50 μl pyruvate kinase (500 U/mg) in Tris buffer.
5. MK-CTP reagent: 95 μl myokinase (2,500 U/mg) + 10 μl CTP (110 mM) in Tris buffer.
1. 3H-leucine or 35S-methionine (GE Healthcare) at a 200–400 μCi/ml.
2. Trichloroacetic acid/TCA (5 %). 3. Phosphate-buffered saline. 4. NCS™ tissue solubilizer (GE Healthcare). 5. Radioactivity scintillation counter.
1. Annexin V-fluorescein isothiocyanate (FITC) (BD Biosciences). 2. Propidium iodide (PI) (Sigma-Aldrich): 10 ml of 1 mg/ml in
PBS. 3. Binding buffer: 10 mM hydroxyethyl piperazine ethane sulfo-
nate/NaOH, pH 7.4, 140 mM NaCl, 2.5 mM CaCl2. 4. Flow cytometer. 5. Centrifuge.
1. Phosphate-buffered saline (PBS), without Ca2+ and Mg2+, pH 7.2.
2. Cytofix/CytopermTM solution (BD Biosciences) or 4 % paraformaldehyde stock solution (Sigma). To reach final concentration of 1 % dilute in PBS.
3. 10 % Perm/WashTM buffer (BD Biosciences) to make a final concentration of 1 % in distilled water.
4. Anti-caspase-3-phycoerythrin (PE) (BD Biosciences) or anti-caspase- 3 FITC antibody (BD Biosciences).
5. Flow cytometer. 6. Centrifuge.
1. Phosphate-buffered saline (PBS), without Ca2+ and Mg2+, pH 7.2.
2. Cytofix/CytopermTM solution (BD Biosciences) or 4 % para-formaldehyde stock solution (Sigma-Aldrich) to a final con-centration of 1 % dilute in PBS.
2.14 Rate of Protein Synthesis
2.15 Annexin V
2.16 Caspase 3
2.17 TUNEL
Cell Growth, Viability, Apoptosis

184
3. Reaction mixture: 0.1 M Na-cacodylate, pH 7.0, 0.1 mM dithiothreitol, 0.05 mg/l bovine serum albumin (BSA), 2.5 mM CaCl2, 0.4 mM bio-16-d uridine triphosphate (UTP), and 0.1 U/ml terminal deoxynucleotidyl transferase (TdT) enzyme (Roche).
4. Staining buffer: 2.5 mg/ml fluoresceinated avidin, 4× concen-trated saline-sodium citrate buffer, 0.1 % Triton X-100, and 5 % low-fat dry milk (Roche).
5. Centrifuge. 6. Flow cytometer.
3 Methods
1. Add an equal volume of trypan blue reagent to a cell suspen-sion and leave for 2 min at room temperature.
2. Introduce a sample into the hemocytometer chamber by a Pasteur pipette.
3. Count cells on each of the five grid blocks defined by triple lines in the hemocytometer chamber (see Note 1).
4. Determine the cell concentration (cells/ml) in the original sample = (2 × total count/5) × 104.
(The calculation is based upon the volume of each grid block = 0.1 μl.)
The percentage of cells that are not stained with trypan blue is a measure of the viability.
1. Allow microcarriers from a culture sample (1 ml) to settle to the bottom of a centrifuge tube.
2. Remove clear supernatant by aspiration. The supernatant can be checked microscopically for any non-attached cells.
3. Add 1 ml of crystal violet reagent. 4. Incubate at 37 °C for at least 1 h. 5. Introduce a sample into the hemocytometer chamber and
count the purple-stained nuclei as for whole cells (see Note 2).
1. Remove 0.5 ml of a microcarrier suspension from the culture while stirring.
2. Add 0.5 ml of crystal violet reagent. 3. Incubate at 37 °C for up to 2–3 h with gentle agitation to lyse
the cells and stain the exposed nuclei. 4. Remove the nuclei from macroporous microcarriers by aspirating
the whole solution through a 25 g (1.5″) needle with a 1 or
3.1 Cell Counting by Hemocytometer
3.2 Nuclei Counting by Hemocytometer
3.3 Nuclei Counting in Macroporous Microcarriers
Michael Butler et al.
185
3 ml syringe. Repeat this between 20 and 25 times until all the stained nuclei are cleared form the microcarriers (see Note 3).
5. Step 4 is continued until all nuclei are removed from the microcarriers. This is determined by taking a sample (0.1 ml) of the suspension of reagent-treated microcarriers. The reagent is removed by decanting, and the microcarriers are washed two or three times with 1 ml of PBS, allowing the microcarriers to settle between washes. A sample of the microcarrier suspension is visually inspected under the microscope on a slide to ensure that there are no remaining nuclei (see Note 4).
6. Allow the beads to settle. Then introduce a portion of the remaining suspension of nuclei into the hemocytometer cham-ber and count the purple-stained nuclei as for whole cells.
1. Add 0.5 ml of a cell suspension (105–106 cells/ml) to 19.5 ml of the saline solution.
2. Introduce the suspension into a Coulter counter. 3. From standard settings of the counter, 0.5 ml of the suspen-
sion is counted. Multiply this count by ×40 to give the original cell concentration (see Note 5).
1. Homogenize or sonicate a cell suspension (106 cells/ml). 2. Add 5 ml Bradford’s reagent to 100 μl of the lysed cell sample
(0–0.5 mg/ml protein). 3. Incubate for 10 min at room temperature. 4. Measure the absorbance at 595 nm. 5. Determine the sample concentrations from a standard curve,
which is established from standard solutions of bovine serum albumin (BSA) at 0–0.5 mg/ml protein.
1. Homogenize or sonicate to lyse a cell suspension (105 cells/ml) in buffer.
2. Dilute lysate or standard DNA solution 1 in 10 in Hoechst reagent.
3. Measure fluorescence with an excitation λ of 356 nm and emis-sion λ of 492 nm.
4. Determine DNA concentration by reference to standard DNA.
1. Homogenize or sonicate to lyse a cell suspension (105 cells/ml). 2. Dilute 150 μl lysed cell suspension with 850 μl buffer. 3. Prepare a DAPI solution (×10) by diluting 100 μl of DAPI
stock solution with 900 μl of buffer and mix well. Prepare a DAPI working solution by adding 0.5 ml of DAPI (×10) to 4.5 ml of buffer.
3.4 Particle Counter
3.5 Protein Determination
3.6 DNA Determination/Hoechst Method
3.7 DNA Determination/DAPI Method
Cell Growth, Viability, Apoptosis
186
4. Add 50 μl of DAPI working solution to each cell suspension or standard DNA (up to 0.8 μg) in a tube, which is kept dark by a foil cover.
5. Vortex the tubes and let stand for 30 min. 6. Measure fluorescence with an excitation λ of 372 nm and emis-
sion λ of 454 nm. 7. Determine DNA concentration by reference to the standard
DNA (see Note 6).
1. Start the reaction by adding 2 ml of assay reagent to glucose standard or culture media supernatant (0.01–0.1 ml). Make the assay volume up to 3 ml with distilled water.
2. Allow the reaction to proceed for 30 min at 37 °C. 3. Stop the reaction by adding 2 ml of 12 M H2SO4. 4. Measure the absorbance at 540 nm. 5. Determine the glucose concentration of the media samples
against a standard value obtained with the glucose solution.
1. Mix 10–200 μl of standard glucose solution or sample of cul-ture media with 1 ml of assay reagent. Make the total assay volume up to 2 ml with distilled water.
2. Incubate at room temperature for 15 min. 3. Measure the absorbance at 340 nm. 4. Determine the glucose concentration of the media samples
against a standard value obtained with the glucose solution (see Note 7).
1. Fit the appropriate membrane into the analyzer for glucose analysis.
2. Calibrate the instrument with standard glucose solutions (2–5 g/l).
3. Inject 25 μl of a cell-free sample of culture supernatant into the instrument and compare with standard readings (see Notes 8 and 9).
1. Remove the media from adherent cells in a multi-well plate and add 0.1 ml MTT reagent. Alternatively, add 0.1 ml MTT reagent to a 1 ml cell suspension in PBS.
2. Incubate for 2 h at 37 °C. 3. Add 600 μl of SDS reagent and mix to solubilize the formazan
crystals. 4. Measure the absorbance at 570 nm (see Notes 10–12).
3.8 Glucose Determination/Glucose Oxidase Assay
3.9 Glucose Determination/Hexokinase Assay
3.10 The Glucose Analyzer
3.11 Viability/Tetrazolium Assay
Michael Butler et al.
187
1. Mix 2.8 ml Tris–HCl (0.2 M) pH 7.3, 0.1 ml NADH (6.6 mM), and 0.1 ml sodium pyruvate (30 mM) in a cuvette.
2. Preincubate for 5 min at the desired reaction temperature (25 or 37 °C).
3. Start reaction by adding 50 μl of sample or standard LDH enzyme (Sigma-Aldrich).
4. Record enzyme activity as an absorbance decrease at 340 nm (see Note 13).
1. Extract soluble nucleotides by addition of 0.1 ml perchloric acid (20 % v/v) to 1 ml of a cell culture sample (106 cells/ml).
2. Place on ice for 15 min and centrifuge for 5 min at 10,000 × g. 3. Remove supernatant and neutralize with 5 M KOH. 4. For ATP determination: Mix 860 μl buffer, 100 μl ATP-MR,
and 10 μl sample. 5. For ADP determination: Add a further 10 μl PK-PEP. 6. For AMP determination: Add a further 10 μl MK-CTP. 7. For standardization: Add a further 10 μl ATP standard. 8. Measure the light emission in a luminometer (e.g., LKB 1250)
after 1 min of each stage of addition (see Note 14).
1. Add 3H-leucine or 35S-methionine at a final specific activity of 20–40 μCi/ml to cell suspension at 5–10 × 106 cells/ml.
2. Remove 5–10 × 105 cells at each time point up to 4–6 h. 3. Isolate cell pellet by centrifugation in a microcentrifuge tube
and wash in PBS. 4. Precipitate protein by addition of 500 μl trichloroacetic acid/
TCA (5 %) containing unlabelled amino acids. 5. Wash the protein precipitate three times in the TCA solution. 6. Add 30 μl NCS™ tissue solubilizer to the pellet and leave for
60 min. 7. Cut tip of tube and place in scintillation fluid for radioactive
counting (see Note 15).
1. Centrifuge cell sample (1 × 10⁵ cells) at 180 × g for 5 min. 2. Resuspend cell pellet in 100 ml of binding buffer after remov-
ing supernatant. 3. Add 5 μl of annexin V-FITC (1–3 mg/ml) and 10 μl of PI
(50 μg/ml). 4. Vortex sample gently and incubate for 15 min at room tem-
perature in the dark. 5. Add 400 μl of binding buffer.
3.12 Lactate Dehydrogenase Determination
3.13 Intracellular Energy Charge
3.14 Rate of Protein Synthesis
3.15 Annexin V (See Note 16)
Cell Growth, Viability, Apoptosis
188
6. Analyze sample within 1 h by flow cytometry using 515–545 nm (FITC detection) and 620–640 (PI emission) (see Note 17).
1. Take cell sample (1 × 10⁶ cells) and centrifuge for 5 min at 180 × g.
2. Remove supernatant and resuspend cell pellet in PBS. 3. Centrifuge cells at 180 × g for 5 min. 4. Fix cells with cold 500 μl Cytofix/CytopermTM for 20 min. 5. For immediate analysis, proceed to step 6. Cells can be stored
at this point at 4 °C in 500 μl solution (PBS containing 2 % fetal bovine serum and 0.09 % NaAzide) for later analysis.
6. Centrifuge cells at 180 × g for 5 min. 7. Prepare 1× Perm/WashTM buffer and keep on ice. 8. Resuspend pellet in Perm/WashTM buffer and centrifuge at
4 °C. 9. Resuspend cell pellet in 500 μl of Perm/WashTM buffer before
adding 20 μl of anti-caspase-3-phycoerythrin (PE) or fluores-cein isothiocyanate (FITC) antibody.
10. Incubate in the dark at 4 °C for 30 min. 11. Analyze using flow cytometer by emission at 670 nm (PE) or
515–540 nm (FITC) (see Note 18).
1. Remove cell sample (5 × 10⁵ cells) and centrifuge at 180 × g for 5 min.
2. Remove supernatant and resuspend cell pellet in 1 ml PBS. 3. Centrifuge cell sample at 180 × g for 5 min. 4. Remove supernatant and resuspend cell pellet using 1 ml of
Cytofix/Cytoperm™ to fix cells. 5. Incubate sample at 4 °C for 20 min. 6. Centrifuge fixed cells for 5 min at 180 × g. 7. Remove supernatant before resuspending cell pellet in reaction
mixture. 8. Incubate sample for 30 min at 37 °C. 9. Centrifuge cell sample for 5 min at 180 × g. 10. Remove supernatant and resuspend cell pellet in 100 μl of
staining buffer. 11. Incubate sample for 30 min in the dark at room temperature. 12. Centrifuge sample for 5 min at 180 × g. 13. Remove supernatant and resuspend cell pellet in 500 μl PBS. 14. Analyze using flow cytometer by emission at 515–545 nm
(see Note 18).
3.16 Caspase 3 (See Note 16)
3.17 TUNEL (See Note 16)
Michael Butler et al.
189
4 Notes
1. The hemocytometer counting method is the most commonly used assay for cell viability. The method is simple and effective but can be laborious for multiple samples. At least 100 cells should be counted for statistical validity of the final value.
2. Care must be taken in interpreting nuclei counts as cells can become binucleated, particularly when growth is arrested. As a result, the nuclei concentration may be higher than the cell concentration [31].
3. The number of aspirations required to remove the nuclei from the microcarriers is dependent on the cell density within each bead. Cultures of CHO cells with 1 × 10⁶ nuclei/ml (or 300 nuclei/bead) require only 20 aspirations for 99 % removal of nuclei from the beads. At a later stage of the same culture with a higher cell density of 1.75 × 10⁶ nuclei/ml (or 515 nuclei/bead), 25 aspirations were required to remove 98 % of the nuclei. Therefore, higher cell densities may require more strin-gent conditions for removal [8].
4. The incubation time and number of needle aspirations needed to completely remove all nuclei may vary between cell types. The method described was used with CHO cells; however, other cell types may require more or less stringent conditions [8].
5. The major advantage of the Coulter counter method is the speed of analysis and is therefore suitable for counting a large number of samples. The method is based upon the number of particles contained in suspension, and consequently, the pro-portion of viable cells in the sample cannot be determined. It must be ensured that cell aggregates are not present in the sample; otherwise, the cell count will be underestimated. The Coulter counter can also be used to determine the size distri-bution of a cell population by careful control of the threshold settings of the instrument.
6. The DNA content of diploid cells is usually constant, although variations can occur as a result of the distribution of cells through the cell cycle. Cells in the G1 phase have the normal diploid content of DNA, which is typically 6 pg per cell. DNA measurement is probably one of the best indicators of cell con-centration in solid tissue [32].
7. The sensitivity of the HK assay for glucose can be increased by measuring the rate of increase of absorbance at 340 nm. This can be achieved with a recording spectrophotometer or using the kinetic mode of a multi-well plate reader.
8. The glucose analyzer is particularly suitable for the analysis of glucose in multiple samples of culture medium.
Cell Growth, Viability, Apoptosis
190
9. By the selection of the appropriate membrane in this instrument, various analytes can be determined such as glucose, sucrose, starch, lactose, galactose, glycerin, lactate, or ethanol.
10. The tetrazolium method is particularly convenient for the rapid assay of replicate cell cultures in multi-well plates. Plate readers are capable of measuring the absorbance of each well of a standard 96-well plate.
11. It is important to ensure that the colored formazan salt formed from MTT is completely dissolved in the SDS reagent.
12. Alternative tetrazolium salts can be used in this assay such as XTT and WST-1, which are available from Roche. These form soluble colored products.
13. The LDH assay is well suited for the determination of multiple samples, particularly if a multi-well plate reader is available. Care must be taken when interpreting the results by this method because the LDH content per cell can change consid-erably during the course of batch culture. The loss of cell via-bility can be expressed as the activity of LDH in the medium as a proportion of total LDH in the culture.
14. The measurement of energy charge is more time-consuming than the routine counting procedures discussed earlier but can allow a means of monitoring the decline in the energy metabo-lism of a cell culture that occurs during the loss of viability.
15. The cells should be incubated in the medium for sufficient time to measure radioactivity in the extracted cell pellet. Normally 4–6 h is sufficient, but this may be longer [33]. The rate of DNA synthesis of a cell population can be determined in a similar assay to that described for protein synthesis but using a radioactively labelled nucleotide precursor such as triti-ated thymidine (3H-TdR) or deoxycytidine (3H-CdR; Amersham). The exposure period may be short (30–60 min) for DNA synthesis rate determinations, and a specific activity of 1 μCi/ml of culture is sufficient. Higher specific activities may be required if using culture media containing the corre-sponding nonradioactive components such as methionine or thymidine.
16. For all apoptosis assays, positive and negative controls should be included in the analysis to distinguish the specific cell popu-lations. This is done by using knowingly healthy cells (negative control) and cells in which apoptosis has been induced (posi-tive control).
17. If R-phycoerythrin (PE) is used as a fluorescent label for this assay, the DNA-binding dye 7-aminoactinomycin D (7-AAD) should be used instead of PI which is used in conjunction with fluorescein isothiocyanate (FITC). This will allow for the
Michael Butler et al.
191
separate detection of the red PE conjugate and 7-AAD, which is detected at 650 nm (long-pass filter).
18. For these assays, a second stain such as PI or 7-AAD can be included to further distinguish later-stage apoptotic, dead, as well as necrotic cells. See Note 17 for the correct choice of a second dye.
References
1. Altman SA, Randers L, Rao G (1993) Comparison of trypan blue dye exclusion and fluorometric assays for mammalian cell viability determinations. Biotechnol Prog 9:671–674
2. Kerr JFR, Wyllie AH, Currie AR (1972) Apoptosis: a basic biological phenomenon with wide-ranging implications in tissue kinetics. Br J Cancer 26:239–257
3. Limoli CL, Hartmann A, Shephard L et al (1998) Apoptosis, reproductive failure, and oxidative stress in Chinese hamster ovary cells with compromised genomic integrity. Cancer Res 58:3712–3718
4. Simon L, Karim MN (2002) Control of starvation- induced apoptosis in Chinese ham-ster ovary cell cultures. Biotechnol Bioeng 78:645–657
5. Telford WG, Komoriya A, Packard BZ et al (2011) Multiparametric analysis of apoptosis by flow cytometry. Methods Mol Biol 699:203–227
6. Patterson MK (1979) Measurement of growth and viability of cell in culture. Methods Enzymol 58:141–152
7. Sanford KK, Earle WR, Evans VJ et al (1951) The measurement of proliferation in tissue cul-tures by enumeration of cell nuclei. J Natl Cancer I 11:773–795
8. Spearman M, Rodriguez J, Huzel N et al (2005) Production and glycosylation of recom-binant beta-interferon in suspension and cyto-pore microcarrier cultures of CHO cells. Biotechnol Prog 21:31–39
9. Zeiser A, Bedard C, Voyer R et al (1999) On-line monitoring of the progress of infection in Sf-9 insect cell cultures using relative permit-tivity measurements. Biotechnol Bioeng 63:122–126
10. Guan Y, Kemp RB (1997) The viable cell mon-itor: a dielectric spectroscope for growth and metabolic studies of animal cells on macropo-rous beads. ESACT Proc 15:321–328
11. Noll T, Biselli M (1998) Dielectric spectros-copy in the cultivation of suspended and immo-bilised hybridoma cells. J Biotechnol 63:187–198
12. Nikolic-Jaric M, Romanuik SF, Ferrier GA et al (2012) Electronic detection of dielectropho-
retic forces exerted on particles flowing over interdigitated electrodes. Biomicrofluidics 6:024117(1)–024117(32)
13. Bradford M (1976) A rapid and sensitive method for the quantitation of microgram quantities of protein using the principle of protein- dye binding. Anal Biochem 72: 248–254
14. Labarca C, Paigen K (1980) A simple, rapid, and sensitive DNA assay procedure. Anal Biochem 102:344–352
15. Brunk CF, Jones KC, James TW (1979) Assay for nanogram quantities of DNA in cellular homogenates. Anal Biochem 92:497–500
16. Bergmeyer HU, Bernt E (1974) Glucose determination with glucose oxidase and peroxi-dase. In: Bergmeyer HU (ed) Methods of enzymatic analysis. Verlag Chemie-Academic Press, New York, pp 1205–1212
17. Kunst A, Draeger B, Ziegenhorn J (1984) D-Glucose. In: Bergmeyer HU (ed) Methods of enzymatic anaysis. VCH Weinheim, Deerfield Beach, FA, pp 163–172
18. Mosmann T (1983) Rapid colorimetric assay for cellular growth and survival: application to proliferation and cytotoxicity assays. J Immunol Methods 65:55–63
19. Cook JA, Mitchell JB (1989) Viability mea-surements in mammalian cell systems. Anal Biochem 179:1–7
20. Wagner A, Marc A, Engasser JM (1992) The use of lactate dehydrogenase (LDH) release kinetics for the evaluation of death and growth of mammalian cells in perfusion reactors. Biotechnol Bioeng 39:320–326
21. Holm-Hansen O, Karl DM (1978) Biomass and adenylate energy charge determination in microbial cell extracts and environmental sam-ples. Methods Enzymol 57:73–85
22. Lundin A, Hasenson M, Persson J et al (1986) Estimation of biomass in growing cells lines by adenosine triphosphate assay. Methods Enzymol 133:27–42
23. Fadok VA, Voelker DR, Campbell PA et al (1992) Exposure of phosphatidylserine on the surface of apoptotic lymphocytes triggers specific recognition and removal by macrophages. J Immunol 148:2207–2216
Cell Growth, Viability, Apoptosis
192
24. Al-Rubeai M, Emery AN (1993) Flow cytom-etry in animal cell culture. Nat Biotechnol 11:572–579
25. Ishaque A, Sorokin A, Dunn MJ (2003) Cyclooxygenase-2 inhibts TNF-alpha mediated apoptosis in renal glomerular mesangial cells. J Biol Chem 278:10629–10640
26. Ekert PG et al (1999) Caspase inhibitors. Cell Death and Differ 6:1081–1086
27. Gorczyca W, Bruno S, Darzynkiewicz Z (1992) DNA strands break occurring during apopto-sis: their early in situ detection by the terminal deoxynucleotidyl transferase and nick transla-tion assays and prevention by serine protease inhibitors. Int J Oncol 1:639–648
28. Gold R, Schmeid M, Rothe G (1993) Detection of DNA fragmentation in apoptosis- application of in situ nick translation to cell culture systems and tissue sections. J Histochem Cytochem 41:1023–1030
29. Li X, Darzynkiewicz Z (1995) Labeling DNA strand breaks with BrdUTP. Detection of apoptosis and cell proliferation. Cell Proliferat 28:572–579
30. Darzynkiewicz Z, Bruno S, Del Bino G et al (1992) Features of apoptotic cells measured by flow cytometry. Cytometry 13:795–808
31. Berry JM, Huebner E, Butler M (1996) The crystal violet nuclei staining technique leads to anomalous results in monitoring mammalian cell cultures. Cytotechnology 21:73–80
32. Kurtz JW, Wells WW (1979) Automated fluo-rometric analysis of DNA, protein and enzyme activities: application of methods in cell cul-ture. Anal Biochem 94:166–175
33. Dickson AJ (1991) Protein expression and pro-cessing. In: Butler M (ed) Mammalian cell bio-technology: a practical approach. Oxford University Press, Oxford, pp 85–108
Michael Butler et al.