Embed Size (px)
Citation preview

CHAPTER 12 – WATER VALUES AND QUALITY
GULF ALUMINA LTD – SKARDON RIVER BAUXITE PROJECT

Skardon River Bauxite Project Chapter 12 – Water Values and Quality
Page 12-i
TABLE OF CONTENTS
12.1 Introduction ..................................................................................................... 12-1 12.2 Environmental Objectives and Performance Outcomes ..................................... 12-1 12.2.1 Environmental Objectives ........................................................................................ 12-1 12.2.2 Performance Outcomes ........................................................................................... 12-1 12.3 Legislative and Policy Context ........................................................................... 12-2 12.3.1 Environmental Protection Act 1994 ......................................................................... 12-2 12.3.2 Environmental Protection (Water) Policy (2009) ..................................................... 12-2 12.3.3 Water Quality Guidelines ......................................................................................... 12-2 12.3.4 Model Mining Conditions ......................................................................................... 12-3 12.3.5 Environmental Authority .......................................................................................... 12-3 12.4 Environmental Values ...................................................................................... 12-4 12.4.1 Catchments and Watercourses ................................................................................ 12-4 12.4.2 Wetlands .................................................................................................................. 12-7 12.5 Water Quality Objectives ................................................................................ 12-14 12.5.1 Environmental Values from EPP Water.................................................................. 12-14 12.5.2 Water Quality Objectives ....................................................................................... 12-14 12.6 Surface Water Monitoring .............................................................................. 12-25 12.6.1 Surface Water Monitoring Locations ..................................................................... 12-25 12.6.2 Surface Water Level Data ....................................................................................... 12-28 12.6.3 Surface Water Quality ............................................................................................ 12-29 12.6.3.1 Physical Parameters ............................................................................................... 12-29 12.6.3.2 Metals ..................................................................................................................... 12-30 12.6.3.3 Nutrients ................................................................................................................ 12-31 12.7 Groundwater Monitoring ............................................................................... 12-31 12.7.1 Groundwater Monitoring Locations and Parameters ............................................ 12-31 12.7.2 Groundwater Levels ............................................................................................... 12-36 12.7.3 Groundwater Quality ............................................................................................. 12-37 12.7.3.1 Physical Parameters ............................................................................................... 12-38 12.7.3.2 Metals ..................................................................................................................... 12-39 12.7.3.3 Nutrients ................................................................................................................ 12-42 12.8 Potential Impacts, Emissions and Releases ...................................................... 12-42 12.9 Mitigation and Management Measures .......................................................... 12-43 12.9.1 Mine Pits ................................................................................................................. 12-43 12.9.1.1 Mine Site Sediment Management ......................................................................... 12-44 12.9.1.2 Mine Site Sediment Pond Management ................................................................ 12-45 12.9.2 Port Infrastructure Area ......................................................................................... 12-46 12.9.2.1 Bauxite Stockpile Sediment Control ....................................................................... 12-49 12.9.2.2 Contaminant Management .................................................................................... 12-49 12.9.2.3 Release Monitoring ................................................................................................ 12-49 12.9.3 Effluent Irrigation Area ........................................................................................... 12-51 12.9.4 Erosion and Sediment Control ............................................................................... 12-51 12.9.4.1 Erosion and Sediment Control Plan ....................................................................... 12-51 12.9.4.2 Permanent Haul Roads ........................................................................................... 12-53 12.9.5 Namaleta Creek Crossing ....................................................................................... 12-54 12.9.5.1 Location .................................................................................................................. 12-54 12.9.5.2 Existing Crossing ..................................................................................................... 12-54 12.9.5.3 Crossing Design ...................................................................................................... 12-54 12.9.5.4 Crossing Drainage ................................................................................................... 12-56
Skardon River Bauxite Project Chapter 12 – Water Values and Quality
Page 12-ii
12.9.5.5 Crossing Construction and Rehabilitation .............................................................. 12-57 12.9.6 Crossings of other Drainage Features .................................................................... 12-57 12.10 Proposed Surface Water and Groundwater Monitoring Programme ................ 12-59 12.10.1 Surface Water Monitoring Locations ..................................................................... 12-59 12.10.2 Surface Water Monitoring Frequency and Parameters ......................................... 12-65 12.10.3 Surface Water Monitoring and Reporting .............................................................. 12-65 12.10.4 Receiving Environment Monitoring Programme ................................................... 12-68 12.10.5 Groundwater Monitoring ....................................................................................... 12-68 12.10.6 Saline Water Ingress ............................................................................................... 12-75 12.10.7 Targeted Monitoring Bores .................................................................................... 12-75 12.10.8 Groundwater Monitoring and Reporting ............................................................... 12-75 12.10.9 Bore Construction .................................................................................................. 12-76 12.11 Risk Assessment ............................................................................................. 12-76 12.12 Cumulative Impacts ........................................................................................ 12-77 12.13 Conclusion ..................................................................................................... 12-78
Tables
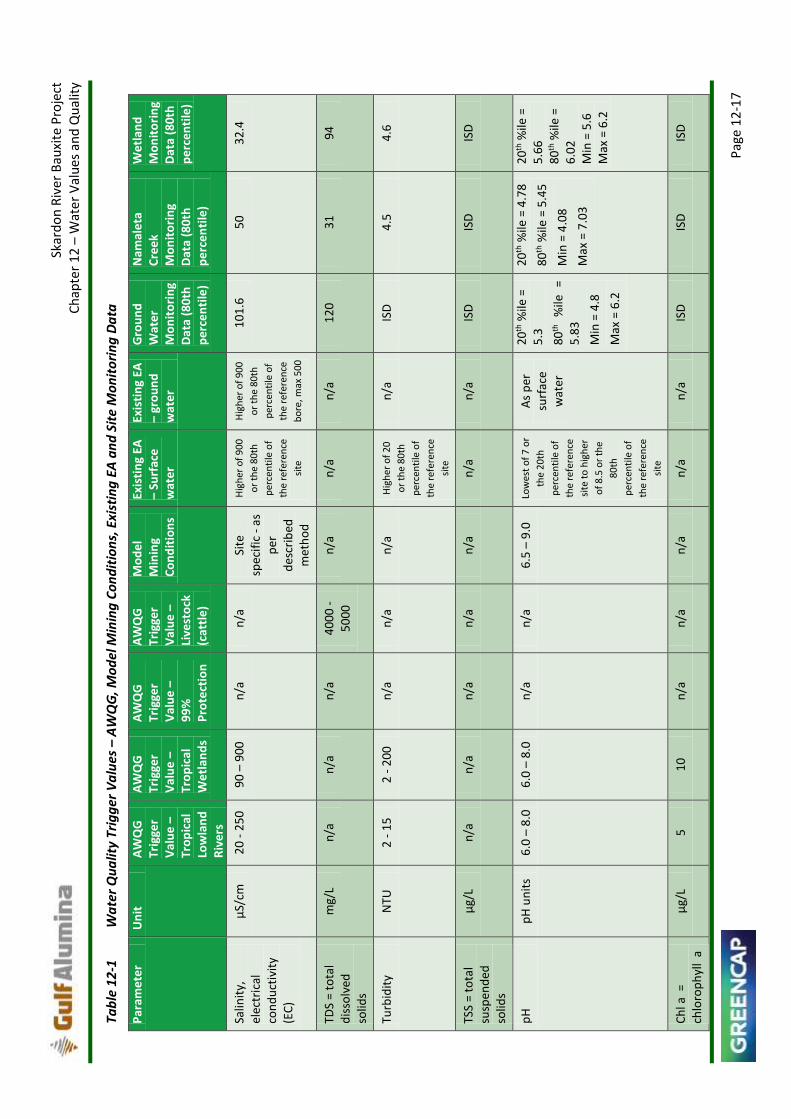
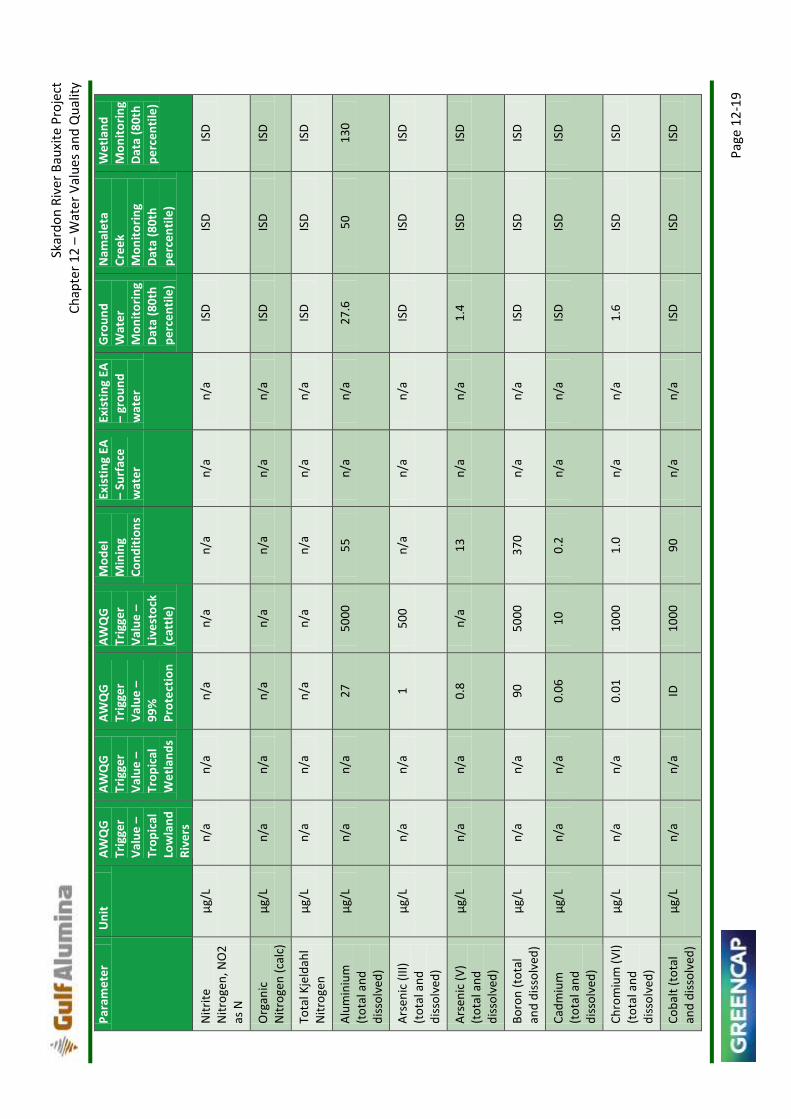
Table 12-1 Water Quality Trigger Values – AWQG, Model Mining Conditions, Existing EA and Site Monitoring Data .................................................................................. 12-17
Table 12-2 Nominated Water Quality Objectives .................................................................... 12-22 Table 12-3 Surface Water Monitoring Data ............................................................................. 12-25 Table 12-4 Surface Water Levels .............................................................................................. 12-28 Table 12-5 Surface Water Physical Parameter Summary Results – Namaleta Creek .............. 12-29 Table 12-6 Surface Water Physical Parameter Summary Results – Wetlands ......................... 12-29 Table 12-7 Surface Water Physical Parameter Summary Results – Kaolin Water
Storages .................................................................................................................. 12-29 Table 12-8 Surface Water Dissolved Metals Summary Results –Namaleta Creek ................... 12-30 Table 12-9 Surface Water Dissolved Metals Summary Results – Wetlands ............................ 12-30 Table 12-10 Surface Water Dissolved Metals Summary Results – Kaolin Water Storages ........ 12-30 Table 12-11 Surface Water Nutrient Summary Results – Namaleta Creek ............................... 12-31 Table 12-12 Surface Water Nutrient Summary Results - Wetlands ........................................... 12-31 Table 12-13 Surface Water Nutrient Summary Results - Kaolin Water Storages ...................... 12-31 Table 12-14 Groundwater Monitoring Data .............................................................................. 12-33 Table 12-15 Groundwater Level Data ........................................................................................ 12-36 Table 12-16 Groundwater Physical Parameter Summary Results – All Bores ........................... 12-38 Table 12-17 Groundwater Physical Parameter Summary Results – Bulimba Formation
(Namaleta Creek) Aquifer....................................................................................... 12-38 Table 12-18 Groundwater Physical Parameter Summary Results – Bulimba Formation
Aquifer .................................................................................................................... 12-39 Table 12-19 Groundwater Physical Parameter Summary Results – Rolling Downs
Siltstone Aquifer ..................................................................................................... 12-39 Table 12-20 Groundwater Dissolved Metals Summary Results – All Bores ............................... 12-40 Table 12-21 Groundwater Dissolved Metals Summary Results – Bulimba Formation
(Namaleta Creek) Aquifer....................................................................................... 12-40 Table 12-22 Groundwater Dissolved Metals Summary Results – Bulimba Formation
Aquifer .................................................................................................................... 12-40 Table 12-23 Groundwater Dissolved Metals Summary Results – Rolling Downs Siltstone
Aquifer .................................................................................................................... 12-41 Table 12-24 Groundwater Nutrient Summary Results – All Bores............................................. 12-42

Skardon River Bauxite Project Chapter 12 – Water Values and Quality
Page 12-iii
Table 12-25 Groundwater Nutrient Summary Results – Bulimba Formation (Namaleta Creek) Aquifer ........................................................................................................ 12-42
Table 12-26 Groundwater Nutrient Summary Results – Bulimba Formation Aquifer ............... 12-42 Table 12-27 Groundwater Nutrient Summary Results – Rolling Downs Siltstone Aquifer ........ 12-42 Table 12-28 Catchments Areas, Sediment Runoff and Pond/Dam Sizing .................................. 12-45 Table 12-29 Release Points – Port Area Sediment Ponds .......................................................... 12-50 Table 12-30 Release Limits ......................................................................................................... 12-50 Table 12-31 Existing and Proposed Surface Water Monitoring Network .................................. 12-61 Table 12-32 Surface Water Monitoring Frequency and Parameters ......................................... 12-66 Table 12-33 Groundwater Monitoring Network ........................................................................ 12-70 Table 12-34 Risk Assessment and Management Measures for Impacts to Water Quality ........ 12-76
Figures
Figure 12-1 Regional Catchments ................................................................................................ 12-5 Figure 12-2 Local Catchments ..................................................................................................... 12-6 Figure 12-3 Wetlands – Queensland WetlandInfo Mapping ....................................................... 12-9 Figure 12-4 Wetlands of Namaleta Creek Catchment - Queensland WetlandInfo
Mapping ................................................................................................................. 12-10 Figure 12-5 Referrable Wetlands – Wetland Management Areas ............................................ 12-11 Figure 12-6 Vegetation Management Act Wetlands and Watercourses .................................. 12-12 Figure 12-7 Directory of Important Wetlands ........................................................................... 12-13 Figure 12-8 Surface Water Monitoring Locations ..................................................................... 12-27 Figure 12-9 Site S8 Surface Water Level and Rainfall ................................................................ 12-28 Figure 12-10 Groundwater Monitoring Locations ....................................................................... 12-35 Figure 12-11 Standing Groundwater Level – Bore C1 ................................................................. 12-37 Figure 12-12 Standing Groundwater Level – Bore G3 ................................................................. 12-37 Figure 12-13 Port Area Sediment Ponds and Drainage ............................................................... 12-47 Figure 12-14 Namaleta Creek Crossing Location ......................................................................... 12-55 Figure 12-15 Namaleta Creek Crossing – Downstream View ...................................................... 12-56 Figure 12-16 Haul Road Crossing of Drainage Feature ................................................................ 12-58 Figure 12-17 Existing and Proposed Monitoring Bores ............................................................... 12-74 Figure 12-18 Conceptual Mine Plan – Bauxite Hills Project ........................................................ 12-77

Skardon River Bauxite Project Chapter 12 – Water Values and Quality
Page 12-1
12. WATER VALUES AND QUALITY
12.1 Introduction
This chapter describes the surface water environment, including catchments and wetlands, within and surrounding the Project area, describes surface water quality and groundwater quality from field samples, establishes environmental values and water quality objectives for waters in the Project area, describes potential impacts to water quality, proposes measures to mitigate impacts and provides a risk assessment for residual impacts.
Information in this chapter is primarily based on the information provided in Appendix 4.
Chapter 14 describes flood modelling and potential impacts from flooding from watercourses on the Project.
Chapter 13 describes the surface water and groundwater hydrological and hydrogeological regimes of the Project, potential impacts and mitigation measures.
12.2 Environmental Objectives and Performance Outcomes
The environmental objectives and performance outcomes below are based on Schedule 5, Table 2 of the Environmental Protection Regulations 2008 (EP Regulation). The mitigation and management measures presented in this chapter are designed to achieve these environmental objectives and performance outcomes. The environmental management plan (EM Plan) presented in Appendix 13 provides a consolidated description of these mitigation and management measures.
12.2.1 Environmental Objectives
The activity will be operated in a way that protects environmental values of waters.
The activity will be operated in a way that protects the environmental values of wetlands.
The activity will be operated in a way that protects the environmental values of groundwater and
any associated surface ecological systems.
The choice of the site, at which the activity is to be carried out, minimises serious environmental
harm on areas of high conservation value and special significance and sensitive land uses at adjacent
places.
The design of water management infrastructure is in accordance with best practice environmental
management.
12.2.2 Performance Outcomes
Contingency measures will prevent or minimise adverse effects on the environment due to
unplanned releases or discharges of contaminants to water.
The activity will be managed so that stormwater contaminated by the activity that may cause an
adverse effect on an environmental value will not leave the site without prior treatment.
Any discharge to water or a watercourse or wetland will be managed so that there will be no
adverse effects due to the altering of existing flow regimes for water or a watercourse or wetland.
The activity will be managed so that adverse effects on environmental values are prevented or
minimised.

Skardon River Bauxite Project Chapter 12 – Water Values and Quality
Page 12-2
The activity will be managed in a way that prevents or minimises adverse effects on wetlands.
The activity will be managed to prevent or minimise adverse effects on groundwater or any
associated surface ecological systems.
The activity will be managed to prevent or minimise adverse effects on the environmental values of
land due to unplanned releases or discharges.
Areas of high conservation value and special significance likely to be affected by the proposal are
identified and evaluated and any adverse effects on the areas are minimised, including any edge
effects on the areas.
12.3 Legislative and Policy Context
12.3.1 Environmental Protection Act 1994
The Environmental Protection Act 1994 (EP Act) provides for environmental protection policies that establish the environmental values (EVs) which are to be protected, that include quality standards that are relevant to the water environment. The EVs of waterways in Queensland (including groundwater) are protected under the EP Act and the subordinate Environmental Protection (Water) Policy 2009 (EPP Water).
12.3.2 Environmental Protection (Water) Policy (2009)
The EPP Water establishes a process for identifying environmental values to be protected and states standards for water quality in support of those values. This policy is supported by the Queensland Water Quality Guidelines 2009 (QWQG).
The EPP Water provides a framework for the following:
Identifying environmental values and management goals for Queensland waters.
Stating water quality guidelines and objectives to enhance the environmental values.
Providing a framework for making consistent, equitable and informed decisions about Queensland
waters.
Monitoring and reporting on the condition of Queensland waters.
The EPP Water has been established to protect Queensland waters while allowing for ecologically sustainable development. The purpose of the policy is to identify EVs for aquatic ecosystems and for human uses; and determine water quality guidelines and water quality objectives to protect EVs. Aquatic ecosystems in both surface and groundwater habitats have EVs that require certain levels of protection under the EPP Water.
EVs and water quality objectives have been established for many waterways in Queensland under Schedule 1 of the EPP Water. Environmental values and associated water quality objectives have not been established for the rivers in Cape York potentially impacted by the Project.
The EPP Water defines an indicator for an EV as a property that can be measured or decided in a quantitative way. Water quality objectives are numerical concentrations or statements for indicators that protect a stated environmental value and are generally developed based on the review of the available site-specific information relevant to each environmental value.
12.3.3 Water Quality Guidelines
The Australian and New Zealand Environment and Conservation Council (ANZECC) has developed the Australian and New Zealand Guidelines for Fresh and Marine Water Quality (ANZECC & ARMCANZ 2000)

Skardon River Bauxite Project Chapter 12 – Water Values and Quality
Page 12-3
(hereafter referred to as the Australian Water Quality Guidelines (AWQG)). The AWQG are numerical concentration limits or descriptive statements that can be applied to a range of ecosystem types and water uses, such as recreational and stock water. Water quality guidelines give recommended values for indicators and are designed to ensure that EVs of waters are protected. The need to develop guidelines for specific regions, water types and local flora and fauna is one of the main reasons why the QWQGs were developed.
Section 4 of the QWQG recommends the use of local water quality objectives developed for appropriate indicators / parameters using monitoring data from local reference sites. The QWQG stipulates a minimum set of eight independent surveys over 12 months from each reference site to establish ‘interim local water quality objectives’, and a further 10 independent surveys over the next 12 month to establish ‘local water quality objectives’ where there are two or less reference sites. Where there are three or more reference sites, a further four independent surveys over the next 12 months are needed to establish local water quality objectives. A reference site is defined as ‘a site whose condition is considered to be a suitable baseline or benchmark for assessment and management of sites in similar water bodies’. The water quality objective is then determined using the 20th and 80th percentile, as appropriate, for each parameter from these independent survey data.
12.3.4 Model Mining Conditions
The model mining conditions are a set of model conditions to form general environmental protection commitments given for mining activities, and environmental authority conditions for resource activities imposed by the administering authority under the EP Act. These model conditions have been used as a guide for developing environmental protection commitments relating to water management and for appropriate conditions for an environmental authority for the Project.
12.3.5 Environmental Authority
Gulf has an existing environmental authority (EA) issued for the kaolin mine which has ceased operations. This EA governs the ongoing rehabilitation, decommissioning and management of the kaolin mine, formerly a Level 1 mining project on the Mining Leases ML 6025, ML 40069 and ML 40082.
Gulf recognises that the existing EA (including conditions related to water management) will be amended as an outcome of the EIS process. The current EA addresses the following areas relevant to water management for the kaolin mine:
Requirement for monitoring receiving waters affected by the release of process water or
stormwater contaminated by kaolin mining activities.
Prohibition of waste deposition and the release of Acid Sulphate Soils (ASS) to any waters.
Monitoring locations and frequencies (receiving waters, end of pipe discharge, groundwater
affected by kaolin mining activities).
Contaminant release limits for end of pipe discharges, sewage effluent for irrigation, and
groundwater.
Contaminant trigger limits for receiving water and groundwater.
Conditions for use of sewage effluent for irrigation.
Requirement for sampling methods to comply with those set out in the latest edition of the
Environmental Protection Agency’s Water Quality Sampling Manual.
It is expected that the amended EA will retain relevant sections related to approval conditions for the kaolin mine as these decommissioning and rehabilitation activities will be ongoing.

Skardon River Bauxite Project Chapter 12 – Water Values and Quality
Page 12-4
12.4 Environmental Values
12.4.1 Catchments and Watercourses
The Project is situated in the tropics and experiences high rainfall during the wet season and hot, humid conditions during the dry season. In normal years, up to 80 per cent of average annual rainfall occurs as a result of tropical cyclonic events during the wet seasonal months of December to mid-April. However, in exceptionally dry years, rainfall during the wet season months can account for between 80 and 90% of the annual precipitation.
The Project’s mining leases are primarily drained by two drainages – the Skardon River and Namaleta Creek. Regional catchments on Cape York surrounding the Project area are shown in Figure 12-1. The catchments for the Skardon River and Namaleta Creek are shown in Figure 12-2. In addition there are highly localised drainages to the west of the mining leases, which drain the areas between the mining leases and the beach ridges, as shown in Figure 12-2 (catchments 1, 2, 3 and 4). The northern end of the Project is bounded by the Skardon River which drains mangrove areas through three primary tributaries to the south and east.
The Skardon River is considered a predominantly estuarine system, consisting of freshwater systems within its upper reaches. The Skardon River catchment is approximately 480 km2, which is relatively small compared to other catchments on Cape York. The southern tributary of the Skardon River catchment (Catchment 7 in Figure 12-2) is approximately 171.5 km2. Estuarine conditions continue upstream into the southern tributary (Skardon River South Arm) for approximately 9.3 km from its confluence with the main Skardon River Estuary. In the Project area, areas of mining are within the catchment of this estuarine reach of the Skardon River only (i.e. they are not within the catchments of the freshwater parts of the Skardon River).
Namaleta Creek is a localised drainage with a catchment of 37 km2, of which 21 km2 lies upstream of the eastern mine boundary. This watercourse is tidally influenced, where mangrove communities begin approximately 1 km west (downstream) of the existing crossing of Namaleta Creek. The ephemeral system rises from the north and east and eventually discharges to the south into Port Musgrave.

ML 6025
ML 40082 ML40069
PASCOERIVER
SUB-BASIN
EMBLEYRIVER
SUB-BASIN
MISSIONRIVER
SUB-BASIN
WATSON RIVERSUB-BASIN
SKARDONRIVERSUB-BASIN
WENLOCKRIVER
SUB-BASIN
OLIVERIVER
SUB-BASIN
MCDONALDRIVER
SUB-BASIN
TORRES STRAITISLANDS
SUB-BASIN
JACKY JACKYCREEK
SUB-BASIN
JARDINERIVER
SUB-BASIN
DUCIE/DULHUNTY RIVERSUB-BASIN
GLENNIE
CREEK
COX
CREE
K
HESKETCREEK
DOUGHBOY RIVER
PASC
OERIV
ER
ELIOT CREEK
EMBLEYRIVER
CHOLMONDELEY
CREEK
ROCK
Y
CREEK
NORTH ALICECREEK
SKARDONRIVER
JACKEY
JACKEY CREEK
WENLOCKRIVER
KURRACOO
CREEK
DUCIE RIVERHAR
MER
CREEK
COCKATOOCREEK
JACKSONRIVER
PALMCREEK
OLIVERIVER
JARD
INE
RIVE
R
MCHENRYRIVER
MISSIONRIVER
MYALLCREEK
DULHUNTY
RIVER
Sources: Esri, USGS, NOAA
600000 650000 70000086
0000
0
8600
000
8650
000
8650
000
8700
000
8700
000
8750
000
8750
000
8800
000
8800
000
Figure 12-1
G:\CLIENTS\E-TO-M\Gulf Alumina\GIS\Maps\EIS\Ch12_SurfaceWater\FIG_12_01_Regional_Catchments_150815.mxd
Revision: R1
Date: 15/08/2015 Author: malcolm.nunn1:1,000,000Map Scale:
Coordinate System: GDA 1994 MGA Zone 54
Regional Catchments
0 10 20 30 40 50Kilometers
Gulf Alumina Limited
!
!
!
!
Queensland
CAIRNS
BRISBANE
TOWNSVILLE
ROCKHAMPTON
±
No warranty is given in relation to the data (including accuracy, reliability, completeness or suitability) and accept no liability (including without limitation, liability in negligence) for any loss, damage or costs (including consequential damage) relating to any use of or reliance upon the data. Data must not be used for direct marketing or be used in breach of privacy laws. Tenures © Geos Mining (2015). State Boundaries and Towns © Geoscience Australia (2006). Watercourses © Geoscience Australia. Drainage basins © State of Queensland (DNRM 2015).
LegendMining Lease BoundariesMajor WatercoursesRiver Sub-Basins

!(
ML 6025
ML 40082 ML40069
NAMALETA
CREEK
DUCIE RIVER
DULH
UNTY
RIVER
NAMALETACREEK
SKARDON RIVER
7
65
4
3
2
1
605000 610000 615000 620000 625000 63000086
7500
0
8675
000
8680
000
8680
000
8685
000
8685
000
8690
000
8690
000
8695
000
8695
000
8700
000
8700
000
8705
000
8705
000
Figure 12-2
G:\CLIENTS\E-TO-M\Gulf Alumina\GIS\Maps\EIS\Ch12_SurfaceWater\FIG_12_02_Local_Catchments_150815.mxd
Revision: R1
Date: 15/08/2015 Author: malcolm.nunn1:150,000Map Scale:
Coordinate System: GDA 1994 MGA Zone 54
Local Catchments
0 1 2 3 4 5Kilometers
Gulf Alumina Limited
!
!
!
!
Queensland
CAIRNS
BRISBANE
TOWNSVILLE
ROCKHAMPTON
±
No warranty is given in relation to the data (including accuracy, reliability, completeness or suitability) and accept no liability (including without limitation, liability in negligence) for any loss, damage or costs (including consequential damage) relating to any use of or reliance upon the data. Data must not be used for direct marketing or be used in breach of privacy laws. Tenures © Geos Mining (2015). State Boundaries and Towns © Geoscience Australia (2006). Watercourses © Geoscience Australia. Imagery (inset, main): sourced from Gulf Alumina. Imagery (main) © ESRI (2015).
Legend!( Port of Skardon River
Mining Lease BoundariesWatercourses
Local CatchmentsProject FootprintExisting Disturbance Footprint
BigfootSwamp
LunetteSwamp
NAMALETACREEK
6
5
Skardon River Bauxite Project Chapter 12 – Water Values and Quality
Page 12-7
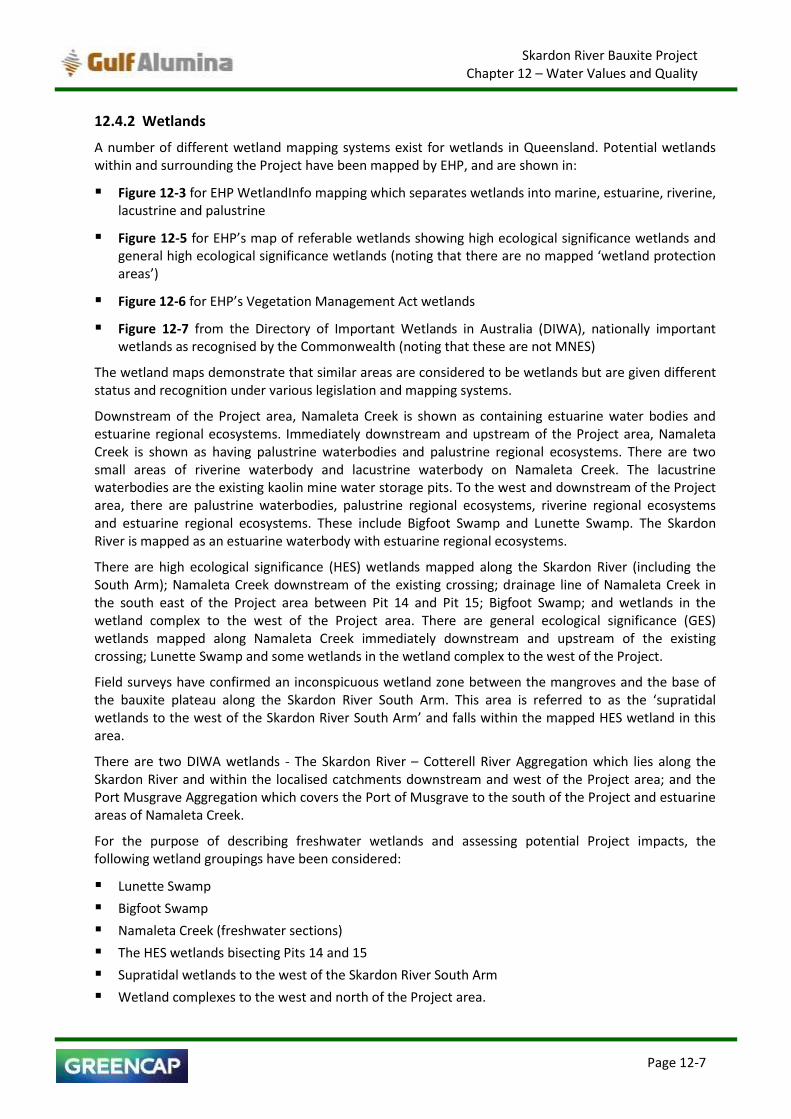
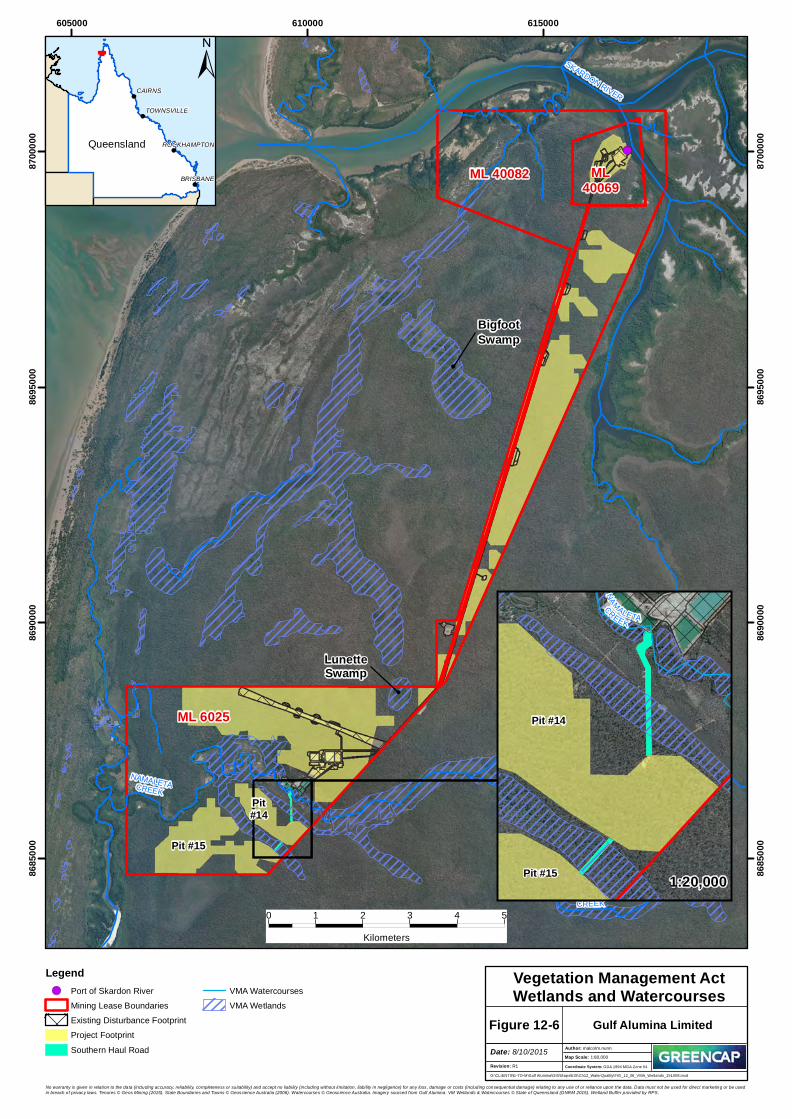
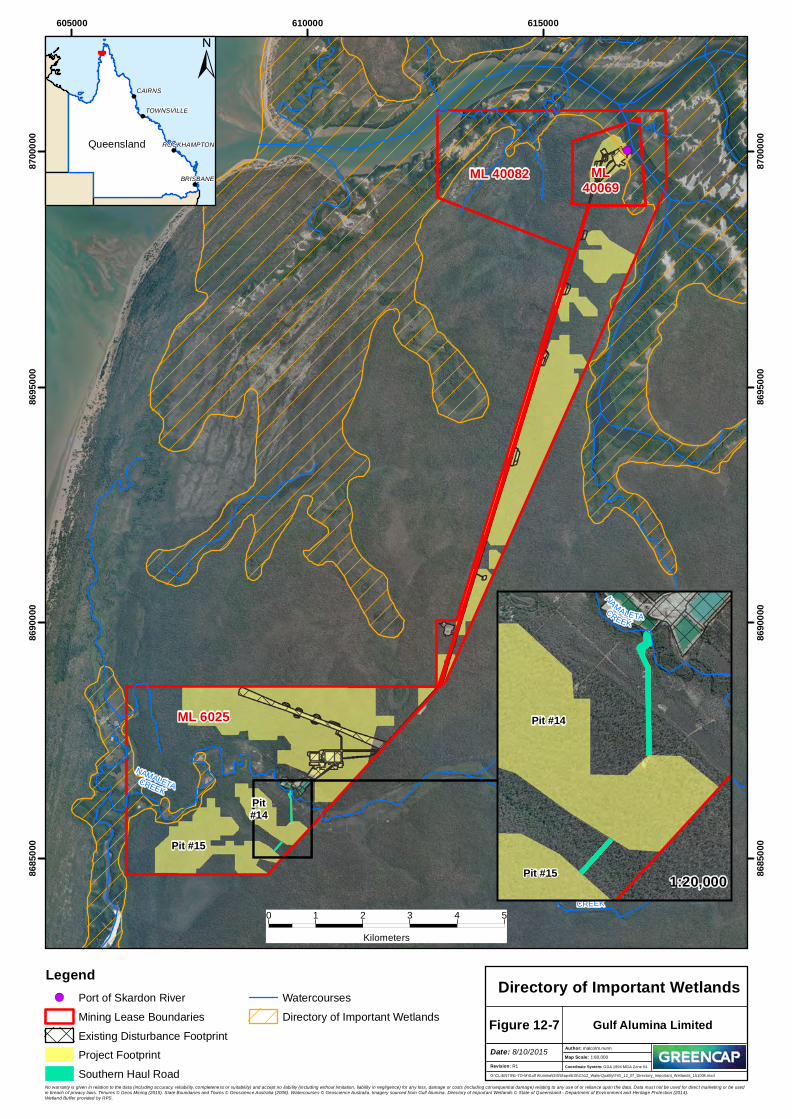
12.4.2 Wetlands
A number of different wetland mapping systems exist for wetlands in Queensland. Potential wetlands within and surrounding the Project have been mapped by EHP, and are shown in:
Figure 12-3 for EHP WetlandInfo mapping which separates wetlands into marine, estuarine, riverine, lacustrine and palustrine
Figure 12-5 for EHP’s map of referable wetlands showing high ecological significance wetlands and general high ecological significance wetlands (noting that there are no mapped ‘wetland protection areas’)
Figure 12-6 for EHP’s Vegetation Management Act wetlands
Figure 12-7 from the Directory of Important Wetlands in Australia (DIWA), nationally important wetlands as recognised by the Commonwealth (noting that these are not MNES)
The wetland maps demonstrate that similar areas are considered to be wetlands but are given different status and recognition under various legislation and mapping systems.
Downstream of the Project area, Namaleta Creek is shown as containing estuarine water bodies and estuarine regional ecosystems. Immediately downstream and upstream of the Project area, Namaleta Creek is shown as having palustrine waterbodies and palustrine regional ecosystems. There are two small areas of riverine waterbody and lacustrine waterbody on Namaleta Creek. The lacustrine waterbodies are the existing kaolin mine water storage pits. To the west and downstream of the Project area, there are palustrine waterbodies, palustrine regional ecosystems, riverine regional ecosystems and estuarine regional ecosystems. These include Bigfoot Swamp and Lunette Swamp. The Skardon River is mapped as an estuarine waterbody with estuarine regional ecosystems.
There are high ecological significance (HES) wetlands mapped along the Skardon River (including the South Arm); Namaleta Creek downstream of the existing crossing; drainage line of Namaleta Creek in the south east of the Project area between Pit 14 and Pit 15; Bigfoot Swamp; and wetlands in the wetland complex to the west of the Project area. There are general ecological significance (GES) wetlands mapped along Namaleta Creek immediately downstream and upstream of the existing crossing; Lunette Swamp and some wetlands in the wetland complex to the west of the Project.
Field surveys have confirmed an inconspicuous wetland zone between the mangroves and the base of the bauxite plateau along the Skardon River South Arm. This area is referred to as the ‘supratidal wetlands to the west of the Skardon River South Arm’ and falls within the mapped HES wetland in this area.
There are two DIWA wetlands - The Skardon River – Cotterell River Aggregation which lies along the Skardon River and within the localised catchments downstream and west of the Project area; and the Port Musgrave Aggregation which covers the Port of Musgrave to the south of the Project and estuarine areas of Namaleta Creek.
For the purpose of describing freshwater wetlands and assessing potential Project impacts, the following wetland groupings have been considered:
Lunette Swamp
Bigfoot Swamp
Namaleta Creek (freshwater sections)
The HES wetlands bisecting Pits 14 and 15
Supratidal wetlands to the west of the Skardon River South Arm
Wetland complexes to the west and north of the Project area.

Skardon River Bauxite Project Chapter 12 – Water Values and Quality
Page 12-8
For the purpose of describing marine and estuarine wetlands and assessing potential Project impacts, the following wetland groupings have been considered:
Skardon River estuarine areas
Namaleta Creek estuarine areas
The hydrology of wetlands and the hydrogeology of the Project area is described in Chapter 13. The wetlands within and surrounding the Project area include several groundwater dependent ecosystems located along drainage lines which comprise valley fill alluvial deposits with underlying shallow aquifer systems. All freshwater wetlands are likely to be recharged by surface water during the wet season and maintained during the dry season by seasonally perched groundwater recharge. All wetlands are considered to be shallow aquifer groundwater dependent ecosystems.
Based on site knowledge, Lunette Swamp and Bigfoot Swamp wetlands dry out during the dry season, except for small ponds at the lower end of Bigfoot Swamp, which can also dry out in some years. Lunette Swamp dries out fairly rapidly, by July 2015 there was no water in Lunette Swamp.
The palustrine wetlands across the Project area are associated with depressions and water course drainage lines. In addition to retaining water they are also a repository of soils and sediments that will retain nutrients to support local biodiversity. The detailed nature of partitioning of the various components of the hydrological cycle – rainfall, runoff, recharge and baseflow, as they affect wetlands, is understood at a conceptual level for the area. These wetlands are dependent on surface water and groundwater interaction. The riverine and estuarine wetlands reaches of Namaleta Creek adjacent to the Project and further downstream are affected by the behaviour of runoff and baseflows entering the Creek.
Field ecological surveys have resulted in the delineation of vegetation communities or ‘map units’, which have been used to derive field mapped regional ecosystems (REs)(Refer Chapter 15), including vegetation map units / REs associated with wetlands. In general field mapped vegetation map units associated with wetlands correspond to government mapped wetlands. However the following areas of government mapped wetland are not likely to be wetland habitat:
Some areas along the north side of Namaleta Creek (RE 3.5.22 / vegetation map unit 2 -tall grassy
woodland of Corymbia novoguinensis over Livistona muelleri with Eucalyptus brassiana to 28 m on
humic soil)
The mapped HES wetland between Pit 14 and 15 (RE 3.3.22a / vegetation map unit 9), which is likely
to contain RE 3.3.22a (woodland of Corymbia novoguinensis over Livistona muelleri, occasionally
with Eucalyptus tetrodonta), classified as “floodplain (other than floodplain wetlands”) by EHP.
Further information on the wetland vegetation communities is provided in Chapter 15 and Chapter 16.
The identified wetlands are not matters of national environmental significance (MNES). Listed species which are associated with wetlands are described in Chapter 16.
The Ramsar Convention (The Convention on Wetlands of International Importance) is an international treaty for the conservation and sustainable utilisation of wetlands. Australia is a signatory to this convention. The Ramsar List of Wetlands of International Importance now includes 1,950 sites (known as Ramsar Sites). A desktop search of Ramsar Wetlands did not identified any Ramsar wetlands within or adjacent to the Project area.

!(
ML 6025
ML 40082 ML40069
BigfootSwamp
LunetteSwamp
NAMALETACREEK
SKARDON RIVER
Pit#14
Pit #15
605000 610000 61500086
8500
0
8685
000
8690
000
8690
000
8695
000
8695
000
8700
000
8700
000
Figure 12-3
G:\CLIENTS\E-TO-M\Gulf Alumina\GIS\Maps\EIS\Ch12_WaterQuality\FIG_12_03_WetlandInfo_1501008.mxd
Revision: R1
Date: 8/10/2015 Author: malcolm.nunn1:80,000Map Scale:
Coordinate System: GDA 1994 MGA Zone 54
Wetlands - QueenslandWetlandInfo Mapping
0 1 2 3 4 5Kilometers
Gulf Alumina Limited
!
!
!
!
Queensland
CAIRNS
BRISBANE
TOWNSVILLE
ROCKHAMPTON
±
No warranty is given in relation to the data (including accuracy, reliability, completeness or suitability) and accept no liability (including without limitation, liability in negligence) for any loss, damage or costs (including consequential damage) relating to any use of or reliance upon the data. Data must not be used for direct marketing or be used in breach of privacy laws. Tenures © Geos Mining (2015). State Boundaries and Towns © Geoscience Australia (2006). Watercourses © Geoscience Australia. Imagery sourced from Gulf Alumina. Queensland Wetland Data Version 3.0 © State of Queensland - Department of Science, Information Technology, Innovation and the Arts (2013).
Legend!( Port of Skardon River
Mining Lease BoundariesExisting Disturbance FootprintProject FootprintSouthern Haul RoadWatercourses
Water BodiesMarineEstuarineRiverineLacustrinePalustrine
Wetland Regional EcosystemEstuarineRiverinePalustrine
NAMALETACREEK
Pit #14
Pit #15 1:20,000

ML 6025
NAMA
LETA
CRE
EK
Pit #14
Pit #15
608000 609000 61000086
8500
0
8685
000
8686
000
8686
000
8687
000
8687
000
8688
000
8688
000
Figure 12-4
G:\CLIENTS\E-TO-M\Gulf Alumina\GIS\Maps\EIS\Ch12_WaterQuality\FIG_12_04_WetlandInfo_Namaleta_Zoom_151008.mxd
Revision: R1
Date: 8/10/2015 Author: malcolm.nunn1:17,500Map Scale:
Coordinate System: GDA 1994 MGA Zone 54
Wetlands of Namaleta Creek Catchment- Queensland WetlandInfo Mapping
0 500 1,000 1,500 2,000Meters
Gulf Alumina Limited
!
!
!
!
Queensland
CAIRNS
BRISBANE
TOWNSVILLE
ROCKHAMPTON
±
No warranty is given in relation to the data (including accuracy, reliability, completeness or suitability) and accept no liability (including without limitation, liability in negligence) for any loss, damage or costs (including consequential damage) relating to any use of or reliance upon the data. Data must not be used for direct marketing or be used in breach of privacy laws. Tenures © Geos Mining (2015). State Boundaries and Towns © Geoscience Australia (2006). Watercourses © Geoscience Australia. Imagery sourced from Gulf Alumina. Queensland Wetland Data Version 3.0 © State of Queensland - Department of Science, Information Technology, Innovation and the Arts (2013).
Legend!( Port of Skardon River
Mining Lease BoundariesExisting Disturbance FootprintProject FootprintSouthern Haul RoadWatercourses
Water BodiesEstuarineRiverineLacustrinePalustrine
Wetland Regional EcosystemEstuarinePalustrine

!(
ML 6025
ML 40082 ML40069
BigfootSwamp
LunetteSwamp
NAMALETACREEK
SKARDON RIVER
NAMALETACREEKPit#14
Pit #15
605000 610000 61500086
8500
0
8685
000
8690
000
8690
000
8695
000
8695
000
8700
000
8700
000
Figure 12-5
G:\CLIENTS\E-TO-M\Gulf Alumina\GIS\Maps\EIS\Ch12_WaterQuality\FIG_12_05_Referrable_Wetlands_151008.mxd
Revision: R1
Date: 8/10/2015 Author: malcolm.nunn1:80,000Map Scale:
Coordinate System: GDA 1994 MGA Zone 54
Referrable Wetlands -Wetland Management Areas
0 1 2 3 4 5Kilometers
Gulf Alumina Limited
!
!
!
!
Queensland
CAIRNS
BRISBANE
TOWNSVILLE
ROCKHAMPTON
±
No warranty is given in relation to the data (including accuracy, reliability, completeness or suitability) and accept no liability (including without limitation, liability in negligence) for any loss, damage or costs (including consequential damage) relating to any use of or reliance upon the data. Data must not be used for direct marketing or be used in breach of privacy laws. Tenures © Geos Mining (2015). State Boundaries and Towns © Geoscience Australia (2006). Watercourses © Geoscience Australia. Imagery sourced from Gulf Alumina. Wetland Management Areas © State of Queensland (Department of Environment and Heritage Protection) 2014.Wetland Buffer provided by RPS.
Legend!( Port of Skardon River
Mining Lease BoundariesExisting Disturbance FootprintProject FootprintSouthern Haul Road
WatercoursesWetland Management Area
HES WetlandGES Wetland
NAMALETACREEK
Pit #14
Pit #15 1:20,000
!(
ML 6025
ML 40082 ML40069
BigfootSwamp
LunetteSwamp
NAMALETACREEK
SKARDON RIVER
NAMALETACREEKPit#14
Pit #15
605000 610000 61500086
8500
0
8685
000
8690
000
8690
000
8695
000
8695
000
8700
000
8700
000
Figure 12-6
G:\CLIENTS\E-TO-M\Gulf Alumina\GIS\Maps\EIS\Ch12_WaterQuality\FIG_12_06_VMA_Wetlands_151008.mxd
Revision: R1
Date: 8/10/2015 Author: malcolm.nunn1:80,000Map Scale:
Coordinate System: GDA 1994 MGA Zone 54
Vegetation Management ActWetlands and Watercourses
0 1 2 3 4 5Kilometers
Gulf Alumina Limited
!
!
!
!
Queensland
CAIRNS
BRISBANE
TOWNSVILLE
ROCKHAMPTON
±
No warranty is given in relation to the data (including accuracy, reliability, completeness or suitability) and accept no liability (including without limitation, liability in negligence) for any loss, damage or costs (including consequential damage) relating to any use of or reliance upon the data. Data must not be used for direct marketing or be used in breach of privacy laws. Tenures © Geos Mining (2015). State Boundaries and Towns © Geoscience Australia (2006). Watercourses © Geoscience Australia. Imagery sourced from Gulf Alumina. VM Wetlands & Watercourses © State of Queensland (DNRM 2015). Wetland Buffer provided by RPS.
Legend!( Port of Skardon River
Mining Lease BoundariesExisting Disturbance FootprintProject FootprintSouthern Haul Road
VMA WatercoursesVMA Wetlands
NAMALETA
CREEK
Pit #14
Pit #15 1:20,000
!(
ML 6025
ML 40082 ML40069
NAMALETACREEK
NAMALETACREEKPit#14
Pit #15
605000 610000 61500086
8500
0
8685
000
8690
000
8690
000
8695
000
8695
000
8700
000
8700
000
Figure 12-7
G:\CLIENTS\E-TO-M\Gulf Alumina\GIS\Maps\EIS\Ch12_WaterQuality\FIG_12_07_Directory_Important_Wetlands_151008.mxd
Revision: R1
Date: 8/10/2015 Author: malcolm.nunn1:80,000Map Scale:
Coordinate System: GDA 1994 MGA Zone 54
Directory of Important Wetlands
0 1 2 3 4 5Kilometers
Gulf Alumina Limited
!
!
!
!
Queensland
CAIRNS
BRISBANE
TOWNSVILLE
ROCKHAMPTON
±
No warranty is given in relation to the data (including accuracy, reliability, completeness or suitability) and accept no liability (including without limitation, liability in negligence) for any loss, damage or costs (including consequential damage) relating to any use of or reliance upon the data. Data must not be used for direct marketing or be used in breach of privacy laws. Tenures © Geos Mining (2015). State Boundaries and Towns © Geoscience Australia (2006). Watercourses © Geoscience Australia. Imagery sourced from Gulf Alumina. Directory of Important Wetlands © State of Queensland - Department of Environment and Heritage Protection (2014).Wetland Buffer provided by RPS.
Legend!( Port of Skardon River
Mining Lease BoundariesExisting Disturbance FootprintProject FootprintSouthern Haul Road
WatercoursesDirectory of Important Wetlands
NAMALETACREEK
Pit #14
Pit #15 1:20,000

Skardon River Bauxite Project Chapter 12 – Water Values and Quality
Page 12-14
12.5 Water Quality Objectives
12.5.1 Environmental Values from EPP Water
These waters of the Project area are considered to be ‘high ecological value’ (waters in which the biological integrity of the water is effectively unmodified or highly valued). The former kaolin mining operations in the Project area, are not considered to have modified physical, chemical or other indicators.
The following EVs listed under the EPP Water are considered relevant to the waters potentially impacted by the Project:
For high ecological value waters - the biological integrity of an aquatic ecosystem.
For waters that may be used for recreation or aesthetic purposes - the suitability of the water for
secondary recreational use or visual recreational use. Secondary use involves boating and fishing.
There are low levels of recreational fishing, and associated camping (not in the Project’s mining
leases), in the Skardon River.
For waters that may be used for producing aquatic foods for human consumption - the suitability of
the water for producing the foods for human consumption. There is very limited use of the waters
for commercial fishing and no production of aquatic foods in the identified waters.
For waters that may be used for drinking water - the suitability of the water for supply as drinking
water. Only one shallow groundwater bore in the Project area is used for drinking water (kaolin
mine camp supply only) and will be the supply source for the Project’s camp. There are no known
human drinking water users of other fresh surface water sources from the identified waters.
For waters that may be used for industrial purposes - the suitability of the water for industrial use.
Shallow groundwater will be used for the Project’s mining operations (e.g. dust suppression). In
addition, surface water and / or groundwater may be used by other nearby proposed mining
operations in the future. The water quality is considered suitable for this purpose.
The cultural and spiritual values of the water. Indigenous people and groups with links to the Project
area have cultural and spiritual connections to the water. In addition to fishing, members of the
Indigenous community use the area for hunting. Namaleta Creek, Skardon River Estuary, Bigfoot
Swamp and Lunette Swamp are all of cultural and spiritual value to the Traditional Owners.
The following EVs listed under the EPP Water are not considered relevant to the waters potentially impacted by the Project:
For waters that may be used for recreation or aesthetic purposes, the suitability of the water for
primary recreational use. Primary recreational use involves full body contact with the water which,
due to the presence of crocodiles and sharks, is highly unlikely to occur.
For waters that may be used for aquaculture - the suitability of the water for aquacultural use.
There is no known existing or proposed aquacultural uses of the identified waters.
For waters that may be used for agricultural purposes - the suitability of the water for agricultural
purposes. There are no known existing uses of the identified waters for agricultural purposes. This
does not preclude the use of these waters at some point in future for agricultural purposes.
12.5.2 Water Quality Objectives
As described in Section 12.3.3, the QWQG recommends the use of local water quality objectives developed for appropriate indicators / parameters using monitoring data from local reference sites.

Skardon River Bauxite Project Chapter 12 – Water Values and Quality
Page 12-15
There is insufficient sampling data for some parameters with which to establish local water quality objectives under the QWQG. The QWQG does not provide guideline values for the region in which the Project is located. In addition, there are no site / waterway specific documents under the EPP Water for the identified waters. Therefore water quality objectives for the identified waters are based on the AWQG, where there is insufficient local water quality data.
The identified waters occur in tropical Australia at altitudes below 50m. The most appropriate AWQG trigger values to use are:
the physico-chemical trigger values for lowland rivers in tropical Australia for slightly disturbed
ecosystems (noting that there are no physico-chemical trigger values for high ecological value
waters)
the physico-chemical trigger values for wetlands in tropical Australia for slightly disturbed
ecosystems (noting that there are no physico-chemical trigger values for high ecological value
waters)
the toxicant trigger values for metal and metalloids to achieve 99% aquatic ecosystem protection
(applicable to high ecological value ecosystems)
the toxicant trigger values for heavy metals and metalloids in livestock drinking water (noting that
there is no current pastoral activity involving the identified waters).
The AWQG trigger values, are provided in Table 12-1 and have also been compared to the release limits and trigger investigation levels provided in the Model Mining Conditions (EHP, 2014) and the receiving waters contaminant trigger levels of the existing environmental authority (kaolin mining). The AWQG does not provide trigger values for certain parameters, as noted in Table 12-1.
Surface water and groundwater quality data, presented in Section 12.6 and Section 12.7 respectively, has been analysed for the 80th percentile for comparison to the AWQG values and to provide local water quality objectives where there is sufficient data. The parameters for which there is sufficient data collected to meet the requirements of the QWQGs are:
Namaleta Creek (refer Table 12-5)
electrical conductivity (EC) – 128 samples, collected over 19 months from 2008 to 2015 at sites
S1, S2, S6, S8, S9
pH – 124 samples, collected over 19 months from 2008 to 2015 at sites S1, S2, S6, S8, S9
total dissolved solids (TDS) – 46 samples collected over 5 months from 2014 to 2015 at sites S1,
S2, S6, S8, S9
turbidity – 134 samples, collected over 19 months from 2008 to 2015 at sites S1, S2, S6, S8, S9
Other parameters, although not meeting the criteria for local water quality objectives provide a reasonable indication of likely local water quality objectives that will be derived following additional monitoring. Note that one set of draft water quality objectives for all aquifers and surface water systems may not be appropriate. For the purpose of nominating water quality objectives for the Project’s environmental management plan (EM Plan) (Appendix 13), separate water quality objectives have been proposed for:
Namaleta Creek
wetlands
groundwater

Skardon River Bauxite Project Chapter 12 – Water Values and Quality
Page 12-16
Although groundwater data demonstrates variances between water quality at different shallow aquifers in the Project area, further monitoring data is required to inform the Project’s EM Plan and therefore one set of water quality objectives is proposed for all groundwater.
The methodology used for selection of the nominated water quality objectives for the Project is:
1. where there is sufficient data to set local water quality objectives, the 80th percentiles from sampling data has been used, and
2. where there is insufficient data to set local water quality objectives the lowest value from either the AWQG or Model Mining Conditions has been selected.
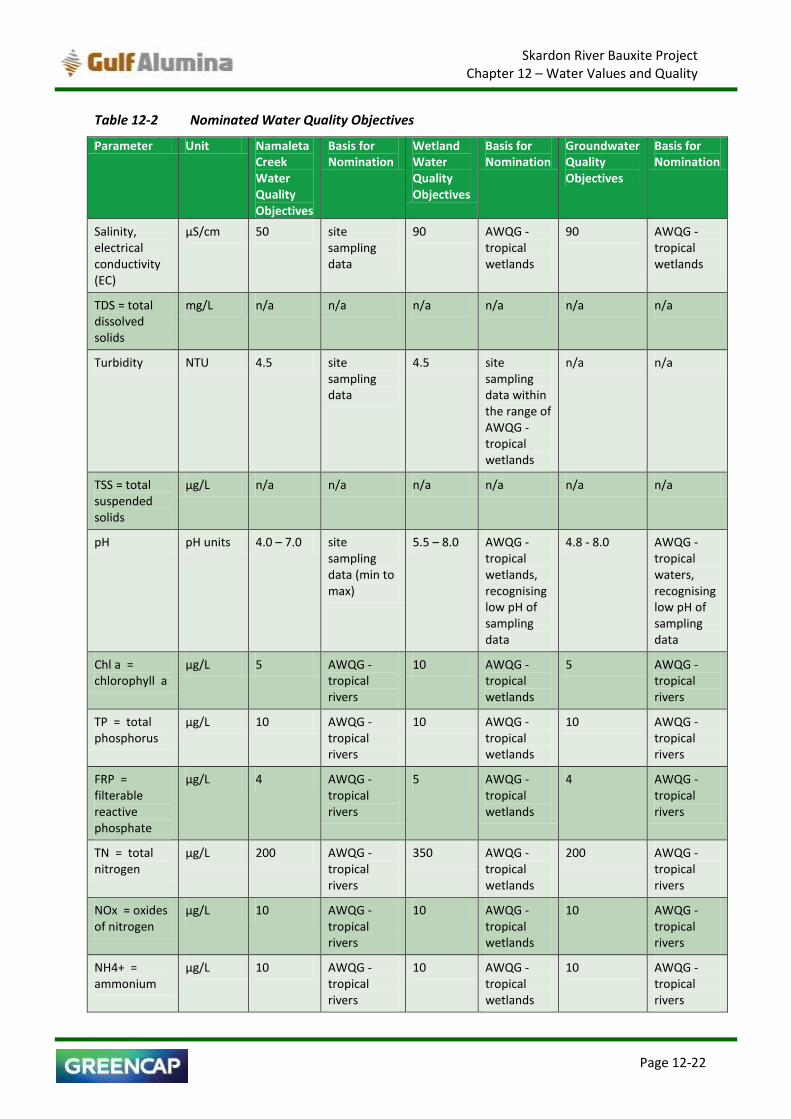
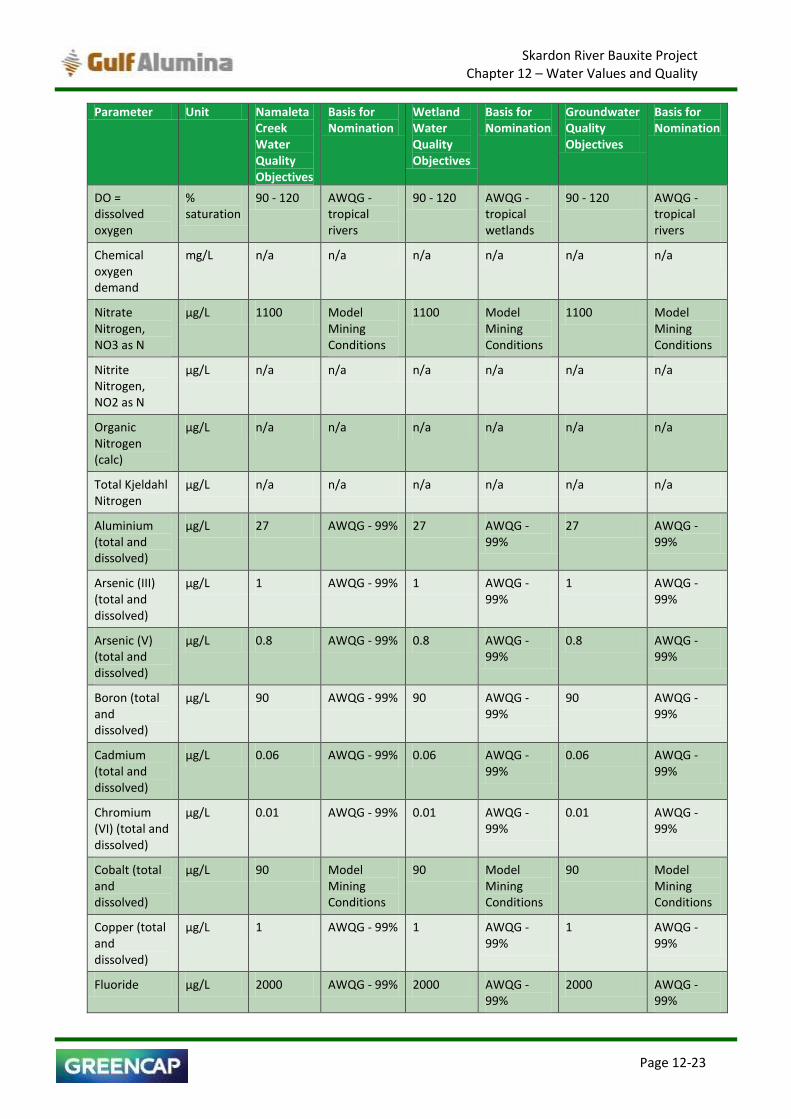
The nominated water quality objectives for the Project are presented in Table 12-2.
Sk
ard
on
Riv
er B
auxi
te P
roje
ct
C
hap
ter
12
– W
ate
r V
alu
es a
nd
Qu
alit
y
Pag
e 1
2-1
7
Tab
le 1
2-1
W
ate
r Q
ua
lity
Trig
ger
Va
lues
– A
WQ
G, M
od
el M
inin
g C
on
dit
ion
s, E
xist
ing
EA
an
d S
ite
Mo
nit
ori
ng
Da
ta
Par
ame
ter
Un
it
AW
QG
Tr
igge
r V
alu
e –
Tr
op
ical
Lo
wla
nd
R
ive
rs
AW
QG
Tr
igge
r V
alu
e –
Tr
op
ical
W
etl
and
s
AW
QG
Tr
igge
r V
alu
e –
9
9%
P
rote
ctio
n
AW
QG
Tr
igge
r V
alu
e –
Li
vest
ock
(c
attl
e)
Mo
de
l M
inin
g C
on
dit
ion
s
Exis
tin
g EA
–
Surf
ace
w
ate
r
Exis
tin
g EA
–
gro
un
d
wat
er
Gro
un
d
Wat
er
Mo
nit
ori
ng
Dat
a (8
0th
p
erc
en
tile
)
Nam
ale
ta
Cre
ek
Mo
nit
ori
ng
Dat
a (8
0th
p
erc
en
tile
)
We
tlan
d
Mo
nit
ori
ng
Dat
a (8
0th
p
erc
en
tile
)
Salin
ity,
el
ectr
ical
co
nd
uct
ivit
y (E
C)
µS/
cm
20
- 2
50
9
0 –
90
0
n/a
n
/a
Site
sp
ecif
ic -
as
per
d
escr
ibed
m
eth
od
Hig
her
of
90
0
or
the
80
th
per
cen
tile
of
the
refe
ren
ce
site
Hig
her
of
90
0
or
the
80
th
per
cen
tile
of
the
refe
ren
ce
bo
re, m
ax 5
00
10
1.6
5
0
32
.4
TDS
= to
tal
dis
solv
ed
solid
s
mg/
L n
/a
n/a
n
/a
40
00
-
50
00
n
/a
n/a
n
/a
12
0
31
9
4
Turb
idit
y N
TU
2 -
15
2
- 2
00
n
/a
n/a
n
/a
Hig
her
of
20
or
the
80
th
per
cen
tile
of
the
refe
ren
ce
site
n/a
IS
D
4.5
4
.6
TSS
= to
tal
susp
end
ed
solid
s
µg/
L n
/a
n/a
n
/a
n/a
n
/a
n/a
n
/a
ISD
IS
D
ISD
pH
p
H u
nit
s 6
.0 –
8.0
6
.0 –
8.0
n
/a
n/a
6
.5 –
9.0
Lo
wes
t o
f 7
or
the
20
th
per
cen
tile
of
the
refe
ren
ce
site
to
hig
her
of
8.5
or
the
80
th
per
cen
tile
of
the
refe
ren
ce
site
As
per
su
rfac
e w
ater
20
th %
ile =
5
.3
80
th
%ile
=
5
.83
Min
= 4
.8
Max
= 6
.2
20
th %
ile =
4.7
8
80
th %
ile =
5.4
5
Min
= 4
.08
Max
= 7
.03
20
th %
ile =
5
.66
8
0th
%ile
=
6.0
2
Min
= 5
.6
Max
= 6
.2
Ch
l a =
ch
loro
ph
yll
a µ
g/L
5
10
n
/a
n/a
n
/a
n/a
n
/a
ISD
IS
D
ISD

Sk
ard
on
Riv
er B
auxi
te P
roje
ct
C
hap
ter
12
– W
ate
r V
alu
es a
nd
Qu
alit
y
Pag
e 1
2-1
8
Par
ame
ter
Un
it
AW
QG
Tr
igge
r V
alu
e –
Tr
op
ical
Lo
wla
nd
R
ive
rs
AW
QG
Tr
igge
r V
alu
e –
Tr
op
ical
W
etl
and
s
AW
QG
Tr
igge
r V
alu
e –
9
9%
P
rote
ctio
n
AW
QG
Tr
igge
r V
alu
e –
Li
vest
ock
(c
attl
e)
Mo
de
l M
inin
g C
on
dit
ion
s
Exis
tin
g EA
–
Surf
ace
w
ate
r
Exis
tin
g EA
–
gro
un
d
wat
er
Gro
un
d
Wat
er
Mo
nit
ori
ng
Dat
a (8
0th
p
erc
en
tile
)
Nam
ale
ta
Cre
ek
Mo
nit
ori
ng
Dat
a (8
0th
p
erc
en
tile
)
We
tlan
d
Mo
nit
ori
ng
Dat
a (8
0th
p
erc
en
tile
)
TP =
to
tal
ph
osp
ho
rus
µg/
L 1
0
10
- 5
0
n/a
n
/a
n/a
n
/a
n/a
1
10
IS
D
17
8
FRP
=
filt
erab
le
reac
tive
p
ho
sph
ate
µg/
L 4
5
- 2
5
n/a
n
/a
n/a
n
/a
n/a
IS
D
ISD
IS
D
TN =
to
tal
nit
roge
n
µg/
L 2
00
–
30
0
35
0 -
1
20
0
n/a
n
/a
n/a
n
/a
n/a
3
24
1
50
5
82
NO
x =
oxi
des
o
f n
itro
gen
µ
g/L
10
1
0
n/a
n
/a
n/a
n
/a
n/a
IS
D
ISD
IS
D
NH
4+
=
amm
on
ium
µ
g/L
10
1
0
n/a
n
/a
90
0
n/a
H
igh
er o
f 1
5
or
the
80
th
per
cen
tile
of
the
refe
ren
ce
bo
re, m
ax 5
00
ISD
IS
D
ISD
DO
=
dis
solv
ed
oxy
gen
%
satu
rati
on
9
0 -
12
0
90
- 1
20
n
/a
n/a
n
/a
n/a
n
/a
ISD
IS
D
ISD
Ch
emic
al
oxy
gen
d
eman
d
mg/
L n
/a
n/a
n
/a
n/a
n
/a
n/a
H
igh
er o
f 4
0
or
the
80
th
per
cen
tile
of
the
refe
ren
ce
bo
re
ISD
IS
D
ISD
Nit
rate
N
itro
gen
, NO
3
as N
µg/
L n
/a
n/a
n
/a
n/a
1
10
0
n/a
n
/a
ISD
IS
D
ISD
Sk
ard
on
Riv
er B
auxi
te P
roje
ct
C
hap
ter
12
– W
ate
r V
alu
es a
nd
Qu
alit
y
Pag
e 1
2-1
9
Par
ame
ter
Un
it
AW
QG
Tr
igge
r V
alu
e –
Tr
op
ical
Lo
wla
nd
R
ive
rs
AW
QG
Tr
igge
r V
alu
e –
Tr
op
ical
W
etl
and
s
AW
QG
Tr
igge
r V
alu
e –
9
9%
P
rote
ctio
n
AW
QG
Tr
igge
r V
alu
e –
Li
vest
ock
(c
attl
e)
Mo
de
l M
inin
g C
on
dit
ion
s
Exis
tin
g EA
–
Surf
ace
w
ate
r
Exis
tin
g EA
–
gro
un
d
wat
er
Gro
un
d
Wat
er
Mo
nit
ori
ng
Dat
a (8
0th
p
erc
en
tile
)
Nam
ale
ta
Cre
ek
Mo
nit
ori
ng
Dat
a (8
0th
p
erc
en
tile
)
We
tlan
d
Mo
nit
ori
ng
Dat
a (8
0th
p
erc
en
tile
)
Nit
rite
N
itro
gen
, NO
2
as N
µg/
L n
/a
n/a
n
/a
n/a
n
/a
n/a
n
/a
ISD
IS
D
ISD
Org
anic
N
itro
gen
(ca
lc)
µg/
L n
/a
n/a
n
/a
n/a
n
/a
n/a
n
/a
ISD
IS
D
ISD
Tota
l Kje
ldah
l N
itro
gen
µ
g/L
n/a
n
/a
n/a
n
/a
n/a
n
/a
n/a
IS
D
ISD
IS
D
Alu
min
ium
(t
ota
l an
d
dis
solv
ed)
µg/
L n
/a
n/a
2
7
50
00
5
5
n/a
n
/a
27
.6
50
1
30
Ars
enic
(II
I)
(to
tal a
nd
d
isso
lved
)
µg/
L n
/a
n/a
1
5
00
n
/a
n/a
n
/a
ISD
IS
D
ISD
Ars
enic
(V
) (t
ota
l an
d
dis
solv
ed)
µg/
L n
/a
n/a
0
.8
n/a
1
3
n/a
n
/a
1.4
IS
D
ISD
Bo
ron
(to
tal
and
dis
solv
ed)
µg/
L n
/a
n/a
9
0
50
00
3
70
n
/a
n/a
IS
D
ISD
IS
D
Cad
miu
m
(to
tal a
nd
d
isso
lved
)
µg/
L n
/a
n/a
0
.06
1
0
0.2
n
/a
n/a
IS
D
ISD
IS
D
Ch
rom
ium
(V
I)
(to
tal a
nd
d
isso
lved
)
µg/
L n
/a
n/a
0
.01
1
00
0
1.0
n
/a
n/a
1
.6
ISD
IS
D
Co
bal
t (t
ota
l an
d d
isso
lved
) µ
g/L
n/a
n
/a
ID
10
00
9
0
n/a
n
/a
ISD
IS
D
ISD

Sk
ard
on
Riv
er B
auxi
te P
roje
ct
C
hap
ter
12
– W
ate
r V
alu
es a
nd
Qu
alit
y
Pag
e 1
2-2
0
Par
ame
ter
Un
it
AW
QG
Tr
igge
r V
alu
e –
Tr
op
ical
Lo
wla
nd
R
ive
rs
AW
QG
Tr
igge
r V
alu
e –
Tr
op
ical
W
etl
and
s
AW
QG
Tr
igge
r V
alu
e –
9
9%
P
rote
ctio
n
AW
QG
Tr
igge
r V
alu
e –
Li
vest
ock
(c
attl
e)
Mo
de
l M
inin
g C
on
dit
ion
s
Exis
tin
g EA
–
Surf
ace
w
ate
r
Exis
tin
g EA
–
gro
un
d
wat
er
Gro
un
d
Wat
er
Mo
nit
ori
ng
Dat
a (8
0th
p
erc
en
tile
)
Nam
ale
ta
Cre
ek
Mo
nit
ori
ng
Dat
a (8
0th
p
erc
en
tile
)
We
tlan
d
Mo
nit
ori
ng
Dat
a (8
0th
p
erc
en
tile
)
Co
pp
er (
tota
l an
d d
isso
lved
) µ
g/L
n/a
n
/a
1.0
1
00
0
2.0
n
/a
n/a
4
1
4.2
2
.8
Flu
ori
de
µ
g/L
n/a
n
/a
n/a
2
00
0
20
00
n
/a
n/a
IS
D
ISD
IS
D
Iro
n (
tota
l an
d
dis
solv
ed)
µg/
L n
/a
n/a
ID
N
ST
30
0
n/a
n
/a
48
6
10
4.4
1
69
.4
Lead
(to
tal
and
dis
solv
ed)
µg/
L n
/a
n/a
1
.0
10
0
4.0
n
/a
n/a
1
.2
ISD
IS
D
Man
gan
ese
(to
tal a
nd
d
isso
lved
)
µg/
L n
/a
n/a
1
20
0
NST
1
90
0
n/a
n
/a
19
.2
3
8
Mer
cury
(to
tal
and
dis
solv
ed)
µg/
L n
/a
n/a
0
.06
2
0
.2
n/a
n
/a
ISD
IS
D
ISD
Mo
lyb
den
um
(t
ota
l an
d
dis
solv
ed)
µg/
L n
/a
n/a
ID
1
50
3
4
n/a
n
/a
ISD
IS
D
ISD
Nic
kel (
tota
l an
d d
isso
lved
) µ
g/L
n/a
n
/a
8
10
00
1
1
n/a
n
/a
7
ISD
IS
D
Sele
niu
m
(to
tal a
nd
d
isso
lved
)
µg/
L n
/a
n/a
5
2
0
10
n
/a
n/a
IS
D
ISD
IS
D
Silv
er (
tota
l an
d d
isso
lved
) µ
g/L
n/a
n
/a
0.0
2
ND
1
n
/a
n/a
IS
D
ISD
IS
D
Ura
niu
m(t
ota
l an
d d
isso
lved
) µ
g/L
n/a
n
/a
ID
20
0
1
n/a
n
/a
ISD
IS
D
ISD

Sk
ard
on
Riv
er B
auxi
te P
roje
ct
C
hap
ter
12
– W
ate
r V
alu
es a
nd
Qu
alit
y
Pag
e 1
2-2
1
Par
ame
ter
Un
it
AW
QG
Tr
igge
r V
alu
e –
Tr
op
ical
Lo
wla
nd
R
ive
rs
AW
QG
Tr
igge
r V
alu
e –
Tr
op
ical
W
etl
and
s
AW
QG
Tr
igge
r V
alu
e –
9
9%
P
rote
ctio
n
AW
QG
Tr
igge
r V
alu
e –
Li
vest
ock
(c
attl
e)
Mo
de
l M
inin
g C
on
dit
ion
s
Exis
tin
g EA
–
Surf
ace
w
ate
r
Exis
tin
g EA
–
gro
un
d
wat
er
Gro
un
d
Wat
er
Mo
nit
ori
ng
Dat
a (8
0th
p
erc
en
tile
)
Nam
ale
ta
Cre
ek
Mo
nit
ori
ng
Dat
a (8
0th
p
erc
en
tile
)
We
tlan
d
Mo
nit
ori
ng
Dat
a (8
0th
p
erc
en
tile
)
Van
adiu
m
(to
tal a
nd
d
isso
lved
)
µg/
L n
/a
n/a
ID
N
D
10
n
/a
n/a
IS
D
ISD
IS
D
Zin
c (t
ota
l an
d
dis
solv
ed)
µg/
L n
/a
n/a
2
.4
20
00
0
8
n/a
n
/a
90
.8
ISD
IS
D
Pet
role
um
h
ydro
carb
on
s (C
6-C
9)
µg/
L n
/a
n/a
ID
n
/a
20
n
/a
No
vis
ible
fi
lm o
r d
etec
tab
le
od
ou
r
ISD
IS
D
ISD
Pet
role
um
h
ydro
carb
on
s (C
10
-C3
6)
µg/
L n
/a
n/a
ID
n
/a
10
0
n/a
N
o v
isib
le
film
or
det
ecta
ble
o
do
ur
ISD
IS
D
ISD
n/a
= n
ot
ap
plic
ab
le o
r n
ot
pro
vid
ed
ID =
Insu
ffic
ien
t d
ata
– a
s p
er A
WQ
G
ISD
= In
suff
icie
nt
sam
plin
g d
ata
to
set
dra
ft t
rig
ger
va
lues
80
th p
erce
nti
le
ND
= N
ot
det
erm
ined
– a
s p
er A
WQ
G
NST
= n
ot
suff
icie
ntl
y to
xic –
as
per
AW
QG
Site
sp
ecif
ic t
rig
ger
va
lues
ba
sed
on
dis
solv
ed m
eta
l sp
ecie
s
Skardon River Bauxite Project Chapter 12 – Water Values and Quality
Page 12-22
Table 12-2 Nominated Water Quality Objectives
Parameter Unit Namaleta Creek Water Quality Objectives
Basis for Nomination
Wetland Water Quality Objectives
Basis for Nomination
Groundwater Quality Objectives
Basis for Nomination
Salinity, electrical conductivity (EC)
µS/cm 50 site sampling data
90 AWQG - tropical wetlands
90 AWQG - tropical wetlands
TDS = total dissolved solids
mg/L n/a n/a n/a n/a n/a n/a
Turbidity NTU 4.5 site sampling data
4.5 site sampling data within the range of AWQG - tropical wetlands
n/a n/a
TSS = total suspended solids
µg/L n/a n/a n/a n/a n/a n/a
pH pH units 4.0 – 7.0 site sampling data (min to max)
5.5 – 8.0 AWQG - tropical wetlands, recognising low pH of sampling data
4.8 - 8.0 AWQG - tropical waters, recognising low pH of sampling data
Chl a = chlorophyll a
µg/L 5 AWQG - tropical rivers
10 AWQG - tropical wetlands
5 AWQG - tropical rivers
TP = total phosphorus
µg/L 10 AWQG - tropical rivers
10 AWQG - tropical wetlands
10 AWQG - tropical rivers
FRP = filterable reactive phosphate
µg/L 4 AWQG - tropical rivers
5 AWQG - tropical wetlands
4 AWQG - tropical rivers
TN = total nitrogen
µg/L 200 AWQG - tropical rivers
350 AWQG - tropical wetlands
200 AWQG - tropical rivers
NOx = oxides of nitrogen
µg/L 10 AWQG - tropical rivers
10 AWQG - tropical wetlands
10 AWQG - tropical rivers
NH4+ = ammonium
µg/L 10 AWQG - tropical rivers
10 AWQG - tropical wetlands
10 AWQG - tropical rivers
Skardon River Bauxite Project Chapter 12 – Water Values and Quality
Page 12-23
Parameter Unit Namaleta Creek Water Quality Objectives
Basis for Nomination
Wetland Water Quality Objectives
Basis for Nomination
Groundwater Quality Objectives
Basis for Nomination
DO = dissolved oxygen
% saturation
90 - 120 AWQG - tropical rivers
90 - 120 AWQG - tropical wetlands
90 - 120 AWQG - tropical rivers
Chemical oxygen demand
mg/L n/a n/a n/a n/a n/a n/a
Nitrate Nitrogen, NO3 as N
µg/L 1100 Model Mining Conditions
1100 Model Mining Conditions
1100 Model Mining Conditions
Nitrite Nitrogen, NO2 as N
µg/L n/a n/a n/a n/a n/a n/a
Organic Nitrogen (calc)
µg/L n/a n/a n/a n/a n/a n/a
Total Kjeldahl Nitrogen
µg/L n/a n/a n/a n/a n/a n/a
Aluminium (total and dissolved)
µg/L 27 AWQG - 99% 27 AWQG - 99%
27 AWQG - 99%
Arsenic (III) (total and dissolved)
µg/L 1 AWQG - 99% 1 AWQG - 99%
1 AWQG - 99%
Arsenic (V) (total and dissolved)
µg/L 0.8 AWQG - 99% 0.8 AWQG - 99%
0.8 AWQG - 99%
Boron (total and dissolved)
µg/L 90 AWQG - 99% 90 AWQG - 99%
90 AWQG - 99%
Cadmium (total and dissolved)
µg/L 0.06 AWQG - 99% 0.06 AWQG - 99%
0.06 AWQG - 99%
Chromium (VI) (total and dissolved)
µg/L 0.01 AWQG - 99% 0.01 AWQG - 99%
0.01 AWQG - 99%
Cobalt (total and dissolved)
µg/L 90 Model Mining Conditions
90 Model Mining Conditions
90 Model Mining Conditions
Copper (total and dissolved)
µg/L 1 AWQG - 99% 1 AWQG - 99%
1 AWQG - 99%
Fluoride µg/L 2000 AWQG - 99% 2000 AWQG - 99%
2000 AWQG - 99%

Skardon River Bauxite Project Chapter 12 – Water Values and Quality
Page 12-24
Parameter Unit Namaleta Creek Water Quality Objectives
Basis for Nomination
Wetland Water Quality Objectives
Basis for Nomination
Groundwater Quality Objectives
Basis for Nomination
Iron (total and dissolved)
µg/L 300 Model Mining Conditions
300 Model Mining Conditions
300 Model Mining Conditions
Lead (total and dissolved)
µg/L 1 AWQG - 99% 1 AWQG - 99%
1 AWQG - 99%
Manganese (total and dissolved)
µg/L 1200 AWQG - 99% 1200 AWQG - 99%
1200 AWQG - 99%
Mercury (total and dissolved)
µg/L 0.06 AWQG - 99% 0.06 AWQG - 99%
0.06 AWQG - 99%
Molybdenum (total and dissolved)
µg/L 34 Model Mining Conditions
34 Model Mining Conditions
34 Model Mining Conditions
Nickel (total and dissolved)
µg/L 8 AWQG - 99% 8 AWQG - 99%
8 AWQG - 99%
Selenium (total and dissolved)
µg/L 5 AWQG - 99% 5 AWQG - 99%
5 AWQG - 99%
Silver (total and dissolved)
µg/L 0.02 AWQG - 99% 0.02 AWQG - 99%
0.02 AWQG - 99%
Uranium(total and dissolved)
µg/L 1 Model Mining Conditions
1 Model Mining Conditions
1 Model Mining Conditions
Vanadium (total and dissolved)
µg/L 10 Model Mining Conditions
10 Model Mining Conditions
10 Model Mining Conditions
Zinc (total and dissolved)
µg/L 2.4 AWQG - 99% 2.4 AWQG - 99%
2.4 AWQG - 99%
Petroleum hydrocarbons (C6-C9)
µg/L 20 Model Mining Conditions
20 Model Mining Conditions
20 Model Mining Conditions
Petroleum hydrocarbons (C10-C36)
µg/L 100 Model Mining Conditions
100 Model Mining Conditions
100 Model Mining Conditions

Skardon River Bauxite Project Chapter 12 – Water Values and Quality
Page 12-25
12.6 Surface Water Monitoring
12.6.1 Surface Water Monitoring Locations
Surface water monitoring has occurred intermittently in the Project area over the past 25 years, primarily to identify potential impacts of the former kaolin mine operations. Surface water monitoring has occurred at the locations listed in Table 12-3 and shown in Figure 12-8. Surface water monitoring sites have been assigned different names over the course of kaolin mining activities. These historical names are provided in Table 12-3, including noting monitoring site names under the current environmental authority.
Surface water level monitoring was undertaken from mid 2014 at S10 and S11, and from early 2015 at S1, S8 and S9.
Monitoring of physical parameters (pH and EC) has been undertaken at most sites since early 2008, with more comprehensive monitoring including selected metals and nutrients since February 2015.
During 2015, surface water monitoring comprised 10 locations across the Project area. Water quality parameters measured in the field include pH, EC, TDS, turbidity, DO and redox. In addition there were laboratory determinations of selected metals. Laboratory analysis was undertaken by a NATA accredited laboratory. There was limited testing for nutrients, which is of limited value as baseline data, but has been included for completeness.
Note that sites S3, S4 and S5 are located within the existing kaolin mine water storage pits and hence water quality at these sites is not representative of ambient / baseline water quality in natural systems, and is therefore presented separately below. Site S13 monitors water quality from releases from the existing Port sediment pond, which are extremely limited to date and do not provide representative baseline water quality, and hence data is not provided for this site.
Marine water quality data is presented in Chapter 17. Site S7 has limited marine water quality from the estuarine section of Namaleta Creek. Site S14 has had limited sampling from the marine / estuarine environment at the Port, but will potentially be a monitoring site for an alternative Port sediment pond proposed for the Project. Data for site S7 and S14 is not presented. Sites S7, S15, S16 and S17 are proposed for ongoing marine / estuarine water quality sampling. Site S18 is proposed for monitoring of the supratidal wetland along the Skardon River South Arm.
Table 12-3 Surface Water Monitoring Data
Site Number
Historical Site Name
Easting Northing Creek / Water Body Water Level Data
Water Quality Data
S1 Nam-1 610491 8685825 Namaleta Creek upstream of all proposed mining
from January 2015
from February 2015
S2 Upstream Water Pit (per EA)
609949 8686287 Namaleta Creek upstream of kaolin mine, downstream of some bauxite mining
n/a from January 2008
S3 W1 (per EA) – discharge point from raw water pit
609803 8686458 Raw Water Pit n/a from January 2008
S4 n/a 609937 8686458 Raw Water Pit n/a from January 2008
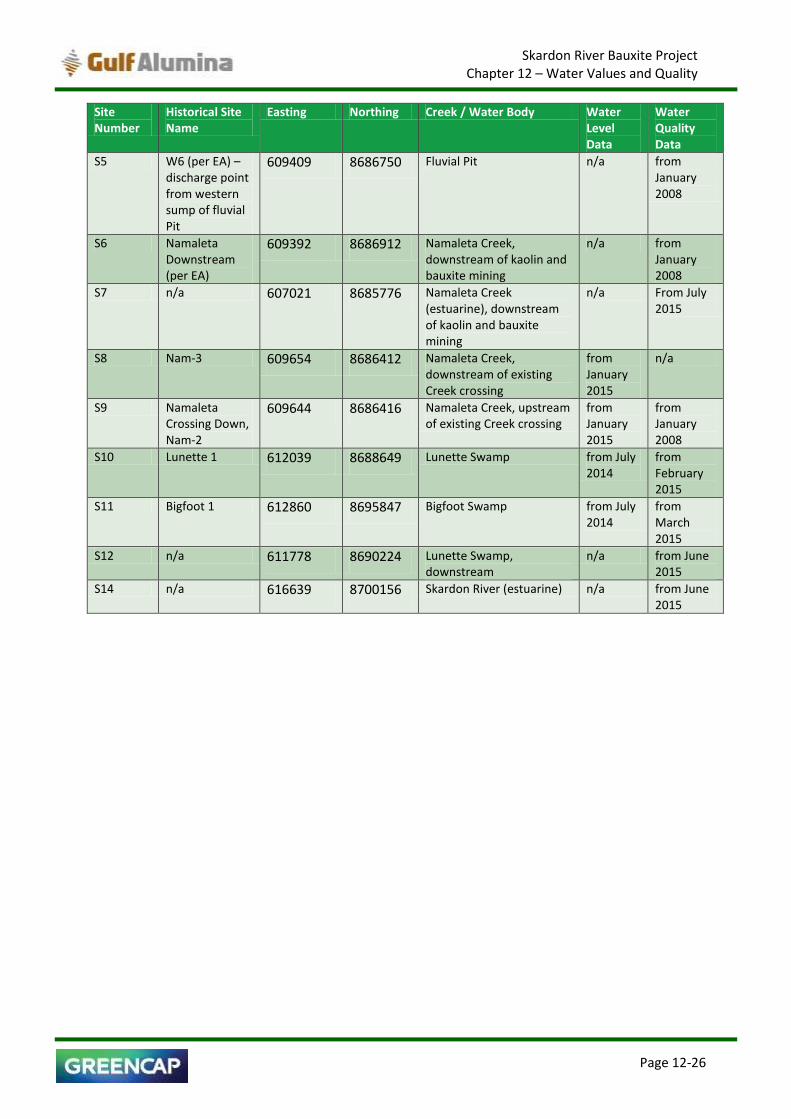
Skardon River Bauxite Project Chapter 12 – Water Values and Quality
Page 12-26
Site Number
Historical Site Name
Easting Northing Creek / Water Body Water Level Data
Water Quality Data
S5 W6 (per EA) – discharge point from western sump of fluvial Pit
609409 8686750 Fluvial Pit n/a from January 2008
S6 Namaleta Downstream (per EA)
609392 8686912 Namaleta Creek, downstream of kaolin and bauxite mining
n/a from January 2008
S7 n/a 607021 8685776 Namaleta Creek (estuarine), downstream of kaolin and bauxite mining
n/a From July 2015
S8 Nam-3 609654 8686412 Namaleta Creek, downstream of existing Creek crossing
from January 2015
n/a
S9 Namaleta Crossing Down, Nam-2
609644 8686416 Namaleta Creek, upstream of existing Creek crossing
from January 2015
from January 2008
S10 Lunette 1 612039 8688649 Lunette Swamp from July 2014
from February 2015
S11 Bigfoot 1 612860 8695847 Bigfoot Swamp from July 2014
from March 2015
S12 n/a 611778 8690224 Lunette Swamp, downstream
n/a from June 2015
S14 n/a 616639 8700156 Skardon River (estuarine) n/a from June 2015
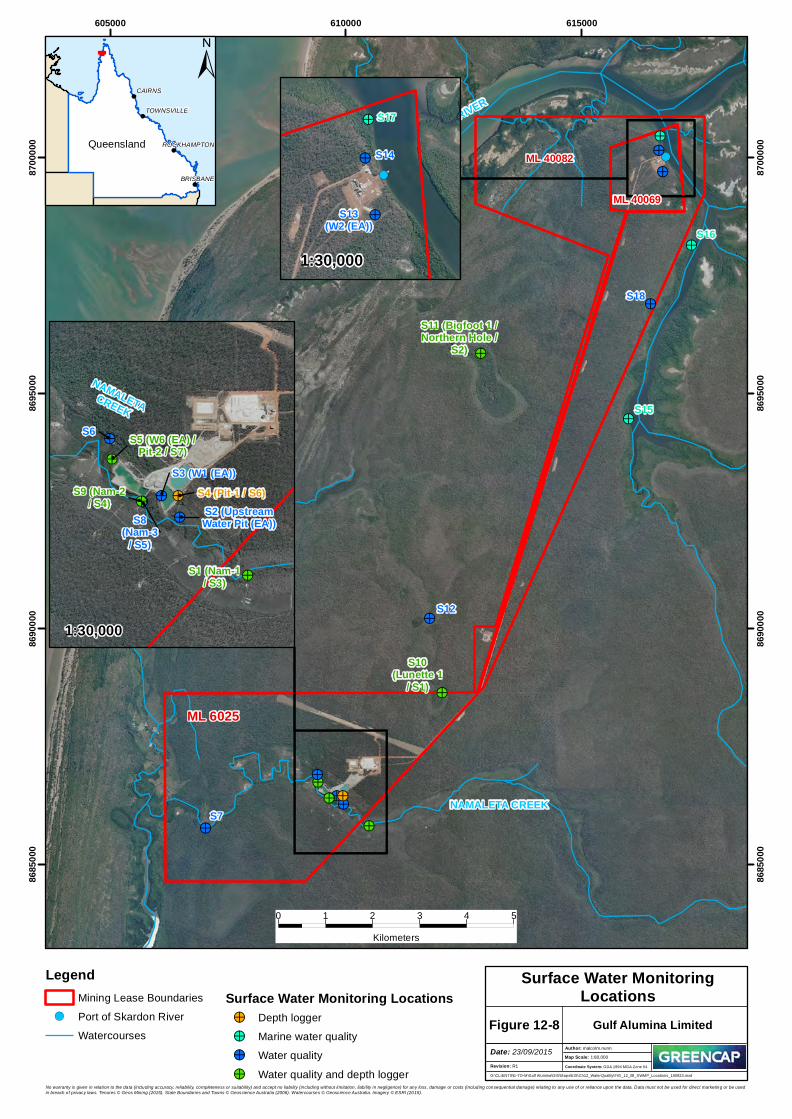
!(
!>
!>
!>
!>
!>
!>
!>
!>
!>!>!>
!>!>
!>
!>
!>
!>
!>
ML 6025
ML 40082
ML 40069
SKARDON RIVER
NAMALETA CREEK
S15
S16
S7
S10(Lunette 1
/ S1)
S11 (Bigfoot 1 /Northern Hole /
S2)
S12
S18
605000 610000 61500086
8500
0
8685
000
8690
000
8690
000
8695
000
8695
000
8700
000
8700
000
Figure 12-8
G:\CLIENTS\E-TO-M\Gulf Alumina\GIS\Maps\EIS\Ch12_WaterQuality\FIG_12_08_SWMP_Locations_150923.mxd
Revision: R1
Date: 23/09/2015 Author: malcolm.nunn1:80,000Map Scale:
Coordinate System: GDA 1994 MGA Zone 54
Surface Water MonitoringLocations
0 1 2 3 4 5Kilometers
Gulf Alumina Limited
!
!
!
!
Queensland
CAIRNS
BRISBANE
TOWNSVILLE
ROCKHAMPTON
±
No warranty is given in relation to the data (including accuracy, reliability, completeness or suitability) and accept no liability (including without limitation, liability in negligence) for any loss, damage or costs (including consequential damage) relating to any use of or reliance upon the data. Data must not be used for direct marketing or be used in breach of privacy laws. Tenures © Geos Mining (2015). State Boundaries and Towns © Geoscience Australia (2006). Watercourses © Geoscience Australia. Imagery © ESRI (2015).
LegendMining Lease Boundaries
!( Port of Skardon RiverWatercourses
Surface Water Monitoring Locations!> Depth logger!> Marine water quality!> Water quality!> Water quality and depth logger
!>
!>
!>
!>
!>
!>
!>!>
S3 (W1 (EA))
S2 (UpstreamWater Pit (EA))
S1 (Nam-1/ S3)
S4 (Pit-1 / S6)
S5 (W6 (EA) /Pit-2 / S7)
S6
S8(Nam-3
/ S5)
S9 (Nam-2/ S4)
NAMALETACREEK
!(
!>
!>
!>
S13(W2 (EA))
S14
S17
1:30,000
1:30,000

Skardon River Bauxite Project Chapter 12 – Water Values and Quality
Page 12-28
12.6.2 Surface Water Level Data
Results of surface water level logging are provided in Table 12-4, and illustrated in graphs in Appendix 4, with an example for site S8 presented in Figure 12-9. These graphs also show rainfall during the monitoring period. There are some data spikes and drop outs noted in the data, these are likely due to the retrieval of the logger for downloading of data. These irregularities have been filtered from the data for the purpose of interpretation in this report.
The surface water level records have not been reduced to any local survey datum. Hence, surface water data records refer to water surface depths above the logger level. Despite this, the data is useful in understanding the seasonal variation in water levels and the response to rainfall events.
Surface water level in all locations is seasonally variable, with elevated water levels in the period February to March each year, co-incident with the wet season. The variation in water level between wet and dry seasons is between 0.88 to 4.2m, depending on the location. It is noted that water level responds very directly to rainfall, with an almost immediate response in water level to rainfall events apparent in Namaleta Creek. The response to rainfall of the sites in Lunette Swamp and Bigfoot Swamp is more subdued.
Table 12-4 Surface Water Levels
Site Number Location Minimum Water Level (m)
Maximum Water Level (m)
Seasonal Water Level Range (m)
S1 Namaleta Creek 0.35 1.23 0.88
S8 Namaleta Creek 0.31 1.95 1.64
S9 Namaleta Creek 0.0 0.96 0.96
S10 Lunette Swamp 0.0 4.20 4.2
S11 Bigfoot Swamp 0 3.0 3.0
Figure 12-9 Site S8 Surface Water Level and Rainfall

Skardon River Bauxite Project Chapter 12 – Water Values and Quality
Page 12-29
12.6.3 Surface Water Quality
The results of surface water quality testing are tabulated and graphed in Appendix 4. The physical parameters from surface water monitoring has been summarised by the location, either Namaleta Creek, the wetlands (Lunette Swamp and Bigfoot Swamp) or kaolin water storages (Raw Water Pit and Fluvial Pit).
Physical parameter data from surface water has been obtained from Namaleta Creek over four wet seasons, and thus there is enough data to propose statistically valid site specific trigger values in accordance with the AWQG for a limited number of parameters (EC, pH TDS and turbidity). The bulk of the trace metal and nutrient surface water quality data for Namaleta Creek has been obtained during a four month period of 2015. Thus, there is not enough data to propose statistically valid site specific trigger values for metals and nutrients in accordance with the AWQG. Despite this, there is sufficient data to make some initial interpretation of the surface water quality onsite.
12.6.3.1 Physical Parameters
Physical parameters for Namaleta Creek, the wetlands and kaolin water storages are presented in Table 12-5 Table 12-6 and Table 12-7 respectively. Note that there was not enough data for dissolved oxygen and redox for valid statistics. The 20th percentile was only calculated for pH.
pH is moderately acidic to neutral, ranging from 4.08 to 7.13 pH units. The weakly acidic pH is a reflection of the geology of the catchment.
EC is low, ranging from 16 to 440 µS/cm. The majority of EC is very low, with the 80th percentile value of 50 µS/cm for Namaleta Creek, 32 µS/cm for the wetlands and 97 µS/cm for the kaolin water stoarges. It is noted that elevated values can be recorded at site S6 (including the maximum of 440 µS/cm) and this is interpreted to occur due to high tidal levels, coincident with the dry season (hence low water levels in Namaleta Creek).
Table 12-5 Surface Water Physical Parameter Summary Results – Namaleta Creek
Sites Statistical Element pH (pH units) EC (µS/cm) TDS (mg/L) Turbidity (NTU)
S1,S2, S6, S8, S9 minimum 4.08 16.2 11 0
maximum 7.03 440 92 30.3
mean 5.15 46.10 25.97 3.56
median 5.04 32.85 21 2.645
20th percentile 4.78
80th percentile 5.45 50.02 31 4.51
n 124 128 46 134
Table 12-6 Surface Water Physical Parameter Summary Results – Wetlands
Sites Statistical Element pH (pH units) EC (µS/cm) TDS (mg/L) Turbidity (NTU)
S10, S11, S12 minimum 5.6 18 18 1.4
maximum 6.2 35 200 140
mean 5.88 28 73.57 16.83
median 5.9 30 64 2.15
20th percentile 5.66
80th percentile 6.02 32.4 94 4.56
n 10 7 10 10
Table 12-7 Surface Water Physical Parameter Summary Results – Kaolin Water Storages
Sites Statistical Element pH (pH units) EC (µS/cm) TDS (mg/L) Turbidity (NTU)
S3, S4, S5 minimum 4.58 25.40 0 0.9
maximum 7.13 162.00 105 310.0
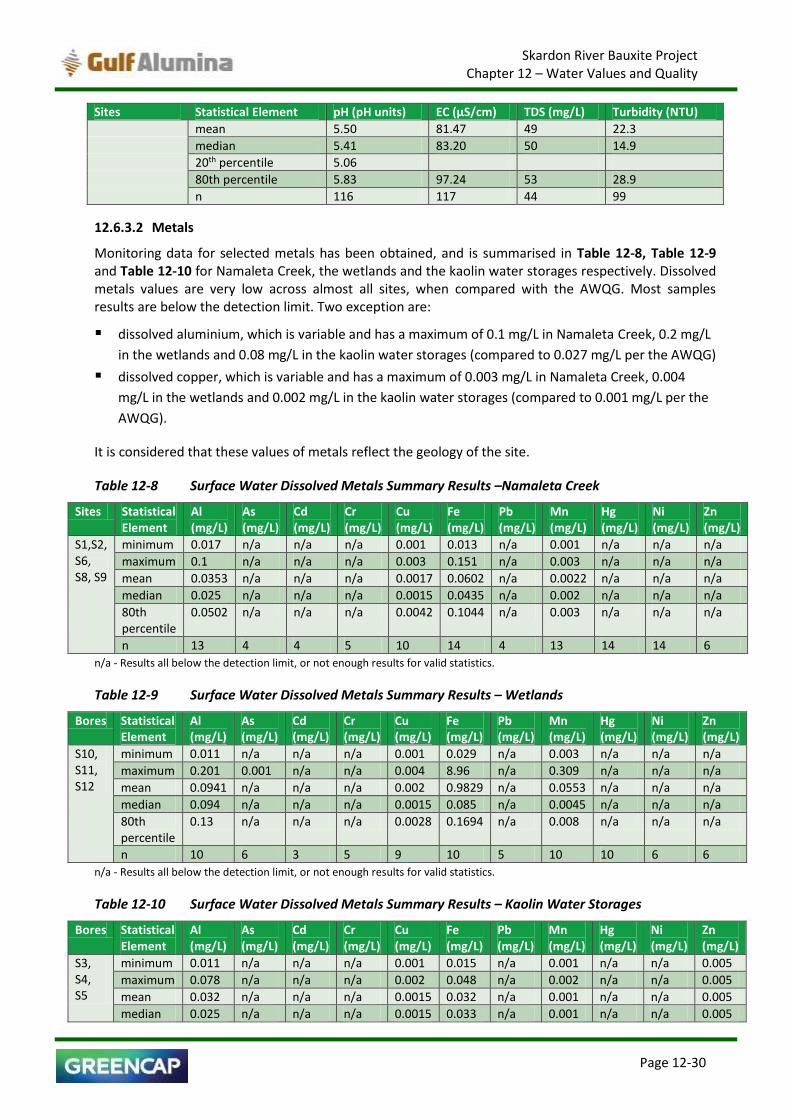
Skardon River Bauxite Project Chapter 12 – Water Values and Quality
Page 12-30
Sites Statistical Element pH (pH units) EC (µS/cm) TDS (mg/L) Turbidity (NTU)
mean 5.50 81.47 49 22.3
median 5.41 83.20 50 14.9
20th percentile 5.06
80th percentile 5.83 97.24 53 28.9
n 116 117 44 99
12.6.3.2 Metals
Monitoring data for selected metals has been obtained, and is summarised in Table 12-8, Table 12-9 and Table 12-10 for Namaleta Creek, the wetlands and the kaolin water storages respectively. Dissolved metals values are very low across almost all sites, when compared with the AWQG. Most samples results are below the detection limit. Two exception are:
dissolved aluminium, which is variable and has a maximum of 0.1 mg/L in Namaleta Creek, 0.2 mg/L
in the wetlands and 0.08 mg/L in the kaolin water storages (compared to 0.027 mg/L per the AWQG)
dissolved copper, which is variable and has a maximum of 0.003 mg/L in Namaleta Creek, 0.004
mg/L in the wetlands and 0.002 mg/L in the kaolin water storages (compared to 0.001 mg/L per the
AWQG).
It is considered that these values of metals reflect the geology of the site.
Table 12-8 Surface Water Dissolved Metals Summary Results –Namaleta Creek
Sites Statistical Element
Al (mg/L)
As (mg/L)
Cd (mg/L)
Cr (mg/L)
Cu (mg/L)
Fe (mg/L)
Pb (mg/L)
Mn (mg/L)
Hg (mg/L)
Ni (mg/L)
Zn (mg/L)
S1,S2, S6, S8, S9
minimum 0.017 n/a n/a n/a 0.001 0.013 n/a 0.001 n/a n/a n/a
maximum 0.1 n/a n/a n/a 0.003 0.151 n/a 0.003 n/a n/a n/a
mean 0.0353 n/a n/a n/a 0.0017 0.0602 n/a 0.0022 n/a n/a n/a
median 0.025 n/a n/a n/a 0.0015 0.0435 n/a 0.002 n/a n/a n/a
80th percentile
0.0502 n/a n/a n/a 0.0042 0.1044 n/a 0.003 n/a n/a n/a
n 13 4 4 5 10 14 4 13 14 14 6
n/a - Results all below the detection limit, or not enough results for valid statistics.
Table 12-9 Surface Water Dissolved Metals Summary Results – Wetlands
Bores Statistical Element
Al (mg/L)
As (mg/L)
Cd (mg/L)
Cr (mg/L)
Cu (mg/L)
Fe (mg/L)
Pb (mg/L)
Mn (mg/L)
Hg (mg/L)
Ni (mg/L)
Zn (mg/L)
S10, S11, S12
minimum 0.011 n/a n/a n/a 0.001 0.029 n/a 0.003 n/a n/a n/a
maximum 0.201 0.001 n/a n/a 0.004 8.96 n/a 0.309 n/a n/a n/a
mean 0.0941 n/a n/a n/a 0.002 0.9829 n/a 0.0553 n/a n/a n/a
median 0.094 n/a n/a n/a 0.0015 0.085 n/a 0.0045 n/a n/a n/a
80th percentile
0.13 n/a n/a n/a 0.0028 0.1694 n/a 0.008 n/a n/a n/a
n 10 6 3 5 9 10 5 10 10 6 6
n/a - Results all below the detection limit, or not enough results for valid statistics.
Table 12-10 Surface Water Dissolved Metals Summary Results – Kaolin Water Storages
Bores Statistical Element
Al (mg/L)
As (mg/L)
Cd (mg/L)
Cr (mg/L)
Cu (mg/L)
Fe (mg/L)
Pb (mg/L)
Mn (mg/L)
Hg (mg/L)
Ni (mg/L)
Zn (mg/L)
S3, S4, S5
minimum 0.011 n/a n/a n/a 0.001 0.015 n/a 0.001 n/a n/a 0.005
maximum 0.078 n/a n/a n/a 0.002 0.048 n/a 0.002 n/a n/a 0.005
mean 0.032 n/a n/a n/a 0.0015 0.032 n/a 0.001 n/a n/a 0.005
median 0.025 n/a n/a n/a 0.0015 0.033 n/a 0.001 n/a n/a 0.005

Skardon River Bauxite Project Chapter 12 – Water Values and Quality
Page 12-31
Bores Statistical Element
Al (mg/L)
As (mg/L)
Cd (mg/L)
Cr (mg/L)
Cu (mg/L)
Fe (mg/L)
Pb (mg/L)
Mn (mg/L)
Hg (mg/L)
Ni (mg/L)
Zn (mg/L)
80th percentile 0.0494
n/a n/a n/a 0.0018 0.038
n/a 0.001
n/a n/a 0.005
n 8 0 0 3 4 8 1 7 8 0 2
n/a - Results all below the detection limit, or not enough results for valid statistics.
12.6.3.3 Nutrients
Monitoring data for total nitrogen (TN) and total phosphorus (TP) has been obtained, and is summarised in Table 12-11, Table 12-12 and Table 12-13 for Namaleta Creek, the wetlands and the kaolin water storages respectively. Nutrient values (TN, TP) are low across all sites. It is generally noted that nutrients within the wetlands are an order of magnitude higher than levels recorded in Namaleta Creek. These elevated nutrient levels will be taken into account during longer term monitoring and management of site activities.
Table 12-11 Surface Water Nutrient Summary Results – Namaleta Creek
Sites Statistical Element Nitrogen (total) (mg/L N) Phosphorus (total) (mg/L P)
S1,S2, S6, S8, S9 minimum 0.05 n/a
maximum 0.16 n/a
mean 0.1008 n/a
median 0.095 n/a
80th percentile 0.15 n/a
n 14 14
Table 12-12 Surface Water Nutrient Summary Results - Wetlands
Bores Statistical Element Nitrogen (total) (mg/L N) Phosphorus (total) (mg/L P)
S10, S11, S12 minimum 0.11 0.02
maximum 2.4 0.28
mean 0.516 0.11
median 0.305 0.07
80th percentile 0.582 0.178
n 10 10
Table 12-13 Surface Water Nutrient Summary Results - Kaolin Water Storages
Bores Statistical Element Nitrogen (total) (mg/L N) Phosphorus (total) (mg/L P)
S3, S4, S5 minimum 0.05 n/a
maximum 0.26 n/a
mean 0.133 n/a
median 0.12 n/a
80th percentile 0.148 n/a
n 8 8
12.7 Groundwater Monitoring
12.7.1 Groundwater Monitoring Locations and Parameters
Groundwater monitoring has occurred intermittently in the Project area over the past 25 years, primarily to support the former kaolin mine operations. However in the past 2 to 3 years groundwater monitoring (including groundwater level and quality) has also been undertaken to understand the reliability of water supply from shallow aquifers for the Project. In addition, groundwater quality

Skardon River Bauxite Project Chapter 12 – Water Values and Quality
Page 12-32
monitoring was undertaken in April 2015, June 2015 and July 2015 to provide additional data to support this EIS.
In order to avoid creating turbidity in clear water and thereby provide more consistent and accurate sampling of more representative samples, the sampling methodology for groundwater was undertaken using the low-flow sampling and purging guidelines described in QED Environmental Systems Inc: Low-Flow Ground-Water Sampling: Latest Research and Equipment Options (2014).
High purge volume sampling in low yield bores (such as those encountered within the Project area), can cause:
an underestimation of maximum contaminant concentrations (due to dilution),
an overestimation of contaminant concentrations due to contaminant mobilization and increased
sample turbidity (e.g. turbidity can elevate metals and some organics bound to solids (e.g.
polyaromatic hydrocarbons),
losses of volatile organic compounds, affected DO and carbon dioxide levels, and
increased sample turbidity.
Groundwater monitoring has occurred at the locations listed in Table 12-14 and shown in Figure 12-10. Over the history of the mining leases dating back to the 1990’s groundwater bores have been given alternative naming conventions. The alternative naming conventions are shown in Table 12-14.
During 2015, groundwater monitoring within and surrounding the Project area comprised 14 bores located on Gulf Alumina’s mining tenements (including exploration tenements adjoining the Project area) and 3 bores on Metro Mining’s adjoining tenements. Monitoring of these bores includes continual measurement with logging equipment of the standing water levels (and in some cases of physical parameters), and water quality sampling on a monthly basis (from April 2015). Table 12-14 summarises the details of the groundwater bores monitored on site. Water quality parameters measured in the field included pH, EC, TDS, DO and redox. In addition there were laboratory determinations of pH, EC, TDS, and selected metals. There was limited testing for nutrients, ions and hydrocarbons, which is of limited value as baseline data, but has been included for completeness.
Note that the C1, C2 and C3 bores are nested, with a shallow bore screened in the Bulimba Formation and a deep bore screened in the Rolling Downs Siltstone in each case. The depth logger is installed in the deep bore, while water quality samples have been taken from both the shallow and deep bores.
The hydrogeology of the Project area, including a description of the aquifers, is provided in Chapter 13, Section 13.5. The aquifers for which monitoring data was obtained are, in order of depth from oldest to youngest, the Rolling Downs Formation, Bulimba Formation and alluvium, valley cut and fill deposits. The Namaleta aquifer is considered to be a meandering palaeochannel within these valley systems and is described as ‘Bulimba Formation (Namaleta Creek) aquifer’ when discussing monitoring data below. For the purpose of this study, the aquifer monitored by the individual bores has been noted.
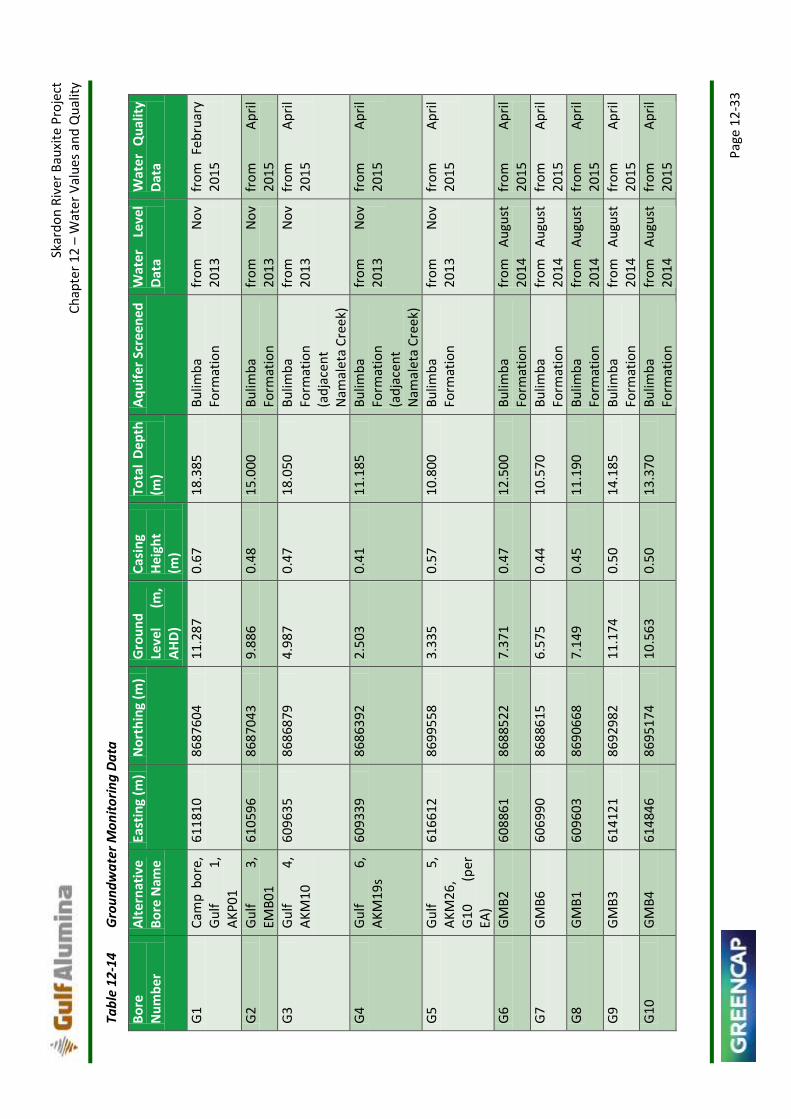
Sk
ard
on
Riv
er B
auxi
te P
roje
ct
C
hap
ter
12
– W
ate
r V
alu
es a
nd
Qu
alit
y
Pag
e 1
2-3
3
Tab
le 1
2-1
4 G
rou
nd
wa
ter
Mo
nit
ori
ng
Da
ta
Bo
re
Nu
mb
er
Alt
ern
ativ
e B
ore
Nam
e Ea
stin
g (m
) N
ort
hin
g (m
) G
rou
nd
Le
vel
(m,
AH
D)
Cas
ing
Hei
ght
(m)
Tota
l D
ep
th
(m)
Aq
uif
er S
cree
ned
W
ate
r Le
vel
Dat
a W
ate
r Q
ual
ity
Dat
a
G1
Cam
p b
ore
, G
ulf
1
, A
KP
01
611
810
8
6876
04
11
.28
7
0.6
7
18
.38
5
Bu
limb
a Fo
rmat
ion
fr
om
N
ov
20
13
fr
om
Fe
bru
ary
20
15
G2
Gu
lf
3,
EMB
01
6
1059
6
868
7043
9
.88
6
0.4
8
15
.00
0
Bu
limb
a Fo
rmat
ion
fr
om
N
ov
20
13
fr
om
A
pri
l 2
01
5
G3
Gu
lf
4,
AK
M1
0 6
0963
5
868
6879
4
.98
7
0.4
7
18
.05
0
Bu
limb
a Fo
rmat
ion
(a
dja
cen
t N
amal
eta
Cre
ek)
fro
m
No
v 2
01
3
fro
m
Ap
ril
20
15
G4
Gu
lf
6,
AK
M1
9s
609
339
8
6863
92
2.5
03
0
.41
1
1.1
85
B
ulim
ba
Form
atio
n
(ad
jace
nt
Nam
alet
a C
reek
)
fro
m
No
v 2
01
3
fro
m
Ap
ril
20
15
G5
Gu
lf
5,
AK
M2
6,
G1
0 (p
er
EA)
616
612
8
6995
58
3.3
35
0
.57
1
0.8
00
B
ulim
ba
Form
atio
n
fro
m
No
v 2
01
3
fro
m
Ap
ril
20
15
G6
GM
B2
6
0886
1
868
8522
7
.37
1
0.4
7
12
.50
0
Bu
limb
a Fo
rmat
ion
fr
om
A
ugu
st
20
14
fr
om
A
pri
l 2
01
5
G7
GM
B6
6
0699
0
868
8615
6
.57
5
0.4
4
10
.57
0
Bu
limb
a Fo
rmat
ion
fr
om
A
ugu
st
20
14
fr
om
A
pri
l 2
01
5
G8
GM
B1
6
0960
3
869
0668
7
.14
9
0.4
5
11
.19
0
Bu
limb
a Fo
rmat
ion
fr
om
A
ugu
st
20
14
fr
om
A
pri
l 2
01
5
G9
GM
B3
6
1412
1
869
2982
1
1.1
74
0
.50
1
4.1
85
B
ulim
ba
Form
atio
n
fro
m
Au
gust
2
01
4
fro
m
Ap
ril
20
15
G1
0
GM
B4
6
1484
6
869
5174
1
0.5
63
0
.50
1
3.3
70
B
ulim
ba
Form
atio
n
fro
m
Au
gust
2
01
4
fro
m
Ap
ril
20
15

Sk
ard
on
Riv
er B
auxi
te P
roje
ct
C
hap
ter
12
– W
ate
r V
alu
es a
nd
Qu
alit
y
Pag
e 1
2-3
4
Bo
re
Nu
mb
er
Alt
ern
ativ
e B
ore
Nam
e Ea
stin
g (m
) N
ort
hin
g (m
) G
rou
nd
Le
vel
(m,
AH
D)
Cas
ing
Hei
ght
(m)
Tota
l D
ep
th
(m)
Aq
uif
er S
cree
ned
W
ate
r Le
vel
Dat
a W
ate
r Q
ual
ity
Dat
a
G1
1
GM
B5
6
1567
1
869
5166
9
.52
1
0.5
0
13
.22
0
Bu
limb
a Fo
rmat
ion
n
/a
fro
m
Ap
ril
20
15
G1
2
AK
M0
9 6
0946
8
868
6946
n
/a
0.4
6
18
.48
0
Bu
limb
a Fo
rmat
ion
(a
dja
cen
t N
amal
eta
Cre
ek)
n/a
fr
om
Ju
ly 2
01
5
G1
3
AK
M0
8 6
0932
9
868
7070
n
/a
0.4
6
18
.00
0
Bu
limb
a Fo
rmat
ion
(a
dja
cen
t N
amal
eta
Cre
ek)
n/a
fr
om
Ju
ly 2
01
5
G1
4
AK
M0
7 6
0915
5
868
7232
n
/a
0.4
6
18
.00
0
Bu
limb
a Fo
rmat
ion
(a
dja
cen
t N
amal
eta
Cre
ek)
n/a
fr
om
Ju
ly 2
01
5
C1
Cap
e 1
, B
H6
MB
1 D
1
01
612
629
8
6905
59
11
.92
6
0.5
0
22
.12
0
Ro
llin
g D
ow
ns
Silt
sto
ne
fro
m
Mar
ch
20
14
fr
om
M
arch
2
01
5
C2
Cap
e 2
, B
H6
MB
2 D
4
19
613
940
8
6956
76
9.4
46
0
.60
2
0.5
10
R
olli
ng
Do
wn
s Si
ltst
on
e fr
om
M
arch
2
01
4
fro
m
Mar
ch
20
15
C3
Cap
e 3
, B
H6
MB
3 D
2
30
615
195
8
6926
49
11
.56
8
0.4
8
21
.74
0
Ro
llin
g D
ow
ns
Silt
sto
ne
fro
m
Mar
ch
20
14
fr
om
M
arch
2
01
5
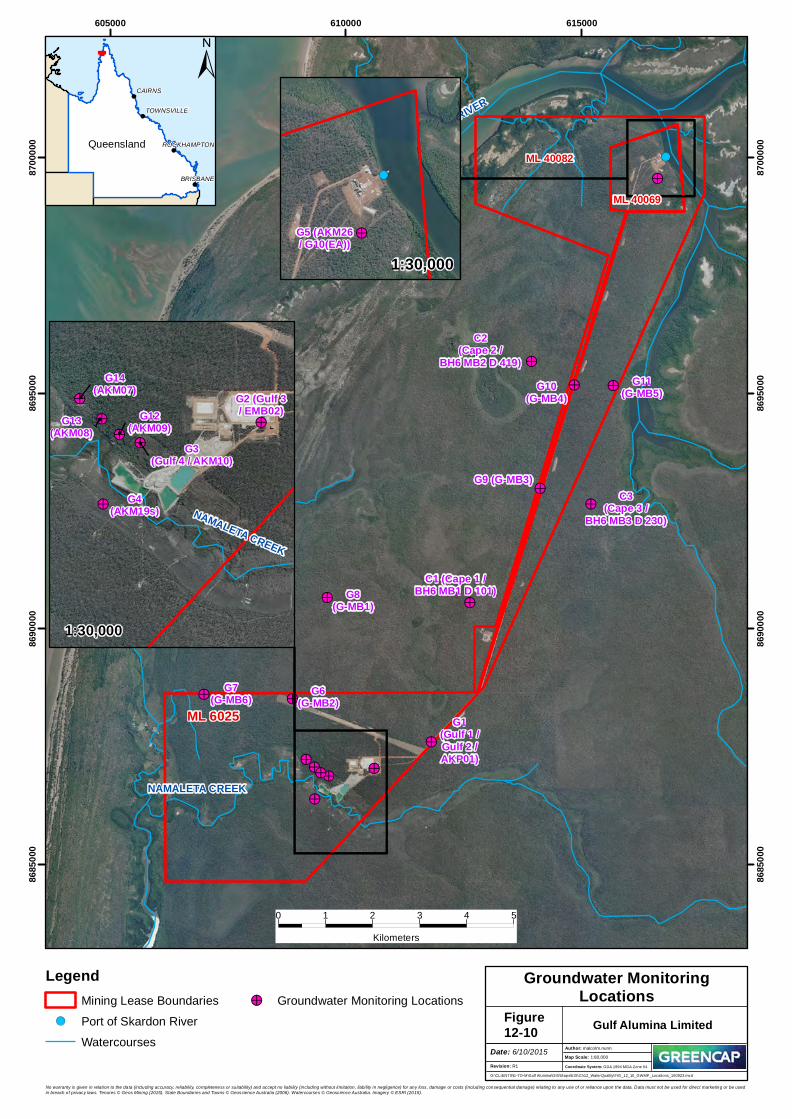
!(
!>
!>!>
!>
!>
!>
!>
!>
!> !>
!>
!>!>!>
!>
!>
!>
ML 6025
ML 40082
ML 40069
SKARDON RIVER
NAMALETA CREEK
G1(Gulf 1 /Gulf 2 /AKP01)
G8(G-MB1)
G6(G-MB2)
G9 (G-MB3)
G10(G-MB4)
G11(G-MB5)
G7(G-MB6)
C1 (Cape 1 /BH6 MB1 D 101)
C2(Cape 2 /
BH6 MB2 D 419)
C3(Cape 3 /
BH6 MB3 D 230)
605000 610000 61500086
8500
0
8685
000
8690
000
8690
000
8695
000
8695
000
8700
000
8700
000
Figure12-10
G:\CLIENTS\E-TO-M\Gulf Alumina\GIS\Maps\EIS\Ch12_WaterQuality\FIG_12_10_GWMP_Locations_150923.mxd
Revision: R1
Date: 6/10/2015 Author: malcolm.nunn1:80,000Map Scale:
Coordinate System: GDA 1994 MGA Zone 54
Groundwater MonitoringLocations
0 1 2 3 4 5Kilometers
Gulf Alumina Limited
!
!
!
!
Queensland
CAIRNS
BRISBANE
TOWNSVILLE
ROCKHAMPTON
±
No warranty is given in relation to the data (including accuracy, reliability, completeness or suitability) and accept no liability (including without limitation, liability in negligence) for any loss, damage or costs (including consequential damage) relating to any use of or reliance upon the data. Data must not be used for direct marketing or be used in breach of privacy laws. Tenures © Geos Mining (2015). State Boundaries and Towns © Geoscience Australia (2006). Watercourses © Geoscience Australia. Imagery © ESRI (2015).
LegendMining Lease Boundaries
!( Port of Skardon RiverWatercourses
!> Groundwater Monitoring Locations
!>
!>
!>
!>
!>!>
G2 (Gulf 3/ EMB02)
G3(Gulf 4 / AKM10)
G4(AKM19s)
G14(AKM07)
G13(AKM08)
G12(AKM09)
NAMALETA CREEK
!(
!>G5 (AKM26/ G10(EA))
1:30,000
1:30,000

Skardon River Bauxite Project Chapter 12 – Water Values and Quality
Page 12-36
12.7.2 Groundwater Levels
Results of groundwater level logging are tabulated and graphed in Appendix 4. Groundwater levels are summarised in Table 12-15 and graphs are presented for bore C1 in Figure 12-11 and bore G3 in Figure 12-12. These graphs are representative of trends in groundwater levels observed in all bores.
The graphs show rainfall during the monitoring period. There are some data spikes and drop outs noted in the graphs, these are likely due to the retrieval of the logger for downloading of data. These irregularities have been filtered from the data for the purpose of groundwater interpretation in this report.
Groundwater level in all aquifers is seasonally variable, with elevated groundwater levels in the period February to March each year, co-incident with the wet season. The variation in groundwater level between wet and dry seasons is between 3.9 to 10.04 m, depending on the bore. Groundwater level responds very directly to recharge from rainfall, with an almost immediate response in groundwater level to rainfall events apparent in all bores in Bulimba Formation aquifers. The response to rainfall of the bores in the Rolling Downs Siltstone aquifer is more subdued. The decline in groundwater level in the bores located in proximity to Namaleta Creek (noted in Table 12-15 as bores in the Bulimba Formation – Namaleta Creek aquifer) is slower when compared with bores located distant to Namaleta Creek. It is thus interpreted that there is some recharge to this aquifer from flows within Namaleta Creek.
Table 12-15 Groundwater Level Data
Bore Number
Aquifer Minimum Water Level (m, AHD)
Maximum Water Level (m, AHD)
Seasonal Water Level Range (m)
G1 Bulimba Formation 2.67 10.52 7.85
G2 Bulimba Formation 1.29 8.70 7.41
G3 Bulimba Formation (adjacent Namaleta Creek)
-2.20 4.84 7.04
G4 Bulimba Formation (adjacent Namaleta Creek)
-1.63 2.30 3.93
G5 Bulimba Formation -0.81 3.20 4.01
G6 Bulimba Formation n/a n/a n/a
G7 Bulimba Formation -1.29 4.29 5.85
G8 Bulimba Formation 0.20 7.19 6.99
G9 Bulimba Formation 0.72 9.93 9.21
G10 Bulimba Formation 0.45 7.56 7.11
G11 Bulimba Formation n/a n/a n/a
G12 Bulimba Formation (adjacent Namaleta Creek)
n/a n/a n/a
G13 Bulimba Formation (adjacent Namaleta Creek)
n/a n/a n/a
G14 Bulimba Formation (adjacent Namaleta Creek)
n/a n/a n/a
C1 Rolling Downs Siltstone 1.71 11.75 10.04
C2 Rolling Downs Siltstone 0.77 6.71 5.94
C3 Rolling Downs Siltstone 0.57 5.92 5.35
n/a = not enough valid data to determine the response

Skardon River Bauxite Project Chapter 12 – Water Values and Quality
Page 12-37
Figure 12-11 Standing Groundwater Level – Bore C1
Figure 12-12 Standing Groundwater Level – Bore G3
12.7.3 Groundwater Quality
The results of groundwater quality testing are tabulated and graphed in Appendix 4. Groundwater quality results are presented for all aquifers in combination and the different aquifers which are intersected by the bores, namely Bulimba Formation (Namaleta Creek) aquifer, Bulimba Formation aquifer and Rolling Downs Siltstone aquifer.

Skardon River Bauxite Project Chapter 12 – Water Values and Quality
Page 12-38
The bulk of the groundwater quality data has been obtained during a four month period of 2015. Thus, there is insufficient data to propose statistically valid site specific trigger values in accordance with the AWQG. Despite this, there is sufficient data to make an initial interpretation of the groundwater quality onsite.
12.7.3.1 Physical Parameters
The physical parameters determined from the groundwater monitoring have been summarised in Table 12-16, Table 12-17,
Table 12-18 and Table 12-19 for the three different aquifer groupings.
pH is slightly acidic in all aquifers, ranging from 4.8 to 6.2 pH units. The weakly acidic pH is a reflection of the geology of the site.
EC is low, ranging from 22 to 196 µS/cm. Bores within the Bulimba Formation aquifer have the lowest mean EC (59 µS/cm), with bores in the Rolling Downs Siltstone aquifer have mean EC (74 µS/cm), and the bores within the Bulimba Formation aquifer adjacent to Namaleta Creek have highest mean EC (126 µS/cm).
Of the bores intersecting the Bulimba Formation aquifer, bores G3, G5, G12 and G13 have elevated EC (>100 µS/cm) when compared with the remainder of the bores. This may be due to their proximity to tidally influenced portions of Namaleta Creek (G3, 12, 13, 14) and Skardon River (G5).
Table 12-16 Groundwater Physical Parameter Summary Results – All Bores
Bores Statistical Element
pH (pH units) EC (µS/cm) TDS (mg/L) DO (mg/L) Redox (mV)
All Bores minimum 4.80 27.00 5.00 1.63 53.00
maximum 6.22 196.00 970.00 4.32 256.00
mean 5.52 74.23 122.09 2.34 200.00
median 5.50 52.00 47.00 1.95 228.00
80th percentile
5.83 101.60 120.00 2.82 249.00
n 54 43 54 8 8
20th percentile
5.30
Table 12-17 Groundwater Physical Parameter Summary Results – Bulimba Formation (Namaleta Creek) Aquifer
Bores Statistical Element
pH (pH units) EC (µS/cm) TDS (mg/L) DO (mg/L) Redox (mV)
G3, G4, G12, G13, G14
minimum 5.02 69 44 n/a n/a
maximum 6 196 970 n/a n/a
mean 5.41 126.3 216 n/a n/a
median 5.33 115.5 74 n/a n/a
80th percentile
5.69 172.2 236 n/a n/a
n 8 8 8 n/a n/a
20th percentile
5.16
n/a = not enough samples for valid statistics

Skardon River Bauxite Project Chapter 12 – Water Values and Quality
Page 12-39
Table 12-18 Groundwater Physical Parameter Summary Results – Bulimba Formation Aquifer
Bores Statistical Element
pH (pH units) EC (µS/cm) TDS (mg/L) DO (mg/L) Redox (mV)
G1, G2, G5, G6, G7, G8, G9, G10, G11, C1 (shallow), C2 (shallow), C3 (shallow)
minimum 4.8 27 5.5 1.63 53
maximum 5.88 185 470 4.32 256
mean 5.4 58.8 53 2.43 211
median 5.4 37 27 2.09 233
80th percentile
5.58 71.6 80 2.986 251
n 32 27 32 7 7
20th percentile
5.2
n/a = not enough samples for valid statistics
Table 12-19 Groundwater Physical Parameter Summary Results – Rolling Downs Siltstone Aquifer
Bores Statistical Element
pH (pH units) EC (µS/cm) TDS (mg/L) DO (mg/L) Redox (mV)
C1, C2, C3 minimum 4.8 40 5 n/a n/a
maximum 6.22 106 620 n/a n/a
mean 5.65 74 218 n/a n/a
median 5.62 79 110 n/a n/a
80th percentile
5.92 87 519 n/a n/a
n 14 8 14 n/a n/a
20th percentile
5.46
n/a = not enough samples for valid statistics
12.7.3.2 Metals
Monitoring data for selected metals has been obtained, and is summarised in Table 12-20, Table 12-21 Table 12-22 and Table 12-23 for all bores and the three aquifer groupings.
Dissolved metals values are very low across almost all bores in all aquifers, when compared with the AWQG trigger values. One exception is dissolved copper, which is elevated across all aquifers and has a maximum of 0.975 mg/L (compared to 0.0014 mg/L per the AWQG). Values of copper appear highest in the Rolling Downs Siltstone aquifer. The other exception is dissolved zinc, which is which is elevated across all aquifers and has a maximum of 1.17 mg/L (compared to 0.008 mg/L per the AWQG). Values of zinc appear highest in the Rolling Downs Siltstone aquifer. It is considered that these values of metals reflect the geology of the site.

Sk
ard
on
Riv
er B
auxi
te P
roje
ct
C
hap
ter
12
– W
ate
r V
alu
es a
nd
Qu
alit
y
Pag
e 1
2-4
0
Tab
le 1
2-2
0 G
rou
nd
wa
ter
Dis
solv
ed M
eta
ls S
um
ma
ry R
esu
lts –
All
Bo
res
Bo
res
Stat
isti
cal E
lem
en
t A
l (m
g/L)
A
s (m
g/L)
C
d (
mg/
L)
Cr
(mg/
L)
Cu
(m
g/L)
Fe
(m
g/L)
P
b (
mg/
L)
Mn
(m
g/L)
H
g (m
g/L)
N
i (m
g/L)
Zn
(m
g/L)
All
Bo
res
min
imu
m
0.0
05
0
0.0
01
0
n/a
0
.00
10
0
.00
10
0
.01
00
0
.00
10
0
.00
10
n
/a
0.0
01
0
0.0
08
0
max
imu
m
0.1
23
0
0.0
02
0
n/a
0
.00
20
0
.89
40
2
.55
00
0
.00
20
0
.17
70
n
/a
0.0
24
0
1.1
70
0
mea
n
0.0
24
0
0.0
01
3
n/a
0
.00
13
0
.05
35
0
.35
02
0
.00
12
0
.02
66
n
/a
0.0
04
8
0.0
96
5
med
ian
0
.01
60
0
.00
10
n
/a
0.0
01
0
0.0
07
0
0.1
02
0
0.0
01
0
0.0
08
0
n/a
0
.00
20
0
.04
30
80
th p
erce
nti
le
0.0
27
6
0.0
01
4
n/a
0
.00
16
0
.04
10
0
.48
60
0
.00
12
0
.01
92
n
/a
0.0
07
0
0.0
90
8
n
54
2
1
14
3
8
52
4
6
36
5
4
54
4
1
52
n/a
= r
esu
lts
all b
elo
w t
he
det
ecti
on
lim
it, o
r n
ot
eno
ugh
res
ult
s fo
r va
lid s
tati
stic
s
Tab
le 1
2-2
1 G
rou
nd
wa
ter
Dis
solv
ed M
eta
ls S
um
ma
ry R
esu
lts –
Bu
limb
a F
orm
ati
on
(N
am
ale
ta C
reek
) A
qu
ifer
Bo
res
Stat
isti
cal
Ele
me
nt
Al
(mg/
L)
As
(mg/
L)
Cd
(m
g/L)
C
r (m
g/L)
C
u
(mg/
L)
Fe
(mg/
L)
Pb
(m
g/L)
M
n
(mg/
L)
Hg
(mg/
L)
Ni
(mg/
L)
Zn
(mg/
L)
G3
, G4
, G1
2, G
13
, G
14
m
inim
um
0
.00
6
0.0
01
n
/a
n/a
0
.00
2
0.0
11
n
/a
0.0
02
n
/a
0.0
01
0
.01
7
max
imu
m
0.0
33
0
.00
2
n/a
n
/a
0.0
14
0
.97
5
n/a
0
.16
7
n/a
0
.00
4
0.0
69
mea
n
0.0
21
0
.00
15
n
/a
n/a
0
.00
55
0
.26
8
n/a
0
.05
1
n/a
0
.00
23
0
.03
6
med
ian
0
.02
15
0
.00
15
n
/a
n/a
0
.00
35
0
.07
9
n/a
0
.02
95
n
/a
0.0
02
0
.02
9
80
th p
erce
nti
le
0.0
27
0
.00
18
n
/a
n/a
0
.00
88
0
.44
3
n/a
0
.09
n
/a
0.0
03
0
.04
66
n
8
5
8
5
8
8
7
8
8
8
8
n/a
= r
esu
lts
all b
elo
w t
he
det
ecti
on
lim
it, o
r n
ot
eno
ugh
res
ult
s fo
r va
lid s
tati
stic
s
Tab
le 1
2-2
2 G
rou
nd
wa
ter
Dis
solv
ed M
eta
ls S
um
ma
ry R
esu
lts –
Bu
limb
a F
orm
ati
on
Aq
uif
er
Bo
res
Stat
isti
cal E
lem
en
t A
l (m
g/L)
A
s (m
g/L)
C
d
(mg/
L)
Cr
(mg/
L)
Cu
(m
g/L)
Fe
(m
g/L)
P
b
(mg/
L)
Mn
(m
g/L)
H
g (m
g/L)
N
i (m
g/L)
Zn
(m
g/L)
G1
, G2
, G5
, G6
, G7
, G8
, G
9, G
10
, G1
1, C
1
(sh
allo
w),
C2
(sh
allo
w),
min
imu
m
0.0
05
n
/a
n/a
n
/a
0.0
01
0
.01
n
/a
0.0
01
n
/a
0.0
01
0
.00
8
max
imu
m
0.0
8
0.0
01
n
/a
0.0
02
0
.89
4
2.5
5
0.0
02
0
.03
2
n/a
0
.02
4
0.1
65
mea
n
0.0
17
7
n/a
n
/a
n/a
0
.04
96
0
.38
79
n
/a
0.0
08
9
n/a
0
.00
61
0
.04
42
med
ian
0
.01
4
n/a
n
/a
n/a
0
.00
4
0.1
06
5
n/a
0
.00
7
n/a
0
.00
2
0.0
29
80
th p
erce
nti
le
0.0
18
4
n/a
n
/a
n/a
0
.02
82
0
.44
16
n
/a
0.0
14
8
n/a
0
.01
04
0
.06
86
n
32
8
6
2
2
30
2
7
18
3
2
32
2
1
30
n/a
= r
esu
lts
all b
elo
w t
he
det
ecti
on
lim
it, o
r n
ot
eno
ugh
res
ult
s fo
r va
lid s
tati
stic
s

Sk
ard
on
Riv
er B
auxi
te P
roje
ct
C
hap
ter
12
– W
ate
r V
alu
es a
nd
Qu
alit
y
Pag
e 1
2-4
1
Tab
le 1
2-2
3 G
rou
nd
wa
ter
Dis
solv
ed M
eta
ls S
um
ma
ry R
esu
lts –
Ro
llin
g D
ow
ns
Silt
sto
ne
Aq
uif
er
Bo
res
Stat
isti
cal E
lem
en
t A
l (m
g/L)
A
s (m
g/L)
C
d (
mg/
L)
Cr
(mg/
L)
Cu
(m
g/L)
Fe
(m
g/L)
P
b (
mg/
L)
Mn
(m
g/L)
H
g (m
g/L)
N
i (m
g/L)
Zn
(m
g/L)
C1
, C2
, C3
m
inim
um
0
.00
6
n/a
n
/a
n/a
0
.00
1
0.0
11
n
/a
0.0
02
n
/a
0.0
01
0
.01
3
max
imu
m
0.1
23
0
.00
1
n/a
0
.00
1
0.7
62
0
.55
0
.00
1
0.1
77
n
/a
0.0
08
1
.17
mea
n
0.0
41
2
n/a
n
/a
n/a
0
.09
05
0
.29
80
n
/a
0.0
55
0
n/a
0
.00
46
0
.26
28
med
ian
0
.02
85
n
/a
n/a
n
/a
0.0
4
0.4
2
n/a
0
.01
2
n/a
0
.00
55
0
.10
7
80
th p
erce
nti
le
0.0
70
4
n/a
n
/a
n/a
0
.06
68
0
.49
88
n
/a
0.1
45
n
/a
0.0
07
0
.26
24
n
14
8
6
1
1
14
1
1
11
1
4
14
1
3
14
n/a
= r
esu
lts
all b
elo
w t
he
det
ecti
on
lim
it, o
r n
ot
eno
ugh
res
ult
s fo
r va
lid s
tati
stic
s
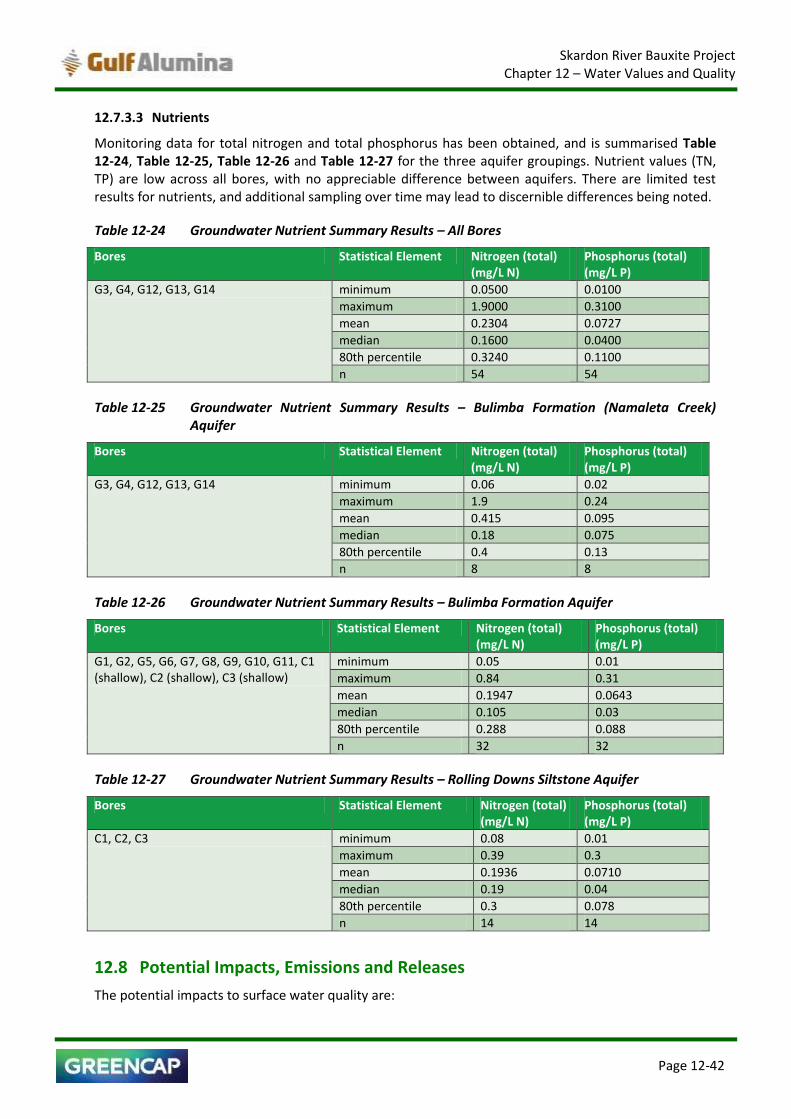
Skardon River Bauxite Project Chapter 12 – Water Values and Quality
Page 12-42 Page 12-42
12.7.3.3 Nutrients
Monitoring data for total nitrogen and total phosphorus has been obtained, and is summarised Table 12-24, Table 12-25, Table 12-26 and Table 12-27 for the three aquifer groupings. Nutrient values (TN, TP) are low across all bores, with no appreciable difference between aquifers. There are limited test results for nutrients, and additional sampling over time may lead to discernible differences being noted.
Table 12-24 Groundwater Nutrient Summary Results – All Bores
Bores Statistical Element Nitrogen (total) (mg/L N)
Phosphorus (total) (mg/L P)
G3, G4, G12, G13, G14 minimum 0.0500 0.0100
maximum 1.9000 0.3100
mean 0.2304 0.0727
median 0.1600 0.0400
80th percentile 0.3240 0.1100
n 54 54
Table 12-25 Groundwater Nutrient Summary Results – Bulimba Formation (Namaleta Creek) Aquifer
Bores Statistical Element Nitrogen (total) (mg/L N)
Phosphorus (total) (mg/L P)
G3, G4, G12, G13, G14 minimum 0.06 0.02
maximum 1.9 0.24
mean 0.415 0.095
median 0.18 0.075
80th percentile 0.4 0.13
n 8 8
Table 12-26 Groundwater Nutrient Summary Results – Bulimba Formation Aquifer
Bores Statistical Element Nitrogen (total) (mg/L N)
Phosphorus (total) (mg/L P)
G1, G2, G5, G6, G7, G8, G9, G10, G11, C1 (shallow), C2 (shallow), C3 (shallow)
minimum 0.05 0.01
maximum 0.84 0.31
mean 0.1947 0.0643
median 0.105 0.03
80th percentile 0.288 0.088
n 32 32
Table 12-27 Groundwater Nutrient Summary Results – Rolling Downs Siltstone Aquifer
Bores Statistical Element Nitrogen (total) (mg/L N)
Phosphorus (total) (mg/L P)
C1, C2, C3 minimum 0.08 0.01
maximum 0.39 0.3
mean 0.1936 0.0710
median 0.19 0.04
80th percentile 0.3 0.078
n 14 14
12.8 Potential Impacts, Emissions and Releases
The potential impacts to surface water quality are:

Skardon River Bauxite Project Chapter 12 – Water Values and Quality
Page 12-43 Page 12-43
uncontrolled release of water with high sediment loads from bauxite mining areas
uncontrolled release of water with high sediment loads from haul roads, including the Namaleta
Creek crossing area
increased sedimentation of waterways during construction and vegetation clearing
uncontrolled release of potentially hydrocarbon and chemical contaminated water from
infrastructure areas.
The potential impacts to groundwater quality are:
localised impacts to groundwater quality hydraulically down-gradient from the landfill, treated
effluent irrigation area and bio-remediation pad through seepage
uncontrolled release of potentially hydrocarbon and chemical contaminated water from
infrastructure areas
saline water ingress resulting from extraction of water from kaolin storages, borefield pumping for
Project water supply and mining of pits.
Chapter 13 describes potential impacts to surface water hydrology and groundwater hydrogeology.
12.9 Mitigation and Management Measures
Water management for the Project is described in Chapter 6 and the management measures relevant to mitigating potential impacts described in Section 12.8 and achieving the environmental objectives and performance outcomes described in Section 12.2 are described below.
Kaolin mine water management is undertaken in accordance with the conditions of the existing EA and the kaolin mine’s Plan of Operations. Kaolin mine water management has been incorporated in the EM Plan (Appendix 13).
The proposed groundwater and surface water monitoring programmes are described in Section 12.10.
12.9.1 Mine Pits
During operational periods, it is intended that rainfall runoff entering the pit will be drained internally and contained within the pit, to be lost as evaporation and as recharge to local aquifers. The need for any sediment ponds external to pits will be determined during ongoing mining operations and may only be required in the unlikely event that the pre-mining topography does not allow for internally draining pits. Mine pits are shown in Chapter 5, Figure 5-14.
Due to the nature of bauxite mining (shallow pits to approximately 6 m depth, located at the top of localised catchments and hydrogeology of pit areas allowing seepage from pits) there is no requirement for external storage and release of water captured within pits.
Surface water runoff does not occur as long as the mine floor lies below the surrounding terrain. Stormwater drains through the groundwater system. This process is enhanced by deep ripping of the mine floor, which will occur prior to the wet season in most bauxite mining areas. Placement of soil and bauxite waste on the mine floor will be even and parallel to the mine floor topography, which should be closely parallel to the original land surface. The edges of mining areas will be battered down to a 3:1 slope and re-vegetated as for the mine floor. Erosion within mined areas is negligible due to the generally flat or gently sloping terrain.
To prevent surface water runoff from mining areas, or to minimise runoff, in the unlikely event of it occurring, the following measures will be adopted for erosion and sediment management:

Skardon River Bauxite Project Chapter 12 – Water Values and Quality
Page 12-44 Page 12-44
Clearing and mining will not be carried out in areas of steep drop-off slope from the general terrain
– expected generally to be within 100 m of natural waterways and swamps.
Ripping will be conducted along contour lines, or offset to direct water away from valleys, using
Keyline principles (i.e. management of the topography to control runoff).
Should a low area be (erroneously) mined on the edge of a mining area, with potential to allow out-
flow of stormwater, earth bunds and silt traps will be constructed, as well as strategic contour banks
on the mine floor to direct flow away from the area. All structures would be stabilized with
establishment of grass cover, trees and shrubs.
Prior to mining, detailed resource surveys will be undertaken to inform the precise location of economic bauxite resources. This is expected to result in accurate delineation of pits areas which avoid:
buffer zones around wetland and watercourses (refer to Chapter 15)
low lying areas with the potential to require erosion and sediment control measures to prevent
outflow from pits
unnecessary clearance of vegetation in areas that will not be mined.
Land clearing in advance of mining will be undertaken in the dry season. Gulf Alumina is likely to undertake annual vegetation clearing, windrowing and burning in advance of proposed mining, with areas to be cleared subject to ongoing review of the proposed areas of mining. Mining will generally occur in the same year (i.e. during the dry season) and therefore there is limited potential for erosion following clearing activities. Following clearing and prior to mining, these areas will be stabilised by allowing regrowth of grasses and shrubs and to maintain viability of the soil for plant growth. Should any cleared areas not be mined within the same dry season, these cleared areas will be bunded along a perimeter track surrounding the cleared areas. Where there is a risk of increased sedimentation from areas cleared of deep rooted vegetation, erosion and sediment control structures will be installed.
12.9.1.1 Mine Site Sediment Management
The topography of the Project area is shown in Chapter 10 and is generally low lying and flat with topography rising towards a ridge where bauxite deposits are located. The Project mining leases are at around 5 – 20 mAHD elevation where bauxite deposits occur, 3 - 8 mAHD at the Port infrastructure area and lower in creek and wetland areas. The bauxite pits are located at the top of the local catchments and hence external catchments reporting to the pits will be minimal.
Under the proposed mining approach, there will be no sediment runoff from mining areas to surrounding land and waters as runoff will be managed within the pits. Sediment ponds receiving drainage from the disturbed mining areas will be managed in pit. Design will be carried out in accordance with best practice approaches and as part of an Erosion and Sediment Control Plan (ESCP). The ESCP will be developed in line with the IECA Manual which provides guidelines for erosion control on site, sediment pond design and construction, and their operation and maintenance.
The design and management details for in pit sediment ponds will be determined as an ongoing operational activity. However, preliminary estimates have been made for the sediment runoff volumes, and indicative geometric requirements for the expected sediment ponds within each pit. As described in Appendix 4, pond sizing was completed using the CALM approach. The approach depends on the erodibility of soil, peak runoff discharge and the volume of sediment likely to enter the structure. The basin surface area is determined as a function of the inflow rate and the target particle settling velocity.
The estimate catchments areas for each pit, sediment runoff volume and in-pit pond sizes and are provided in Table 12-28. Nominal sediment basin volumes range between 400 m3 and 88100 m3 with minimum storage depth requirements of between 2.0 and 2.3 m. This depth requirement could be

Skardon River Bauxite Project Chapter 12 – Water Values and Quality
Page 12-45 Page 12-45
reduced further, subject to pond management practices, with regular scouring and dredging to maximise containment volumes. The nominal in-pit pond size is approximately 0.5% of the pit catchment area for each pit. It is clear that in-pit sediment ponds will occupy a minor portion of each pit and that the pit itself will act to capture any runoff should the sediment basins overtop.
Table 12-28 Catchments Areas, Sediment Runoff and Pond/Dam Sizing
Pit Local Catchment Area (ha)
Sediment Volume (m3/y)
Nominal Pond Area (m2)
Minimum Storage Depth (m)
Pond Volume (m3)
Pit 1 78.1 5639 3300 2.1 7055
Pit 2 31.0 2238 1400 2.0 2855
Pit 3 296.0 21337 25000 2.1 53436
Pit 4 7.4 536 350 2.0 693
Pit 5 27.8 2007 1200 2.1 2527
Pit 6 4.4 318 200 2.0 407
Pit 7 43.6 3145 1900 2.1 3971
Pit 8 18.2 1314 800 2.1 1663
Pit 9 17.3 1249 800 2.0 1604
Pit 10 8.9 645 400 2.1 820
Pit 11 160.0 11553 6800 2.2 15254
Pit 12 369.0 26644 38000 2.3 88131
Pit 13 65.6 4737 2800 2.1 5943
Pit 14 83.6 6036 3600 2.1 7593
Pit 15 219.0 15813 12000 2.1 25616
12.9.1.2 Mine Site Sediment Pond Management
The sediment ponds will be used opportunistically to meet local demand for water (e.g. dust suppression) thereby reducing the need for supply from other sources (e.g. shallow aquifer bores). For the dual purposes of containing sediment on site for controlled disposal and for providing low quality water supply, sediment and erosion control measures will include:
regular inspection of the sediment storage structures conducted at the conclusion of the wet season
(typically in April-May).
inspection of sediment ponds to establish the condition and stability of rock walls and spillways
(applicable to Port sediment ponds described below).
monitoring of sediment deposition volumes and identification if a clean out is required to provide
sufficient storage for sediment loading in runoff and improve storage availability where sediment
ponds are in use for dust suppression.
Clean out will be completed immediately prior to the wet season, and sediment will be disposed of in a location where erosion will be limited or contained (e.g. mining areas undergoing rehabilitation), and will not contribute to sediment loads reporting to other control structures.

Skardon River Bauxite Project Chapter 12 – Water Values and Quality
Page 12-46 Page 12-46
12.9.2 Port Infrastructure Area
One or more sediment ponds will be located at the Port infrastructure area to capture runoff from disturbance areas, including the bauxite stockpile, paved areas, workshops and haul roads. Sediment ponds based on the two Port layouts (refer Chapter 5), are shown in Figure 12-13, which also shows runoff flow paths and drainage control structures
Under Option 1, there is an existing sediment pond which may be decommissioned or refurbished for the Project or, alternatively a new sediment pond may be constructed adjacent to the existing pond as a replacement. Under Option 2 a new sediment pond would be required to the north of the existing Port infrastructure and the existing sediment pond is likely to be retained. All sediment pond options are located to capture runoff from the Port infrastructure area.
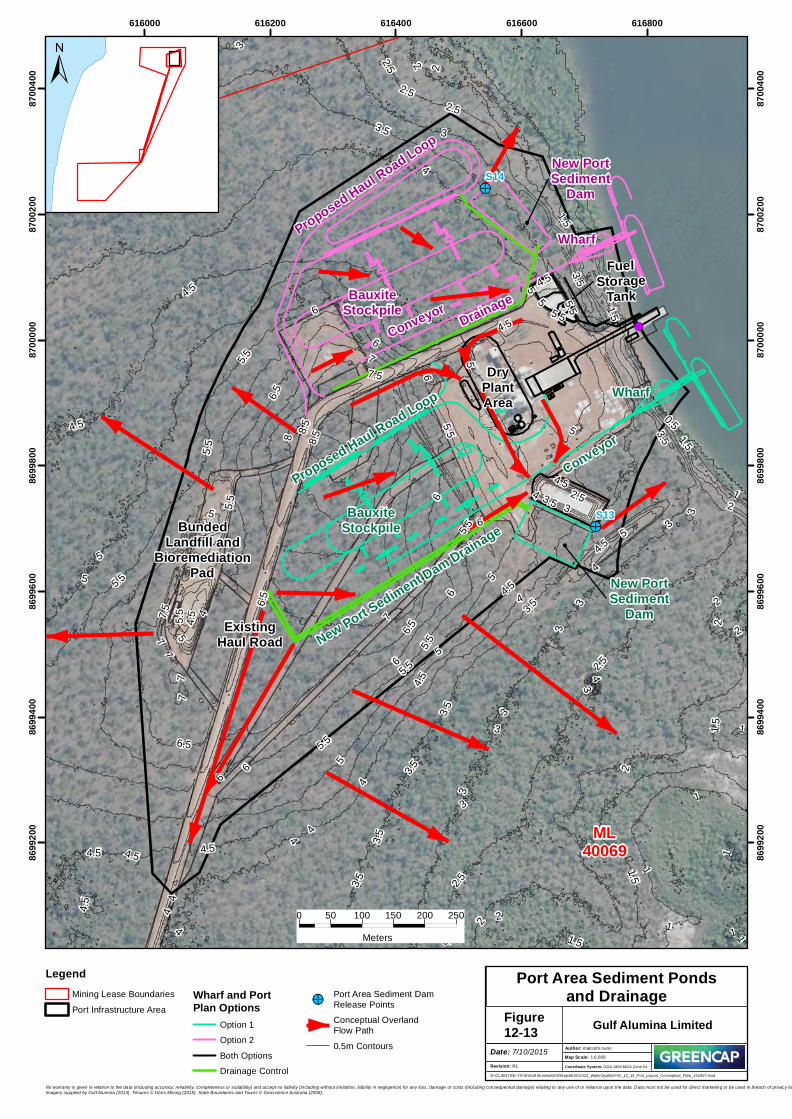
!>
!>
!(
ML40069
ExistingHaul Road
BundedLandfill and
BioremediationPad New Port
SedimentDam
New Port Sediment Dam DrainageBauxite
Stockpile
Proposed Haul Road Loop
FuelStorage
Tank
Wharf
Conveyor
DryPlantArea
ConveyorBauxite
Stockpile
New PortSediment
Dam
Drainage
Proposed Haul Road Loop
Wharf
4
2.53
7.576
4
3
2.5
5
4.5 4
3.5
3
76.5
5.5 56 5.5
4.5
6.5
5.5
4.5
5.5
54
3.5
2.5
2
8.58
5.5
4
4.5
6
5.5
3.5
3
8.5
6.5
4.5
3.5
3
4 3.5
5.55
2.52
3
2
6
11.5
2.5
1.5
4.5
2.5
1.5
12
5.5
2
1
3.5
7
4.55.5
5
4
4
3.5
0.5
3
36
35.5
3.5
6
5
4.5
2
4
5
1.5
1
1
77
3
3.5
4
4
4.5
4.5
5
3.5
1
1.5
3
1
6.5
2.5 1.5
5
5
4.5
7.5
7
6
3
4.5
5
3
6
1
3
5.5
5
4.53
2
5.5
2
4
2
6
3
S13
S14
616000 616200 616400 616600 61680086
9920
0
8699
200
8699
400
8699
400
8699
600
8699
600
8699
800
8699
800
8700
000
8700
000
8700
200
8700
200
8700
400
8700
400
Figure12-13
LegendMining Lease BoundariesPort Infrastructure Area
Wharf and PortPlan Options
Option 1Option 2Both OptionsDrainage Control
!>Port Area Sediment DamRelease PointsConceptual OverlandFlow Path0.5m Contours
G:\CLIENTS\E-TO-M\Gulf Alumina\GIS\Maps\EIS\Ch12_WaterQuality\FIG_12_13_Port_Layout_Conceptual_Flow_151007.mxd
Revision: R1
Date: 7/10/2015 Author: malcolm.nunn1:6,000Map Scale:
Coordinate System: GDA 1994 MGA Zone 54
Port Area Sediment Pondsand Drainage
0 50 100 150 200 250Meters
Gulf Alumina Limited
No warranty is given in relation to the data (including accuracy, reliability, completeness or suitability) and accept no liability (including without limitation, liability in negligence) for any loss, damage or costs (including consequential damage) relating to any use of or reliance upon the data. Data must not be used for direct marketing or be used in breach of privacy laws.Imagery supplied by Gulf Alumina (2014). Tenures © Geos Mining (2015). State Boundaries and Towns © Geoscience Australia (2006).
±

Skardon River Bauxite Project Chapter 12 – Water Values and Quality
Page 12-48 Page 12-48
Based on a preliminary risk assessment (refer to Chapter 6), the Port area sediment ponds are not expected to be regulated dams. Following detailed design, and prior to the design and construction of the structure, the Port area sediment ponds will be subject to a regulated dam assessment by a suitably qualified and experienced person in accordance with the Manual for Assessing Consequence Categories and Hydraulic Performance of Structures (EHP, 2014). A consequence assessment report and certification will be prepared for each structure assessed.
Port area sediment ponds will be designed by an appropriately qualified person. On the basis that Port sediment ponds are not expected to be regulated structures, the nominal design is for a 1:10 year annual exceedance probability (AEP), 24 hour rainfall event, subject to refinement during detailed design. Port area sediment ponds will have a spillway that is designed, constructed and effectively armoured to convey anticipated flows, with a nominal minimum design for a 50 year annual recurrence interval (ARI) rainfall event, subject to refinement during detailed design.
The nominal pond area allowed for in the conceptual layout of Port infrastructure allows for a sediment pond of at least 6000 m2. From a sediment assessment based on the CALM method (refer to Appendix 4) for a 6 hour, 1 in 10 year storm event, the minimum pond area requirement for retention is estimated to be 673 m2, demonstrating that the nominal pond area has been adequately sized.
Runoff from the Port infrastructure area will be concentrated in drainage channels flowing to the sediment ponds. These drainage channels will be designed, constructed, armoured and maintained to maintain the runoff from all storm events up to an including a 1 in 10 year ARI rainfall event without causing erosion and sedimentation.
The sediment pond(s) at the Port will capture and retain runoff from the Port infrastructure area and during normal operation, will retain water in line with design guidelines to remove sediment to desired levels before controlled release. Release events will occur during rainfall events that exceed the design capacity of the sediment ponds, when there will be naturally high levels of turbidity in the receiving environment. Port area sediment ponds will minimise impacts on the Skardon River by:
discharging through the nominated spillway
managing releases to prevent scouring (e.g. rock spillways)
maximising the distance through which discharges flow through vegetation prior to entering the
Skardon River.
Should the Port area sediment pond(s) overtop, water will drain through an area of vegetation prior to entering the Skardon River estuary. The environmental values of the Skardon River estuary are described in Chapter 17 – Coastal Processes and Chapter 18 – Marine Ecology. Given the scale of the estuary compared to the scale of the Port area sediment pond(s), and high natural variation in estuary turbidity, any releases from the sediment pond are likely to have a minimal impact on the marine environment. Release events would only occur under a rainfall event that exceeds the design criteria when natural sediment loads in runoff would be high.
Sediment from the pond will be removed twice per year, and at least before the wet season, allowing maximum storage capacity for settling and containing suspended solids during the wet season. Sediment levels will be inspected in ponds following rainfall events resulting in runoff (e.g. 20 mm in 24 hours), which may result in further sediment removal so that the required design capacity is available from the next rainfall event. Sediment that is removed will be taken to an area where sediments will be contained, such as an open mining area.
Other measures to manage erosion and sediment runoff at the Port infrastructure area include:
paving of some areas

Skardon River Bauxite Project Chapter 12 – Water Values and Quality
Page 12-49 Page 12-49
short term measures such as surface roughening of exposed areas particularly during periods of high
risk for erosion (likely to occur during construction)
long term prevention of erosion using control techniques such as revegetation and gravelling (which
limits the impact of raindrops and generation of mud).
Port sediment ponds will be located above the 1:100 year flood level for the Skardon River as described in Chapter 14.
This pond(s) will not be more than 10 m in height and hence does not require a failure impact assessment under the Water Supply (Safety and Reliability) Act 2008.
12.9.2.1 Bauxite Stockpile Sediment Control
The stockpile will be gradually depleted over the year and decreased to zero in January so that no stocks are held during the wet season. This will prevent runoff from the stockpile over the wet season. Never-the-less the stockpile will be bunded and any runoff from the bauxite stockpile will be directed towards a sediment trap / sediment check dam system. This will consist of drains, incorporating rock lining as required, around the bauxite stockpile which direct runoff to an interceptor system. Sediment from the interceptor will be removed regularly, including after rainfall events. Outflow from the interceptor system will be directed to the port sediment ponds, thereby reducing the volume of sediment reporting to the sediment ponds.
12.9.2.2 Contaminant Management
Measures to prevent contamination of surface water and groundwater from hydrocarbons and chemicals in infrastructure areas, and from the landfill and bio-remediation pad are described in Chapter 11. Chapter 11 describes monitoring of groundwater up gradient and down gradient of the landfill and bio-remediation pad and hydrocarbon storage, including monitoring locations, frequency, parameters and contaminant limits. The landfill and bio-remediation pad will be bunded to prevent ingress of runoff and prevent outflow of potentially contaminated water from direct rainfall.
Waste management at the Port infrastructure area is described in Chapter 8. These measures (e.g. bunds, oily water separators) are intended to prevent runoff to sediment ponds containing hydrocarbons, chemicals and other pollutants. Therefore any releases from the sediment ponds are not expected to contain elevated levels of hydrocarbons or chemicals.
12.9.2.3 Release Monitoring
Sediment depths in Port sediment ponds will be inspected at least biannually, prior to the wet season, following the wet season and after any significant rainfall events. Sediment will be removed and transferred to an open mining area, should sediment depth compromise the design standards of the dams.
Release points from Port area sediment ponds will be located at the downslope end of these structures, for which coordinates are provided in Table 12-29, based on the conceptual Port area design. These coordinates are subject to change during detailed design and any approvals will be amended accordingly to reflect changes.
The existing EA nominates release point W2 at the Port as the ‘discharge point from stormwater drains on the bank of the Skardon River’. This EIS replaces this monitoring location with monitoring of the release point from the existing sediment pond, which more accurately reflects existing and proposed water management at the Port area. Note that Table 12-29 provides release points for the existing sediment pond and a new sediment pond (Port option layout 1) to replace the existing sediment pond, if required. It is unlikely that both sediment ponds will be required and hence this release point is referred to as S13.

Skardon River Bauxite Project Chapter 12 – Water Values and Quality
Page 12-50 Page 12-50
Release points have been situated as far away from Skardon River as possible given the constraints of collecting runoff downstream of Port infrastructure, above the Skardon River flood zone, and with 50 m to 100 m separation distance to the Skardon River. Release points will have a shallow contour drain leading away from the dams, so that water spreads over a native vegetation area between 50 m and 100 m from the Skardon River. This will result in dissipation of flows and a reduction in velocity and erosion potential.
Table 12-29 Release Points – Port Area Sediment Ponds
Release Point Reference per existing EA
Easting Northing Monitoring Frequency
S13 – Discharge point from the existing Port sediment pond
W2 - Discharge point from stormwater drains on the bank of the Skardon River
616718 8699703 Within 24 hours of any discharge from S13 (formerly W2) and thereafter weekly whilst discharging
S13 Proposed sediment pond – Option 1 (adjacent to existing sediment pond)
n/a 616718 8699703 Within 24 hours of discharge and thereafter weekly whilst discharging.
S14 - Proposed sediment pond – Option 2
n/a 616639 8700156 Within 24 hours of discharge and thereafter weekly whilst discharging.
During a release event, monitoring will commence with 24 hours of a release event (subject to safe access) and releases will be monitored weekly until releases cease. Release will be monitored for the following parameters:
physico-chemical
nutrients
metals
total petroleum hydrocarbons
oil and grease.
The proposed release limits for the Port sediment ponds are provided in Table 12-30, and are based on the preliminary marine water quality objectives presented in Chapter 17.
Table 12-30 Release Limits
Parameter Units Release Limit
Turbidity NTU Turbidity maximum as identified through monitoring at site S16 prior to any release.
No visible plume in Skardon River
Electrical Conductivity
µS/cm Salinity maximum as identified through monitoring at site S16 prior to any release.
pH pH units 7 - 8.5
Total nitrogen µg/L 1000
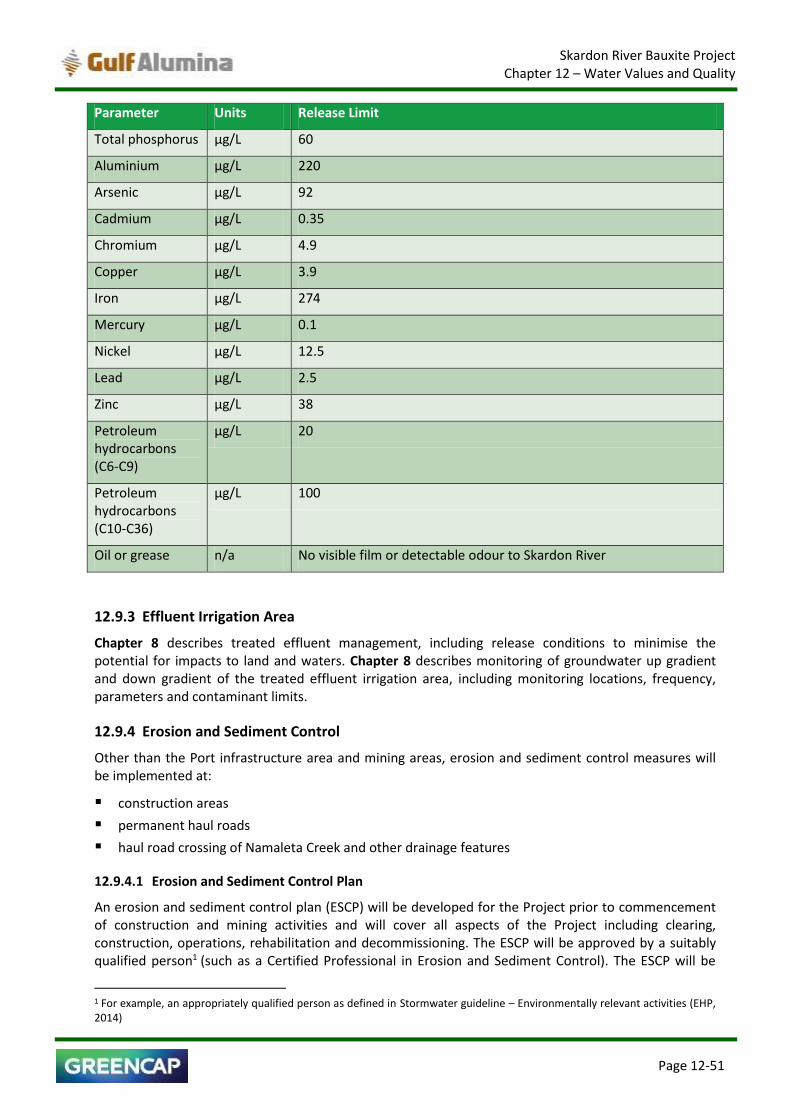
Skardon River Bauxite Project Chapter 12 – Water Values and Quality
Page 12-51 Page 12-51
Parameter Units Release Limit
Total phosphorus µg/L 60
Aluminium µg/L 220
Arsenic µg/L 92
Cadmium µg/L 0.35
Chromium µg/L 4.9
Copper µg/L 3.9
Iron µg/L 274
Mercury µg/L 0.1
Nickel µg/L 12.5
Lead µg/L 2.5
Zinc µg/L 38
Petroleum hydrocarbons (C6-C9)
µg/L 20
Petroleum hydrocarbons (C10-C36)
µg/L 100
Oil or grease n/a No visible film or detectable odour to Skardon River
12.9.3 Effluent Irrigation Area
Chapter 8 describes treated effluent management, including release conditions to minimise the potential for impacts to land and waters. Chapter 8 describes monitoring of groundwater up gradient and down gradient of the treated effluent irrigation area, including monitoring locations, frequency, parameters and contaminant limits.
12.9.4 Erosion and Sediment Control
Other than the Port infrastructure area and mining areas, erosion and sediment control measures will be implemented at:
construction areas
permanent haul roads
haul road crossing of Namaleta Creek and other drainage features
12.9.4.1 Erosion and Sediment Control Plan
An erosion and sediment control plan (ESCP) will be developed for the Project prior to commencement of construction and mining activities and will cover all aspects of the Project including clearing, construction, operations, rehabilitation and decommissioning. The ESCP will be approved by a suitably qualified person1 (such as a Certified Professional in Erosion and Sediment Control). The ESCP will be
1 For example, an appropriately qualified person as defined in Stormwater guideline – Environmentally relevant activities (EHP, 2014)

Skardon River Bauxite Project Chapter 12 – Water Values and Quality
Page 12-52 Page 12-52
amended as the mine develops to account for changes in final landform design and infrastructure locations.
An ESCP will be developed in accordance with the:
recommended guidelines of the International Erosion Control Association (IECA) Manual (IECA,
2008)
Soil Erosion and Sediment Control-Engineering Guidelines for Queensland Construction Sites
(Witheridge and Walker, 1996)
Stormwater guideline – Environmentally relevant activities (EHP, 2014)
The most critical aspects of the ESCP are set out below.
An assessment of erosion risk will be undertaken for different parts of the Project area.
Soil types will be assessed (refer Chapter 10), including identification of erosion potential.
Soil will be managed in accordance with the measures described in Chapter 10 for soil stripping,
handling, stockpiling and testing.
Development of the ESCP will be integrated into the mine planning process.
Sensitive areas (e.g. buffer zones around watercourses and wetlands) that may require specific
measures to prevent sedimentation will be identified.
The period of maximum disturbance will be planned to occur in the dry season.
Construction activities and land clearing will be undertaken in the dry season.
The extent and duration of disturbance (topsoil and subsoil exposure) will be minimised.
Boundaries of areas to be cleared will be delineated and clearing will be authorised by use of a
‘permit to clear’ system.
Grubbing out and removal of ground cover will be carried out as close to the time of mining or
earthworks as possible.
Stabilisation of areas cleared in advance of mining will occur through allowing regrowth of grasses
and shrubs.
Stormwater runoff from external or undisturbed catchments will be diverted around or away from
infrastructure construction areas.
Uncontaminated stormwater run-off will be diverted around areas disturbed by Port infrastructure
area activities or where contaminants or wastes are stored or handled.
All drainage structures and sediment controls will have design specifications appropriate to the
rainfall regime and design life.
Erosion controls will be used to minimise sediment generation and transport.
Sediment controls will be used to treat run-off from disturbed areas prior to leaving the site.
Sediment controls will be located as close to the source as possible.
Erosion and sediment control structures will be installed as required, prior to disturbance in that
area of site.
Disturbed areas will be stabilised as soon as possible (progressively rehabilitated).
Control structures will be inspected regularly.
Details of the rehabilitation of the site, including final landform design is provided in Chapter 7. Rehabilitated landforms will be designed to minimise slope angle and length. Erosion loss decreases exponentially with percentage ground cover and is greatly reduced when cover exceeds 50%. For long-

Skardon River Bauxite Project Chapter 12 – Water Values and Quality
Page 12-53 Page 12-53
term stabilisation in tropical climates, IECA (2008) recommends a minimum ground cover of 80% which will considered as the target for this Project. Vegetation establishment will be required for long-term soil stabilisation. All revegetated areas will be monitored to ensure the desired ground cover is achieved and further seeding or planting is conducted in areas that do not meet the desired target.
Chapter 15 and Chapter 16 described the proposed vegetation buffer zones around wetlands, watercourses and drainage features. These buffer zones will act to reduce potential impacts from sediment laden runoff.
Erosion mitigation measures specifically relevant to waterways include the following:
Where earthworks are carried out in proximity to a watercourse, disturbance will be stabilised.
Felled timber will be removed from the area and stockpiled away from the watercourse.
Where required temporary controls will be installed along cleared slopes approaching watercourses,
to divert dirty water away from the watercourse.
Clean rock and culverts will be used for temporary watercourse crossings
Water discharged to a waterway will meet Project water quality objectives.
The ESCP may include measures such as:
velocity slowing methods including rock and log placement in cleared areas
restriction of land disturbance
scour protection design methods for drainage
rehabilitation practices to limit erosion.
The ESCP will be implemented for construction and throughout operations. Drainage and erosion control will be implemented as a part of operational activities using measures such as erosion control blankets, check dams, filter fences and rock mattresses.
Monitoring of erosion and sediment control structures will be carried out both pre- and post-wet season and following any significant events. Monitoring may be done using visual methods (such as those for recording erosion features) and/or more quantitative methods such as those using erosion monitoring pins, or measuring sediment loads from monitored catchments.
Monitoring of erosion and sediment controls may include:
visual inspections undertaken regularly and following significant rainfall e.g. 20 mm in 24 hours
daily monitoring of weather predictions to manage clearing and construction activities.
completion of site inspection checklist
supervisors to visually monitor all operations and identify where correct procedures are not being
followed
contractors to monitor works and should they become aware of improper management practices, to
report the issue to their supervisor.
site supervisors will be responsible for modifying or stopping non-conforming management
practices until corrective actions are determined
corrective and preventive actions to be implemented and monitored visually on site to ensure they
are effective.
12.9.4.2 Permanent Haul Roads
Permanent haul roads (i.e. the main haul road connecting the Port area to the mining areas to the south) will be designed in consideration of the Department of Transport and Main Road’s (TMR’s) Road

Skardon River Bauxite Project Chapter 12 – Water Values and Quality
Page 12-54 Page 12-54
Drainage Manual (TMR, 2015). This provides technical guidance on road drainage, erosion, environmental and sediment control.
12.9.5 Namaleta Creek Crossing
12.9.5.1 Location
The location of the proposed crossing of Namaleta Creek is shown in Figure 12-14. This is the same location as the existing crossing.
12.9.5.2 Existing Crossing
The existing crossing of Namaleta Creek crossing consists of an earthen crossing (10 – 15 m wide), where two cylindrical pipes connect the upstream and downstream reaches of Namaleta Creek. These existing pipe culverts may be impacting flows and fish passage. The section of road currently crossing the south-western flood plain of Namaleta Creek (refer to Figure 12-14) is restricting normal flow during the height of the wet season.
12.9.5.3 Crossing Design
The crossing will be upgraded to support haul truck movements between mining areas to the south of Namaleta Creek and the Port. The corridor associated with the proposed upgrade of the crossing will be 40m at the widest point requiring an additional 25m of clearing. The design of the crossing will be in accordance with the Department of Agriculture and Fisheries Code for Self-assessable Development – Minor Waterway Barrier Works, Part 3 Culvert Crossings, Code Number: WWBW01 April 2013 (the Code). This Code is designed to minimise impacts to fish passage. In this respect the upgraded crossing will result in the hydrology of the area more closely resembling its pre-disturbance condition. Additional culverts will be inserted in the section of road crossing the flood plain to restore free flow of wet season water.
A schematic cross-section of the Namaleta Creek crossing is shown in Figure 12-15. The culverts and deck level of the crossing were sized for a 1:50 year AEP design flood standard. Figure 12-15 shows the preliminary sizings of the culvert groupings proposed to convey water through the haul crossing embankment, as applied in the model. Note that the culverts are distorted by the aspect ratio of the cross-section.

Namaleta CreekCrossing
NAMALETA CREEK
Pit #14
8.5
2.5
2
3
4
3
6.5
7
5
3.5
4.5
5
6
8.5
87.5
76.5
6
5.5
5
43.5
3
8
6
1
1.5
2
2.5
0.5
1
2
0.5
1.5
2
21.532.5
2
0
8
10
87
6.5
0.5
1
2
1.5
2.5
0.5
10
4
3.5
1
1.51
0.5
0.5
0.5
3.5
1.5
6.5
8.5
4
3
4
9.5
9
2
5
4.5
4
4
4.5
1.5
12
5.5
2.5
2.5
4.5
0 5
2.52
4
2.5
4.5
3
7.5
7
1.5 4
4
1
2
8
2
4
2
4
4
7
4
3.54 3.5
2
43.5
2.5
0.5
3
0
3.5
2
2.5
2
7.57
2.5 2
0
3
44.5
1
5.5
6
8.5
8
3
3.5
2
2
7
4
3
8
34
1
22
4
1
3.5
2.5
1.52.5
0.5
2
3
3.5
2.5 8
5
609400 609600 60980086
8580
0
8685
800
8686
000
8686
000
8686
200
8686
200
8686
400
8686
400
Figure12-14
G:\CLIENTS\E-TO-M\Gulf Alumina\GIS\Maps\EIS\Ch12_WaterQuality\FIG_12_14_Namaleta_Crossing_Contours_WWBW_151007.mxd
Revision: R1
Date: 7/10/2015 Author: malcolm.nunn1:4,000Map Scale:
Coordinate System: GDA 1994 MGA Zone 54
Namaleta Creek Crossing Location
0 50 100 150 200Meters
Gulf Alumina Limited
!
!
!
!
Queensland
CAIRNS
BRISBANE
TOWNSVILLE
ROCKHAMPTON
±
No warranty is given in relation to the data (including accuracy, reliability, completeness or suitability) and accept no liability (including without limitation, liability in negligence) for any loss, damage or costs (including consequential damage) relating to any use of or reliance upon the data. Data must not be used for direct marketing or be used in breach of privacy laws. Tenures © Geos Mining (2015). State Boundaries and Towns © Geoscience Australia (2006). Watercourses © Geoscience Australia. Imagery sourced from Gulf Alumina. Waterways for Waterway Barrierworks © State of Queensland (Department of Agriculture and Fisheries) 2015.
Legend!( Port of Skardon River
Mining Lease BoundariesWatercoursesExisting Disturbance FootprintProject FootprintHaul RoadCrossing
Elevation Contours (0.5m)Queensland Waterways forWaterway Barrier WorksRisk of Impact
2 - Moderate (Streams)

Skardon River Bauxite Project Chapter 12 – Water Values and Quality
Page 12-56 Page 12-56
Figure 12-15 Namaleta Creek Crossing – Downstream View
Preliminary sizing of the culvert groups and bridge deck level required at the crossing was carried out with reference to the guidelines and recommendations of the Road Drainage Manual, Department of Transport and Main Roads, July 2015 (TMR-RDM).
Detailed design will be carried out in compliance with the TMR-RDM and with:
Roads in the Wet Tropics Manual, Transport and Main Roads, 1998)
design detail requirements of the Code for Self-Assessable Development; Minor Waterway Barrier
Works Part 3: Culvert Crossings, Code number: WWWBW01 (April 2013), Department of Agriculture,
Fisheries and Forestry (DAFF).
The following specific conditions are noted from the Code for addressing moderate impact waterways (applicable to Namaleta Creek):
Works must commence and finish within a maximum time of 360 calendar days and instream
sediment and instream silt control measures associated with the works must be removed within this
period.
The crossing must have a minimum (combined) culvert aperture width of 2.4 m or span 100% of the
main channel width.
All new or replacement culvert cells must be installed at or below bed level.
The internal roof of the culverts must be >300 mm above ‘the commence to flow’ water level.
Where the cell is installed at less than 300 mm below bed level (potentially the case for the
Namaleta Crossing), the culvert floor must be roughened throughout to approximately simulate
natural bed conditions.
The culvert must be installed at no steeper gradient than the waterway bed gradient.
Apron and stream bed scour protection must be provided in line with the design requirements of
the Code.
It is expected that the Code requirements can be met for the Namaleta crossing design.
12.9.5.4 Crossing Drainage
Drainage from road surface of the crossing will be directed to the ends away from the Creek, by peaking the height of the crossing at its centre and raising the entire crossing above the elevation of the surrounding topography. Thus stormwater runoff will drain to the entry points of the crossing approximately 50 m to 100 m from the Creek bank. Silt traps will be installed at the end of the drains

Skardon River Bauxite Project Chapter 12 – Water Values and Quality
Page 12-57 Page 12-57
and over flow directed into contour drains. On the south-west side this water will flow into natural vegetation while on the north-east side water will be directed into kaolin mine revegetation areas, or kaolin mine water storages.
12.9.5.5 Crossing Construction and Rehabilitation
To prevent any instream impacts including sedimentation to Namaleta Creek and the mapped HES wetland during the construction of haul road crossing, construction activities will be scheduled for the dry season, when the potential for impact is minimised due to low or no flow conditions when temporary impoundments are not expected to be required when working within the in-stream environments. This strategy is also part of avoiding disturbance of acid sulphate soil, the management of which is described in Chapter 10.
With construction of the proposed crossing within a single dry season, temporary changes to the drainage and flow regimes will be avoided and Creek flow will be improved from the current situation in the following wet season. Construction work within Namaleta Creek will ensure that all surfaces are adequately stabilised following the completion of the haul road crossing. This will include revegetation of exposed embankment areas and mulching if necessary until stream banks have stabilised.
A significant level of vegetation clearing and landform modification has occurred on the northern side of Namaleta Creek as a consequence of the former kaolin clay mine operation. The resilience of the Melaleuca-dominated vegetation of this wetland has the capacity to regenerate rapidly, and form a functional and protective vegetation cover within a relatively short period, and this would be expected for the crossing upgrade.
The crossing will be constructed with ironstone material from the borrow pits over a claystone core, using material from the kaolin claystone overburden stockpile.
12.9.6 Crossings of other Drainage Features
The haul road will cross a drainage feature between Pits 14 and 15 to the south of Namaleta Creek, as shown in Figure 12-16. This drainage feature is mapped as moderate risk for waterway barrier works. The design of the crossing will be determined following inspection of the area, including drainage, and extent and width of any potential wetland features (if wetland is found to be associated with this area). The design of the crossing will be in accordance with the Department of Agriculture and Fisheries Code for Self-assessable Development – Minor Waterway Barrier Works, Part 3 Culvert Crossings, Code Number: WWBW01 April 2013.
Crossing construction will follow the methodology described for the Namaleta Creek crossing. Culverts will maintain natural flow of stormwater in the drainage feature and the road surface drainage system will direct flow away from drainage feature. All works required within the drainage feature will ensure that all surfaces are adequately stabilised following the completion of the haul road construction. This will include revegetation of exposed embankment areas and temporary erosion and sediment control until construction is completed or drainage feature banks have been stabilised.

Drainage FeatureCrossing
Pit #14
Pit #15
Pit #15
99
7
9
10
9.5
9
88.5
7.5
76.5
9
9
8.58
8.5
7.5
6.5
8
7.5
8.5
8
9
8.5
6
6.5
99
10.5
10.5
8
7.58
10.5
9
8.5
9
8.5
9
10.5
8
99
8
8
9 9.5
7
89
9
8
8
609000 609200 609400 60960086
8480
0
8684
800
8685
000
8685
000
8685
200
8685
200
8685
400
8685
400
8685
600
8685
600
Figure12-16
G:\CLIENTS\E-TO-M\Gulf Alumina\GIS\Maps\EIS\Ch12_WaterQuality\FIG_12_16_Drainage_Crossing_Contours_WWBW_151007.mxd
Revision: R1
Date: 7/10/2015 Author: malcolm.nunn1:4,000Map Scale:
Coordinate System: GDA 1994 MGA Zone 54
Haul Road Crossing ofDrainage Features
0 50 100 150 200Meters
Gulf Alumina Limited
!
!
!
!
Queensland
CAIRNS
BRISBANE
TOWNSVILLE
ROCKHAMPTON
±
No warranty is given in relation to the data (including accuracy, reliability, completeness or suitability) and accept no liability (including without limitation, liability in negligence) for any loss, damage or costs (including consequential damage) relating to any use of or reliance upon the data. Data must not be used for direct marketing or be used in breach of privacy laws. Tenures © Geos Mining (2015). State Boundaries and Towns © Geoscience Australia (2006). Watercourses © Geoscience Australia. Imagery sourced from Gulf Alumina. Waterways for Waterway Barrierworks © State of Queensland (Department of Agriculture and Fisheries) 2015.
Legend!( Port of Skardon River
Mining Lease BoundariesWatercoursesExisting Disturbance FootprintProject FootprintHaul RoadCrossing
Elevation Contours (0.5m)Queensland Waterways forWaterway Barrier WorksRisk of Impact
2 - Moderate (Streams)

Skardon River Bauxite Project Chapter 12 – Water Values and Quality
Page 12-59
12.10 Proposed Surface Water and Groundwater Monitoring Programme
A baseline monitoring programme, as described in Section 12.6 (surface water) and Section 12.7 (groundwater) has been established by Gulf to provide data for surface water quality, surface water depth, groundwater quality and groundwater level. This data has been used to establish baseline conditions and understand natural variations. These sites will continue to be monitored to detect potential Project impacts during construction and operations. The intention is to expand the monitoring network prior to construction and operations, as described below. The following areas are currently monitored in line with the EA requirements for the kaolin mine:
receiving waters affected by the release of process water and/or stormwater potentially
contaminated by former kaolin mining activities (approximately 100m upstream and 100m to 500m
downstream of the existing water storages)
contaminants from end of pipe release points from kaolin mine water storages (discharge points
from the Raw Water Pit, western sump of Fluvial Pit, south side of Namaleta Creek and stormwater
drains on the bank of the Skardon River at the Port)
effluent released from the treatment plant at the camp to be released to the effluent irrigation area
groundwater potentially affected by former kaolin mining activities.
Proposed groundwater and surface water monitoring programs for the Project (i.e. bauxite mining) are outlined in this section. Other monitoring related to water parameters will include ongoing recording of weather parameters (rainfall and evaporation), water consumption and flow rates.
It is proposed to modify the monitoring programme and the existing EA conditions such that they continue to apply to the former kaolin mine activities as well as future bauxite mining activities.
Ongoing monitoring will be conducted in order to establish local water quality objectives prior to commencement of mining activities.
12.10.1 Surface Water Monitoring Locations
Monitoring of surface water has been carried out at several sites on Namaleta Creek, Skardon River, Lunette Swamp and Bigfoot Swamp, as described in Section 12.6.
The current EA specifies surface water monitoring for the decommissioned kaolin mine. This monitoring will continue during the Project and will provide information to understand potential impacts of the kaolin mine and the Project and is described in Table 12-31.
Ongoing surface water monitoring at the sites described in Section 12.6 is proposed for the Project to supplement current surface water monitoring. The proposed monitoring locations and function of each location are described in Table 12-31 and shown in Figure 12-8. Surface water monitoring will be for water quality, water levels in swamps and in receiving waterways, and for flows in the receiving waterway.
The surface water monitoring programme will collect water quality samples on a quarterly basis prior to mining in order to establish robust baseline conditions that can inform setting local water quality objectives in accordance with the QWQG.
The catchments and drainages surrounding the Project area are small and comprise a mix of freshwater and estuarine water. The design of the monitoring programme involves three distinct catchment zones:
Skardon River South Arm and supratidal wetland
Drainages and wetlands downstream of the central mining areas including Lunette Swamp and
Bigfoot Swamp

Skardon River Bauxite Project Chapter 12 – Water Values and Quality
Page 12-60
Namaleta Creek catchment, including downstream of the intersection of with the EHP mapped
wetland drainage feature between Pits 14 and 15 (that is not interpreted to be a wetland).

Sk
ard
on
Riv
er B
auxi
te P
roje
ct
C
hap
ter
12
– W
ate
r V
alu
es a
nd
Qu
alit
y
Pag
e 1
2-6
1
Tab
le 1
2-3
1 Ex
isti
ng
an
d P
rop
ose
d S
urf
ace
Wa
ter
Mo
nit
ori
ng
Net
wo
rk
Mo
nit
ori
ng
Po
int
Nam
e
per
C
urr
ent
EA#
Loca
tio
n D
eta
ils
Site
Fu
nct
ion
–
Kao
lin M
ine
Site
Fu
nct
ion
– B
auxi
te P
roje
ct
De
pth
Lo
gger
In
stal
led
East
ing
(m)
N
ort
hin
g (m
)
S1
n/a
N
amal
eta
Cre
ek –
up
stre
am
of
bau
xite
min
ing
Ref
ere
nce
Sit
e R
efe
ren
ce s
ite
– q
ual
ity,
dep
th a
nd
fl
ow
s.
Yes
61
04
91
8
68
58
25
S2
Nam
alet
a C
reek
U
pst
ream
100
m u
pst
ream
of
exis
tin
g cr
oss
ing
Ref
ere
nce
sit
e R
efe
ren
ce s
ite
- d
ow
nst
ream
of
Pit
s 1
2 a
nd
14
du
rin
g m
inin
g. P
rio
r to
m
inin
g,
up
stre
am
of
kao
lin
min
e an
d h
ence
pro
vid
es b
asel
ine
dat
a.
No
6
09
94
9
86
86
28
7
S3
W1
Dis
char
ge
po
int
fro
m
the
Raw
Wat
er P
it
Co
mp
lian
ce
- en
d
of
pip
e d
isch
arge
m
on
ito
rin
g.
Co
mp
ared
w
ith
N
amal
eta
Cre
ek
up
stre
am s
ite
Lim
ited
dir
ect
rele
van
ce f
or
bau
xite
m
ine,
may
ass
ist
in d
iffe
ren
tiat
ing
bet
wee
n
po
ten
tial
im
pac
ts
of
kao
lin m
ine
and
bau
xite
min
ing.
No
6
09
80
3
86
86
45
8
S4
n/a
R
aw W
ater
Pit
M
on
ito
r w
ater
q
ual
ity
of
sto
rage
s Li
mit
ed d
irec
t re
leva
nce
fo
r b
auxi
te
min
e. W
ater
qu
alit
y w
ill b
e u
sed
to
as
sess
if it
is s
uit
able
fo
r u
se in
du
st
sup
pre
ssio
n,
bau
xite
st
ock
pile
m
ois
ture
co
nte
nt
and
was
hd
ow
ns
Yes
60
99
37
8
68
64
58
S5
W6
Dis
char
ge
po
int
fro
m
Wes
tern
su
mp
o
f cu
rren
t Fl
uvi
al P
it
Co
mp
lian
ce
- en
d
of
pip
e d
isch
arge
m
on
ito
rin
g.
Co
mp
ared
w
ith
N
amal
eta
Cre
ek
up
stre
am s
ite
Lim
ited
dir
ect
rele
van
ce f
or
bau
xite
m
ine,
may
ass
ist
in d
iffe
ren
tiat
ing
bet
wee
n
po
ten
tial
im
pac
ts
of
kao
lin m
ine
and
bau
xite
min
ing.
Yes
60
94
09
8
68
67
50

Sk
ard
on
Riv
er B
auxi
te P
roje
ct
C
hap
ter
12
– W
ate
r V
alu
es a
nd
Qu
alit
y
Pag
e 1
2-6
2
Mo
nit
ori
ng
Po
int
Nam
e
per
C
urr
ent
EA#
Loca
tio
n D
eta
ils
Site
Fu
nct
ion
–
Kao
lin M
ine
Site
Fu
nct
ion
– B
auxi
te P
roje
ct
De
pth
Lo
gger
In
stal
led
East
ing
(m)
N
ort
hin
g (m
)
S6
Nam
alet
a C
reek
: D
ow
nst
ream
Nam
alet
a C
reek
: fo
r an
im
pac
ted
si
te
bet
wee
n
100
an
d
500
m
d
ow
nst
ream
o
f ka
olin
min
ing
area
Co
mp
lian
ce
Site
. C
om
par
ed
wit
h
Nam
alet
a C
reek
u
pst
ream
sit
e
Co
mp
lian
ce s
ite
do
wn
stre
am o
f P
its
12
an
d
14
d
uri
ng
min
ing.
D
ow
nst
ream
of
exis
tin
g ka
olin
min
e so
pro
vid
es b
asel
ine
dat
a fo
r w
ater
q
ual
ity
po
ten
tial
ly
imp
acte
d
by
kao
lin
min
e.
Flo
ws
to
be
mo
nit
ore
d.
No
6
09
39
2
86
86
91
2
S7
n/a
N
amal
eta
Cre
ek
– d
ow
nst
ream
of
Pit
s 14
an
d
15
, cr
oss
ove
r b
etw
een
fr
esh
wat
er
and
es
tuar
ine
syst
ems
n/a
R
efe
ren
ce
site
p
rio
r to
m
inin
g.
Co
mp
lian
ce
site
o
nce
m
inin
g co
mm
ence
s.
No
6
07
02
1
86
85
77
6
S8
n/a
N
amal
eta
Cre
ek i
mm
edia
tely
u
pst
ream
of
curr
ent
cro
ssin
g W
ate
r q
ual
ity
up
stre
am
of
cro
ssin
g an
d
nea
r R
aw
Wat
er
Pit
. A
cces
s ea
sy
and
sa
fe f
rom
cro
ssin
g.
Co
mp
lian
ce s
ite
do
wn
stre
am o
f P
its
12
an
d
14
. P
rovi
des
re
aso
nab
le
ind
icat
ion
of
bas
elin
e w
ater
qu
alit
y in
N
amal
eta
Cre
ek.
Pro
po
sed
fo
r o
ngo
ing
mo
nit
ori
ng
pro
gram
me
for
qu
alit
y an
d
dep
th
in
case
ac
cess
re
stri
cted
at
oth
er lo
cati
on
s.
Yes
60
96
54
8
68
64
12
S9
n/a
N
amal
eta
Cre
ek i
mm
edia
tely
d
ow
nst
ream
o
f cu
rren
t cr
oss
ing
Wat
er
qu
alit
y d
ow
nst
ream
o
f cr
oss
ing
and
n
ear
Raw
W
ate
r P
it.
Acc
ess
easy
an
d
safe
fro
m c
ross
ing.
Co
mp
lian
ce s
ite
do
wn
stre
am o
f P
its
12
an
d 1
4 a
nd
cro
ssin
g. P
rovi
des
re
aso
nab
le
ind
icat
ion
o
f b
asel
ine
wat
er
qu
alit
y in
N
amal
eta
Cre
ek.
Bas
elin
e d
epth
dat
a u
nim
pac
ted
by
cro
ssin
g.
Pro
po
sed
fo
r o
ngo
ing
mo
nit
ori
ng
pro
gram
me
in
case
ac
cess
res
tric
ted
at
oth
er lo
cati
on
s.
Flo
ws
to b
e m
on
ito
red
.
Yes
60
96
44
8
68
64
16

Sk
ard
on
Riv
er B
auxi
te P
roje
ct
C
hap
ter
12
– W
ate
r V
alu
es a
nd
Qu
alit
y
Pag
e 1
2-6
3
Mo
nit
ori
ng
Po
int
Nam
e
per
C
urr
ent
EA#
Loca
tio
n D
eta
ils
Site
Fu
nct
ion
–
Kao
lin M
ine
Site
Fu
nct
ion
– B
auxi
te P
roje
ct
De
pth
Lo
gger
In
stal
led
East
ing
(m)
N
ort
hin
g (m
)
S10
n
/a
Lun
ette
Sw
amp
n
/a
Wat
er
qu
alit
y an
d d
epth
. Ref
ere
nce
si
te
pri
or
to
min
ing.
C
om
plia
nce
si
te o
nce
min
ing
com
men
ces.
Yes
61
20
39
8
68
86
49
S11
n
/a
Big
foo
t Sw
amp
n
/a
Wat
er
qu
alit
y an
d d
epth
. Ref
ere
nce
si
te
pri
or
to
min
ing.
C
om
plia
nce
si
te o
nce
min
ing
com
men
ces.
Yes
61
28
60
8
69
58
47
S12
n
/a
Un
nam
ed
cree
k –
do
wn
stre
am L
un
ette
Sw
amp
n
/a
Do
wn
stre
am o
f P
its
3, 4
, 5, 8
, 9, 1
0,
11
, 1
2,
13
Ref
ere
nce
sit
e p
rio
r to
m
inin
g.
Co
mp
lian
ce
site
o
nce
m
inin
g co
mm
ence
s.
No
6
11
77
8
86
90
22
4
S13
W
2 D
isch
arge
po
int
fro
m e
xist
ing
Po
rt s
edim
ent
po
nd
C
om
plia
nce
-
rele
ase
po
int
dis
char
ge
mo
nit
ori
ng.
Mo
nit
ori
ng
of
run
off
fr
om
P
ort
in
fras
tru
ctu
re a
rea
No
6
16
71
8
86
99
70
3
S14
n
/a
Dis
char
ge
po
int
- P
ort
in
fras
tru
ctu
re a
rea
op
tio
n 2
se
dim
en
t p
on
d.
Exac
t lo
cati
on
to
b
e d
ete
rmin
ed
follo
win
g d
etai
led
d
esig
n.
No
min
al
loca
tio
n
of
add
itio
nal
m
on
ito
rin
g p
oin
t in
cas
e tw
o s
edim
ent
po
nd
s re
qu
ired
at
Po
rt.
n/a
C
om
plia
nce
si
te
- d
isch
arge
m
on
ito
rin
g o
f w
ater
qu
alit
y ru
no
ff
fro
m
Po
rt
infr
astr
uct
ure
ar
ea
/ se
dim
en
t p
on
d.
No
6
16
54
2
87
00
24
2
S15
n
/a
Skar
do
n
Riv
er
Sou
th
Arm
–
estu
arin
e w
ater
–
do
wn
stre
am
of
Pit
3
an
d
up
stre
am o
f P
ort
.
n/a
R
efe
ren
ce
site
p
rio
r to
m
inin
g.
Co
mp
lian
ce
site
o
nce
m
inin
g co
mm
ence
s.
No
6
15
99
6
86
94
45
8

Sk
ard
on
Riv
er B
auxi
te P
roje
ct
C
hap
ter
12
– W
ate
r V
alu
es a
nd
Qu
alit
y
Pag
e 1
2-6
4
Mo
nit
ori
ng
Po
int
Nam
e
per
C
urr
ent
EA#
Loca
tio
n D
eta
ils
Site
Fu
nct
ion
–
Kao
lin M
ine
Site
Fu
nct
ion
– B
auxi
te P
roje
ct
De
pth
Lo
gger
In
stal
led
East
ing
(m)
N
ort
hin
g (m
)
S16
n
/a
Skar
do
n
Riv
er
Sou
th
Arm
–
estu
arin
e w
ater
–
do
wn
stre
am o
f al
l p
its
(Pit
s 1
, 2
, 3
, 6
) an
d u
pst
ream
of
Po
rt.
n/a
C
om
plia
nce
si
te
on
ce
min
ing
com
men
ces.
N
o
61
73
33
8
69
81
41
S17
n
/a
Skar
do
n
Riv
er
Sou
th
Arm
–
estu
arin
e w
ater
–
do
wn
stre
am o
f P
ort
n/a
R
efe
ren
ce
site
p
rio
r to
m
inin
g.
Co
mp
lian
ce
site
o
nce
m
inin
g co
mm
ence
s.
No
6
16
66
6
87
00
46
3
S18
n
/a
Skar
do
n
Riv
er
sup
rati
dal
w
etl
and
n
/a
Ref
ere
nce
si
te
pri
or
to
min
ing.
C
om
plia
nce
si
te
on
ce
min
ing
com
men
ces.
No
6
16
46
6
86
96
89
7
# Th
e lo
cati
on
sp
ecif
ied
fo
r o
ngo
ing
mo
nit
ori
ng
may
dif
fer
to s
ligh
tly
to t
he
loca
tio
n i
n t
he
EA i
n o
rder
to
pro
vid
e an
im
pro
ved
mo
nit
ori
ng
loca
tio
n t
hat
co
nsi
der
s ac
cess
ibili
ty a
nd
effe
ctiv
ene
ss in
ach
ievi
ng
the
inte
nd
ed
mo
nit
ori
ng
pu
rpo
se.
Skardon River Bauxite Project Chapter 12 – Water Values and Quality
Page 12-65
12.10.2 Surface Water Monitoring Frequency and Parameters
The frequency of water quality monitoring at each location is variable and is affected by access problems due to necessary site safety precautions during rainfall and water levels. Details of proposed frequency of monitoring and monitoring parameters at each location are summarised in Table 12-32.
The current EA specifies monitoring frequency and parameters for the existing kaolin mine when in ‘care and maintenance’ (i.e. its current status). These are included in the proposed monitoring frequency and parameters provided in Table 12-32, with modifications to reflect the monitoring proposed for the Project. The physico-chemical, nutrient and metals parameters that will be sampled are as per Table 12-2.
Water levels will also be monitored in fresh water environments of Namaleta Creek, Bigfoot Swamp and Lunette Swamp. Monitoring of water levels in estuarine environments will not provide information on potential changes in levels associated with bauxite mining as the water levels in these areas are dominated by tidal influences.
The surface water samples will be analysed by a registered NATA accredited laboratory and sample collection and transportation will follow guidelines and protocols provided within the Monitoring and Sampling Manual 2009 (EHP, 2010).
12.10.3 Surface Water Monitoring and Reporting
Proposed water quality objectives for monitoring parameters for Namaleta Creek and wetlands are described in Table 12-2. These are ‘default’ water quality objectives and will be refined once sufficient baseline water quality data has been collected in accordance with the QWQG.
If water quality characteristics from monitoring of compliance locations during mining exceed any of the water quality objectives specified in Table 12-2 then Gulf will compare the monitoring results in the downstream receiving waters to monitoring results from reference sites and:
where the reference site results are not exceeded then no action will be taken, or
if the result is greater than the reference site, complete an investigation into the potential for
environmental harm and provide a written report to the administering authority in the next annual
return outlining:
details of the investigations carried out
actions taken to prevent environmental harm.
The following information will be recorded for all water monitoring:
the date on which the sample was taken
the time at which the sample was taken
the monitoring point at which the sample was taken
the results of all monitoring and details of any exceedances of the conditions of the EA.

Sk
ard
on
Riv
er B
auxi
te P
roje
ct
C
hap
ter
12
– W
ate
r V
alu
es a
nd
Qu
alit
y
Pag
e 1
2-6
6
Tab
le 1
2-3
2 Su
rfa
ce W
ate
r M
on
ito
rin
g F
req
uen
cy a
nd
Pa
ram
eter
s
Loca
tio
n
Fre
qu
ency
P
aram
ete
rs
– Ex
isti
ng
EA
Am
en
de
d f
or
Pro
ject
Fi
nal
Par
ame
ters
S1
Qu
arte
rly,
wh
en f
low
ing.
Co
nti
nu
ou
s w
ater
dep
th lo
gger
.
n/a
n
/a
Qu
arte
rly
for
ph
ysic
o-c
hem
ical
, n
utr
ien
ts,
met
als.
W
ate
r le
vels
.
S2 (
Nam
alet
a C
reek
U
pst
ream
) Q
uar
terl
y w
hen
flo
win
g.
Wit
hin
24
ho
urs
of
dis
char
ge a
nd
th
erea
fter
w
eekl
y w
hils
t d
isch
argi
ng
Turb
idit
y, E
C, p
H
Qu
arte
rly
for
ph
ysic
o-c
hem
ical
, n
utr
ien
ts a
nd
met
als
Qu
arte
rly
for
ph
ysic
o-c
hem
ical
, n
utr
ien
ts a
nd
met
als.
S3 (
W1
) W
ith
in 2
4 h
ou
rs o
f d
isch
arge
an
d
ther
eaft
er
wee
kly
wh
ilst
dis
char
gin
g.
Turb
idit
y,
EC,
pH
, o
il an
d g
reas
e N
o a
men
dm
ents
pro
po
sed
Tu
rbid
ity,
EC
, pH
, oil
and
gre
ase
S4 (
Raw
Wat
er
pit
) Q
uar
terl
y,
Co
nti
nu
ou
s w
ater
d
epth
logg
er
EC, p
H
No
am
end
men
ts p
rop
ose
d
EC, p
H
S5 (
W6
) W
ith
in 2
4 h
ou
rs o
f d
isch
arge
an
d
ther
eaft
er
wee
kly
wh
ilst
dis
char
gin
g.
Co
nti
nu
ou
s w
ater
dep
th lo
gger
.
Co
nti
nu
ou
s tu
rbid
ity
logg
er
in
Flu
vial
Pit
.
Turb
idit
y,
EC,
pH
, o
il an
d g
reas
e N
o a
men
dm
ents
pro
po
sed
Tu
rbid
ity,
EC
, pH
, oil
and
gre
ase
S6
(Nam
alet
a C
reek
: D
ow
nst
ream
)
Qu
arte
rly
wh
en f
low
ing.
Wit
hin
24
ho
urs
of
dis
char
ge a
nd
th
erea
fter
w
eekl
y w
hils
t d
isch
argi
ng
Turb
idit
y, E
C, p
H
Qu
arte
rly
for
ph
ysic
o-c
hem
ical
, n
utr
ien
ts a
nd
met
als
Qu
arte
rly
for
ph
ysic
o-c
hem
ical
, n
utr
ien
ts a
nd
met
als.
S7
Qu
arte
rly
n/a
n
/a
Ph
ysic
o-c
hem
ical
, nu
trie
nts
, met
als.
S8
Qu
arte
rly.
n
/a
n/a
P
hys
ico
-ch
emic
al, n
utr
ien
ts, m
etal
s.

Sk
ard
on
Riv
er B
auxi
te P
roje
ct
C
hap
ter
12
– W
ate
r V
alu
es a
nd
Qu
alit
y
Pag
e 1
2-6
7
Loca
tio
n
Fre
qu
ency
P
aram
ete
rs
– Ex
isti
ng
EA
Am
en
de
d f
or
Pro
ject
Fi
nal
Par
ame
ters
Co
nti
nu
ou
s w
ater
dep
th lo
gger
W
ate
r le
vels
.
S9
Qu
arte
rly.
Co
nti
nu
ou
s w
ater
dep
th lo
gger
n/a
n
/a
Ph
ysic
o-c
hem
ical
, nu
trie
nts
, met
als.
Wat
er
leve
ls.
S10
Q
uar
terl
y.
Co
nti
nu
ou
s w
ater
dep
th lo
gger
n/a
n
/a
Ph
ysic
o-c
hem
ical
, n
utr
ien
ts,
met
als.
W
ate
r le
vels
.
S11
Q
uar
terl
y.
Co
nti
nu
ou
s w
ater
dep
th lo
gger
n/a
n
/a
Ph
ysic
o-c
hem
ical
, nu
trie
nts
, met
als.
Wat
er
leve
ls.
S12
Q
uar
terl
y, w
hen
flo
win
g n
/a
n/a
P
hys
ico
-ch
emic
al, n
utr
ien
ts, m
etal
s.
S13
(W
2)
Wit
hin
24
ho
urs
of
dis
char
ge a
nd
th
erea
fter
w
eekl
y w
hils
t d
isch
argi
ng.
Turb
idit
y,
EC,
pH
, o
il an
d g
reas
e P
hys
ico
-ch
emic
al,
nu
trie
nts
, to
tal
pet
role
um
h
ydro
carb
on
s an
d
met
als
Ph
ysic
o-c
hem
ical
, n
utr
ien
ts,
met
als,
to
tal p
etro
leu
m h
ydro
carb
on
s, o
il an
d
grea
se
S14
W
ith
in 2
4 h
ou
rs o
f d
isch
arge
an
d
ther
eaft
er
wee
kly
wh
ilst
dis
char
gin
g.
n/a
n
/a
Ph
ysic
o-c
hem
ical
, n
utr
ien
ts,
met
als,
to
tal p
etro
leu
m h
ydro
carb
on
s, o
il an
d
grea
se
S15
Q
uar
terl
y n
/a
n/a
P
hys
ico
-ch
emic
al,
nu
trie
nts
, m
etal
s,
hyd
roca
rbo
ns
S16
Q
uar
terl
y n
/a
n/a
P
hys
ico
-ch
emic
al,
nu
trie
nts
, m
etal
s,
hyd
roca
rbo
ns
S17
Q
uar
terl
y n
/a
n/a
P
hys
ico
-ch
emic
al,
nu
trie
nts
, m
etal
s,
hyd
roca
rbo
ns
S18
Q
uar
terl
y n
/a
n/a
P
hys
ico
-ch
emic
al, n
utr
ien
ts, m
etal
s
Skardon River Bauxite Project Chapter 12 – Water Values and Quality
Page 12-68
12.10.4 Receiving Environment Monitoring Programme
As described in Chapter 6, Project releases to receiving environments will be limited to sediment ponds at the Port infrastructure area. Never-the-less there is potential for mining related activities to result in increased erosion and sedimentation of receiving waters.
The proposed monitoring programme outlined above will commence prior to construction and operations and continue throughout the mine life. This monitoring programme will inform the requirements of a Receiving Environment Monitoring Program (REMP) to monitor, identify and describe any adverse impacts to surface water environmental values, quality and levels due to bauxite mining activity. The REMP will be informed by:
environmental values identified in Section 12.4 and Section 12.5
water quality objectives and indicators / parameters proposed for monitoring, including water
depth and Creek flows (Section 12.5)
location of monitoring sites, including reference sites and compliance / control sites (Table 12-31)
timing and frequency of sampling (Table 12-32)
Monitoring will involve a combination of (i) in situ measurements obtained using field instruments to monitor indicators such as turbidity, EC, DO and pH, and (ii) field sampling using manual grab sampling or auto-sampling with subsequent laboratory analysis.
Monitoring will be undertaken in accordance with the Monitoring and Sampling Manual (EHP, 2009). The REMP will define quality assurance / quality control (QA/QC) procedures for all aspects of monitoring. Data analysis methods will be described in the REMP.
Proposed ecological and biological monitoring of creeks and wetlands is described in Chapter 16. This monitoring is design to tie in with the surface water monitoring programme by undertaking monitoring at the same sites.
Proposed monitoring in the estuarine / marine environment of the Skardon River is described in Chapter 17.
The REMP will be developed and implemented to monitor, identify and describe any adverse impacts to surface water and groundwater environmental values, quality and flows due to the authorised mining activity. This will include monitoring the effects of the mine on the receiving environment periodically (under natural flow conditions). For the purposes of the REMP, the receiving environment is the waters of Namaleta Creek, Skardon River and wetlands within and surrounding the Project area downstream or down gradient of the authorised mining activity.
The REMP will address the requirements of the REMP Guideline (EHP, 2015). A report outlining the findings of the REMP, including all monitoring results and interpretations will be prepared annually. The report will include an assessment of background reference water quality, the condition of downstream water quality compared against water quality objectives, and the suitability of current release limits to protect downstream environmental values.
12.10.5 Groundwater Monitoring
The groundwater monitoring programme will include ongoing monitoring of the existing groundwater bores and additional bores. The bore number, location, purpose and summary of monitoring are described in Table 12-33.
The locations for the monitoring bore sites are shown in relation to the proposed bauxite mining pits and other bauxite mine infrastructure in Figure 12-17. The proposed monitoring bore network comprises existing bores and new bores. Reference bores provide information on groundwater

Skardon River Bauxite Project Chapter 12 – Water Values and Quality
Page 12-69
upgradient of potential Project impacts. Compliance bores will be used for comparison to reference bores to assist in understanding potential Project impacts on groundwater. Prior to mining all bores will provide baseline groundwater data for the area.
The groundwater levels for all bores will be recorded with a continuous, automatic logger to determine any shallow groundwater responses to rainfall events and to changes in local pumping regimes. Manual readings of standing water levels will be measured with a water level dipper quarterly so as to capture data during the wet and dry seasons and for calibration of the automated instrumentation within bores fitted with pressure transducers.
It is intended that data will be downloaded from the pressure transducers on a six monthly basis at beginning and end of wet season, i.e. October – November and April – May. Manual water level measurements will be taken prior to downloading the data from the pressure transducer, such that the pressure transducer measurements can be calibrated.
Analysis of groundwater samples will be recorded at the existing and proposed monitoring locations listed in Table 12-33 at quarterly intervals. The samples will be tested at a NATA accredited laboratory for standard suites of analytes. Sample collection and transportation will follow guidelines and protocols provided within the Monitoring and Sampling Manual 2009 (EHP, 2010), with consideration given to sampling techniques for groundwater in a low yield bores. The testing will include the parameters described in Table 12-2.

Sk
ard
on
Riv
er B
auxi
te P
roje
ct
C
hap
ter
12
– W
ate
r V
alu
es a
nd
Qu
alit
y
Pag
e 1
2-7
0
Tab
le 1
2-3
3 G
rou
nd
wa
ter
Mo
nit
ori
ng
Net
wo
rk
Mo
nit
ori
ng
Po
int
Loca
tio
n D
eta
ils
Loca
tio
n (
GD
A9
4 –
Zo
ne
5
4)
Bo
re P
urp
ose
M
on
ito
rin
g
East
ing
(m)
No
rth
ing
(m)
Re
fere
nce
Bo
res
G1
Nea
r Lu
net
te
Swam
p a
nd
cam
p –
u
sed
fo
r ca
mp
su
pp
ly
611
810
8
687
60
4
Co
nd
itio
ns
at
the
top
o
f Lu
net
te
Swam
p
catc
hm
ent;
ind
icat
ive
of
con
dit
ion
s n
ear
Pit
s 1
0,
11
, 12
an
d 1
3.
Sup
ply
wat
er t
o c
amp
fro
m b
ore
up
grad
ien
t o
f im
pac
ts.
Wat
er
qu
alit
y h
isto
rica
lly s
uit
able
fo
r p
ota
ble
cam
p w
ater
.
Wat
er
leve
ls
reco
rded
w
ith
co
nti
nu
ou
s lo
gger
; Sa
mp
ling
and
la
bo
rato
ry
test
ing;
C
on
tin
uo
us
logg
ing
EC.
G9
Nea
r h
aulr
oad
, w
est
of
Pit
3
614
121
8
692
98
2
Aq
uif
er
con
dit
ion
s at
ce
ntr
al
min
ing
pit
s (p
red
om
inan
tly
up
grad
ien
t o
f P
it 3
are
a) a
nd
u
pgr
adie
nt
of
Big
foo
t Sw
amp
Wat
er
leve
ls
reco
rded
w
ith
co
nti
nu
ou
s lo
gger
; Sa
mp
ling
and
la
bo
rato
ry
test
ing.
G1
0
Nea
r h
aulr
oad
in
lin
e w
ith
B
igfo
ot
Swam
p
614
846
8
695
17
4
Aq
uif
er c
on
dit
ion
s at
th
e n
ort
her
n e
nd
of
min
e (p
red
om
inan
tly
up
grad
ien
t o
f P
its
3,
2 a
nd
6)
and
up
grad
ien
t o
f B
igfo
ot
Swam
p
Wat
er
leve
ls
reco
rded
w
ith
co
nti
nu
ou
s lo
gger
; Sa
mp
ling
and
la
bo
rato
ry
test
ing.
G1
5
New
b
ore
u
pgr
adie
nt
of
Lun
ette
Sw
amp
614
307
8
689
72
2
Aq
uif
er
con
dit
ion
s u
pgr
adie
nt
of
Lun
ette
Sw
amp
an
d a
ll m
ine
pit
s (P
its
5, 8
, 9, 1
0)
Wat
er
leve
ls
reco
rded
w
ith
co
nti
nu
ou
s lo
gger
; Sa
mp
ling
and
la
bo
rato
ry
test
ing.
G1
6
New
b
ore
u
pgr
adie
nt
of
Pit
s 1
4 a
nd
15
610
300
8
685
02
3
Aq
uif
er
con
dit
ion
s u
pgr
adie
nt
of
Nam
alet
a C
reek
an
d s
ou
ther
n m
ine
pit
s (P
its
14
an
d 1
5)
Wat
er
leve
ls
reco
rded
w
ith
co
nti
nu
ou
s lo
gger
; Sa
mp
ling
and
la
bo
rato
ry
test
ing.
C2
Nea
r B
igfo
ot
Swam
p
613
940
8
695
67
6
Aq
uif
er
con
dit
ion
s u
p
grad
ien
t fr
om
B
igfo
ot
Swam
p
Wat
er
leve
ls
reco
rded
w
ith
co
nti
nu
ou
s lo
gger
; Sa
mp
ling
and
la
bo
rato
ry
test
ing.
Co
mp
lian
ce B
ore
s
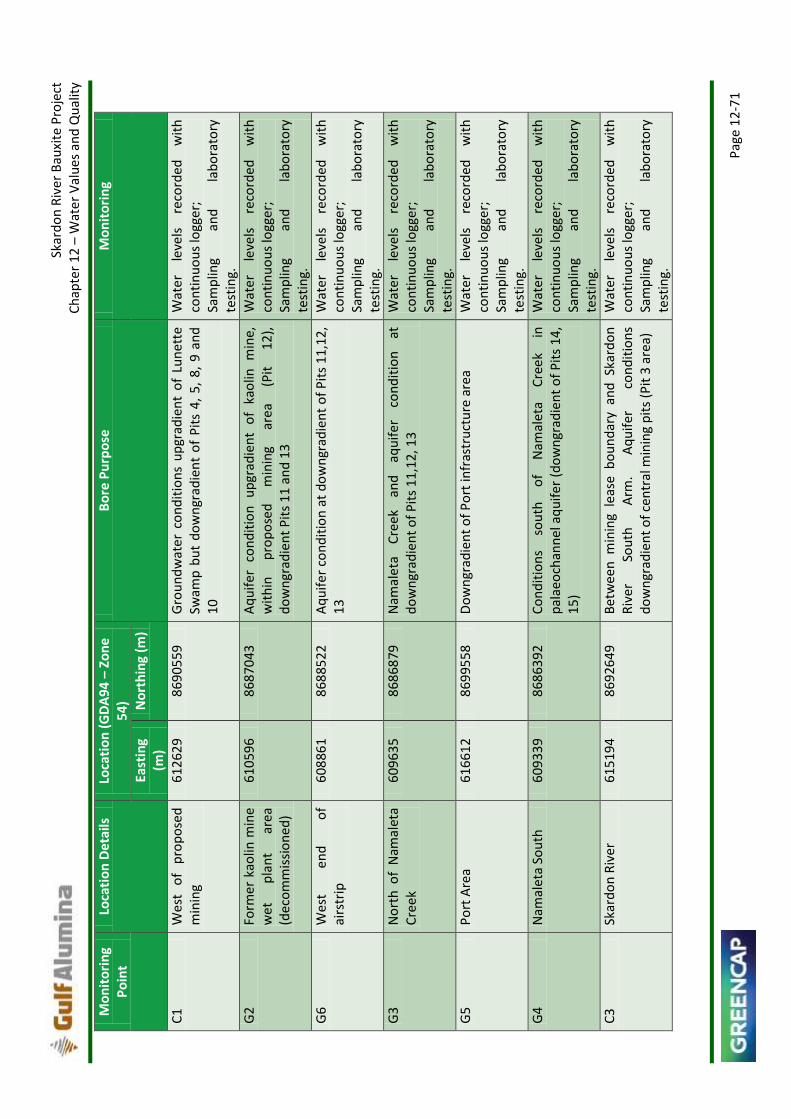
Sk
ard
on
Riv
er B
auxi
te P
roje
ct
C
hap
ter
12
– W
ate
r V
alu
es a
nd
Qu
alit
y
Pag
e 1
2-7
1
Mo
nit
ori
ng
Po
int
Loca
tio
n D
eta
ils
Loca
tio
n (
GD
A9
4 –
Zo
ne
5
4)
Bo
re P
urp
ose
M
on
ito
rin
g
East
ing
(m)
No
rth
ing
(m)
C1
Wes
t o
f p
rop
ose
d
min
ing
612
629
8
690
55
9
Gro
un
dw
ater
co
nd
itio
ns
up
grad
ien
t o
f Lu
net
te
Swam
p b
ut
do
wn
grad
ien
t o
f P
its
4,
5,
8,
9 a
nd
1
0
Wat
er
leve
ls
reco
rded
w
ith
co
nti
nu
ou
s lo
gger
; Sa
mp
ling
and
la
bo
rato
ry
test
ing.
G2
Form
er k
aolin
min
e w
et
pla
nt
area
(d
eco
mm
issi
on
ed)
610
596
8
687
04
3
Aq
uif
er
con
dit
ion
u
pgr
adie
nt
of
kao
lin
min
e,
wit
hin
p
rop
ose
d
min
ing
area
(P
it
12
),
do
wn
grad
ien
t P
its
11
an
d 1
3
Wat
er
leve
ls
reco
rded
w
ith
co
nti
nu
ou
s lo
gger
; Sa
mp
ling
and
la
bo
rato
ry
test
ing.
G6
Wes
t en
d
of
airs
trip
6
0886
1
868
85
22
A
qu
ifer
co
nd
itio
n a
t d
ow
ngr
adie
nt
of
Pit
s 1
1,1
2,
13
W
ate
r le
vels
re
cord
ed
wit
h
con
tin
uo
us
logg
er;
Sam
plin
g an
d
lab
ora
tory
te
stin
g.
G3
No
rth
of
Nam
alet
a C
reek
6
0963
5
868
68
79
N
amal
eta
Cre
ek
and
aq
uif
er
con
dit
ion
at
d
ow
ngr
adie
nt
of
Pit
s 1
1,1
2, 1
3
Wat
er
leve
ls
reco
rded
w
ith
co
nti
nu
ou
s lo
gger
; Sa
mp
ling
and
la
bo
rato
ry
test
ing.
G5
Po
rt A
rea
616
612
8
699
55
8
Do
wn
grad
ien
t o
f P
ort
infr
astr
uct
ure
are
a
Wat
er
leve
ls
reco
rded
w
ith
co
nti
nu
ou
s lo
gger
; Sa
mp
ling
and
la
bo
rato
ry
test
ing.
G4
Nam
alet
a So
uth
6
0933
9
868
63
92
C
on
dit
ion
s so
uth
o
f N
amal
eta
Cre
ek
in
pal
aeo
chan
nel
aq
uif
er (
do
wn
grad
ien
t o
f P
its
14
, 1
5)
Wat
er
leve
ls
reco
rded
w
ith
co
nti
nu
ou
s lo
gger
; Sa
mp
ling
and
la
bo
rato
ry
test
ing.
C3
Skar
do
n R
iver
6
1519
4
869
26
49
B
etw
een
min
ing
leas
e b
ou
nd
ary
and
Ska
rdo
n
Riv
er
Sou
th
Arm
. A
qu
ifer
co
nd
itio
ns
do
wn
grad
ien
t o
f ce
ntr
al m
inin
g p
its
(Pit
3 a
rea)
Wat
er
leve
ls
reco
rded
w
ith
co
nti
nu
ou
s lo
gger
; Sa
mp
ling
and
la
bo
rato
ry
test
ing.
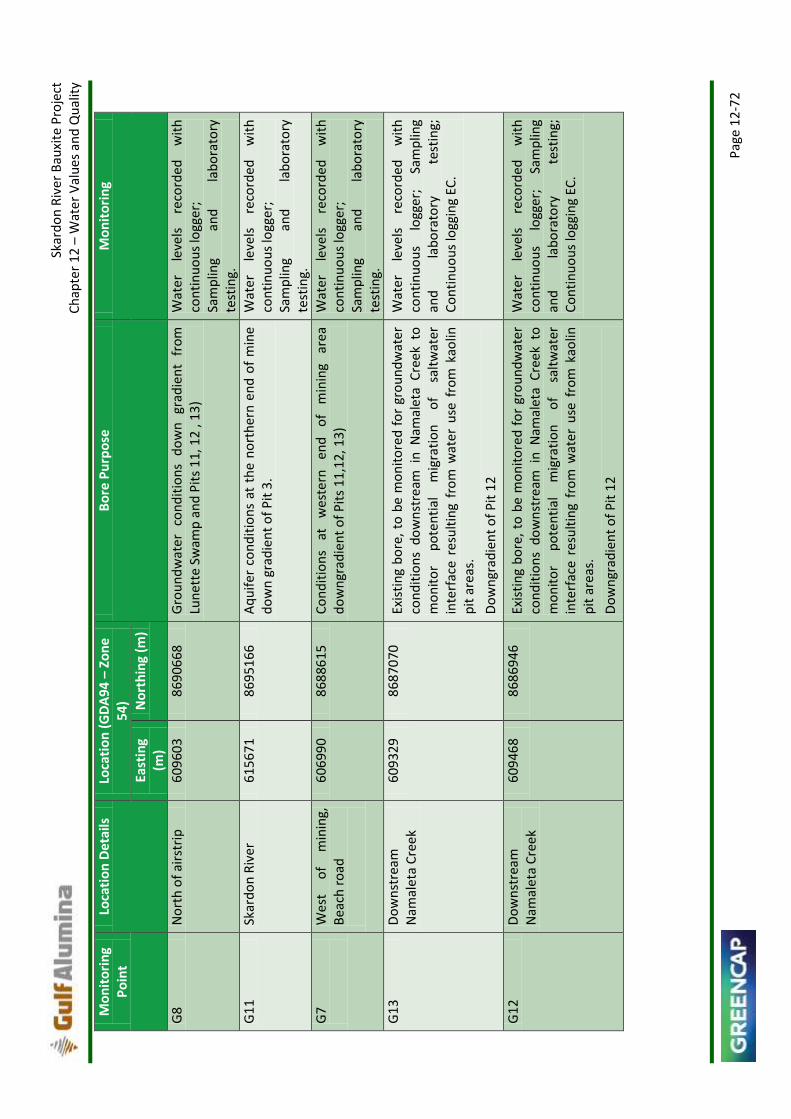
Sk
ard
on
Riv
er B
auxi
te P
roje
ct
C
hap
ter
12
– W
ate
r V
alu
es a
nd
Qu
alit
y
Pag
e 1
2-7
2
Mo
nit
ori
ng
Po
int
Loca
tio
n D
eta
ils
Loca
tio
n (
GD
A9
4 –
Zo
ne
5
4)
Bo
re P
urp
ose
M
on
ito
rin
g
East
ing
(m)
No
rth
ing
(m)
G8
No
rth
of
airs
trip
6
0960
3
869
06
68
G
rou
nd
wat
er
con
dit
ion
s d
ow
n
grad
ien
t fr
om
Lu
net
te S
wam
p a
nd
Pit
s 1
1, 1
2 ,
13
)
Wat
er
leve
ls
reco
rded
w
ith
co
nti
nu
ou
s lo
gger
; Sa
mp
ling
and
la
bo
rato
ry
test
ing.
G1
1
Skar
do
n R
iver
6
1567
1
869
51
66
A
qu
ifer
co
nd
itio
ns
at t
he
no
rth
ern
en
d o
f m
ine
do
wn
gra
die
nt
of
Pit
3.
Wat
er
leve
ls
reco
rded
w
ith
co
nti
nu
ou
s lo
gger
; Sa
mp
ling
and
la
bo
rato
ry
test
ing.
G7
W
est
of
min
ing,
B
each
ro
ad
606
990
8
688
61
5
Co
nd
itio
ns
at
we
ste
rn
end
o
f m
inin
g ar
ea
do
wn
grad
ien
t o
f P
its
11
,12
, 13)
W
ate
r le
vels
re
cord
ed
wit
h
con
tin
uo
us
logg
er;
Sam
plin
g an
d
lab
ora
tory
te
stin
g.
G1
3
Do
wn
stre
am
Nam
alet
a C
reek
6
0932
9
868
70
70
Ex
isti
ng
bo
re,
to b
e m
on
ito
red
fo
r gr
ou
nd
wat
er
con
dit
ion
s d
ow
nst
ream
in
Nam
alet
a C
reek
to
m
on
ito
r p
ote
nti
al
mig
rati
on
o
f sa
ltw
ater
in
terf
ace
resu
ltin
g fr
om
wat
er u
se f
rom
kao
lin
pit
are
as.
Do
wn
grad
ien
t o
f P
it 1
2
Wat
er
leve
ls
reco
rded
w
ith
co
nti
nu
ou
s lo
gger
; Sa
mp
ling
and
la
bo
rato
ry
test
ing;
C
on
tin
uo
us
logg
ing
EC.
G1
2
Do
wn
stre
am
Nam
alet
a C
reek
6
0946
8
868
69
46
Ex
isti
ng
bo
re,
to b
e m
on
ito
red
fo
r gr
ou
nd
wat
er
con
dit
ion
s d
ow
nst
ream
in
Nam
alet
a C
reek
to
m
on
ito
r p
ote
nti
al
mig
rati
on
o
f sa
ltw
ater
in
terf
ace
resu
ltin
g fr
om
wat
er u
se f
rom
kao
lin
pit
are
as.
Do
wn
grad
ien
t o
f P
it 1
2
Wat
er
leve
ls
reco
rded
w
ith
co
nti
nu
ou
s lo
gger
; Sa
mp
ling
and
la
bo
rato
ry
test
ing;
C
on
tin
uo
us
logg
ing
EC.

Sk
ard
on
Riv
er B
auxi
te P
roje
ct
C
hap
ter
12
– W
ate
r V
alu
es a
nd
Qu
alit
y
Pag
e 1
2-7
3
Mo
nit
ori
ng
Po
int
Loca
tio
n D
eta
ils
Loca
tio
n (
GD
A9
4 –
Zo
ne
5
4)
Bo
re P
urp
ose
M
on
ito
rin
g
East
ing
(m)
No
rth
ing
(m)
G1
4
Do
wn
stre
am
Nam
alet
a C
reek
6
0915
5
868
72
32
Ex
isti
ng
bo
re,
to b
e m
on
ito
red
fo
r gr
ou
nd
wat
er
con
dit
ion
s d
ow
nst
ream
in
Nam
alet
a C
reek
to
m
on
ito
r p
ote
nti
al
mig
rati
on
o
f sa
ltw
ater
in
terf
ace
resu
ltin
g fr
om
wat
er u
se f
rom
kao
lin
pit
are
as.
Do
wn
grad
ien
t o
f P
it 1
2
Wat
er
leve
ls
reco
rded
w
ith
co
nti
nu
ou
s lo
gger
; Sa
mp
ling
and
la
bo
rato
ry
test
ing;
C
on
tin
uo
us
logg
ing
EC.
G1
7
Nea
r p
rop
ose
d
wat
er
sup
ply
p
rod
uct
ion
b
ore
s at
th
e P
ort
are
a
615
305
8
698
17
0
Mo
nit
or
gro
un
dw
ate
r le
vels
n
ear
pro
po
sed
w
ater
su
pp
ly b
ore
s at
Po
rt a
rea
Wat
er
leve
ls
reco
rded
w
ith
co
nti
nu
ou
s lo
gger
;
Sam
plin
g an
d
lab
ora
tory
te
stin
g.
G1
8
Nea
r p
rop
ose
d
Nam
alet
a b
ore
fiel
d,
sou
th o
f N
amal
eta
Cre
ek
609
807
8
685
93
3
Mo
nit
or
gro
un
dw
ate
r le
vels
n
ear
pro
po
sed
w
ater
su
pp
ly b
ore
s in
Nam
alet
a B
ore
fiel
d
Wat
er
leve
ls
reco
rded
w
ith
co
nti
nu
ou
s lo
gger
;
Sam
plin
g an
d
lab
ora
tory
te
stin
g.
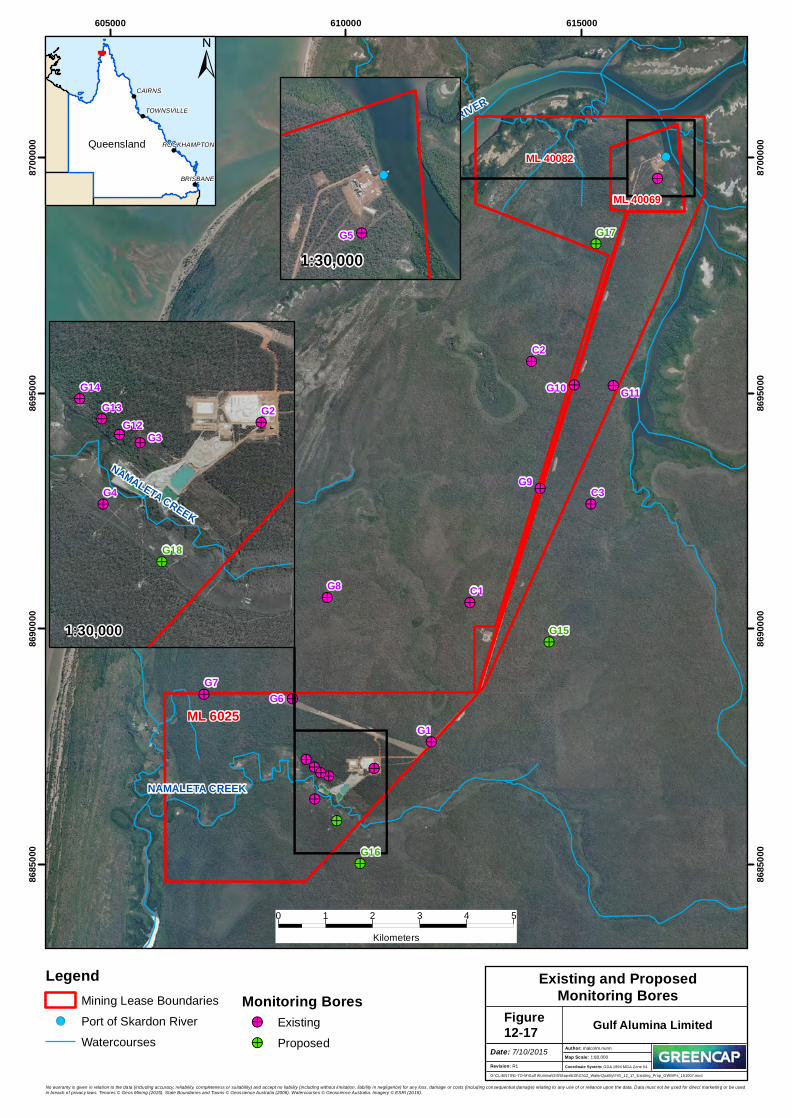
!(
!>
!>!>
!>
!>
!>
!>
!>
!> !>
!>
!>!>!>
!>
!>
!>
!>
!>
!>
!>
ML 6025
ML 40082
ML 40069
SKARDON RIVER
NAMALETA CREEK
G1
G8
G6
G9
G10 G11
G7
C1
C2
C3
G17
G15
G16
605000 610000 61500086
8500
0
8685
000
8690
000
8690
000
8695
000
8695
000
8700
000
8700
000
Figure12-17
G:\CLIENTS\E-TO-M\Gulf Alumina\GIS\Maps\EIS\Ch12_WaterQuality\FIG_12_17_Existing_Prop_GWMPs_151007.mxd
Revision: R1
Date: 7/10/2015 Author: malcolm.nunn1:80,000Map Scale:
Coordinate System: GDA 1994 MGA Zone 54
Existing and ProposedMonitoring Bores
0 1 2 3 4 5Kilometers
Gulf Alumina Limited
!
!
!
!
Queensland
CAIRNS
BRISBANE
TOWNSVILLE
ROCKHAMPTON
±
No warranty is given in relation to the data (including accuracy, reliability, completeness or suitability) and accept no liability (including without limitation, liability in negligence) for any loss, damage or costs (including consequential damage) relating to any use of or reliance upon the data. Data must not be used for direct marketing or be used in breach of privacy laws. Tenures © Geos Mining (2015). State Boundaries and Towns © Geoscience Australia (2006). Watercourses © Geoscience Australia. Imagery © ESRI (2015).
LegendMining Lease Boundaries
!( Port of Skardon RiverWatercourses
Monitoring Bores!> Existing!> Proposed
!>
!>
!>
!>
!>!>
!>
G2
G3
G4
G14G13
G12
G18
NAMALETA CREEK
!(
!>G5
1:30,000
1:30,000
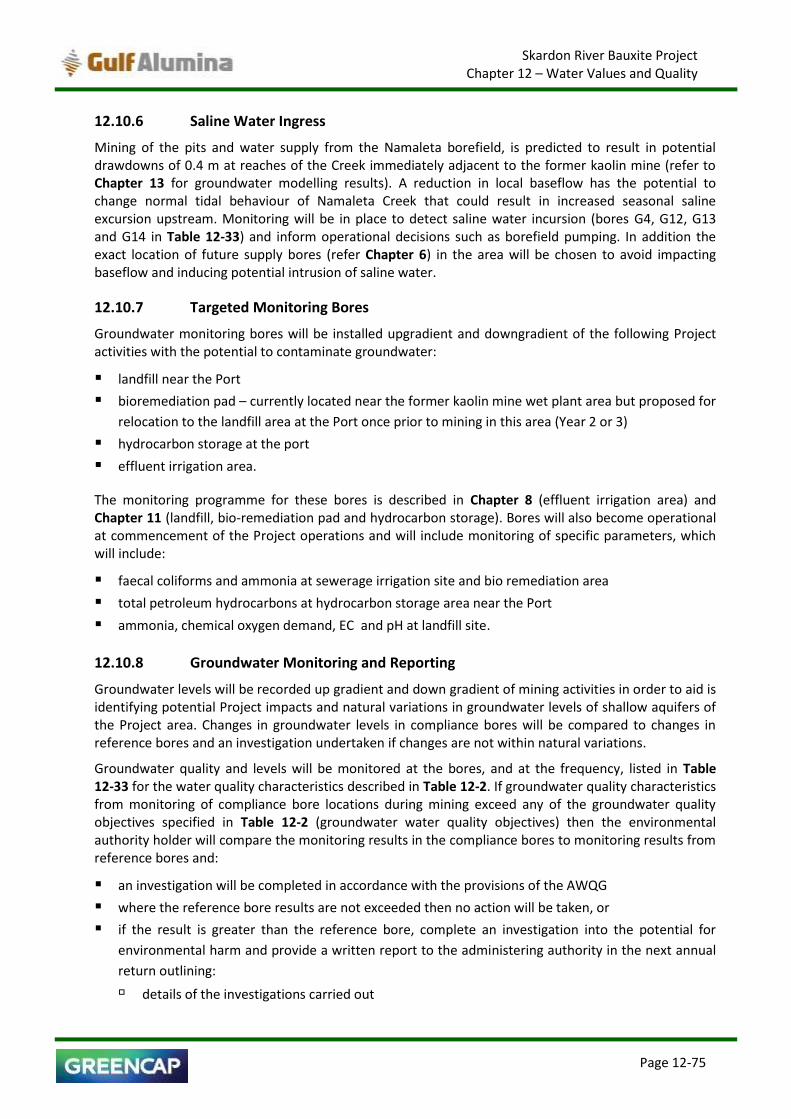
Skardon River Bauxite Project Chapter 12 – Water Values and Quality
Page 12-75
12.10.6 Saline Water Ingress
Mining of the pits and water supply from the Namaleta borefield, is predicted to result in potential drawdowns of 0.4 m at reaches of the Creek immediately adjacent to the former kaolin mine (refer to Chapter 13 for groundwater modelling results). A reduction in local baseflow has the potential to change normal tidal behaviour of Namaleta Creek that could result in increased seasonal saline excursion upstream. Monitoring will be in place to detect saline water incursion (bores G4, G12, G13 and G14 in Table 12-33) and inform operational decisions such as borefield pumping. In addition the exact location of future supply bores (refer Chapter 6) in the area will be chosen to avoid impacting baseflow and inducing potential intrusion of saline water.
12.10.7 Targeted Monitoring Bores
Groundwater monitoring bores will be installed upgradient and downgradient of the following Project activities with the potential to contaminate groundwater:
landfill near the Port
bioremediation pad – currently located near the former kaolin mine wet plant area but proposed for
relocation to the landfill area at the Port once prior to mining in this area (Year 2 or 3)
hydrocarbon storage at the port
effluent irrigation area.
The monitoring programme for these bores is described in Chapter 8 (effluent irrigation area) and Chapter 11 (landfill, bio-remediation pad and hydrocarbon storage). Bores will also become operational at commencement of the Project operations and will include monitoring of specific parameters, which will include:
faecal coliforms and ammonia at sewerage irrigation site and bio remediation area
total petroleum hydrocarbons at hydrocarbon storage area near the Port
ammonia, chemical oxygen demand, EC and pH at landfill site.
12.10.8 Groundwater Monitoring and Reporting
Groundwater levels will be recorded up gradient and down gradient of mining activities in order to aid is identifying potential Project impacts and natural variations in groundwater levels of shallow aquifers of the Project area. Changes in groundwater levels in compliance bores will be compared to changes in reference bores and an investigation undertaken if changes are not within natural variations.
Groundwater quality and levels will be monitored at the bores, and at the frequency, listed in Table 12-33 for the water quality characteristics described in Table 12-2. If groundwater quality characteristics from monitoring of compliance bore locations during mining exceed any of the groundwater quality objectives specified in Table 12-2 (groundwater water quality objectives) then the environmental authority holder will compare the monitoring results in the compliance bores to monitoring results from reference bores and:
an investigation will be completed in accordance with the provisions of the AWQG
where the reference bore results are not exceeded then no action will be taken, or
if the result is greater than the reference bore, complete an investigation into the potential for
environmental harm and provide a written report to the administering authority in the next annual
return outlining:
details of the investigations carried out
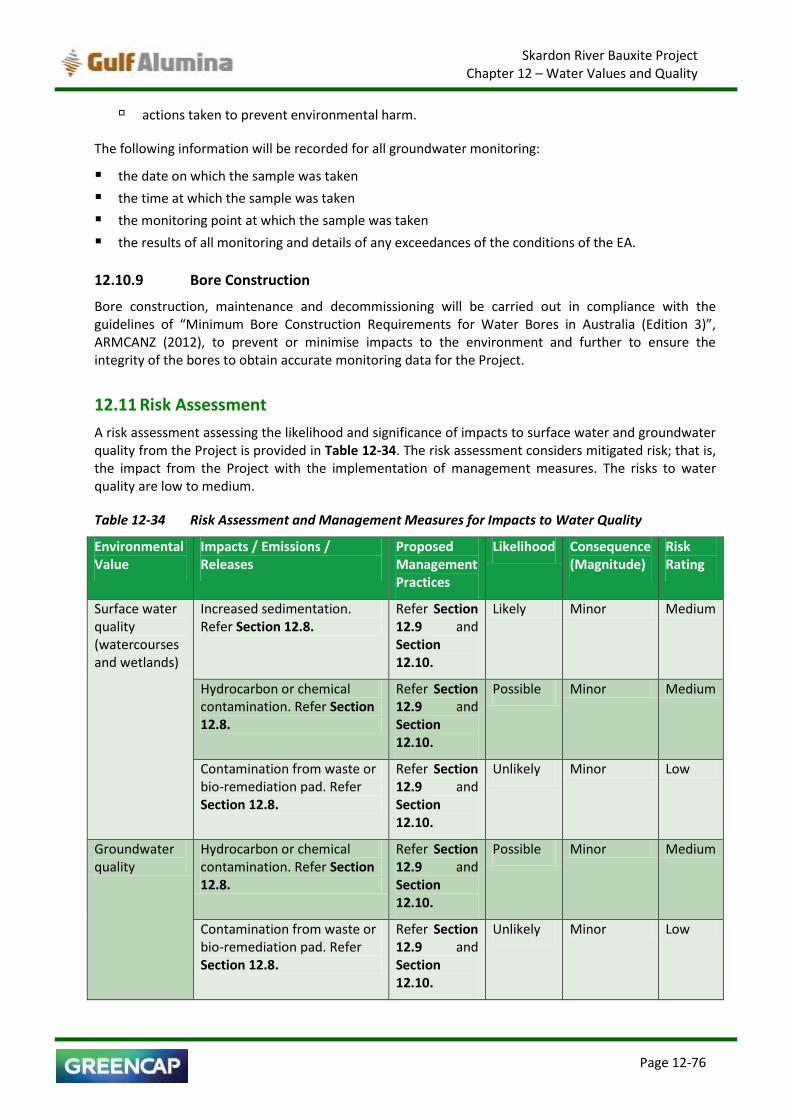
Skardon River Bauxite Project Chapter 12 – Water Values and Quality
Page 12-76
actions taken to prevent environmental harm.
The following information will be recorded for all groundwater monitoring:
the date on which the sample was taken
the time at which the sample was taken
the monitoring point at which the sample was taken
the results of all monitoring and details of any exceedances of the conditions of the EA.
12.10.9 Bore Construction
Bore construction, maintenance and decommissioning will be carried out in compliance with the guidelines of “Minimum Bore Construction Requirements for Water Bores in Australia (Edition 3)”, ARMCANZ (2012), to prevent or minimise impacts to the environment and further to ensure the integrity of the bores to obtain accurate monitoring data for the Project.
12.11 Risk Assessment
A risk assessment assessing the likelihood and significance of impacts to surface water and groundwater quality from the Project is provided in Table 12-34. The risk assessment considers mitigated risk; that is, the impact from the Project with the implementation of management measures. The risks to water quality are low to medium.
Table 12-34 Risk Assessment and Management Measures for Impacts to Water Quality
Environmental Value
Impacts / Emissions / Releases
Proposed Management Practices
Likelihood Consequence (Magnitude)
Risk Rating
Surface water quality (watercourses and wetlands)
Increased sedimentation. Refer Section 12.8.
Refer Section 12.9 and Section 12.10.
Likely Minor Medium
Hydrocarbon or chemical contamination. Refer Section 12.8.
Refer Section 12.9 and Section 12.10.
Possible Minor Medium
Contamination from waste or bio-remediation pad. Refer Section 12.8.
Refer Section 12.9 and Section 12.10.
Unlikely Minor Low
Groundwater quality
Hydrocarbon or chemical contamination. Refer Section 12.8.
Refer Section 12.9 and Section 12.10.
Possible Minor Medium
Contamination from waste or bio-remediation pad. Refer Section 12.8.
Refer Section 12.9 and Section 12.10.
Unlikely Minor Low

Skardon River Bauxite Project Chapter 12 – Water Values and Quality
Page 12-77
12.12 Cumulative Impacts
Cumulative impacts are considered for all known or reasonably foreseeable projects with the potential for spatial and temporal impacts in combination with the Skardon River Bauxite Project. The projects in the Cape York region which potentially meet these criteria are:
Metro Mining Ltd’s (formerly Cape Alumina Ltd’s) Bauxite Hills project
Rio Tinto’s existing bauxite mining operation near Weipa
Rio Tinto’s proposed South of Embley Project
Rio Tinto’s existing and proposed projects are not considered to have a cumulative impact on water quality with the Skardon River Bauxite Project as the projects are approximately 90 km apart, do not share the same catchments or hydrology and do not operate in the same near shore waters.
The only project considered to have a cumulative impact with the Skardon River Bauxite Project is the Bauxite Hills project. Based on publically available information, the Bauxite Hills project would be for an integrated bauxite mine adjacent (east and west) to the Project and port located to the immediate south of the Skardon River. The pre-feasibility information for the Bauxite Hills project describes a 2 Mtpa bauxite mine with over 21 year mine life and a 61.5 Mt indicated and inferred resource. The Bauxite Hills project includes a new barge loading facility on the Skardon River, barging of bauxite to an offshore transhipment area, workers camp and haul road transport corridor. A conceptual mine plan for the Bauxite Hills project is provided in Figure 12-18, which shows mining to the east and west of the Skardon River Bauxite Project.
Figure 12-18 Conceptual Mine Plan – Bauxite Hills Project

Skardon River Bauxite Project Chapter 12 – Water Values and Quality
Page 12-78
For the purpose of assessing cumulative impacts to groundwater, Chapter 13 demonstrates that groundwater gradients for shallow aquifers are similar to surface water catchments.
The Bauxite Hills Project is not located within the Namaleta Creek or Lunette Swamp catchments and hence there is not expected to be cumulative impacts to surface water or groundwater quality in Namaleta Creek and Lunette Swamp.
Based on publically available information, the Bauxite Hills project will include mine pits in close proximity to Bigfoot Swamp. Therefore there may be cumulative water quality impacts on Bigfoot Swamp dominated by Bauxite Hills project’s activities. As Bigfoot Swamp occurs on Metro Mining’s leases, it is expected that they will undertake ongoing monitoring of water levels and quality and, in consultation with Gulf Alumina, implement any management measures or investigations required by monitoring results.
Both project’s mining activities occur within upper catchment of the wetland complex to the west and north-west of both Project’s mining leases. There is potential for cumulative surface water quality impacts on this wetland complex, although due to separation distance and proposed management measures expected from both projects, impacts are likely to be minimal. As operations on Metro Mining Ltd’s ML 20689, are located directly west of Gulf Alumina’s ML 40082, Gulf Alumina will seek a cooperative relationship with Metro Mining and the landowners for access, establishment and ongoing monitoring of water quality in these wetland areas.
The Skardon River Bauxite Project will not impact the catchments to the east of Skardon River South Arm where the mining is proposed for the Bauxite Hills project. Nevertheless, the Skardon River South Arm (estuarine environment) may be impacted by runoff from both the west, mainly from the Skardon River Bauxite Project, but also small areas of the Bauxite Hills project, and from the east (Bauxite Hills Project).
Gulf Alumina has proposed a buffer around the fringing supratidal wetland area along the Skardon River South Arm. However parts of this buffer area exist outside of Gulf’s mining lease and within a narrow zone alongside the Skardon River South Arm, on Metro Mining’s mining lease. Publically available information from Metro Mining indicates that this area may contain a haul road to support movement of bauxite within their tenements to a new proposed Port location. There are potential cumulative impacts to surface water quality in this wetland. This area will be subject to ongoing and cooperative monitoring to establish if impacts are occurring and the potential cause of impacts.
Gulf Alumina will seek to cooperate and consult with Metro Mining on all aspects of water management, water monitoring, identification of potential cumulative impacts and measures to mitigate impacts.
12.13 Conclusion
The watercourses and catchments potentially impacted by the Project are the Skardon River and Namaleta Creek. The Skardon River is considered a predominantly estuarine system, consisting of freshwater systems within its upper reaches. The Skardon River catchment is approximately 480 km2, which is relatively small compared to other catchments on Cape York. Namaleta Creek is a localised drainage, tidally influenced in its lower reaches and with a catchment of 37 km2, of which 21 km2 lies upstream of the eastern mine boundary.
The freshwater wetland ecosystems within and surrounding the Project area are Lunette Swamp, Bigfoot Swamp, Namaleta Creek, supratidal wetlands to the west of the Skardon River South Arm and wetland complexes to the west and north of the Project area. Based on data review, a State mapped high ecological significance (HES) wetland between Pits 14 and 15 is unlikely to be associated with wetland habitat.
Skardon River Bauxite Project Chapter 12 – Water Values and Quality
Page 12-79
Environmental values and water quality objectives have been nominated for the Project based on the requirements of the Queensland Water Quality Guidelines. In the absence of sufficient information to set local water quality objectives, default water quality objectives based on the Australian Water Quality Guidelines have been proposed.
Surface water quality and surface water depths have been monitored at locations within and surrounding the Project area. Surface water level in all locations is seasonally variable, with elevated water levels in the period February to March each year, co-incident with the wet season. pH is moderately acidic to neutral, which is a reflection of the geology of the catchment. The majority of EC is very low, with the 80th percentile value of 50 µS/cm. Dissolved metals values are very low across almost all sites, when compared with the AWQG, other than copper. Most samples results are below the detection limit. Nutrient values (TN, TP) are low across all sites.
Groundwater quality and groundwater levels have been monitored at bores within and surrounding the Project area. Groundwater level in all aquifers is seasonally variable, with elevated groundwater levels in the period February to March each year, co-incident with the wet season. pH is slightly acidic in all aquifers, which is a reflection of the geology of the site. EC is low across all aquifers. Dissolved metals values are very low across almost all bores in all aquifers, when compared with the AWQG trigger values, with the exception of dissolved copper and dissolved zinc. Nutrient values (TN, TP) are low across all bores.
The potential impacts to surface water quality are:
uncontrolled release of water with high sediment loads from bauxite mining areas
uncontrolled release of water with high sediment loads from haul roads, including the Namaleta
Creek crossing area
increased sedimentation of waterways during construction and vegetation clearing
uncontrolled release of potentially hydrocarbon and chemical contaminated water from
infrastructure areas.
The potential impacts to groundwater quality are:
localised impacts to groundwater quality hydraulically down-gradient from the landfill, treated
effluent irrigation area and bio-remediation pad through seepage
uncontrolled release of potentially hydrocarbon and chemicals
The Project’s water management strategy is described in Chapter 6 and has been designed to minimise the potential for release of sediment laden water from mining areas and the Port infrastructure area.
Chapter 15 and Chapter 16 described the proposed vegetation buffer zones around wetlands. These buffer zones will act to reduce potential impacts from sediment laden runoff.
Measures to prevent contamination of surface water and groundwater from hydrocarbons, chemicals in infrastructure areas, and from the bio-remediation pad are described Chapter 11. The proposed measures will minimise the risk of release of contaminants to water bodies.
Design and management of the landfill and waste storage areas are described in Chapter 8. The proposed measures will minimise the risk of release of contaminants to water bodies.
Design and mitigation measures for impacts to water quality from construction of the Namaleta Creek crossing and the crossing of the mapped wetland to the south are described in Chapter 16.
An erosion and sediment control plan (ESCP) will be developed for the Project construction and operations, with localised erosion and sediment control structures to be designed within the recommended guidelines of the International Erosion Control Association (IECA) Manual (IECA, 2008).

Skardon River Bauxite Project Chapter 12 – Water Values and Quality
Page 12-80
A comprehensive surface water and groundwater monitoring program has been proposed to assist in determining potential Project impacts and to inform potential mitigation measures. With the implementation of proposed mitigation measures, environmental objectives and performance outcomes are expected to be achieved and the risks to surface water and groundwater quality are low to medium.