Embed Size (px)
Citation preview
Chapter 10.
Promotion Analytics(Estimation and Allocation)
Disclaimer:
• All images such as logos, photos, etc. used in this presentation are the property of their respective copyright owners and are used
here for educational purposes only
• Some material adapted from: Sorger, Stephan. “Marketing Analytics: Strategic Models and Metrics. Admiral Press. 2013.
© Stephan Sorger 2016; www.StephanSorger.com; Ch. 10 Promotion Analytics 1
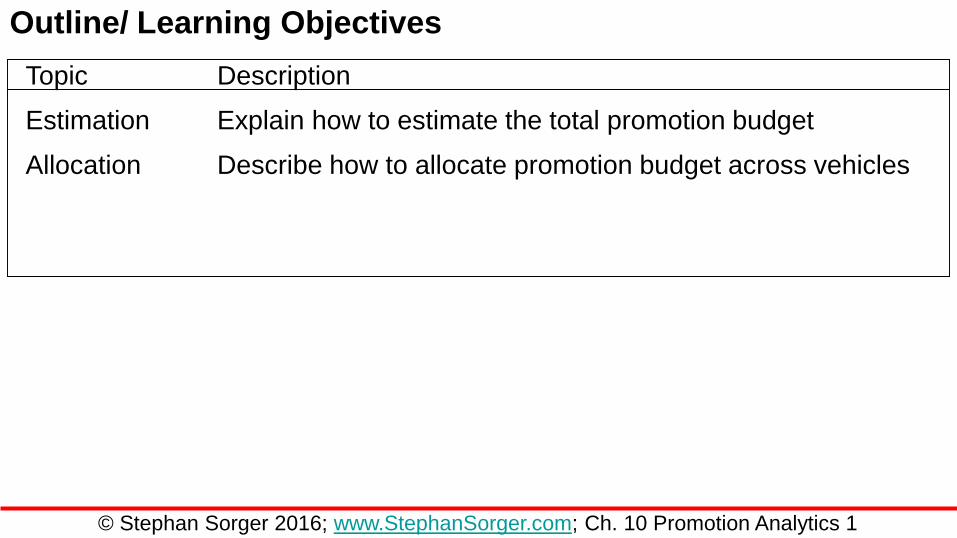
Outline/ Learning Objectives
Topic Description
Estimation Explain how to estimate the total promotion budget
Allocation Describe how to allocate promotion budget across vehicles
© Stephan Sorger 2016; www.StephanSorger.com; Ch. 10 Promotion Analytics 1
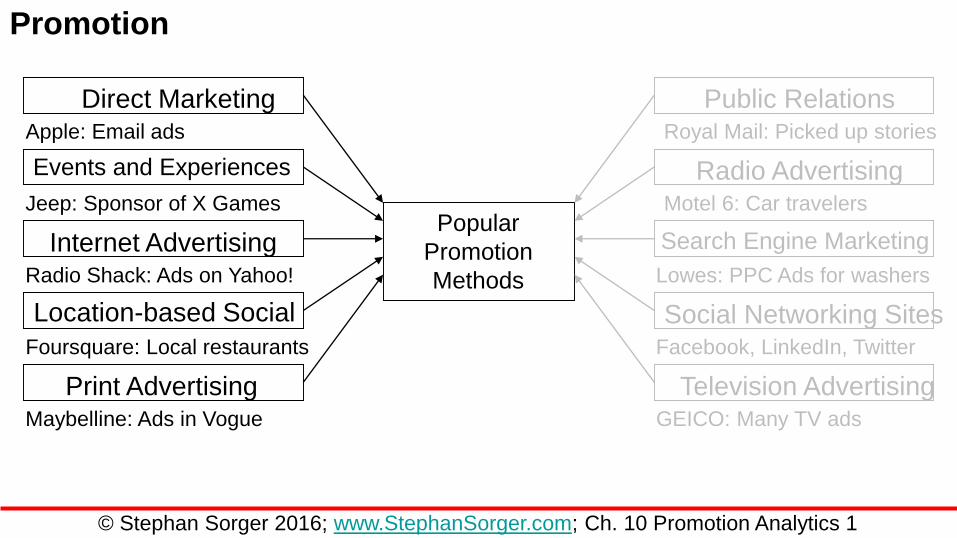
Popular
Promotion
Methods
Public Relations
Radio Advertising
Search Engine Marketing
Social Networking Sites
Television Advertising
Direct Marketing
Events and Experiences
Internet Advertising
Location-based Social
Print Advertising
Promotion
Apple: Email ads
Jeep: Sponsor of X Games
Radio Shack: Ads on Yahoo!
Foursquare: Local restaurants
Maybelline: Ads in Vogue
Royal Mail: Picked up stories
Motel 6: Car travelers
Lowes: PPC Ads for washers
Facebook, LinkedIn, Twitter
GEICO: Many TV ads
© Stephan Sorger 2016; www.StephanSorger.com; Ch. 10 Promotion Analytics 1
Promotion
Popular
Promotion
Methods
Public Relations
Radio Advertising
Search Engine Marketing
Social Networking Sites
Television Advertising
Direct Marketing
Events and Experiences
Internet Advertising
Location-based Social
Print Advertising
Apple: Email ads
Jeep: Sponsor of X Games
Radio Shack: Ads on Yahoo!
Foursquare: Local restaurants
Maybelline: Ads in Vogue
Royal Mail: Picked up stories
Motel 6: Car travelers
Lowes: PPC Ads for washers
Facebook, LinkedIn, Twitter
GEICO: Many TV ads
© Stephan Sorger 2016; www.StephanSorger.com; Ch. 10 Promotion Analytics 1
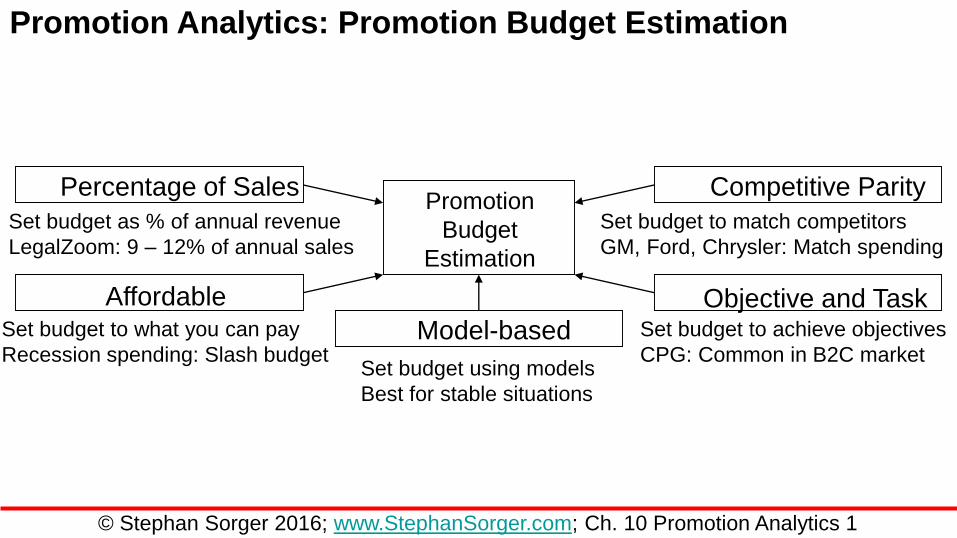
Promotion Analytics: Promotion Budget Estimation
Promotion
Budget
Estimation
Competitive Parity
Objective and Task
Model-based
Percentage of Sales
Affordable
Set budget as % of annual revenue
LegalZoom: 9 – 12% of annual sales
Set budget to what you can pay
Recession spending: Slash budget
Set budget to match competitors
GM, Ford, Chrysler: Match spending
Set budget to achieve objectives
CPG: Common in B2C marketSet budget using models
Best for stable situations
© Stephan Sorger 2016; www.StephanSorger.com; Ch. 10 Promotion Analytics 1
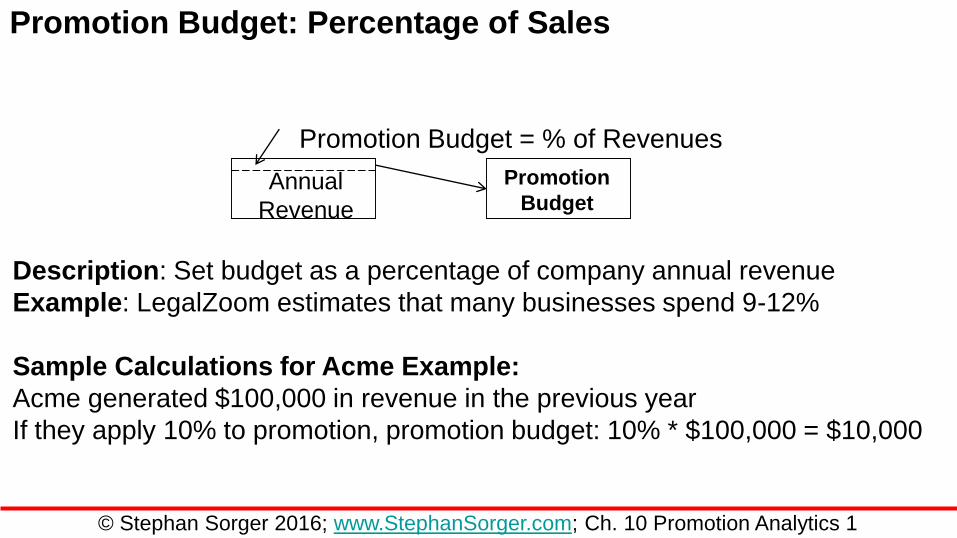
Promotion Budget: Percentage of Sales
Promotion
Budget
Promotion Budget = % of Revenues
Annual
Revenue
Description: Set budget as a percentage of company annual revenue
Example: LegalZoom estimates that many businesses spend 9-12%
Sample Calculations for Acme Example:
Acme generated $100,000 in revenue in the previous year
If they apply 10% to promotion, promotion budget: 10% * $100,000 = $10,000
© Stephan Sorger 2016; www.StephanSorger.com; Ch. 10 Promotion Analytics 1
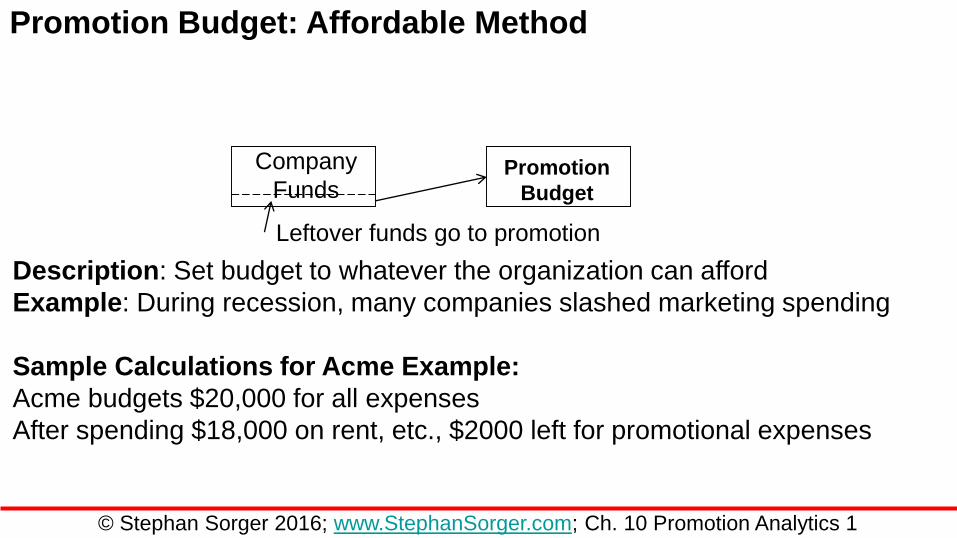
Promotion Budget: Affordable Method
Promotion
Budget
Leftover funds go to promotion
Company
Funds
Description: Set budget to whatever the organization can afford
Example: During recession, many companies slashed marketing spending
Sample Calculations for Acme Example:
Acme budgets $20,000 for all expenses
After spending $18,000 on rent, etc., $2000 left for promotional expenses
© Stephan Sorger 2016; www.StephanSorger.com; Ch. 10 Promotion Analytics 1
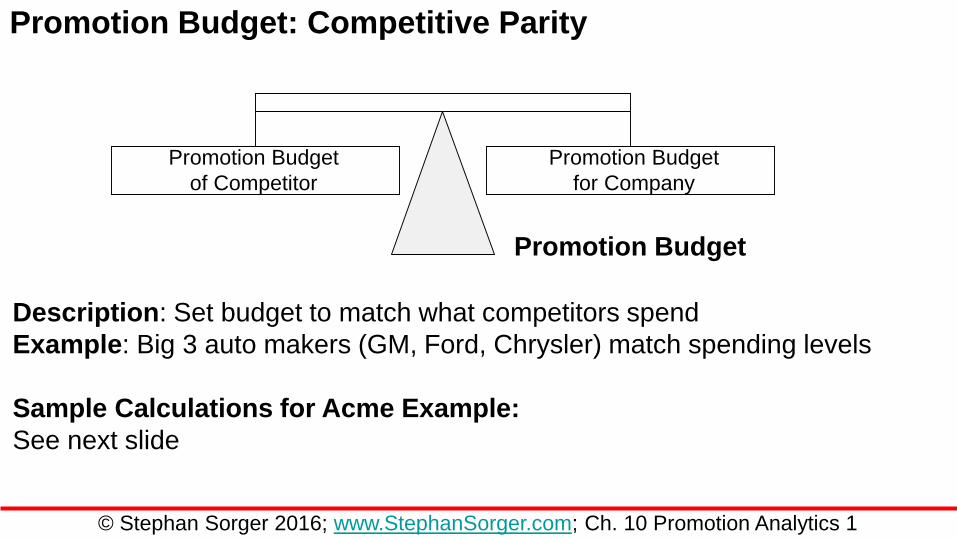
Promotion Budget: Competitive Parity
Promotion Budget
Promotion Budget
for Company
Promotion Budget
of Competitor
Description: Set budget to match what competitors spend
Example: Big 3 auto makers (GM, Ford, Chrysler) match spending levels
Sample Calculations for Acme Example:
See next slide
© Stephan Sorger 2016; www.StephanSorger.com; Ch. 10 Promotion Analytics 1
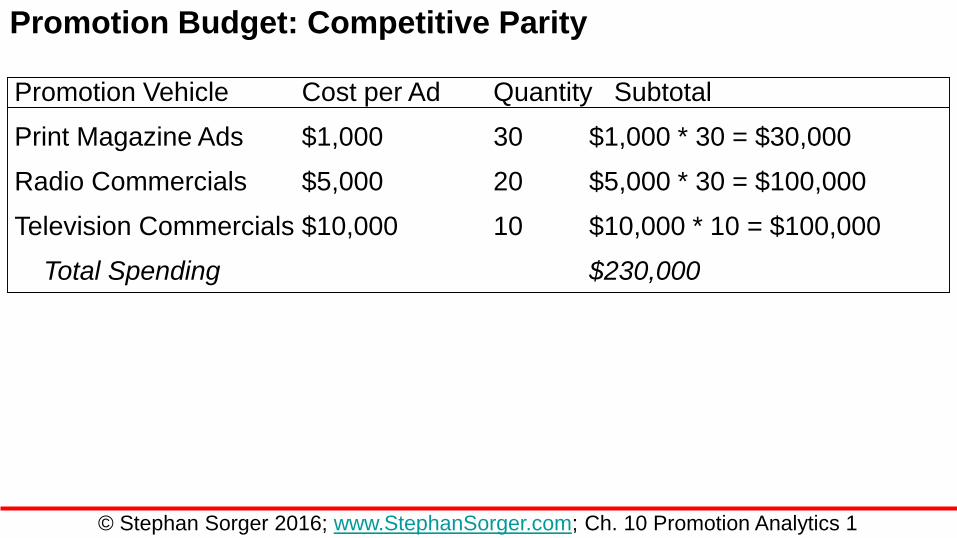
Promotion Budget: Competitive Parity
Promotion Vehicle Cost per Ad Quantity Subtotal
Print Magazine Ads $1,000 30 $1,000 * 30 = $30,000
Radio Commercials $5,000 20 $5,000 * 30 = $100,000
Television Commercials $10,000 10 $10,000 * 10 = $100,000
Total Spending $230,000
© Stephan Sorger 2016; www.StephanSorger.com; Ch. 10 Promotion Analytics 1
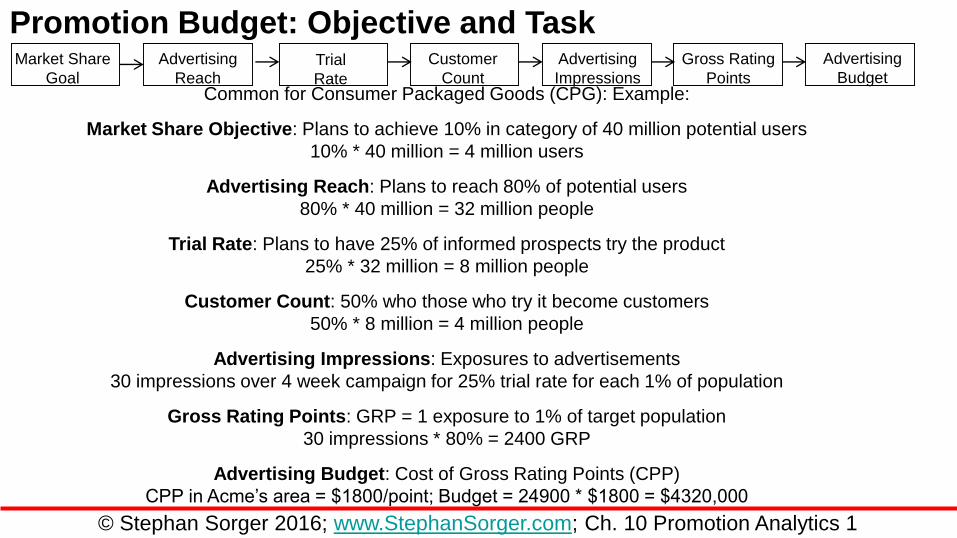
Promotion Budget: Objective and TaskMarket Share
Goal
Advertising
ReachTrial
Rate
Customer
Count
Advertising
Impressions
Gross Rating
Points
Advertising
Budget
© Stephan Sorger 2016; www.StephanSorger.com; Ch. 10 Promotion Analytics 1
Common for Consumer Packaged Goods (CPG): Example:
Market Share Objective: Plans to achieve 10% in category of 40 million potential users
10% * 40 million = 4 million users
Advertising Reach: Plans to reach 80% of potential users
80% * 40 million = 32 million people
Trial Rate: Plans to have 25% of informed prospects try the product
25% * 32 million = 8 million people
Customer Count: 50% who those who try it become customers
50% * 8 million = 4 million people
Advertising Impressions: Exposures to advertisements
30 impressions over 4 week campaign for 25% trial rate for each 1% of population
Gross Rating Points: GRP = 1 exposure to 1% of target population
30 impressions * 80% = 2400 GRP
Advertising Budget: Cost of Gross Rating Points (CPP)
CPP in Acme’s area = $1800/point; Budget = 24900 * $1800 = $4320,000
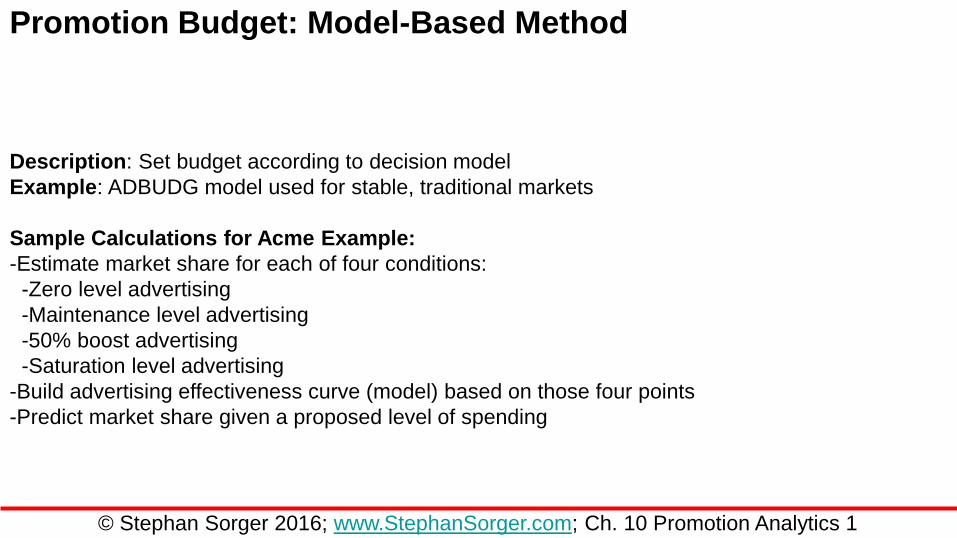
Promotion Budget: Model-Based Method
Description: Set budget according to decision model
Example: ADBUDG model used for stable, traditional markets
Sample Calculations for Acme Example:
-Estimate market share for each of four conditions:
-Zero level advertising
-Maintenance level advertising
-50% boost advertising
-Saturation level advertising
-Build advertising effectiveness curve (model) based on those four points
-Predict market share given a proposed level of spending
© Stephan Sorger 2016; www.StephanSorger.com; Ch. 10 Promotion Analytics 1
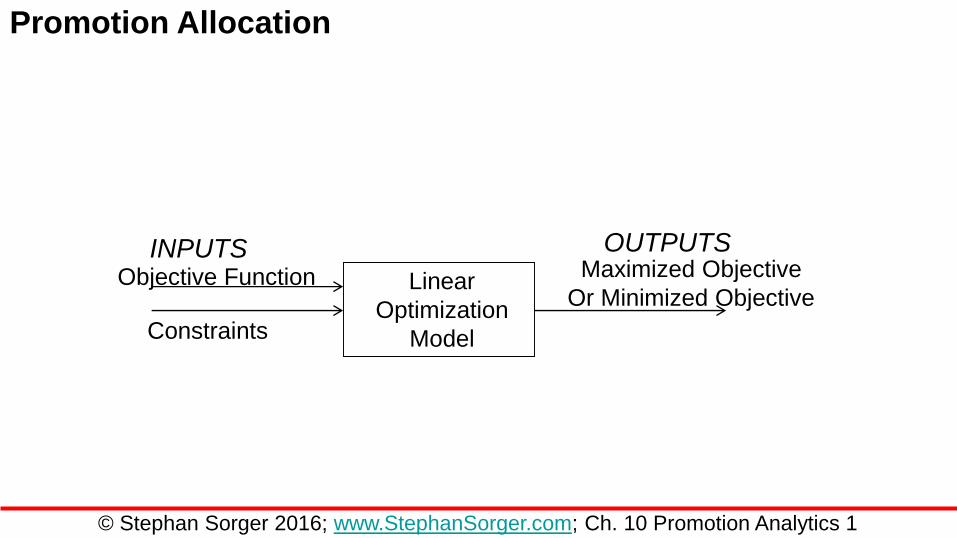
Promotion Allocation
Linear
Optimization
Model
INPUTS OUTPUTS
Objective Function
Constraints
Maximized Objective
Or Minimized Objective
© Stephan Sorger 2016; www.StephanSorger.com; Ch. 10 Promotion Analytics 1
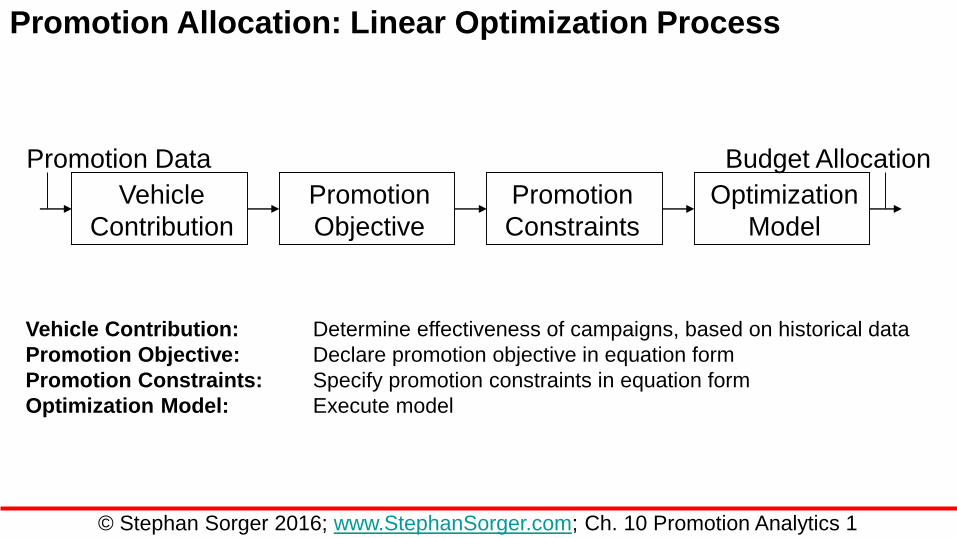
Promotion Allocation: Linear Optimization Process
Vehicle Contribution: Determine effectiveness of campaigns, based on historical data
Promotion Objective: Declare promotion objective in equation form
Promotion Constraints: Specify promotion constraints in equation form
Optimization Model: Execute model
Vehicle
Contribution
Promotion
Objective
Optimization
Model
Promotion
Constraints
Promotion Data Budget Allocation
© Stephan Sorger 2016; www.StephanSorger.com; Ch. 10 Promotion Analytics 1
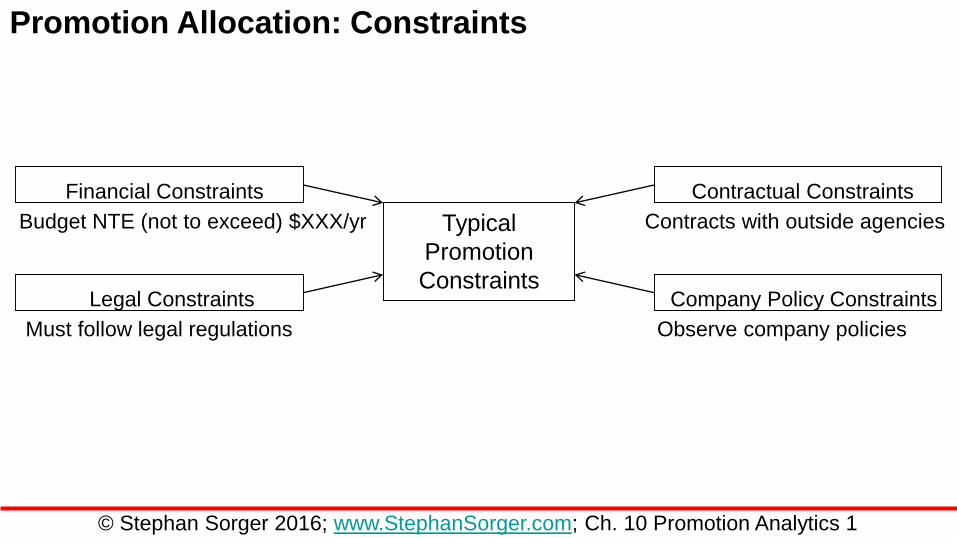
Promotion Allocation: Constraints
Contractual Constraints
Company Policy Constraints
Financial Constraints
Legal Constraints
Typical
Promotion
Constraints
Budget NTE (not to exceed) $XXX/yr
Must follow legal regulations
Contracts with outside agencies
Observe company policies
© Stephan Sorger 2016; www.StephanSorger.com; Ch. 10 Promotion Analytics 1
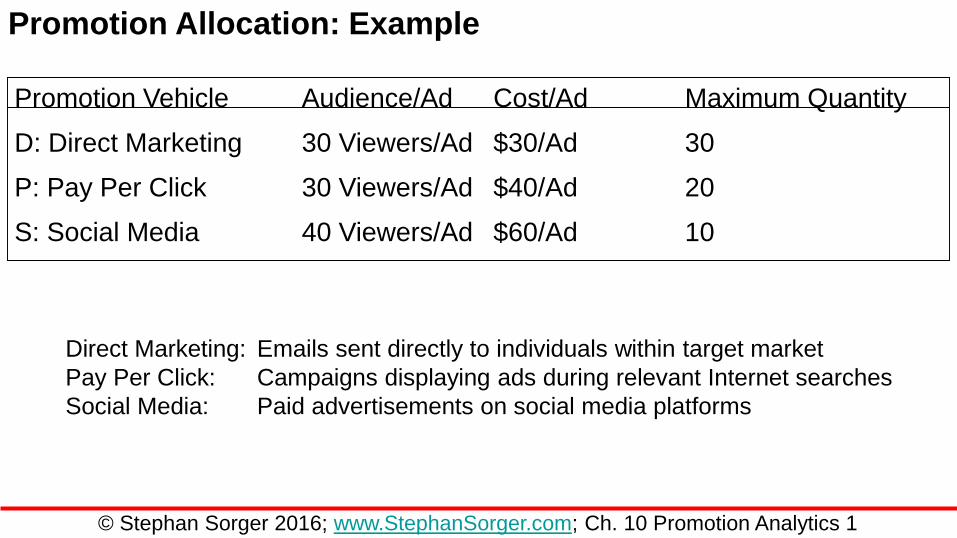
Promotion Allocation: Example
Direct Marketing: Emails sent directly to individuals within target market
Pay Per Click: Campaigns displaying ads during relevant Internet searches
Social Media: Paid advertisements on social media platforms
Promotion Vehicle Audience/Ad Cost/Ad Maximum Quantity
D: Direct Marketing 30 Viewers/Ad $30/Ad 30
P: Pay Per Click 30 Viewers/Ad $40/Ad 20
S: Social Media 40 Viewers/Ad $60/Ad 10
© Stephan Sorger 2016; www.StephanSorger.com; Ch. 10 Promotion Analytics 1
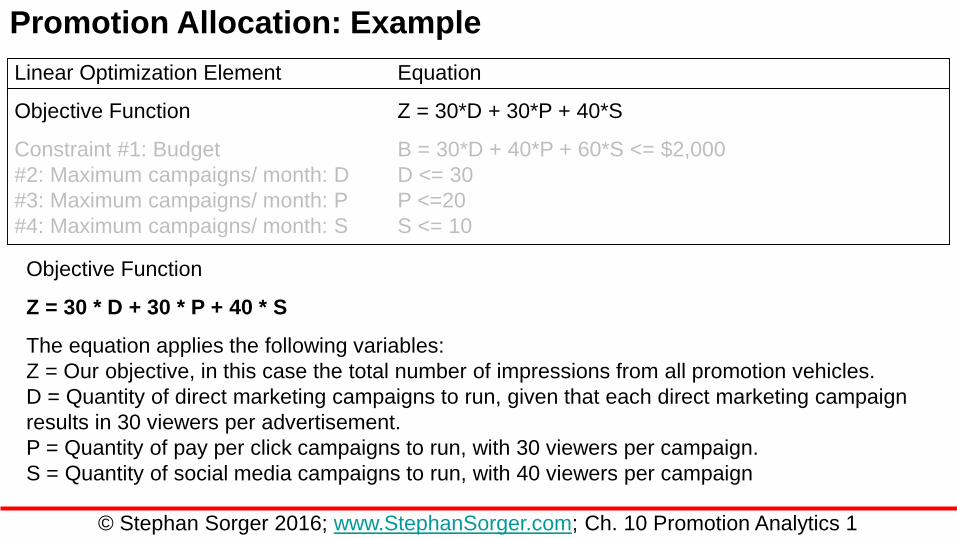
Promotion Allocation: Example
Objective Function
Z = 30 * D + 30 * P + 40 * S
The equation applies the following variables:
Z = Our objective, in this case the total number of impressions from all promotion vehicles.
D = Quantity of direct marketing campaigns to run, given that each direct marketing campaign
results in 30 viewers per advertisement.
P = Quantity of pay per click campaigns to run, with 30 viewers per campaign.
S = Quantity of social media campaigns to run, with 40 viewers per campaign
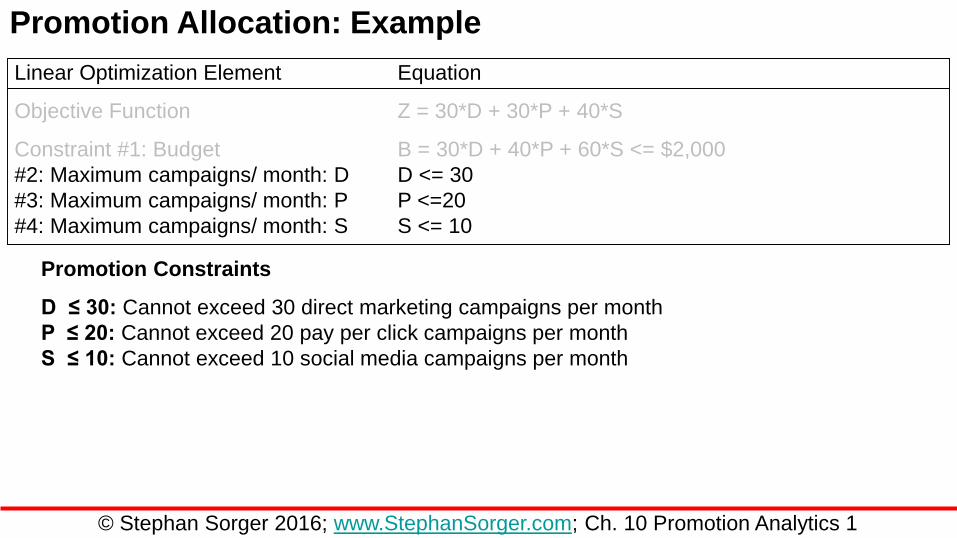
Linear Optimization Element Equation
Objective Function Z = 30*D + 30*P + 40*S
Constraint #1: Budget B = 30*D + 40*P + 60*S <= $2,000
#2: Maximum campaigns/ month: D D <= 30
#3: Maximum campaigns/ month: P P <=20
#4: Maximum campaigns/ month: S S <= 10
© Stephan Sorger 2016; www.StephanSorger.com; Ch. 10 Promotion Analytics 1
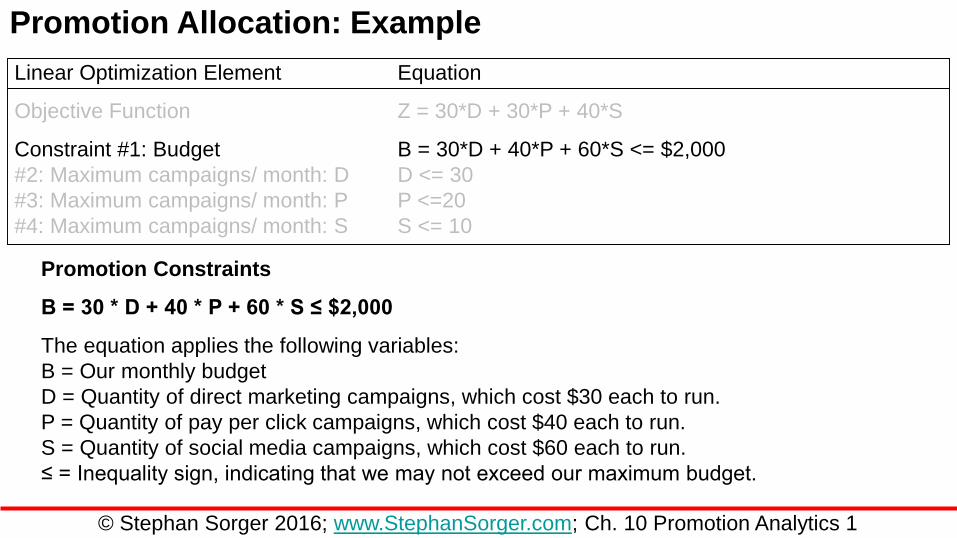
Promotion Allocation: Example
Promotion Constraints
B = 30 * D + 40 * P + 60 * S ≤ $2,000
The equation applies the following variables:
B = Our monthly budget
D = Quantity of direct marketing campaigns, which cost $30 each to run.
P = Quantity of pay per click campaigns, which cost $40 each to run.
S = Quantity of social media campaigns, which cost $60 each to run.
≤ = Inequality sign, indicating that we may not exceed our maximum budget.
Linear Optimization Element Equation
Objective Function Z = 30*D + 30*P + 40*S
Constraint #1: Budget B = 30*D + 40*P + 60*S <= $2,000
#2: Maximum campaigns/ month: D D <= 30
#3: Maximum campaigns/ month: P P <=20
#4: Maximum campaigns/ month: S S <= 10
© Stephan Sorger 2016; www.StephanSorger.com; Ch. 10 Promotion Analytics 1
Promotion Allocation: Example
Promotion Constraints
D ≤ 30: Cannot exceed 30 direct marketing campaigns per month
P ≤ 20: Cannot exceed 20 pay per click campaigns per month
S ≤ 10: Cannot exceed 10 social media campaigns per month
Linear Optimization Element Equation
Objective Function Z = 30*D + 30*P + 40*S
Constraint #1: Budget B = 30*D + 40*P + 60*S <= $2,000
#2: Maximum campaigns/ month: D D <= 30
#3: Maximum campaigns/ month: P P <=20
#4: Maximum campaigns/ month: S S <= 10
© Stephan Sorger 2016; www.StephanSorger.com; Ch. 10 Promotion Analytics 1
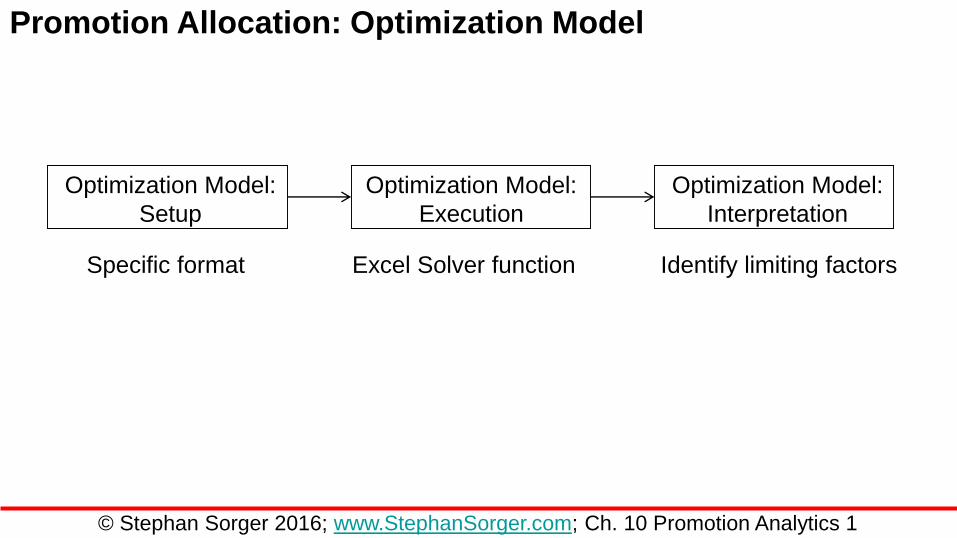
Promotion Allocation: Optimization Model
Optimization Model:
Setup
Optimization Model:
Execution
Optimization Model:
Interpretation
Excel Solver functionSpecific format Identify limiting factors
© Stephan Sorger 2016; www.StephanSorger.com; Ch. 10 Promotion Analytics 1
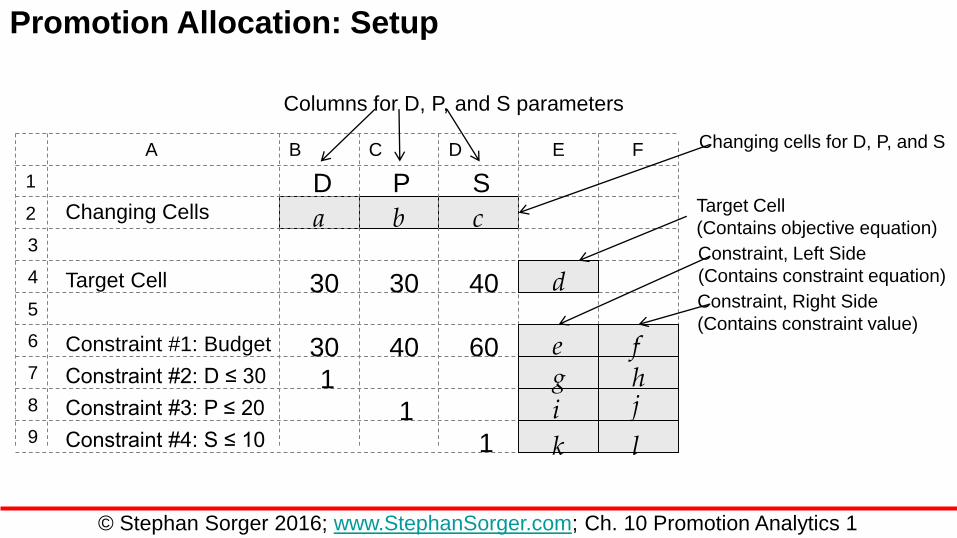
Promotion Allocation: Setup
Changing Cells
Target Cell 30 30 40
Constraint #1: Budget 30 40 60Constraint #2: D ≤ 30 1Constraint #3: P ≤ 20
Constraint #4: S ≤ 10 1
1
D P S
Columns for D, P, and S parameters
Changing cells for D, P, and S
Target Cell
(Contains objective equation)
Constraint, Left Side
(Contains constraint equation)
Constraint, Right Side
(Contains constraint value)
a b c
d
e fg hi j
k l
A B C D E F
1
2
3
4
5
6
7
8
9
© Stephan Sorger 2016; www.StephanSorger.com; Ch. 10 Promotion Analytics 1
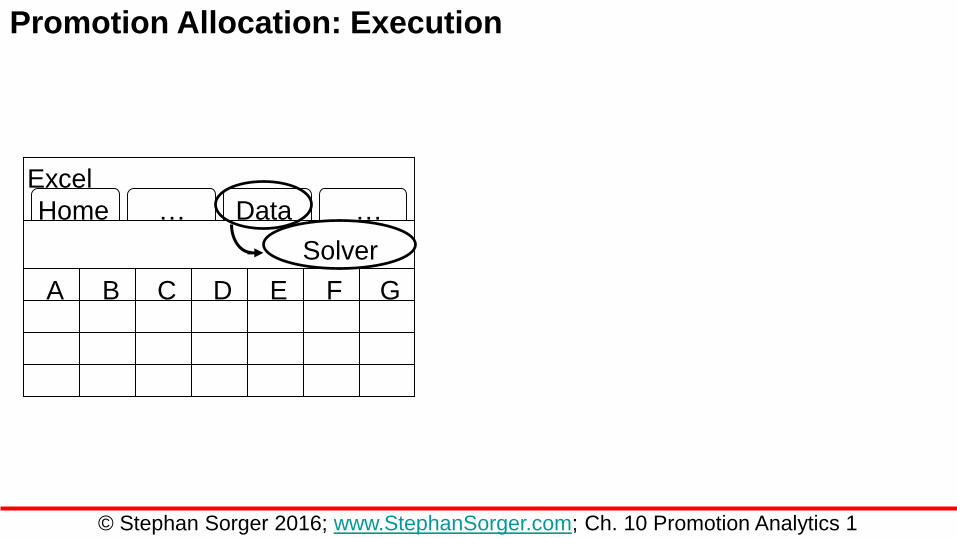
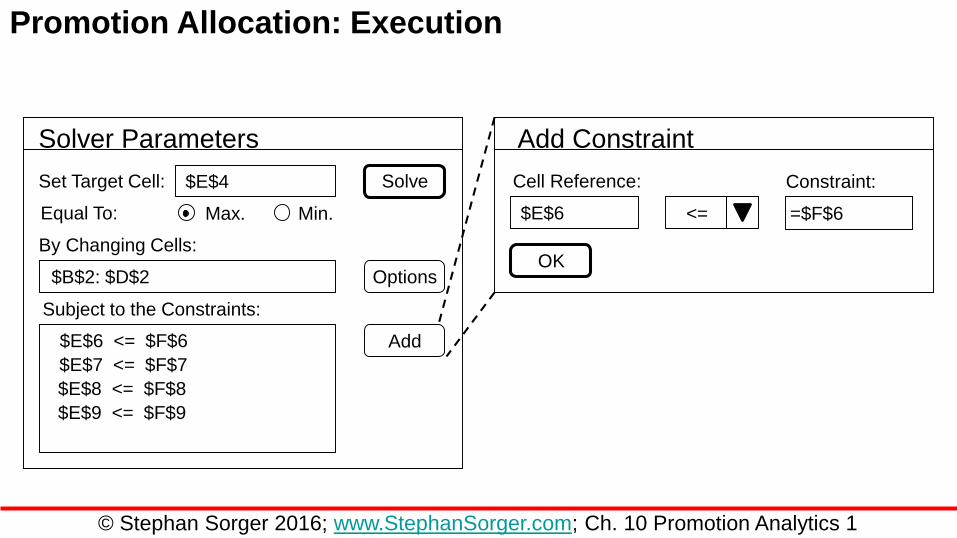
Promotion Allocation: Execution
Excel
Home Data ……
Solver
A B C D E F G
© Stephan Sorger 2016; www.StephanSorger.com; Ch. 10 Promotion Analytics 1
Promotion Allocation: Execution
Solver Parameters
Set Target Cell: Solve
Options
Equal To: Max. Min.
$E$4
By Changing Cells:
Subject to the Constraints:
$B$2: $D$2
$E$6 <= $F$6
$E$7 <= $F$7
$E$8 <= $F$8
$E$9 <= $F$9
Add
Add Constraint
Cell Reference:
OK
$E$6 <=
Constraint:
=$F$6
© Stephan Sorger 2016; www.StephanSorger.com; Ch. 10 Promotion Analytics 1
Promotion Allocation: Execution
Changing Cells
Target Cell 30 30 40
Constraint #1: Budget 30 40 60Constraint #2: D ≤ 30 1Constraint #3: P ≤ 20
Constraint #4: S ≤ 10 1
1
D P S
Columns for D, P, and S parameters
Changing cells for D, P, and S
Target Cell
(Contains objective equation)
Constraint, Left Side
(Contains constraint equation)
Constraint, Right Side
(Contains constraint value)
30 20 5
1700200 20030 3020 205 10
A B C D E F
1
2
3
4
5
6
7
8
9
© Stephan Sorger 2016; www.StephanSorger.com; Ch. 10 Promotion Analytics 1
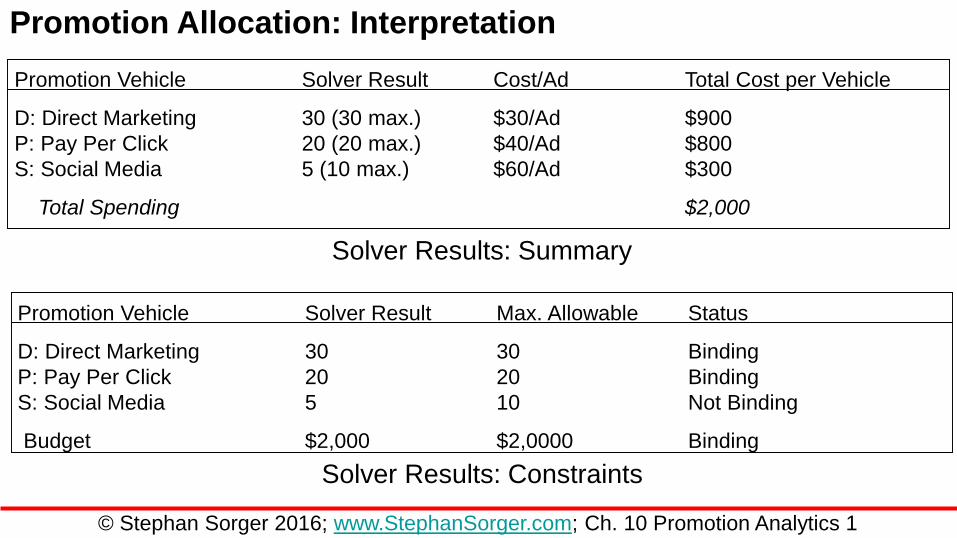
Promotion Allocation: Interpretation
Solver Results: Constraints
Solver Results: Summary
Promotion Vehicle Solver Result Cost/Ad Total Cost per Vehicle
D: Direct Marketing 30 (30 max.) $30/Ad $900
P: Pay Per Click 20 (20 max.) $40/Ad $800
S: Social Media 5 (10 max.) $60/Ad $300
Total Spending $2,000
Promotion Vehicle Solver Result Max. Allowable Status
D: Direct Marketing 30 30 Binding
P: Pay Per Click 20 20 Binding
S: Social Media 5 10 Not Binding
Budget $2,000 $2,0000 Binding
© Stephan Sorger 2016; www.StephanSorger.com; Ch. 10 Promotion Analytics 1
Check for Understanding
Topic Description
Estimation Explain how to estimate the total promotion budget
Allocation Describe how to allocate promotion budget across vehicles
© Stephan Sorger 2016; www.StephanSorger.com; Ch. 10 Promotion Analytics 1