Embed Size (px)
Citation preview
Chapter 10: Mantle Melting and the Generation
of Basaltic Magma
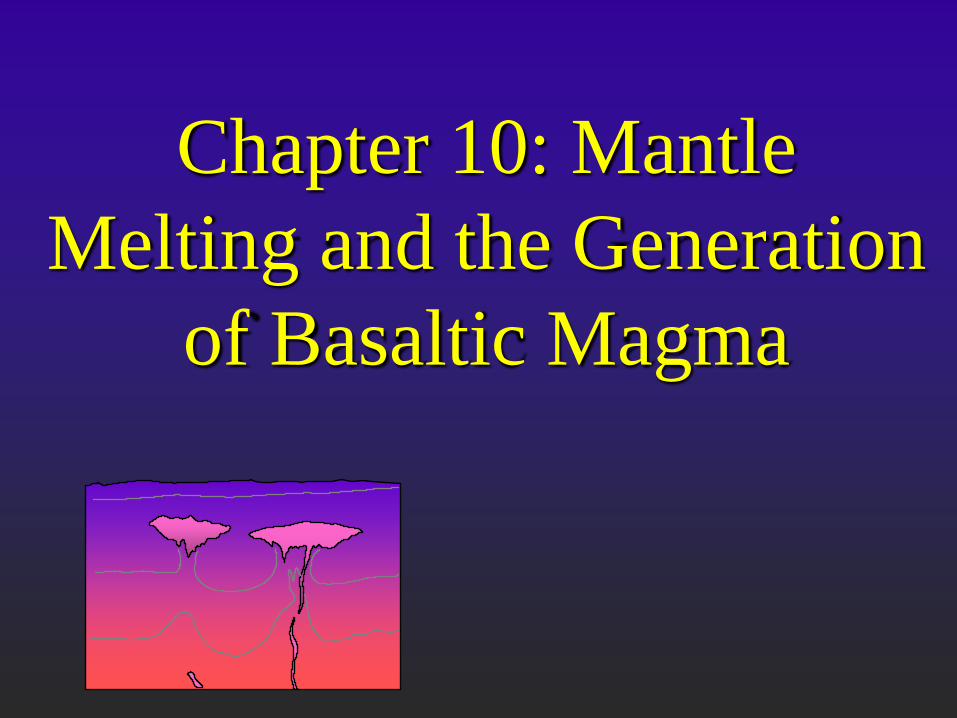
2 principal types of basalt in the ocean basins
Table 10.1 Common petrographic differences between tholeiitic and alkaline basalts
Tholeiitic Basalt Alkaline BasaltUsually fine-grained, intergranular Usually fairly coarse, intergranular to ophitic
Groundmass No olivine Olivine common
Clinopyroxene = augite (plus possibly pigeonite) Titaniferous augite (reddish)
Orthopyroxene (hypersthene) common, may rim ol. Orthopyroxene absent
No alkali feldspar Interstitial alkali feldspar or feldspathoid may occur
Interstitial glass and/or quartz common Interstitial glass rare, and quartz absent
Olivine rare, unzoned, and may be partially resorbed Olivine common and zoned
Phenocrysts or show reaction rims of orthopyroxene
Orthopyroxene uncommon Orthopyroxene absent
Early plagioclase common Plagioclase less common, and later in sequence
Clinopyroxene is pale brown augite Clinopyroxene is titaniferous augite, reddish rims
after Hughes (1982) and McBirney (1993).
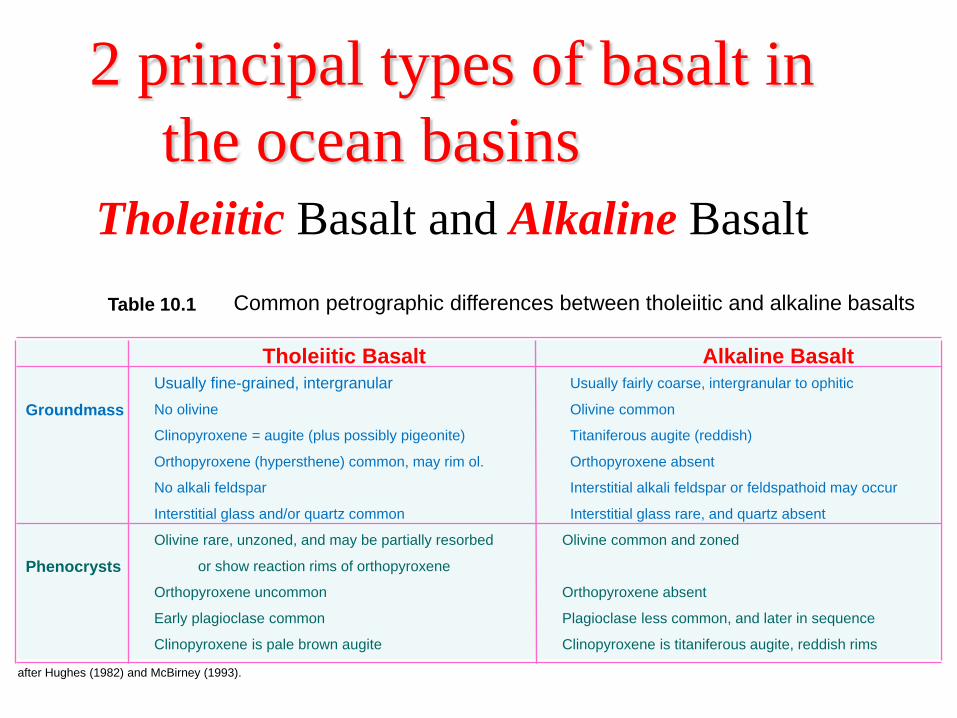
Tholeiitic Basalt and Alkaline Basalt
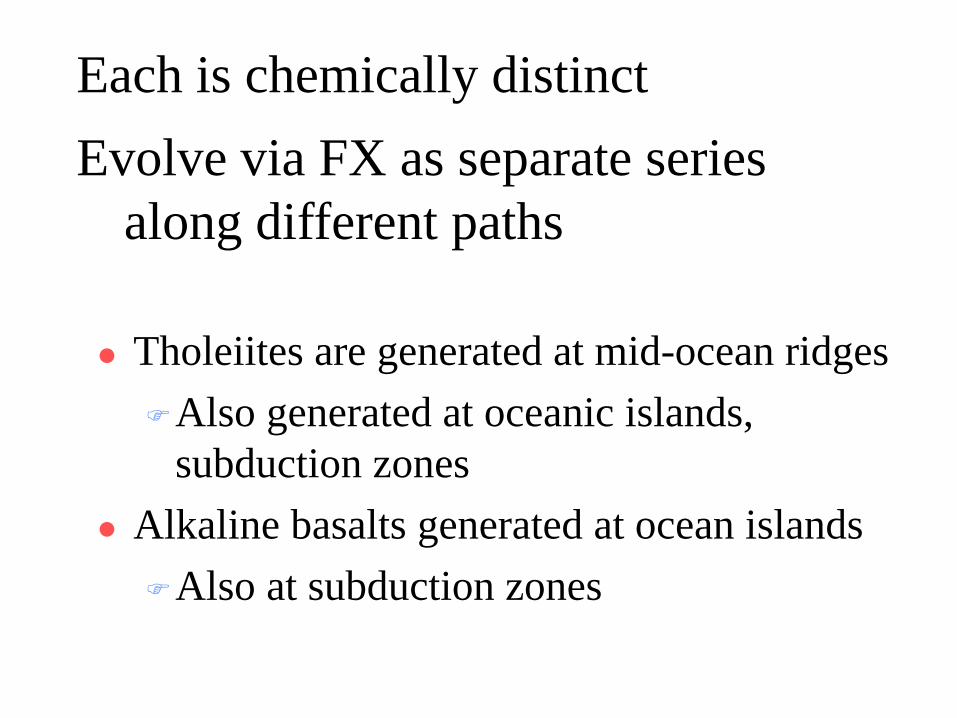
Tholeiites are generated at mid-ocean ridgesAlso generated at oceanic islands,
subduction zones Alkaline basalts generated at ocean islandsAlso at subduction zones
Each is chemically distinctEvolve via FX as separate series
along different paths
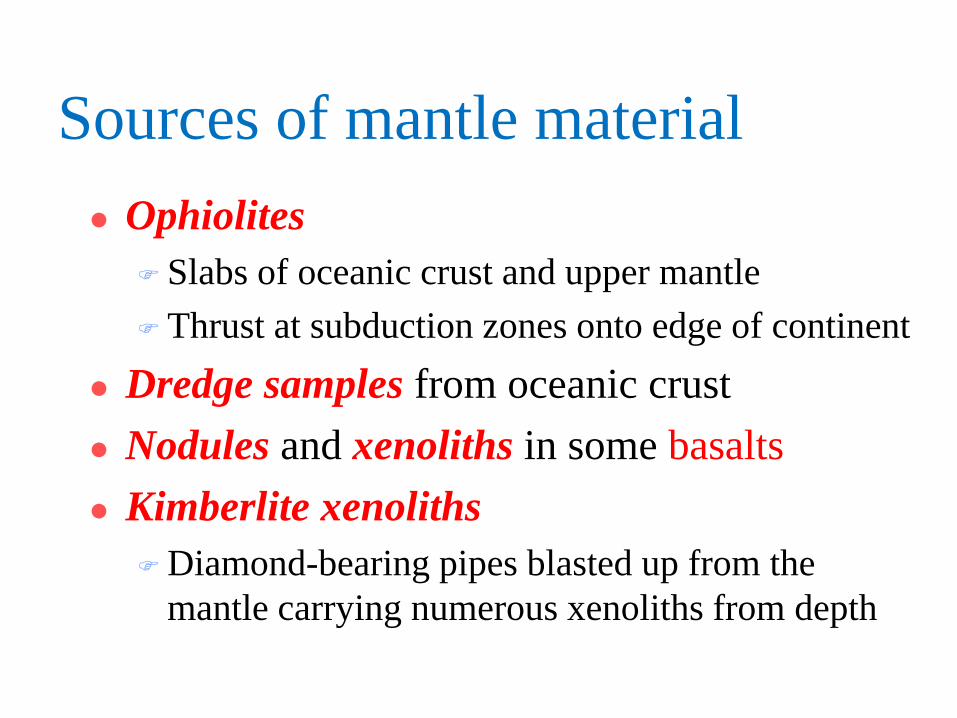
Sources of mantle material Ophiolites
Slabs of oceanic crust and upper mantle Thrust at subduction zones onto edge of continent
Dredge samples from oceanic crust Nodules and xenoliths in some basalts Kimberlite xenoliths
Diamond-bearing pipes blasted up from the mantle carrying numerous xenoliths from depth
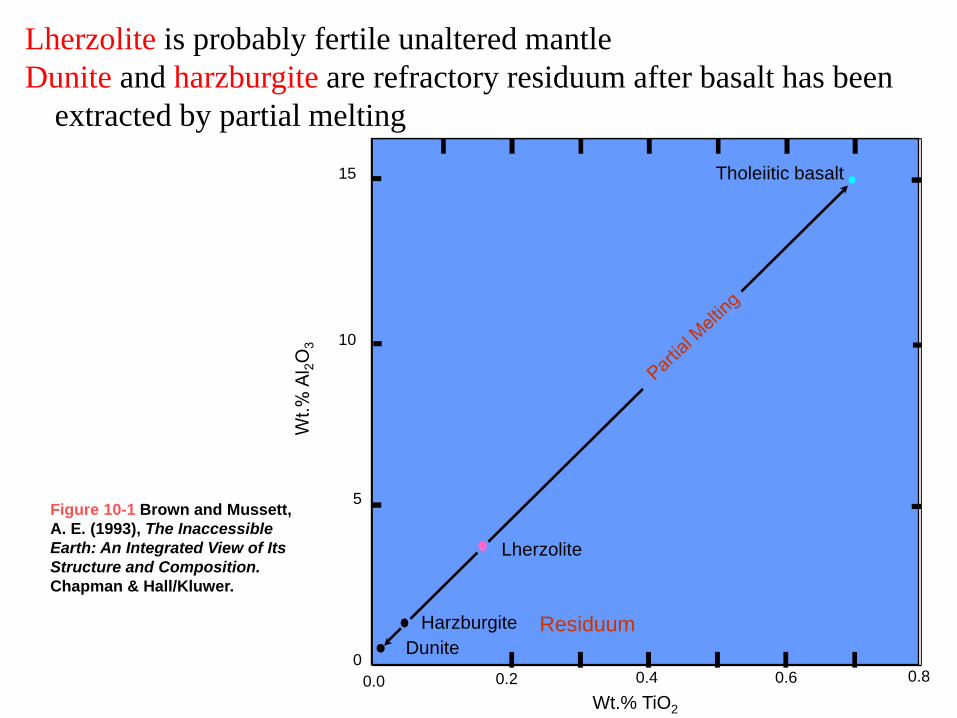
15
10
5
00.0 0.2 0.4 0.6 0.8
Wt.% TiO2
DuniteHarzburgite
Lherzolite
Tholeiitic basalt
Residuum
Lherzolite is probably fertile unaltered mantleDunite and harzburgite are refractory residuum after basalt has been
extracted by partial melting
Figure 10-1 Brown and Mussett, A. E. (1993), The Inaccessible Earth: An Integrated View of Its Structure and Composition. Chapman & Hall/Kluwer.
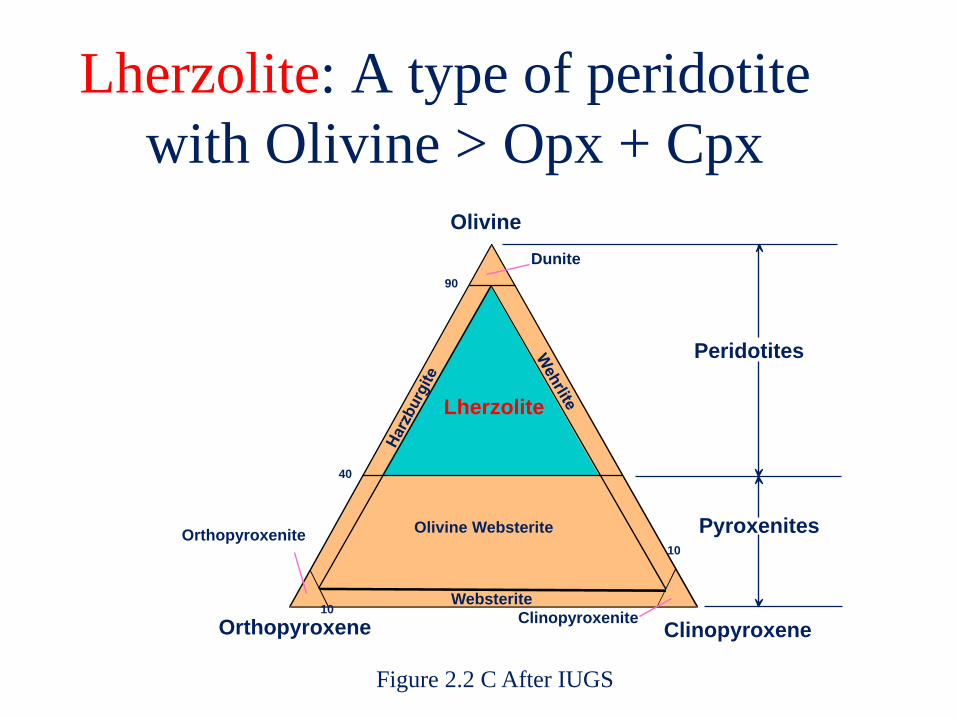
Lherzolite: A type of peridotite with Olivine > Opx + Cpx
Olivine
ClinopyroxeneOrthopyroxene
Lherzolite
Websterite
Orthopyroxenite
Clinopyroxenite
Olivine Websterite
Peridotites
Pyroxenites
90
40
10
10
Dunite
Figure 2.2 C After IUGS
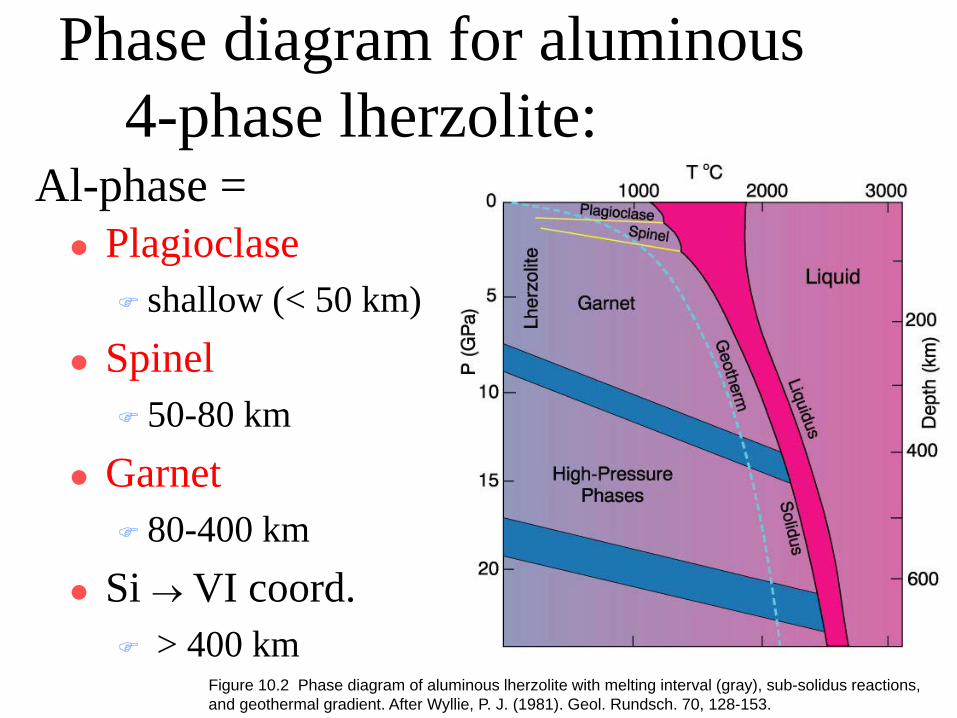
Phase diagram for aluminous 4-phase lherzolite:
Plagioclase shallow (< 50 km)
Spinel 50-80 km
Garnet 80-400 km
Si → VI coord. > 400 km
Al-phase =
Figure 10.2 Phase diagram of aluminous lherzolite with melting interval (gray), sub-solidus reactions, and geothermal gradient. After Wyllie, P. J. (1981). Geol. Rundsch. 70, 128-153.
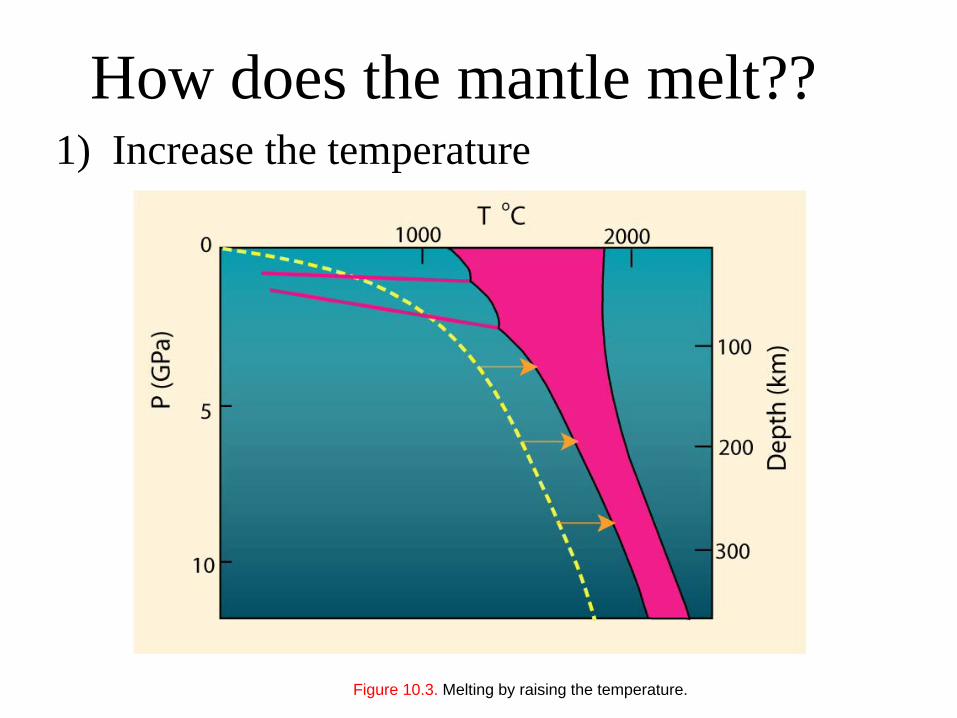
How does the mantle melt??1) Increase the temperature
Figure 10.3. Melting by raising the temperature.
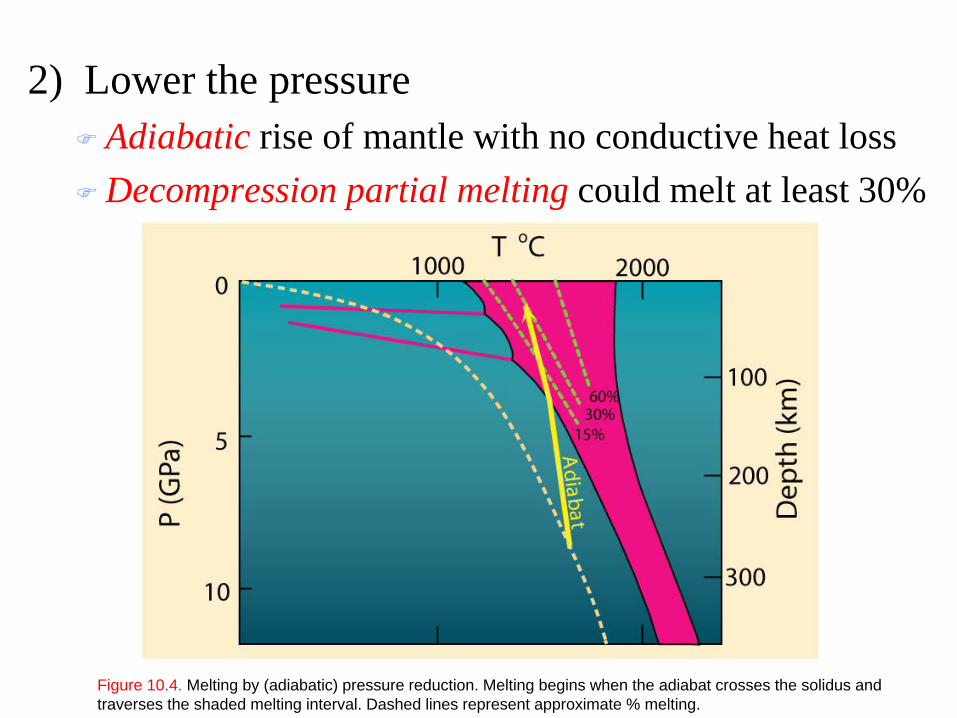
2) Lower the pressure Adiabatic rise of mantle with no conductive heat lossDecompression partial melting could melt at least 30%
Figure 10.4. Melting by (adiabatic) pressure reduction. Melting begins when the adiabat crosses the solidus and traverses the shaded melting interval. Dashed lines represent approximate % melting.
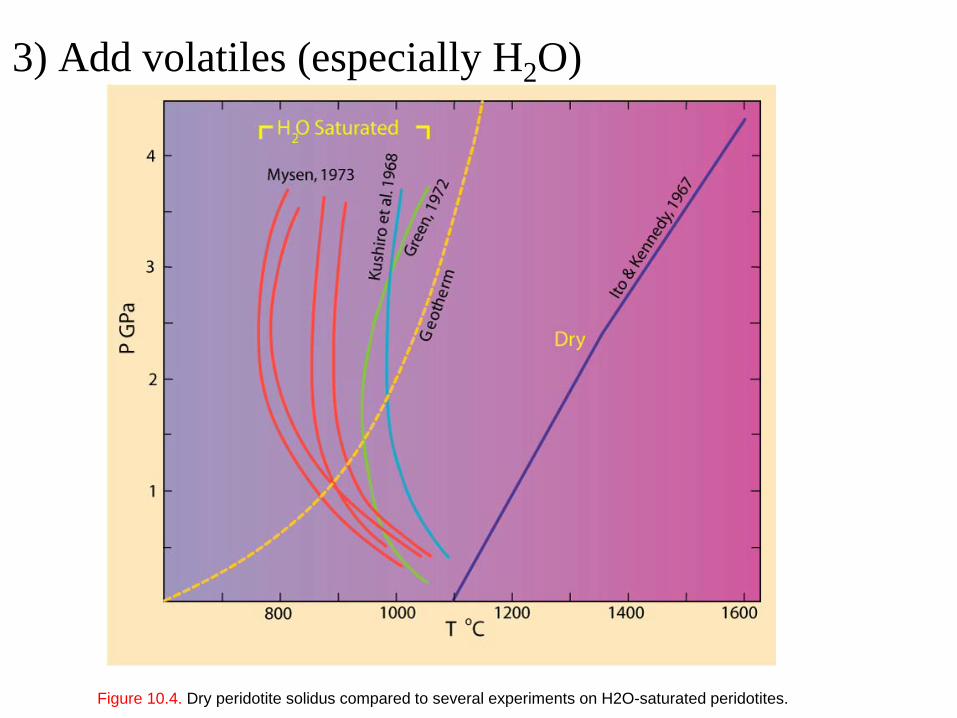
3) Add volatiles (especially H2O)
Figure 10.4. Dry peridotite solidus compared to several experiments on H2O-saturated peridotites.

Fraction melted is limited by the availability of water
15% 20% 50% 100%
Figure 7.22. Pressure-temperature projection of the melting relationships in the system albite-H2O. From Burnham and Davis (1974). A J Sci., 274, 902-940.

Heating of amphibole-bearing peridotite1) Ocean geotherm 2) Shield geotherm
Figure 10.6 Phase diagram (partly schematic) for a hydrous mantle system, including the H2O-saturated lherzolite solidus of Kushiro et al. (1968), the dehydration breakdown curves for amphibole (Millhollen et al., 1974) and phlogopite (Modreski and Boettcher, 1973), plus the ocean and shield geotherms of Clark and Ringwood (1964) and Ringwood (1966). After Wyllie (1979). In H. S. Yoder (ed.), The Evolution of the Igneous Rocks. Fiftieth Anniversary Perspectives. Princeton University Press, Princeton, N. J, pp. 483-520.
Melts can be created under realistic circumstances
Plates separate and mantle rises at mid-ocean ridgesAdibatic rise → decompression melting
Hot spots → localized plumes of melt Fluid fluxing may give LVLAlso important in subduction zones and
other settings
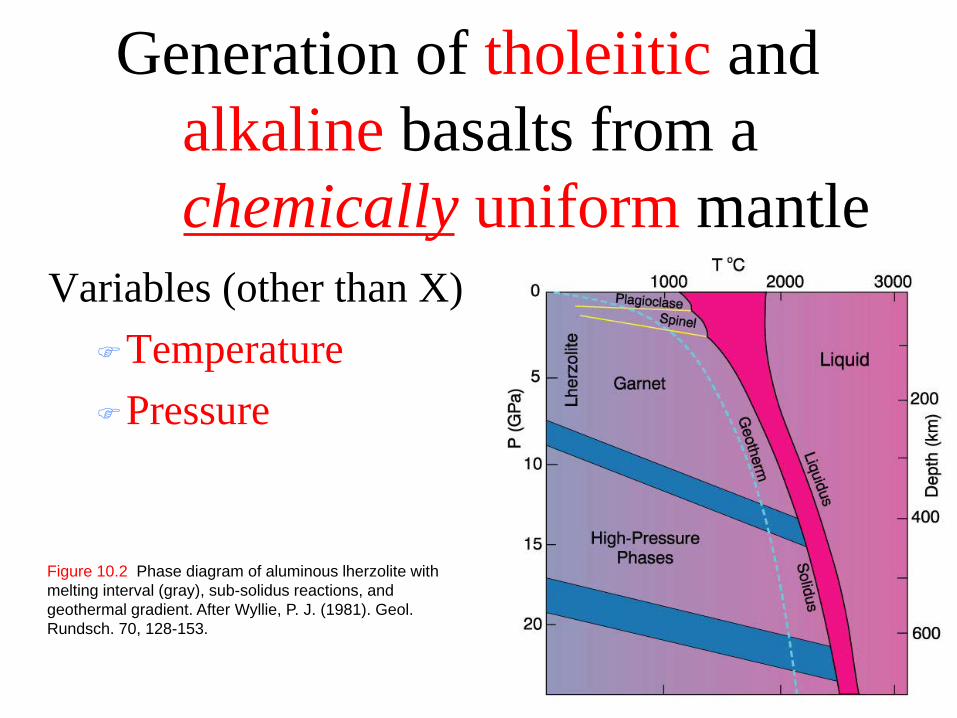
Generation of tholeiitic and alkaline basalts from a chemically uniform mantle
Variables (other than X)TemperaturePressure
Figure 10.2 Phase diagram of aluminous lherzolite with melting interval (gray), sub-solidus reactions, and geothermal gradient. After Wyllie, P. J. (1981). Geol. Rundsch. 70, 128-153.
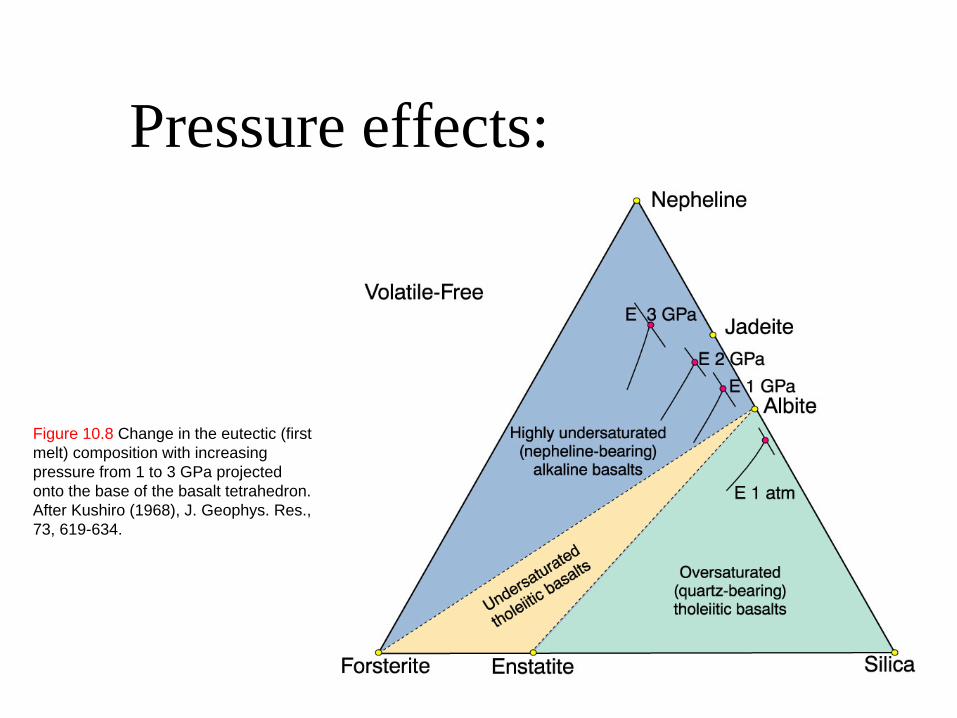
Pressure effects:
Figure 10.8 Change in the eutectic (first melt) composition with increasing pressure from 1 to 3 GPa projected onto the base of the basalt tetrahedron. After Kushiro (1968), J. Geophys. Res., 73, 619-634.
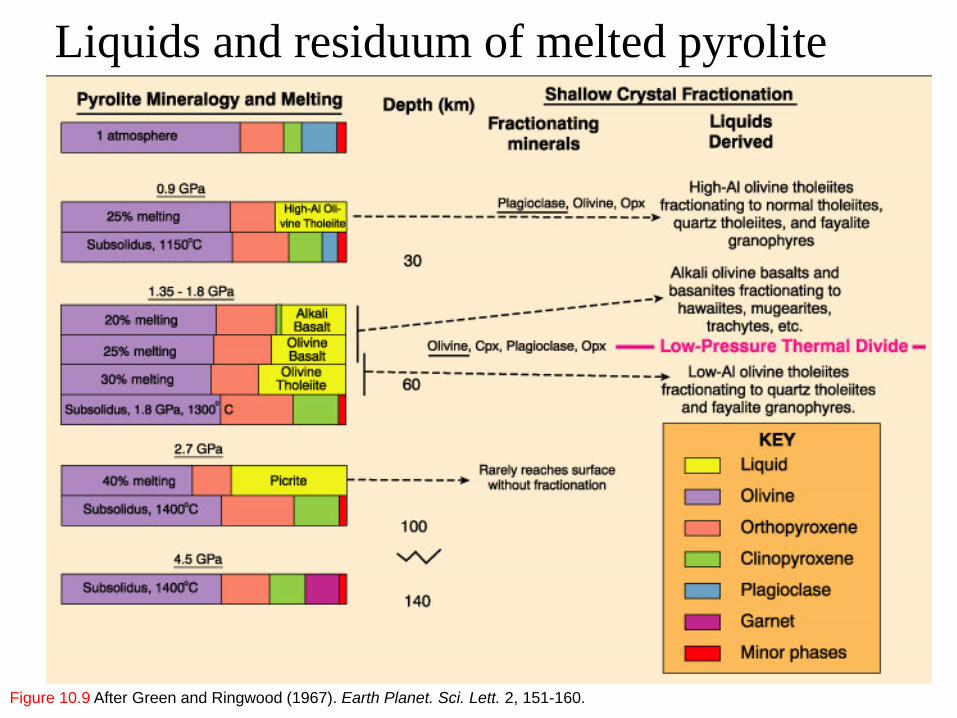
Liquids and residuum of melted pyrolite
Figure 10.9 After Green and Ringwood (1967). Earth Planet. Sci. Lett. 2, 151-160.
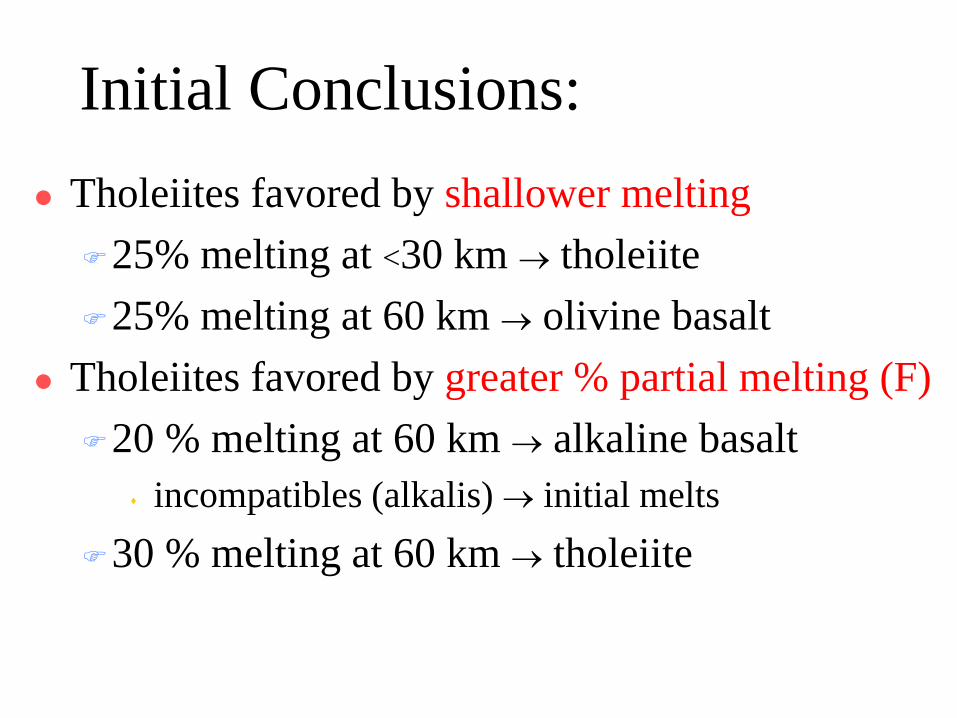
Initial Conclusions: Tholeiites favored by shallower melting25% melting at <30 km → tholeiite25% melting at 60 km → olivine basalt
Tholeiites favored by greater % partial melting (F)20 % melting at 60 km → alkaline basalt
incompatibles (alkalis) → initial melts30 % melting at 60 km → tholeiite
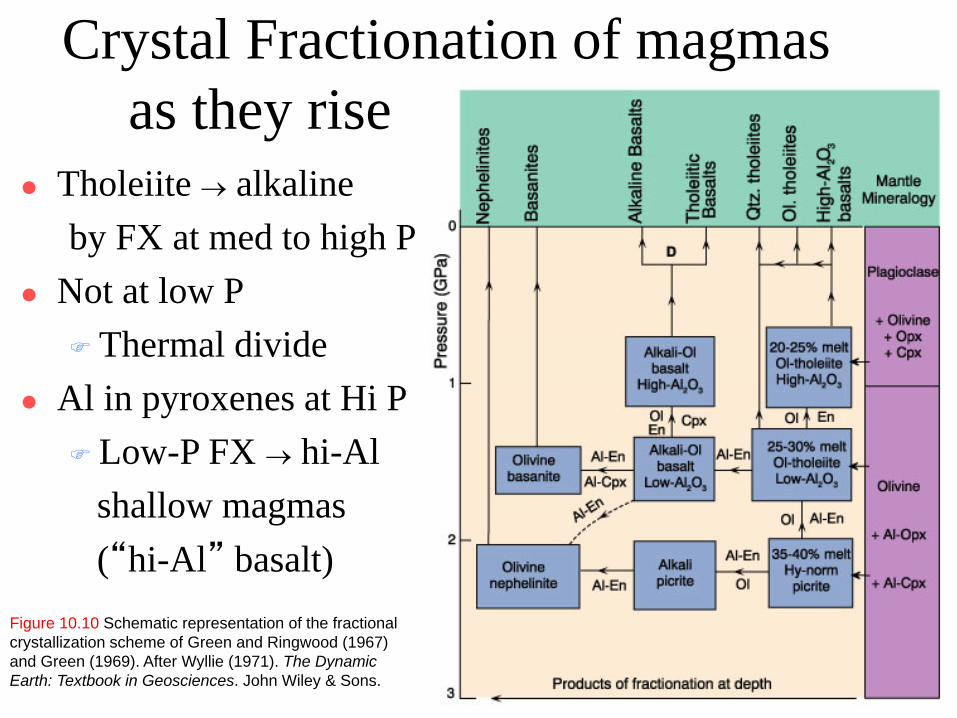
Crystal Fractionation of magmas as they rise
Tholeiite → alkalineby FX at med to high P
Not at low P Thermal divide
Al in pyroxenes at Hi P Low-P FX → hi-Al
shallow magmas(“hi-Al” basalt)
Figure 10.10 Schematic representation of the fractional crystallization scheme of Green and Ringwood (1967) and Green (1969). After Wyllie (1971). The Dynamic Earth: Textbook in Geosciences. John Wiley & Sons.
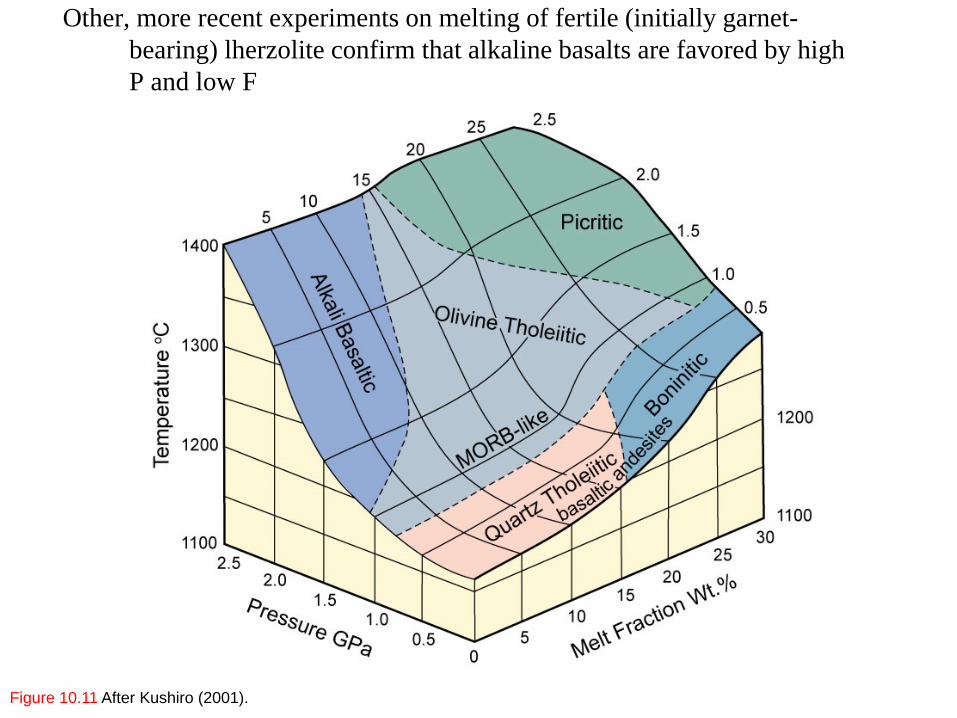
Figure 10.11 After Kushiro (2001).
Other, more recent experiments on melting of fertile (initially garnet-bearing) lherzolite confirm that alkaline basalts are favored by high P and low F
Primary magmas Formed at depth and not subsequently modified by
FX or Assimilation CriteriaHighest Mg# (100Mg/(Mg+Fe)) really → parental
magmaExperimental results of lherzolite melts
Mg# = 66-75 Cr > 1000 ppm Ni > 400-500 ppm Multiply saturated

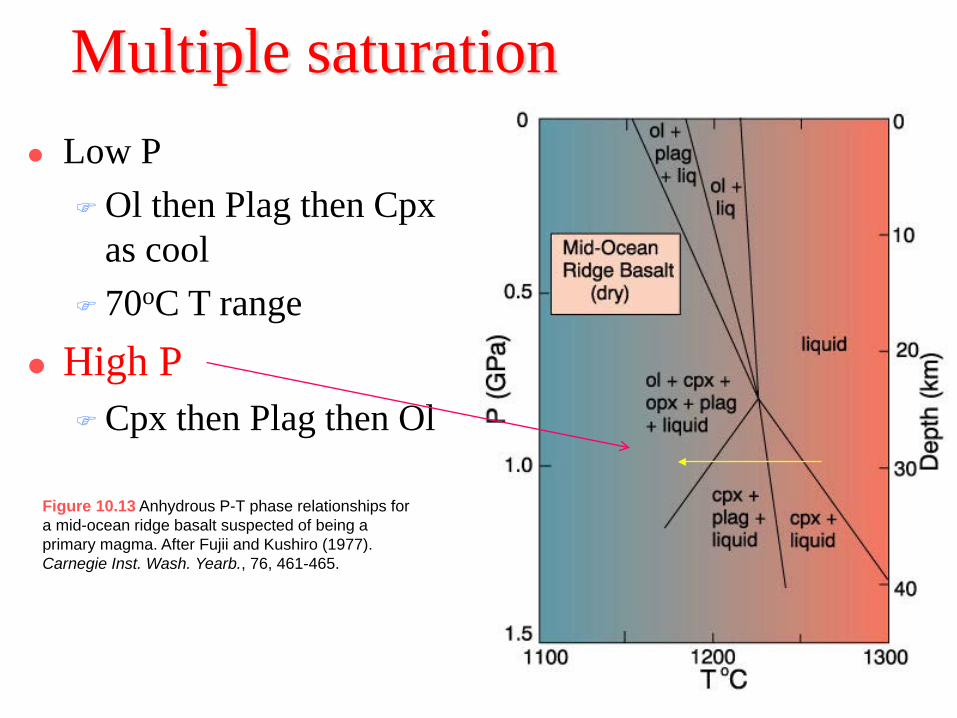
Multiple saturation Low P
Ol then Plag then Cpx as cool
~70oC T range
Figure 10.13 Anhydrous P-T phase relationships for a mid-ocean ridge basalt suspected of being a primary magma. After Fujii and Kushiro (1977). Carnegie Inst. Wash. Yearb., 76, 461-465.
Low POl then Plag then Cpx
as cool 70oC T range
High PCpx then Plag then Ol
Multiple saturation
Figure 10.13 Anhydrous P-T phase relationships for a mid-ocean ridge basalt suspected of being a primary magma. After Fujii and Kushiro (1977). Carnegie Inst. Wash. Yearb., 76, 461-465.
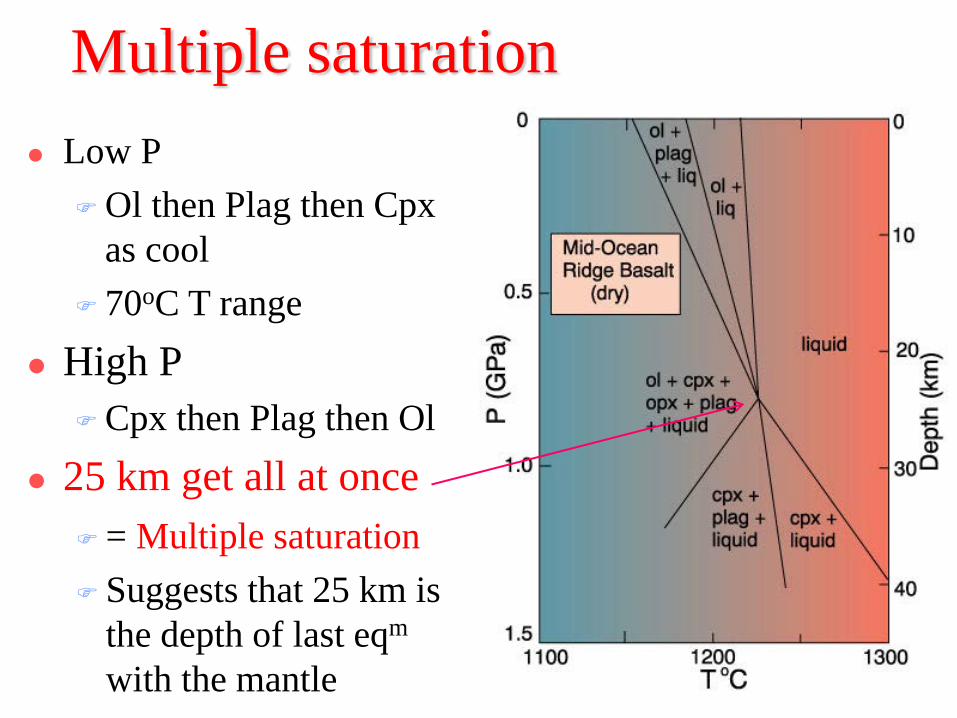
Low POl then Plag then Cpx
as cool 70oC T range
High PCpx then Plag then Ol
25 km get all at once = Multiple saturation Suggests that 25 km is
the depth of last eqm
with the mantle
Multiple saturation
Summary A chemically homogeneous mantle can
yield a variety of basalt types Alkaline basalts are favored over tholeiites
by deeper melting and by low % PM Fractionation at moderate to high depths can
also create alkaline basalts from tholeiites At low P there is a thermal divide that
separates the two series
0.00
2.00
4.00
6.00
8.00
10.00
atomic number
sam
ple/
chon
drite
La Ce Nd Sm Eu Tb Er Yb Lu
increasing incompatibility
Review of REE
Review of REE
increasing incompatibility
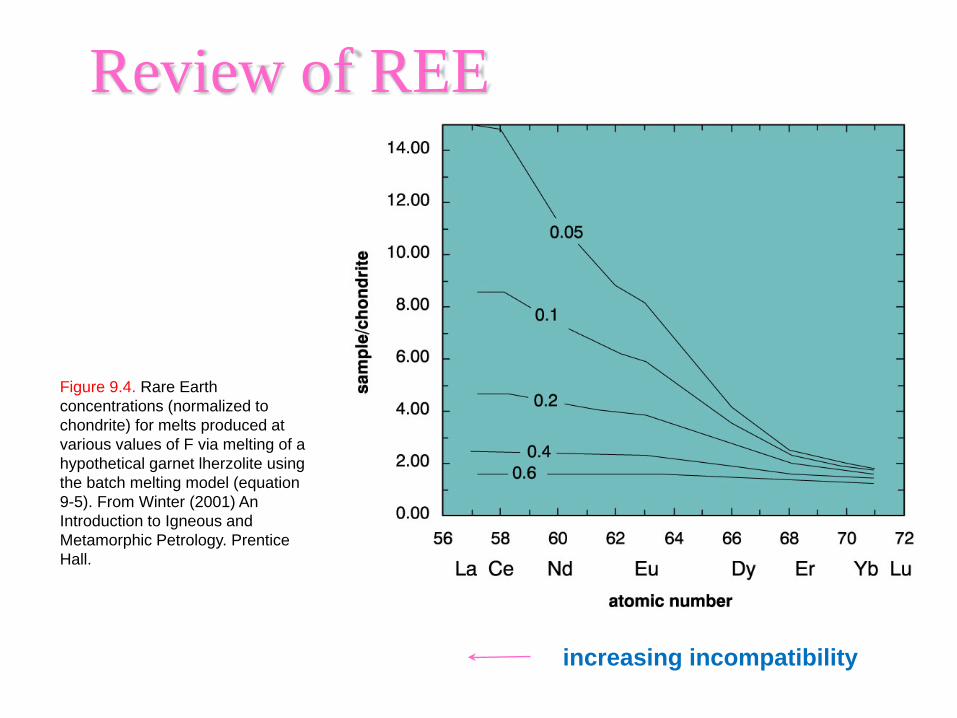
Figure 9.4. Rare Earth concentrations (normalized to chondrite) for melts produced at various values of F via melting of a hypothetical garnet lherzolite using the batch melting model (equation 9-5). From Winter (2001) An Introduction to Igneous and Metamorphic Petrology. Prentice Hall.

REE data for oceanic basalts
Figure 10.14a. REE diagram for a typical alkaline ocean island basalt (OIB) and tholeiitic mid-ocean ridge basalt (MORB). From Winter (2001) An Introduction to Igneous and Metamorphic Petrology. Prentice Hall. Data from Sun and McDonough (1989).
increasing incompatibility
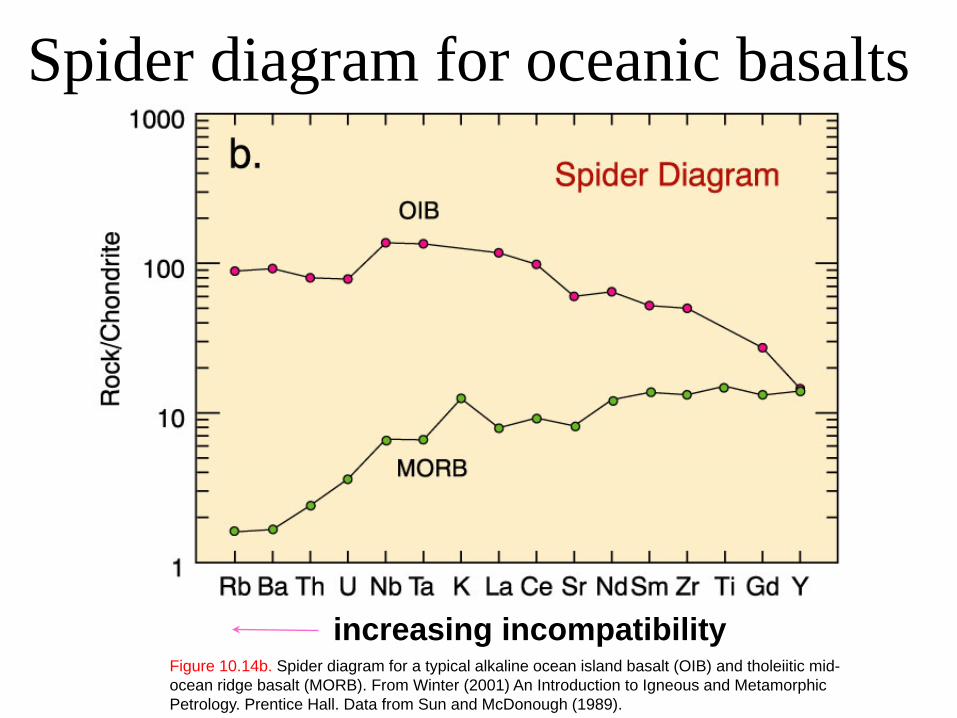
Spider diagram for oceanic basalts
increasing incompatibilityFigure 10.14b. Spider diagram for a typical alkaline ocean island basalt (OIB) and tholeiitic mid-ocean ridge basalt (MORB). From Winter (2001) An Introduction to Igneous and Metamorphic Petrology. Prentice Hall. Data from Sun and McDonough (1989).

Suggests different mantle source types, but isn’t conclusive.
Depleted mantle could → both MORB and OIB.
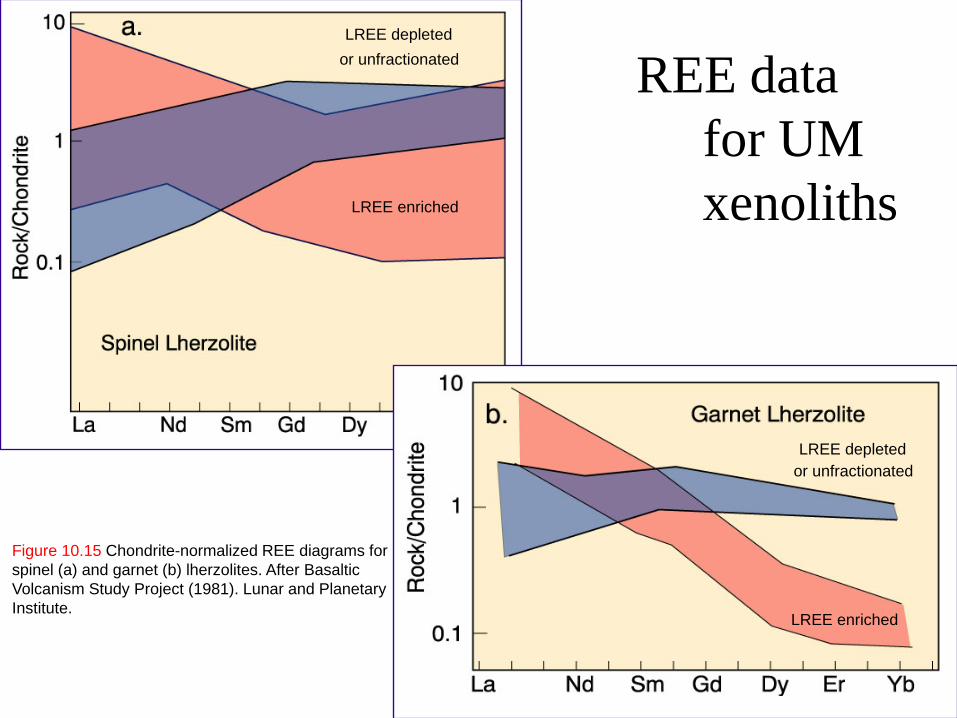
REE data for UM xenoliths
Figure 10.15 Chondrite-normalized REE diagrams for spinel (a) and garnet (b) lherzolites. After Basaltic Volcanism Study Project (1981). Lunar and Planetary Institute.
LREE enriched
LREE depletedor unfractionated
LREE depletedor unfractionated
LREE enriched
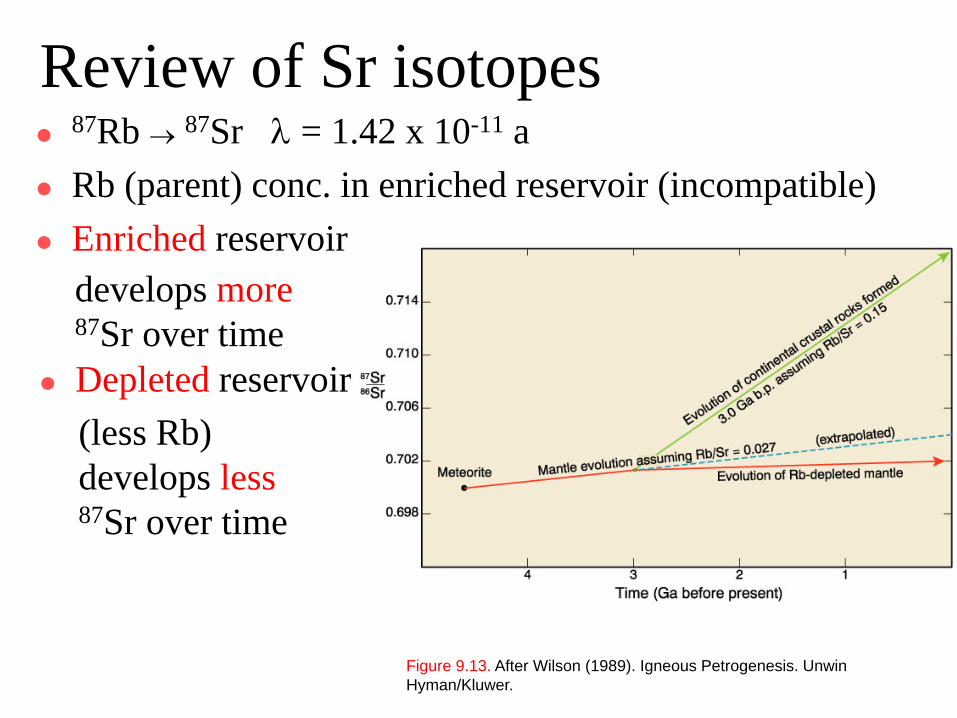
Review of Sr isotopes 87Rb → 87Sr λ = 1.42 x 10⁻¹¹ a Rb (parent) conc. in enriched reservoir (incompatible) Enriched reservoir
Figure 9.13. After Wilson (1989). Igneous Petrogenesis. Unwin Hyman/Kluwer.
develops more87Sr over time
Depleted reservoir(less Rb)develops less87Sr over time
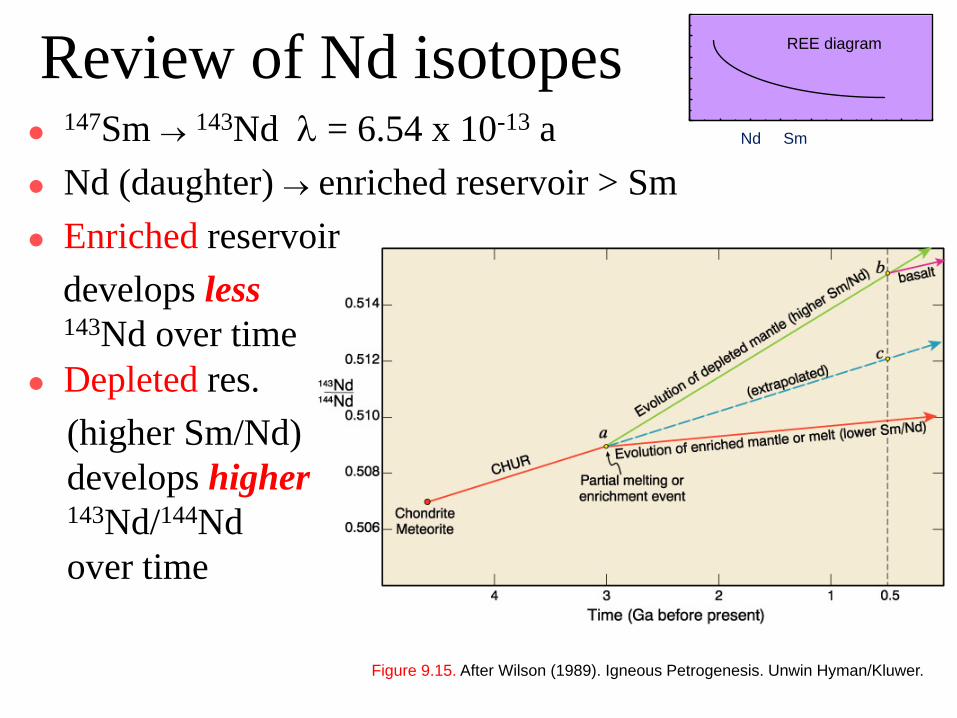
Review of Nd isotopes 147Sm → 143Nd λ = 6.54 x 10⁻¹³ a Nd (daughter) → enriched reservoir > Sm Enriched reservoir
develops less143Nd over time
Depleted res.(higher Sm/Nd)develops higher143Nd/144Ndover time
Nd Sm
REE diagram
Figure 9.15. After Wilson (1989). Igneous Petrogenesis. Unwin Hyman/Kluwer.
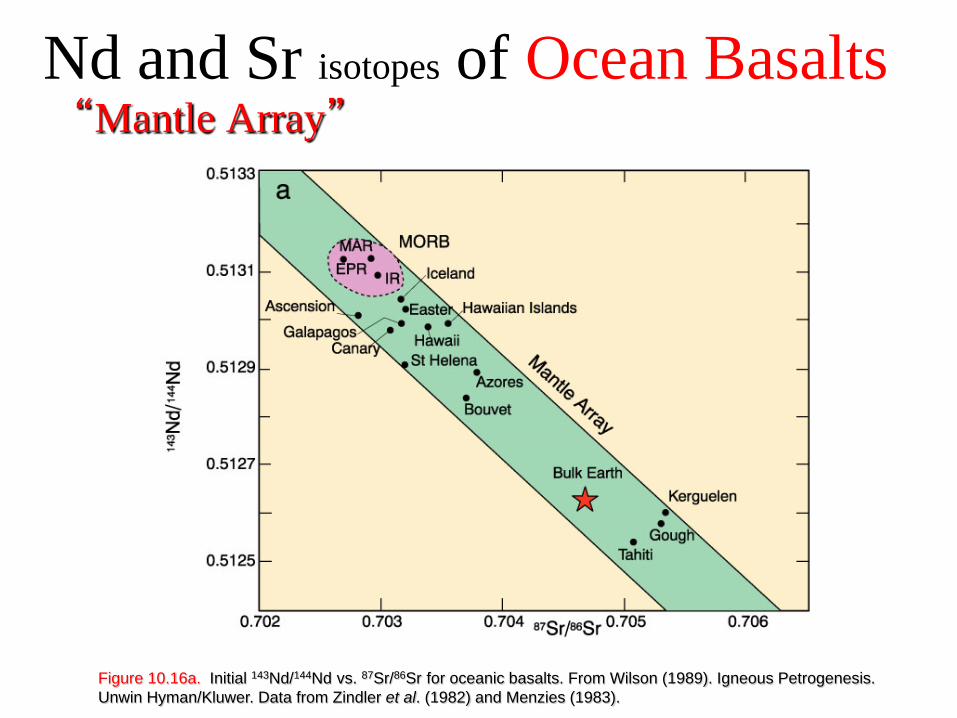
Nd and Sr isotopes of Ocean Basalts“Mantle Array”
Figure 10.16a. Initial 143Nd/144Nd vs. 87Sr/86Sr for oceanic basalts. From Wilson (1989). Igneous Petrogenesis. Unwin Hyman/Kluwer. Data from Zindler et al. (1982) and Menzies (1983).

Nd and Sr isotopes of Kimberlite Xenoliths
Figure 10.16b. Initial 143Nd/144Nd vs. 87Sr/86Sr for mantle xenoliths. From Wilson (1989). Igneous Petrogenesis. Unwin Hyman/Kluwer. Data from Zindler et al. (1982) and Menzies (1983).
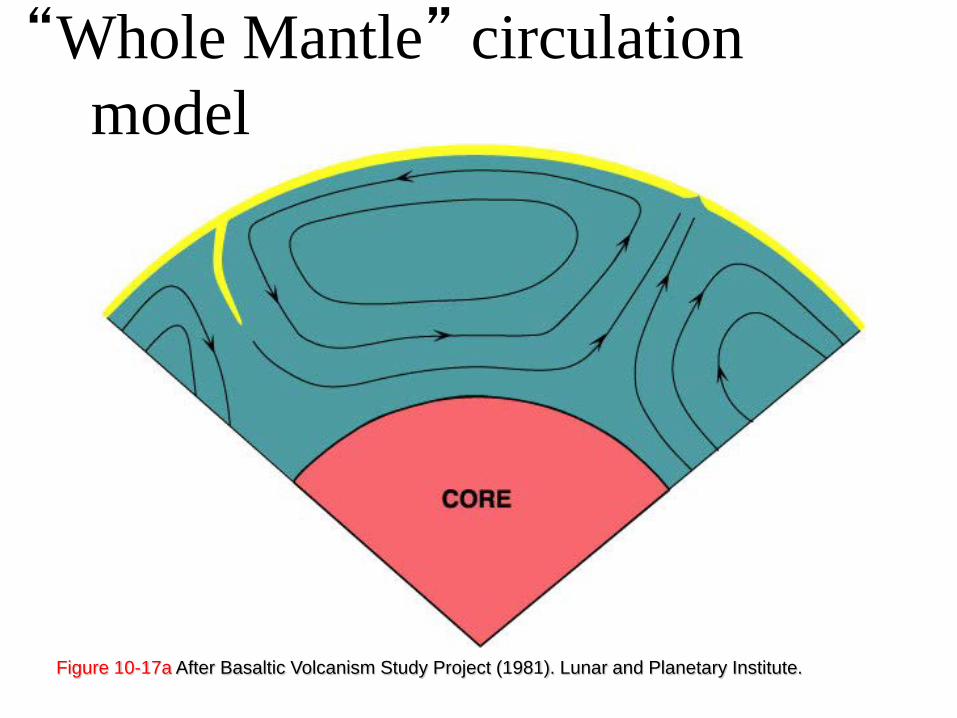
“Whole Mantle” circulation model
Figure 10-17a After Basaltic Volcanism Study Project (1981). Lunar and Planetary Institute.
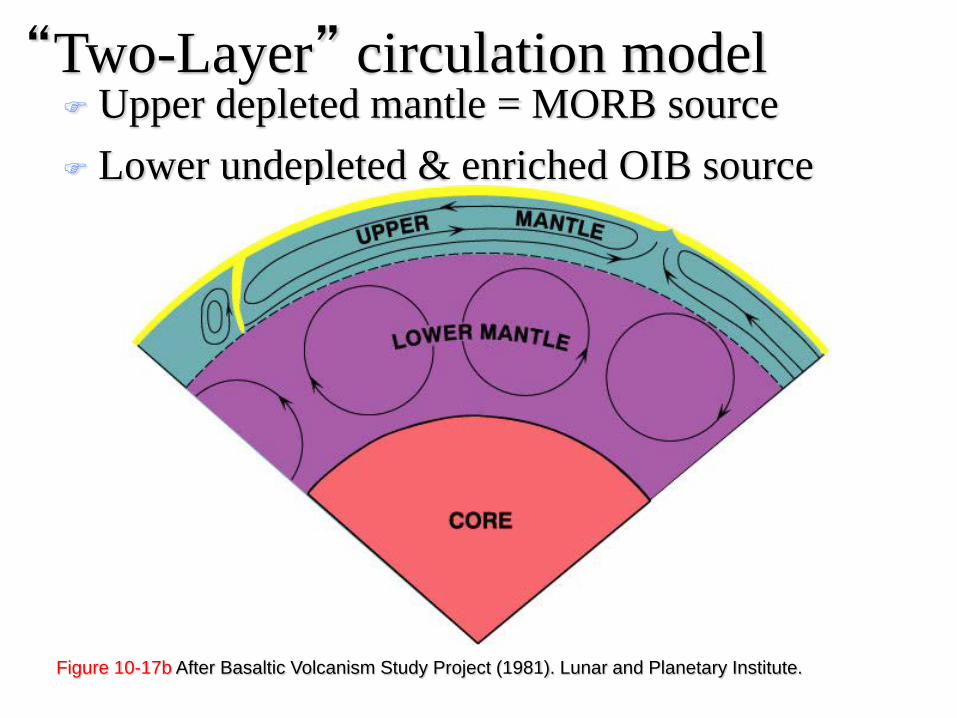
Upper depleted mantle = MORB source Lower undepleted & enriched OIB source
“Two-Layer” circulation model
Figure 10-17b After Basaltic Volcanism Study Project (1981). Lunar and Planetary Institute.

Experiments on melting enriched vs. depleted mantle samples:
Tholeiite easily createdby 10-30% PM
More silica saturatedat lower P
Grades toward alkalicat higher P
1. Depleted Mantle
Figure 10-18a. Results of partial melting experiments on depleted lherzolites. Dashed lines are contours representing percent partial melt produced. Strongly curved lines are contours of the normative olivine content of the melt. “Opx out” and “Cpx out” represent the degree of melting at which these phases are completely consumed in the melt. After Jaques and Green (1980). Contrib. Mineral. Petrol., 73, 287-310.
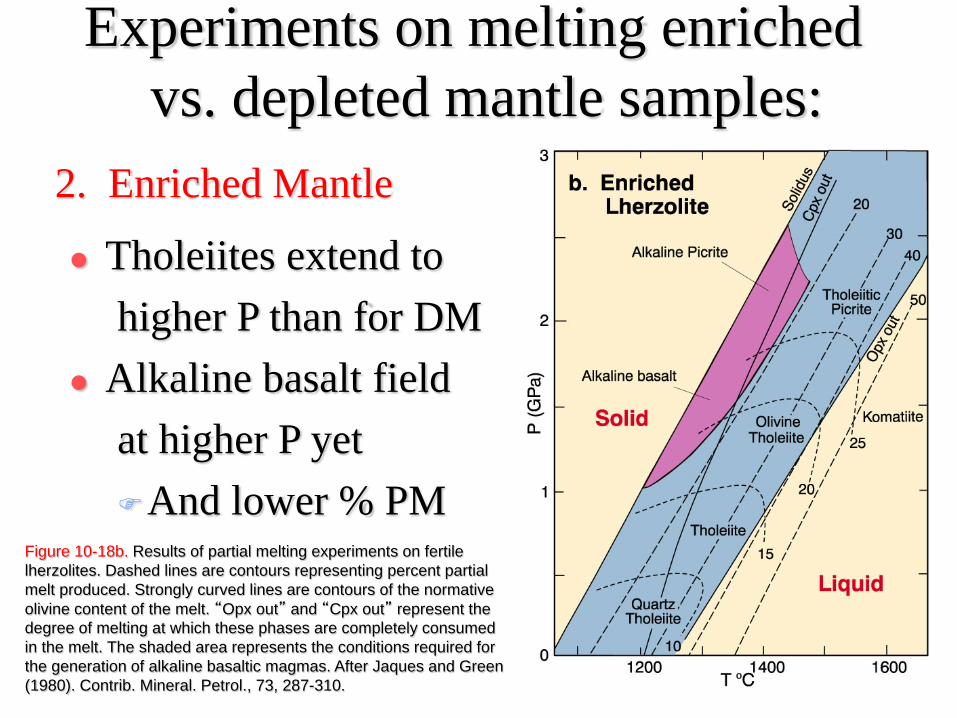
Experiments on melting enriched vs. depleted mantle samples:
Tholeiites extend tohigher P than for DM
Alkaline basalt fieldat higher P yetAnd lower % PM
2. Enriched Mantle
Figure 10-18b. Results of partial melting experiments on fertile lherzolites. Dashed lines are contours representing percent partial melt produced. Strongly curved lines are contours of the normative olivine content of the melt. “Opx out” and “Cpx out” represent the degree of melting at which these phases are completely consumed in the melt. The shaded area represents the conditions required for the generation of alkaline basaltic magmas. After Jaques and Green (1980). Contrib. Mineral. Petrol., 73, 287-310.