Embed Size (px)
Citation preview
August 2015 Page 10-1
10. ESTIMATED COSTS AND FORECASTED REVENUES
Understanding the anticipated costs of Oklahoma’s transportation needs identified in Chapter 9 and the potential available revenue to ODOT and its partners to address these needs is an important part of planning for Oklahoma’s transportation future.
This chapter provides discussion of the following:
Costs – The estimated costs of meeting the 2015-2040 LRTP multimodal transportation needs over the next 25 years (in constant 2013 dollars), organized by mode and by investment categories.
Revenue – An anticipated 2015-2040 LRTP baseline revenue forecast (federal, state, and local) for the 25-year (2015-2040) planning period (in constant 2013 dollars) to fund transportation.
Funding Gap – The amount that the estimated costs exceed the anticipated baseline revenue forecast over the 25-year planning period (in constant 2013 dollars).
Potential Additional Revenue Sources – A brief discussion of additional revenue sources that decision makers could consider addressing the funding gap.
10.1. FUNDING JURISDICTION AND RESPONSIBILITIES
As discussed in Chapter 9, ODOT is responsible for certain parts of the transportation system and works with other entities and the private sector to address several transportation needs. The various transportation assets/functions and related needs are described in this report as being “owned” or addressed by ODOT and/or other entities. There are various institutional mechanisms and funding arrangements.
ODOT has responsibility for funding state transportation improvements: The needs for State Highway System1 bridges, roadways, interchanges, and transportation appurtenances are addressed by ODOT using federal and state funds. Transportation appurtenances include safety improvements, maintenance, Ports of Entry, weigh stations and rest areas, ITS technology, and maintenance of the state rail lines (including rail-highway grade crossings). These are essential components of an effective transportation system in the State of Oklahoma.
Partner entities, private sector finance some transportation improvements: The partner owned assets and functions (sometimes described as modal programs) are vitally important to providing an efficient transportation system. For the purposes of the 2015-2040 LRTP, these include: bicycle and pedestrian facilities; intermodal facilities; passenger rail; public transportation - urban, rural, and tribal; ports and waterways; congestion management; and, the locally owned federal aid system.
Partner entities include: ACOG, INCOG and Lawton MPOs; Oklahoma cities, towns and counties; Oklahoma rural, urban and tribal transit providers; and the USACE. Public-private or private bodies, such as Amtrak, private rail operators, private rail corporations, and private port and terminal operators also participate in the development and delivery of transportation in the state, but only public costs and revenues are itemized in the final analysis of this report.
ODOT, as well as the partner entities, provide funding for the partner owned assets.
MOVING OKLAHOMA FORWARD
10 – Estimated Costs and Forecasted Revenues
August 2015 Page 10-2
Collaboration is required to address multimodal transportation needs: ODOT is not responsible for addressing the entire range of multimodal transportation needs in Oklahoma. However, ODOT and numerous federal, state, local partners work collaboratively to preserve, maintain, operate, and expand Oklahoma’s multimodal transportation system.
10.2. COST ESTIMATES (NEEDS)
Chapter 9 described the multimodal needs for the transportation system with a description of the responsibilities of ODOT and its partner entities. This section discusses the costs that are associated with addressing 2015-2040 LRTP needs.
10.2.1. ODOT-Owned Assets and Functions and Related ODOT Costs
Cost estimates for State Highway System bridge and highway needs were determined using analytical models such as FHWA’s Highway Economics Requirements System – State Version (HERS-ST), and NBIAS, as well as input from ODOT staff and the public.
The cost estimates for State Highway System interchange needs were estimated by ODOT staff based on historical records of ODOT’s programming of such projects. Interchange improvement needs were identified and then a unit cost was applied to estimate the cost. An approximate unit cost for right-of-way and utilities for the interchange improvements was also taken into account.
There are several transportation appurtenances that support the State Highway System and the state-owned rail system and its ongoing operation. The costs of these needs were estimated based on historical records and information from ODOT staff.
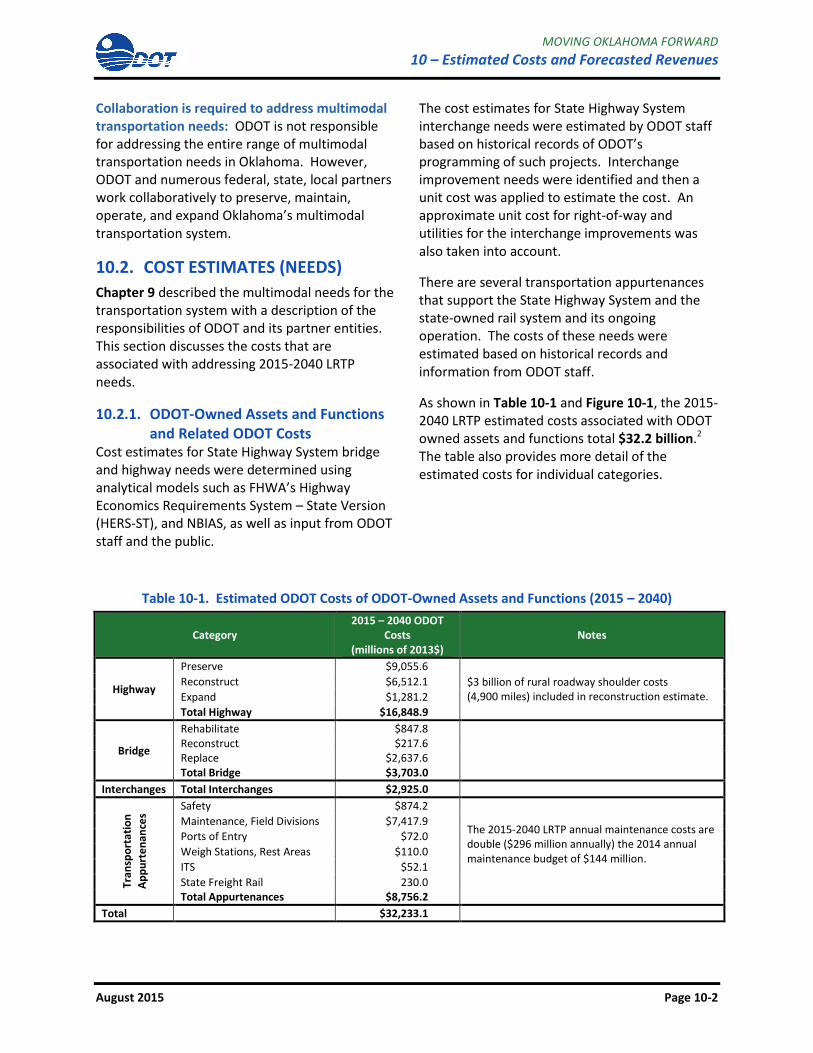
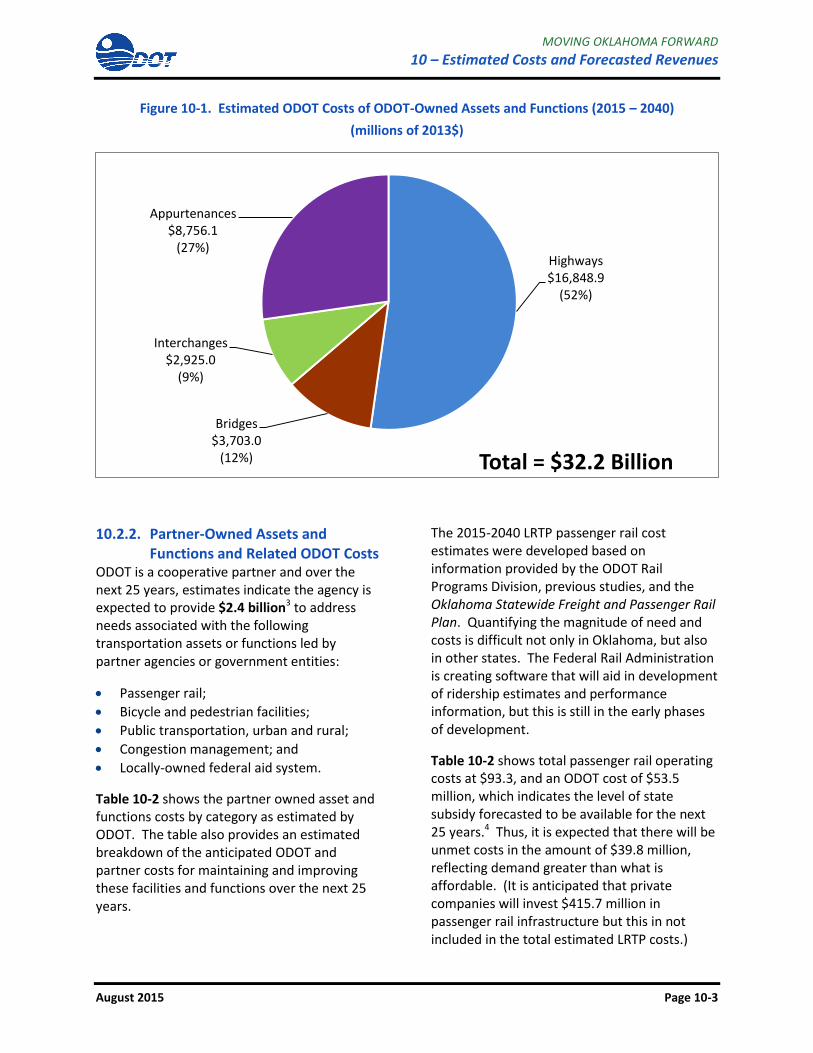
As shown in Table 10-1 and Figure 10-1, the 2015-2040 LRTP estimated costs associated with ODOT owned assets and functions total $32.2 billion.2 The table also provides more detail of the estimated costs for individual categories.
Table 10-1. Estimated ODOT Costs of ODOT-Owned Assets and Functions (2015 – 2040)
Category 2015 – 2040 ODOT
Costs (millions of 2013$)
Notes
Highway
Preserve $9,055.6
$3 billion of rural roadway shoulder costs (4,900 miles) included in reconstruction estimate.
Reconstruct $6,512.1
Expand $1,281.2
Total Highway $16,848.9
Bridge
Rehabilitate $847.8
Reconstruct $217.6
Replace $2,637.6
Total Bridge $3,703.0
Interchanges Total Interchanges $2,925.0
Tran
spo
rtat
ion
Ap
pu
rte
nan
ces
Safety $874.2
The 2015-2040 LRTP annual maintenance costs are double ($296 million annually) the 2014 annual maintenance budget of $144 million.
Maintenance, Field Divisions $7,417.9
Ports of Entry $72.0
Weigh Stations, Rest Areas $110.0
ITS $52.1
State Freight Rail 230.0 Total Appurtenances $8,756.2
Total $32,233.1
MOVING OKLAHOMA FORWARD
10 – Estimated Costs and Forecasted Revenues
August 2015 Page 10-3
Figure 10-1. Estimated ODOT Costs of ODOT-Owned Assets and Functions (2015 – 2040)
(millions of 2013$)
10.2.2. Partner-Owned Assets and Functions and Related ODOT Costs
ODOT is a cooperative partner and over the next 25 years, estimates indicate the agency is expected to provide $2.4 billion3 to address needs associated with the following transportation assets or functions led by partner agencies or government entities:
Passenger rail;
Bicycle and pedestrian facilities;
Public transportation, urban and rural;
Congestion management; and
Locally-owned federal aid system.
Table 10-2 shows the partner owned asset and functions costs by category as estimated by ODOT. The table also provides an estimated breakdown of the anticipated ODOT and partner costs for maintaining and improving these facilities and functions over the next 25 years.
The 2015-2040 LRTP passenger rail cost estimates were developed based on information provided by the ODOT Rail Programs Division, previous studies, and the Oklahoma Statewide Freight and Passenger Rail Plan. Quantifying the magnitude of need and costs is difficult not only in Oklahoma, but also in other states. The Federal Rail Administration is creating software that will aid in development of ridership estimates and performance information, but this is still in the early phases of development.
Table 10-2 shows total passenger rail operating costs at $93.3, and an ODOT cost of $53.5 million, which indicates the level of state subsidy forecasted to be available for the next 25 years.4 Thus, it is expected that there will be unmet costs in the amount of $39.8 million, reflecting demand greater than what is affordable. (It is anticipated that private companies will invest $415.7 million in passenger rail infrastructure but this in not included in the total estimated LRTP costs.)
Highways $16,848.9
(52%)
Bridges $3,703.0
(12%)
Interchanges $2,925.0
(9%)
Appurtenances $8,756.1
(27%)
Total = $32.2 Billion
MOVING OKLAHOMA FORWARD
10 – Estimated Costs and Forecasted Revenues
August 2015 Page 10-4
Table 10-2. Partner-Owned Assets & Functions and Related Estimated Costs (2015 – 2040)
Category 2015 – 2040 Costs (millions of 2013$)
Notes Total Costs ODOT Cost Partner Cost Unmet Costs
Par
tne
r O
wn
ed
Ass
ets
an
d F
un
ctio
ns
Passenger Rail
Preserve - Heartland Flyer (HF) to Ft. Worth
$80.3 $53.5 $0.0 $26.8
Forecasted state subsidy for passenger rail is $53.5 million. Shortfall is $26.8
Expand - Extend HF from OKC to Newton KS, active 2035
(private sector capital: $60.0 M)
$13.0 NA $0.0 $13.0
$60.0 million of private investments. $13.0 million is operation subsidy shortfall from 2035 to 2040.
Expand – Improved service Newton KS to Ft. Worth TX
$0.0 $0.0 $0.0 $0.0 $107.0 million of private investments (after 2040)
Tulsa-OKC (private sector capital: $355.7 M)
$0.0 $0.0 $0.0 $0.0 $355.7 million of private investments
Passenger Rail Subtotal
$93.3 $53.5 $0.0 $39.8
Private investments of $107.0 million after 2040. Total private investment 2015-2040 = $415.7 million
Public Transit
Rural Transit $909.0 $583.3 $222.7 $103.0 $103.0 million shortfall
Urban Transit $1,349.0 $43.2 $1,305.8 $0.0
Tribal Transit $162.7 $0.0 $162.7 $0.0 Public Transit Subtotal
$2,420.7 $626.5 $1,691.2 $103.0
Bicycle and Pedestrian
$851.0 $189.7 $113.5 $547.8 $547.8 million shortfall
Intermodal Facilities
$94.5 $0.0 NA $94.5 City of Oklahoma City, $94.5 million gap
Ports and Waterways
$191.0 $0.0 $72.4 $118.6 USACE, $118.6 million gap
Locally owned federal aid system
$1,521.2 $1,521.2 $0.0* $0.0 ODOT provides funding directly to counties, cities, ACOG & INCOG.
Congestion Mitigation
$30.5 $30.5 $0.0 $0.0
Total Partner Programs
$5,202.2 $2,421.0 $1,877.1 $903.6 Total ODOT and Partner cost = $5.2 billion.
Note: Rural Transit is administered by ODOT. Local entities provide service and secure (approx.60%) local match. Typical required match for federal transit operating funds is 50%; capital funds typically require 10% to 20% match. Bicycle & pedestrian needs are funded by a variety of sources. This is an estimate of needs based on history and adopted Plans. ODOT acknowledges that it is not a statement of all Oklahoma bicycle & pedestrian needs. *ODOT acknowledges there is significant local funding of local streets and roadways not included. NA: Information is not available or unknown.
MOVING OKLAHOMA FORWARD
10 – Estimated Costs and Forecasted Revenues
August 2015 Page 10-5
The bicycle and pedestrian needs were examined for each metropolitan area by reviewing the regional bicycle plans and/or bicycle-pedestrian elements of the latest Long Range Transportation Plans of the state’s metropolitan organizations, and by analyzing historic needs/costs as identified through the ODOT Transportation Alternatives Program5 (formerly Enhancement). As shown in Table 10-2, ODOT will provide $189.7 million to support bicycle and pedestrian facility improvements.6
To estimate the long term rural transit cost, components of actual (vs. budgeted) costs for the years 2009 through 2013 were averaged and then projected over the next 25 years. As shown in Table 10-2, ODOT is expected to provide $583.3 million to support rural transit in Oklahoma between 2015 and 2040.7
The long term urban transit needs and estimated cost were examined for each of the metropolitan areas by reviewing their LRTPs. As shown in Table 10-2, ODOT plans to provide $43.2 million in state funds to support urban transit in Oklahoma over the next 25 years.
The State Highway System does not include all federal aid highway miles in Oklahoma; local streets and roads on the federal aid system are owned by counties, cities and towns, or occasionally another public agency. To help address the 19,000 miles8 of local government owned federal aid system improvement needs, ODOT provides annual funding to counties, cities, and the ACOG and INCOG MPOs. As shown in Table 10-2, the 25-year funding that ODOT is expected to pass through to local governments to address locally-owned federal aid highways totals over $1.5 billion. This funding is used as an indicator of local needs/costs; however ODOT is aware that the need is greater than what is represented by this investment. Other state, and local funds help to meet many of the city, town, and county road needs, and some needs remain unmet.
The Congestion Mitigation and Air Quality Improvement (CMAQ) Program was implemented by FHWA and FTA to support surface transportation projects and other related efforts that contribute air quality improvements and provide congestion relief. Federal CMAQ funding is provided to areas in nonattainment or maintenance for ozone, carbon monoxide, and/or particulate matter. Even though Oklahoma does not have any nonattainment areas, ODOT receives an apportionment of CMAQ funding for congestion mitigation, either air quality improvement projects, or other elements of flexible spending. ODOT provides a pass through of CMAQ funds to the MPOs to assist with congestion reduction/air quality improvement efforts. Estimated costs related to congestion management, $30.5 million over the next 25 years, are based on a continuation of ODOT expenditures at current levels.
ODOT’s share of partner-owned program costs such as passenger rail, public transit, bicycle and pedestrian facilities, etc. is estimated at $2.4 billion.
10.2.3. Partner Asset/Functions Cost Assumed by Partner Entities
ODOT is involved in multiple aspects of planning and developing the transportation system; yet there are many occasions where the Department works in cooperation with partner agencies to address transportation problems and/or fund improvements. Additionally, ODOT recognizes that there are institutional and jurisdictional issues, for example with counties or MPOs, where ODOT may serve as the second tier rather than the lead agency.
The cost estimates for other modal transportation assets/functions (modal programs) were determined using data from the sponsoring entity/agency, local COGs, ODOT publications, and input from ODOT staff. These cost estimates may not be as finely tuned by virtue of the fact that ODOT is not the lead entity. Nevertheless, these partner programs
MOVING OKLAHOMA FORWARD
10 – Estimated Costs and Forecasted Revenues
August 2015 Page 10-6
are important to the picture of freight and passenger transportation in the State of Oklahoma.
Several of the items mentioned in the previous section involve costs, as shown in Table 10-2 that are shared by partner entities, namely:
Bicycle and pedestrian facilities; and
Rural and urban public transportation.
As explained above, estimated costs for bicycle and pedestrian improvements were developed based on an analysis of state and local government historical costs. Assuming that local government funding trends continue, local partner entities are expected to absorb $113.5 million of bicycle and pedestrian improvement costs over the next 25 years. An additional number of bicycle and pedestrian facility needs, costing an estimated $547.8 million, do not have an identified funding source.
Rural transit costs, as described earlier, have been estimated based on an analysis of historical costs. In addition to required match, local governments or sponsor agencies are expected to face rural transit costs of $222.7 million between 2015 and 2040. Additionally, a shortfall of over one hundred million dollars is expected.
As shown in Table 10-2, the urban transit cost for partner entities (based on financially constrained metropolitan LRTPs) is estimated at $1,305.8 million. About one-third of this cost is covered through FTA funds provided directly to the metropolitan transit agencies. The remainder of the cost is the responsibility of the local governments and related transit agencies.9
In addition to the transportation system components mentioned above, this group of partner assets/functions includes tribal transit, intermodal facilities, and ports and waterways.
Funding from FTA’s Tribal Transit program for years 2009 through 2014 was used as the basis for estimating tribal funding needs for the life of
this plan. Extrapolating from the past five year’s transit use and costs, estimated cost of the 25-year tribal transit needs is estimated at $162.7 million. Tribal transit receives direct funding through FTA. ODOT provides coordination and assistance as needed.10
The need for intermodal transportation hubs has been expressed by various governmental and private entities, along with stakeholders within the State of Oklahoma. The only definite facility being proposed at the time of this Plan development is the Oklahoma City Intermodal Transportation Hub. The proposed transportation hub will provide connectivity between existing and future transit modes, and will provide passengers with amenities such as enclosed waiting and ticketing, restrooms and access to mixed use development. The total project cost of the transit hub is estimated at $123 million.11
Phase I of the Hub is funded by a Transportation Investment Generating Economic Recovery (TIGER) grant, City of Oklahoma City designated sales tax revenue, and ODOT. The City of Oklahoma City is the project sponsor and approximately $94.5 million is needed to complete the improvements recommended by the Hub Study. A revenue source has not been identified.
The estimated cost of meeting the 25-year ports and waterway needs for critical maintenance and capacity expansion totals $191.0 million. These costs were developed based on information provided by the ODOT Waterways Program and the USACE.12 These improvement costs are under the fiscal responsibility of the USACE.
As shown in Table 10-2, cost estimates for partner agency assets and functions total nearly $1.9 billion to address intermodal facilities; bicycle and pedestrian facilities; ports and waterways; and rural, urban, and tribal public transportation needs over the next 25 years. After estimated ODOT and partner entity contributions are considered for the needs
MOVING OKLAHOMA FORWARD
10 – Estimated Costs and Forecasted Revenues
August 2015 Page 10-7
listed in Table 10-2, there remains approximately $900 million in unmet costs that would require further investment on the part of participating entities.
10.2.4. Total Estimated Costs for 2015-2040 LRTP
Based on the 2015-2040 needs analysis conducted for the 2015-2040 LRTP, Figure 10-2 illustrates the estimated costs of ODOT-owned assets and functions (highways, bridges, interchanges, and appurtenances) plus partner-owned assets and functions at a total of $37.4 billion.
Of the $37.4 billion in total estimated costs, ODOT is responsible for $32.2 billion in state highway, bridge, interchange and appurtenance needs costs. Figure 10-2 shows this cost level is not affordable. The affordable cost for ODOT for these state owned assets is $24.2 billion. (This value is detailed in Section 10.3.1.) Thus, $8.0 billion of this price tag is identified as an unmet cost. ODOT will need to decide which needed improvements will not be funded.
Of the $37.4 billion in total estimated costs, partner agency costs total $5.2 billion. Assigning cost responsibilities shows partner entities are responsible for nearly $1.9 billion. ODOT is expected to provide pass through and other designated funds in the amount of $2.4 billion; and $0.9 billion are unmet costs.
In conclusion, for the 2015-2040 LRTP -
Total Estimated Costs are .............. $37.4 billion
Total Affordable Costs are ............. $28.5 billion
ODOT ....................................... $26.6 billion
Partner entities ......................... $1.9 billion
Total Unmet Needs are: ................... $8.9 billion
State highway, bridge, interchange, appurtenances (combined total): ..................... $8.0 billion
Passenger rail, bicycle and pedestrian facilities, public transportation, intermodal facilities, locally owned federal aid system, congestion management, ports and waterways (combined total): ..................... $0.9 billion
Figure 10-2. 2015-2040 LRTP Total Estimated Cost (millions of 2013 dollars)
$0
$5,000
$10,000
$15,000
$20,000
$25,000
$30,000
$35,000
$40,000
ODOT Assets Partner Assets Total
$32,233
$5,202
$37,435
$24,239
$4,298
$28,537
Estimated Cost Affordable Cost
Highways, Bridges, Interchanges, Appurtenances
Bicycle/ Pedestrian, Passenger Rail, Public Transit, Ports and Waterways, Congestion Management, Local-Owned Federal Aid System
Total 2015-2040 LRTP
Funding Gap $904 Million
Funding Gap
$8,898 Million
Funding Gap
$7,994 Million
MOVING OKLAHOMA FORWARD
10 – Estimated Costs and Forecasted Revenues
August 2015 Page 10-8
10.3. REVENUE FORECAST
The 2015-2040 LRTP revenue forecast projects ODOT’s state revenues, federal funds and required match, and local funds for state-owned surface transportation infrastructure investments13 (highways, bridges, interchanges, transportation appurtenances) over the next 25 years. The ODOT revenue forecast also projects ODOT funds that are passed through and/or designated to partners for partner-owned transportation assets and functions.
Additionally, revenue estimates for partner agencies and other government entities responsible for transportation assets and functions were projected. While ODOT funds may be shared, passed through, and/or designated for these transportation assets and functions, the responsibility for these assets and functions are outside the ODOT’s control.
10.3.1. ODOT Revenue Forecast ODOT Funds for ODOT-owned Infrastructure
To develop the ODOT forecast, historic ODOT revenues and funding streams were documented;14 and then, for each revenue and funding line item, growth rate assumptions for the forecast period were developed in collaboration with ODOT staff.
In brief, the following ODOT funds are included in the forecast:
State and federal (FHWA) highway and bridge funds;
State and federal (FTA) transit funds;
State and federal highway assistance to local governments, including counties, cities, and towns;
State transit funds to urban transit systems;
State and federal funds to rural and tribal transit systems;15
State funds for passenger rail operations and railroad improvements; and
Required local matching funds.
In the following pages of this report, the term “ODOT funds” represents the sum of resources from the above mentioned sources. The ODOT funds include approximately 42 percent federal, 56 percent state, and 2 percent local money.
The ODOT revenue forecast does not include the following:
Local transportation revenues such as city transit subsidies;
Federal or state transportation (non-transit) funds for which local or tribal governments are direct recipients;
City, town and county funds for sidewalks and bicycle facilities;
Private company funding of ports or railroads;
AMTRAK or private passenger rail funds;
Airport or aeronautics funding; and
Funding for the Oklahoma Turnpike Authority system.
The primary revenue growth rate assumptions are described below.
Federal Funding. All sources of federal funding remain at FY2014 funding levels, i.e., 0 percent growth in federal funding is assumed. This assumption is based on the future federal transportation funding uncertainty related to solvency issues of the Federal Highway Trust Fund and the lack of a long term funding act for surface transportation.
State Revenues. State revenues are projected according to specific growth rates for each revenue source. Growth rate assumptions for the primary state revenue sources include the following:
MOVING OKLAHOMA FORWARD
10 – Estimated Costs and Forecasted Revenues
August 2015 Page 10-9
– Motor fuel tax revenue growth is based on the Energy Information Administration’s (EIA) annual projected growth rates in motor fuel consumption in the United States’ West South Central region.
– Annual growth in motor fuel tax revenue over the forecast period is flat.
– Income tax revenue growth through FY2018 is based on dollar amounts set forth in state statute; and tax revenue is projected to remain at the FY2018 level (i.e., 0 percent growth) thereafter and through the duration of the forecast period.
– Motor vehicle registration fee revenue growth is 0.69 percent annually based on the FY2004 to FY2013 compound annual growth rate (CAGR) of motor vehicle registrations in Oklahoma. No change in the fee rates is assumed.
Deductions. Deductions from the revenue forecast are made to account for required debt service payments on currently outstanding debt and an estimate of projected funds that will pay for non-infrastructure related costs such as the administration of ODOT, research, and planning.
Direct Pass Through. ODOT provides federal revenue directly to the Association of Central Oklahoma Governments (ACOG), the Indian Nations Council of Government (INCOG),16 as well as counties and cities. The two MPOs use this funding to address needs on the federal-aid highway system. Typically, if improvements are made to the State Highway System, within the ACOG or INCOG regions, this cost is ODOT’s responsibility. Counties and cities use the funding to address locally owned streets, roads, and bridges that are not included in the State Highway System.
The baseline revenue forecast does not assume the following:
Any changes to state or federal legislation which stipulate the amount of revenues ODOT receives after FY2015;
Any changes in tax rates, fee levels, or existing revenues;
Receipt of any new revenue sources; and
Receipt of any proceeds from newly issued debt, general revenue appropriations from the State, or other special one-time funding.
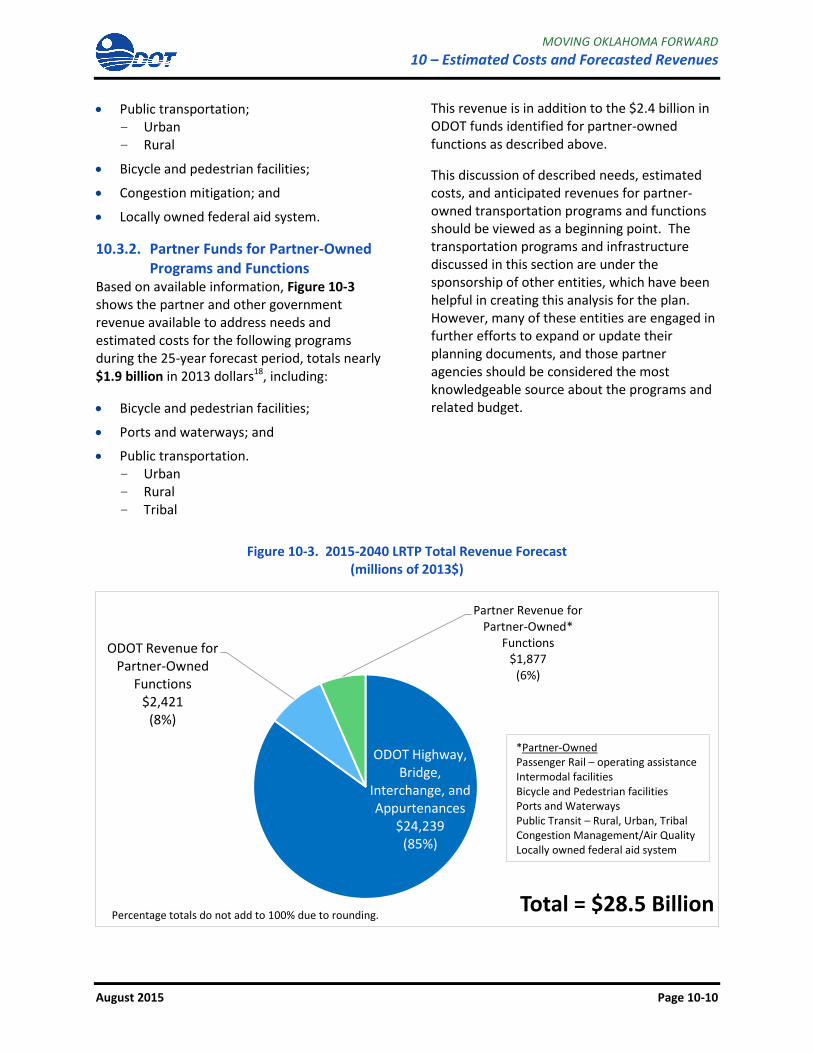
Over the 25-year forecast period, it is projected that ODOT’s transportation revenue available to address needs total $26.7 billion in 2013 dollars.17 However, when you reduce the direct pass through revenue provided to ACOG, INCOG, counties, and cities to address the locally owned federal aid system, Figure 10-3 shows the revenue available to address the following needs and estimated costs on the State Highway System totals $24.2 billion in 2013 dollars.
ODOT Funds for Partner-Owned Assets and Functions As noted earlier, ODOT works in cooperation with, and provides funding to, partner agencies or government entities to address needed improvements for transportation assets under the jurisdiction of these other entities. During the 25-year forecast period, Table 10-2 and Figure 10-3 show the projected ODOT transportation revenue available to address needs and estimated costs for the following locally-owned transportation assets and functions total $2.4 billion in 2013 dollars:
Passenger rail- operations (the Oklahoma City to Fort Worth Heartland Flyer 2015-2040; Newton, Kansas to Oklahoma City 2035-2040);
MOVING OKLAHOMA FORWARD
10 – Estimated Costs and Forecasted Revenues
August 2015 Page 10-10
Public transportation; – Urban – Rural
Bicycle and pedestrian facilities;
Congestion mitigation; and
Locally owned federal aid system.
10.3.2. Partner Funds for Partner-Owned Programs and Functions
Based on available information, Figure 10-3 shows the partner and other government revenue available to address needs and estimated costs for the following programs during the 25-year forecast period, totals nearly $1.9 billion in 2013 dollars18, including:
Bicycle and pedestrian facilities;
Ports and waterways; and
Public transportation. – Urban – Rural – Tribal
This revenue is in addition to the $2.4 billion in ODOT funds identified for partner-owned functions as described above.
This discussion of described needs, estimated costs, and anticipated revenues for partner-owned transportation programs and functions should be viewed as a beginning point. The transportation programs and infrastructure discussed in this section are under the sponsorship of other entities, which have been helpful in creating this analysis for the plan. However, many of these entities are engaged in further efforts to expand or update their planning documents, and those partner agencies should be considered the most knowledgeable source about the programs and related budget.
Figure 10-3. 2015-2040 LRTP Total Revenue Forecast (millions of 2013$)
ODOT Highway, Bridge,
Interchange, and Appurtenances
$24,239 (85%)
ODOT Revenue for Partner-Owned
Functions $2,421
(8%)
Partner Revenue for Partner-Owned*
Functions $1,877
(6%)
Total = $28.5 Billion
*Partner-Owned Passenger Rail – operating assistance Intermodal facilities Bicycle and Pedestrian facilities Ports and Waterways Public Transit – Rural, Urban, Tribal Congestion Management/Air Quality Locally owned federal aid system
Percentage totals do not add to 100% due to rounding.
MOVING OKLAHOMA FORWARD
10 – Estimated Costs and Forecasted Revenues
August 2015 Page 10-11
10.4. FUNDING GAP AND IMPLICATIONS
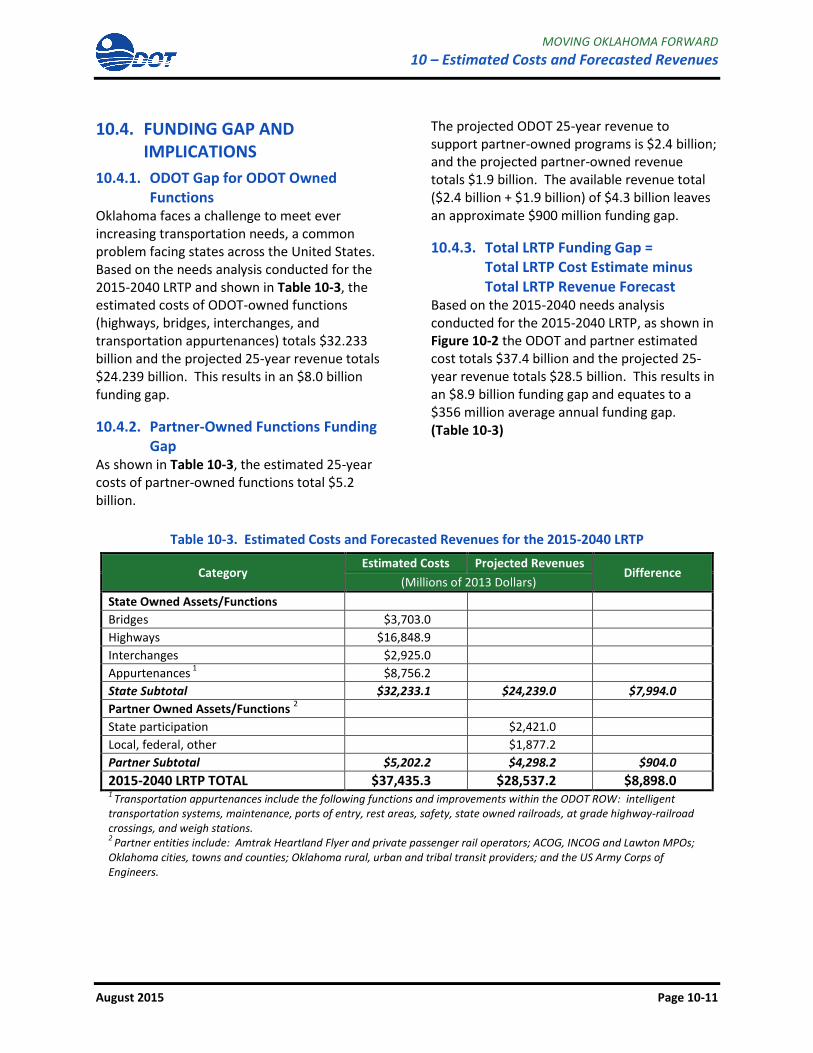
10.4.1. ODOT Gap for ODOT Owned Functions
Oklahoma faces a challenge to meet ever increasing transportation needs, a common problem facing states across the United States. Based on the needs analysis conducted for the 2015-2040 LRTP and shown in Table 10-3, the estimated costs of ODOT-owned functions (highways, bridges, interchanges, and transportation appurtenances) totals $32.233 billion and the projected 25-year revenue totals $24.239 billion. This results in an $8.0 billion funding gap.
10.4.2. Partner-Owned Functions Funding Gap
As shown in Table 10-3, the estimated 25-year costs of partner-owned functions total $5.2 billion.
The projected ODOT 25-year revenue to support partner-owned programs is $2.4 billion; and the projected partner-owned revenue totals $1.9 billion. The available revenue total ($2.4 billion + $1.9 billion) of $4.3 billion leaves an approximate $900 million funding gap.
10.4.3. Total LRTP Funding Gap = Total LRTP Cost Estimate minus Total LRTP Revenue Forecast
Based on the 2015-2040 needs analysis conducted for the 2015-2040 LRTP, as shown in Figure 10-2 the ODOT and partner estimated cost totals $37.4 billion and the projected 25-year revenue totals $28.5 billion. This results in an $8.9 billion funding gap and equates to a $356 million average annual funding gap. (Table 10-3)
Table 10-3. Estimated Costs and Forecasted Revenues for the 2015-2040 LRTP
Category Estimated Costs Projected Revenues
Difference (Millions of 2013 Dollars)
State Owned Assets/Functions
Bridges $3,703.0
Highways $16,848.9
Interchanges $2,925.0
Appurtenances 1
$8,756.2
State Subtotal $32,233.1 $24,239.0 $7,994.0
Partner Owned Assets/Functions 2
State participation
$2,421.0
Local, federal, other
$1,877.2
Partner Subtotal $5,202.2 $4,298.2 $904.0
2015-2040 LRTP TOTAL $37,435.3 $28,537.2 $8,898.0 1
Transportation appurtenances include the following functions and improvements within the ODOT ROW: intelligent transportation systems, maintenance, ports of entry, rest areas, safety, state owned railroads, at grade highway-railroad crossings, and weigh stations. 2
Partner entities include: Amtrak Heartland Flyer and private passenger rail operators; ACOG, INCOG and Lawton MPOs; Oklahoma cities, towns and counties; Oklahoma rural, urban and tribal transit providers; and the US Army Corps of Engineers.
MOVING OKLAHOMA FORWARD
10 – Estimated Costs and Forecasted Revenues
August 2015 Page 10-12
10.5. POTENTIAL EXAMPLES TO ADDRESS THE FUNDING GAP
As discussed above, the 2015-2040 LRTP projects that the estimated cost of transportation needs will exceed available revenue. For illustrative purposes, this section discusses the following select examples of potential additional revenue sources for transportation investment:
Example 1: Secure Increased Percentage of Motor Vehicle Revenue. The State of Oklahoma currently charges various fees and taxes on motor vehicles. These include charges for the registration of automobiles, farm trucks, and commercial vehicles, personalized license plates, house trailer licenses, rental taxes, bus mileage taxes, vehicle title fees, and overweight truck permits, among others.
To generate additional revenues for transportation investments, the State of Oklahoma would allocate a larger percentage of the revenues collected from these motor vehicle fees to transportation. Current fee levels and tax rates would not be increased under this example. Increasing the percentage of these revenues allocated to transportation investments, therefore, would result in a smaller percentage allocated to non-transportation uses.
Example 2: Increase Diesel Tax. The State of Oklahoma currently taxes gasoline at a rate of 17 cents per gallon (cpg) and diesel at a rate of 14 cpg.19 This example for additional transportation revenue would increase the state diesel tax rate by 3 cpg to 17 cpg, the same rate as imposed on gasoline. The revenues derived from the 3 cpg incremental tax on diesel fuel could be dedicated to improving critical freight routes.
Example 3: Freight Fees. Various revenue examples that specifically target freight-related activities are possible revenue generating candidates. Freight fee and tax
examples that Oklahoma could consider include the following:
– Container Fee. A fee could be established on some or all containers that move through Oklahoma.
– Freight Waybill Tax. A sales tax could be imposed on freight shipping costs.
– Weight and Distance Tax. An excise tax could be imposed on either the weight of freight moved (a ton-based tax) or as a function of both weight and distance (a ton-mile tax).
Example 4: Vehicle Miles Traveled (VMT) Fee. A VMT fee would charge drivers for the total number of miles traveled. As opposed to tolls, which are facility specific and not necessarily levied strictly on a per-mile basis, VMT fees are based on the distance driven on a defined network of roadways.
Example 5: Additional Tolling. Oklahoma could potentially toll additional facilities—existing or new—as a means to generate additional revenues for transportation. Oklahoma also could potentially toll its interstates; however, such authority is limited by the federal government.
The discussion of these examples is intended to facilitate further discussion as ODOT looks to address future transportation investment needs. None of these examples are recommended as part of this plan. To fully address long-term transportation investment costs in a financial sustainably manner, it is likely that ODOT would draw on a combination of increments to existing revenues, new revenue initiatives, and cost savings. Detailed analysis, stakeholder vetting, and thorough discussions would be undertaken prior to implementation of any new revenue option. In addition, each of these options would require specific legislative and potentially voter action prior to implementation.
MOVING OKLAHOMA FORWARD
10 – Estimated Costs and Forecasted Revenues
August 2015 Page 10-13
10.6. ENDNOTES 1 The State Highway System includes Interstate, U.S., and
Oklahoma (State) highways within the State of Oklahoma.
2 Further information on the breakdown of Costs for ODOT-
Owned Assets and Functions can be found in Sections 2 and 8 of the 2015 2040 LRTP Tech Memo Multimodal Needs.
3 Additional information about the ODOT revenue forecast is
available in the 2015-2040 LRTP Tech Memo Revenue Forecast.
4 Further information on the breakdown of estimated costs
and anticipated revenues for passenger rail can be found in Sections 2 and 8 of the 2015 2040 LRTP Tech Memo Multimodal Needs.
5Further information on the Transportation Alternatives
Program is available at the sites below. http://ok.gov/odot/About_ODOT/Contact_ODOT_Divisions/Local_Government_Division.html; http://www.fhwa.dot.gov/map21/factsheets/tap.cfm
6 Further information on the breakdown of estimated costs
and anticipated revenues for bicycle/pedestrian facilities can be found in Section 12 of the 2015 2040 LRTP Tech Memo Multimodal Needs.
7 Further information on the breakdown of costs and
anticipated revenues for rural transit can be found in Section 9.2.1 of the 2015 2040 LRTP Tech Memo Multimodal Needs.
8 According to the 2013 “Federal Aid Highway, Miles by
Ownership” publication, cities, towns, and counties in Oklahoma own 18,989 miles in the aggregate. http://www.fhwa.dot.gov/policyinformation/statistics/2013/pdf/hm14.pdf
9 Further information on the breakdown of costs and
anticipate revenues for urban transit can be found in Section 9.2.2 of 2015 2040 LRTP Tech Memo Multimodal Needs.
10 Further information on the estimated costs and anticipated
revenues for tribal transit can be found in Section 9.2.3 of the 2015 2040 LRTP Tech Memo Multimodal Needs.
11 Further information on needs, estimated costs, and
available revenue for intermodal transportation facilities can be found in Section 10 of the 2015 2040 LRTP Tech Memo Multimodal Needs.
12 Further information on estimated costs and anticipated
revenues for ports and waterways can be found in Section 11 of the 2015 2040 LRTP Tech Memo Multimodal Needs.
13 2015-2040 LRTP Revenue Forecast Scenarios Technical
Memorandum.
14 Historic revenues and funding sources are documented in
the spreadsheet tool that is a supplement to this technical memorandum.
15
FTA Section 5311 funds are requested by tribal entities through state DOTs. Once grants have been authorized, tribes may elect to have direct FTA or state oversight. Additionally, there are other federal tribal transportation funds that are provided directly to the tribes.
16 Federal transportation law requires that state DOT’s
provide a suballocation to large metropolitan planning organizations (MPOs) like ACOG and INCOG.
17 The 25-year projected transportation revenue totals $35.6
billion in current year dollars which equates to $26.7 billion in 2013 dollars (inflation-adjusted dollars). The adjustment for inflation assumes a 2 percent annual inflation factor (beginning with the FY2013 base year) based on recent trends and a review of inflation factors used in other state long range transportation plans.
18 Further information on the estimates of Partner Funds for
Partner Owned Programs and Functions can be found in Section 2.2 of the 2015 2040 LRTP Tech Memo Multimodal Needs.
19 The gasoline and diesel fuel tax rates each include a 1 cpg
underground storage tank fee.
August 2015
This page is intentionally left blank.