Embed Size (px)
Citation preview

Chapter 10
MEASUREMENT AND SCALING
IN MARKETING RESEARCH
371
Scaling is the generation of a broadly defined continuum on which measured objects arelocated (Peterson, 2000, p. 62). In Chapter 9, we established that some sort of scale—nominal,ordinal, interval, ratio—is necessarily involved every time a measurement is made.
This chapter continues our discussion of how scales are developed and how some ofthe more common scaling techniques and models can be used. The chapter focuses on broadconcepts of attitude scaling—the study of scaling for the measurement of managerial andconsumer or buyer perception, preference, and motivation. All attitude (and other psychological)measurement procedures are concerned with having people—consumers, purchasing agents,marketing managers, or whomever—respond to certain stimuli according to specified sets ofinstructions. The stimuli may be alternative products or services, advertising copy themes, pack-age designs, brand names, sales presentations, and so on. The response may involve which copytheme is more pleasing than another, which package design is more appealing than another, whatdo each of the brand names mean, which adjectives best describe each salesperson, and so on.
Scaling procedures can be classified in terms of the measurement properties of the final scale(nominal, ordinal, interval, or ratio), the task that the subject is asked to perform, or in still otherways, such as whether the emphasis is to be placed on subject, stimuli, or both (Torgerson, 1958).
This chapter begins with a discussion of various methods for collecting ordinal-scaled data(paired comparisons, rankings, ratings, etc.) in terms of their mechanics and assumptionsregarding their scale properties. Then specific procedures for developing the actual scalesthat measure stimuli and/or respondents are discussed. Techniques such as Thurstone Case Vscaling, semantic differential, the Likert summated scale, and the Thurstone differential scaleare illustrated. The chapter concludes with some issues and limitations of scaling.
DATA COLLECTION METHODS
Scaling methods may be classified by the level of scaling used to collect the data. In ordinalmeasurement methods, it is assumed that the basic data are only ordinal-scaled. Often, however,
10-Smith.qxd 9/1/2004 12:29 PM Page 371

some type of model is then applied to transform the ordinal data into an interval scale. Forexample, ordinal-scaled data with a given mean and standard deviation can be converted into astandard-score scale, with a mean of zero and a standard deviation of 1.0. A more general pro-cedure allows researchers to convert to a common scale with any specified mean and standarddeviation, say a mean of 50 and a standard deviation of 10 (Guilford & Fruchter, 1973). Theform of distribution will not change. This procedure does not normalize the distribution; thereare other procedures to do this.
In metric measurement methods, the respondent makes direct numerical judgments andit is assumed that the data are either interval- or ratio-scaled. In this method, models are alsoused at times to further refine the data. Models are typically directed toward finding the scalevalues most consistent with the input data. (Often the model will involve nothing more thana simple averaging of the original numerical responses.)
Ordinal Measurement Methods
The variety of ordinal measurement methods includes a number of techniques:
• Paired comparisons• Ranking procedures• Ordered-category sorting• Rating techniques
We discuss each of these data collection procedures in turn.
Paired Comparisons
As the name suggests, paired comparisons require the respondent to choose one of a pairof stimuli that “has more of,” “dominates,” “precedes,” “wins over,” or “exceeds” the otherwith respect to some designated property of interest. If, for example, six laundry detergentbrands are to be compared for “sudsiness”, a full set of paired comparisons (if order of pre-sentation is not considered) would involve (6 × 5) / 2, or 15, paired comparisons. Respondentsare asked which one of each pair has the most sudsiness. Obviously each respondent wouldhave to have used each brand, perhaps set up using an experiment design. A question formatfor paired comparisons is shown in Table 10.1. The order of presentation of the pairs and whichitem of a pair is shown first typically are determined randomly. The following are the brandnames (and numbers): Arrow (1), Zip (2), Dept (3), Advance (4), Crown (5), and Mountain (6).
The upper panel of Figure 10.1 illustrates how paired-comparison responses may berecorded for a single respondent. As noted from the figure, Brand 2 (Zip) dominates all theother five brands. This is shown by the fact that all of its paired comparisons with the remain-ing stimuli involve ls (arbitrarily letting row dominate column) in the table of original data.In the lower panel of Figure 10.1, rows and columns of the original table have been permu-tated to yield the stimulus rank over: 2, 1, 5, 6, 4, 3, from most suds to least suds. The totalnumber of votes received by each brand appears in the last column.
These hypothetical data are characterized by the fact that the respondent was transitivein making judgments, leading (after row and column permutation) to the triangular responsepattern of ls shown in the lower panel of the figure.
372— M E A S U R E M E N T
10-Smith.qxd 9/1/2004 12:29 PM Page 372

But what if the judgments are not transitive? For example, the respondent may say thatBrand 2 exceeds Brand 1, Brand 1 exceeds Brand 5, and Brand 5 exceeds Brand 2, leading towhat is called a circular triad. The presence of circular triads in a subject’s data requires theresearcher to examine two questions: (a) how serious are the subject’s violations of transitiv-ity; and (b) if not too serious, how can the data be made transitive with the fewest number ofalterations in the original paired-comparisons table?
Measurement and Scaling in Marketing Research— 373
Table 10.1 Example of Paired Comparisons Question
For each of the pairs of laundry detergent brands shown below, indicate which one has the most sudsiness:
a. Arrow ____ Zip ____b. Arrow ____ Advance ____c. Dept ____ Arrow ____d. Crown ____ Arrow ____e. Arrow ____ Mountain ____
.
.
.o. Crown ____ Mountain ____
Brand
1 2 3 4 5 6
1 X 0 1 1 1 12 1 X 1 1 1 13 0 0 X 0 0 04 0 0 1 X 0 05 0 0 1 1 X 16 0 0 1 1 0 X
Brand Original Data
Brand
2 1 5 6 4 3 Sum
2 X 1 1 1 1 1 51 0 X 1 1 1 1 45 0 0 X 1 1 1 36 0 0 0 X 1 1 24 0 0 0 0 X 1 13 0 0 0 0 0 X 0
* A cell value of 1 implies that the row brand exceeds the column brand, “0,” otherwise
Figure 10.1 Paired-Comparison Responses for a Single Subject*
Brand
(PermutatedRows andColumns)
10-Smith.qxd 9/1/2004 12:29 PM Page 373

Kendall (1962) has developed summary measures and statistical tests regarding the incidenceof tolerable levels of intransitivity. One may compute a coefficient of consistency and test thismeasure against the null hypothesis that the respondent is responding randomly. Slater (1961)and Phillips (1967) have described ways of finding the best rank order (one that least disturbsthe original paired-comparison judgments) in the presence of intransitive data. Of course, themotivation for using paired comparisons in the first place stems from the researcher’s interest inthe consistency of respondents’ choices; otherwise, the researcher might just as well have therespondent rank the six brands, thereby reducing labor (but forcing consistency within that setof choices). Obviously, from such a direct ranking, paired-preferences can be developed.
Other than the transitivity issue for more than two alternatives, there is a possibility thatrespondents’ judgments are not consistent or stable in that they prefer Brand A to B on onetrial but Brand B to A on another. In this situation there exists an underlying preferenceprobability distribution and multiple judgments are needed (Gottlieb, n.d.)
Implicit in the preceding discussion has been the assumption that the respondent mustforce a choice between each pair of brands. Variations in the method of paired comparisonsallow the subject to express indifference between members of the pair (i.e., to “tie” the stim-uli with respect to the property level of interest) or, after having chosen between members ofthe pair, to indicate on an intensity scale how much the chosen member of the pair exceedsthe other with regard to some designated property, such as sudsiness.
For another approach to paired comparison data collection see Exhibit 10.1.
EXHIBIT 10.1 Method of Choices
This method provides a procedure for indirectly arriving at paired-comparison proportions of theform p(B>A). Each respondent is presented with a set of n stimuli and is asked to indicate whichone appears greatest or largest on, or has the most of, the attribute or characteristic being stud-ied. The resulting data are the frequency with which each stimulus was the first choice. For anytwo stimuli X and Y, the sum of the two frequencies gives the total number or observations inwhich we know the result of comparing the two stimuli. The proportions of times that X appearedgreater than Y is given by
where f(x) is the number of times X was first choice and f(y) is the number of times Y was firstchoice.
For example, if stimulus X was the first choice of 10 respondents and stimulus Y the favoredchoice of 15 respondents.
All pairs of the stimuli can be analyzed in this manner to arrive at the matrix of preferenceproportions.
374— M E A S U R E M E N T
10-Smith.qxd 9/1/2004 12:29 PM Page 374

This method has some deficiencies. In the first place, full use is not made of the ranked datathat may be available—only top rankings are considered. Second, each proportion is based ondifferent subsets of respondents. In addition, the number of observations upon which each pro-portion is based will differ. Third, those stimuli that never receive a first choice cannot be scaled.Finally, this method does not provide for appropriate goodness-of-fit tests (Torgerson, 1958).
Ranking Procedures
Ranking procedures require the respondent to order stimuli with respect to some desig-nated property of interest. For example, instead of using the paired-comparison techniquefor determining the perceived order of six laundry detergents with respect to sudsiness,each respondent might have been asked to directly rank the detergents with respect to thatproperty. Similarly, ranking can be used to determine key attributes for services.
In a survey conducted during the 1990s, Subaru of America asked new Subaru carpurchasers questions regarding the purchase and delivery processes. One question requireda ranking procedure:
From the following list, please choose the three most important factors (other thanprice or deal) that attracted you to shop at this Subaru dealership. Please rank thesethree factors in order of importance to you by writing the number 1 in the box whichwas most important, followed by numbers 2 and 3 in the appropriate boxes. Rank threeboxes only.
a) Location ___ b) Previous c) Experiences d) Dealer’s experience ___ of others ___ reputation ___
e) Had specific model f) Financing ___ g) Advertising h) Service ___ you wanted ___ reputation ___
Subaru could just as easily have asked respondents to rank all eight items. One majorconcern in asking a ranking question is whether the number of items is too many for aperson to be able to make distinctions. If it is desired that a respondent rank all items, andthere are many to rank, one procedure would be to have the respondents first sort the itemsinto a number of piles (each of which has a relatively small and equal number of items, thatgo from high to low. Then, the request is made to rank within each pile. Unfortunately, thereis no set number of items that constitutes a maximum that people can easily handle. This willvary depending upon the stimuli (items) to be ranked, and where groupings (piles), or otheraid is used.
A variety of ordering methods may be used to order k items from a full set of n items.These procedures, denoted by Coombs (1964) as “order k/n” (k out of n), expand the reper-tory of ordering methods quite markedly. At the extremes, “order 1/2” involves a paired com-parison, while “order (n – 1)/n” involves a full rank order. The various ordering methods maypre-specify the value of k (“order the top three out of six brands with respect to sudsiness”)as illustrated by the Subaru study, or allow k to be chosen by the respondent (“select those ofthe six brands that seem to exhibit the most sudsiness, and rank them”).
Measurement and Scaling in Marketing Research— 375
10-Smith.qxd 9/1/2004 12:29 PM Page 375

Ordered-Category Sorting
Various data collection procedures are available that have as their purpose the assignment ofa set of stimuli to a set of ordered categories. For example, if 15 varieties of laundry detergentsrepresented the stimulus set, the respondent might be asked to complete the following task:
Please sort the 15 detergents into three sudsiness categories: (1) high suds, (2) moderate suds,and (3) low suds. Next, order the brands within each category from most suds to least suds.
Sorting procedures vary with regard to the following characteristics:
• The free versus forced assignment of stimuli to each category• The assumption of equal intervals between category boundaries versus the weaker assump-
tion of category boundaries that are merely ordered with regard to the attribute of interest
In ordinal measurement methods one assumes only an ordering of category boundaries. Theassumption of equal intervals separating boundaries is part of the interval/ratio measurementset of methods. Ordered-category sorting appears especially useful when the researcher is deal-ing with a relatively large number of stimuli (over 15 or so) and it is believed that a subject’sdiscrimination abilities do not justify a strict (no ties allowed) ranking of the stimulus objects.If the equal-intervals assumption is not made, it then becomes the job of the researcher to scalethese responses (by application of various models) to achieve stronger scales, if so desired.
Rating Techniques
Some data collection methods, most notably rating scales, are ambiguous. In some cases,the responses are considered by the researcher to be only ordinal, while in other cases, theresearcher treats them as interval- or ratio-scaled. The flexibility of rating procedures makesthem appropriate for either the ordinal or interval/ratio measurement data collection methods.
Rating measurement methods represent one of the most popular and easily applied datacollection methods in marketing research (Peterson, 2000). The task typically involves havinga respondent place that which is being rated (a person, object, or concept) along a continuumor in one of an ordered set of categories. Ratings allow the respondent to register a degreeor an amount of a characteristic or attribute directly on a scale. The task of rating is used in avariety of scaling approaches, such as the semantic differential and the Likert summated scale.
Rating scales can be either monadic or comparative. In monadic scaling, each objectis measured (rated) by itself, independently of any other objects being rated. In contrast,comparative scaling objects are evaluated in comparison with other objects. For example, anin-flight survey conducted by a major airline asked the following questions:
Please rate the service you received from the airline reservations agent.
Among Better About the Not as Amongthe Best Than Most Same as Most Good as Most the Worst
Courtesy/friendliness _____ _____ _____ _____ _____Knowledge/helpfulness _____ _____ _____ _____ _____Efficiency on completing _____ _____ _____ _____ _____transaction
376— M E A S U R E M E N T
10-Smith.qxd 9/3/2004 9:59 AM Page 376

The rating is monadic. The airlines then asked respondents another question:
Please rate today’s fight attendants compared to flight attendants on other airlines on eachof the following items.
• Courtesy/friendliness• Assistance in cabin before departure• Responsiveness to your needs• Availability throughout flight• Professional appearance• Tray pick up after meal
Ratings would again be completed using the same five response alternatives shownabove—among the best, better than most, about the same as most, not as good as most, amongthe worst. In this application, the rating is comparative.
Ratings are used very widely because they are easier and faster to administer and yield data thatare amenable to being analyzed as if they are interval-scaled. But there is a risk that when the par-ticular attributes are worded positively or are positive constructs, such as values, respondents willend-pile their ratings toward the positive end of the scale—this leads to little differentiation amongthe scores. Such lack of differentiation may potentially affect the statistical properties of the itemsbeing rated and the ability to detect relationships with other variables. McCarty and Shrum (2000)offer an alternative to simple rating. They compared two approaches to assessing personal valuesusing rating scales. Simple ratings were compared to an approach where respondents first pickedtheir most and least important values (or attributes or factors), and then rated them (most to least).The remainder of the values was then rated. Their results indicate that, compared with a simple rat-ing of values, the most-least procedure reduces the level of end-piling and increases the differenti-ation of values ratings, both in terms of dispersion and the number of different rating points used.
Rating methods can take several forms:
1. Numerical
2. Graphic
3. Verbal
Often two or more of these formats appear together, as illustrated in Figure 10.2. As shownin Panel (a) of the figure, the respondent is given both a series of integers (1 through 7) andverbal descriptions of the degree of “gentleness/harshness.” The respondent would then beasked to circle the number associated with the descriptive statement that comes closest to his orher feelings about the gentleness/harshness of the brand(s) of say, dishwasher detergent, beingrated. In Panel (b) of Figure 10.2, the need is only to check the appropriate category that bestexpresses feelings about some attitude statement regarding dishwashing detergents, whereas inPanel (e) the category checked represents the importance of characteristics of a retail store.
In Panel (c), the figure represents a graduated thermometer scale with both numerical assign-ments and a (limited) set of descriptive statements. This illustrates another type of rating device.A so-called “feelings thermometer” is illustrated in Exhibit 10.2 (see p. 380) and is a type ofpure numerical scale. A pure numerical version would ask respondents to rate objects on somecharacteristic using a scale of, say, 1 to 10, (or 1 to 100), where the number 10 (100) representsthe most favorable (or most unfavorable) position. It is assumed that this numerical scale has
Measurement and Scaling in Marketing Research— 377
10-Smith.qxd 9/1/2004 12:29 PM Page 377

(a) (b)
7 Very Gentle ____ I definitely agree with the statement
6 Somewhat Gentle ____ I generally agree with the statement
5 Slightly Gentle ____ I moderately agree with the statement
4 Neither Gentle nor Harsh ____ I moderately disagree with the statement
3 Slightly Harsh ____ I generally disagree with the statement
2 Somewhat Harsh ____ I definitely disagree with the statement
1 Very Harsh
(c) (d)
13 Definitely Would Buy Definitely the Best12
11 One of the Best Available10
9 Considerably Better Than Average8
7 May or May Not Buy Slightly Better Than Average6
5 About Average4
3 Below Average2
1 Definitely Would Not Buy
Very Somewhat Somewhat Not at All (e) Important Important Neutral Unimportant Important
Cleanliness of store _________ _________ _________ _________ _________
Location _________ _________ _________ _________ _________
more than ordinal properties. This scale may properly be viewed as a metric measurement(quantitative judgment) method. Panel (d) attempts to anchor the scale using a comparison withthe “average” brands. Many other types of rating methods are in use (Haley & Case, 1979).
One type of itemized rating scale that has merit in cases where leniency error may betroublesome is the behaviorally-anchored rating scale, or BARS (see Exhibit 10.3 on p. 381).This scale uses behavioral incidents to define each position on the rating scale rather thanverbal, graphic, or numeric labels. The underlying premise is that response biases may emergesince scale positions on most graphic rating scales are vague and undefined. Thus, providingspecific behavioral anchors can reduce leniency errors and increase discriminability.Developing scales such as these requires a great amount of testing and refinement to find theright anchors for the situation under examination.
378— M E A S U R E M E N T
Figure 10.2 Examples of Rating Scales Used in Marketing Research
10-Smith.qxd 9/1/2004 12:29 PM Page 378

The basic process of BARS scale development consists of four steps:
1. Construct definition—the construct being measured must be explicitly defined and thekey dimensions identified.
2. Item generation—statements must be generated describing actual behaviors that wouldillustrate specific levels of the construct for each dimension identified.
3. Item testing—items must be tested; the purpose is to be able to unambiguously fitbehavioral statements to dimensions.
4. Scale construction—the process of laying out the scale with behavioral statements asanchors follows item testing.
In following this process, sets of judges are used. It should be clear that developing BARSis a time-consuming and costly task. Thus, they should be reserved for those applied settingswhere they can minimize the errors they are designed to curtail, especially leniency error. Asan example, families with elderly members were surveyed to determine their need for in homehealth-care services. BARS was used for one critical measure of how well elderly membersof the household were able to perform everyday living activities:
Now about your ability to perform everyday living activities. Which of the following bestdescribes your everyday living capacities:
• You can perform all physical activities of daily living without assistance. (Excellentcapacity)
• You can perform all physical activities without assistance, but may need some helpwith the heavy work (such as laundry and housekeeping). (Good capacity)
• You regularly require help with certain physical activities or heavy work, but can getthrough any single day without help. (Moderate capacity)
• You need help each day, but not necessarily throughout the day or night. (Severelyimpaired capacity)
• You need help throughout the day and night to carry out the activities of daily living.(Completely impaired capacity)
In many instances where rating scales are used, the researcher assumes not only thatthe items are capable of being ranked, but also that the descriptive levels of progress arein equal-interval steps psychologically. That is, the numerical correspondences shown inPanels (a) and (c) of Figure 10.2 may be treated—sometimes erroneously—as interval- orratio-scaled data. Even in cases represented by Panels (b), (d), and (e), it is not unusual to findthat the researcher assigns successive integer values to the various category descriptions andsubsequently works with the data as though the responses were interval-scaled.
Treating rating scales as interval or even ratio measurements is a practice that is welldocumented and widespread. Research shows that there is little error in treating the data asbeing of a higher level of measurement than it is. Research evidence supports this practice,in that often when ordinal data are treated as interval and parametric analysis are used, theconclusions reached are the same as when the data are treated as ordinal and tested usingnon-parametric analyses.
Measurement and Scaling in Marketing Research— 379
10-Smith.qxd 9/1/2004 12:29 PM Page 379

EXHIBIT 10.2 A Rating Thermometer
Sudman and Bradburn (1983, p. 159) present the following rating thermometer, with an intro-ductory statement, “We’d also like to get your feelings about some groups in American society.When I read the name of a group, we’d like you to rate it with what we call a feelingthermometer. It is on Page 19 of your booklet. Ratings between 50° and 100° mean that you feel
380— M E A S U R E M E N T
A Big Business S Labor unions
B Poor people T Young people
C Liberals U Conservatives
D Southerners V Women’s liberationmovement
E Hispanics/Mexican W People who Americans use marijuana
F Catholics X Black militants
G Radical students Y Jews
H Policemen Z Civil rights leaders
J Older people AA Protestants
K Women BB Workingmen
M The military CC Whites
N Blacks DD Men
P Democrats EE Middle-class people
Q People on welfare FF Businessmen
R Republicans
100° Very warm or favorable feeling
85° Quite warm or favorable feeling
70° Fairly warm or favorable feeling
60° A bit more warm or favorable than cold feeling
50° No feeling at all
40° A bit more cold or unfavorable than warm feeling
30° Fairly cold or unfavorable feeling
15° Quite cold or unfavorable feeling
0° Very cold or unfavorable feeling
10-Smith.qxd 9/1/2004 12:29 PM Page 380

favorably and warm toward the group; ratings between 0° and 50° mean that you don’t feelfavorably and warm toward the group and that you don’t care too much for that group. If youdon’t feel particularly warm or cold toward a group, you would rate them a 50°. If we cometo a group you don’t know much about, just tell me and we’ll move on to the next one. Ourfirst group is Big Business—how warm would you say you feel toward them? (Write numberof degrees or DK (don’t know) in boxes provided below.)”
Research on use of the feeling thermometer tends to validate its use, even though must of thevariance is left unexplained (Wilcox, Sigelman, & Cook, 1989). This may be due to random noise,idiosyncratic factors hard to measure by the survey method, and a type of response set that paral-lels some respondents’ habitual tendency to answer “yes” regardless of question type. The primaryeffects observed were shown to be substantively interpretable.
Since the scale has been shown to be valid for evaluating social and other types of groups, itshould be of usefulness to marketing researchers. Oftentimes, target groups, segments, and soforth, are evaluated along different dimensions of interest to the marketing manager.
EXHIBIT 10.3 Measuring Preferences of Young Children Calls for Creativity
The children’s market is a multibillion dollar market in direct purchasing power and an evengreater market in purchasing influence. Thus, it is important that companies wishing to gaina competitive advantage in understanding and responding to children’s preferences be able tomeasure such preferences. In a fairly recent study of companies marketing to children, the devel-opment of better measurement technique was identified as a major priority for future research bya majority of responding companies.
Among the areas of most concern are better scaling techniques for measuring children’s prod-uct preferences. Widely used approaches for assessing children’s preferences are itemized ratingscales using a series of stars (a scale from 1 to 5 stars) or a series of facial expressions (a scaleanchored at one end with a happy face and at the other end with a sad face), as illustrated below:
A. Facial Scale
B. Star Scale
***** **** *** ** *
Children are asked to indicate how much they like a product, or how much they like aparticular feature of a product, by pointing to one of the visual anchors on the scale. Theseresponses are then analyzed to determine which products children like best and which featuresthey prefer in particular products.
Measurement and Scaling in Marketing Research— 381
A B C D E F G
10-Smith.qxd 9/1/2004 12:29 PM Page 381

Although these scales have done well in varied research applications, there are some problemsthat emerge, particularly when used with young children under the age of eight. A major poten-tial problem is leniency error. This error emerges when young children consistently use theextreme positions (usually on the positive side) with relatively little use of intermediate scale posi-tions. If this is done for all products tested, the overall sensitivity of existing (traditional) ratingscales is lowered, resulting in inconclusive findings about children’s preferences. Regardless of thereasons for this bias—and there are some alternative explanations—it is important that its poten-tial for existence be acknowledged and reduced.
One type of scale that has been introduced to reduce leniency error in young children’s ratingsis an itemized rating scale based on the concept of behaviorally-anchored rating scales (BARS).
Behaviorally-anchored rating scales use critical behavioral incidents to define various positionson the rating scale, instead of the more usual verbal labels or graphic devices such as stars or faces.The use of behavioral anchors would appear to be useful in studying children’s markets since theyprovide a familiar and concrete way of expressing preferences and can be readily displayed in avisual format for young children.
One illustration of behaviorally-anchored scales is a study of children’s preferences for cerealsin which the scale used pictures depicting sharing and shopping behavior, rather than verbaldescriptions of behavior. The children studied were less than eight years of age. These two BARSwere effective in lowering leniency bias when tested against the more usual facial and star scales.
The extent to which creative researchers can develop such scales for use in children’s marketsis almost limitless. When older children are of concern, the more traditional type of BARS (withverbalized descriptions of behavior for each scale position) can be used (Karsten & John, 1991).
In Chapter 9 we illustrated some of the problems associated with treating ordinal data asinterval- or ratio-scaled data. Although methods are available for scaling the stimuli underweaker assumptions about the intervals that separate category labels (as mentioned earlierunder ordered-category sorting), in practice these methods are often cumbersome to use and,accordingly, may not justify the time and effort associated with their application. However,this should not negate the importance of being aware of the implicit assumptions that one
382— M E A S U R E M E N T
10-Smith.qxd 9/1/2004 12:29 PM Page 382

makes about the scale properties of rating instruments when certain statistical techniques areused to summarize and interrelate the response data.
Table 10.2 identifies nine questions that must be identified and answered when a scale isconstructed.
These questions may be related. For example, questions 2 and 3 are obviously related.Similarly questions 2 and 7 also appear to be related. A series of experiments involving themiddle response alternative in general—neutral scale item, middle position of the scale, andso forth—showed that (a) people are more likely to select it when it is part of the scale thanthey are to volunteer it; (b) the order in which it is presented in the scale question andresponse set can make a difference in results; and (c) people who choose the middle alterna-tive when available would not necessarily answer the question in the same way that others doif forced to choose sides on the matter of concern (Bishop, 1987).
More recent research on the neutral option is inconclusive (Nowlis, Kahn, & Dhar, 2002).A conclusion is reached that consumer responses can be significantly altered by excludinga neutral position when respondents are ambivalent. Further, the study showed that scalesexcluding this option produce a different response from scales that include it. The question tobe answered is which of the two scales—neutral-included or neutral-excluded—is likely tobest reflect the underlying attitudes. Unfortunately, the researchers were reluctant to statewhich would most accurately reflect the truth. Since it has not been shown that there areerrors made when a neutral option is provided, our suggestion is that it always be included,unless the researcher has a compelling reason to not do so (e.g., the problem situation/samplemix is such that each sample member can be expected to have a non-neutral attitude).Expected voting in a survey of voters is an example.
Question 4 deals with an interesting issue. Balance refers to having an equal number ofnegative response alternatives as positive ones. Or the alternatives may just be in oppositedirections from some mid-point. When using importance scales for attributes, the alter-natives provided may be “very important,” “important,” “neither important nor unimportant,”“unimportant,” and “very unimportant,” or additional categories may be included. ThomasSemon (2001) has questioned the use of balance (or symmetry, as he calls it) in importance
Measurement and Scaling in Marketing Research— 383
Table 10.2 Issues in Constructing a Scale
1. Should negative numbers be used?2. How many categories should be included?3. Related to the number of categories is: Should there be an odd number or an even number?
That is, should a neutral alternative be provided?4. Should the scale be balanced or unbalanced?5. Is it desirable to not force a substantive response by giving an opportunity to indicate
“don’t know,” “no opinion,” or something similar?6. What does one do about halo effects—that is, the tendency of raters to ascribe favorable property
levels to all attributes of a stimulus object if they happen to like a particular object in general?7. How does one examine raters’ biases—for example, the tendency to use extreme values or,
perhaps, only the middle range of the response scale, or to overestimate the desirablefeatures of the things they like (i.e., the generosity error)?
8. How should descriptive adjectives for rating categories be selected?9. How anchoring phrases for the scale’s origin should be chosen?
10-Smith.qxd 9/1/2004 12:29 PM Page 383

scales. He argues that importance is not a bipolar concept. Importance ranges from somepositive amount to none, not a negative amount. Although this appears to have conceptualappeal, researchers continue to successfully use importance scales from some mid-point—specified or implied. There would seem to be three keys to successful importance scale use:
1. Isolating any findings of unimportance
2. Recognizing that importance is ordinally scaled
3. Accurately interpreting the relative nature of importance findings
Answers to questions such as these will vary by the researcher’s approach, and by theproblem being studied. For example, there are many alternative response categories that canbe used to measure satisfaction. Table 10.3 shows just a few. The effects of research designon reliability and validity of rating scales are discussed in two excellent review papers(Churchill and Peter, 1984; Peter and Churchill, 1986).
In summary, rating methods—depending on the assumptions of the researcher—can beconsidered to lead to ordinal-, interval-, or even ratio-scaled responses. The latter two scalesare taken up next. We shall see that rating methods figure prominently in the development ofquantitative-judgment scales.
Ratio/Interval Procedures
Direct-judgment estimates, fractionation, constant sum, and rating methods (if theresearcher wishes to assume more than ordinal properties about respondents’ judgments) areall variants of ratio/interval procedures or metric measurement methods.
Direct-Judgment Methods
In direct-judgment methods, the respondent is asked to give a numerical rating to eachstimulus with respect to some designated attribute. In the unlimited-response category sub-case, the respondent is free to choose his or her own number or, in graphical methods, to inserta tick mark along some line that represents his or her judgment about the magnitude of the
384— M E A S U R E M E N T
Table 10.3 Alternative Scales for Measuring Satisfaction
1. A numerical scale from 1 to 7 where 1 = completely satisfied and 7 = completely dissatisfied2. A percentage scale using the following categories: 91–100, 81–90, 71–80, 61–70, 51–603. A verbal scale using the following choices: very satisfied, somewhat satisfied, somewhat
dissatisfied, very dissatisfied, uncertain4. A verbal scale using the following: very satisfied, somewhat satisfied, unsatisfied, very unsatisfied5. A verbal scale using the following: completely satisfied, very satisfied, fairly satisfied,
somewhat dissatisfied, very dissatisfied6. A verbal scale using the following: very satisfied, quite satisfied, not very satisfied,
not at all satisfied7. A verbal scale using the following: very satisfied, somewhat satisfied, not at all satisfied
10-Smith.qxd 9/1/2004 12:29 PM Page 384

stimulus relative to some reference points. This is illustrated in Panel (a) of Figure 10.3 forthe rating of Brand A.
This is a simplified version of a magnitude scale, which is based on psychological scaling(Lodge, 1981). It is an alternative to category scaling. This method has been studied for usein a semantic differential context (to be discussed later in this chapter) and was found to haveadvantages in individual measurement without affecting aggregate properties of the measure-ment (Albaum, Best, & Hawkins, 1981). Another study showed that these unlimited responsescales, also known as continuous-rating scales, appear to be insensitive to fluctuations in thelength of the line used (Hubbard, Little, & Allen, 1989).
The limited-response category subcase is illustrated by Panel (b) in Figure 10.3. Here therespondent is limited to choosing one of seven categories. We note that in this instance thedirect-judgment method is nothing more than a straight rating procedure, with the importantaddition that the ratings are now treated as either interval- or ratio-scaled data (depending onthe application) rather than as simple ratings.
Measurement and Scaling in Marketing Research— 385
Direct Judgment: Direct Judgment:
(a) Unlimited-Response Categories (b) Limited-Response Categories
(Brand A)
(c) Fractionation (d) Constant Sum
“Compare each brand to the Relative degree of sudsiness “Assign 100 points across standard: Brand A is assumed compared to Brand A the five brands so as to to be 1.0” reflect your relative degree
of liking for them”
Brand Response Brand Response
B 0.75 A 20C 0.80 B 25D 2.4 C 10E 0.5 D 5
E 40100
7 Like very much
6
5 (Brand A)
4
3
2
1 Don’t like at all
Figure 10.3 Some illustrations of Interval-Ratio Scale
10-Smith.qxd 9/1/2004 12:29 PM Page 385

If the respondent has several items to rate, either the unlimited- or limited-response categoryprocedures can be employed. In the former case, the respondent arranges the stimuli (usuallydescribed on small cards) along a sort board, provided by the researcher, so that each is sepa-rated according to a subjective distance relative to the others. In the latter case, one assigns cardsto the designated category on the sort board that best matches one’s evaluation of the stimulus.
Fractionation
Fractionation is a procedure in which the respondent is given two stimuli at a time (e.g., astandard laundry detergent and a test brand) and asked to give some numerical estimate of theratio between them, with respect to some attribute, such as sudsiness.
The respondent may answer that the test brand, in his or her judgment, is three-fourths assudsy as the standard. After this is done, a new test brand is compared with the same standard,and so on, until all test items are judged. Panel (c) in Figure 10.3 illustrates this procedure.
In other cases where the test item can be more or less continuously varied by the respon-dent, the respondent is asked to vary the test item so that it represents some designated ratioof the standard. For example, if the attribute is sweetness of lemonade, the respondent maybe asked to add more sweetener until the test item is “twice as sweet” as the standard.
Constant Sum
Constant-sum methods have become quite popular in marketing research, primarilybecause of their simplicity and ease of instructions. In constant-sum methods the respondentis given some number of points—typically 10 or 100—and asked to distribute them over thealternatives in a way that reflects their relative magnitude of some attitudinal characteristic.Panel (d) of Figure 10.3 shows an illustration of the constant-sum procedure. Constant sumforces the respondent to allocate his or her evaluations and effectively standardizes each scaleacross persons, since all scores must add to the same constant. As such, the constant-sum pro-cedure requires the respondent to make a comparative evaluation of the stimuli. Generally, itis assumed that a subjective ratio scale is obtained by this method.
In a study of its customers and noncustomers, a local bank asked the following question:
Please divide 100 points among the characteristics listed below to indicate how importanteach is to you in doing business with a financial institution. The more important a trait is toyou, the more points you should give it. You may give as many or as few points as you like.
Number of PointsThe bank is locally owned _________Friendly, helpful personnel _________Conveniently located _________Offers a full range of financial services _________Price of its services _________Decisions are made locally _________Must total to 100
To sum it up, unlike ordinal measurement methods, the major assumption underlyingratio/interval measurement methods is that a unit of measurement can be constructed directly
386— M E A S U R E M E N T
10-Smith.qxd 9/1/2004 12:29 PM Page 386

from respondents’ estimates about scale values associated with a set of stimuli. The respondent’sreport is taken at face value and any variation in repeated estimates (over test occasions withinrespondent or over respondents) is treated as error; repeated estimates are usually averagedover persons and/or occasions.
The problems associated with interval-ratio scaling methods include the following:
1. Respondents’ subjective scale units may differ across each other, across testing occasions,or both.
2. Respondents’ subjective origins (zero points) may differ across each other, acrossoccasions, or both.
3. Unit and origin may shift over stimulus items within a single occasion.
These problems should not be treated lightly, particularly when data for several subjectsare being averaged.
In addition, researchers should be aware of the constraints placed on the respondent’sresponse format. For example, if asked to rate laundry detergents on a five-point scale, rang-ing from 1 (“least sudsy”), to 3 (“moderate sudsy”), to 5 (“sudsiest”), the respondent maynot be capable of accurately carrying out the task. That is, one’s subjective distance betweenthe sudsiest detergent and the moderate detergent(s) may not equal one’s perception of thedistance between the moderate detergent(s) and the least sudsy detergent.
Most ratings measurement methods have the virtue of being easy to apply. Moreover, littleadditional work beyond averaging is required to obtain the unit of measurement directly.Indeed, if a unique origin can be established (e.g., a zero level of the property), then theresearcher obtains both an absolute origin and a measurement unit. As such, a subjective ratioscale is obtained.
TECHNIQUES FOR SCALING STIMULI
Any of the data collection methods just described—whether for the measurement of rankingor ratings data—produce a set of raw-data responses. In the case of ranking methods, the rawdata, describing ordinal-scaled judgments, usually undergo a further transformation (via ascaling model) to produce set of scale values that are interval-scaled. Technically speaking,the raw data obtained from ratings methods also require an intervening model. However, inthis case the model may be no more elaborate than averaging the raw data across respondentsand/or response occasions.
Thurstone’s Case V method is a popular model for dealing with ordinal data obtained fromranking methods. Osgood’s semantic differential is an illustration of a procedure for dealingwith raw data obtained from interval-ratio scale ratings methods. We consider each of thesetechniques in turn.
Case V Scaling
Thurstone’s Case V Scaling model, based on his law of comparative judgment, permits theconstruction of a unidimensional interval scale using responses from ordinal measurementmethods, such as paired comparisons (Thurstone, 1959). This model can also be used to scale
Measurement and Scaling in Marketing Research— 387
10-Smith.qxd 9/1/2004 12:29 PM Page 387

ranked data or ordered-category sorts. Several subcases of Thurstone’s model have beendeveloped. We shall first describe the general case and then concentrate on Case V, a specialversion particularly amenable to application in marketing situations.
Essentially, Thurstone’s procedure involves deriving an interval scale from comparativejudgments of the type “A is fancier than B,” “A is more prestigious than B,” “A is preferredto B,” and so on. Scale values may be estimated from data in which one individual makesmany repeated judgments on each pair of a set of stimuli or from data obtained from a groupof individuals with few or no replications per person.
The concept that underlies the model of comparative judgment on which Case V scaling isbased is simple to describe. Suppose that we have a group of respondents, almost all of whomprefer A to B. Then the proportion of total comparisons (no ties allowed) in which A is pre-ferred to B will be close to 100 percent. Suppose, however, that when B is compared with C,only 55 percent of the group prefers B to C. Intuitively, we might think that the differencebetween the scale values associated with A and B should be much larger than the differencebetween the scale values associated with B and C. Under certain assumptions, Thurstone’smodel of comparative judgment provides a means to develop an interval scale from thesestimulus-comparison proportions.
An example should make the Case V procedure easier to follow. Assume that 100homemakers were asked to compare five brands of canned tomato juice with respect to“overall goodness of flavor.” The homemakers sipped a sample of each brand paired with asample of every other brand (a total of 10 pairs) from paper cups that were marked merelywith identifying numbers. Table 10.4 shows the empirically observed proportion for eachcomparison.
From this table we see that 69 percent of the respondents preferred Juice C to Juice A andthe remainder, 31 percent preferred Juice A to Juice C (if we arbitrarily let column dominaterow). It is customary to set self-comparisons (the main-diagonal entries of Table 10.4) to 0.5;this has no effect on the resulting scale values (Edwards, 1957). From the data of this tablewe next prepare Table 10.5, which summarizes the Z-values appropriate for each proportion.These Z-values were obtained from Table A.1 in Appendix A at the end of this book. If theproportion is less than 0.5, the Z-value carries a negative sign; if the proportion is greater than0.5, the Z-value carries a positive sign. The Z-values are standard unit variates associated witha given proportion of total area under the normal curve. The Thurstonian model assumesnormally distributed scale differences in mean = 0 and standard deviation = 1.0.
For example, from Table 10.4 we note that the proportion of respondents preferringJuice B over Juice A is 0.82. We wish to know the Z-value appropriate thereto. This valuelabeled Z in the standard unit normal table of Table A.1 is 0.92. That is, 82 percent of thetotal area under the normal curve is between Z = – ∞ and Z = 0.92. All remaining entries inTable 10.5 are obtained in a similar manner, a minus sign being prefixed to the Z-valuewhen the proportion is less than 0.5.
Column totals are next found for the entries in Table 10.5. Scale values are obtained fromthe column sums by taking a simple average of each column’s Z-values. For example, fromTable 10.5, we note that the sum of the Zs for the first column (Juice A) is –0.36. The averageZ for column A is simply:
388— M E A S U R E M E N T
10-Smith.qxd 9/1/2004 12:29 PM Page 388

This scale value expresses Juice A as a deviation from the mean of all five scale values.The mean of the five values, as computed from the full row of Zs, will always be zero underthis procedure. Similarly, we find the average Z-value for each of the remaining four columnsof Table 10.5.
Next, since the zero point of an interval scale is arbitrary, we can transform the minimumscale so that it becomes zero. We will let Juice D (RD = ZD = –0.674) be the reference point(or origin) of zero by adding .674. We then simply add 0.674 to each of the other Z-values toobtain the Case V scale values of the other four brands. These are denoted by R and appearin the last row of Table 10.5.
The scale values of Juices A through E indicate the preference ordering
B > C > A > E > D
Moreover, assuming that an interval scale exists, we can say, for example, that the differ-ence in “goodness of flavor” between Juices B and A is 2.3 times the difference in “goodnessof flavor” between Juices C and A, since
B – A = 2.3 (C – A)
1.484 – 0.602 = 2.3 (0.984 – 0.602)
0.882 = 2.3 (0.382)
(within rounding error).
Measurement and Scaling in Marketing Research— 389
Table 10.4 Observed Proportions Preferring Brand X (Top of Table) to Brand Y (Side of Table)
Preferred Brand
Brand A B C D E
A 0.50 0.82 0.69 0.25 0.35B 0.18 0.50 0.27 0.07 0.15C 0.31 0.73 0.50 0.16 0.25D 0.75 0.93 0.84 0.50 0.59E 0.65 0.85 0.75 0.41 0.50
Table 10.5 Z-Values Related to Preference Proportions in Table 10.4
Brand
Brand A B C D E
A 0 0.92 0.50 –0.67 –0.39B –0.92 0 –0.61 –1.48 –1.04C –0.50 0.61 0 –0.99 –0.67D 0.67 1.48 0.99 0 0.23E 0.39 1.04 0.67 –0.23 0
Total –0.36 4.05 1.55 –3.37 –1.87Mean (Z) –0.072 0.810 0.310 –0.674 –0.374
R 0.602 1.484 0.984 0 0.300
10-Smith.qxd 9/1/2004 12:29 PM Page 389

The test of this model is how well scale values can be used to work backward—that is,to predict the original proportions. The Case V model appears to fit the data in the examplequite well. For any specific brand, the highest mean absolute proportion discrepancy is0.025 (Juice A). Moreover, the overall mean absolute discrepancy is only .02 (rounded).Even the simplest version (Case V) of the Thurstonian model leads to fairly accurate pre-dictions. The R* scale values of the Case V model preserve the original rank ordering of theoriginal proportions data.
Another approach to obtain numerical scores from rankings is shown in Exhibit 10.4.
EXHIBIT 10.4 Converting Ranks into Scale Values
Another approach to convert ranks into numerical scores is based on the assumption that truedifferences between adjacent objects ranked near the extremes tend to be larger than differencesbetween objects falling near the middle of the rank. Specifically, we can view relative differencesamong ranked objects as being similar to differences between the standardized or Z-valuesfalling at the boundary points of N–1 equally probable intervals falling in the midrange of anormal distribution. We would like the interval between each adjacent pair of ranks (e.g., 1 and2, 7 and 8) to define an interval corresponding to 100/N of cases in a normal distribution. Finally,we arbitrarily set 100/2N as the percentage of cases in a normal distribution to be cut below thevalue of the object ranked I and above the value of the object ranked N.
We can proceed as follows. For any stimulus object (such as a brand of soap) that has beenranked j, we find from the normal tables the Z-score cutting off the lower proportion of the areaunder the normal curve. Using this procedure we determine the Z-values for 10 brands of soap(A–J) as follow:
Brand Rank Percentile Z-Value
C 1 5 –1.65E 2 15 –1.04A 3 25 –.67D 4 35 –.39F 5 45 –.13H 6 55 .13G 7 65 .39J 8 75 .67I 9 85 1.04B 10 95 1.65
For Brand E, for example, we find that the lower (2 – 5)/10 or .15 proportion of the areaunder the normal curve corresponds to a Z-value of –1.04. The end result is that the originalranks have been transformed into scale values, which can then be treated as if they wereintervally-scaled.
390— M E A S U R E M E N T
10-Smith.qxd 9/1/2004 12:29 PM Page 390
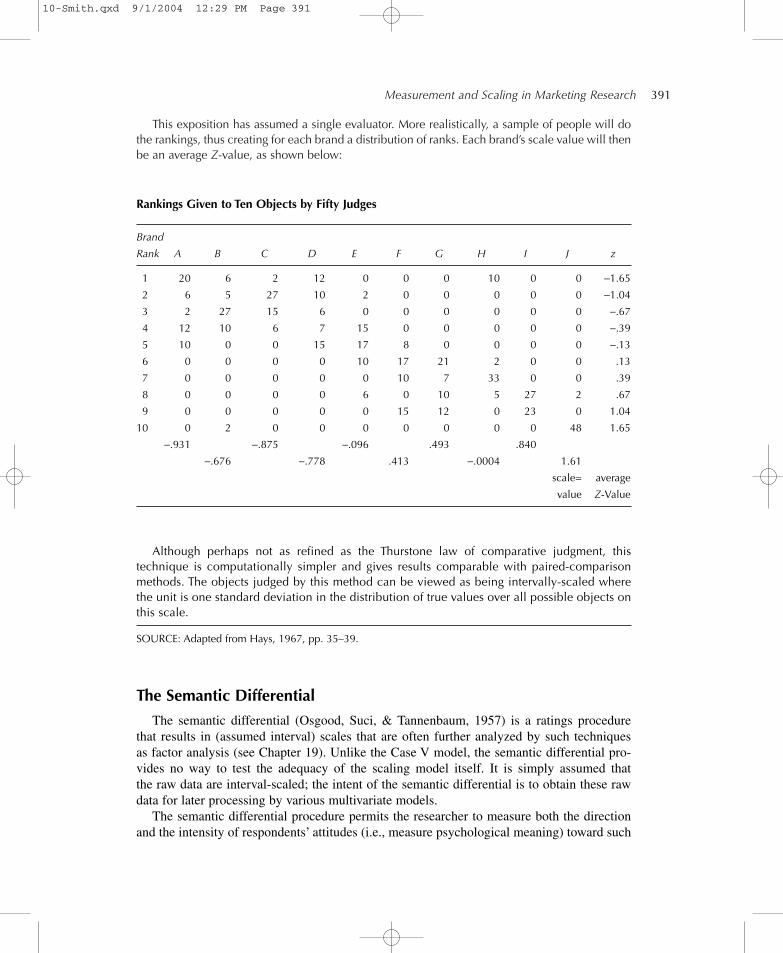
This exposition has assumed a single evaluator. More realistically, a sample of people will dothe rankings, thus creating for each brand a distribution of ranks. Each brand’s scale value will thenbe an average Z-value, as shown below:
Measurement and Scaling in Marketing Research— 391
Rankings Given to Ten Objects by Fifty Judges
Brand
Rank A B C D E F G H I J z
1 20 6 2 12 0 0 0 10 0 0 −1.65
2 6 5 27 10 2 0 0 0 0 0 −1.04
3 2 27 15 6 0 0 0 0 0 0 −.67
4 12 10 6 7 15 0 0 0 0 0 −.39
5 10 0 0 15 17 8 0 0 0 0 −.13
6 0 0 0 0 10 17 21 2 0 0 .13
7 0 0 0 0 0 10 7 33 0 0 .39
8 0 0 0 0 6 0 10 5 27 2 .67
9 0 0 0 0 0 15 12 0 23 0 1.04
10 0 2 0 0 0 0 0 0 0 48 1.65
−.931 −.875 −.096 .493 .840
−.676 −.778 .413 −.0004 1.61
scale= average
value Z-Value
Although perhaps not as refined as the Thurstone law of comparative judgment, thistechnique is computationally simpler and gives results comparable with paired-comparisonmethods. The objects judged by this method can be viewed as being intervally-scaled wherethe unit is one standard deviation in the distribution of true values over all possible objects onthis scale.
SOURCE: Adapted from Hays, 1967, pp. 35–39.
The Semantic Differential
The semantic differential (Osgood, Suci, & Tannenbaum, 1957) is a ratings procedurethat results in (assumed interval) scales that are often further analyzed by such techniquesas factor analysis (see Chapter 19). Unlike the Case V model, the semantic differential pro-vides no way to test the adequacy of the scaling model itself. It is simply assumed thatthe raw data are interval-scaled; the intent of the semantic differential is to obtain these rawdata for later processing by various multivariate models.
The semantic differential procedure permits the researcher to measure both the directionand the intensity of respondents’ attitudes (i.e., measure psychological meaning) toward such
10-Smith.qxd 9/1/2004 12:29 PM Page 391
Extremely Extremely
Powerful X _______ ______ ______ ______ ______ ______ Weak
Reliable ______ ______ X ______ ______ ______ ______ Unreliable
Modern ______ ______ X ______ ______ ______ ______ Old-fashioned
Warm ______ _______ ______ ______ X ______ ______ Cold
Careful ______ X ______ ______ ______ ______ ______ Careless
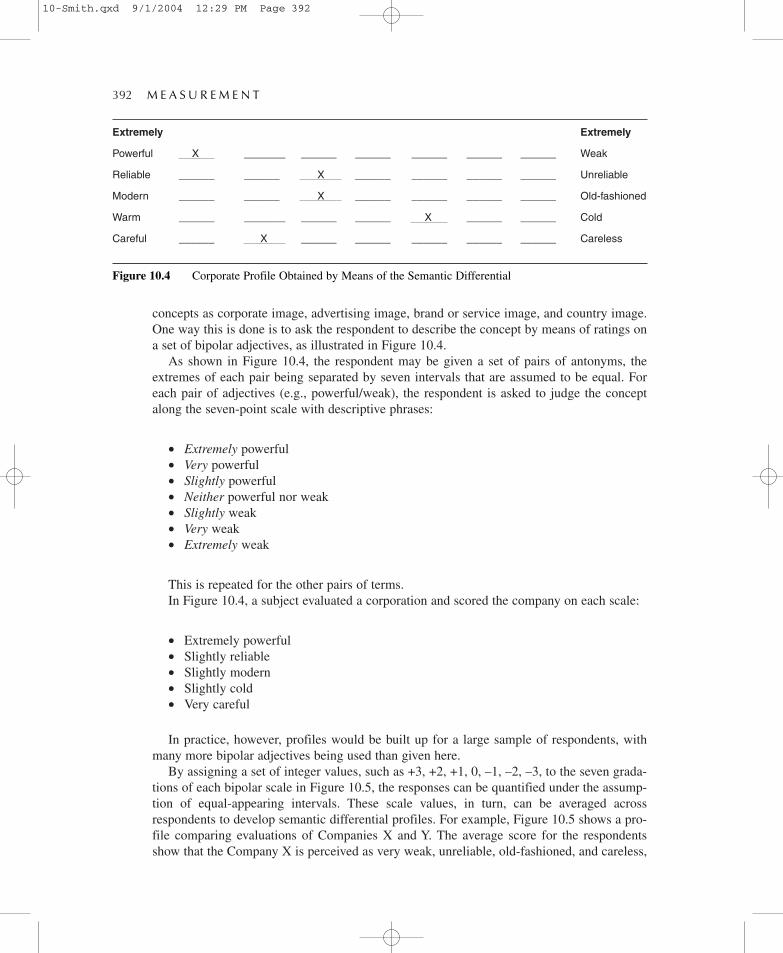
concepts as corporate image, advertising image, brand or service image, and country image.One way this is done is to ask the respondent to describe the concept by means of ratings ona set of bipolar adjectives, as illustrated in Figure 10.4.
As shown in Figure 10.4, the respondent may be given a set of pairs of antonyms, theextremes of each pair being separated by seven intervals that are assumed to be equal. Foreach pair of adjectives (e.g., powerful/weak), the respondent is asked to judge the conceptalong the seven-point scale with descriptive phrases:
• Extremely powerful• Very powerful• Slightly powerful• Neither powerful nor weak• Slightly weak• Very weak• Extremely weak
This is repeated for the other pairs of terms.In Figure 10.4, a subject evaluated a corporation and scored the company on each scale:
• Extremely powerful• Slightly reliable• Slightly modern• Slightly cold• Very careful
In practice, however, profiles would be built up for a large sample of respondents, withmany more bipolar adjectives being used than given here.
By assigning a set of integer values, such as +3, +2, +1, 0, –1, –2, –3, to the seven grada-tions of each bipolar scale in Figure 10.5, the responses can be quantified under the assump-tion of equal-appearing intervals. These scale values, in turn, can be averaged acrossrespondents to develop semantic differential profiles. For example, Figure 10.5 shows a pro-file comparing evaluations of Companies X and Y. The average score for the respondentsshow that the Company X is perceived as very weak, unreliable, old-fashioned, and careless,
392— M E A S U R E M E N T
Figure 10.4 Corporate Profile Obtained by Means of the Semantic Differential
10-Smith.qxd 9/1/2004 12:29 PM Page 392

Measurement and Scaling in Marketing Research— 393
Figure 10.5 Average-Respondent Profile Comparisons of Companies X and Y via the SemanticDifferential
NOTE: Company X = _________Company Y = --------------
but rather warm. Company Y is perceived as powerful, reliable, and careful, but rather coldas well; it is almost neutral with respect to the modern/old-fashioned scale.
In marketing research applications, the semantic differential often uses bipolar descrip-tive phrases rather than simple adjectives, or a combination of both types. These scales aredeveloped for particular context areas, so the scales have more meaning to respondents,thus leading usually to a high degree of reliability.
To illustrate, a supermarket chain was interested in knowing how the general public per-ceived it and one of its major competitors. Table 10.6 lists the semantic differential scale itemsused in this study. Both descriptive terms and so-called phrases were used. One thing to noteabout these scales is that polarity is mixed; for some items the negative term is on the left,while for others it is on the right (and vice-versa for the positive item). This is a form ofreversed polarity and is done to reduce the effects of, or even to eliminate, acquiescence biasor yea-saying, and halo effects. The idea is to force respondents to read each item and makeindependent judgments about each item.
The same type of questions presented in Table 10.2 as being applicable to rating scale use alsoapply to the semantic differential. In addition, the researcher must select an overall format for pre-sentation of the scales. Figure 10.6 illustrates (in the context of evaluating national retailers in theUnited States) the four major approaches, from which there are many specific variations.
The traditional approach is shown in Panel (a) of Figure 10.6. The object of concern,Kmart, is rated on all attribute dimensions before the next object, Wal-Mart, is rated onthese dimensions. Panel (b) illustrates a modified traditional format, in that Kmart andWal-Mart, and Sears are evaluated on a single attribute (dull/exciting) before the next attribute(high quality/low quality) is introduced into the measurement process. Panel (c) illustrateswhat is called the graphic positioning scale (Narayana, 1977) in which all objects (i.e., Sears,Kmart and Ward’s) are evaluated on the same scale by some graphical means (usually letters)to reflect relative perceptual placement. Finally, Panel (d) illustrates the numerical compara-tive scale (Golden, Brockett, Albaum, & Zatarain, 1992). Respondents make their judgmentsfor Kmart, Wal-Mart, and Sears on one attribute before moving to the next one.
The number and type of stimuli to evaluate and the method of administration (personalinterview, mail, telephone) should determine at least which format the researcher should
ExtremelyExtremely +3 +2 +1 0 −1 −2 −3
Powerful Weak
Reliable Unreliable
Modern Old-fashioned
Warm Cold
Careful Careless
10-Smith.qxd 9/1/2004 12:29 PM Page 393

use. Comparative studies of these formats are inconclusive and seem to indicate smalldifferences in the content provided in the quality, including reliability, of the data obtained.Therefore, choice of a format may be appropriately made on the basis of other considera-tions, such as ease of subject understanding, ease of coding and interpretation for theresearcher, ease of production and display, and cost. If a large number of stimuli are to beevaluated, this would tend to favor use of the graphic positioning or numerical comparativescales.
A recent study raises a question of whether the semantic differential, as used in a single-stageformat asking for both direction and strength (amount), leads to a central tendency error (Yu,Albaum, & Swenson, 2003). This error is one in which there is reluctance on the part of respon-dents to give extreme responses. A two-stage approach is suggested in which respondents arefirst asked to indicate one of the adjectives or phrases from a pair and then they are asked to
394— M E A S U R E M E N T
Table 10.6 Scale Items Used in Comparative Study of Supermarkets
Inconvenient location ____ ____ ____ ____ ____ ____ ____ Convenient location
Low prices ____ ____ ____ ____ ____ ____ ____ High prices
Pleasant atmosphere ____ ____ ____ ____ ____ ____ ____ Unpleasant atmosphere
Low quality products ____ ____ ____ ____ ____ ____ ____ High quality atmosphere
Modern ____ ____ ____ ____ ____ ____ ____ Old-fashioned
Unfriendly clerks ____ ____ ____ ____ ____ ____ ____ Friendly clerks
Sophisticated customers ____ ____ ____ ____ ____ ____ ____ Unsophisticated customers
Cluttered ____ ____ ____ ____ ____ ____ ____ Spacious
Fast check-out ____ ____ ____ ____ ____ ____ ____ Slow check-out
Unorganized layout ____ ____ ____ ____ ____ ____ ____ Well organized layout
Enjoyable shopping ____ ____ ____ ____ ____ ____ ____ Unenjoyable shoppingexperience experience
Bad reputation ____ ____ ____ ____ ____ ____ ____ Good reputation
Good service ____ ____ ____ ____ ____ ____ ____ Bad service
Unhelpful clerks ____ ____ ____ ____ ____ ____ ____ Helpful clerks
Dull ____ ____ ____ ____ ____ ____ ____ Exciting
Good selection of ____ ____ ____ ____ ____ ____ ____ Bad selection of productsproducts
Dirty ____ ____ ____ ____ ____ ____ ____ Clean
Like ____ ____ ____ ____ ____ ____ ____ Dislike
10-Smith.qxd 9/1/2004 12:29 PM Page 394

indicate “how much.” For example, in a study of shoppers at supermarkets, this format of thesemantic differential can be used as follows:
For each of the descriptors shown below please tick the term which best describes
ABC Food Stores.
____ Inconvenient location ____ Convenient location ____ Neither
If you ticked one of the two terms or phrases (i.e., you did NOT tick “neither”),
Indicate whether it is very, somewhat, or slightly descriptive of ABC.
____ Very ____ Somewhat ____ Slightly
This study reported that the two-stage format generated a greater proportion of responsesin the extreme (i.e., the very) categories than did the regular one-stage format. If a researcheris interested primarily in people with extreme views, then the two-stage approach providesbetter data quality. But if interest is in central tendencies and/or overall distributions such asgroup means, then the one-stage format is adequate.
Measurement and Scaling in Marketing Research— 395
(a)
Kmart
Friendly X Unfriendly
Modern X Old-fashioned
(b)Dull Exciting
Kmart 1 2 3 4 5 6 7Wal-Mart 1 2 3 4 5 6 7Sears 1 2 3 4 5 6 7
(c)
Friendly S W K Unfriendly
Modern K W S Old-fashioned
(d) Kmart Wal-Mart Sears
High Quality 1 2 3 4 5 6 7 Low Quality 3 5 4
Dull 1 2 3 4 5 6 7 Exciting 6 4 2
Figure 10.6 Formats of the Semantic Differential
10-Smith.qxd 9/1/2004 12:29 PM Page 395
Stapel Scale
A modification of the semantic differential is the Stapel scale (Crespi, 1961). This scaleis an even-numbered nonverbal rating scale used in conjunction with single adjectives orphrases, rather than bipolar opposites, to rate an object, concept or person. Figure 10.7 showsthe format of this scale, although it is not necessary that the scale have 10 points. Bothintensity and direction are measured at the same time. It cannot be assumed that the intervalsare equal and that ratings for a respondent are additive. Research has shown no differencesin reliability and validity between this scale and the semantic differential (Hawkins,Albaum & Best, 1974; Menzes & Elbert, 1979).
A Concluding Remark
Currently the semantic differential technique is being used in diverse applications:
• Comparing corporate images, both among suppliers of particular products and againstan ideal image of what respondents think a company should be
• Comparing brands and services of competing suppliers• Determining the attitudinal characteristics of purchasers of particular product classes
or brands within a product class, including perceptions of the country of origin forimported products
• Analyzing the effectiveness of advertising and other promotional stimuli toward changingattitudes
The comparatively widespread use of the semantic differential by marketing researcherssuggests that this method provides a convenient and reasonably reliable way for developingconsumer/buyer attitudes on a wide variety of topics.
TECHNIQUES FOR SCALING RESPONDENTS
Thurstone’s Case V model and Osgood’s semantic differential are primarily designed for scal-ing stimuli—tomato juices, brands of toothpaste, corporate images, retailing services, and thelike. Researchers also have available techniques whose primary purpose is to scale respon-dents along some attitude continuum of interest. There are three better-known procedures fordoing this:
1. The summated scale
2. The Q-sort technique
3. The differential scale
Each of these is described in turn.
396— M E A S U R E M E N T
10-Smith.qxd 9/1/2004 12:29 PM Page 396

The Summated Scale
The summated scale was originally proposed by Rensis Likert, a psychologist (Likert,1967; Kerlinger, 1973). To illustrate, assume that the researcher wishes to scale some char-acteristic, such as the public’s attitude toward travel and vacations. In applying the Likertsummated-scale technique, the steps shown in Table 10.7 are typically carried out.
Many researchers using the final Likert summated scale (the one developed after thepretest) assume only ordinal properties regarding the placement of respondents along the atti-tude continuum of interest. Nonetheless, two respondents could have the same total scoreeven though their response patterns to individual items were quite different. That is, theprocess of obtaining a single (summated) score ignores the details of just which items wereagreed with and which ones were not. Moreover, the total score is sensitive to how the respon-dent reacts to the descriptive intensity scale.
Respondents’ reactions to the items may be affected by the polarity of the items. That is,when developing a set of items for use, the researcher needs to consider the possibility ofacquiescence bias, or agreement, arising. Polarity refers to the positiveness or negativenessof the statement used in a scale. Often, a researcher will reverse the polarity of some itemsin the set (i.e., word items negatively) as a way to overcome this bias. Having positively andnegatively worded statements hopefully forces respondents with strong positive or negativeattitudes to use both ends of a scale, but the cost may be losing unidimensonality of the scale(Herche & Engelland, 1996). This suggests a trade-off is necessary: unidimensional mea-surement with acquiescence bias versus nonbiased measurement tainted by suspect unidi-mensionality. The latter is preferred in most cases. Thus, a researcher should reverse thepolarity of some items and adjust the scoring, as appropriate. That is, a “strongly agree”response to a positive statement and a “strongly disagree” to a negative statement should bescored the same, and so forth.
A recent study of five cultures questions the issue of reverse-worded items, ultimatelypreferring a mixed-worded Likert format, especially in cross-cultural research on consumers(Wong, Rindfleisch, & Burroughs, 2003). These researchers studied the mixed-wordedformat for a particular scale—the Material Values Scale (MVS) (Richins & Dawson, 1992).When applied cross-culturally, the mixed-worded format of MVS tended to confound the
Measurement and Scaling in Marketing Research— 397
High Quality
( ) +5( ) +4( ) +3( ) +2( ) +1( ) −1( ) −2( ) −3( ) −4( ) −5
Figure 10.7 A Stapel Scale
10-Smith.qxd 9/1/2004 12:29 PM Page 397

scale’s applicability. Translation errors, variable response biases, and substantive culturaldifferences all can lead to confounding. To correct for this, adapting the statements into aset of nondirectional questions will lead to largely alleviating the problems associatedwith mixed-wording scales (Wong, Rindfleisch, & Burroughs, 2003). As an illustration, anondirectional format for one item of MVS would be
“How much pleasure do you get from buying things? [Very little . . . A great deal]”
In contrast, the normal Likert format for this item is
“Buying things gives me a lot of pleasure [strongly agree, agree, neither agree nor disagree,disagree, strongly disagree]”
To further illustrate the use of the Likert scale, a set of seven statements regarding traveland vacations used in a study by a travel company are shown in Figure 10.8. Assume nowthat each of the seven test items has been classified as “favorable” (items 1, 3, and 7) or
398— M E A S U R E M E N T
Table 10.7 Steps in Constructing a Likert Scale
1. The researcher assembles a large number (e.g., 75 to 100) of statements concerning the public’s sentimentstoward travel and vacations.
2. Each of the test items is classified by the researcher as generally “favorable” or “unfavorable” with regardto the attitude under study. No attempt is made to scale the items; however, a pretest is conducted thatinvolves the full set of statements and a limited sample of respondents. Ideally, the initial classificationshould be checked across several judges.
3. In the pretest the respondent indicates approval (or not) with every item, checking one of the followingdirection-intensity descriptors:a. Strongly approve or agreeb. Approve or agreec. Undecided or neither agree nor disagreed. Disapprove or disagreee. Strongly disapprove or disagree
4. Each response is given a numerical weight (e.g., +2, +1, 0, −1, −2). It could be +1 to +5.
5. The individual’s total-attitude score is represented by the algebraic summation of weights associated withthe items checked. In the scoring process, weights are assigned such that the direction of attitude—favorable to unfavorable—is consistent over items. For example, if a + 2 were assigned to “stronglyapprove/agree” for favorable items, a + 2 should be assigned to “strongly disapprove/disagree” forunfavorable items.
6. On the basis of the results of the pretest, the analyst selects only those items that appear to discriminatewell between high and low total scorers. This may be done by first finding the highest and lowest quartilesof subjects on the basis of total score. Then, the mean differences on each specific item are comparedbetween these high and low groups (excluding the middle 50 percent of subjects).
7. The 20 to 25 items finally selected are those that have discriminated “best” (i.e., exhibited the greatestdifferences in mean values) between high versus low total scorers in the pretest.
8. Steps 3 through 5 are then repeated in the main study.
10-Smith.qxd 9/1/2004 12:29 PM Page 398

“unfavorable” (items 2, 4, 5, and 6). Each subject would be asked to circle the number thatmost represents his or her agreement with the statement. We may use the weights +2for “strongly agree,” +1 for “agree,” 0 for “neither,” –1 for “disagree,” and –2 for “strongly-disagree.” Since, by previous classification, items 1, 3, 7 are “favorable” statements, wewould use the preceding weights with no modification. However, on items 2, 4, 5, and 6(“unfavorable” statements), we would reverse the order of the weights so as to maintain aconsistent direction. Thus, in these items, +2 would stand for “strongly disagree,” and so on.
Measurement and Scaling in Marketing Research— 399
In this part of the questionnaire we are interested in your opinions about vacations. There are no right or wronganswers to any of these statements. What we would like you to do is simply read each statement as it appears. Thenindicate the extent of your agreement or disagreement by circling the number that best describes your reaction tothe statement: strongly agree (5), agree (4), neither agree nor disagree (3), disagree (2), strongly disagree (1).
Please circle the number that best describes your reaction
Neither Agree StronglyStrongly Agree Agree nor Disagree Disagree Disagree
1. In the winter I need to 5 4 3 2 1go south to the sun.
2. When you take trips with the 5 4 3 2 1children you’re not reallyon vacation.
3. I look for travel bargains. 5 4 3 2 14. I “hate” to spend money. 5 4 3 2 15. I do not like the fresh air 5 4 3 2 1
and out-of-doors.6. I would feel lost if I were alone 5 4 3 2 1
in a foreign country7. A good vacation shortens the 5 4 3 2 1
year and makes life longer.
Figure 10.8 A Direction-Intensity Scale for Measuring Attitudes Toward Travel and Vacations
Suppose that a subject evaluated the seven items in the following way:
Item Response
1 Strongly agree +2
2 Disagree +1
3 Agree +1
4 Strongly disagree +2
5 Disagree +1
6 Strongly disagree +2
7 Strongly agree +2
10-Smith.qxd 9/1/2004 12:29 PM Page 399

The respondent would receive a total score of
+ 2 + 1 + 1 + 2 + 1 + 2 + 2 = 11
Suppose that another respondent responded to the seven items by marking (1) stronglydisagree, (2) neither, (3) disagree, (4) strongly agree, (5) strongly disagree, (6) strongly agree,and (7) neither. This person’s score would be
– 2 + 0 – 1 – 2 – 2 – 2 + 0 = –9
This listing indicates that the second respondent would be ranked “lower” than thefirst—that is, as having a less-favorable attitude regarding travel and vacations. However,as indicated earlier, a given total score may have different meanings.
Some final comments are in order. When using this format, Likert (1967) stated that a keycriterion for statement preparation and selection should be that all statements be expressionsof desired behavior and not statements of fact. In practice this has not always been done. Theproblem seems to be that two persons with decidedly different attitudes may agree on fact.Thus, their reaction to a statement of fact is no indication of fact. Pragmatically, a researchermay use this approach for fact so long as it is recognized that direction is the only meaning-ful measure obtained.
The second concern is that the traditional presentation of a Likert scale is one-stage, withboth intensity and direction combined; this may lead to an underreporting of extreme posi-tions. This is a type of form-related error known as a central tendency error. As stated earlier,a central tendency error represents reluctance on the part of respondents to either give extremescores or use the extreme position on an individual scale item. To compensate for this situa-tion, a two-stage format, whereby direction and intensity are separate evaluations, can beused. Respondents are first asked to indicate agree, disagree, or neither. Then they are askedhow strongly they feel about their response. The limited research on this phenomenon showedthat in three separate studies, the two-stage format generated a greater proportion of extremeresponses (on both ends) in all cases but four single scales and did a better job in predictingpreferences (Albaum, 1997).
One impact of using a two-stage format is that the length of the measuring instrumentwill be increased, perhaps leading to greater time and money costs in implementingresearch projects. The mode of data collection—mail, Internet, telephone, personal—mayhave an effect on the advisability of using a two-stage format. Two-stage formats areused quite often in studies where telephone interviewing is used for data collection.Perhaps the main justification for using this format is that for researchers interestedprimarily in respondents holding the most intense (i.e., extreme position) views, thetwo-stage seems to provide higher data quality. Typically, mean values of a group are notaffected that much.
Earlier in this chapter we discussed central tendency errors related to the semanticdifferential. It is fair to speculate that central tendency errors probably exist for all types ofrating scales, and that an appropriate two-stage format would minimize the error. Figure 10.9
400— M E A S U R E M E N T
10-Smith.qxd 9/1/2004 12:29 PM Page 400

gives an example of the one-stage and two-stage formats for satisfaction questions. But, asfor the Likert scale and the semantic differential, use should probably be limited to thosesituations where one wants to know about people with extreme views or those situationswhere respondents can more easily answer the questions.
The Q-Sort Technique
The Q-sort technique has aspects in common with the summated scale. Very simply, thetask required of a respondent is to sort a number of statements (usually on individual cards)into a predetermined number of categories (usually 11) with a specified number having to beplaced in each category.
In illustrating the Q-sort technique, assume that four respondents evaluate the test itemsdealing with travel and vacations. For purposes of illustration, only three piles will be used.The respondents are asked to sort items into:
MOST AGREED WITH NEUTRAL ABOUT LEAST AGREED WITH(TWO ITEMS) (THREE ITEMS) (TWO ITEMS)
+1 0 –1
The numbers represent the number of items that the respondents must place intopiles 1, 2, and 3, respectively. That is, they may first select the two items that they mostagree with; these go in pile 1. Next, they select the two statements that they least agreewith; these go in pile 3. The remaining three items are placed in pile 2. The numbers belowthe line represent scale values. Suppose that the responses of the four respondents, A, B, C,and D, result in the following scale values:
As can be noted, the respondent pairs A & B and C & D seem “most alike” of the six dis-tinct pairs that could be considered. We could, of course, actually correlate each respondent’sscores with every other respondent and, similar to semantic differential applications, conductfactor or cluster analyses (see Chapter 19) to group the respondents or items. Typically, theseadditional steps are undertaken in Q-sort studies.
Measurement and Scaling in Marketing Research— 401
Respondent
Item A B C D
1 +1 +1 −1 −12 0 0 0 03 +1 0 0 −14 −1 −1 +1 +15 0 0 0 06 −1 −1 +1 +17 0 +1 −1 −1
10-Smith.qxd 9/1/2004 12:29 PM Page 401

The Differential Scale
When using a differential scale, it is assumed that a respondent will agree with only asubset, say one or two, of the items statements about an object, a concept, a person, and soforth. The items agreed with correspond to the respondent’s position on the dimension being
402— M E A S U R E M E N T
ONE-STAGE: Now I’ll ask you to give me a number between one and seven that describes how you feel aboutyour health. . . . “One” stands for completely dissatisfied, and “seven” stands for completelysatisfied. If you are right in the middle, answer “four.” So, the low numbers indicate that you aredissatisfied; the high numbers that you are satisfied.
First, what number comes closest to how satisfied or dissatisfied you are with your health andphysical condition in general?
_______ Number
TWO-STAGE: Now, thinking about your health and physical condition in general, would you say you aresatisfied, dissatisfied, or somewhere in the middle?
How satisfied are you with How dissatisfied are your withyour health and physical condition— your health and physical condition—completely satisfied, mostly, completely dissatisfied, mostly, or somewhat?or somewhat?
If you had to choose, would you say that you arecloser to being satisfied or dissatisfied with your healthand physical condition, or are you right in the middle?
Figure 10.9 Examples of One- and Two-Stage Satisfaction Questions
SOURCE: From Miller, P. V., “Alternate Question Forms for Attitude Scale Questions in Telephone Interviews, PublicOpinion Quarterly, 48, copyright © 1984. Reprinted with permission of The University of Chicago Press.
8. Never thought; No feelings
7. Satisfied
7. Completely
6. Mostly
5. Somewhat
4. In the middle.
5. Satisfied
3. Dissatisfied
4. In the middle
3. Somewhat
2. Mostly
1. Completely
1. Dissatisfied
10-Smith.qxd 9/1/2004 12:29 PM Page 402

measured, while the items disagreed with are on either side of those selected. This means thatthe respondent localizes his or her position.
Each of the items or statements used to construct a differential scale has attached to it ascore (that is, a position on the scale) determined by outside judges. Judgments of scale posi-tion can be made by one of the following methods: paired-comparisons, equal-appearing inter-vals, or successive intervals. The most commonly used method is equal-appearing intervals.
To develop this type of scale, the researcher starts with a large number of statementsrelated to the attitude under study. These are given to a number of judges, who are asked toindependently sort each statement into one of a specified number of piles (often 11), rangingfrom most strongly positive or favorable to most strongly negative (i.e., least favorable). Thescale value for each statement is assigned by the judges and is usually computed as themedian pile, although in some cases the mean is used. A final list of statements consists ofstatements that have a relatively small dispersion across judges and that cover the range ofattitude values. A respondent’s attitude score (i.e., scale value) is the mean (or median) of thescale values of the statements with which he or she agrees. By using this procedure, respon-dents can be rank-ordered according to positiveness of attitude.
Developing differential scales can be time-consuming. In addition, respondents withdifferent attitudes on specific dimensions may end up being classified as similar on an aggre-gate basis. This is so because of the averaging process used. To illustrate, assume that sevenstatements about advertising were scaled as follows:
Statement Scale Value
1 2.82 7.93 4.34 1.45 9.26 6.17 5.0
We assume that the lower the value the more negative a respondent is. Also, we have tworespondents who are asked to indicate the two statements they most agree with. If RespondentA agrees with statements 2 and 4, the score assigned that person is 7.9 + 1.4 / 2 = 4.65.Suppose Respondent B agrees with statements 3 and 7. This person’s score would be thesame—4.3 + 5.0 / 2 = 4.65. A and B would both be classified as near-neutral (on, say, an11-point scale). But Respondent A has a greater variance, as he or she is quite negative on oneaspect but positive on another. B, on the other hand, is relatively neutral on both. Thisexample illustrates that a researcher must be careful when interpreting the score of differen-tial scales. Although aggregates may be of interest, the researcher—and the manager aswell—should not ignore the individual items themselves.
SCALING BOTH STIMULI AND RESPONDENTS
When both stimuli and respondents can be scaled, this is called the response approach to scal-ing. One approach to this involves cumulative scales. Cumulative scales are constructed of a
Measurement and Scaling in Marketing Research— 403
10-Smith.qxd 9/1/2004 12:29 PM Page 403

set of items with which the respondent indicates agreement or disagreement. If a cumulativescale exists, the items included are unidimensional. This means that they are related to eachother such that (in the ideal case) a respondent who responds favorably to Item 2 alsoresponds favorably to Item 1; one who responds favorably to Item 4 also responds favorablyto Items 1, 2, and 3, and so on. This scale is based on the cumulative relation between itemsand the total scores of individuals. An individual’s score is calculated by counting the numberof items answered favorably. The basic idea is that if individuals can be ranked along a uni-dimensional continuum, then if A is more favorably inclined than B, he or she should endorseall the items that B does plus at least one other item. There is a pattern of item responses thatis related to total score. If the scale is truly cumulative, when we know a person’s total scorewe can predict his or her pattern.
In addition, if we know responses to “harder” items, we can predict the response to theeasier items. For instance, suppose we gave a respondent three mathematical problems tosolve, each of differing difficulty. If he correctly answered the most difficult one, he is likelyto answer the other two correctly. On the other hand, a respondent who incorrectly solves themost difficult problem but correctly solves the next most difficult one will most likely answerthe least difficult one correctly. In a similar manner, people can be asked attitudinal-orientedquestions, and if the patterns of response arrange themselves similarly to the mathematicalproblem situation, then the questions are unidimensional. Consequently, people can be rankedon the basis of their scale responses. The resulting scale is ordinal.
One of the best-known approaches to cumulative scaling is scalogram analysis, developedby Louis Guttman (1985; Manfield, 1971). The technique is designed to determine whetherthe items used to measure an attitude form a unidimensional scale. That is, if we know aperson’s rank order on a set of questions, can we predict his or her response to each questionin some area of content? Both items and people can be scaled. A so-called universe of con-tent is unidimensional, using the Guttman approach, if it yields a perfect or almost perfectcumulative scale. Unfortunately, scalogram analysis is useful ex post and does not help inselecting items that are likely to form a cumulative scale.
To illustrate this approach, assume our interest is in obtaining a measurement of anadvertisement’s ability to stimulate a consumer to some kind of action. We select four itemsrepresenting actions that might occur, and we transform these actions into questions that callfor a yes/no answer:
• Would you go out of your way to look at this product in a store? (2)• Would you stop to look at this ad in a magazine? (4)• Would you buy this product after reading this ad? (1)• Would you want to show the ad to a friend or a neighbor? (3)
We present this set of questions to a group of respondents, whose task is to indicate “Yes”or “No” to each one. Their responses indicate the relative difficulty of answering “Yes.”Assume the ranking of difficulty from most to least is shown by the numbers in parentheses.To determine whether the questions form a cumulative scale, we look at whether a patternexists such that a respondent who answers “Yes” to a difficult question also answers “Yes” tothe less-difficult ones. If a scale exists, then a respondent can be classified into one of fivetypes of respondents depending on his or her response pattern. Table 10.8 shows the responsepatterns for an ideal cumulative scale. In practice this perfect pattern will not exist.
404— M E A S U R E M E N T
10-Smith.qxd 9/1/2004 12:29 PM Page 404

Experience has shown that a cumulative scale will exist if no more than 10 percent of theanswers vary from this geometric pattern. We have discussed only the content component ofthe Guttman scale. There are also components concerned with intensity and location of ori-gin, which are discussed in detail in Guttman (1985), Manfield (1971) and Torgerson (1958).
Our discussion so far has been concerned with unidimensional scales in which stimuli andrespondents can be placed along a linear continuum. In multidimensional scaling models,discussed in Chapter 19, the existence of an underlying multidimensional space is assumed.The stimuli in such models are represented by points in a space of several dimensions. Bothstimuli and respondents can be scaled. The dimensions of this space represent attributes thatare perceived to characterize the stimuli or respondents.
MULTI-ITEM SCALES
Each of the types of scales discussed in this chapter can be used either alone or part of a multi-item scale used to measure some construct. A multi-item scale consists of a number of closelyrelated individual rating scales whose responses are combined into a single index, compositescore, or value (Peterson, 2000). Often the scores are summated to arrive at a total score.Multi-item scales are used when measuring complex psychological constructs that are noteasily defined by just one rating scale or captured by just one question.
Figure 10.10 (Spector, 1992) outlines the major steps in constructing a multi-item scale.The first, and perhaps most critical, step is to clearly and precisely define the construct ofinterest. A scale cannot be developed until it is clear just what the scale is intended to mea-sure. This is followed by design and evaluation of the scale. A pool of items is developedand then subject to analysis to arrive at the initial scale. Along the way, a pilot study is con-ducted to further refine the scale and move toward the final version. Validation studies areconducted to arrive at the final scale. Of concern is construct validation, in which an assess-ment is made that the scale measures what it is supposed to measure. At the same time thatvalidity data are collected, normative data can also be collected. Norms describe the distri-butional characteristics of a given population on the scale. Individual scores on the scalethen can be interpreted in relation to the distribution of scores in the population (Spector,1992, p. 9).
Measurement and Scaling in Marketing Research— 405
Table 10.8 Ideal Pattern From Scaleogram Analysis
“Yes” Answers “No” AnswersType of Scale Respondent 3 1 4 2 3 1 4 2 Score
1 X X X X (4)2 X X X X (3)3 X X X X (2)4 X X X X (1)5 X X X X (0)
10-Smith.qxd 9/1/2004 12:29 PM Page 405

A good multi-item scale is both reliable and valid. Reliability is assessed by the scale’sstability (test-retest reliability) and internal consistency reliability (coefficient alpha). Thesemeasures have been discussed in Chapter 9. According to Spector (1992), there are severalother characteristics of a good multi-item scale:
• The items should be clear, well-written, and contain a single idea.• The scale must be appropriate to the population of people who use it, such as having an
appropriate reading level.• The items should be kept short and the language simple.• Consider possible biasing factors and sensitive items.
Table 10.9 gives an example of a multi-item scale developed to measure consumer ethno-centrism within a nation, the CETSCALE (Shimp & Sharma, 1987). This scale is formattedin the Likert scale format. A compilation of multi-item scales frequently used in consumerbehavior and marketing research is provided by Bearden and Netemeyer (1999).
Multi-item scales come in all sizes and shapes with varied numbers of items. Often,researchers want to use shorter versions of the scale. For example, the CETSCALE shown inTable 10.9 has a 10-item shorter form as well as the 17-item full version. Richins (in press)has studied short versions of the Material Values Scale, some of which have acceptablepsychometric properties when used to measure materialism at a general level. Researchersmust be careful when attempting to shorten scales, as psychometric properties and any effectson construct validity of shorter versions must first be assessed.
406— M E A S U R E M E N T
Administration andItem Analysis
Pilot Test
Design Scale
Design Construct
Validate and Norm
Figure 10.10 Steps in Developing a Multi-Item Scale
10-Smith.qxd 9/1/2004 12:29 PM Page 406

LIMITATIONS OF SCALING PROCEDURES
Although psychological measurement offers an interesting and potentially rewarding area ofstudy by the marketing researcher, there are some limitations of current scaling techniques intheir applicability to marketing problems.
First, it is apparent that more progress has been made in the construction of scales for mea-suring attitudes along a single dimension than in dealing with the more complex cases of mul-tidimensional attitudes. However, a person’s decision to purchase a particular brand usuallyreflects a response to a variety of stimuli, such as the brand’s functional features, packagedesign, advertising messages, corporate image, and so on. Much work still remains to be doneon the development of scales to measure multidimensional stimuli.
Second, relatively little development has been done of anything like a general theory ofindividual buyer behavior that is testable in terms of empirical findings from psychologicaland sociological studies. In addition to consumer perception and preference studies, we stillneed to know much more about the influence of other persons (peers, superiors, subordinates)on the buyer decision process, consumer habit formation, and so on. The development of any-thing close to a general, operationally-based theory will require—at the least—validation ofscaling techniques by behavioral-type measures under experimentally controlled conditions.
Finally, predictions from attitude scales, preference ratings, and the like still need to betransformed into measures (sales, market share) of more direct interest to the marketer. Westill do not know, in many cases, how to effectively translate verbalized product ratings,
Measurement and Scaling in Marketing Research— 407
Table 10.9 Example of Multi-Item Scale: Consumer Ethnocentrism (CETSCALE)
1. American people should always buy American-made products instead of imports.2. Only those products that are unavailable in the United States should be imported.3. Buy American-made products. Keep America working.4. American products first, last and foremost.5. Purchasing foreign-made products is un-American.6. It is not right to purchase foreign products.7. A real American should always buy American-made products.8. We should purchase products in America instead of letting other countries get rich off us.9. It is always best to purchase American products.
10. There should be very little trading or purchasing of goods from other countries unless out ofnecessity.
11. Americans should not buy foreign products, because this hurts American business and causesunemployment.
12. Curbs should be put on all imports.13. It may cost me in the long run, but I prefer to support American products.14. Foreigners should not be allowed to put their products on our markets.15. Foreign products should be taxed heavily to reduce their entry into the United States.16. We should buy from foreign countries only those products that we cannot obtain within our own
country.17. American consumers who purchase products made in other countries are responsible for putting
their fellow Americans out of work.
NOTE: Items composing the 10-item reduced version are items 2, 4 through 8, 11, 13, 16, and 17.
10-Smith.qxd 9/1/2004 12:29 PM Page 407

attitudes about corporations, and so on into the behavioral and financial measures requiredto evaluate the effectiveness of alternative marketing actions.
SUMMARY
In this chapter, the major objective has been to discuss some of the fundamental concepts ofmeasurement and psychological scaling and their relationship to the gathering and analysisof behavioral data. The chapter first covered variability (ordinal) and quantitative-judgment(ratio/interval) methods of data collection.
Scaling procedures were next commented upon within the framework of stimulus-centered and subject-centered methods. As examples of stimulus-centered techniques,Thurstone’s Case V model and Osgood’s semantic differential were described in a market-ing research context. Subject-centered scaling techniques—the Likert summated scale,Stephenson’s Q-sort technique, and Thurstone’s differential scale—were also described andillustrated by numerical examples. Next we covered techniques for scaling both stimuli andrespondents. Guttman’s scalogram analysis and an introduction to the multidimensionalnature of attitudes were presented. The chapter concluded with a discussion of multi-itemscales and some of the difficult problems associated with testing the validity and reliabilityof psychological scales.
�
ASSIGNMENT MATERIAL
1. Take an article from a current marketing journal and do the following:a. Define key terms from an operational standpoint.b. Examine the author’s justification for the type of measurement scale(s) used.c. Criticize the article from the standpoint of its operational usefulness to marketing
management.
2. Design and administer a short questionnaire on the topic of student attitudes toward theteaching competence of your university’s faculty members. Include questions dealingwith paired comparisons, agree-disagree responses, and rating-type scales.a. Apply Thurstone’s Case V procedure to the paired-comparisons data. Apply also
the method of Exhibit 10.4. What can you conclude about these approaches?b. Summarize the rating-scale patterns in terms of a semantic differential profile.c. Evaluate the usefulness of these procedures in the context of your problem.
3. The Grandma’s Own Soup Company was considering the possibility of changing theconsistency of its famous tomato soup. Five test soups were prepared, ranging from“very light” to “very heavy consistency”. A consumer clinic was held in which 15housewives ranked each soup (no ties allowed) from 1 (liked best) to 5 (liked least).
408— M E A S U R E M E N T
10-Smith.qxd 9/1/2004 12:29 PM Page 408

The data for this test are as follows:
Measurement and Scaling in Marketing Research— 409
Powerful
Reliable
Modern
20— :40
52— :20
5 — :
6
42— :30
12— :25
14— :20
10— :15
8— :12
21— :25
5— :5
10— :22
25— :20
5— :5
8— :35
20— :12
12— :
5
5— :
6
10— :
9
7— :0
5— :0
5— :8
Weak
Nonreliable
Old-Fashioned
Soup 1 2 3 4 5 6 7 8 9 10 11 12 13 14 15
A 2 4 3 2 2 1 2 2 2 2 3 1 2 3 2
B 1 2 1 1 1 2 1 3 1 1 1 2 1 2 4
C 4 1 4 5 4 5 3 1 5 3 4 4 5 4 5
D 3 3 2 3 3 3 5 4 3 4 2 3 3 1 3
E 5 5 5 4 5 4 4 5 4 5 5 5 4 5 1
a. On the basis of a composite (sum of the ranks), what is the rank order of thesoups—from best- to least-liked?
b. What, if anything, can be said about how much better Soup B is than Soup E?c. By going across rows of the above table one can count the number of times one soup
of each possible pair is ranked higher than the other soup in the pair. Prepare a table ofpaired comparisons as derived from the ranked data, express the table entries in termsof proportions, and construct an interval scale, using Thurstone’s Case V scaling.
d. What major assumption are we making about the sample of subjects when weconstruct the interval scale above? Criticize this type of application of the Thurstonecomparative judgment technique.
e. Apply the method described in Exhibit 10.4 to the rankings above. What can youconclude about this approach and that of Thurstone Case V?
4. Using the method of choices, construct an interval scale using Thurstone Case V scalingof the data shown in question 3 above. Evaluate the scale you have just derived fromthe standpoint of efficient use of data.
5. Assume that two groups—a group of housewives and a group of small businessmen—areasked to rate the Mighty Electric Company on the basis of three bipolar adjective pairs:• Powerful/weak• Reliable/nonreliable• Modern/old-fashioned
The frequencies of each group of 100 respondents are shown below (numbers above the hor-izontal lines refer to housewives’ responses; numbers below refer to businessmen’s responses):
10-Smith.qxd 9/1/2004 12:29 PM Page 409

a. Using a 7-point scale (where, for example, 7 = extremely powerful and 1 =extremely weak), find a summary rating index for each group of raters for each setof adjective pairs.
b. What assumptions are made by using the integer weights, 7, 6, . . . , 1?c. In which adjective pairs are the rating indexes between the groups most similar?
Most dissimilar?d. How would your answer to part (a) change if the weights +3, +2, +1, 0, –1, –2,
and –3 were used instead of the weights, 7, 6, . . . . , 1? Would rank order betweenpairs of summary indexes (for each adjective pair) be affected, and if so, how?
6. Select the scaling technique you would recommend be used to obtain measurements forthe situations described below. Explain why you chose each.a. Measurement of price elasticity of demand for a new product.b. Determination of preference of three levels of sweetness for a new product.c. Measurement of change of attitude toward a product as the package is changed.d. Determination of which respondents have tried a particular brand of product.e. Measurement of which of three advertisements has the greatest readership.f. Comparison of three retail stores on 15 attributes.g. Measurement of the proportion of “triers” who make repeat purchases of a new
product.
7. Construct a multi-item scale to measure public satisfaction with local governmentservices. Include at least five items in your scale. Also, develop a single-item measureof public satisfaction with local government services. Administer each of these scalesto a group of 25 residents in your local area, including demographic variables ofgender, marital status, and age. What can you conclude about any differences thatemerge in your findings?
�
410— M E A S U R E M E N T
REFERENCES
Albaum, G. (1997, April). The Likert scale revisited:An alternate version. Journal of the MarketResearch Society, 39 (2), 331–348.
Albaum, G., Best, R., & Hawkins, D. (1981).Continuous vs. discrete semantic differentialscales. Psychological Reports, 49, 83–86.
Bearden, W. O., & Netemeyer, R. G. (1999).Handbook of marketing scales (2nd ed.).Thousand Oaks, CA: Sage.
Bishop, G. F. (1987). Experiments with the middleresponse alternative in survey questions. PublicOpinion Quarterly, 51, 220–232.
Churchill, G. A., Jr., & Peter, J. P. (1984, November).Research design effects on the reliability of
rating scales: A meta analysis. Journal ofMarketing Research, 21, 360–375.
Coombs, C. H. (1964). A theory of data. New York:Wiley.
Crespi, I. (1961, July). Use of a scaling technique insurveys. Journal of Marketing, 25, 69–72.
Edwards, A. L. (1957). Techniques of attitude scaleconstruction. New York: Appleton-Century-Crofts.
Golden, L., Brockett, P., Albaum, G., & Zatarain, J.(1992). The golden numerical comparative scaleformat for economical multi-object/multi-attribute comparison questionnaires. Journal ofOfficial Statistics, 8 (1), 77–86.
10-Smith.qxd 9/1/2004 12:29 PM Page 410

Gottlieb, M. J. (n.d.). A modern marketing approachin measuring consumer preference. New York:Audits and Surveys, Inc.
Guilford, J. P., & Fruchter, B. (1973). Fundamentalstatistics in psychology and education (5th ed.).New York: McGraw-Hill.
Guttman, L. (1985). Measuring the true-state of opin-ion. In R. Ferber & H. Wales (Eds.), Motivationand market behavior. Homewood, IL: RichardD. Irwin, 393–415.
Haley, R., & Case, P. (1979, Fall). Testing thirteenattitude scales for agreement and brand determi-nation. Journal of Marketing, 43, 20–32.
Hawkins, D. I., Albaum, G., & Best, R. (1974,August). Stapel scale or semantic differential inmarketing research? Journal of MarketingResearch, 11, 318–322.
Hays, W. L. (1967). Quantification in psychology.Belmont, CA: Brooks/Cole.
Herche, J., & Engelland, B. (1996). Reversed-polarityitems and scale unidimensionality. Journal ofthe Academy of Marketing Science, 24 (4),366–374.
Hubbard, R., Little, E. L., & Allen, S. J. (1989). Areresponses measured with graphic rating scalessubject to perceptual distortion? PsychologicalReports, 69, 1203–1207.
Karsten, Y. G., & John, D. R. (1991). Measuringchildren’s preferences: The use of behaviorallyanchored rating scales. Paper presented at the1991 Attitude Research Conference.
Kendall, M. G. (1962). Rank correlation methods.New York: Hafner.
Kerlinger, F. (1973). Foundation of behavioralresearch (2nd ed.). New York: Holt, Rinehart &Winston.
Likert, R. (1967). The method of constructing anattitude scale. In M. Fishbein (Ed.), Readingsin attitude theory and measurement. New York:Wiley, pp. 90–95.
Lodge, M. (1981). Magnitude scaling: Quantitativemeasurement of opinions. Beverly Hills, CA:Sage.
Manfield, M. N. (1971). The Guttman scale. InG. Albaum & M. Venkatesan (Eds.), Scientificmarketing research. New York: The Free Press.
McCarty, J. A., & Shrum, L. J. (2000). The measure-ment of personal values in survey research:A test of alternative rating procedures. PublicOpinion Quarterly, 64, 271–298.
Menzes, D., & Elbert, N. F. (1979, February).Alternative semantic differential scaling formatsfor measuring store image: An evaluation.Journal of Marketing Research, 16, 80–87.
Miller, P. V. (1984). Alternative question forms forattitude scale questions in telephone interviews.Public Opinion Quarterly, 48, 766–778.
Narayana, C. (1977, February). Graphic positioningscale: An economical instrument for surveys.Journal of Marketing Research, 14, 118–122.
Nowlis, S. M., Kahn, B. E., & Dhar, R. (2002).Coping with ambivalence: The effect of remov-ing a neutral option on consumer attitude andpreference judgments. Journal of ConsumerResearch, 29, 319–334.
Osgood, C. E., Suci, G. J., & Tannenbaum, P. H.(1957). The measurement of meaning. Urbana:University of Illinois Press.
Peter, J. P., & Churchill, G. A., Jr. (1986, February).Relationships among research design choicesand psychometric properties of rating scales: Ameta-analysis. Journal of Marketing Research,23, 1–10.
Peterson, R. A. (2000). Creating effective question-naires. Thousand Oaks, CA: Sage.
Phillips, J. P. N. (1967). A procedure for determiningSlater’s i and all nearest adjoining orders. BritishJournal of Mathematical and Statistical Psycho-logy, 20, 217–223.
Richins, M. (in press). The material values scale:Measurement properties and development of ashort form. Journal of Consumer Research.
Richins, M., & Dawson, S. (1992, December). Aconsumer values orientation for materialismand its measurement: Scale development andvalidation. Journal of Consumer Research, 19,303–316.
Semon, T. T. (2001, October 8). Symmetry shouldn’tbe goal for scales. Marketing News, 35, 9.
Shimp, T. A., & Sharma, S. (1987, August).Consumer ethnocentrism: Construction and val-idation of the CETSCALE. Journal ofMarketing Research, 24, 280–289.
Slater, P. (1961). Inconsistencies in a schedule ofpaired comparisons. Biometrica, 48, 303–312.
Spector, P. E. (1992). Summated rating scaleconstruction: An introduction. Newbury Park,CA: Sage.
Sudman, S., & Bradburn, N. (1983). Asking ques-tions. San Francisco: Jossey-Bass.
Measurement and Scaling in Marketing Research— 411
10-Smith.qxd 9/1/2004 12:29 PM Page 411

Thurstone, L. L (1959). The measurement of values.Chicago: University of Chicago Press.
Torgerson, W. S. (1958). Theory and methods ofscaling. New York: Wiley.
Wilcox, C., Sigelman, L., and Cook, E. (1989). Somelike it hot: Individual differences in responsesto group feeling thermometers. Public OpinionQuarterly, 53, 246–257.
Wong, N., Rindfleisch, A., & Burroughs, J. E. (2003,June). Do reverse-worded items confound
measures in cross-cultural research? The case ofthe material values scale. Journal of ConsumerResearch, 30, 72–91.
Yu, J., Albaum, G., & Swenson, M. (2003). Is acentral tendency error inherent in the use ofsemantic differential scales in different cultures.International Journal of Market Research, 45(2), 213–228.
412— M E A S U R E M E N T
10-Smith.qxd 9/1/2004 12:29 PM Page 412


![371 [Vol. CORPORATE AND BUSINESS LAW JOURNAL 2:371: 2021]](https://img.pdfslide.us/doc/110x75/617a02a951808a692b5a5087/371-vol-corporate-and-business-law-journal-2371-2021.jpg)