Embed Size (px)
Citation preview

CHAPTER
1
1
After completing this chapter you should be able to:
• identify problems that can be investigated scientifically
• use information from primary and secondary sources to predict results
• plan and conduct fieldwork and experiments
• identify ethical considerations that may apply to an investigation
• assess whether the planned investigations is fair, safe and is able to be performed using available equipment
• identify and explain the differences between controlled, dependent and independent variables
• construct and use tables, graphs, keys and models
• calculate averages and identify outliers in data
• analyse patterns in data using digital technologies as appropriate
• summarise data
• draw conclusions from primary and secondary sources
• evaluate the quality of the data collected and identify improvements.This is an extract from the Australian Curriculum Victorian Curriculum F–10 © VCAA (2016); reproduced by permission AB
1.1
Have you ever wondered ...• which internet sites are trustworthy and
which are not?
• why scientists sometimes use pie charts but at other times use column or line graphs?
• what the difference is between a mistake and an error?
• how to run a fair test?
Working with scientific data
LightbookStarter
LS LS
Sample
page
s

Data is all the information and measurements that are collected by scientists from textbooks, encyclopedias, journals and the internet, or from carrying out their own investigations. Scientists collect data and organise it into tables and graphs. They analyse the data, draw conclusions from it and then write it all up so that other scientists can understand it.
2 PEARSON SCIENCE 8 2ND EDITION
MODULE
1.1 Primary data
DataData is the term given to all the observations and measurements that can be used to describe something. For example, you can be described by your personal data. This includes your height and weight, your hair, skin and eye colour, when and where you were born, the names of your parents and distinguishing features such as a scar or birthmark. Data on the parrot in Figure 1.1.1 would include its colour, sex, body temperature and the type of nest it makes.
FIGURE 1.1.1 Data on this parrot would include its size and mass, the environment it lives in, the number of tail feathers it has, the average number of eggs it lays and the age at which it first flies.
Internet reaction timesHow fast can you react?
Do this …1 Use the key words reflex tester or reaction
time in your internet search engine to find interactive games that will measure your reaction time.
2 Although most of the games involve detecting a change in colour of the web page, some shoot tranquiliser darts into sheep while in others you play baseball! Try as many as you can to determine your average reaction time.
Record this …1 Describe what happened.2 Explain why you think this happened.
science 4 fun
Sample
page
s

3CHAPTER 1 • WORKING WITH SCIENTIFIC DATA
Types of dataMuch of the data you find will be measurements that are written as numbers with units attached to them. This type of data is known as quantitative data. Other data can only be described in words. This data is qualitative data. For example, data about Mt Kosciuszko in New South Wales is shown here and in Figure 1.1.2:
• Quantitative data includes: - coordinates (36°27’S, 148°16’E) - height (2228 metres above sea level) - average temperatures (-6°C in July, 21°C in
January).• Qualitative data includes:
- Aboriginal name (Tar-Gan-Gil) - rock type (granite) - the animals that live there (wombats, spotted-tailed
quoll, pygmy possum, corroboree frog, flame robin, mountain galaxia and wingless grasshopper)
- wildflowers found there (alpine stackhousia, hoary sunray and snow beard heath).
Collecting your own dataYou can generally trust primary data because you collected it yourself from experiments that you ran. If the data is wrong, then it’s probably because you made a mistake.
Mistakes are things that can be avoided if you take a little more care. Mistakes happen when you spill material, use the wrong equipment (or the right equipment wrongly), wrongly read an instrument or incorrectly write or copy the measurement down. All these are obvious mistakes because they can be easily avoided.
Errors are not mistakes. Errors are small and unavoidable variations (changes) that occur naturally in measurements. Errors will always happen no matter how careful you are. This means that nothing is exact—even ‘accurate’ measurements have small variations and errors in them.
Some common forms of errors are:
• parallax error—your eye can never be exactly over the marking of a measuring device. Everyone looks at markings at slightly different angles, so everyone will take slightly different readings. Parallax error is caused when you read the instrument at a slight angle. This is shown in Figure 1.1.3.
FIGURE 1.1.2 Mt Kosciuszko is 2228 metres high and its main rock type is granite. 0 5 10 15 20 25 30 35
FIGURE 1.1.3 Jo, Steve and Waseem are all looking at the same measurement but at slightly different angles. Only Steve’s measurement will be accurate. Jo’s and Waseem’s measurements will have parallax error.
Jo reads the measurement as 18.5.
Steve reads it as 20.
Waseem reads it as 21.5.
SciFileDiscovery by mistakeMistakes and accidents have led to some important scientific discoveries, including an artificial sweetener (saccharine) and the first antibiotic (penicillin).
Data can also be classified according to where you obtain it from.
• Primary data is data that you or your team personally find out by running your own experiments, surveys and fieldwork. Any measurements that you take are primary data.
• Secondary data is data that comes from the work of other people. Secondary data includes the measurements and information that you find on the internet, TV, DVD and video, and in encyclopedias, textbooks, newspapers and magazines. Secondary data can also be obtained by interviewing experts.
AB1.2
AB1.3
Sample
page
s

4 PEARSON SCIENCE 8 2ND EDITION
• instrument errors—sometimes an instrument may be faulty and will never give the right reading. Some instruments give correct readings only at certain temperatures and will give small errors if used at any other temperature. For example, a metal ruler expands when hot, pushing its markings further apart. As Figure 1.1.5 shows, this makes measurements taken on a hot day slightly smaller than those made on a cold day.
• zero errors—an instrument such as a beam balance or electronic balance should read zero when nothing is placed on it. If it doesn’t read zero, then everything you measure will be a little out and all measurements will have a zero error. Balances can usually be adjusted to read zero once more.
SciFileA near disastrous mistake!In 2009, an Airbus A340/500 jet was taking off from Melbourne with 275 people on board, bound for Dubai. It ran out of runway, scraped its undercarriage, shattered a landing light and only just missed the boundary fence. An investigation concluded that the pilots had mistakenly entered a wrong number into the on-board computer, making the plane ‘think’ that it was 100 tonnes lighter than it really was!
0 cm 1 2 3 4 5 6 7
FIGURE 1.1.4 This match is not quite 6 cm long, but is it 5.7, 5.8 or 5.9 cm?
0 cm 1 2 3 4 5 6 7
0 cm 1 2 3 4 5 6 7
Metal rulers contract on cold days.
Metal rulers expand when hot.
FIGURE 1.1.5 Metal rulers give different measurements at different temperatures. This makes the match appear 'longer' on cold days.
SkillBuilder
TareWhen you tare an electronic balance, you are resetting it to read zero when something like a beaker is placed on it (Figure 1.1.6). You can then add material without having to worry about the mass of the beaker because it has already been subtracted from the total mass.
120.5gO
00.0gO
FIGURE 1.1.6 The tare button on an electronic scale resets its zero so that you don’t have to worry about the mass of the beaker that is on it.
• reading errors—measurements often fall between the markings of a measuring device. You need to estimate your measurement, and different people will make slightly different estimations. An example is shown in Figure 1.1.4.
• human reflex—a stopwatch typically reads to one-hundredth of a second (0.01 second). The best human reaction time is around 0.11 second and so stopwatches are much more accurate than us. Everyone has different reflex times and so everyone will measure times slightly differently when using a stopwatch.
Prac 1p. 9
Sample
page
s

5CHAPTER 1 • WORKING WITH SCIENTIFIC DATA
Improving primary dataErrors always exist and each person in a team will probably take slightly different measurements of exactly the same quantity. Unless someone made a mistake then no one is wrong and everyone’s measurement is ‘correct’.
One easy way of improving the accuracy of your data is to repeat your measurements. For example, each member in your team could take the same measurement so that they can be compared and obvious mistakes eliminated. Mistakes in data can sometimes be obvious because they are very different from the other measurements. These measurements are known as outliers and should be ignored. Even if no mistakes were made, deleting outliers ensures that the remaining measurements are as accurate as possible.
You can then calculate the average (or mean) of the remaining data. The average will be the most accurate measurement of all because it doesn’t include mistakes and has evened out all the small errors everyone made in their measurement.
A little give and takeIt is useful to write measurements with an estimation of how big the error might be. Scientists allow a little ‘give and take’ by showing the error as ± (standing for ‘plus or minus’).
Figure 1.1.7 shows the temperature on a thermometer. The exact temperature falls between the markings and a little guesswork is needed to measure it. It looks as though it should be about 27°C, but it could be a little higher or lower, perhaps by as much as 1°C. The measurement might be written as 27°C ‘give or take’ 1°C. Scientists write this as 27 ± 1°C.
Prac 2p. 10
Worked exampleFinding averagesProblemThe members of a prac team each measured the length of the mouse’s tail. Their measurements are shown below.
Team member Length (cm)
Karen 8.1
Evan 8.4
Rebecca 7.9
Anna 8.2
Mark 8.5
Andrew 12.9
SolutionThinking: Delete the highest and lowest measurements (outliers).
Andrew’s and Rebecca’s results can be ignored.
Add the rest of the ‘good’ measurements together.
Working: 8.1 + 8.4 + 8.2 + 8.5 = 33.2
Thinking: Divide by how many ‘good’ measurements were taken. Four ‘good’ measurements were taken.
Working: Average length = 33.2
4 = 8.3 cm
Note that no one actually measured 8.3 cm but this is the average and is the most accurate measurement based on the data collected.
Try yourselfUse the above procedure to calculate the average for each of the following sets of data.
1 9, 10, 6, 13, 12, 10, 11, 15, 12
2 0.72, 0.57, 1.02, 0.34, 0.74, 0.89
SkillBuilder
Finding averages 1 Delete any outliers as these are the most likely
to be inaccurate.
2 Add the rest of the ‘good’ measurements together.
3 Divide by how many ‘good’ measurements were taken.
FIGURE 1.1.7 The temperature shown on this thermometer might be written as 27 ± 1°C.
0
5
10
15
20
25
30
35
ºC
27°C give or take 1°C
Sample
page
s

6 PEARSON SCIENCE 8 2ND EDITION
HUMAN RIGHTS FIELD STATISTICIANData can be collected and analysed to answer many different questions. Data analysis gives us a way to find patterns, structure and meaning in complex sets of numbers. By applying scientific method along with statistics and mathematics to data, we can gain a better understanding of processes or events and use this understanding to predict outcomes.Field statisticians in human rights organisations such as Amnesty International (Figure 1.1.8) do this as part of their job. They use statistical methods to answer questions about large-scale conflicts and human rights violations in places such as Lebanon, Sri Lanka, India and Colombia. Field statisticians collect and analyse data to measure rates of mortality (deaths), famine, violence and human rights violations in unsettled environments. Using scientific and mathematical knowledge, statisticians improve the monitoring, reporting and understanding of human rights issues. Their day-to-day jobs involve working in the field, collecting and processing data, developing software tools to analyse data, and applying the data to important questions about human rights issues. The knowledge gained from their work is helping to raise awareness and make positive changes for people living in areas where conflict and rights violations occur.You might like this job if you enjoy solving problems, working in teams and travelling, while using your knowledge to address social issues. There are many opportunities to apply statistics in a variety of other interesting fields, such as health care and environmental science. A Bachelor of Science with a major in mathematics or statistics will give you the skills you need for these jobs.
Review1 How do you think statistics can be used
to help us to better understand social and environmental issues?
2 List three other fields where you think statistics will play an important role.
Working with Science
Worked example± errors in sets of dataProblemIn the previous Worked example, six students measured the length of a mouse’s tail. Present this measurement as an average ± error.
SolutionThinking: Find the average of the data.
Working: The average was 8.3 cm.
Thinking: Find the difference between the highest ‘good’ value and the average.
Working: 8.5 – 8.3 = 0.2
Thinking: Find the difference between the lowest ‘good’ value and the average.
Working: 8.3 – 8.1 = 0.2
The ± error is the biggest of these differences.
Both differences are the same, so the measurement can be written as 8.3 ± 0.2.
Try yourselfState the answers to the practice questions in the previous Worked example as average ± error.
SkillBuilder
± errors in sets of dataYou can find the overall ± error for your data by following these steps.
1 Find the average of the data.
2 Find the difference between the highest ‘good’ value and the average.
3 Find the difference between the lowest ‘good’ value and the average.
4 The ± error is the biggest of these differences.
FIGURE 1.1.8 Supporting Amnesty International’s work
Sample
page
s
7CHAPTER 1 • WORKING WITH SCIENTIFIC DATA
1.1MODULE
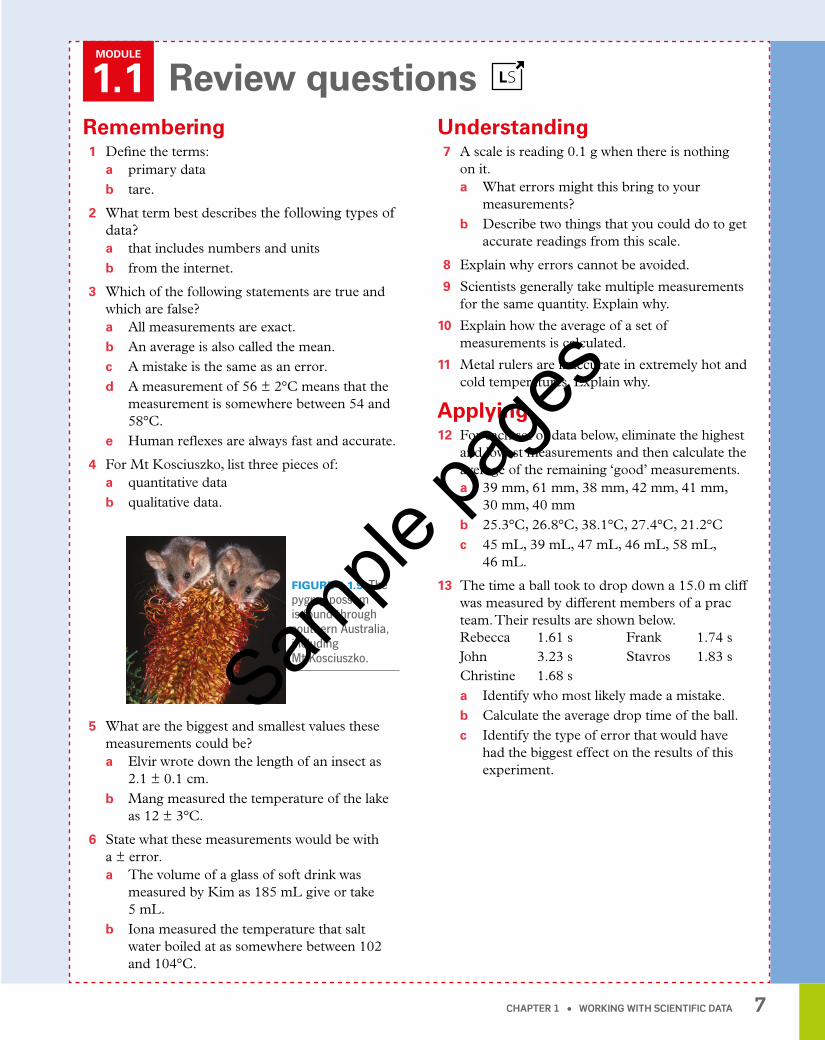
Review questionsRemembering 1 Define the terms:
a primary datab tare.
2 What term best describes the following types of data?a that includes numbers and unitsb from the internet.
3 Which of the following statements are true and which are false?a All measurements are exact.b An average is also called the mean.c A mistake is the same as an error.d A measurement of 56 ± 2°C means that the
measurement is somewhere between 54 and 58°C.
e Human reflexes are always fast and accurate.
4 For Mt Kosciuszko, list three pieces of:a quantitative datab qualitative data.
Understanding 7 A scale is reading 0.1 g when there is nothing
on it.a What errors might this bring to your
measurements?b Describe two things that you could do to get
accurate readings from this scale.
8 Explain why errors cannot be avoided.
9 Scientists generally take multiple measurements for the same quantity. Explain why.
10 Explain how the average of a set of measurements is calculated.
11 Metal rulers are inaccurate in extremely hot and cold temperatures. Explain why.
Applying 12 For each set of data below, eliminate the highest
and lowest measurements and then calculate the average of the remaining ‘good’ measurements.a 39 mm, 61 mm, 38 mm, 42 mm, 41 mm,
30 mm, 40 mmb 25.3°C, 26.8°C, 38.1°C, 27.4°C, 21.2°Cc 45 mL, 39 mL, 47 mL, 46 mL, 58 mL,
46 mL.
13 The time a ball took to drop down a 15.0 m cliff was measured by different members of a prac team. Their results are shown below.Rebecca 1.61 s Frank 1.74 sJohn 3.23 s Stavros 1.83 sChristine 1.68 sa Identify who most likely made a mistake.b Calculate the average drop time of the ball.c Identify the type of error that would have
had the biggest effect on the results of this experiment.
LightbookStarter
LS LS
FIGURE 1.1.9 The pygmy possum is found through southern Australia, including Mt Kosciuszko.
5 What are the biggest and smallest values these measurements could be?a Elvir wrote down the length of an insect as
2.1 ± 0.1 cm.b Mang measured the temperature of the lake
as 12 ± 3°C.
6 State what these measurements would be with a ± error.a The volume of a glass of soft drink was
measured by Kim as 185 mL give or take 5 mL.
b Iona measured the temperature that salt water boiled at as somewhere between 102 and 104°C.
Sample
page
s

8 PEARSON SCIENCE 8 2ND EDITION
Review questions1.1MODULE
14 Identify the types of error shown in Figure 1.1.10.
Analysing 15 Contrast:
a errors and mistakesb reading errors and parallax errorsc instrument errors and zero errors.
16 Classify each of the following as either a mistake or an error.a Liz poured water from a measuring cylinder
but could not get every drop out.b Sam spilt some of the chemicals he was to
use in an experiment.c Jon didn’t bother clearing the dirt off the
balance he used.d Liana found it difficult to decide on
measurements that fell between the markings on a tape measure.
e Michael’s electronic scale was reading 0.1 g when empty and he didn’t ‘zero’ it.
17 Classify the data on the parrot listed in Figure 1.1.1 on page 2 as quantitative or qualitative.
Evaluating 18 Suppose a watch-glass has a mass of 50 g.
Propose a way of measuring 10 g of salt onto a watch-glass:a without using the tare buttonb with the tare button.
19 a Identify whether a measurement made with a metal ruler will be too high or too low on a:i hot dayii cold day.
b Justify your answers.
73 mL
FIGURE 1.1.10
10.15 s
32˚C
a
b
c
Sample
page
s

9CHAPTER 1 • WORKING WITH SCIENTIFIC DATA
MODULE
1.1 Practical investigations1 • Reaction times PurposeTo determine your reaction time.
HypothesisHow long do you think it takes for you to react—a second, half a second or less? Before you go any further with this investigation, write a hypothesis in your workbook.
Timing 45 minutes
Materials• 30 cm ruler• access to a calculator• stopwatch
Procedure 1 Construct a table like the one shown in the
Results section in your workbook. Alternatively, construct a spreadsheet that has similar columns to those in the table. Give your table or spreadsheet a title.
2 Work with a partner. Hold the ruler vertically with its zero in line with the top of your partner’s hand, as shown in Figure 1.1.11.
3 Without warning, let go of the ruler. Your partner needs to catch it as quickly as possible with their fingertips.
4 Note the reading of the ruler (in centimetres) at the top of your partner’s open hand.
5 Have two trial runs and then record in your table the distance dropped for the next three runs.
6 Repeat the experiment, but this time count down the ruler drop.
7 Try again, but have another student distract your partner (such as by talking to them or tapping their shoulder). Don’t count them down.
Results 1 Record all your results in a table or spreadsheet
like the one shown below.
Experiment Distance ruler dropped (cm)
Average ruler drop (cm)
Average reaction time (s)
no distractions, no warningswith countdown
with distractions
2 Calculate the average distances the ruler dropped in each experiment. Add your own answers to the table. Alternatively, program your spreadsheet to calculate the averages for you.
3 Calculate your average reaction time using the mathematical formula:
t = d490
To do this, follow these steps on your calculator:
• ÷ your average ruler drop by 490.
• Push the = button.
• Push the √ (square root) button.
The final answer is the time in seconds that you took to react. Add your times to the table. If you used a spreadsheet, then use the above instructions to program it to calculate the average reaction time for you.
ruler
Have your fingers level at zero.
The ruler has dropped 22 cm.
FIGURE 1.1.11
SPARKlab alternative available for this activity
Questioning & Predicting
Planning &Conducting
Processing& AnalysingEvaluating CommunicatingQuestioning
& PredictingPlanning &Conducting
Processing& AnalysingEvaluating Communicating
Sample
page
s

10 PEARSON SCIENCE 8 2ND EDITION
MODULE
1.1 Practical investigations
Review 1 If you have already measured your reaction time
using interactive games on the internet, then compare the result you obtained there with the result you obtained in this prac.
2 Of the different methods you tried, assess which is the most reliable way of measuring reaction time.
3 Digital stopwatches normally measure to the nearest 0.01 second. Compare this with your reaction time.
Measurement Average measurement
Average ± error
Units
#1 #2 #3 #4 #5
Length of laboratory
Temperature of tap water
Number of heartbeats in a minute
Time for a pen to drop 2 m to floor
Time for flat paper to flutter 2 m to floor
4 Your measurements using a stopwatch should never be thought of as perfect. Explain why.
5 List factors that affected your reaction time. Specify whether they made it better or worse.
6 Measurements taken in an experiment are more accurate when the experiment is repeated a number of times. Explain why.
2 • Repeated measurementsPurposeTo take repeated measurements and calculate their averages.
Timing 45 minutes
Materials• measuring tape• thermometer• stopwatch
Procedure 1 Copy the table below into your workbook.
Alternatively, construct a spreadsheet with similar columns to the table. Give your table or spreadsheet a title.
2 Measure each of the following as carefully as you can. Have each member of your prac team do the same.• length of the laboratory• temperature of tap water• number of heartbeats in a minute• time it takes for a pen to drop 2 metres to the
floor• time it takes for a flat piece of A4 paper to
flutter from a height of 2 metres to the floor.
Results 1 Use your results table or spreadsheet to record all
the measurements made by your prac team. 2 If you have five or more measurements then
cross out the outliers (highest and lowest measurement) for each.
3 Calculate the average of the remaining ‘good’ measurements. (If you have fewer than five measurements use them all.) If you used a spreadsheet, then program it to calculate the average.
4 State each measurement as an average ± error. Include the units you used.
Review 1 Explain why scientists repeat their measurements
instead of taking just one. 2 Contrast an error with a mistake. 3 Explain why errors happen in every measurement. 4 List the likely sources of errors in each
measurement you took in this investigation. 5 Classify the errors in your list in question 4 as
parallax, reading, instrument or human reflex. 6 For each measurement, assess which of these
errors was the most important.
Questioning & Predicting
Planning &Conducting
Processing& AnalysingEvaluating CommunicatingQuestioning
& PredictingPlanning &Conducting
Processing& AnalysingEvaluating Communicating
Sample
page
s

29CHAPTER 1 • WORKING WITH SCIENTIFIC DATA
Science would never progress if scientists only ever used secondary data. Progress happens because brand-new, primary data is obtained through experiments and scientific research. This research must be carefully planned or the data obtained will not be reliable.
MODULE
1.4 Planning investigations
Pendulum patternsPROBLEM Can you make a pendulum that can draw sand patterns?SUPPLIES• empty coffee tin, hammer and nail or hole punch,
string, broom or mop handle, two chairs, fine sand, large plastic sheet, masking tape, brush and dustpan
PLAN AND DESIGN
A punctured coffee tin full of sand and hung as a pendulum will trace out patterns on the floor as the sand drains from it. What sorts of patterns are produced? Design the solution. What information do you need to solve the problem? Draw a diagram. Make a list of materials you will need and steps you will take.
CREATE
Follow your plan. Draw your solution to the problem.
IMPROVE
What works? What doesn’t? How do you know it solves the problem? What could work better? Modify your design to make it better. Test it out.
REFLECTION1 What area of STEM did you work in today?2 How did you use mathematics in this task?3 What did you do today that worked well?
What didn’t work well?
4 funSTEM
Sample
page
s

30 PEARSON SCIENCE 8 2ND EDITION
Questioning, predicting and planningThis year, you and your team will need to design and perform more of your own investigations. Before you start planning any investigation you should:
• Be clear on the question you need to answer For your investigation, be clear on what you need to do and what you are testing. This means that you need to be clear on what variables you want to test and which you are to control.
• Get some background knowledge about what you are about to test You may have already done a similar experiment and know something about it already. You might find what you need to know from this book. Otherwise, you might need to search the internet or printed sources to find out something about it. This background information will enable you to predict what might happen. This will then provide you with the basis for a hypothesis.
• Brainstorm ideas from everyone in your team This way your team will come up with ideas that you may never have thought of by yourself.
• Know what equipment and materials are available It doesn’t make much sense planning an investigation that uses equipment that the school does not own or equipment that is reserved for senior science classes.
• Find out what is potentially dangerous in your investigation You particularly need to find out whether the chemicals you want to use are dangerous, and how to minimise their risks.
• Assess whether your planned investigation is ethical You need to make sure it will not hurt animals, the environment or others.
• Think about the best way to record your observations Consider whether you will use a table or spreadsheet to record your measurements, or whether a series of photos or a video might be better way of recording your observations.
• Think about the best way to analyse your data Consider whether a graph is needed and, if so, what type of graph (pie, column, line) is best for your investigation.
SafetyPerforming experiments can be dangerous and so every laboratory has a set of safety rules that must be followed. One common rule is shown in Figure 1.4.1. Others common to all laboratories are:
• Always follow instructions from your teacher or laboratory technician.
• Move about the lab in a safe way. Do not run, push or shove.
• Always wear safety glasses when using chemicals or a Bunsen burner.
• Unless instructed to do so by your teacher or lab technician, do not eat, taste, drink or sniff anything in the lab.
• Always tell your teacher if you break something or if you are unsure about what to do.
• Turn on the tap before placing anything under it. Otherwise the pressure might break whatever you are holding.
• Always tie back long hair before heating something. Otherwise it’s a fire risk!
• When the Bunsen burner is not in use, turn it to a visible yellow safety flame.
• Only use matches to light Bunsen burners. Do not use lighted scraps of paper.
• Always use tongs to pick up objects that have been heated.
• Hotplates, Bunsen burners, tripods and gauze mats remain hot for a long time. Allow them to cool before packing them away.
FIGURE 1.4.1 When heating a test-tube, ensure that it is pointed away from everyone (including you).
Sample
page
s

31CHAPTER 1 • WORKING WITH SCIENTIFIC DATA
Risk assessmentAll experiments are risky, or even dangerous, if you do not perform them carefully. For this reason, all experiments require a risk assessment, which tells everyone how risky they are and how those risks can be avoided or minimised. For most experiments, a risk assessment has been done by your teacher or the laboratory technician. For your own investigations, you will need to construct a list of potential risks and ways of minimising them. Without this list, you will not be able to start work.
Some risks will be obvious. For example, you will naturally avoid an experiment that would require someone to climb up a tall tree or one in which someone is hit with stones flung from a slingshot. However, you will not know how dangerous chemicals are. To find out, you need to search the internet for each chemical’s Safety Data Sheet (SDS) (Figure 1.4.2). Variables
Variables are factors that might have some influence on an experiment.
As an example, think of a simple experiment in which you are toasting a slice of bread. The time takes will depend on many variables (Figure 1.4.4).
A few variables are:
• the type of bread (Is it light and fluffy or heavy and dense?)
• the thickness of the slice (Is it thick, thin or in between?)
• how dry the bread is (Is it old, dry and stale or new, fresh and moist?)
• the make of toaster (Is it Sunbeam, Breville or another brand?)
• the age of the toaster (Is it new or old?)• how clean the toaster is. (Is it clean or covered
in crumbs?)
FIGURE 1.4.3 This police officer is undergoing hazardous materials training and is protecting himself by wearing thick rubber gloves, a protective body suit and a gas mask.
FIGURE 1.4.4 Many factors influence the time it takes to toast some bread. These factors are known as variables.
This sheet will tell you everything you need to know about the chemical you are using. It will tell you:
• its physical properties—for example, its melting point, boiling point, colour and density
• its chemical properties—for example, how it reacts with oxygen or whether it is an acid or a base
• what dangers it might present to you—for example, whether it will burn or trigger an asthma attack
• what you can do to minimise those dangers—for example, by wearing rubber gloves or by performing the experiment outside or in a fume hood (Figure 1.4.3)
• appropriate first aid if you accidentally come into direct contact with the chemical.
FIGURE 1.4.2 Safety Data Sheet
Sample
page
s

32 PEARSON SCIENCE 8 2ND EDITION
Not all variables are equally important. Some will greatly influence the experiment, while others will have little or no effect. Important variables here are the type of bread, its dryness and thickness, and the type of toaster. The cleanliness and age of the toaster will have some effect but probably not as much as other variables.
Independent variableOnce you have identified all the variables involved in an experiment, you then need to pick one to test. The variable you choose is known as the independent variable. It is the only one you are going to change. This is important because if you change more than one variable, it will be hard to work out which variable is having a direct effect on the results. Changing one variable at a time ensures that we know which variable is having an effect on the results.
For the toast experiment, you might choose the thickness of the slice as your independent variable (Figure 1.4.5). You would change the thickness of the slice and test its effect on the cooking time.
Dependent variableWhat you are trying to test and about to measure is known as the dependent variable. This is because it depends on the independent variable. Change the size of the independent variable and the size of the dependent variable is likely to change too. The dependent variable in the toast experiment is the time it takes to toast the slice—it depends on the thickness of the slice (the independent variable).
Controlled variablesAny experiment that you run needs to be a fair test. This means that only one variable should be changed at any time. All the other variables need to be controlled (or held constant). For this reason, these variables are referred to as controlled variables. If they were changed too, then you would never know which variable caused changes in the experiment.
In the toast experiment, the controlled variables would be:
• the type of bread (choose one type of bread and use it throughout the experiment)
• how dry the bread is (all the bread you test would need to be the same dryness and age)
• the make, age and cleanliness of the toaster (stick with one toaster and don’t change it).
Scientific researchAn experiment only changes one variable at a time. If you want to change another variable, then you need to run another experiment. This means that you could potentially run six or more different experiments to fully investigate the time it takes to toast bread!
A group of related experiments such as this is known as scientific research. Each new experiment changes another variable (with all the others kept constant) until you have tested them all.
Scientists do not carry out unrelated experiments but carry out scientific research on the one topic. This gives them a thorough understanding of that topic and allows them to become experts in it.
TeamworkScientists generally do not work by themselves but as part of a team like the one in Figure 1.4.6. Everyone is good at something and teamwork allows these strengths to be shared. Equally, we all perform less well at some things and teamwork allows others to help out when one of their members is struggling.
FIGURE 1.4.6 You will usually work as part of a team when carrying out scientific prac work.
FIGURE 1.4.5 The thickness and type of bread will affect how long it takes to toast.
Sample
page
s

33CHAPTER 1 • WORKING WITH SCIENTIFIC DATA
There are many different ways that teams can be organised. One that works well in the school laboratory is the managerial model in which there are four team members.
• Manager—this team member oversees the whole team and prac. They make sure that everyone knows what to do and that the prac work is completed on time.
• Communicator—this team member communicates with the teacher and laboratory assistant. All communication to and from the team should pass through the communicator. For example, the teacher may gather all the communicators together to go through the safety concerns of the prac or to show them how to use a particular piece of equipment. The communicator then passes on this information to the team.
• Equipment specialist—this team member collects all the required equipment and materials and makes sure the equipment is cleaned and returned to the correct spot at the end of the prac. They report any broken equipment to the communicator, who passes on the information to the teacher.
• Recorder—this team member records all the observations and measurements that are taken throughout the prac. They also ensure that all the other team members have their own copy of results before they leave the laboratory.
Ethical guidelinesScientists must be ethical in their research and so must you. Any investigation that you carry out needs to:
• be safe—assess all risks before carrying out any prac work and take steps to minimise those risks. Take care with equipment and chemicals and follow all laboratory safety rules
• be careful—avoid silly mistakes and make sure that all data is recorded accurately
• be honest—run fair tests and analyse your data accurately and fairly. If you use data from someone else, then acknowledge them in a resource list
• be respectful—respect the work of others, whether they are part of your prac team, your teacher, the laboratory technician or someone who has provided secondary data
• take care of the environment—chemicals can harm the environment, so dispose of them as instructed by your teacher or laboratory technician. If an experiment requires samples of soil, leaves, plants or animals then take only what you need and no more
• take care of animals—do not carry out unnecessary experiments on animals. If you do need to use animals (even insects and snails), then treat them with care and respect. If possible, return the animals to their habitat when you have completed your work.
Paper towels versus toilet paperPROBLEM Which is more absorbent—paper towel or toilet paper?
SUPPLIES
• paper towel, toilet paper, access to water, eyedroppers, teaspoons, measuring cylinders, cups or beakers
PLAN AND DESIGN
Design a fair test to find the solution. What information do you need to solve the problem? Draw a diagram. Make a list of materials you will need and steps you will take.
CREATE
Follow your plan. Draw your solution to the problem.
IMPROVE
What works? What doesn’t? How do you know it solves the problem? What could work better? Modify your design to make it better. Test it out.
REFLECTION1 What area of STEM did you work in today? 2 How did you use mathematics in this task?3 If another student was to do this task, what
advice would you give?
4 funSTEM
Prac1p. 37
AB1.8
STEMp. 40
NO
Sample
page
s

FIGURE 1.4.7 Pendulums are used in metronomes and some clocks.
ENDEAVOURSCIENCE AS A HUMAN
Use and influence of science
34 PEARSON SCIENCE 8 2ND EDITION
The pendulum
The pendulum is a simple device but it gave early scientists an accurate way to measure time and length, and it allowed early explorers to accurately determine where they were.
A pendulum is a mass (called a bob) attached to a rod, chain or rope that swings back and forth repeatedly.
A typical pendulum is shown in Figure 1.4.7. The period of a pendulum is the time it takes to complete one entire swing, back and forth, as shown in Figure 1.4.8. Period is measured in seconds (unit symbol s).
Pendulum variablesImportant variables that affect the period of a pendulum are:
• the length of the string—the longer the string, the slower the bob will swing and the longer the period
• gravity—a pendulum only swings because of gravity, but changing gravity significantly would mean travelling somewhere in space, which is highly unlikely.
The mass of the bob is another variable, but changing it has little or no effect on the swing and period. Likewise, the angle from which the bob is swung has little or no effect until it reaches more than 10°. Above that angle, the pendulum’s swing can become messy and irregular.
History of the pendulumIn 1602, the Italian scientist Galileo Galilei studied the pendulum and its variables in detail. His findings allowed scientists of the seventeenth century to develop new instruments that changed the way time was measured, how explorers determined their position on Earth and much more.
1 period
string
retort stand
bosshead and clamp
bob
FIGURE 1.4.8 A simple pendulum
AB1.9
Prac 3p. 39
Prac 2p. 38
Sample
page
s

ENDEAVOURSCIENCE AS A HUMAN
35CHAPTER 1 • WORKING WITH SCIENTIFIC DATA
TimekeepingPendulums swing regularly back and forth when allowed to swing from angles of less than 10° from the vertical. This fact allows pendulums to be used in clocks. Before 1656, clocks were often ‘out’ by as much as 30 minutes. However, in that year, Dutch scientist Christian Huygens built a pendulum-based clock that was accurate to within ten seconds per day.
Pendulums are still used to regulate the timing of grandfather and older-style mantle clocks today. The bob of a grandfather clock is shown in Figure 1.4.9.
SciFileFoucault’s pendulumEvery swing a pendulum makes is in a slightly different direction due to Earth’s rotation about its own axis. After 24 hours, the pendulum returns to its original direction. A pendulum that does this is known as a Foucault’s pendulum and it is evidence that Earth is spinning.
Standards of lengthScientists, builders and traders all over the world need to know the exact length of one metre. They need a standard length that doesn’t change. One early method of setting the standard length of one metre was suggested by French scientist Gabriel Mouton around 1670. His method used a pendulum. Gravity is roughly the same everywhere on Earth, and so the seconds pendulum swings the same way wherever it is located. To achieve a period of one second, a pendulum needs to be one metre long. Hence, anyone with a pendulum has an accurate way of measuring the length of one metre. Although convenient, this method of defining the length of a metre was abandoned in favour of other (non-pendulum) methods.
NavigationEarly explorers were often unsure of where they were on Earth because they had no way of accurately measuring their longitude (how far they were east or west on Earth). The invention of accurate clocks gave them the technology to measure time accurately. They set their clocks when they left port against standard Greenwich Mean Time. At noon, the Sun is directly overhead and the clock should read 12. If it didn’t, then it meant that they had travelled east or west. Every hour their clock was ‘out’ represented another 15° they had travelled from longitude 0°. From this, early explorers were able to calculate their longitude.
Shape of the EarthGravity is one of the variables on which the period of a pendulum depends. The swings of a pendulum can therefore be used to measure the value of gravity around the globe. Pendulums swing a little slower at the equator than at the poles. This proves that Earth is not perfectly spherical but has a greater diameter at the equator.
REVIEW1 Define the term period.2 Outline how the pendulum can be used for:
a accurate timekeepingb measuring the length of one metrec navigationd determining the shape of Earth.
FIGURE 1.4.9 Grandfather clocks use a pendulum to keep them accurate.
FIGURE 1.4.10 A metronome is an ‘upside-down’ pendulum. Its period matches the timing of the music being practised.
MetronomesMusicians use metronomes to keep in time when practising. A typical metronome is shown in Figure 1.4.10. A metronome uses a pendulum to regulate its time. The pendulum can be made to go faster by sliding the mass down the rod, and to go slower by pushing it upwards.
Sample
page
s

36 PEARSON SCIENCE 8 2ND EDITION
Review questions1.4MODULE
Remembering 1 Define the following terms:
a variableb fair testc risk assessment.
2 What term best describes each of the following?a variables that you keep constantb a group of related experimentsc the sheet with all the information you need to
know about a chemical.
3 List the variables that influence the time it takes to toast a slice of bread.
4 Match the different types of variables in the first column with their correct descriptions in the second column.independent fixeddependent changes naturallycontrolled changed by you.
5 List six ethical guidelines that you need to follow when carrying out scientific research.
Understanding 6 Why should you (or your teacher) check the
SDS of chemicals before an experiment?
7 a How many variables should be changed in a single experiment?
b Explain why.
8 Predict the pattern that would form in the STEM4fun on page 29.
Applying 9 Imagine aliens land on Earth and begin to carry
out experiments on humans. a Identify the ethical guideline that you really
hope they follow.b Explain how this relates to what you do in
the school laboratory.
Analysing 10 Contrast:
a scientific research with an experimentb independent and dependent variables.
Toaster make
Setting Bread type Slice thickness
Fresh or stale
Average time (s)
toastie high wholemeal thick fresh 40
toastie high white thick fresh 31
toastie high seeded thick fresh 45
toastie high wholegrain thick fresh 44
toastie high sourdough thick fresh 38
11 Analyse the following experiments and identify:i the dependent variableii two independent variables that are likely to
be important.a Prac A: To determine the amount of
sugar that can be dissolved in water.b Prac B: To determine the amount of time
a pet dog sleeps per day.c Prac C: To determine how long a
parachute takes to drop 50 metres.
Evaluating 12 What advantages and disadvantages do you
think the managerial model brings to the:a team? b teacher?
13 Someone in your team just got hurt in a prac. You want to tell the teacher but your team is organised on the managerial model and you’re not the communicator. What do you think you should do?
Creating 14 Benji and Bianca carried out an experiment to
test how long it took to toast a slice of bread. They repeated the experiment and calculated average times. Their results are shown in the table below.a For this experiment, identify the:
i independent variableii dependent variableiii controlled variables.
b Identify which type of graph below would best represent the above data.A line graph B histogramC bar graph D pie chart/sector graph.
c Design an experiment that tests which of five different toasters toasts a slice of bread the quickest.
LightbookStarter
LS LS
Sample
page
s

37CHAPTER 1 • WORKING WITH SCIENTIFIC DATA
MODULE
1.4 Practical investigations
1 • Parachute drop timePurposeTo determine what influences the drop time of a parachute.
Timing 45 minutes
Materials• lightweight materials (such as tissue paper, plastic
sheet from garbage bags, newspaper)
• fine cotton
• access to a hole punch• sticky tape• small masses (plasticine
or paperclips are ideal)• access to an electronic balance• stopwatch• metre ruler or tape measure
Procedure 1 Brainstorm all the variables that could affect the
drop time of a parachute.
2 Select the two variables that your team thinks will have the most effect.
3 What do you think will happen to the drop time as you change your selected variables—do you think it will increase or decrease? Before you go any further with this investigation, write a hypothesis in your workbook for each of your selected variables.
4 Design several different ways to test each of your selected variables. Select the best procedures and write them in your workbook.
5 Before you start any practical work, assess your procedure. List any risks that your procedure might involve and what you might do to minimise those risks. Show your teacher your procedure and your assessment of its risks. If they approve, then collect all the required materials and start work.
Hints• Only change the variable you have chosen to test.
Keep all the other variables the same.• When constructing your chutes, reinforce the
string holes with patches of sticky tape like the one shown in Figure 1.4.11.
SAFETY
A risk assessment is required for this investigation.
2 metresor more
parachute
sticky tape reinforcing
lightmaterials, e.g. paper,
plastic
stopwatch
small mass
FIGURE 1.4.11
• Drop your chutes from a height of at least 2 metres.• Make repeated measurements of the time they
take to hit the ground, recording the times in a table or spreadsheet.
• Use the STEM and SDI template in your eBook to help you plan an carry out your investigation.
ResultsConstruct a table and a line graph for each experiment.
Review 1 List the variables that your prac team thought
may be important in this experiment.
2 Explain why you chose the variables you tested and not others.
3 Describe the shape of all graphs you plotted.
4 a Construct conclusions for both experiments.b Assess whether your hypotheses were
supported or not.
5 Evaluate your procedure. Pick two other prac groups and evaluate their procedures too, identifying their strengths and weaknesses.
• STUDENT DESIGN •
Sample
page
s

38 PEARSON SCIENCE 8 2ND EDITION
MODULE
1.4 Practical investigations
2 • The pendulum and lengthThe time it takes for the pendulum to complete one swing (back and forth) is known as its period.
HypothesisWhat do you think will happen to the period of a pendulum when its length is increased—will the period increase, decrease or stay the same? Before you go any further with this investigation, write a hypothesis in your workbook.
PurposeTo test how the length of a pendulum affects its period.
Timing 45 minutes
Materials• materials to construct a
pendulum
• stopwatch or appropriate data-logging equipment
• protractor (optional)
Procedure 1 Design an experiment that tests what happens
to the period of a pendulum when its length is changed.
2 Write your procedure in your workbook.
3 Before you start any practical work, assess your procedure. List any risks that your procedure might involve and what you might do to minimise those risks. Show your teacher your procedure and your assessment of its risks. If they approve, then collect all the required materials and start work.
Hints• The independent variable here is the length of
the pendulum, and so you need to keep the mass and the angle the pendulum is swung from the same throughout the prac. Decide what mass and angle you will use, and keep them fixed.
• Decide on the lengths that you will test. At least five different lengths should be tested.
• Don’t attempt to measure the time of a single swing. Instead, measure the time for five or ten complete swings.
SAFETY
A risk assessment is required for this investigation.
• You need to repeat measurements for the time taken for ten complete swings. Decide how many times you will repeat each experiment.
• Use the STEM and SDI template in your eBook to help you plan and carry out your investigation.
Results 1 Construct a table or spreadsheet for the
measurements you take.
2 Calculate the average time for ten swings and for one swing (the period) or get your spreadsheet to do it for you.
3 Plot a graph of period versus length.Extension: One aim of a scientist when analysing results is to try and get a straight line when plotting graphs. If you didn’t get a straight line, then try the next few steps.
4 Make another column in your table. Use a calculator to take the square root √ of the lengths you used and enter these into the new column.
5 Plot a new graph of period versus square root of length like the one shown in Figure 1.4.12.
Review 1 Describe the shape of each graph that you
plotted.
2 List the controlled variables in this experiment.
3 What were the independent and dependent variables in this experiment?
4 a Construct a conclusion for your investigation.b Assess whether your hypothesis was
supported or not.
FIGURE 1.4.12
Per
iod
(s)
Length
• STUDENT DESIGN •
SPARKlab alternative available for this activity
Sample
page
s

39CHAPTER 1 • WORKING WITH SCIENTIFIC DATA
MODULE
1.4 Practical investigations
3 • The pendulum, mass and starting angle• STUDENT DESIGN •
ResultsConstruct a table or spreadsheet and a line graph to display your results.
Review 1 Explain how you controlled all the variables other
than the starting angle in this experiment.
2 a Construct a conclusion for your investigation.
b Assess whether your hypothesis was supported or not.
PurposeTo test whether mass and starting angles change the period of a pendulum.
HypothesisWhat do you think will happen to the period of a pendulum when its mass is increased or if it is swung from a bigger angle—do you think the period will increase, decrease or stay the same? Before you go any further with this investigation, write a hypothesis in your workbook.
Timing 45 minutes per variable
Materials• materials to construct a
pendulum
• stopwatch• protractor
Procedure 1 Your task is to design and report on an
experiment that tests how starting angle or mass affects the period of a pendulum (Figure 1.4.13).
2 Write your procedure in your workbook.
3 Before you start any practical work, assess your procedure. List any risks that your procedure might involve and what you might do to minimise those risks. Show your teacher your procedure and your assessment of its risks. If they approve, then collect all the required materials and start work.
Use the STEM and SDI template in your eBook to help you plan and carry out your investigation.
SAFETY
A risk assessment is required for this investigation.
1 period
string
retort stand
startingangle
bosshead and clamp
bob (mass)
FIGURE 1.4.13
Sample
page
s

STEMI N Q U I RY
40 PEARSON SCIENCE 8 2ND EDITION
MODULE
1.4 Practical investigations
BMXtreme
FIGURE 1.4.14 BMX rider in full flight!
BackgroundSport promoters are developing a new competition for BMX cyclists, like the one shown in Figure 1.4.14. The competition is like ski jumping. The competitors start up a ramp.They gain speed as they travel down the ramp, and leap from the ramp, with the aim of landing upright on two wheels. Unlike ski jumping, where the skier lands on a downhill slope, the ground on which the BMX rider lands is horizontal.
You are hired as a designer, and your job is to find the shape of a ramp that will enable competitors to get maximum horizontal distance from take-off. The difference between competitors will be in the speed that they can gain in travelling down the ramp and in their jumping and landing techniques.
It is too expensive to build a range of different ramps, so initially trial ramps will be modelled in a laboratory using a small ball rolling down and off the end. The challenge is to find the optimum ramp shape so the ball travels the greatest horizontal distance after leaving the ramp. You can use any scientific knowledge that you know about energy, or just use your common sense.
Following your investigation, you are required to write a report for engineers who will be responsible for the final design and construction of the real ramp.
In the report you need to explain the testing procedure, present the data, and accurately communicate your conclusions with justifications.
TaskYour task is to design a ramp for a BMX bike jumping competition (like a ski ramp).
Timing 2–3 hours across several lessons
ProcedureWork in small groups to identify the best shape ramp for use in the BMXtreme jump competition. Your group will propose designs, construct models and systematically test a variety of shapes for the jumping ramp. You will need to decide which shapes of the ramp to test, the measurements you will make and ways to make these measurements accurate and reproducible. During the testing, you will record your measurements (data). You will then analyse the data collected to find out which shape is best. Use the STEM and SDI template available on your eBook to help plan and carry out your investigation.
MaterialsYou will be provided with some basic materials, including:
cardboard (manila folder), marbles, straws, icy pole sticks, ruler or measuring tape, plasticine, sticky tape or masking tape, a sand or flour tray, and a bulldog clip and chair or table leg.
Your teacher may provide you with other materials.
Planning1 Identify the purpose.
2 Identify the independent, dependent and controlled variables, and only change one variable at a time.
3 Based on your purpose and the controls and variables, write a hypothesis for this experiment.
4 Summarise your experiment in a scientific report. Include the Purpose, Hypothesis, Materials, Procedure, Risk Assessment, Results (including data presented in table and/or graphs), Discussion and Conclusion.
Questioning & Predicting
Planning &Conducting
Processing& AnalysingEvaluating CommunicatingQuestioning
& PredictingPlanning &Conducting
Processing& AnalysingEvaluating Communicating
Sample
page
s

41
Chapter review1CHAPTER
Remembering 1 Define the terms:
a purpose b hypothesisc conclusion d bibliographye prefix f tare.
2 Which of the following statements are true and which are false?a A measurement ranging from 10°C to 14°C
could be written as 12 ± 2°C.b A measurement of 21 ± 1 cm spreads from 21
to 22 cm.c Human reactions cannot be faster than 0.5
seconds.d A line of best fit connects its points dot to
dot.e ‘The prac was fun’ is a good conclusion for
an experiment.
3 List three pieces each of qualitative data and three pieces of quantitative data that would help describe where you live.
4 List five types of errors.
5 List four variables that might be expected to influence:a a person’s fitnessb the time it takes to fry a sausagec the temperature reached inside a parked car.
Understanding 6 Why should you always be ethical in your
investigations and research?
Applying 7 Identify the variables that could logically
influence:a how quickly iron rustsb how quickly a banana ripensc how often you go to the toilet to urinated how good you are at sport.
Analysing 8 Analyse the graph in Figure 1.5.1 and predict the
sound intensity (measured in watts per square metre) at:a 2.5 mb 3.5 mc 150 cm.
9 Extrapolate the graph in Figure 1.5.1, extending it logically backwards to zero. Use your extrapolation to predict what the sound intensity at a distance of 0 metres would be.
10 Analyse the graph in Figure 1.5.1 and predict the distance at which the sound intensity was:a 45 W/m2
b 15 W/m2
11 Consider the following list of volumes: 87 mL, 82 mL, 90 mL, 86 mL, 97 mL, 93 mL.a Which results should be eliminated?b Calculate the average.
Evaluating 12 a Determine whether you can or cannot answer
the questions on page 1 at the start of this chapter.
b Assess how well you understand the material presented in this chapter.
Creating 13 Use the following ten key terms to construct a
visual summary of the information presented in this chapter.data internet experimentprimary secondary variableindependent dependent fair testcontrolled
0 1 2 3 4 5S
oun
d in
tens
ity
(W/m
2 )
Distance (m)
70
60
50
40
30
20
10
0
FIGURE 1.5.1
LightbookStarter
LS LS
CHAPTER 1 • WORKING WITH SCIENTIFIC DATA
AB1.11
Sample
page
s
42 PEARSON SCIENCE 8 2ND EDITION
Inquiry skills1CHAPTER
Research 1 Questioning
& PredictingPlanning &Conducting
Processing& AnalysingEvaluating Communicating
Search the internet for games that test how well you:a take measurements (use measurement games
for your search)b convert units (use skillwise unit conversion
for your search).
2 Questioning & Predicting
Planning &Conducting
Processing& AnalysingEvaluating Communicating
Search the internet for videos showing:a how pendulum clocks workb parachute drops and skydiver formations
(Figure 1.5.2).
Present your findings as a summary.
4 Questioning & Predicting
Planning &Conducting
Processing& AnalysingEvaluating CommunicatingQuestioning
& PredictingPlanning &Conducting
Processing& AnalysingEvaluating Communicating
Accidents caused the following discoveries to be made or caused another use for them. Research one of them.• penicillin (Alexander Fleming) • BakeliteTM (Leo Hendrik Baekeland)• Coca-Cola® (John Pemberton)• heart pacemaker (Wilson Greatbatch)• microwave oven (Percy L. Spencer)• radioactivity (Henri Becquerel)• Teflon® (Roy Plunkett)• saccharine (Constantin Fahlberg)• vulcanised rubber (Charles Goodyear).
Whichever one you choose:a state the year of the discoveryb describe the accident that caused it to be
madec describe the current use of the discoveryd list biographical details about its discoverer.
Present your research as a biography outlining the life of the discoverer and their accidental discovery.
5 Questioning & Predicting
Planning &Conducting
Processing& AnalysingEvaluating CommunicatingQuestioning
& PredictingPlanning &Conducting
Processing& AnalysingEvaluating Communicating
Advertising often uses data to make claims about particular products. Describe an advertisment that does this and analyse how the data is used to make the product look good.
Present your findings as a:• print copy or recording of the ad• summary of the data used• description of how that data was used to
convince people to buy whatever product or service is being advertised.
6 Questioning & Predicting
Planning &Conducting
Processing& AnalysingEvaluating CommunicatingQuestioning
& PredictingPlanning &Conducting
Processing& AnalysingEvaluating Communicating
Research the development of different standards for the length of one metre. Find:• what the toise was• the problems associated with the toise• how the size of the Earth was used to define
the metre• how modern scientists define the length of
one metre.
Present your findings as answers to the above.
FIGURE 1.5.2 Skydivers in formation
3 Questioning & Predicting
Planning &Conducting
Processing& AnalysingEvaluating CommunicatingQuestioning
& PredictingPlanning &Conducting
Processing& AnalysingEvaluating Communicating
In 1983, Air Canada flight AC143 ran out of fuel and glided to a safe landing at an abandoned air force base at Gimli, Canada. Research this flight to find:• details of its descent and landing• images/video of the flight• how the conversion between litres (a metric
unit) and gallons (an older imperial unit) led to the aircraft running out of fuel
• what else went wrong when landing and how this assisted the aircraft
• whether there were any injuries or deaths.
Present your research in digital form. In your presentation, classify the problems the flight crew had with their unit conversions as mistakes or errors. Justify your decision.
Sample
page
s

43CHAPTER 1 • WORKING WITH SCIENTIFIC DATA
Inquiry skills1CHAPTER
Thinking scientificallyAnila ran an experiment in which she measured the period of a pendulum. The period is the time it takes for a mass on a length of string to swing back and forth once. The data she obtained is shown in the table below.
Mass of bob (g)
Length (cm)
Angle swung from
Time for 10 complete swings (s)
Average period (s)
50 50 10° 142 1.42
50 100 10° 201 2.01
50 150 10° 246 2.46
50 200 10° 283 2.83
50 250 10° 317 3.17
1 Which two variables did Anila control in her experiment?A mass and lengthB length and angleC mass and angleD average period and time for ten swings.
2 Which of the following is the most likely aim for her experiment?A to test the effect of changing mass on the
period of a pendulumB to test the effect of changing length on the
period of a pendulumC to test the effect of changing angle on the
period of a pendulumD to test the effect of changing times for
ten complete swings on the period of a pendulum.
3 Anila did not try to time a single swing but instead timed ten complete swings. Identify the most likely reason explaining why she did this.A She can count to ten.B It reduced the effect of errors in her timing.C The change in period only becomes
noticeable after ten swings.D It was the only way to test her chosen
variable.
4 Identify which of the four sketch graphs A–D best describes her results.
Per
iod
Length
Per
iod
Length
Per
iod
Length
Per
iod
Length
Per
iod
Length
Per
iod
LengthP
erio
d
LengthP
erio
dLength
Per
iod
Length
Per
iod
Length
Per
iod
Length
Per
iod
Length
Per
iod
Length
Per
iod
LengthP
erio
d
LengthP
erio
dLength
LightbookStarter
LS LS
D C
B A
Sample
page
s
Glossary3CHAPTER
44 PEARSON SCIENCE 8 2ND EDITION
1CHAPTER
average: the mean; add up all the ‘good’ values and divide by how many there arebibliography: resource listbob: the mass on the end of a pendulum conclusion: a short summary of what you found out in an experimentcontrolled variable: the variable that is kept constant throughout an experimentdata: measurements and observations about somethingdependent variable: the variable that is being measured in an experiment; it changes as the independent variable changesdomain: the last part of a website’s address or URLerrors: small changes to measurements that cannot be avoided, even with careethics: the study of what is right and wrongextrapolation: the logical extension of a line graphfair test: when only one variable is changed in an experimenthuman reflex: your quickest reaction to something; for example, pressing a stopwatch to record a race timehypothesis: an ‘educated guess’ about what might happen in an experimentimprint page: a page that includes all relevant data about a book such as publisher and year of publicationindependent variable: the variable changed by you; it will probably cause a change in the dependent variableinstrument error: error due to a faulty instrument or using it at a temperature it is not designed forline or curve of best fit: a straight line or curve drawn through the ‘centre’ of points on a graphmean: average; add up all the ‘good’ values and divide by how many there aremistakes: things that affect your measurements but can be avoided with care; mistakes are not errorsoutlier: a value that is much smaller or much larger than the other values in a set of data
line of best fit
Spe
ed (m
/s)
Time (s)
parallax error: error caused by not having your eye directly in line with the measurementpendulum: a mass that swings back and forthperiod: time taken for a pendulum to complete one swing, back and forthprefixes: letters in front of standard unit symbols, e.g. m for milli, c for centi, k for kiloprimary data: data you collect yourself from an experimentprocedure: a description of what you did in an experimentpurpose: aim; what you are trying to do in an experimentqualitative data: observations that are descriptive only (no numbers)quantitative data: measurements that use numbers (and usually units)reading error: an error caused by having to guess, when a measurement falls between an instrument’s markingsresource list: a list of all resources used in gathering data for an experiment or report; also called a reference list or a bibliographyscientific research: a series of experiments on one topicsecondary data: data you have not found through an experiment; sources can be textbooks, encyclopedias, internet etc.tare: changing the zero on an electronic balanceteam: your prac partners and youURL: website addressvariables: factors that may influence an experimentzero error: error caused by an instrument giving a small reading when it should read zero
primary data
AB1.10
parallax error
0 5 10 15 20 25 30 35
Jo reads the measurement as 18.5.
Steve reads it as 20.
Waseem reads it as 21.5.
00.0gO
tare
Sample
page
s