Embed Size (px)
Citation preview
78
CHAPTER-3
LITERATURE SURVEY
Literature survey is important to learn what has been studied in the subject
and to identify area in which fresh research is necessary. Accordingly literature
survey was carried out. Books, articles, reports, journals, magazines, news
bulletins, research papers, news papers on the subject have been perused through
in detail. This has helped in identifying the research gap in this subject. This has
guided a lot in deciding the focus of this research.
The brief summary of some of the literature studied is given below:
In the paper, Enforcement- A key Component for Traffic Management in
Developing Countries- India, Regional Health Forum- Volume8, Number 1, 2004
Page 64-67 its author, Rohit Baluja has listed 17 major challenges in the area of
traffic management.
1. Mixed traffic conditions: Delhi, for example, has over 30 modes of transport
using the same road.
2. The Motor vehicles Act defines the responsibility of motorized vehicles only,
leaving out the non-motorized user in the absence of a Road Traffic Act;
3. Enforcement is not linked to engineering, driver training or road education;
4. The role and responsibility of enforcers are not defined, nor are they
adequately trained.
5. Enforcement agencies do not work in coordination;
6. Tools and systems of training are lacking;
7. Enforcers are willing to compromise;
8. Lack of political will;
9. Absence of driver training and negligent driver – testing;
10. Absence of traffic engineering as a science;
11. Unprecedented growth of motorized / non-motorized vehicles in the absence
of a basic public trans-port system;
12. Accident investigation – no qualitative information of causes and
consequences of crashes – without which remedial measures are only
hypothetical;
13. Without scientific investigation, punitive measures are enforced arbitrarily.
79
14. Enforcement in rural areas or on the highways hardly exists, whereas in the
urban metropolitan areas it is treated as a means of revenue collection;
15. Vehicle maintenance is a neglected area and vehicle safety enforcement is
almost non existent;
16. Right of way is not defined by the road maker, road maintainer, or the road
user; enforcers are also ignorant, and
17. Road encroachments are common and parking management is neglected.
The author feels “Road traffic enforcement should develop a culture of
responsible road use which demonstrates concern and respect for other road
users. Enforcement should lead to a smooth flow of road traffic without
compromising on safety, saving of time, protection of environment and fuel
conservation. Effective enforcement is one where the behaviour of the road user is
within the defined legal, engineering and ethical framework – where the right of way
is truly respected.
The author opines that “Enforcement needs to be defined within the holistic
perspective of traffic management along with other key elements of traffic
management." and suggests systematic driver training and emphasises the role of
highway and civic authorities and state that they should implement standard
practices of road safety engineering. Their role is not simply the road construction.
They should create safe road environment.
He also opines that “One of the biggest causes of enforcement failure is that
traffic engineering is not recognized as a science, and often the road infrastructure
is not conducive to enforcement of the law.” and states “A dedicated Traffic
Engineering Department in every metropolitan city to start with is a must, working
closely with the traffic Police in every city with a population of more than one
million.
He also suggests a comprehensive Road Traffic Act covering motorized as
well as non motorized traffic: “As the Motor Vehicles Act does not include non
motorized road users, the latter tend to break laws with impunity and become the
victims of road accidents. For example, in Delhi out of the 1700 annual fatalities on
roads 900 are pedestrians. Therefore, it is important to promulgate a Road Traffic
Act wherein the responsibility of road user is defined for every road user.
80
He feels that the law should be clear and all the stakeholders should be
made aware of the law: “Laws are not respected when they are not clearly defined.
Laws are also not respected when the road users to whom these laws are
applicable are unaware of them. Therefore laws must be made as simple as
possible, in consultation with all stakeholders, and should be promulgated only after
wide publicity.”
He wants that the role of traffic police should expand “Consultation with other
agencies and the public in creating a safe road culture should be the primary role of
the traffic police force.”
He suggests following preventive measures for traffic Police:
(1) Control and direct the non motorized traffic to ensure their safe
movement;
(2) Guide and help the road users unfamiliar with the specific rules and
regulations:
(3) Make sure that pedestrians / cyclists use such facilities like pedestrian
crossings, subways etc. and that they do not become potential
hazards to safety.
(4) Help the disabled road users without compromising their safety, and
He prescribes some persuasive methods for traffic police as:
(1) Issuing verbal warnings for offences;
(2) Holding the erring road users in custody for a short duration.
He also emphasises the training of traffic police personnel: “Police training
schools, colleges and academies must have a planned curriculum on all aspects of
traffic management. Before being posted with the traffic police, all police personnel
must undergo specialized raining.
He also recommends creation of separate Collision Investigation, Analysis &
Research Department as “Reconstructing serious collisions would provide
information about their causes and consequences. Analysis of such information
would help the authorities find solutions in the areas of road user awareness, driver
training, road engineering and enforcement for enhancing road safety.”
The paper, ‘The Cost Effectiveness of Traffic Enforcement case studies from
Uganda by David Bishai, Brain Asiimwe, Syed Abbas, Adnan A. Hyder, William
Bazeyo is very useful for studying traffic effectiveness of enforcement. This is one
of the rare studies on this subject.
81
Objective: In October, 2004, the Ugandan Police department deployed state of the
art traffic safety patrols on the four major roads to the capital, Kampala. We sought
to assess the costs and potential effectiveness of scaling up traffic enforcement in
Uganda.
Methods: It conducted record review and key informant interviews at 10 stations
along the highways that were patrolled. Monthly data on traffic citations and
casualties were reviewed for January 2001 to December 2005 and time series
(ARIMA) regression is used to assess for a statistically significant change in traffic
deaths. We computed the potential revenue from traffic citations.
Results: The preliminary estimate of the annual costs of deploying the four squads
of traffic patrols (20 officers, 4 vehicles. equipment, and administration) is estimated
at $72,000. Since deployment, the number of citations has increased substantially
with a value of $327.311 annually. Key informants claim that speeds are lower and
crashes are fewer. Monthly crash data pre and post intervention show a statistically
significant 17% drop in road deaths after the intervention. The average cost
effectiveness of better road safety enforcement in Uganda is $603 per death
averted or $27 per life year saved (amounting 1.55% of Uganda's $1800 GDP per
capita)
Conclusion: The costs of traffic safety enforcement are low in comparison to the
potential number of lives saved and revenue generated. Scaling up traffic safety
enforcement could be an extremely cost-effective public health intervention.
It notes that there is ample evidence that enforcement is much more
effective if it forms part of a systematic approach to road safety and is backed up by
information and engineering measures.
The main objective of traffic regulation enforcement is road safety –
achieved by deterring, road users from committing, offences which are related to
road crashes and injuries. It is not to maximise the number of infringement notice
issued.
Police activities should primarily serve as deterrence for drivers inclined to
commit traffic offences through increasing road users perception of the risk of being
caught. Consistent deterrence strategies, which typically comprise highly visible
police or camera activity can bring about lasting changes in road user behaviour
and, as a consequence, changes in road users attitudes which reinforce these
behavioural changes.
82
Excess speed is by the most frequent road traffic offence. The problem of
excess and inappropriate speed is the most common and the most serve road
safety problem. Both, crash frequency and crash severity increase as driving speed
increases. The potential for reducing crash injury, and particularly fatal injury, is
substantial. On average, a 4 per cent reduction in crashes is estimated to occur for
every 1 km /h decrease in average speed. The benefits are particularly high where
vulnerable road users are involved: the probability of a pedestrian fatality reduces
from 85 per cent at 50 km/h to less than 10 percent at 30 km/h.
It also observes that traditionally, two types of operational policing, methods
have been used to reduce speeding, but only one of them has proved to be
effective in influencing behaviour and crashes. The Stationary methods generally
involves an observation unit, typically an unmarked police car more or less hidden
at the roadside, and an apprehension unit comprising one or more marked police
cars, clearly visible at which point speeding drivers are stopped. Mobile methods
are defined as enforcement of traffic behaviour, and apprehension of individual
offenders from a moving unmarked car. Studies that have evaluated experiments
with mobile enforcement only, indicate that mobile methods neither have any
lasting, measurable effect on speed behaviour, nor on speed – related crashes.
It mentions that in recent years speed camera technology has been used
very cost-effectively. A recent analysis of 11 studies evaluating the effects of speed
cameras found an average reduction of 19 per cent in the number of casualties.
The reductions were found to be larger in urban areas (28 per cent) than in rural
areas (4 per cent).
Speed enforcement strategies will need to include prolonged, high intensity
enforcement efforts to reach optimal effectiveness. Speed enforcement without
such long – term strategic commitments has at best, transitory effects.
It notes: “Wile drink driving is relatively infrequent, compared to other traffic
offences, it is highly dangerous. For the EU as a whole a rough average of about 3
per cent of journeys are associated with an illegal BAC, but about 30 pr cent of
injured driver are under the influence of alcohol. Alcohol is one of the major causes
of causes of crashes and can increase the severity of injury outcomes. The key to
successful enforcement strategies to reduce alcohol related casualties is to
increase drivers’ perception of the probability of detection through programmes that
involve the following
83
It makes a very important observation: “Enforcement that is unpredictable in
terms of time and place, deployed in a widespread manner to ensure broad
coverage of the road network and difficult (for drivers) to avoid when encountered.
It observes very commonly made statement but never ensured: “The main function
of police control is to demonstrate that the law is being, enforced.”
In order to improve the effects of enforcement, the following supporting
measures are necessary;
1. Drivers must be informed at local level about police activity (frequency
and detection rate) and the level of compliance.
2. Attitude – oriented campaigns must be conducted, showing that safety is
the main reason for the regulation in question. Combine media advocacy
efforts with increased enforcement level.
3. Feedback to police officers concerning the goals and effectiveness of
control activities.
It gives the essential elements successful strategies as:
1. Increasing perceived probability of detection through programmes that
involve (a) a high number of persons tested (at least one in ten drivers every
year).
2. Targeted policing can be employed to maximise apprehension of persistent
offenders.
3. Enforcement should be accompanied by publicity in order to inform drivers
and provide them with feedback which will sever to increase public
acceptance of enforcement activities and reduce public acceptance of
drinking driving.
4. Finally, the enforcement process has to be monitored carefully and corrected
where necessary. This requires close and continuous contacts between
police, researchers and policymakers.
Regarding use of seat belts it observes: “About 75-80 per cent of EU Passenger car drivers reported using belt in the front seats in 1996 in most countries rear seat belt use was substantially less. If every car occupant had used existing seat belts that year about 10,000 of a total of 25000 killed car occupants in EU would have survived, About 7000 lives could have been saved had all wearing levels been up to the best achieved internationally.”
84
About Failure to observe red lights it points out that pedestrian crossing
lights is a major safety issue in urban areas. The same applies to offence which
involve failure to observe the priority or right of way of other road users, which
comprise about half of the road collisions in urban areas and states that the same
observation applies to offences such as use of restricted lanes, making U-turns or
turning left or right where prohibited or overtaking in chevron indicated areas. All
these types of behaviour emerge as disproportionately risky in crash analysis but
are rarely the targets of systematic enforcement.
Traffic regulation enforcement has mostly concentrated to date on the
important problems of speeding, alcohol impairment and failure to use seat belts. At
the same time, there are other important offences in road safety terms which have
yet to be included as priority areas in police work. For example, errors in over
taking or over taking offences result in very serious crashes. Failure to observe red
lights or pedestrian light is a major safety issue in urban areas. Maintaining short
distances (tailgating) substantially increases risk of rear-end collision. All these
types of behaviour appear disproportionately risky but are rarely the target of
systematic enforcement. Aggressive driving is a major source of irritation amongst
road users. Only when the scope of enforcement is widened to include these
offences will the road user be made aware that it not acceptable to violate
regulations whatever they concern.
The effectiveness of traffic law enforcement is dependent on the efficiency of
the legal system. Traffic law is in most countries part of criminal law. While this may
be appropriate for serious offences it is hardly possible to process the myriad of
offences without making an exceptional demand on policing manpower or closing
up the courts. In several EU countries, the processing of offences is brought under
civic or administrative law in order to increase the efficacy of the law enforcement
system.
In several EU countries automatic detection and registration is used for
offences such as speeding and red light running. These approaches are very cost-
effective and will need to be widely adopted in traffic regulation enforcement
strategies.
It makes following proposals for effective traffic low enforcement in EU countries:
85
1. For each offence, integrate police enforcement activities into the national
traffic safety policy relevant to that offence, at least including publicity
activities.
2. Increase effectiveness of detection by allowing random breath testing, and
camera evidence for offences such as speeding red light violations and
tailgating.
3. Develop information and training, resources in order to increase awareness
and competence of police enforcement staff.
4. Obtain explicit agreements between the various actors (legislators, police
prosecuting bodies) about the consequences that follow detection of
offenders.
5. As part of the EU road safety information system, communicate the results of
specific demonstration project amongst policymakers and police.
It also gives a Dutch experiment: “A Dutch experiment in 1988 shows that
intensive, random alcohol controls by the police can have a marked effect on the
alcohol consumption of road users and that this effect lasts for more than half a
year ( Mathijssen & Noordzij, 1993) In the city of Leiden the effect of the following,
comprehensive enforcement strategy was tested:
1. High enforcement level at the start of the intervention, followed by a slow
reduction;
2. Controls by small control teams ( 2-4 policemen)
3. Random breath testing ( 1 test per 14 motorists in 12 months)
4. Very conspicuous enforcement at times and places with a lot of traffic but
small proportion of offenders;
5. Unobtrusive controls at places and times with low traffic but a lot of
offenders.
6. Continuity in enforcement ;
86
7. Extensive publicity ( information about conformity level; information about the
legal limit, information which increases the perceived risk of getting caught.)
The results were noted as under:
The percentage of drivers with a BAC – level of more than 0.5 per mille
dropped from 8.1 per cent to 6 per cent. Due to the application of these measures
(including evidential breath testing) in the long run the proportion of drivers over the
legal BAC – limit dropped to 3.9 per cent in 1991. After that date, reorganisation of
Dutch police had the effect that random breath testing dropped nearly to a zero
level in 1994 (Mathijssen, 1997) and, as a consequence, the incidence of drink
driving again increased. This experiment and the following real life experience show
the need for a comprehensive strategy including random breath testing activities on
a continuous basis.
Another interesting case, showing the effect of strategically planned random
breath testing enforcement on offence rates in Finland. In this country, the risk of
being caught for drunken driving has increased considerably sins 1977 when the
police were first empowered to carry out random breath tests.
Over the year the enforcement strategy has developed. The share of visible
enforcement increased and has reached 70 per cent of all enforcement on drunken
driving.
1. Voluntary crash reporting and mass media coverage and
2. Targeted government information mainly from the police and Central
Organisation for Traffic Safety ( Liikennevetura)
The application and development of these enforcement and publicity activities was
followed by a positive trend in the incidence rates of drunken driving; The number
of those caught for drunken driving has fallen during the past ten years from 33 out
of 1000 to 14 out of 1000 ( Makinen and Veijalainen, 1997)
A recent Swiss study results has shown that random breath testing is
amongst the most cost effective safety measures that can be taken ( Eckhardt and
Seitz, 1998).
The positive effect to combining media advocacy efforts, which increase drink
driving news coverage, and greater police activity (officer time, training, equipment,
and checkpoints) which increases the enforcement level, are experimentally proven
(Holder, Voas, and Gruenwald, 1997)

87
Both motorists and pedestrians cause safety problems at pedestrian
crossings. Pedestrian risk taking and inattention, and in some countries
intoxication, increase the risk of being run over by cars considerably. Moreover,
adverse conditions such as rain and darkness or the two combined create
favourable circumstances for crashes. Risks for pedestrian crossing crashes are
highest in darkness and during the rain. Very often crashes at pedestrian crossings
are caused directly or indirectly by speeding vehicles driving free, that is, outside
queues (Pasanen, 1991).
When enforcing red light offences, it recommends the following points:
1. Intervene also with offences made by pedestrians; use warnings, since they
are effective in controlling behaviour,
2. Use camera techniques having, both red light and speed monitoring
capabilities
3. Keep cameras operational especially in adverse conditions, and make it
known to the driving public,
Road Rage:
It defines and road rage and makes important observations: “Road rage can
be defined as inappropriate violent reaction of road users to incidents involving
other road users. Incidents in which drivers performed aggressive manoeuvres to
tech the other driver a lesson” and which result in a crash involving the victim and
incidents in which drivers physically attack fellow drivers for unclear reasons are
making the headlines. The frequency of such incidents is very difficult to establish
and the only empirical evidence available is from a study carried out on behalf of
the UK Automobile Association (Ward et at., 1998).
Less extreme, but more frequent than road rage is aggressive road user
behaviour. Shinar (in press) distinguishes between instrumental aggression (that
serves to gain advantages such as jumping a queue ) and hostile aggression ( That
is directed towards the driver evoking the aggression). Parker, Lajunen and
Standing (1998) further distinguishes between initiated aggression and retaliatory
aggression and found that aggressive behaviour is relatively frequent and that
incidence of this behaviour is not strongly related to that of other offences.
Particularly worrying is that fact that drivers feel justified to commit retaliatory
aggression (that is directed towards the driver evoking the aggression).
88
Aggressive driving is experienced by many drivers as threatening and anti-
social and for this reason alone should be a subject for enforcement. Analogous to
the zero tolerance approach in social deviant behaviour and crime, police
enforcement units can crack-down on aggressive behaviour.
There is no single measure that can solve safety problems caused by illegal
and dangerous driving manoeuvres. There are several engineering measures that
should be used in the elimination of risky driving manoeuvres. This applies
especially to junctions. where these measures have not been used, enforcement is
needed and these instances are still too many.
Due to scant resources the police have to make clear strategic choices. This
means that it is of no use to focus on the innumerable number of isolated
infringements prescribed by various European traffic laws. The key enforcement
areas have to be defined and enforcement executed in these areas in the way that
has a deterrent effect on driving manoeuvres.
Drug Driving:
Evidence is accumulating of increased psychoactive drug, use in car drivers.
For example Morland et al. (1995) found a psychoactive drug other than alcohol in
every third case under suspicion of driving under the influence in Norway, where
apprehensions for suspected drug influence in drivers have increased more than
300 per cent between 1983 and 1996 ( Christophersen et al. 1997) In a random
sample of 1237 drivers in Italy. Zancaner et al. (1995) found 2.2 per cent to be
under the influence of drugs of abuse or psychoactive drugs. However the role of
most drugs in contributing to crash frequency is still unknown.
It is noteworthy that, with the notable exception of alcohol, popular minor
tranquilizers and perhaps tetrahydrocannabinol ( cannabis), it is generally unknown
which drugs under what conditions may impair road-user performance and safety (
for example, for antidepressants see Linnoila and Seppala, 1985) Epidemiological
evidence clearly demonstrates that benzodiazepine users are over represented in
injured and fatally injured drivers ( Ellinwood and Heatherly, 1985) Although
controlled laboratory and driving task studies support the notion that cannabis
induces impairment ( Moskowits, 1985), and a growing incidence of cannabis in the
blood of fatally injured drivers is found in some countries, the evidence for its
89
relationship with crash causation is ambiguous ( Moskowits 1976, 1985;
Robbe,1994)
Determining the relationship between drug dose-level and increased crash risk is a
complex issue for epidemiological and experimental research. Evidence that
“drug driving" constitutes a road safety hazard is lacking.
Other problems which confound interpretation of the relationship between
drug levels (however measured) and driving safety include:
1. Most drugs are unlike alcohol in that they do not exhibit a simple relationship
between drug blood level and impairment level
( Moskowits, 1985 and Ellinwood and Heatherly, 1985);
2. Drugs within a particular category, e.g. antidepressants, can vary widely in
their influence on driver behaviours such as braking distance;
3. There are large individual differences in response to particular drugs;
4. Short term effects may differ from long-term effects. The crash risk of elderly
patients using long half-life benzodiazepines (defined as those that take
more than a day for half the dose to be eliminated from the cody) is
increased by 45 per cent. This drops to 25 per cent after one year of use
( Hemmelgarn et al. 1997)
5. There are many drugs in current use and several are often taken at the
same time. Combinations of drugs may have synergistic ( for example,
codeine and antiopsychotic drugs with alcohol) or antagonistic effects. The
number of possible interactions is astronomical ( McKenna 1985);
6. Blood levels of some psychoactive drugs ( for example, cannabis) drop very
sharply after uptake and yet the behavioural effect often occurs only when
blood levels of psychoactive constituents have returned to a very low level.
Because of these problems, behavioural testing may have to become the critical
means of documenting intoxication rather than assessing drug levels directly.
However the development of sensitive and reliable behavioural test batteries
operable in field conditions and sensitive to both drug and alcohol impairment has
not been accomplished.
90
Role of Fatigue:
At present insufficient information is recorded about crashes to determine
the role of fatigue. However, some investigators (for example, O'Hanlon, 1978)
conclude that around 10 per cent of road crashes may be attributable to falling
asleep at the wheel, and that fatigue contributes to an even larger proportion of
single vehicle and commercial vehicle crashes (Harris and Mackie, 1972)
Implementation of improved crash reporting systems is needed so that better data
are available for judicial purposes and for research into crashes in which fatigue
may be involved (Hartley, 1996).
Driver fatigue arises not only from hours spent at the wheel but also from
many other causes such as length and regularity of work and duty spells, available
rest and continuous sleep time, and the location of duty, rest, sleep and driving,
periods within the 24 hour diurnal cycle (Brown 1994).There are also individual
differences in susceptibility to fatigue under various conditions. Despite this body of
knowledge, current EU regulation of working time in the haulage industry
(Regulation 3820/85) refers exclusively to daily and weekly hours of driving and rest
periods, although this is currently under review. Thus limiting driving hours (for
example, through enforcement of tachograph measures ) does not address all the
other causes of fatigue although it may be most practicable strategy to ensure that
drivers have adequate time for continuous sleep during each 24 hours period.
Effective fatigue management however will require that other causes of fatigue are
also addressed.
Short Headways:
The causes for too short headways are several:
1. Drivers are not aware of safe driving distances,
2. Driving faster than the median speed of traffic cause situations where
overtaking is necessary and those waiting for an opportunity to overtaking
are often following too closely.
3. Drunk driving or driving under time pressure,
4. Short headways are used often means for aggression, for example,
"punishing" or pushing other drivers for driving, either too slowly or for some
other misconduct.
91
The reasons for driving too close imply that no single measure can improve the situation. There are at least the following steps needed to tackle the problem
1. Use driver supports such as electronic feedback to indicate the recommended distance. Combined with the presence of the police, the effects may even be increased.
2. Use information to increase both the awareness of drivers of the problem and of the activities of the police concerning close following,
3. Focus enforcement specific conditions, such as adverse weather, where close following is likely to increase the risk of a rear-end crash. Video-techniques may be used for monitoring and for producing evidence of close-following.
For enforcement of short time headways to be effective, it is important that the objective risk of detection is considerably increased and combined engineering measures and information are used.
Short time-headways are associated with a large number of rear-end crashes and also with some other types of crashes – and rear-end collisions are the most frequent crash type in several countries. Although, the consequences of rear-end collisions are usually not as severe as with other types of collision, the total number of them causes great economic losses and disturb traffic flow. On the other hand, the severe crashes which take place infrequently on motorways and which involve a large number of cars are caused by a combination of factors including driving too fast for conditions, keeping too short a time-headway and adverse weather conditions.
Junctions are the most frequent crash sites in urban areas. Typically, the proportion of casualty crashes ranges from 40 per cent to 50 per cent in European cities. In addition to rear-end crashes, many other types of crashes occur at junctions such as:
1. Collisions with intersecting traffic including non-compliance of right hand rule, yield sign, stop sign and traffic signals,
2. Crashes when changing a lane, 3. Crashes involving unprotected road users, 4. Single vehicle crashes ( Drunk driving)
The causes for these crashes vary considerably. Very often, they are associated in one way or another with excess speed or inappropriate speed. Another significant factor is the over-involvement of elderly road users in these crashes.
92
Enforcement to influence behaviour:
Enforcement to influence behaviour at junctions has received relatively little
attention. There are only a few experiments using conventional enforcement And
these concern mostly automated enforcement methods at signalised junctions
( Zaal, 1994) The results indicate that these can result in a substantial decrease in
mean speeds, ranging from 5 – 10 km/h, and the number unnecessary and
prohibited lane changes at junction areas ( Anila & Makinen 1997)
It has been shown over the years that usually most forms of traffic behaviour
can be affected through enforcement, but these effects are usually short term in
time and space ( Syvanen, 1971; Spolander, 1972; Rothengatter, Burin and
Rooijers, 1989; Makinen, 1990 and Zaal, 1994). When enforcement is repeated
and combined with information, the effects show at least some sign of permanency
(ibid.) Accordingly, junction enforcement should include the following elements:
1. Make known to the public what is done in terms of enforcement, repeated
enforcement and publicity campaigns at junctions are needed,
2. Concentrate on speeds,
3. Concentrate on interaction of cars and unprotected road users,
4. Monitor the observance of yield sighs – consider especially the problems of
elderly road users,
5. Use camera enforcement,
6. Make enforcement sufficiently visible,
7. Increase the awareness of unprotected road users in terms of visibility ( use
of reflectors.
Seat Belts:
International research and experience show that the use of occupant restraints is a
highly effective way of reducing serious and fatal injuries to car occupants. The
injury reducing effect of seat belts is around 50 per cent for fatal and serious
injuries.The serious injury reducing effect of child restraints is around 90 per cent
for rearward facing systems and around 60 per cent for forward facing systems (
ETSC, 1996). The seat belt not only reduce the forces on the body but also keeps
the body in its position in the car in crash, so preventing ejection and contact with
other parts of the vehicle.
93
Seat belt wearing is mandatory in the front and rear seats of passenger cars
in European countries. However in spite of this legislation, usage differs a lot
between countries. About 75-80 per cent of EU passenger car drivers used their
front seat belt in 1996. Rear seat belt use was much lower. If every car occupant
had used available seat belts that year about 10,000 of a total of 25000 killed car
occupants in EU would have survived. About 7000 would have survived had all
wearing levels been up to the best achieved internationally.
Research has found that the higher the use among drivers, the higher the
use among passengers. Seat belt usage by passengers is treated independently of
the driver in most legislation, although in some countries drives have legal
responsibility for the passengers seat belt usage. Even if it is left to passengers
themselves to use the seat belts, the driver has the responsibility to make the seat
belts available and fit for use and used by children in any case.
Usage among drivers in some countries tends to be high on motorways but
low in urban areas. Acceptance among car occupants varies a lot between different
countries, which is hard to explain as the vehicle fleet and the road network is very
similar.
Young male drivers, for example, use their safety belt less often than other
groups and are more often involved in crashes ( Van Kampen, 1985) Moreover,
negative attitudes towards using seat belts are associated with positive attitudes
towards traffic law offences such speeding that increase crash risk.
Compared to drivers and front seat passengers, seat belt usage amongst
rear seat passenger still is very low in some EU countries. In general, a higher use
among drivers results in higher use among passengers. Drivers alone in a car uses
the seat belt less than if a passenger is present, which explains why front seat
passengers on overage have a somewhat higher usage then the average driver.
Seat belt usage is influenced firstly as to whether a legal requirement exists
to use seat belts and secondly the degree to which enforcement complemented by
publicity campaigns are carried out.
The former was amply demonstrated in Switzerland where in the 1980's the
seat belt laws were temporarily withdrawn due to legal problems. During the period
the law withdrawn, seat belt usage dropped significantly while seat belt usage
increased after the law was reintroduced even though no major enforcement
activities were undertaken.
94
Many national and local studies show that enforcement increases seat belt
use and especially if it is combined with other activities such as information
campaigns. Substantial increases have been achieved in studies reported by, for
example, Jonah, Dawson and Smith (1982) Johan and Grant (1985) and Gundy
(1988). The best way of achieving increasing is through intensive, highly visible and
well publicised enforcement. So-called 'blitz' approaches have been shown to be
extremely effective in producing sharp increases in seat belt wearing. If such 'blitz;
enforcement, usually lasting only one to four weeks, is repeated several times a
year, high levels of wearing rates can be maintained. In some studies (for
example, Gundy, 1988), wearing rates after two years still remained above the
original baseline level. The STEP enforcement and publicity campaigns carried out
in Canada (see ETSC 1996) have also been shown to be most effective.
Alternatively, incentive programmes have been devised in which seat belt
use is monitored and seat belt wearers are eligible for a reward – ranging from a
free hamburger voucher to a lottery ticket for sizeable rewards such as video
recorders or free holidays. In general, these incentive programmes appear very
effective. Hagenziejer (1997) carried out a meta-analysis of 34 studies investigating
the effects of incentives on seat belt use and found the effect size to be related to a
number of variables such as target population, initial baseline rate and the
immediacy of the rewards. Incentives programmes, moreover, generally have a
higher level of acceptance than strict enforcement programmes.
Ultimately technological solutions will be able to reach the last 10-20 per
cent of unbelted occupants who cannot be reached by other means. Intelligent
warning systems when the belts are not used proved an acceptable and sufficiently
effective method if the waning is made sufficiently aggressive according to Swedish
studies. Once public acceptance is sufficiently high an even better result could be
reached by compulsory interlock systems.
Gundy (1988) carried out a simple cost/benefit analysis and concluded that
the combined awareness / enforcement programme is very cost effective: an
expenditure of less than 1 euro per inhabitant resulted in an increase in wearing
rate of more than 15 percentage points, leading to a net " profit " of almost 1.5 euro
per inhabitant. Even if the programme had been 2-5 times as expensive it still
would have paid off. Laundry (1991, quoted in Zaal, 1994) estimated that in
Canada a one per cent increase in seat belt usage rates would result in 18 fewer
95
road fatalities and 500 fewer injuries each year. Zaal ( p.131) concluded that these
( and other ) estimates "clearly demonstrate the potential cost saving which could
result from an increase in the level of seat belt use enforcement activity".
In conclusion, seat belt use is crucial to safety. Even if wearing rates are
high, improvements in wearing rates reduce crash fatalities as non wearers are
usually disproportionately at risk of being involved in a fatal crash. Enforcement
appears effective in increasing wearing rates, so called blitz involving very high
levels of enforcement over a short period of time can, when applied repeatedly,
result in long-terms effects. High levels of publicity are crucial for optimising the
effects of enforcement. Incentives programmes are a viable and effective addition
to enforcement. There is ample evidence that activities to increase wearing rates
are highly cost-effective.
The type of offences subject to traffic enforcement needs to be broadened.
Only when this is achieved will the road user be made aware that it is not
acceptable to violate traffic regulations, whatever these may concern.
There is a growing concern with regard to the increasing likelihood of road
users displaying uncooperative, aggressive or violent behaviour towards each
other. For a large part, this can be attributed to media – hype emphasising
exceptional incidents. However, this may not be the only explanation of this
phenomenon. Society, in general, is tending to become more competitive. The
reliance on informal rules in traffic was perhaps efficient when these were evident
to all road users but with the growing culture diversification and cross border traffic,
this is no longer the case. Finally, the rapid increase in traffic intensities not only
augments the number of interactions and conflicts between road users, it is also
likely to increase frustration and, thus inappropriate, emotional reactions to
conflicting situations. This poses a new challenge for policing activities and traffic
regulation enforcement.
In principle, it is possible to automate all police enforcement activities that
are related to objectively observable behaviour. Devices for the automatic detection
and registration of speeding offences are now used, albeit in too infrequently, in
most EU countries. Likewise devices for red light running are being installed more
and more. In principle, it is possible to develop devices for a wide range of easily
observable offences.
96
One step further is to build such devices into the vehicle. A number of EU projects have demonstrated that this is feasible and can apply to a wider range of offences.
When in vehicle devices are capable of detecting offences by comparing the required behaviour of the driver with the behaviour that is actually displayed, it is also possible to limit the driver's options of committing traffic law offences.
These developments will drastically change the possibilities of enforcement and need to be taken into account in the development of future strategies.
When the drivers options to commit traffic law offences are forcefully limited resistance is likely to occur and the social acceptance of such measures is likely to be questioned. This is certainly a point of concern in the development of future strategies, but early studies to this effect indicate that the majority of road users are capable of seeing the advantages of a more restrictive system over the disadvantages. In a recent survey of drivers opinions in Europe (SARTRE, 1998) 54 per cent of the respondents stated to be in favour of a restriction of the maximum speed of vehicles. The major advantage that drivers acknowledge is that traffic will become less strenuous and dangerous and that drivers who habitually ignore all regulations will be prohibited to do so.
There is a growing recognition that the standard response of fining the offender may not be optimal. In some EU countries (most notably in Germany) elaborate systems are being developed to correct offending drivers rather than punishing them. Elements of such schemes are provisional licensing for young drivers, driver improvement and remedial courses for offending drivers and demerit point systems. Which such scheme have had notable effects on for example the recidivism of alcohol-involved drivers, the main issues to be addressed are which factors influence the effectiveness; how such schemes can be incorporated in the traffic regulation enforcement strategies and judiciary procedures. Further research is necessary in this respect. The same observation applies to the integration of enforcement activities with road user communication strategies. There is ample empirical evidence that publicity about the target behaviour and about the planned enforcement activities augments the effects of the enforcements and thus increases cost-effectiveness.
Moreover, combined enforcement and publicity not only are effective in changing driver’s behaviour, it also appears to have an effect on drivers attitudes towards traffic law offences. When police enforcement is targeted to a specific offence such as speeding the attitude towards that offence becomes more
97
negative, thus reinforcing the effects of enforcement. This is an important phenomenon as it can contribute to achieve a lasting behavioural change and support public acceptance of effective enforcement actions.
In 1902 the House of Commons in the United Kingdom declared that "speeding offences are the most important threat to orderly traffic". There is now overwhelming empirical evidence to support this declaration. Moreover, it also is evident that this not only applies to speeding offences but a range of other offences as well. The relation between traffic law offences and traffic safety has been documented on an aggregate level ( Nilsson, 1990) and on an individual level ( Parker et al. 1995) Simply stated, roads where many offences are committed are more dangerous and drivers who regularly commit offences are more often involved in crashes.
A very substantial safety benefit would be achieved if road users were to be deterred from committing traffic law offences. Estimates vary, but it seems reasonable to assume that the magnitude of potential crash savings would be in the order of 50 per cent. There is no single crash prevention measure that comes anywhere near in terms of potential saving of crash costs. Moreover, traffic law enforcement scores very high in cost / benefit terms. A recent economic analysis, carried out in Switzerland concludes that no crash prevention measure is more cost effective than effective enforcement of drinking- driving laws and this analysis comprised all types of crashers, including those occurring at home, work or during leisure activities. The cost-effectiveness of enforcement programmes related to excess speed, drinking and driving and seat belt use is invariably positive.
Traffic regulation enforcement requires professional skills different from other types of police work, because of the complex nature of regulation in traffic law and because of the emphasis on deterrence rather than detection of offences. Yet in view of societal developments in may European countries, the tendency has been to integrate traffic policing into general policing work. Also, the tendency has been to direct police manpower towards the many other societal problems that are prevalent in Europe.
As traffic law enforcement is not considered a core policing, activity, the career prospects for police officers active in this area have diminished, and as traffic law enforcement if not seen to be a political priority the allocation of resources has dwindled. In the assignment of available manpower, traffic enforcement has to compete with other societal issues – increase in violence, crime, and environmental problems – that also demand attention of police forces.
98
As a result, traffic law enforcement is unattractive to the actors involved and in many European countries the allocation of resources is not in line with growing traffic volumes.
As with any activity, enforcement activities gain in effectiveness if they are problem oriented, targeted, goal- oriented, have specified objectives and success criteria and are monitored in terms of process and product. At present the majority of enforcement activities are not. Normally, no analysis of crash occurrence precedes enforcement activities, no quantitative targets are set no specific methods are selected, and no monitoring is carried. That this state of affairs seriously hinders effectiveness goes without saying. The exception to this rule may be found amongst specialised traffic police forces but, at present they are in a minority in performing enforcement duties.
Moreover, across the EU as a whole, it is not common for police enforcement activities to be considered as an integral part of traffic safety policy. In general, there is little co-ordination between road safety experts and police staff. It has been demonstrated that the integration of enforcement activities with publicity is more effective in changing road user behaviour than enforcement or publicity activities on their own. Yet in practice, very few enforcement activities are accompanied by targeted publicity.
It makes the following recommendations:
1. On the basis of detailed crash data analysis, set specific targets for compliance with key traffic offences which influence road safety levels.
2. For each offence, integrate police enforcement activities into the national traffic safety policy relevant to that offence, at least including publicity activities.
3. In each country formulate for each office, effective and feasible police enforcement strategies. These strategies should take into account the results achieved in experimental or demonstration projects carried out elsewhere, specify the means and methods of police enforcement and specify the allocation of resources. Increase effectiveness of detection by allowing random breath testing and camera evidence for offences such as speeding, red light violations and tailgating.
4. Develop information and training resources in order to increase awareness and competence of police enforcement staff.
99
5. Obtain explicit agreements between the various actors ( legislators, police prosecuting bodies) about the consequence that follow detection of offenders.
6. Communicate the results of specific demonstration projects amongst policymakers and police.
In the paper, ‘The Road Ahead: Traffic Injuries and Fatalities in India,’
Transportation Research and Injury Prevention Programme, Indian Institute of
Technology, Delhi. Page 1-30.its author Dinesh Mohan has, in the year 2000,
studied the traffic accident in 19 metropolitan cities of Kanpur -438, Delhi -1736,
Jaipur -312, Nagpur – 255, Coimbatore-157, Hyderabad -445, Bangalore -659,
Indore -173, Licknow -311, Madurai-114, Vishakhapatnam -190, Chennai – 671,
Bhopal-162, Pune -316, Vadodara-148, Varanasi-103, Mumbai -1361, Patna- 80,
Ahmedabad-223, Kolkata-452 cases and concludes:
1. Around 15% of the total road traffic fatalities in India occur in 23 metros.
2. Non-motorised transport road users consisting of pedestrians, cyclists and
other slow moving vehicles are the most vulnerable group and account for
60 to 80% of the fatalities.
3. Motorised two-wheelers comprise approximately 70% of all vehicles and
constitute 20-30% of fatalities.
4. Heavy vehicles like trucks and buses are associated with 50-70% of fatal
road crashes in urban area.
5. The issues concerning safety of non-motorised transport have not been
given adequate importance. Policies need to be developed so that these
groups are included as an integral part of traffic in the planning of new
highway and area planning schemes.
6. Crash patterns show that the self-segregation of the modes is not sufficient
to ensure the safety of vulnerable bicyclists. While mid block crashes are not
usually a serious concern in homogenous regimented traffic conditions, this
category dominates in Indian cities.
7. It is essential to provide safe segregated facilities for non-motorised road
users (pedestrians, bicyclists and rickshaws) on all major urban corridors
where vehicle speeds are likely to be greater than 30 km/h.
8. All residential and shopping areas must implement traffic calming techniques
so that no vehicles can operate at speeds greater than 30 km/h.
100
The author has also studied and analysed traffic on intercity roads and
national highway in year 2000 in 25 states of India State of India and concludes
that
1. Perceptions about crashes formed by highway users may not reflect the
reality of the problem. Everyone sees damaged vehicles stranded on the
highways and thus believes that these kinds of crashes would constitute the
main problem.
2. Though the motor vehicle fatalities are higher on highways than in urban
areas, as would be expected, the differences are not as high as in western
countries. A vast majority (68%) of those getting killed on highways in India
comprise vulnerable road users and this fact should be the guiding factor in
future design considerations.
3. Crash patterns on rural and urban roads are more similar than would be
expected based on western experience. This is probably because there is a
high density of settlements all along the highways and this probably results
in the use of many sections of the highway like an urban arterial road.
Therefore, safety would be enhanced mainly by separating local and through
traffic on different roads or by separating slow and fast traffic on the same
road, and by providing convenient and safe road crossing facilities at
frequent intervals to vulnerable road users.
4. We need to develop standards for provision of convenient tunnels and other
crossing facilities in terms of designs and frequencies. In addition, there
would also be a need for provision of "service roads" along the highways for
short distance trips for local traffic. At present, there are no such guidelines
to help the local designer and planner.
5. Collisions with fixed objects are low only on 4 lane divided highways.
However, they are not absent. Better road markings to indicate the alignment
of the road is essential. Provision of adequate run-off area without
impediments is very important on highways. Both the shoulder and the
median must provide adequate space for straying vehicles to recover without
major damage. When adequate run-off area is not available the use of guard
rails to stop vehicles going off the road becomes or use of concrete jersey
Barriers becomes necessary.
101
The author has also analysed the cost of road traffic accidents in India and concludes that “Indian society suffers an estimated economic loss of Rupee 55,000 crores (550,000 m) per year due to road traffic crashes. This is of the same order of magnitude as all the investment in road building and maintenance. A small reduction of 10% in road traffic injuries means a saving of about Rupees 5,000 crores a year. This understanding should guide us in policy making for road safety research and safety infrastructure investments. It would be sensible to earmark a fixed percentage of road building funds for road safety activity.
The author has also given summary of review of world wide experience in road safety by researcher to understand the record of success and failure. This summary is very useful for this study. Legislation and enforcement:
a) Most attempts at enforcing road traffic legislation will not have any lasting effects, either on road enforcement is expensive and difficult to sustain in most situations.
b) Imposing stricter penalties (in the form of higher fines or longer prison sentences) does not affect road-user behaviour significantly and imposing stricter penalties also reduces the level of enforcement.
c) Increased normal, stationary speed enforcement is in most cases cost-effective. Automatic speed enforcement with cameras seems to be even more efficient ( 39:40)
d) Compulsory helmet laws work and reduce injuries and fatalities for motorcycle riders in all or hearing capabilities of motorcycle riders in a manner that increases their crash involvement. Use of helmets is the single most effective safety measure available to motorcycle riders, Helmet use by cyclists has also shown to reduce the probability of injuries and fatalities.
Education and campaigns:
a) Road safety campaigns are often aimed to improve road user behaviour by increasing the knowledge and by changing the attitudes. There is no clearly proven relationship between knowledge and attitudes on one hand and behaviour on the other hand. Most highway safety educational programs do not work. They do not reduce motor vehicle crash deaths and injuries. Only a few programs have ever been shown to work, and contrary to the make matters worse. Education programs by themselves usually are insufficient to change behaviour. They may increase knowledge, but increased knowledge, rarely results in appropriate behaviour change.
102
b) There is no reason to waste money on general campaigns. Campaigns
should be used to put important questions on the agenda, and campaigns
aimed at changing road user behaviour should be focused on clear defined
behaviours and should by preference fortify other measures such as new
legislation and/or police enforcement. Safety interventions that have relied
only on education, even when well done, have often been unsuccessful.
Successful strategies have been those that used a combination of education
with other approaches such as legislation, regulation, or lowering barriers to
implementation.
Specific campaigns :
a) Seat belts: The effect of campaigns using tangible incentives to promote
safety belt usage, have been evaluated by means of a meta-analytic
approach. The results (weighted mean effect ) show a mean short term
increase in use rates of 12.0 percentage points; the mean long term effect
was 9.6 percentage points. Research first from Australia, later many
European countries, then Canadian provinces, and finally some U.S. states
clearly shows that the only effective way to get most motorists to use safety
belts and child seats is with good laws requiring their use. When laws are in
place, education and / or advertising can be used to inform the public about
the laws and their enforcement. In some jurisdictions where the political
support for good safety belt laws is not present, however, enthusiastic
advocates continue to promote expensive and ineffective advertising
approaches, did not produce the desired result.
b) Children's education; Pedestrian safety education can result in improvement
in children's knowledge and can change observed road crossing behaviour
but whether this reduces the risk of pedestrian motor vehicle collision and
injury occurrence is unknown. There is evidence that changes in safety
knowledge and observed behaviour decline with time suggesting that safety
education must be repeated at regular intervals.
103
Licensing and driver education:
a) Studies show that driver education may be necessary for beginners to learn
the elementary skills for obtaining a license, but compulsory training in
schools leads to early licensing (55) There is no evidence that such schemes
result in reduction in road crash rates. On the other hand they may lead to
increased road crash rates (56-59). While there may be a need to train
professional drivers in the use of heavy vehicles, there is no evidence that
formal driver education should be compulsory in schools and colleges.
b) Evaluation confirms that Graduated Driver Licensing programs reduce
crashes and violations, especially during night time driving restriction hours.
Much of this effectiveness is due to reduced driving exposure by beginning
driver resulting from longer learner's permit holding times and from these
night time driving restrictions for provisional licensees.
Vehicle safety features:
a) Vehicle crashworthiness: The term 'Secondary safety' refers to the protection
that a vehicle provides to its occupants when involved in a crash. In is
estimated that improved secondary safety reduced the number of car drivers
killed or seriously injured by at least 19.7%.
b) Restraints: Use of seat belts, child seats and airbag equipped cars can
reduce car occupant fatalities by over 30%. The only effective way to get
most motorists to use safety belts is with good laws requiring their use.
When laws are in place, education and / or advertising can be used to inform
the public about the laws and their enforcements.
c) Lights :
i. High mounted rear break lights reduce the incidence of rear end
crashes.
Road and environment:
Though there is no clear evidence regarding the effect of “improvements" in
road infrastructure on road safety, there is adequate evidence to show that design
features that limit speeds, prevent destructive impacts, and provide safer mobility to
vulnerable road users do result in injury reductions. A guiding principle in this
respect is that the road environment and infrastructure must be adapted to the
limitations of the road user (67). Some measures for which there is reasonable
evidence regarding effectiveness in promoting road safety are:
104
a) Traffic calming techniques, use of roundabout and provision of bicycle
facilities in urban areas provide significant safety benefits.
b) Limited access highways with appropriate shoulder, median and guardrail
designs provide significant safety benefits on long distance through roads.
Median barriers are found to increase accident rate, but reduce accident
severity. Guardrails and crash cushions are found to reduce both accident
rate and accident severity.
c) Arterial roads are generally less safe than controlled access facilities (
motorways). Statistically significant injury reduction benefits result from
controlled access facilities compared to more fatalities and injuries due to
arterial roads.
d) Increasing the lane widths of roads is normally seen as a strategy for
reducing accidents. A study using a cross-sectional time series database of
US states shows that those arterials roads with lane widths of 9 ft (2.7m) or
less have fewer traffic injuries. Reporting these results, Noland states “These
results are quite surprising as it is general practice to improve the safety of
roads by increasing lane widths. One possible behavioural response is that
drivers increase their speed when lanes are wider and off-set any safety
benefit from increased lane space. As can be seen, it is in general, not
possible to support the engineering hypotheses"
e) Free turns on red (left turn on a red light in India) result in significantly higher
pedestrian and bicycle crashes. A study done in the USA show that
approximately 80% of all signalized intersections where motorists are
allowed to turn right on red all right turning crashes increase by about 23%
pedestrian crashes by about 60% and bicyclist crashes by about 100%(73)
f) Large sale use of roundabouts in urban areas ( as compared with signalised
intersections ( can reduce crash risk by more than 40% and emissions by
more than 20%)
g) There is no evidence from randomised controlled trials to support the use of
early or large volume intravenous fluid administration in uncontrolled
haemorrhage.
h) The effect of pre hospital spinal immobilization on mortality, neurological
injury, spinal stability and adverse effects in trauma patient therefore remains
uncertain. Because airway obstruction is a major cause of preventable death
105
in trauma patients and spinal immobilisation, particularly of the cervical
spine, can contribute to airway compromise, the possibility that spinal
immobilisation may increase mortality and morbidity cannot be excluded.
i) In the absence of evidence of the effectiveness of advanced life support
training for ambulance crews, a strong argument could be made that it
should not be promoted outside the context of a properly conceived and
otherwise rigorously conducted randomised controlled trial.
These results show that there is a lack of clear evidence regarding the
effectiveness of widely used interventions in pre-hospital care and there is a
need for conducting randomised control trials to evaluate the effectiveness of
such interventions. However, these results are very useful in the Indian
context because they show that effective pre-hospital care can be provided
without capital intensive investments in infrastructure.
Finally the author prescribes a road safety policy for Indian in six steps:
(1) Institutional Reform:
Institutional: Experience across the world has shown that every country
needs a lead agency on road safety, with the authority and responsibility to make
decisions, control resources and coordinate efforts by all sectors of government –
including those of health, transport, education and the police. This agency should
have adequate finances to use for road safety, and should be publicly accountable
for its actions (13). At present, there is no institutional arrangement for such
activities in India.
Therefore, a statutory National Road Safety Board (NRSB) needs to be
established that is independent of the Road Building agency. In principle, the NRSB
could follow the structures set up for agencies like the Central Pollution Control
Board. The Planning Commission of India set up a Committee to examine this issue
and a report on the subject was submitted in 2001. The NRSB can have the
following functions.
106
(2) New system for data collection & Analysis
a) Police data collection systems need to be modified so that essential base
line data become available to policy makers and researchers for meaningful
analysis.
b) Traffic injury surveillance systems need to e established at hospital and
medical colleges around the country according to international guidelines
suggested by the WHO. These hospital databases need to be coordinated
with police data sources and a system established for coordination of data.
c) A highway crash data system needs to be developed to monitor the details
of vehicle and road design features associated with crashes.
d) Multidisciplinary crash investigation data are necessary for detailed
evaluation of vehicle and road design changes and their correlations with
injury patterns.
(3) Research and Training:
Here the author suggests following measures.
6. Strengthening of existing research institutions working on road safety.
7. Establishment of regional specialised interdisciplinary research centres on
road safety.
8. Training programmes for policy makers and researchers on road safety.
9. Organisation of an annual scientific road safety conference.
The author quotes the world report on Road Traffic Injury Prevention and
notes: “Road safety polices in India have focused on education and behaviour
change of road users as a mainstay of our efforts. This has not given us the
reductions in injuries and fatalities that we expected and the trends indicate that the
increase in death rates is likely to continue. To reverse this trend, it is necessary
that we take note of the conclusions regarding the role of Education. Information
and Publicity as included in the World Report on Road Traffic Injury Prevention -
Education can help to bring about a climate of concern and develop sympathetic
attitudes towards effective interventions. Consultation with road users and residents
is essential in designing urban safety management schemes. When used in
support of legislation and law enforcement, information can create shared social
norms for safety. However, when used in isolation, education, information and
publicity do not generally deliver tangible and sustained reductions in deaths and
serious injuries. Historically, considerable emphasis has been placed on efforts to
107
reduce road user error through traffic safety education – for example, in pedestrian
and cycle education for schoolchildren and in changing behaviour, there is no
evidence that they have been effective in reducing rates of road traffic crashes."
To make this possible all new initiatives must be accompanied by
information and publicity campaigns that explain the benefits of the new designs,
legal and enforcement measures, and restrictions where necessary. Such
measures will reduce the resistance to new ideas and find champions for road
safety in the community.
Specific strategies for intervention:
The author suggests specific strategy for intervention for safety of different
road users.
Pedestrian and bicyclist safety: 10. Free left turns must be banned at all signalized junctions. This will give a
safe time for pedestrians and bicyclists to cross the road. This measure has
the potential of saving 3,000 – 5000 lives per year in the near future.
11. Speed control in urban areas. Maximum speed limits of 50 km/h in
residential areas and by judicious use of speed breakers dead end streets
and mini roundabouts. In the short term of three years, a target of covering
10% of the roads can be attempted. This measure has the potential of
achieving a saving of 5000-10000 lives in the year 2008.
12. Increasing the conspicuousness of bicycles by fixing of reflectors on all sides
and wheels and painting them in yellow, white or orange colours. Initially
voluntary drives and encouragement, and later mandating the same can do
this. This can result in a possible saving of 5000 – 1000 lives per year.
Motorcyclist safety: 13. Notification of mandatory helmet laws by every state. The Motor Vehicles act
of India specifies that all motorised two –wheeler riders must wear a helmet
in the country, however, since transportation is a state subject, most states
are not enforcing this regulation. Helmets are available, as the
manufacturing capability already exists in the country. Countrywide
notification and enforcement is likely to result in a saving of about 5000 lives
in 2008.
14. Mandatory daytime headlights use by two wheeler riders. Expected saving of
2000 – 3000 lives in 2008.
108
Motor Vehicle occupants: 15. Enforcement of seatbelt use laws countrywide is likely result in a saving of
about 1000 – 2000 live per year. A conservative estimate is taken as it will
be difficult to ensure that everyone wears a seat belt on rural roads in the
near future.
16. Restricting travel in front seat of cars by children has the potential of
reducing injuries dramatically. It is difficult to estimate the effectiveness of
this measure, as we do not know the incidence of front seat children injured
in crashes.
17. Bus and truck occupant injuries and fatalities and injuries caused to other
road users can be reduced significantly by enforcing strict observance of
speed limit regulation on highways. This can be done by ensuring that bus
timetables and truck movement schedules ensure that drivers can observe
speed limits with ease. Random speed checking on highways would help
ensure such measures. These measures can result in a reduction of 2000 –
4000 deaths per year.
Road measures – initiation of good practices: 18. Traffic calming in urban areas and on rural highways passing through towns
and villages.
19. Improvement of existing traffic circles by bringing them in accordance with
modern roundabout practices and substituting existing signalised junctions
with roundabouts.
20. Provision of segregated bicycle lanes and disabled friendly pedestrian paths
21. Mandatory road safety audit for all road building and improvement projects.
Pre-hospital care, treatment and rehabilitation
22. Modern knowledge regarding pre-hospital care to be made available widely.
23. Training of specialists in trauma care.
The author also presents a long term road safety strategy.
Road safety strategies – long term
109
Traffic calming and speed control
We should aim at implementing speed control and traffic calming measures
in all urban areas and appropriate locations on rural highways by altering road
design, vehicle monitoring through intelligent transport systems and vehicle design
by the year 2015. This measure is likely to give us the maximum savings in terms of
lives and serious injuries. The savings could be anywhere in the region of 20,000 –
40,000 lives in the year 2015.
Segregated lanes for vulnerable road users and buses in urban areas
Non-motorised transport and buses must be provided segregated lanes on
all major arterial roads in urban areas. India specific designs need to be de
developed and phase wise implementation plans drawn up for all cities. Expected
saving: 10,000 -20,000 lives in 2015.
Safer design of 4/6 lane highways.
(a) Provision of service lanes on high-speed highways for slow and non-
motorized traffic.
(b) Provision of at surface tunnels at frequent intervals for local traffic.
- Expected saving :- 10,000 lives in 2015
Vehicle safety
(a) All vehicles sold in India should meet international crashworthiness
standards by 2010.
(b) All buses and trucks should meet pedestrian impact standards by 2010.
(c) All urban buses to have low floors and automatic closing doors.
(d) Crashworthiness standards must be developed for all indigenous
vehicles by 2008 and implemented by 2010.
(e) Use daytime running lights by all cars
(f) Installation of ITS and other modern safety devices for assisting and
controlling drivers.
- Expected saving: - 8,000 – 20,000 lives in 2015
110
Driving under the influence of alcohol and other drugs:
A long term strategy to reduce drinking and driving incidence to less than 10
% of all crashes needs to be drawn up for the next 10 years. Measures could
include:
(a) Sensitization of the public to the extent of the problem.
(b) Institution of random roadblocks and checking on urban roads and
rural highways.
(c) Ignition interlock on cars.
- Expected saving: - 20,000 – 40,000 lives.
Road user based strategies
(a) Helmet use by all bicyclists.
(b) Graduated driver licensing schemes to be introduced on a trial basis
by 2007 and implemented country wide by 2010
(c) Schools to identify and arrange safe routes for children walking and
bicycling to school.
Pre-hospital care, treatment and rehabilitation
(a) Trauma care specialists to be trained and employed in all general and
specialty hospitals.
(b) Specialised rehabilitation centres to be set up in all regions of the
country.
In the paper “Sustainable Transport System: Linkage between
Environmental Issues, Public Transport, Non-motorised Transport and Safety,
Economic and Political Weekly, June 19, 1999 Page 1589-1596, the author Dinesh
Mohan summarises: “Unless the needs of non-motorised modes of traffic are met, it
will be almost impossible to design any sustainable transport system for urban
areas. If the infrastructure design does not meet the requirements of pedestrians,
bicyclists and non-motorised rickshaws, al modes of transport operate in sub-
optimal conditions. However, re-designing existing roads will not only provide a
safer and convenient environment for non-motorised modes, it will also improve
efficiency of public transport vehicles and enhance the capacity of the corridor
when measured in number of passengers transported per. hour per lane.”
111
The author describes the road blocks in encouraging non motorised
transport and suggests ways and means to increase it.
The author says: “A sustainable transport system must provide mobility and
accessibility to all urban residents in a safe and environment friendly mode of
transport. This is a complex and difficult task when the needs and demands of
people belonging to different income groups are not only different but also often
conflicting. For example, if a large proportion of the population cannot afford to use
motorised transport – private vehicles or public buses – then they have to either
walk or ride bicycles to work. Provision of safe infrastructure for bicyclists and
pedestrians may need segregation of road space for bicyclists and pedestrians
from motorised traffic or reduction in speeds of vehicles. Both measures could
result in restricting mobility of car users.”
The author points out the conflict between various traffic issues: “Measures
to reduce pollution may at times conflict with those needed for reduction in road
accidents. For example, increases in average vehicle speeds may reduce
emissions but they can result in an increase in accident rates.”
The author emphasises the importance of taking care of non motorised
traffic: “Pedestrians, bicyclists and non-motorised rickshaws are the most critical
elements in mixed traffic. If the infrastructure design does not meet the
requirements of these elements all modes of transport operate in sub-optimal
conditions.
It is possible to redesign the existing roads to provide a safer and more
convenient environment for non-motorised modes. This also results in improved
efficiency of public transport vehicles and enhanced capacity of the corridor when
measured in number of passengers transported per hour per lane.”
The author says that the decision regarding mode of transport by individuals
are based on economic criteria, trip time involved, convenience, comfort and safety.
Of all these concerns the one involving safety is the most difficult one for the
individual.
Pedestrians and other non-motorised road users who do not benefit from increased mobility sustain the increased accident risk. Thus the benefits accrue to one sub-group while the disadvantages are imposed on another.
112
Risk for an occupant of a bus (0.5) is much less than that for the occupant of a car (6). However, the traveller subjected to a much higher risk walking to or from the bus (6.5) and The bicycle users have the highest risk per trip;
It would be fair to expect personal vehicle users to use public transport only if the safety of pedestrians could be ensured.
The higher risk associated with bus travel must be acting as a deterrent for private vehicle owners to use public transport. At present 62 per cent of all motorised trips in Delhi are made by buses.
These data clearly indicate that if public transport use has be promoted in mega-cities like Delhi in less industrialised countries (LIC) much more attention has to be given to the improvement in safety levels of bus commuters and the non-motorised transport segment of the road users. This is particularly important because promotion of public transport use can also result in an increase in the number of pedestrians and bicycle users on city streets. Unless people actually perceive that they are not inconvenienced or exposed to greater risks as bicyclists, pedestrians and bus commuters it will be difficult to reduce private vehicle use.
It will be difficult to increase this share of public transport and non-motorised models unless modes are made much more convenient and safer.
Bicycle trips of the total trips has declined from 17 per cent in 1981 to 7 per cent in 1994,
Unlike the traffic in high income countries, bicycle and other non-motorised vehicles are present in significant numbers on the arterial roads and inter-city highways designed for fast moving uninterrupted flow of motorised vehicles.
On an average, a household cannot spend more than 10 per cent of its disposable income on transportation.
Even if 5 per cent of these trips are converted to bicycle trips, it means 1.1 million additional trips. This would not only lead to substantial savings in fuel but also drastically reduce air and noise pollution.
A wide variety of vehicle types (including bicycles and human and animal
drawn vehicles) share the same road space in Delhi. All modes of traffic use the
one, two and three lane roads all over Delhi. Delhi traffic laws do not segregate non
motorised and motorised modes and enforcement of speed limits is very limited.
113
It is a waste of resources not to provide a separate bicycle lane because one
whole Motorised Vehicle (MV) lane gets used by bicycles other Non Motorised
Vehicle (NMV) irrespective of bicycle density.
Since primarily bicycles and other NMVs use the left most lane of the road,
buses are unable to use the designated bus lanes and are forced to stop in the
middle lane at bus stops. All modes of transport move in sub-optimal conditions in
the absence of facilities for NMVs. This disrupts the smooth flow of traffic in all
lanes and makes bicycling more hazardous. Therefore, providing a separate bicycle
track would make more space available for motorised modes and make bicycling
less hazardous. It is also obvious that in the absence of segregated NMV lanes on
arterial roads, it is not possible to provide designated lanes for buses.
Increase in use of public transport also result in an increase in walking/
bicycling trips.
At present pedestrians and bicyclists have a much higher risk per trip of
being involved in an accident than those using cars.
It is not possible to have efficient bus transport systems with designated
lanes for buses unless segregated lanes are provided for non-motorised transport.
Sustainable transportation options rely heavily on promotion of public
transport and non-motorised modes.
The author points out to the effect of expressways, wide roads and grade separated junctions: “Construction of expressways through or around cities and grade separated junctions may encourage higher speeds, greater use of private vehicles and longer trip lengths. Higher speeds always result in an increase in the incidence and severity of accidents unless very special countermeasures are put in place for control of injuries.
Very small increase in speed can result in large increases in deaths and injuries. This increase in risk has the maximum effect on pedestrians and bicyclists resulting in lower use rates of public transport services.
Wide roads and expressways (especially elevated sections) and grade separated junctions also divide the urban landscape into separate zones. It becomes very difficult for people to cross these arteries on foot or using other non-motorised modes. As explained above, this has the effect of discouraging public transport user, as all commuters using buses have to cross the road at least two times for every round trip at the origin or the destination. Elevated roads also reduce the attractiveness of business and entertainment activity in their vicinity.
114
A grade separated intersection inside the city speeds up traffic at that
junction and the arrival rate of vehicles at the next light controlled junction
increases. This causes greater delay at junctions on both sides, especially during
rush hours.
At grade separated junctions noise and exhaust is produced at a greater
height and spreads over a wider area. This makes this area unsuitable for living
and other community functions.
Any high capacity road inside a city influences land use around it and makes
it less people friendly.
In the past five years, the input to road infrastructure in the large cities has
been doubled. Almost all the large city authorities believe that the situation of traffic
congestion may be alleviated through road construction... But to date, we are still
short of rational study which verifies the relationship between road infrastructure
and traffic volume or the ownership of motor vehicles... The traffic volume
introduced with road construction may again increase vehicle emission and cause
new traffic congestion, multiplying all the pollutants. So there would be no direct
cause and effect relationship among infrastructure construction, pollution
prevention and environmental protection.
Induced travel demand is a likely outcome of capacity expansion and that
over time.
The SACTRA report found that induced traffic is of 'greatest importance'
under certain circumstances. These include “where trips are suppressed by
congestion and then released when the network is improved". The report clarified
that “in urban areas where there are many alternative destinations, modes and
activities induced traffic may be an appreciable consequence of major road building
schemes... It will simply not be possible to cater for future, unrestrained demand for
travel by private vehicles.
15-Year Texas Transportation Institute (TTI) in the US shows similar results.
Analysis of TTI's data for 70 metro areas over 15 years shows that metro areas that
invested heavily in road capacity expansion fared no better in easing congestion
than metro areas that did not. Trends in congestion show that areas that exhibited
greater growth in lane capacity spent roughly $22 billion more on road construction
than those that didn't yet ended up with slightly higher congestion costs per person,
wasted fuel, and travel delay [STPP 1998]
115
These experiences from very different locations suggest that construction of
more high capacity roads can have the unintended effect of reductions in public
transport and bicycle use without increasing vehicle speeds or reducing congestion
on city roads. Reductions in bus and bicycle use would result in higher pollution
levels and possible increase in traffic congestion. No detailed studies have been
done to understand the effect of these changes on road user behaviour in cities of
low-income countries. It is possible that in these countries the construction of high
capacity roads at the expense of facilities for public transport and non-motorised
traffic may make things worse for everyone. These effects could include higher
incidence of congestion for motorised traffic, higher accident risk for non-motorised
traffic and reductions in public transport and non motorised traffic.
The author also suggests: “Introduction of one way streets should be done
only when absolutely necessary. One Way Street have the effect of increasing
travel distances and hence fuel consumption as people cannot use the shortest
routes between origin and destination.
If bicycle riders are also forced to obey the one way regulations then it would
discourage bicycle use because of increase in trip lengths.
On 4 and 6 lane one way roads it would be essential to provide pedestrian
refuges in the centre of the road at intersections to ensure safety.
The author views about the metro trains are worth noting: “The general
conclusion is that contrary to expectations metros do not appear to reduce traffic
congestion. The passengers are mostly captured from the buses, but the reduction
in bus traffic is not proportional and represents only a small part of the total traffic.
The relief to traffic congestion is short lived because private traffic rapidly grows to
utilise the released road capacity. There has been very little shift from car use... In
most cities in most developing countries it will not be possible to justify metros
rationally... In these cities we have sought to direct attention to their priorities and
actions to improve the bus and para-transit system.
The author says: “Several developed countries have industries for metro
systems facing lack of demand at home. Part of their foreign policy is to make soft
loans to support these industries. At the same time in the developing countries
governments are interested because. (1) a large construction project will bring jobs
(2) a metro system seems modern, and (3) because the cost will not be born until
the project has been built; even then the financing may be about 3 percent, a
116
reason not to invest. Financial discipline is often not regarded as important. There
was money to be made, prestige and political power to be won, short term and long
term motivations lay behind the construction of the metro. Firstly, there was the
desire to immediately improve political fortunes. In the longer term there was a
desire to build a monument to those holding office at that time [Ridley 1995].
The metro system in Beijing takes only 11 per cent of the public passenger
transport volume and a report from Beijing states that “As the advanced track
transport system is enormously expensive and requires long construction period it
cannot be taken as immediate solution"
Construction of a metro rail system and increase in number of buses would
also increase the number of access trips by walking and bicycling. High –density
metro corridors increase the presence of pedestrians on the surface. This can
result in higher accident rates if special measures for traffic claming, speed
reduction, and provision of better facilities for bicycles and pedestrians were not put
in place in parallel. Therefore, there is no evidence that the construction of a metro
rail system on its own would result in the reduction of congestion, pollution or road
accidents. It is important the alternative lower cost methods of transportation be
explored much more seriously.”
In furtherance of what is said about the metro the author also shares the low
cost poor citizen friendly experience of Brazil: “The experience of designing and
running a high capacity bus system in the city of Curitiba in Brazil gives us a very
good example of what is possible in planning public transportation systems at a
fraction of the cost (5 percent-10 per cent) involved for metro lines [Ceneviva 1999].
Special bus and bus stop designs have been developed in Curitiba to make access
to buses easier, safer and faster. This is combined with provision of segregated bus
lanes where necessary, traffic light priority for buses and moving buses in platoons.
A specially designed bus system of this sort can carry up to 25,000-30,000
passengers in one hour in each direction. Since such systems can be put in place
at a fraction of the cost of metro systems without digging or building elevated
sections, they can be introduced on all major corridors of a city. Since the total
number of lines so built would be many more than the high cost metro system, the
total capacity of this system would also exceed that of a limited metro rail network.
An intelligent mix of electric trolley buses and other buses running on diesel and
alternate cleaner fuels could take care of pollution issues. The availability of
117
modern computer network communication systems and intelligent transport
technology hold great promise for making high capacity bus systems even more
efficient and user friendly. Even the highly industrialized countries did not have
these options available to them in the past decades and so very little serious
research and development work has been done to optimise designs for mega cites
in low income countries. Any investment in this direction should be highly profitable.
The author also states that the cost effectiveness of metro rail systems be
evaluated very carefully. Current evidence suggests that metro rail systems,
especially the construction of two or three lines at great cost, do not help in
reduction of private vehicle use, congestion or pollution.
The author gives detail analysis of Why older buses should be phased out
“Use of older buses can result in higher operating expenses and increase in user
costs. A study from Delhi shows that 3 per cent of the city bus service passengers
own cars and 18 per cent own scooters and motorcycles [RITES 1998]. About 11
per cent of the bus users in Delhi travel by private chartered buses that assure
them of a sitting place in return for monthly contract tickets. These bus users are on
an average have higher incomes than those using the city bus service and 11 per
cent of them own cars and 44 percent own motorcycles and scooters. At present
the average cost for these commuters is about Rupees 7 (US$ 0.18) per trip. This
cost is close to the marginal cost of running a motorcycle for 10 km. Therefore it is
possible that an increase in fare prices might result in many commuters reverting to
use of personal modes. This would be particularly true for those who own scooters
and motorcycles, as the running cost for these vehicles is relatively low. Higher use
of these vehicles can offset the environmental advantage of using less polluting
buses.”
The author suggests network route planning for cyclists: “Detailed origin
destination analysis of bicycle user’s network for bicyclists covering the whole of
Delhi. This is because there are no areas where they are not present. Since a
majority of the bicyclists are captive riders who are daily commuters (with no other
more choice owing to economic compulsions) the proposed network must enable
direct and safe bicycle-travel within a coherent system. The proposed routes must
guarantee minimum trip lengths (directness) and minimise the number of
encounters between cyclists and motor vehicles (safety)
118
The author suggests that in the first phase, the routes which have heavy
bicycle traffic sharing the road space with other traffic should be developed
because this would result in improving flow of bicycles as well as public transport
buses and motorised private modes which are affected by the presence of bicycles
on the same carriageway. This will cover 90 km of road length.
The author suggests that physically segregated lanes also improve safety of
the vulnerable road users by reducing the conflicts between motorised and non
motorised modes.
The author has given a lot of details for efficient bus system as environment
friendly and people friendly mode of transport: “Design and development of modern
and sophisticated high capacity bus systems are given priority in mega cities of
Asia.
Introduction of bus engine and transmission technologies that ensure clean
burning and efficient combustion at the passenger loads and driving cycles
experienced in Asian mega cities.
Safe entry and exit procedures for bus passengers would include all buses
to be equipped with closing doors, low floors, and appropriately designed bus
stands and bus stop locations that ensure route changes are convenient and safe
for commuters.
He also suggest development of safer bus front designs and standards and
says that since a significant proportion of road user fatalities involve buses in low
income countries, it would be very important to develop such designs. Particularly
in view of the fact that increases in bus numbers can mean an increase in conflict
between them and other road users. Recent studies suggest that such designs are
technically feasible.
The author also suggests wider use of traffic claming techniques, keeping
peak vehicle speeds below 50 km/h on arterial roads and 30 km/h on residential
streets and shopping areas;
The author also suggests asking leading questions about safety and
environmental goals, at the conceptual stage of the project, and looking beyond the
immediate boundaries of the scheme.
He also says that the safety and environmental consequences of changes in
transport and land use should be made more explicit in technical and public
assessments.
119
There should be simultaneous consideration of safety and environmental
issues by involving all concerned agencies.
In the paper ‘The Development of New Zealand’s Road Safety Strategy’, 2010
by Rachel Petrus, Land Transport Safety Authority, New Zealand, Page 1-7, a new
performance management framework was proposed, which recognised that
interventions which address road user behaviour are not the only way to tackle
road safety problems. Changing the roads and or vehicles instead can often be
more effective. Three sets of interventions which reflected strategic trade-offs
between standards and compliance measures were identified as broad options for
improving road safety: an engineering based option, an enforcement based option
and an option with a mix of engineering and enforcement measures. A public
consultative process was developed to determine the desired level of safety for
2010, before the final targets could be set.
It also states that the current safety management practice places an undue
emphasis on driver behaviour. Although driver behaviour contributes to most
crashes the most effective remedy may not always be to reform the driver. It can
sometimes be more effective to improve the roads or vehicles. as such
improvements can reduce the number of crashes and their severity regardless of
cause. The road network itself is becoming the focus for development of future road
safety strategies in some of the better performing countries.
The research reveals that European countries have been experiencing a
philosophical shift in focus. Countries such as Sweden and the Netherlands now
recognise the importance of systems design in avoiding and counteracting the
consequences of inevitable human error.
When consideration was given to the key areas where New Zealand can make
safety gains over the next ten years, three types of interventions stood out: speed
management; an expanded road construction programme and improved vehicle
standards.
It was estimated that open road speed management has the potential to
reduce the total annual social cost of crashes by 19% To achieve this, however
mean speeds on our open roads would need to be reduced to 93kmm/h.
A performance management framework was also suggested within which the
entire road safety effort can be located. This framework recognises the fundamental
importance of the road network itself to our road safety effort.
120
Enforcement, performance assessment mechanism (such as an operator
performance rating system currently being developed) and education play an
important role in the overall compliance regime applying to the land transport
system.
Three sets of interventions were identified as broad options for achieving the
proposed level of safety an engineering based option, an enforcement based
option; and an option with a mix of engineering and enforcement interventions.
The consultation process used a variety of methods to seek feedback,
including a national launch. public meeting in regions, meetings with various
interest groups, focus groups with the general public, and written submissions. An
extensive media campaign was used to publicise the proposed strategy and the
documentation available included a detailed proposed Strategy.
The first of the specific questions asked of the public was whether the
supported the proposed target for 2010. There was a clear message from the
consultation process that the public wanted a higher level of safety, and there was
a strong endorsement of achieving a level of safety in 2010 equivalent to where the
safest countries in the world are now. The second question related to the preferred
option for achieving this level of safety. There was broad support for a mix of
engineering and enforcement based measures. The preferred mix would consist of
an emphasis on enforcement measures backed up by targeted safety engineering
measures and long – term education programmes. The public were concerned at
the costs of engineering initiatives, but were also supportive of addressing priority
road safety issues. Many people wanted education to play a larger part in the
Strategy. When asked whether they were prepared to pay for the additional costs of
the strategy, many people indicated they were not prepared to pay anything over
and above the current road user related taxes.
The fourth consultation question asked what specific targets should be defined
in the final strategy. There was strong support for the range of targets proposed in
the consultation documents including targets for cyclists, pedestrians and regions.
Finally the public were asked what other matters needed to be resolved as
part of the Strategy. The role of education in the strategy was the focus of many
comments, with there being a clear perception that education was downplayed in
the strategy documents.
121
In the paper Road Accident Analysis: A Case Study of Patna City, Urban
Transport Journal 2(2):60-75, its author, Sanjiy Kumar Sigh and Ashish Misra have
studied and analyzed the road accidents in Patna for the period of 1996-2000 and
concluded “The total number of fatal accidents as well as related fatality in the city
is increasing over the years; persons killed per 100 accidents are alarmingly high,
as high as 45 during the year 2000. Pedestrian deaths as a percentage of all road
fatalities are also extremely high. During the recent years, they constitute more than
90% of all road fatalities. Also, the adult working age group (18 to 60 years)
accounted for more than 80 percent of all casualties."
The author observes: “Although fatality rate is relatively low in Patna, fatality
risk is higher than the Indian average. Since both adults working age group and
pedestrians constitute a large proportion of road accident fatalities, it is believed
that the vast majority of pedestrian casualties occur to the economically active
cohort (18 to 60 years). As far as vehicle-wise accident rates are concerned, buses
are the most risky. On an average, they are causing around sixteen accidents per
thousand buses per annum. In general, trucks and three –wheelers are the second
and third most risky vehicles, respectively.”
In the paper Multi criteria Evaluation of Transport Policies, Handbook of
transport Strategy and Institutions, Edited by K. J. Button and D.A. Hensher Page
507-526, the authors Ron Vreeker and Peter Nijkamp talk about the multi criteria
evaluation of traffic in good deal of details: “In the 1960s, a period with
unprecedented economic growth in many Western countries, transportation policies
were strongly oriented toward network and capacity expansion. From the 1970s
onward, however, the “limits to growth discussion” marked a more modest role for
infrastructure policy, in which the efficient use of existing networks received more
attention than the straightforward expansion of the physical network. The 1980s
saw the emergence of new views, reflected in the environmentalist movement (e.g.
green parties), with its strong concern about the negative impact of transport on the
general quality of life (Banister et al., 1997). From the 1990s onward, there has
also been considerable interest in the potential of modern technologies (e.g.
telecommunication) for network improvement, notably in the context of the “missing
network discussion” and of the evolving network economies (e.g. Handy and
Mokhtarian,1995; European Industrial Bank, 1996).”
122
They also listed out the importance of 3Es:
Economic efficiency, reflected in the increased competitiveness of
regions through an improvement in connectivity;
Social equity ,reflected in more equal opportunities for better access to
transport facilities (for different socio-economic groups; for less central
areas);
Environmental sustainability, reflected in more emphasis on coping with
the negative externalities of the transport sector, such as pollution, noise,
landscape decay, congestion, and lack of safety.
They also note that in many cases, these objectives are not immediately
compatible.
They also remark that transportation planning cannot be undertaken in
isolation from other fields of planning and policy-making (e.g. economic,
environmental, or technologies policies).
Transportation planning is, by definition, a multidimensional activity focusing
on multiple public interests with a particular emphasis on conflict resolution and on
sustainable development.
Evaluation is usually not a one-shot activity. The results of an evaluation
procedure have to be transferred to policy-makers in a manageable and
communicable form, particularly because the items of an evaluation are usually
multidimensional in nature.
They also observe that the planning Environment” is usually highly dynamic.
Every planning or policy-making process presupposes choices to be made,
regardless of the evaluation methods.
In the paper, Traffic Congestion in Indian cities: Challenges of a rising
power, Kyoto of the cities, Naples Mar 26-28, 2009 its author Azeem Uddinhas
enlisted economic growth, migration from rural to urban areas, concentration of
population in big cities, the mixed kind of traffic leading to movement of traffic at the
speed of vehicle having slowest speed etc as some of the causes of traffic
congestion in India. The author states that the situation is going to be worse from
bad due to development of Tata Neno and expectation of similar versions by other
companies.
123
It suggests to build better transport system " Transport experts at the second
Urban Age conference on mega cities in Sao Paulo, Brazil – a city with 18 million
people and 9 million cars were unanimous in pointing out that throughout the world,
whether in industrial or developing countries, public transport had to be promoted at
the expense of private, motorized transport which, in effect, implies traffic restraint,
among a slew of other measures. The demand so often raised by car owners for
more roadways, by way of highways, flyovers and the like. India which is the
second largest producer of buses, accounting for 16 percent of world's total bus
production has a bus penetration ratio anywhere between 0.4 to 6 buses per 1000
people. An efficient public transport system can effectively reduce the traffic on
roads. There's considerable evidence to suggest vehicle owners will use a mass
transit system, if a good one is available. In fact, because of traffic snarls and the
problem of finding parking space, many commuters in cities like New York and
London choose to travel by the metro rail network."
It also recommends measures like congestion charges that exist in London
and Singapore: "Cities around the world such as Singapore and London have
introduced congestion charging schemes to reduce traffic. For instance, in London,
drivers are charged a fee for entering the Central London zone. The idea was to
ensure that those using the road infrastructure made a financial contribution
towards it, discourage vehicle owners from making unnecessary journeys and
encourage the use of public transport systems. The results were impressive indeed:
traffic in central London went down by about 21 per cent, and traffic speed went up
by about 10%."
The author also understands the political sensitivity of the issue and need for
the political will and states " Congestion charging brings with it a dual advantage: it
reduces traffic on the roads and generates funds that can go towards improving
alternative systems of transport. But congestion charging can be a politically loaded
issue. In London, too, it was not an easy decision to introduce a fee for private
vehicles to use certain roads. But London Mayor Ken Livingstone remained
committed to his vision, and Londoners today enjoy the fruits of the LCC.
Introducing such schemes in India will require political consensus and strong
political will."
124
The author also suggests car pooling that is happening on a smaller scale in Mumbai and Bangalore: “Mumbai Regional Transport Authority has also recommended car pooling. Mumbai Environmental Social Network has promoted a web- and sms based pooling system ( www.mykoolpool.com). Bangalore Transport Information System has a group SMS version (www.btis.in/carpool).
The author proposes traffic restraints that are in place in Athens & Mexico city but wary of Indian consequences: “Traffic restraint schemes envisage eliminating at least a fifth of the cars on the road on any given day. Athens and Mexico City have implemented such schemes successfully. One way to do this is to permit cars with number plates ending with an odd number on alternate days into the city centre. The fear, however, is that rich residents may only buy a second car – or, as has been feared, may actually fraudulently change their number plates every day!”
The author is concerned about the decline in public transport: “From 1994 to 2007, the share of public transport has declined from 69 percent to just 38 per cent in cities with more than 4 million people.”
The author recommends use of technology for traffic to solve the problem of congestion. He suggests the model used by London and Singapore. London uses Automatic Number Plate recognition technology and optical character recognition to charge vehicles entering in to central London. Singapore uses Electronic Road Pricing system where in the charges are deducted from the pre paid cash card when the vehicles enters through the gantry in the central city areas.
The author also mentions the online prosecution system, the Area Traffic Control System, SMS facility for information dissemination and GIS based Accident Information System adopted by Delhi Police.
The author also mentions the Intelligent Traffic signals adopted in Bangalore city where the signal turns red if there is no vehicle waiting for 4 seconds. He suggests that this along with junction capacity augmentation can provide a long term solution to traffic jam. He also suggests the variable message signs [VMS], SMS & FM radio to disseminate real time information about traffic condition.
A project was undertaken by Dominic Zaal of the Federal Office of Road Safety, Department of Transport while on secondment to the Monash University, Accident Research Centre for Institute of Road Safety research (SWOW), Leidsehendam, and the Netherlands. It is described in the paper titled: ‘Traffic Law Enforcement: A Review of literature: Dominic Zaal Report No. 53.’
125
In this project a study was undertaken to review the recent Australian and
international literature relating to traffic law enforcement. The specific areas
examined included alcohol, speed seat belts and signalised intersections. The
review documents the types of traffic enforcement methods and the range of
options available to policing authorities to increase the overall efficiency (in terms of
cost and human resources) and effectiveness of enforcement operations. The
review examines, may of the issues related to traffic law enforcement including the
deterrence mechanism, the effectiveness of legislation and the type of legal
sanctions administered to traffic offenders. The need to use enforcement in
conjunction with educational and environmental / engineering strategies is also
stressed. The use of educational programs and measures targeted at modifying the
physical and social environment is also briefly reviewed.
The need for publicity to support enforcement operations, police training and
education programs is also documented. The review concludes with a series of
recommendations regarding the most promising options available.
The author observes:
1. The success of enforcement is dependent on its ability to create a
meaningful deterrent threat to road users. To achieve this, the primary
focus should be on increasing surveillance levels to ensure that perceived
apprehension risk is high. Once this has been achieved, increasing penalty
severity and the quick and efficient administration of punishment can
further enhance the deterrent effect.
2. Significantly increasing the actual level of enforcement activity is the most
effective means of increasing the perceived risk of apprehension.
3. The use of periodic, short – term intensive enforcement operations (blitzes)
is a more cost effective enforcement option, however, the effect on road
user behaviour may be reduced.
4. The use of selective enforcement strategies, designed to specifically target
high risk road user behaviour and traffic accident locations is another cost
effective alternative.
126
5. Automated enforcement devices provide the most cost effective means of
significantly increasing apprehension risk and should be adopted as a
matter of priority.
6. The use of publicity to support enforcement operations should be adopted
as a means of increasing enforcement effectiveness.
7. It is essential that road users actually observe the publicised increase in
the level of enforcement activity otherwise behavioural changes are usually
only short-term.
8. Publicity as a stand alone measure can increase community awareness of
road safety issues, however, it has only a minimal effect on actual road
user behaviour.
9. If the risk of apprehension is high then the use of legal sanctions, such as
licence suspension and revocation procedures, can be an effective
deterrent.
10. The use of point demerit schemes provides an effective means of linking
less serious repeat offences to more severe penalties.
11. The introduction of per se legislation and provisions which allow police to
stop and test any driver, are considered necessary to develop effective
alcohol enforcement strategies.
12. The use of sustained and highly intensive random breath testing (RBT)
operations is one of the most effective means of deterring drink driving
behaviour.
13. To maximise the benefits of RBT operations it is essential that large
proportion of drives are stopped and that ALL are tested for alcohol
impairment.
127
14. RBT operations should be highly visible, accompanied by sustained high
levels of publicity, rotated among numerous FIXED locations and
undertaken for no longer than a one hour period at each location.
15. The strategic deployment of random breath testing operations or
enforcement "blitzes" should be considered if a less resource intensive
enforcement option is required.
16. Legal sanctions are an essential element in the process of deterring drink
driving behaviour.
17. The use of roadside licence suspensions is an effective countermeasure
and provides a means of increasing the immediacy and certainty of
punishment.
18. The fitment of alcohol ignition interlocks, in the vehicles of recidivist drink
drivers is an effective countermeasure which should be considered.
19. Publicity campaigns should always be an integral component of
enforcement strategies.
20. The use of preventative strategies such as the implementation of alcohol
control polices and taxation measures, the development of server
intervention programs and the increased availability of public and personal
breath testing devices can compliment enforcement activities and should
be seriously considered.
21. The primary focus of speed enforcement should be on increasing
surveillance levels, and hence the actual and the perceived risk of
detection.
22. Traditional vehicle based enforcement methods should focus on increasing
the visibility and unpredictability of traffic policing operations.
128
23. Highly visible stationary enforcement operations have the greatest
deterrence potential.
24. to maximise the benefits and community acceptance of speed camera
operations it is important that enforcement is primarily targeted at accident
locations where speed is known to be a causal factor.
25. The use of both fixed (unmanned) and temporary site (manned) speed
camera operations can maximise the system wide effectiveness of speed
enforcement operations.
26. The development of strategies designed to ensure better spatial
deployment of available policing resources can increase the efficiency of
enforcement operations.
27. The use of publicity to support speed enforcement activities is an essential
requirement to raise community awareness and improve the effectiveness
of enforcement operations.
28. Behavioural feedback strategies such as the public posting of speed
information displays and incentive programs can increase the effectiveness
of speed enforcement operations.
29. Greater emphasis should be placed on the use license suspension /
revocation procedures.
30. emphasis should be placed on increasing the credibility of speed zones so
as to ensure greater acceptance and adherence, by road users, to the
posted speed limits.
31. Vehicle design characteristics to improve the accident avoidance capability
of vehicles, as well as the level of protection provided to vehicle occupants
can potentially reduce the injury consequences of speeding behaviour.
32. Consideration should be given to the development and implementation of
periodic. high intensity enforcement strategies (blitzes)
129
33. Enforcement activities should be supported by high levels of publicity and
program evaluations should be undertaken to provide police and the public
with feedback.
34. Special consideration should be given to the use of police education
programs to promote the safety and cost benefits associated with seat belt
enforcement operations.
35. The use of feedback devices (seat belt warning devices and dashboard
stickers) designed specifically to remind occupants to use their seat belts
should be actively promoted.
36. Highly visible enforcement operations sported by sustained publicity are
essential elements.
37. In order to maximise both the deterrence and accident reduction
effectiveness of red light cameras consideration should be given to use of :
Warning signs at intersection approaches;
The use of highly visible hardware installations;
The use of high level of supporting publicity; and
38. The use of new digital imaging systems should be considered as they can
significantly increase apprehension rates and are able to be used as a
portable red light enforcement device.
39. Greater consideration should be given to intersection design
considerations as a means of reducing intersection conflict situations and
as an alternative to enforcement.
40. The use of appropriate wintergreen timings, vehicle turning phases ( for
drivers wishing to turn at a right angle against the opposing flow of traffic)
and active intersection warming signs should be considered.
41. The more widespread use of roundabouts (as an alternative to signalised
intersections) and the provision of turning lanes at intersections should also be given a grater priority.
130
42. Modifying the social environment can change societal attitudes towards
road safety which is regarded as a necessary precursor to beneficial
behavioural changes
In the book titled “Indian Transport through the New Millennium”. Page 144-
190, the author states that the growth of personalised vehicle has been much
higher than that of public transport vehicles and identifies it as one of the important
factor having several implications and opines: “The disproportionate growth of the
personalised vehicles in Indian cities has many implications: severe road
congestion, reduction in speed increase in accidents, increased energy
consumption, and emission of local and global pollutant. He states: “the share of
mass transport in total passenger traffic was less than 55 per cent in major Indian
cities during the year 1980.
This inadequacy of urban road network has been compounded by the rapid
increase in the number of vehicles, most of which will ply on the urban roads. The
de-licensing of the auto industry in 1991 has fuelled an unparalleled growth in the
passenger car segment. The most visible evidence of the deteriorating urban
transport system in India is the rising number of traffic jams. The rapid growth of
personalised modes of transport in Indian cities gives rise to serious congestions
problems. A study has estimated that an increase in the share of bus travel from 57
per cent to 80 percent in big Indian cities will lead to 54 per cent reduction in
number of vehicles on road (MoUD, 1987)”
The author identifies insufficient road infrastructure as the next important
cause of concern and state that this also leads to more accidents, injuries and
deaths. The congestion problem in many cities is compounded by the fact that
there is no lane for slow moving vehicles and animals.
He also states that the rapid growth of personalise vehicle leads to increase
in fuel consumption and consequent increase in air pollution and summarises some
important facts: “Rapid growth of personalised vehicles is very unsustainable and
results in avoidable energy consumption and pollution. Because of the rapid
passenger transport growth in Delhi, its petrol consumption has been estimated to
increase by more than 5.5 times between 1990-91 and 2000-01. Similar trends are
expected in other metropolitan cities as well, including Mumbai and Kolkata (CSE
1996)
131
Energy consumption has direct linkages with the emission of air pollutants. In the three metropolitan cities, the share of automobiles in total pollutant emissions is quite high. According to the World Resources Report (1996-97), motor vehicles were responsible for 90 per cent of the Carbon Monoxide emissions, 85 per cent of hydrocarbon emissions, 59 per cent of the emission of Nitrogen Oxides (NOx), 13 per cent of Sulphur dioxide (SO2) emissions and 37 per cent of emissions of suspended Particulate Matter (SPM) in Delhi during 1987. According to the same study, automobiles caused about 52 per cent of the total Nox emissions, 5 per cent SO2 emissions and 24 per cent of SPM emissions in Mumbai in 1992. In the year 1993-94, the share of automobiles in total pollutant load was as high as 64 per cent in Delhi and 52 per cent in Mumbai. The share was 30 per cent in Kolkata in 1988-89. The contribution of automobiles to the atmospheric concentrations of air pollutants is very significant. Measurements indicate that while SO2 levels in the metros are generally within the prescribed limits, the concentrations of nitrogen oxides and SPM are well above the standards. Another study (Opinion survey 1998) conducted by the Union Environment Ministry in Delhi puts the SPM concentration between 362-452 micrograms per cubic meter on an average day. The study puts a very bleak picture on the environmental conditions of Delhi, measured in terms of water quality of the Yamuna river, noise pollution and the total pollution load. For example, Delhi's average noise level is 75-85 decibels compared to the limits of 45-75 decibels. The study also shows that the total pollution load in Delhi is rising very rapidly, from 1450 tonnes per day (tpd) in 1991 to 2890 tpd in 1995.
This trend should be checked. It is important to promote mass transport modes that are energy efficient and environmentally benign. It is possible to convert the energy units mentioned in the table to more popular units, namely the quantity of petrol or diesel. For example, in India, buses consume, on an average, about 0.212 MJ of direct fuel energy (equivalent to about 6 ml of diesel) per passenger kilometre. Diesel and electric tractions of railways consume about 0.241(about 7 ml of diesel) and 0.115 (about one thirtieth of a unit- kwh) MJ per passenger kilometre respectively. There are quite small compared to the energy consumption of personalised transport modes, which averages to about 0.532 MJ (equivalent to about 16 ml of petrol) per passenger kilo meter. Thus, huge savings in direct fuel consumption can be affected if the traffic from personalised modes is diverted to mass transport modes.
132
It has been estimated that an increase in the share of bus travel from 57 per
cent to 80 per cent in big Indian cites will lead to a saving of 1.1 million tonnes of
oil, 36 per cent reduction in air pollution, 27 per cent reduction in CO2 emissions
(MoUD, 1987).
The author writes that in 1993-94 there were 2.86 lakh accidents in Indian
roads resulting in 2.88 lakh injured persons and 60.595 casualties. The largest 120
metropolitan cities accounted for 44,653 accidents (16%). 36,888 injuries (13%)
and 5,197 casualties (8.6%). There seems to be no direct relation between
accident statistics and vehicular or population density. This may be attributed to the
slow vehicular speed in urban areas.
The author quotes a Readers’ Digest study about driver attitude and
behaviour: “According to an international study (Reader’s Digest October 1999)
Indian drivers are ranked second among Asia's traffic offenders, just after China.
Although India has only about the same number of vehicles as Thailand and
Taiwan combined, it accounts of more than 10 per cent of the world's traffic
fatalities each year.
The author suggests integrated approach: “Use of any single option in
isolation will not solve the problem, and an integrated use of all these options is
essential. For example, a policy to reduce the number of private vehicles will have
detrimental effects on the economic growth of a city unless an efficient public
transport system is made available. The public transportation system can function
efficiently only when it is integrated well with land use patterns. Similarly, larger
investment in public transport modes without controlling the growth of personal
vehicles will encourage avoidable and luxurious travels, and hence can lead to
unsustainable transport performance – large transport costs, more congestion,
pollution, etc. More importantly, the commitment of the implementing authority in
properly implementing the options is very crucial factor in deciding the success of
these options.
To support his argument author gives example of Brazil “Curitiba, the capital
of Parana state in south eastern Brazil, can provide can provide a good example of
sustainability and exemplary urban planning. It is one of the fastest growing cities in
a nation of urban booms. Its population growth was dramatic, from 300000 in 1950
to 2.1 million in 1990. It also transformed from an agricultural centre to an industrial
and commercial powerhouse during this period. Such development is likely to
133
cause several urban related problems, including congestion and environmental
decay. But, Curitiba defined conventional wisdom and adapted to the
transformation in a human friendly way.
The most important unifying feature of Curitiba's is its emphasis on an
integrated approach to public transportation system, land-use legislation and the
hierarchy of the road network. The key concept was to channel the city's physical
expansion away from the central city and along five pre-determined linear corridors.
Each corridor is built around a central or structural road that has exclusive lanes for
express buses, for local traffic, for high-speed car traffic flowing in and out of the
city. Municipal government acquires land along and close to the newly developed
corridors, prior to their constructions and organises constructions of high- density
housing programmes at these places. Zoning laws encourage high-density
commercial development along these transport corridors, while land away from the
corridors is zoned at low densities. On sites located along the corridors, buildings
are permitted to have a total floor area of up to six times the plot size. The
coefficient decreases as distance of site from public transport increases. This has
encouraged new commercial development outside the central city along the
corridors and ensured public transport to high density residential and commercial
areas. These developments in turn greatly reduced traffic congestion and noise in
the CBD area, which is meant mainly for pedestrians.
There is also a hierarchy of roads. Each road is assigned a function in
relation to its location and importance. First, there are five structural roads or
corridors. There are "priority" links connecting traffic to the structural roads.
“Connector" streets have commercial activity along them with all forms of traffic. :
"Connector" streets link the structural corridors to the industrial city.
Along the corridors, a central lane was set aside for buses only. New lines
were created and expanded as the city grew. A series of circular inter-district bus
routes has been developed since 199 to complement the express bus ways. Buses
are colour coded: the express buses are red, inter-district buses are green and
conventional (feeder) buses are yellow. There is full integration among the there
sets of buses for facilitating easy transfer. There are large bus terminals at the end
of the corridors, where people can transfer to inter-district, feeder or inter municipal
buses. One single fate is valid for all buses within Curitiba. Smaller bus terminals
are located approximately every two kilometres along the express routs.”
134
The author gives an Asian example too: “Singapore is one of the few major
cities in the world that is able to maintain a smooth traffic flow within the city area at
any time of the day. The keys to Singapore's success in urban transport
management lies with its good planning coordinated multi-prone approach and
strong political and institutional commitments.
Road space occupies 10 per cent of Singapore's land. Further road
expansion had to be limited because of the limited space. Hence a comprehensive
approach was adopted based on the principle of increasing road network capacity
while containing road traffic and optimising road use. Singapore's land transport
policy is built on four main pillars.
(1) Increasing road capacity, using a network of roads, expressways, tunnels, junction interchanges, flyovers and underpasses. Traffic junctions are fully computerised.
(2) Integrated land-use planning to bring schools, factories, office, shops and recreational and other facilities into or near housing estates to minimise the need to travel far or frequently for work and other activities.
(3) Promoting public transport (buses and the urban rail or MRT) by providing enough infrastructure such as bus stops, MRT stations and bus interchanges. Special lanes are designated for exclusive use by buses during peak hours. Special card can be used with both buses and MRT stations.
(4) Managing vehicle ownership and use in order to control congestion. Earlier, the Government has tried to curb rising vehicle ownership through fiscal disincentives such as very high registration fees, road tax and parking charges. These measures had limited success. A Vehicle Quota System (VQS) was introduced in 1990 to control the growth of vehicles directly by setting a quota on the number of new vehicles allowed on the roads. The quota ensures that vehicular growth is commensurate with gains in the carrying capacity of the road network. Under the VQS, a vehicle can only be registered with a Certificate of Entitlement (CoE), which is obtained through monthly tenders. CoE is valid for ten years only and needs to be renewed thereafter. An Area Licensing Scheme (ALS) has been in place to limit traffic entering the Central Business District (CBD), which requires vehicles entering the CBD to pay a license fee. The ALS scheme has recently been replaced
135
by an Electronic Road Pricing ( ERP) to allow charges to be fine-tuned depending upon the congestion level. A "weekend Car" scheme allows more people to use privet cars during off-peak hours on working days and during Sunday and public holidays.
The author suggests that the pricing and tax measures and parking controls:
“Pricing involves charging transport users so that part of the external costs of their travel is internalised. A variety of techniques can be used for the purpose: use of tolls, area licensing schemes, and electronic road pricing. Theoretically, an efficient road pricing scheme should cover all important roads of a city, and should employ differential pricing in accordance with the demand for road use (Newbury, 1990) For example, just like the telephone rates in India, higher prices should be charged for periods of maximum demand, namely the peak rush hours of the morning and evening. The goal is to encourage people to use public transport modes instead of private vehicles or to drive during off-peak periods. However, owing to technical, administrative and political complications, such theoretically efficient schemes are seldom implemented.
One can also think of levying an exclusive tax on car finance companies, as
they are partly responsible for increasing the number of vehicles on road. These
taxes are supposed to be used for the improvement of transport systems-
construction and maintenance of roads, subsidising public transport, etc.
Taxes: In addition, pollution cess may be levied from polluting modes of transport to cover the costs of pollution abatement. Private transport modes cause substantially larger pollution in India. Hence, a pollution tax may be imposed on their use, and a part of the revenue generated may be transferred to subsidise the environmentally benign mass transport systems. Parking controls: It is possible to discourage private car usage by providing parking restrictions. If the price of parking is high, or parking is limited, then people tend to prefer car-pooling or mass transport modes. However, these restrictions require an efficient public transportation system as an alternative. By providing a parking facility at the periphery of the CBD and providing adequate public transport to move inside the CBD, a significant amount of congestion in the CBD area can be avoided Vehicles desirous of entering into the CBD should be made to pay a hefty fee for the use of the road as well as for parking.
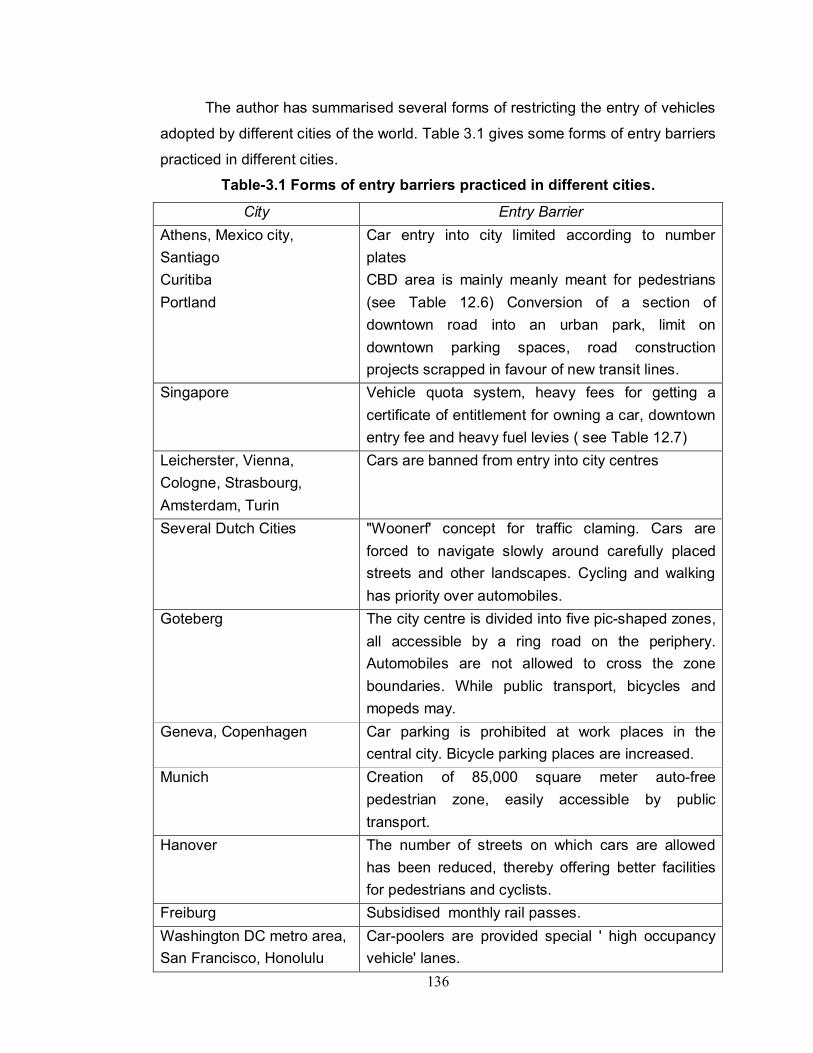
136
The author has summarised several forms of restricting the entry of vehicles
adopted by different cities of the world. Table 3.1 gives some forms of entry barriers
practiced in different cities.
Table-3.1 Forms of entry barriers practiced in different cities.
City Entry Barrier Athens, Mexico city, Santiago Curitiba Portland
Car entry into city limited according to number plates CBD area is mainly meanly meant for pedestrians (see Table 12.6) Conversion of a section of downtown road into an urban park, limit on downtown parking spaces, road construction projects scrapped in favour of new transit lines.
Singapore Vehicle quota system, heavy fees for getting a certificate of entitlement for owning a car, downtown entry fee and heavy fuel levies ( see Table 12.7)
Leicherster, Vienna, Cologne, Strasbourg, Amsterdam, Turin
Cars are banned from entry into city centres
Several Dutch Cities "Woonerf' concept for traffic claming. Cars are forced to navigate slowly around carefully placed streets and other landscapes. Cycling and walking has priority over automobiles.
Goteberg The city centre is divided into five pic-shaped zones, all accessible by a ring road on the periphery. Automobiles are not allowed to cross the zone boundaries. While public transport, bicycles and mopeds may.
Geneva, Copenhagen Car parking is prohibited at work places in the central city. Bicycle parking places are increased.
Munich Creation of 85,000 square meter auto-free pedestrian zone, easily accessible by public transport.
Hanover The number of streets on which cars are allowed has been reduced, thereby offering better facilities for pedestrians and cyclists.
Freiburg Subsidised monthly rail passes. Washington DC metro area, San Francisco, Honolulu
Car-poolers are provided special ' high occupancy vehicle' lanes.
137
The author suggests that techniques such as the Area Licensing Scheme
(ALS) practised in Singapore can be adapted to restrict the inflow of traffic in CBD
areas of Indian cities.
Mass transport systems can move more people while occupying lesser road
space. With the high occupancy rates of mass transport systems in India (they
operate at super saturated capacity during peak periods), they are also very
economical in terms of energy consumption and pollution for every passenger kilo
meter effected (see Table 3.4). As the Indian average occupancy of 1.6 per car and
about 50 people per bus, it is a substantial saving (of more than 10 times in terms
of PCU).
Buses should be made punctual, comfortable, fast and reliable. For faster
movement of vehicles, roads should have separate lanes for express buses ( inter
– state and inter – district), mofussil buses ( inter-city), city buses (intra-city), trucks,
cars and other personalised vehicles. Exclusive lanes for bicycles, and sufficient
footpath should also be provided. As far as possible, commuters should be able to
travel on any of these buses with a single ticket. To make public transportation
more attractive and punctual, buses should be given preference at signals and at
traffic congestion.
The author summaries the traffic improvement plan planned by many Indian
cities: “There are plants to improve the transportation supply in many Indian cities.
Metros are panned in Delhi and Mumbai, to be built with the help of international
funding agencies (such as the Overseas Economic Co-operation Fund of Japan for
Delhi). The Mumbai Urban Transport Project (MUTP) It is being negotiated with
international funding agencies. An elevated light rail transit system for Bangalore
and a LRT/MRT project for Jaipur are under consideration for inclusion in the ninth
five year plan. Maharashtra State Road Development Corporation is building over
50 flyovers and main elevated driveways in Mumbai. These will certainly help in
meeting the growing needs of the economic activities of these cities by easing
traffic snarls and open several arterial passages.”
138
He also suggests following measures:
1. Integrated public transport system should be planned such that the
commuters can buy a single ticket for travelling by different classes of buses
and suburban rail, if there is one. This can also reduce the fare to the
commuters due to telescopic pricing. The time wasted at the ticket counters
can be minimised. Those who own a ticket should be preferred to enter the
bus to avoid delays. Innovative bus designs, such as wide doors and closing
doors, can improve the quality of bus service.
2. Use of unleaded petrol can be promoted which eliminates harmful lead
emissions.
3. Engines may be designed such that they consume less fuel for moving the
same distance.
4. The progressively stricter pollution control norms also are ensuring the
adoption of such environmentally benign technologies.
5. Introduction of alternate transportation fuels can also reduce energy
requirements and emissions. Compressed Natural Gas (CNG), bio-ethanol
and methanol are the other possible fuels for transportation.
The author also emphasises the importance of maintenance of vehicles:
“Older and improperly maintained vehicles produce disproportionately more
pollution. It has been reported that a badly maintained older vehicle can emit 100
times the pollutants than a properly maintained new vehicle. In India, the problem
of improper maintenance is rampant. A study has reported that, at a random check,
43.6 per cent of the total new vehicles failed to meet the existing emission
standards. The proportion was higher (56.1%) for old vehicles. The study also
reported that 57.2 per cent of the two-wheelers and 53.8 per cent of the three
wheelers checked exceeded the emission limits (CSE,1996) Authorities in some
Indian cities are now thinking of banning older vehicles into city limits.”
The author concludes: “A sustainable transport development requires a
significant change in the attitudes and life-styles of commuters. This change is
possible only if the awareness on energy conservation and environmental
preservation should be instilled on their minds. Various capacity building measures
such as training, workshops and advertisements (trough hording, televisions, etc.)
can be employed in this regard.”


![CHAPTER 1 INTRODUCTION - Shodhgangashodhganga.inflibnet.ac.in/bitstream/10603/19094/10/10_chapter 1.pdf · CHAPTER 1 INTRODUCTION ... (Global Navigation Satellite System) [6-8],](https://img.pdfslide.us/doc/110x75/5adc54367f8b9a1a088bd244/chapter-1-introduction-1pdfchapter-1-introduction-global-navigation-satellite.jpg)