Embed Size (px)
Citation preview

Chapter 1: The Stock Market
1.4 Simple Moving Averages

What factors might contribute to the fluctuation of stock market prices?
How can stock data be smoothed?
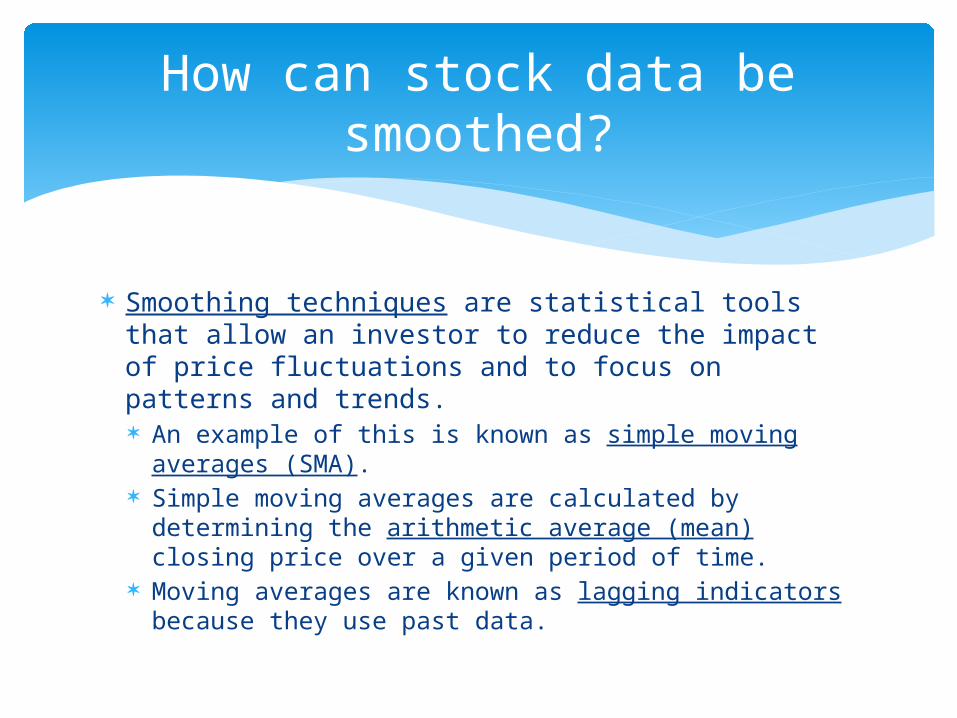
Smoothing techniques are statistical tools that allow an investor to reduce the impact of price fluctuations and to focus on patterns and trends. An example of this is known as simple moving
averages (SMA). Simple moving averages are calculated by
determining the arithmetic average (mean) closing price over a given period of time.
Moving averages are known as lagging indicators because they use past data.
How can stock data be smoothed?

Graph over 30 trading days

Example 1
The closing prices for 10 consecutive trading days for a particular stock are shown. Calculate the 5-day SMA and plot both the closing prices and the averages on a graph.

To find 3 day moving average
To use the previous 3 day moving average
Simple Moving Averages Using the Subtraction and Addition Method
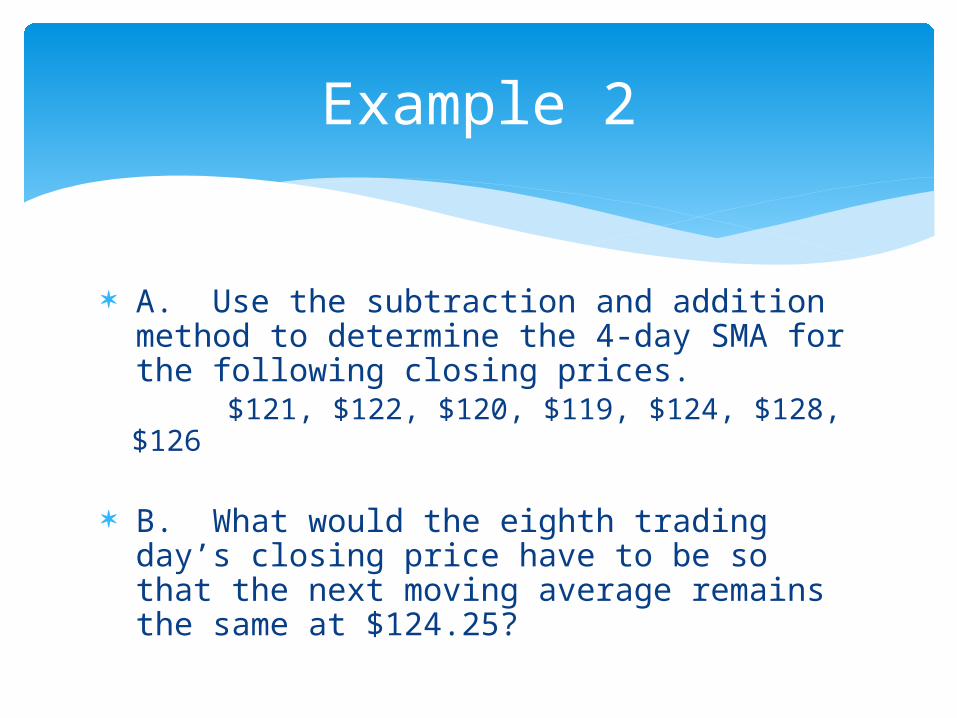
A. Use the subtraction and addition method to determine the 4-day SMA for the following closing prices.
$121, $122, $120, $119, $124, $128, $126
B. What would the eighth trading day’s closing price have to be so that the next moving average remains the same at $124.25?
Example 2

Graphs with smaller time intervals are called fast moving averages.
Graphs with larger time intervals are called slow moving averages.
A crossover occurs when a one-time interval moving average graph overtakes (rises above) another. Consider buying when fast moving average
graph overtakes slow moving average graph. Consider selling when the fast moving average
graph falls below the slow moving average graph.
Crossovers
Example 3
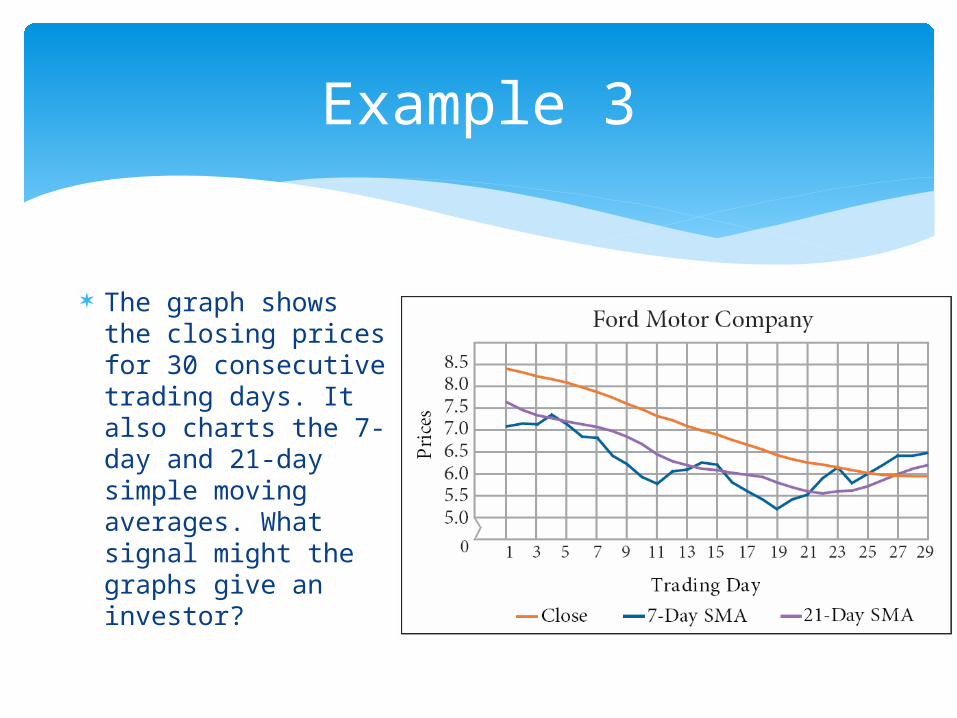
The graph shows the closing prices for 30 consecutive trading days. It also charts the 7-day and 21-day simple moving averages. What signal might the graphs give an investor?

p.27#2, 4, 7, 9, 13, 14
1.4 HW