Embed Size (px)
Citation preview

1
Chapter 1
The Ocean as a HabitatThe Ocean as a Habitat

2
The Changing Marine Environment
Newsflash: Things have changed over the 5 billion year history of the Earth!!!

3
What changes???Physically – How?Chemically – How?
Density stratification Atmosphere w/ water vapor

4
What changes???
Geologically – How?Biologically – How?
Oceans getting deeper Continents getting larger & higher
Oxygen revolutionOzone layer
Marine bacteria
5
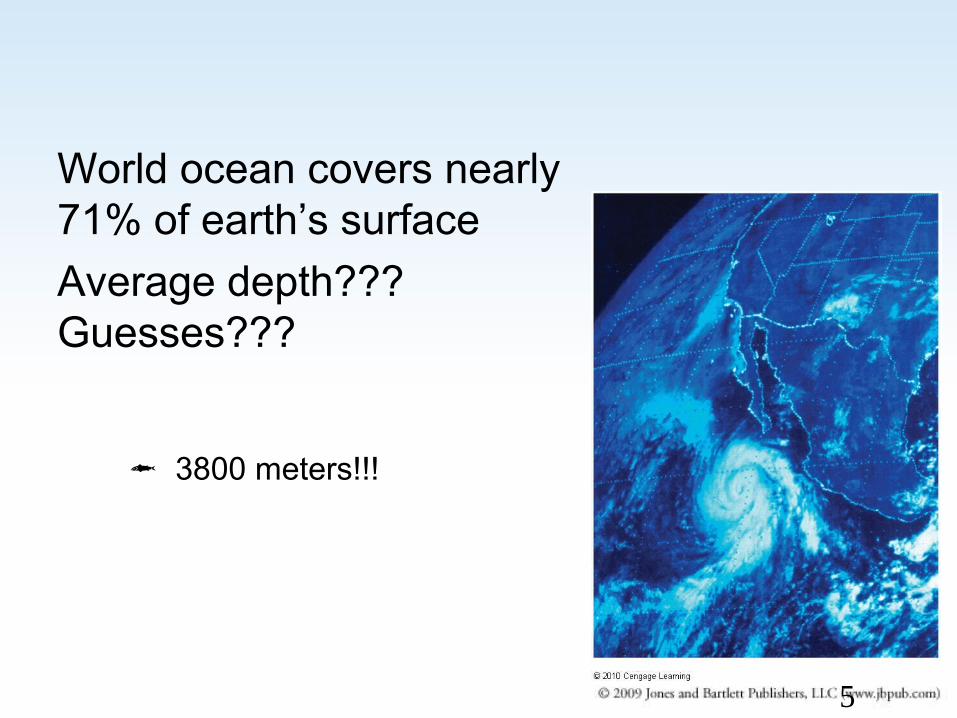
World ocean covers nearly 71% of earth’s surfaceAverage depth??? Guesses???
3800 meters!!!

6
The Challenger’s Voyage69,000 nautical miles!!!
Charting the Deep

7
Charting the Deep The interrelated concepts of continental drift and
plate tectonics have radically changed our view of the ocean’s structure.

8
Layers of the earth
Inner coreOuter coreMantleCrustLithosphere: crust and
upper mantleAthenosphere: below
lithosphere (liquid)

9
Plate tectonics – The lithosphere is
broken up into tectonic plates
Earthquakes rock!

10
Plates can come together and move apart

11
A Different View of the Ocean Floor
Fig. 1.6 Cross-section of a spreading ocean floor, illustrating the relative motions of oceanic and continental crusts. New crust is created at the ridge axis, and old crust is lost in trenches.
Crust created Crust destroyed

12
Seafloor spreading – the mechanism of continental drift: occurs at ridges

13

14

15

16
subduction
Subduction zones occur at trenches

17
Continental Drift
All continents were once part of a supercontinent – Pangaea – that split and drifted apart

18
A Different View of the Ocean Floor
About 200 million years ago, Pangaea, separated into Laurasia and Gondwana.

19
The World Ocean
Earth’s oceans exist as a large inter-connected system of mixing seawater.
Visualizing the World Ocean

20
Shelf break (120 – 200 m)
Abyssal plain
3000-4000 m
3000-5000 m
Trenches > 6000m

21
The World Ocean
Courtesy National Geophysical Data Center/NOAA
Seamounts, islands, abyssal hills
22
Properties of Seawater

23
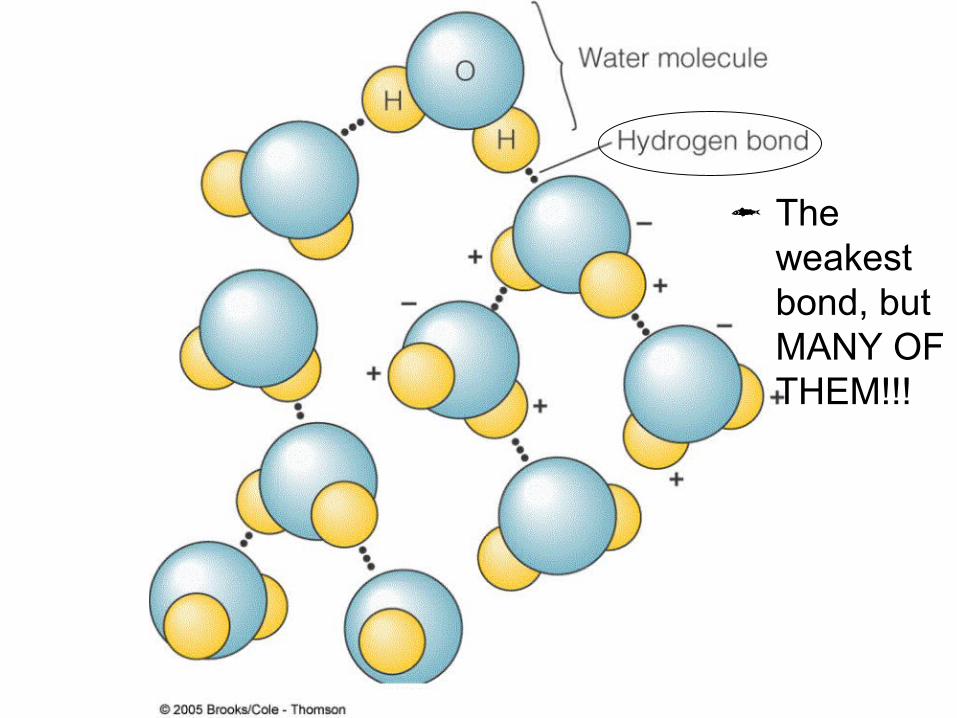
Polar molecule
Covalent bond – the strongest bond
24
The weakest bond, but MANY OF THEM!!!

25
Properties of SeawaterPure Water

26
Properties of Seawater1. Highest Viscosity and Surface Tension
of all liquids!
Fig. 1.15 A water strider (Halobates), one of the few completely marine insects, is supported by the surface tension of seawater.
© Vasiliy Koval/ShutterStock, Inc.
27
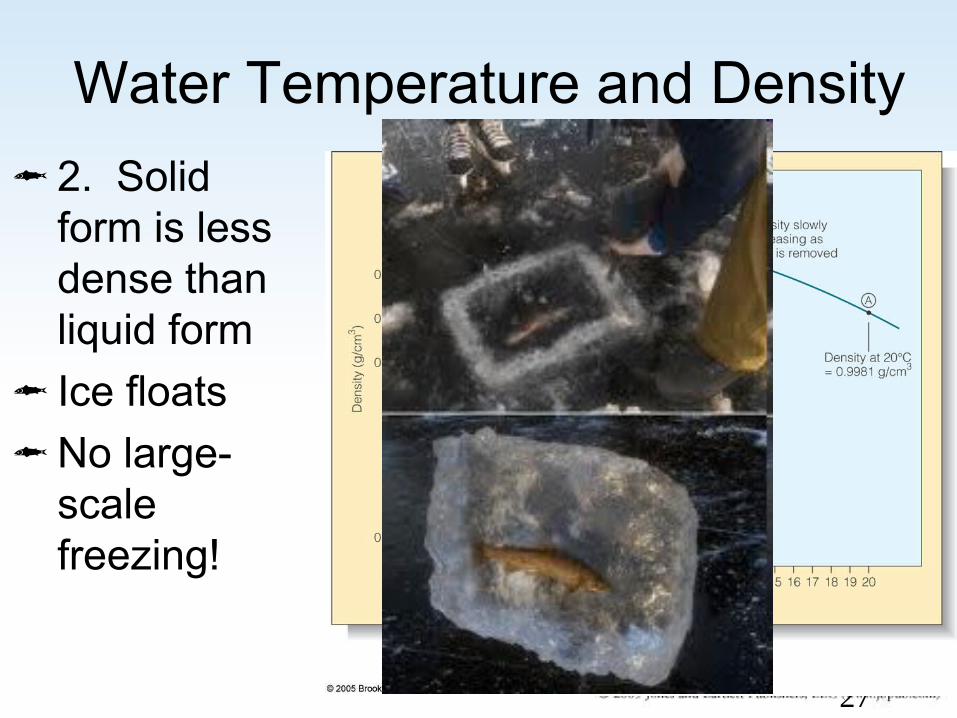
Water Temperature and Density2. Solid
form is less dense than liquid form
Ice floatsNo large-
scale freezing!

28
Properties of Seawater3. High Heat CapacityA. High latent heat of fusion B. High latent heat of vaporizationC. High boiling pointD. High freezing point
What does this mean for water and the “global” ocean?

29
Properties of Seawater
4. Water’s a good solvent!
Na+
Cl–
– –– –
––
–
––– –
+ + + ++
++
+++
+++ +++
++

30
Seawater vs. Freshwater
96.5% pure water3.5% other stuff:
SALTS, also dissolved gases & organic
compounds
Amount of salts = salinity!!!
31
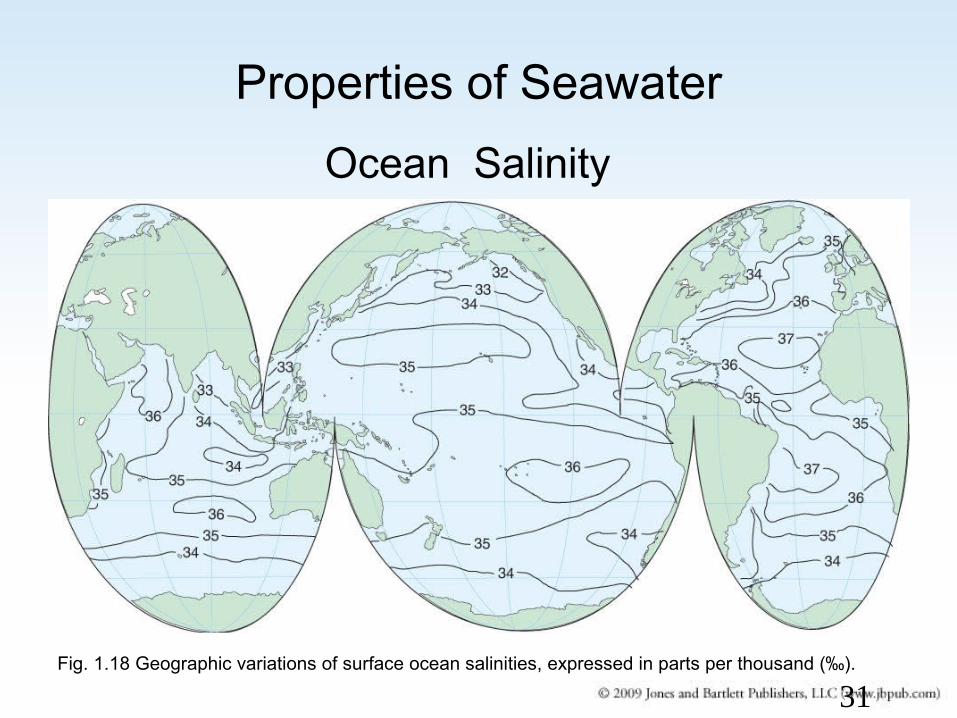
Properties of Seawater
Fig. 1.18 Geographic variations of surface ocean salinities, expressed in parts per thousand (‰).
Ocean Salinity
32
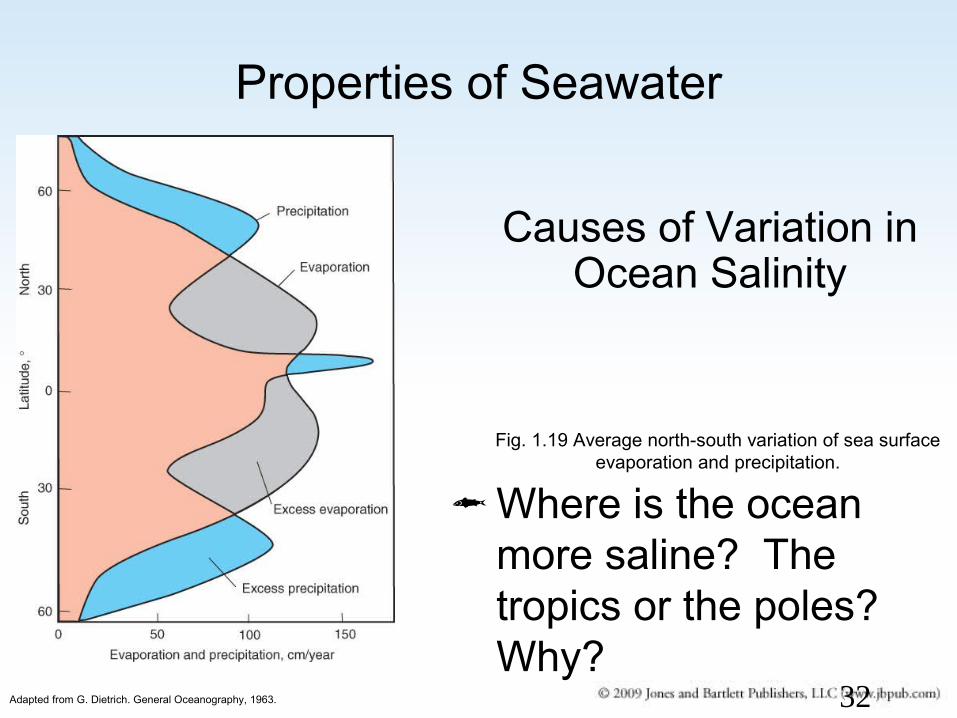
Properties of Seawater
Fig. 1.19 Average north-south variation of sea surface evaporation and precipitation.
Causes of Variation in Ocean Salinity
Adapted from G. Dietrich. General Oceanography, 1963.
Where is the ocean more saline? The tropics or the poles? Why?

33
The source of the salts…sort of…
34
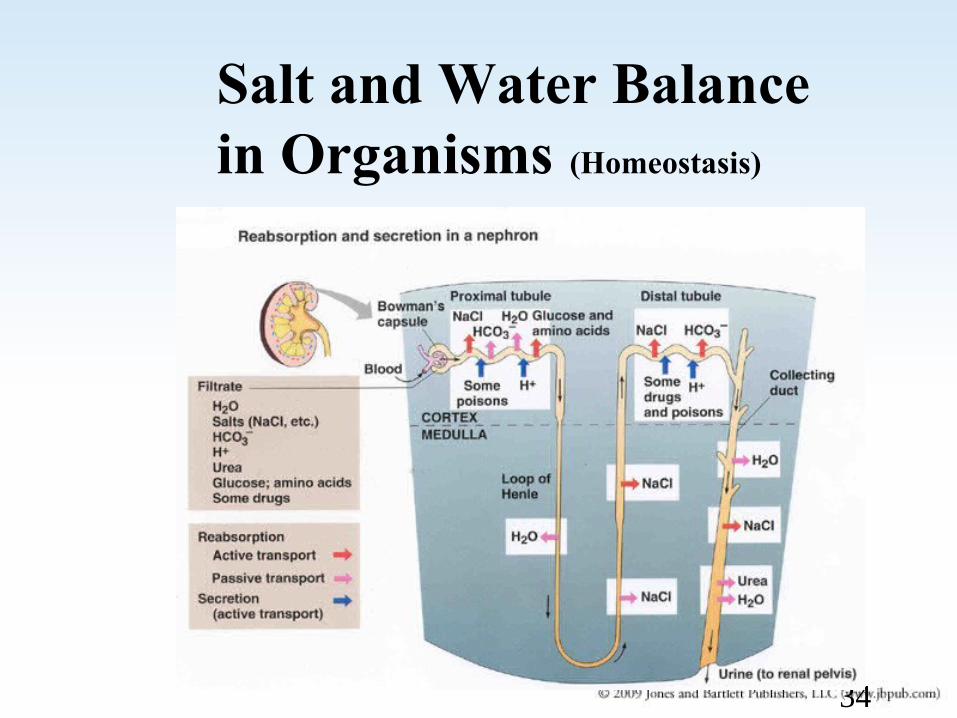
Salt and Water Balance in Organisms (Homeostasis)

35
Properties of Seawater
Fig. 1.20 A comparison of the osmotic conditions of a sea cucumber and a salmon in seawater and fresh water.
Which organism can maintain homeostasis better???
How does water move???
There are rules!!! Diffusion!!!

36
Properties of Seawater
Light and Temperature in
the Sea
Fig. 1.21 Fate of sunlight as it enters seawater. The violet and red ends of the visible spectrum
are absorbed first.

37
Properties of SeawaterLight and Temperature in the Sea
Fig. 1.22 The electromagnetic radiation spectrum. The small portion known as visible light is passed through a prism to separate the light into its component colors.
38
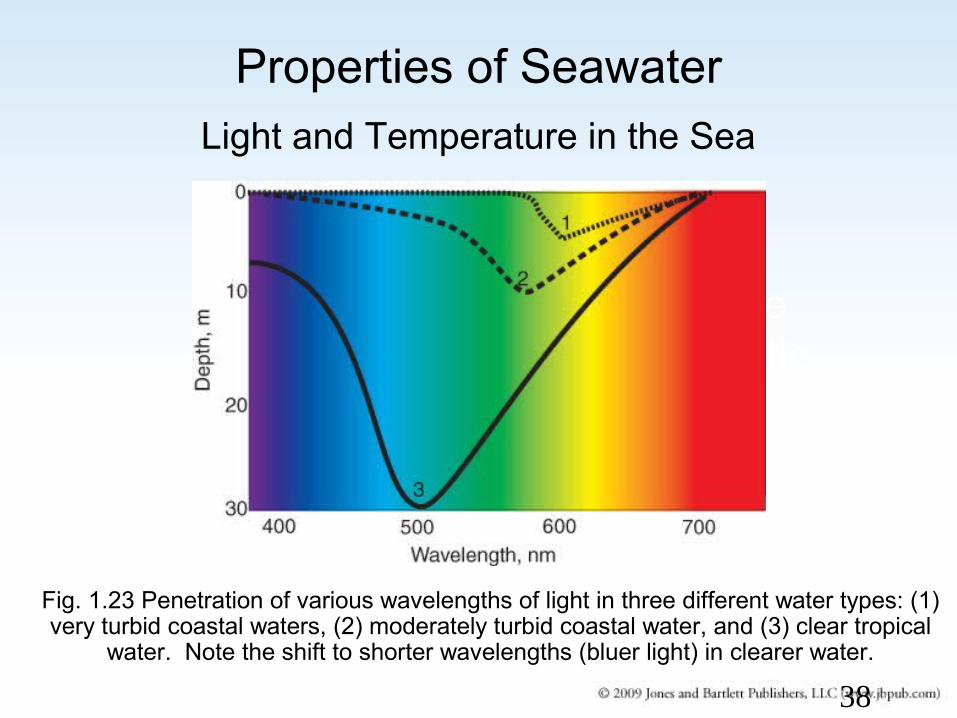
Properties of SeawaterLight and Temperature in the Sea
Fig. 1.23 Penetration of various wavelengths of light in three different water types: (1) very turbid coastal waters, (2) moderately turbid coastal water, and (3) clear tropical
water. Note the shift to shorter wavelengths (bluer light) in clearer water.
The Photic Zone
39
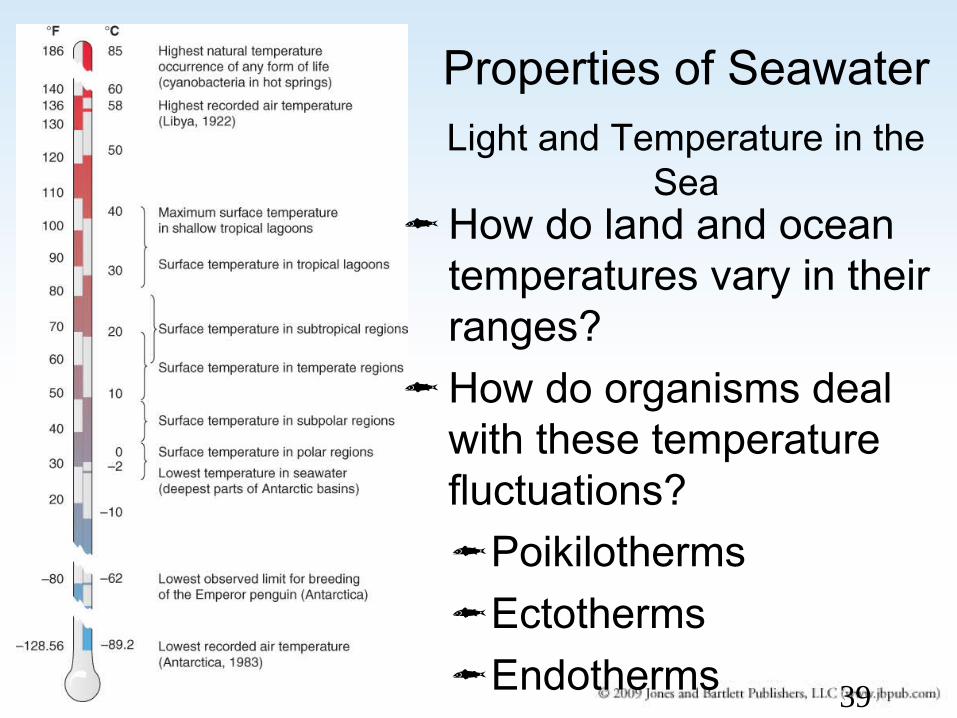
Properties of SeawaterLight and Temperature in the
SeaHow do land and ocean
temperatures vary in their ranges?
How do organisms deal with these temperature fluctuations?PoikilothermsEctothermsEndotherms
40
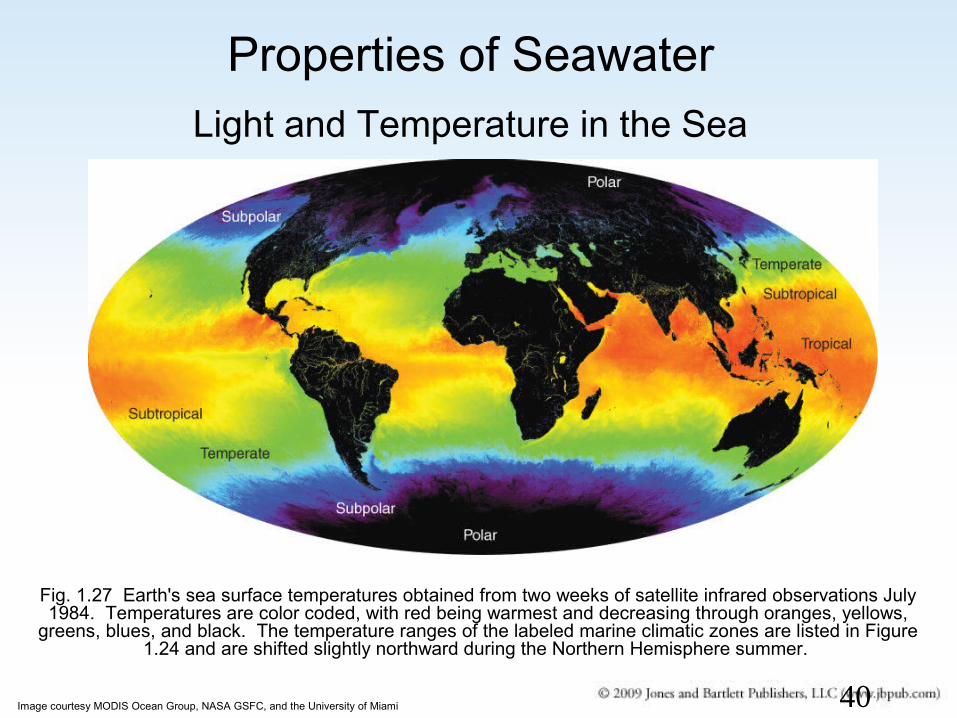
Fig. 1.27 Earth's sea surface temperatures obtained from two weeks of satellite infrared observations July 1984. Temperatures are color coded, with red being warmest and decreasing through oranges, yellows,
greens, blues, and black. The temperature ranges of the labeled marine climatic zones are listed in Figure 1.24 and are shifted slightly northward during the Northern Hemisphere summer.
Properties of SeawaterLight and Temperature in the Sea
Image courtesy MODIS Ocean Group, NASA GSFC, and the University of Miami

41
Properties of Seawater Ocean Layers
The ocean is layered!!!
How is it layered???

42Fig. 4-18, p. 85
By temperature!
Thermocline – zone of rapid temperature change

43Fig. 4-18, p. 85
By salinity!
Halocline – zone of rapid change in salinity
increases
44Fig. 4-18, p. 85
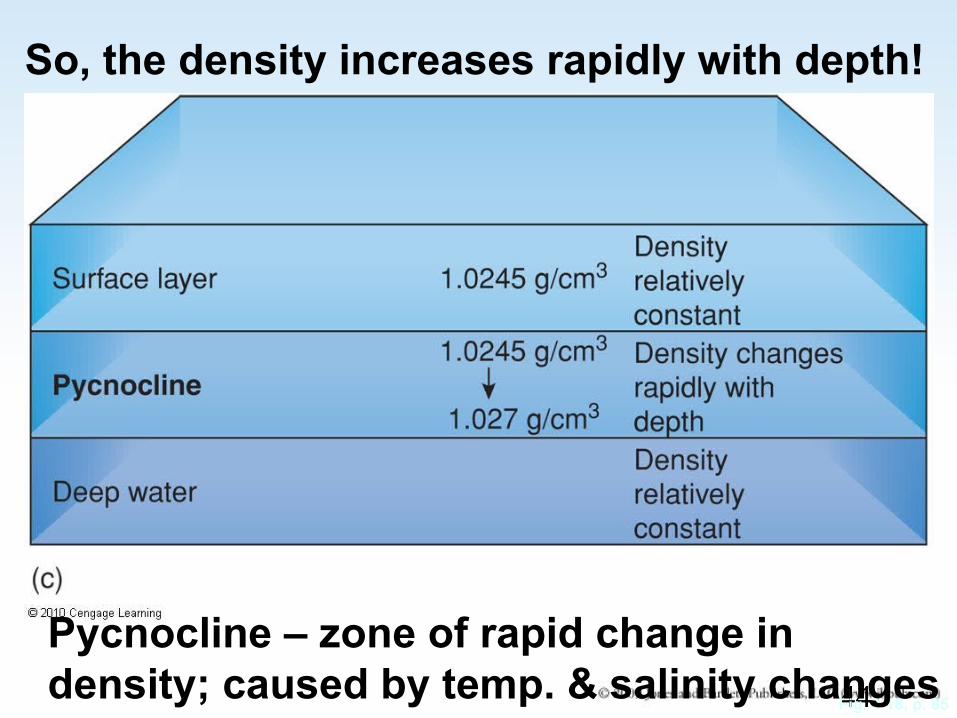
So, the density increases rapidly with depth!
Pycnocline – zone of rapid change in density; caused by temp. & salinity changes
45
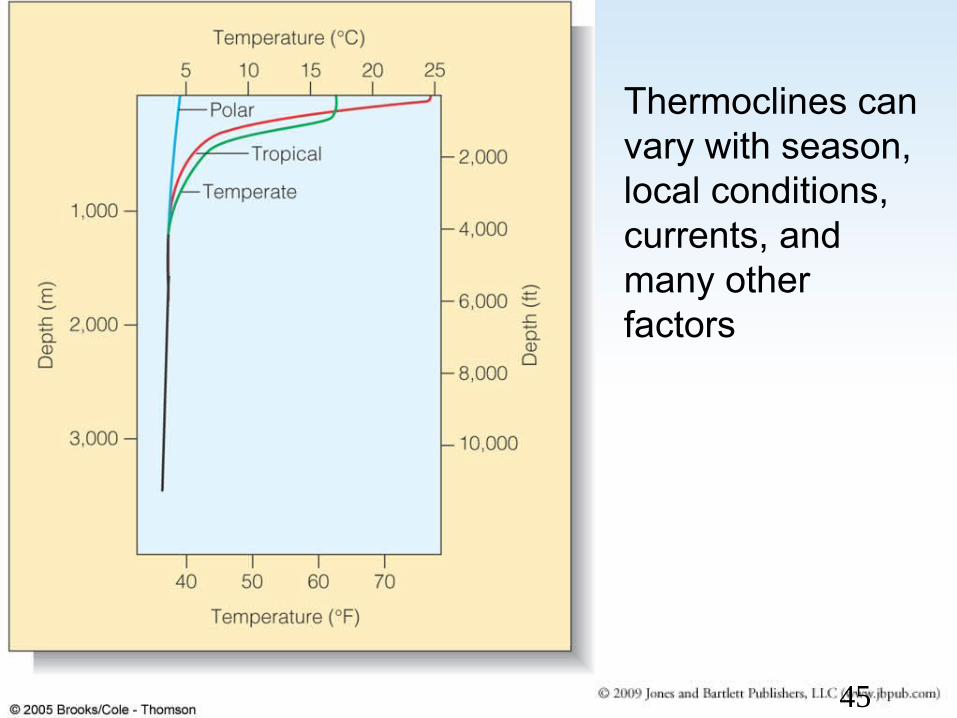
Thermoclines can vary with season, local conditions, currents, and many other factors

46
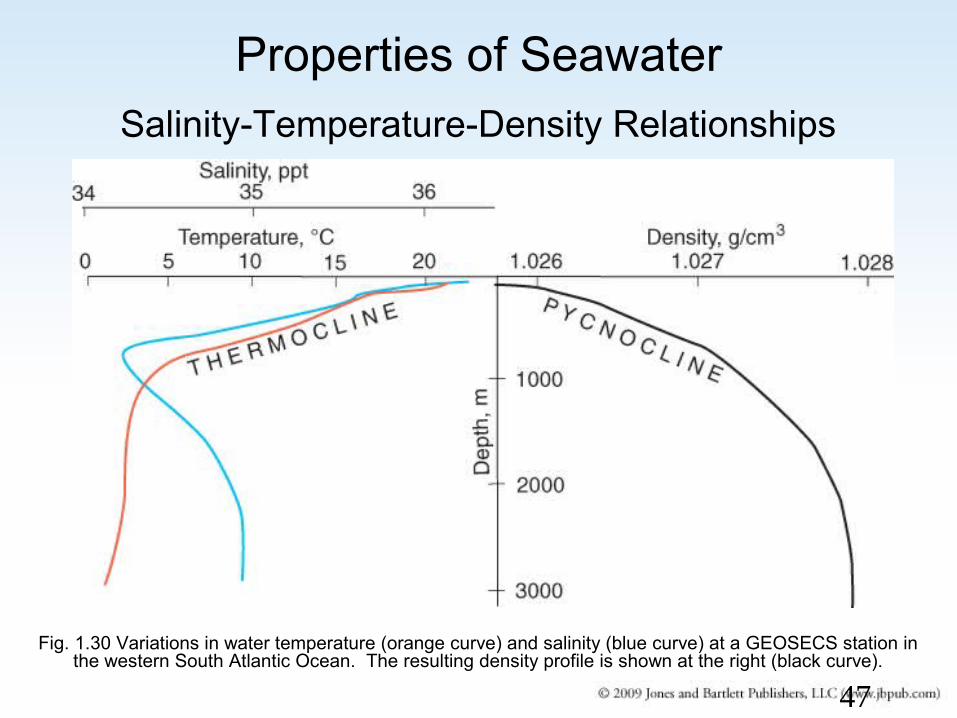
Properties of SeawaterSalinity-Temperature-Density Relationships
Fig. 1.29 Temperature-salinity-density diagram for seawater. Purple curved lines represent density values (in g/cm3) resulting from the combined effects of temperature and salinity. Three fourths of
the volume of the ocean is remarkably uniform, with salinity, temperature, and density characteristics defined by the dark blue area.
47
Fig. 1.30 Variations in water temperature (orange curve) and salinity (blue curve) at a GEOSECS station in the western South Atlantic Ocean. The resulting density profile is shown at the right (black curve).
Properties of SeawaterSalinity-Temperature-Density Relationships

48
I’ve got gas!!!
49
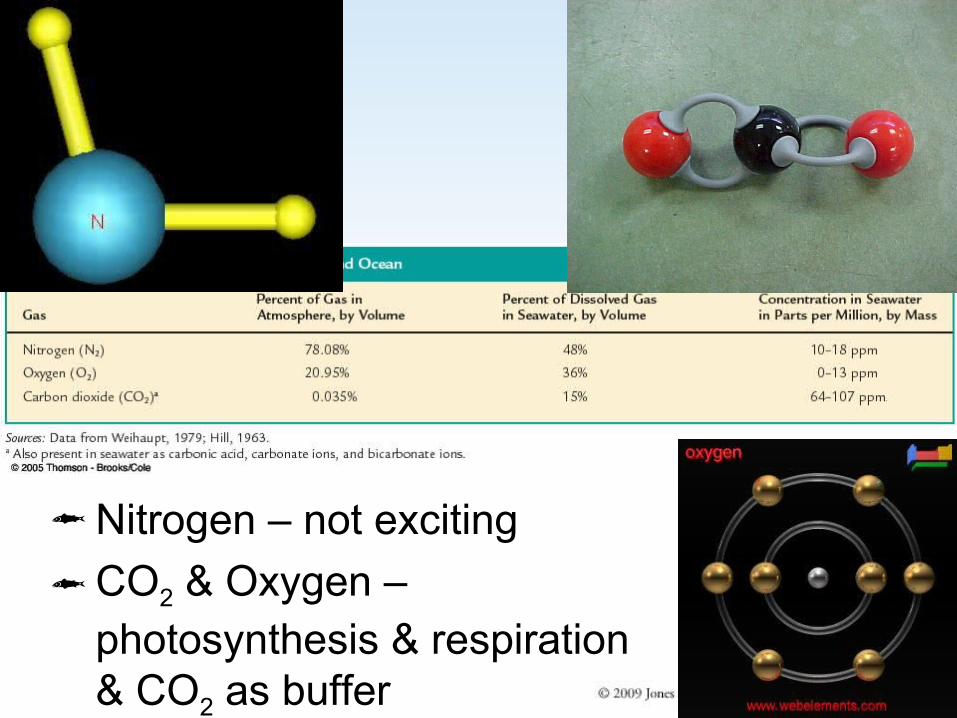
Nitrogen – not excitingCO2 & Oxygen –
photosynthesis & respiration & CO2 as buffer

50
A buffer is a substance that can maintain the pH of a solution at a relatively constant point.
51
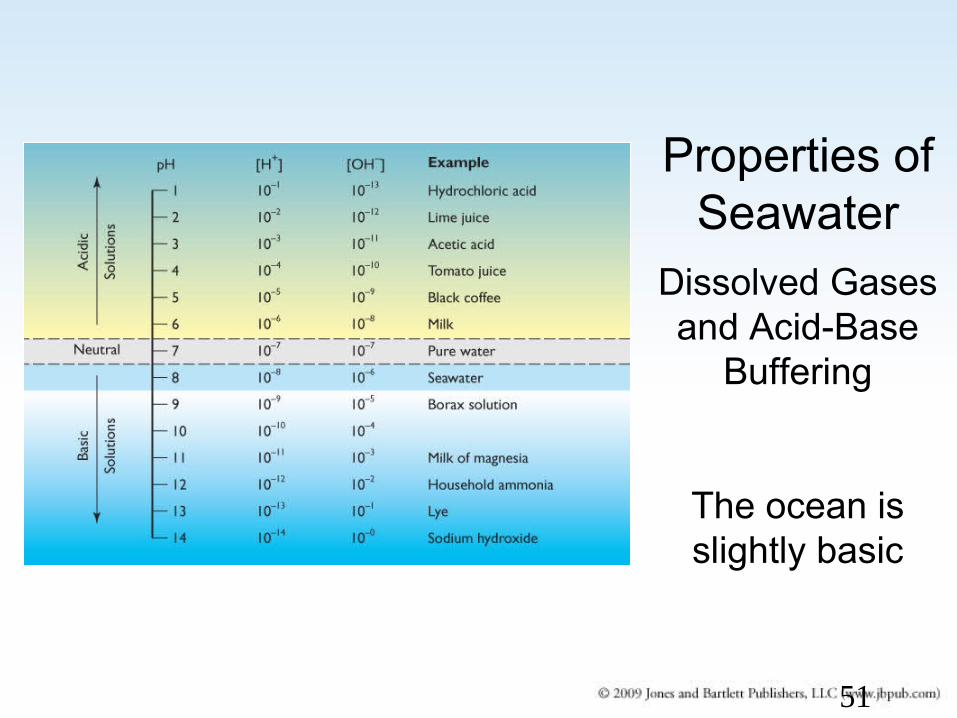
Properties of Seawater
Dissolved Gases and Acid-Base
Buffering
The ocean is slightly basic
52
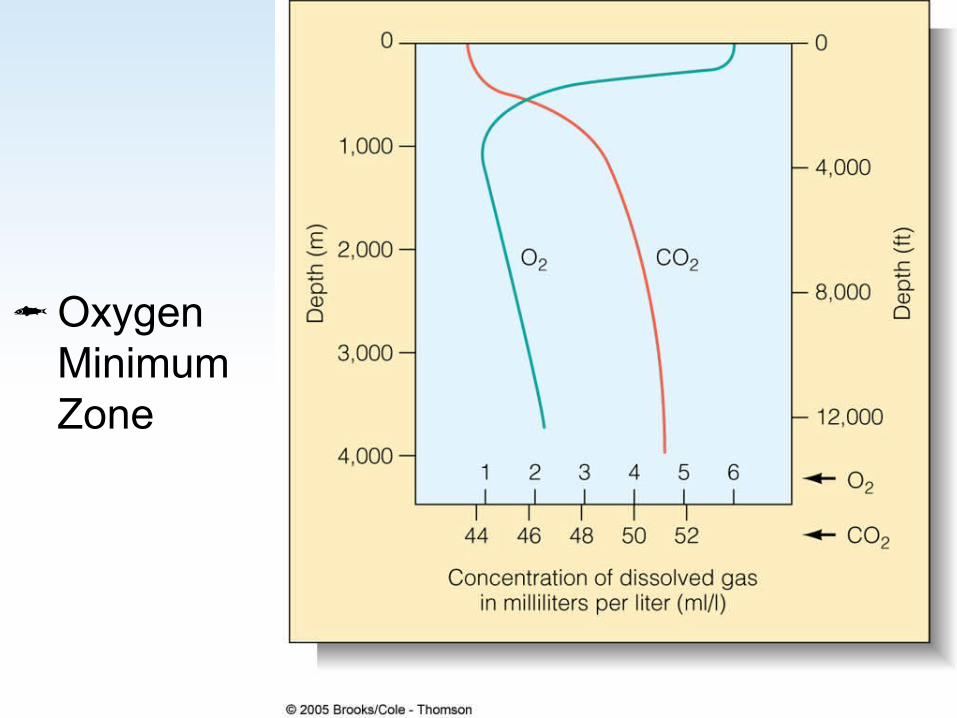
Oxygen Minimum Zone
53
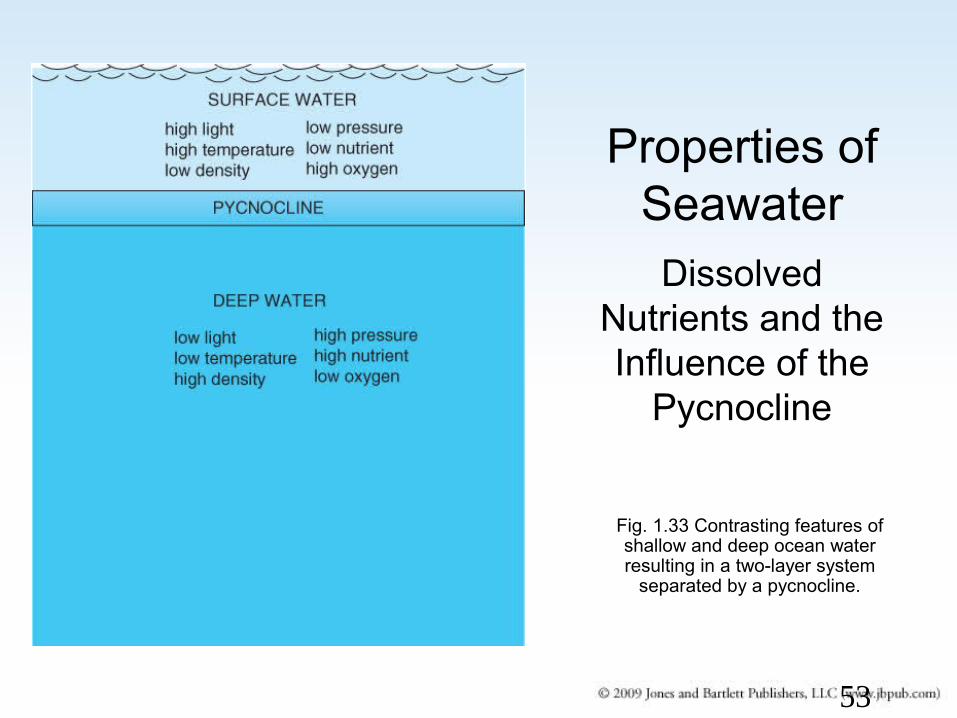
Properties of SeawaterDissolved
Nutrients and the Influence of the
Pycnocline
Fig. 1.33 Contrasting features of shallow and deep ocean water resulting in a two-layer system
separated by a pycnocline.

54
The Ocean in MotionThe Ocean in Motion
The sea is constantly moving, both horizontally and vertically.
Winds, waves, tides, currents, sinking water masses, and upwelling all contribute to the remarkable homogeneity of the world ocean.

55
The Ocean in MotionThe Ocean in MotionWind Waves The character of wind-driven ocean waves depends on
the wind’s speed, duration, and fetch.
Fig. 1.35 Wave form and pattern of water motion in a deep-water wave as it moves to the right toward a shoreline. Circles indicate orbits of water particles diminishing with depth. There is
little water motion below a depth equal to one half of the wavelength.

56
The Ocean in MotionSurface CurrentsOcean surface
currents are driven by stable patterns of surface winds.
Affected by Coriolis Effect – deflection due to Earth’s rotation
http://www.youtube.com/watch?v=_36MiCUS1ro
57
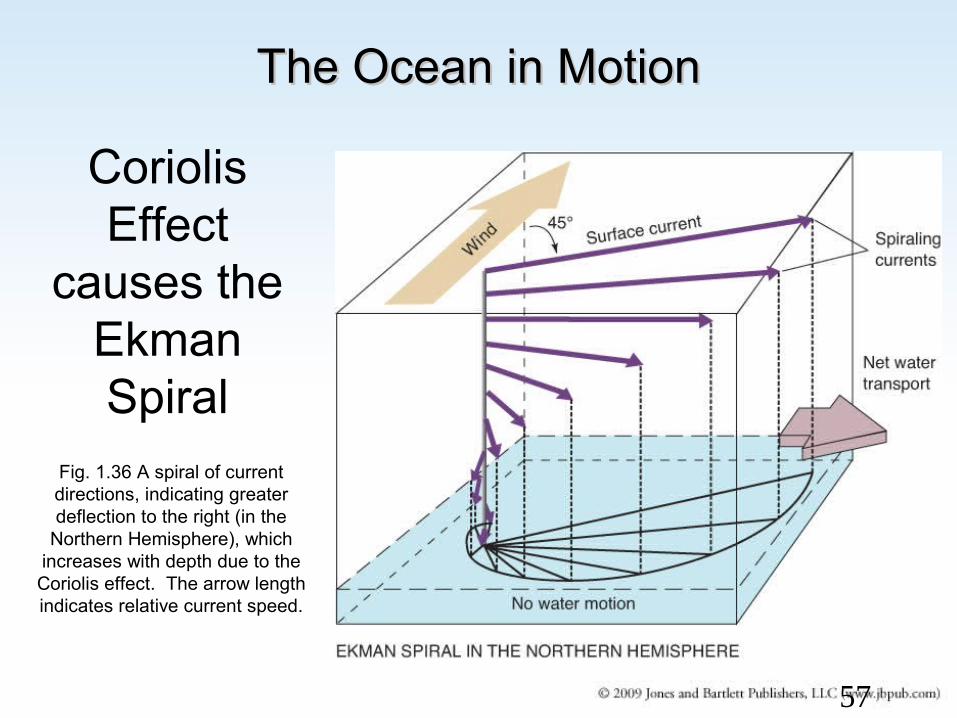
The Ocean in MotionThe Ocean in Motion
Fig. 1.36 A spiral of current directions, indicating greater deflection to the right (in the
Northern Hemisphere), which increases with depth due to the Coriolis effect. The arrow length indicates relative current speed.
Coriolis Effect
causes the Ekman Spiral

58
The Ocean in MotionThe Ocean in Motion
The North Pacific Gyre
The largest surface currents are organized into huge circuits known as gyres
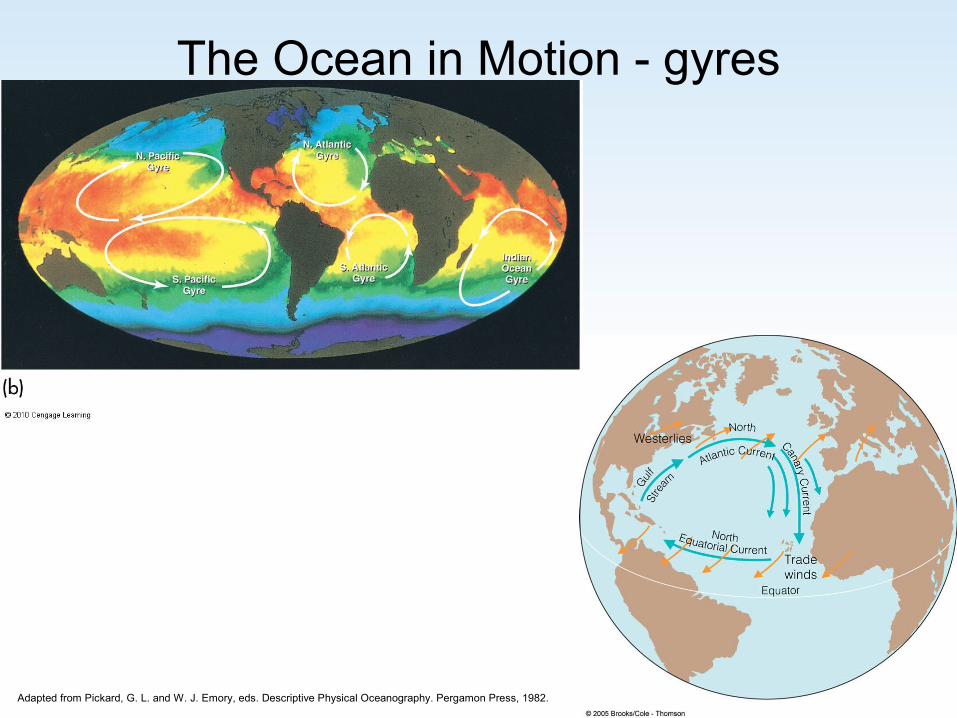
59
The Ocean in Motion - gyres
Adapted from Pickard, G. L. and W. J. Emory, eds. Descriptive Physical Oceanography. Pergamon Press, 1982.

60
The Ocean in Motion - TidesTides are the periodic changes in water level that occur along coastlines.They are a result of the gravitational pull of the moon and the sun on the water of the oceans.
Lowest lows, highest highs
Smallest change between lows & highs
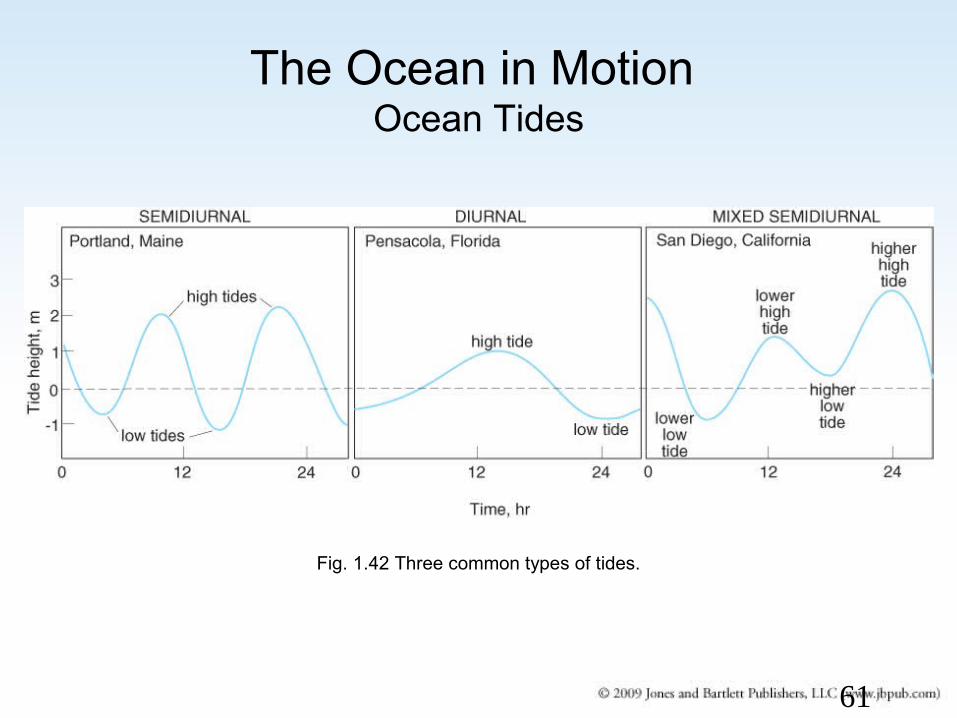
61
The Ocean in Motion Ocean Tides
Fig. 1.42 Three common types of tides.

62
The Ocean in Motion Ocean Tides
Fig. 1.43 The geographic occurrence of the three types of tides described in Figure 1.42.
63
The Ocean in Motion
Vertical Water Movements Vertical circulation of ocean water results
from density-driven sinking processes.
64
The Ocean in Motion – Vertical Water Movements

65
Vertical Mixing
thermohaline circulation – mixing by differences in temp & salinity

66
Classification of the Marine Environment
Energy from the sun:warms the sea’s surface creates winds
Winds result in a two-layered world ocean, with:a shallow, well-mixed, warm, sunlit layer overlaying a much deeper, cold, dark, high-pressure layer of
slowly moving water below

67
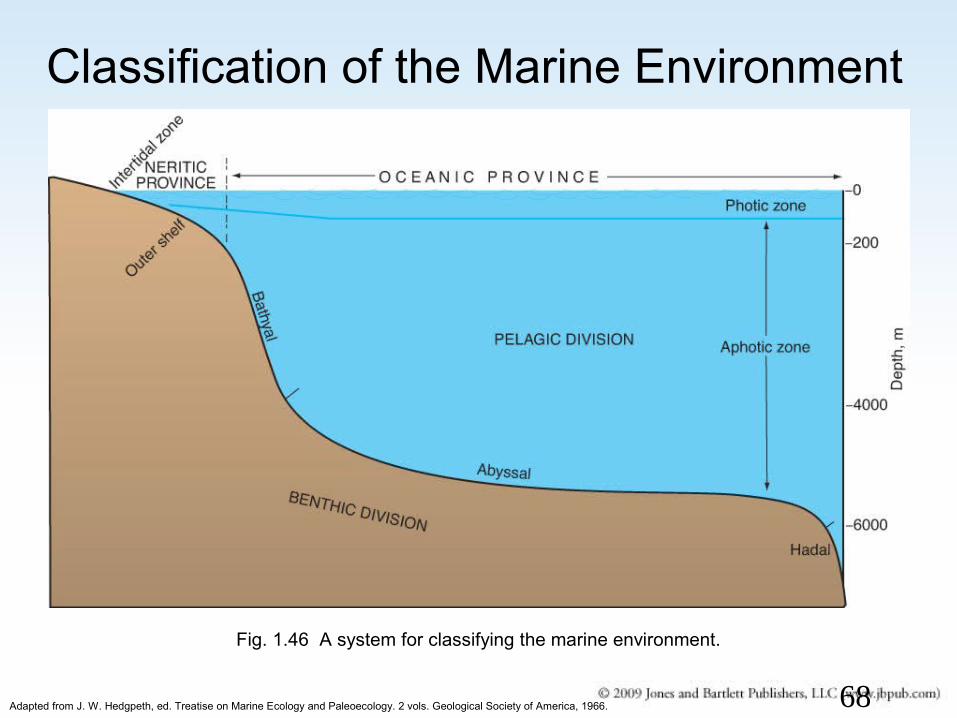
Classification of the Marine EnvironmentThe three-dimensional marine environment can be separated into two broad divisions: the benthic realm of the sea floor (bathyal, abyssal, hadal) and the pelagic water column (neritic, oceanic)
68
Classification of the Marine Environment
Fig. 1.46 A system for classifying the marine environment.
Adapted from J. W. Hedgpeth, ed. Treatise on Marine Ecology and Paleoecology. 2 vols. Geological Society of America, 1966.