Embed Size (px)
Citation preview

Chapter 1 Surveying Part 650 Engineering Field Handbook Florida Supplement
(210-vi-EFH-Florida Supplement February 2011) FL1D - 1
SECTION D: FLORIDA AUTOCAD CIVIL 3D DESIGN PROCEDURES
The use of AutoCAD Civil 3D can greatly improve the efficiency of plotting and the processing of survey data. The survey data must be collected in a manner that will be compatible with AutoCAD Civil 3D. Such features in AutoCAD Civil 3D like the Survey and Figure databases will need to be set. The procedures described below shall be followed when setting the Survey and Figure databases, importing survey points, importing .SID files, and creating surfaces for contour lines using the downloaded survey data.
Before using this procedure, the following programs should be installed on the computer:
Microsoft Activesync V. 4.50 - used to link to total stations and external data collectors.
Trimble Data Transfer V. 1.50 - useful to download the base files from R8/GNSS GPS grade survey equipment.
Trimble RINEX converter- useful to convert the DAT or T01 base receiver file into a RINEX file, which is the file required by OPUS for post processing.
Register with Trimble to obtain an authorization key to use Trimble Link menu on AutoCAD.
Have the current Geoid Model (current Geoid Model is G03USDA.ggf) installed using AutoCAD and Trimble Link menu. (An IT specialist may have to do this.)
This procedure is written assuming that the user has a basic understanding of AutoCAD Civil 3D. If a more detailed explanation is required refer to the online vbooks located at www.nrcsknowledge.com
A. SETTING THE USER SURVEY DATABASE AND FIGURE PREFIX DATABASES.
1. Open a new drawing in AutoCAD Civil 3D.
2. Open the “Toolspace” palette if not already open by clicking “General”>”Toolspace”, or type “showts” into the command line.
3. In Toolspace select the “Survey” tab.
4. Click the icon at the upper left corner of the survey tab. See Figure A-1.
Figure A-1: Survey User Settings
5. In the “Survey User Settings” dialog box click the file path icon for “Survey database settings path”. See Figure A-2.
Figure A-2: Survey User Settings Dialog Box
6. In the “Browse for Folder” window navigate to the desired location for saving survey databases and click “OK”.
a. This file path is saved until changed.
b. The desired location should be set to allow access for everyone that needs to use the survey databases. (Server or external hard drive that can be mapped by everyone)
7. In the “Survey User Settings” dialog box click the file path icon for “Figure prefix database path”.
8. In the “Browse for Folder” window navigate to the desired location for saving figure prefix databases and click “OK”.
a. This file path is saved until changed.
Chapter 1 Surveying Part 650 Engineering Field Handbook Florida Supplement
FL1D - 2 (210-vi-EFH-Florida Supplement February 2011)
b. The desired location should be set to allow access for everyone that needs to use the Figure Prefix databases. (Server or external hard drive that can be mapped by everyone)
9. Click “OK” to close the “Survey User Settings” dialog box.
B. IMPORTING A TSC2 JOB FILE INTO AUTOCAD CIVIL 3D
1. Open and save a new drawing in AutoCAD Civil 3D. Place in the proper project folder and give it a file name.
2. Plug the TSC2 Data collector into the computer.
3. MS Active Sync will sync Data collector with the computer and will bring up a dialog box notifying the connection between the computer and the Data collector.
4. In Civil 3D select “Import Job” from the “Trimble” menu. See Figure B-1.
Figure B-1: Trimble Menu
5. From the list of Devices, select “Survey Controller on Activesync”.
There will be two devices, one mentioned above and a connection device that allows the data collector to use a different Trimble Communications cable to the computers COM1 port called “Survey Controller on COM1”. See Figure B-2.
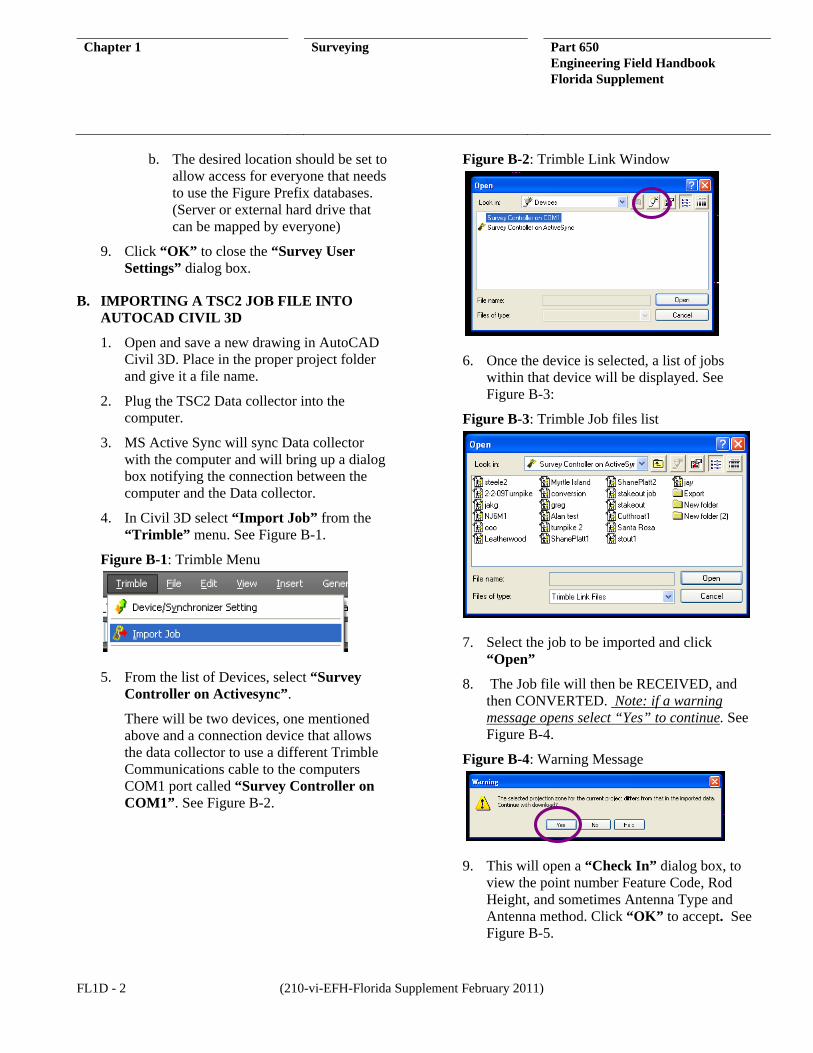
Figure B-2: Trimble Link Window
6. Once the device is selected, a list of jobs within that device will be displayed. See Figure B-3:
Figure B-3: Trimble Job files list
7. Select the job to be imported and click “Open”
8. The Job file will then be RECEIVED, and then CONVERTED. Note: if a warning message opens select “Yes” to continue. See Figure B-4.
Figure B-4: Warning Message
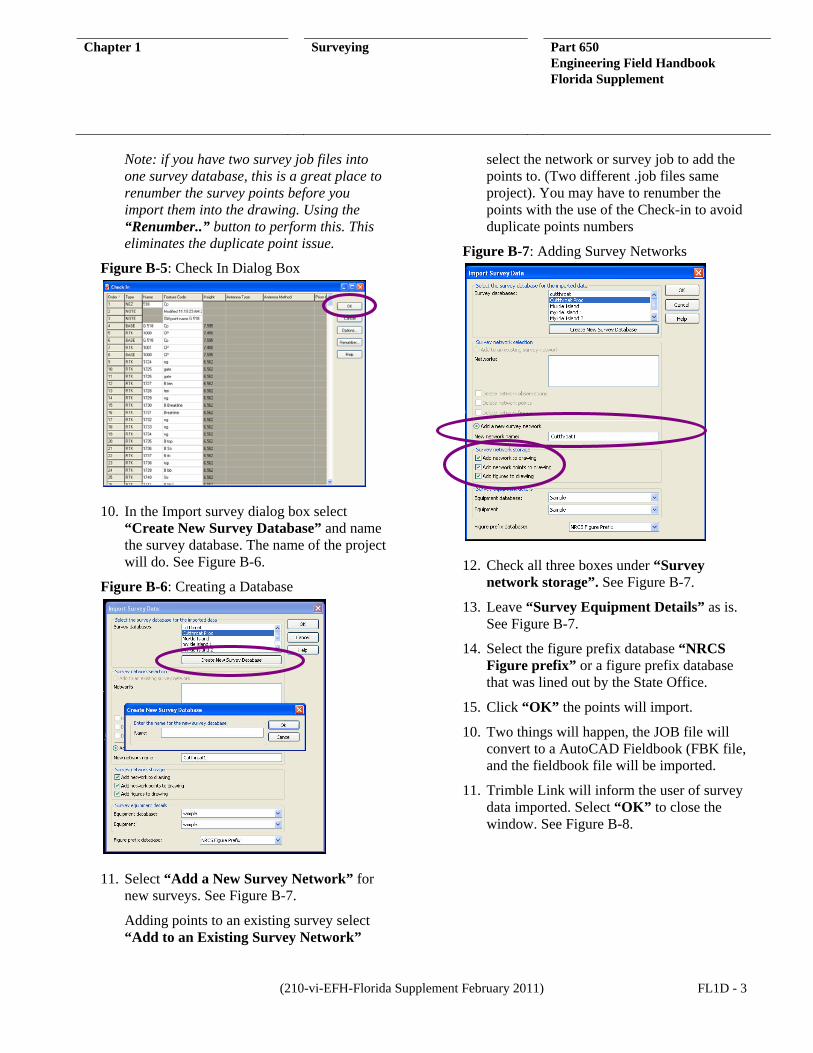
9. This will open a “Check In” dialog box, to view the point number Feature Code, Rod Height, and sometimes Antenna Type and Antenna method. Click “OK” to accept. See Figure B-5.
Chapter 1 Surveying Part 650 Engineering Field Handbook Florida Supplement
(210-vi-EFH-Florida Supplement February 2011) FL1D - 3
Note: if you have two survey job files into one survey database, this is a great place to renumber the survey points before you import them into the drawing. Using the “Renumber..” button to perform this. This eliminates the duplicate point issue.
Figure B-5: Check In Dialog Box
10. In the Import survey dialog box select “Create New Survey Database” and name the survey database. The name of the project will do. See Figure B-6.
Figure B-6: Creating a Database
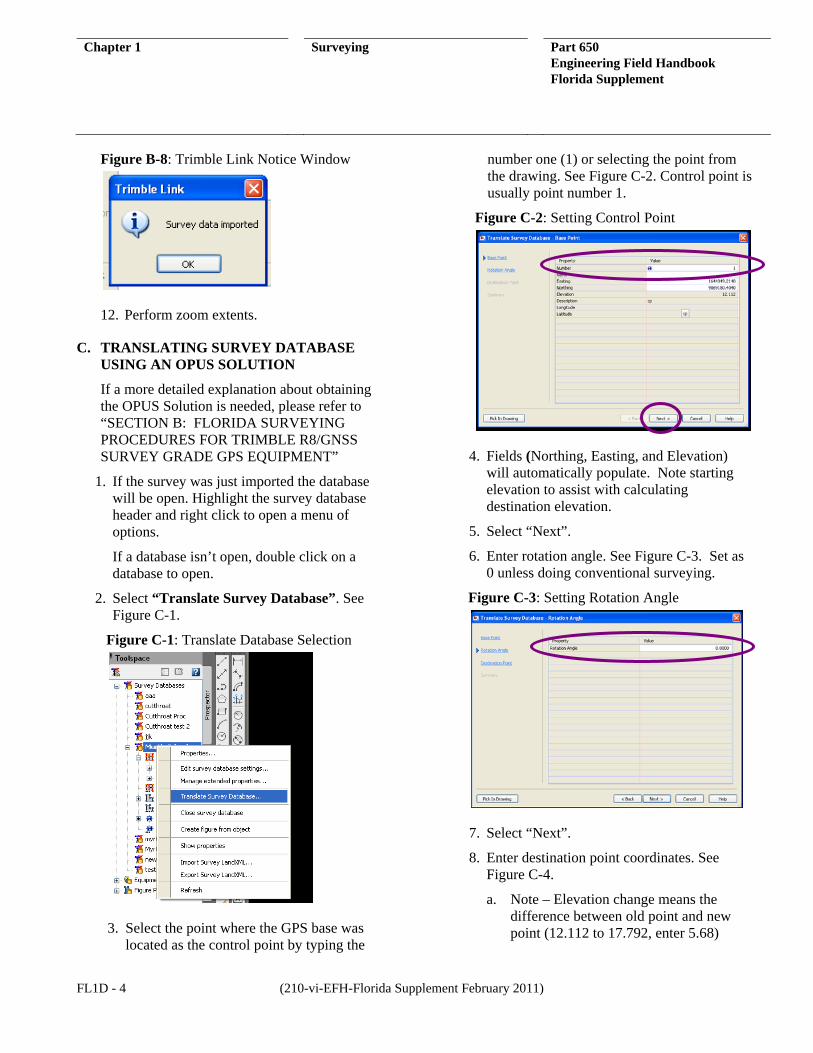
11. Select “Add a New Survey Network” for new surveys. See Figure B-7.
Adding points to an existing survey select “Add to an Existing Survey Network”
select the network or survey job to add the points to. (Two different .job files same project). You may have to renumber the points with the use of the Check-in to avoid duplicate points numbers
Figure B-7: Adding Survey Networks
12. Check all three boxes under “Survey network storage”. See Figure B-7.
13. Leave “Survey Equipment Details” as is. See Figure B-7.
14. Select the figure prefix database “NRCS Figure prefix” or a figure prefix database that was lined out by the State Office.
15. Click “OK” the points will import.
10. Two things will happen, the JOB file will convert to a AutoCAD Fieldbook (FBK file, and the fieldbook file will be imported.
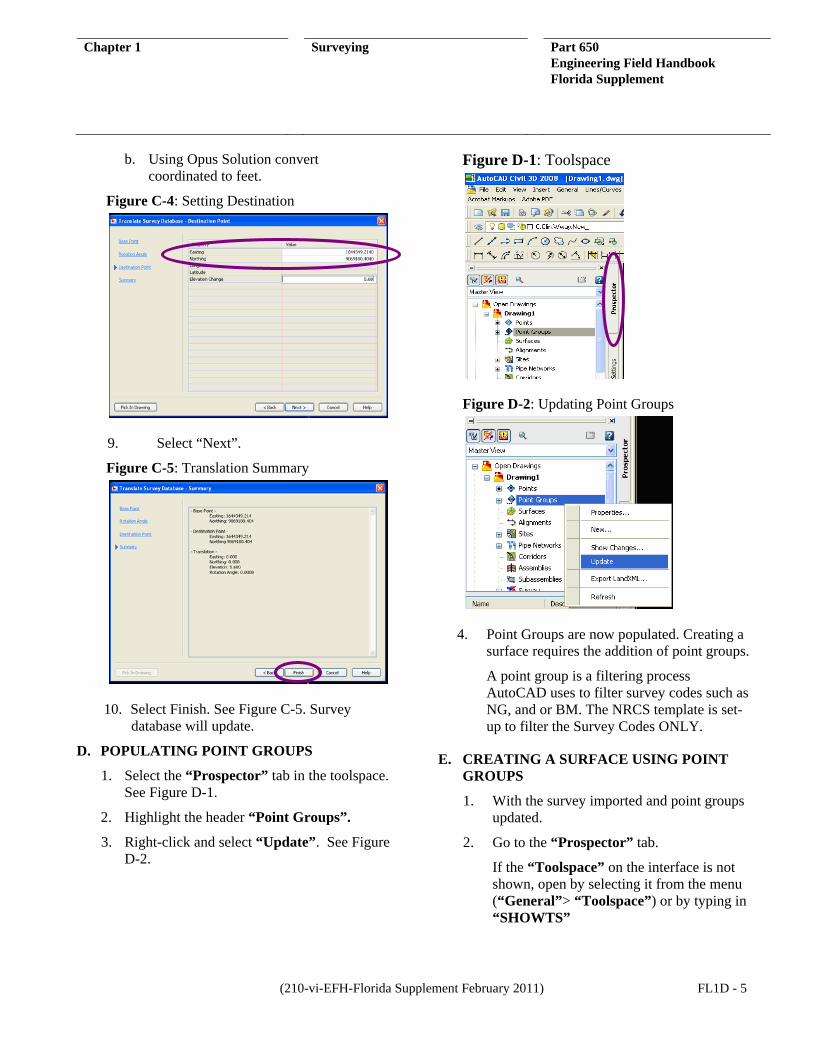
11. Trimble Link will inform the user of survey data imported. Select “OK” to close the window. See Figure B-8.
Chapter 1 Surveying Part 650 Engineering Field Handbook Florida Supplement
FL1D - 4 (210-vi-EFH-Florida Supplement February 2011)
Figure B-8: Trimble Link Notice Window
12. Perform zoom extents.
C. TRANSLATING SURVEY DATABASE USING AN OPUS SOLUTION
If a more detailed explanation about obtaining the OPUS Solution is needed, please refer to “SECTION B: FLORIDA SURVEYING PROCEDURES FOR TRIMBLE R8/GNSS SURVEY GRADE GPS EQUIPMENT”
1. If the survey was just imported the database will be open. Highlight the survey database header and right click to open a menu of options.
If a database isn’t open, double click on a database to open.
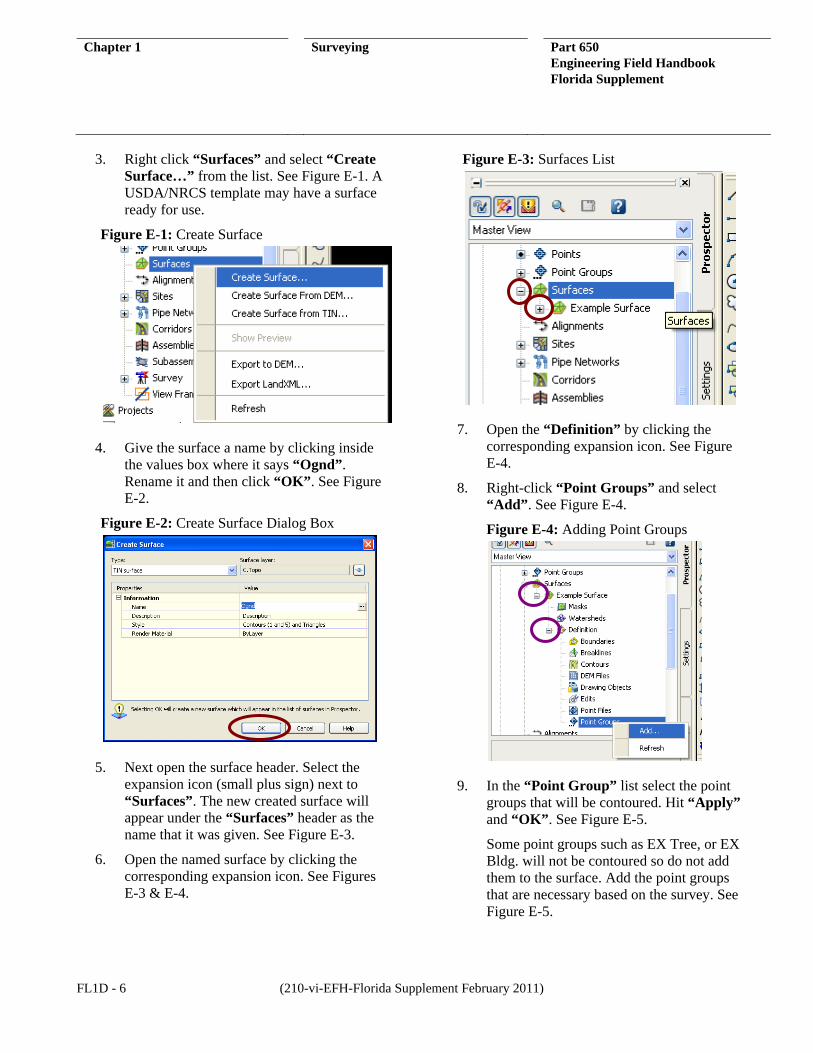
2. Select “Translate Survey Database”. See Figure C-1.
Figure C-1: Translate Database Selection
3. Select the point where the GPS base was located as the control point by typing the
number one (1) or selecting the point from the drawing. See Figure C-2. Control point is usually point number 1.
Figure C-2: Setting Control Point
4. Fields (Northing, Easting, and Elevation) will automatically populate. Note starting elevation to assist with calculating destination elevation.
5. Select “Next”.
6. Enter rotation angle. See Figure C-3. Set as 0 unless doing conventional surveying.
Figure C-3: Setting Rotation Angle
7. Select “Next”.
8. Enter destination point coordinates. See Figure C-4.
a. Note – Elevation change means the difference between old point and new point (12.112 to 17.792, enter 5.68)
Chapter 1 Surveying Part 650 Engineering Field Handbook Florida Supplement
(210-vi-EFH-Florida Supplement February 2011) FL1D - 5
b. Using Opus Solution convert coordinated to feet.
Figure C-4: Setting Destination
9. Select “Next”.
Figure C-5: Translation Summary
10. Select Finish. See Figure C-5. Survey database will update.
D. POPULATING POINT GROUPS
1. Select the “Prospector” tab in the toolspace. See Figure D-1.
2. Highlight the header “Point Groups”.
3. Right-click and select “Update”. See Figure D-2.
Figure D-1: Toolspace
Figure D-2: Updating Point Groups
4. Point Groups are now populated. Creating a surface requires the addition of point groups.
A point group is a filtering process AutoCAD uses to filter survey codes such as NG, and or BM. The NRCS template is set-up to filter the Survey Codes ONLY.
E. CREATING A SURFACE USING POINT GROUPS
1. With the survey imported and point groups updated.
2. Go to the “Prospector” tab.
If the “Toolspace” on the interface is not shown, open by selecting it from the menu (“General”> “Toolspace”) or by typing in “SHOWTS”
Chapter 1 Surveying Part 650 Engineering Field Handbook Florida Supplement
FL1D - 6 (210-vi-EFH-Florida Supplement February 2011)
3. Right click “Surfaces” and select “Create Surface…” from the list. See Figure E-1. A USDA/NRCS template may have a surface ready for use.
Figure E-1: Create Surface
4. Give the surface a name by clicking inside the values box where it says “Ognd”. Rename it and then click “OK”. See Figure E-2.
Figure E-2: Create Surface Dialog Box
5. Next open the surface header. Select the expansion icon (small plus sign) next to “Surfaces”. The new created surface will appear under the “Surfaces” header as the name that it was given. See Figure E-3.
6. Open the named surface by clicking the corresponding expansion icon. See Figures E-3 & E-4.
Figure E-3: Surfaces List
7. Open the “Definition” by clicking the corresponding expansion icon. See Figure E-4.
8. Right-click “Point Groups” and select “Add”. See Figure E-4.
Figure E-4: Adding Point Groups
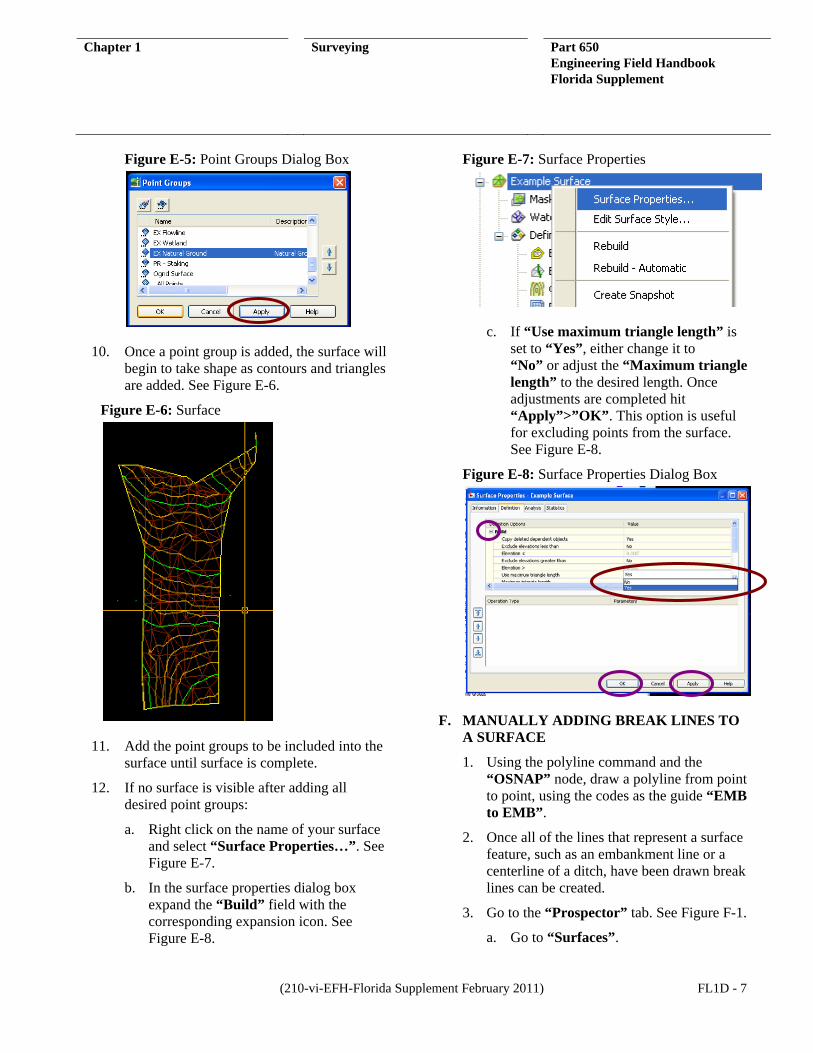
9. In the “Point Group” list select the point groups that will be contoured. Hit “Apply” and “OK”. See Figure E-5.
Some point groups such as EX Tree, or EX Bldg. will not be contoured so do not add them to the surface. Add the point groups that are necessary based on the survey. See Figure E-5.
Chapter 1 Surveying Part 650 Engineering Field Handbook Florida Supplement
(210-vi-EFH-Florida Supplement February 2011) FL1D - 7
Figure E-5: Point Groups Dialog Box
10. Once a point group is added, the surface will begin to take shape as contours and triangles are added. See Figure E-6.
Figure E-6: Surface
11. Add the point groups to be included into the surface until surface is complete.
12. If no surface is visible after adding all desired point groups:
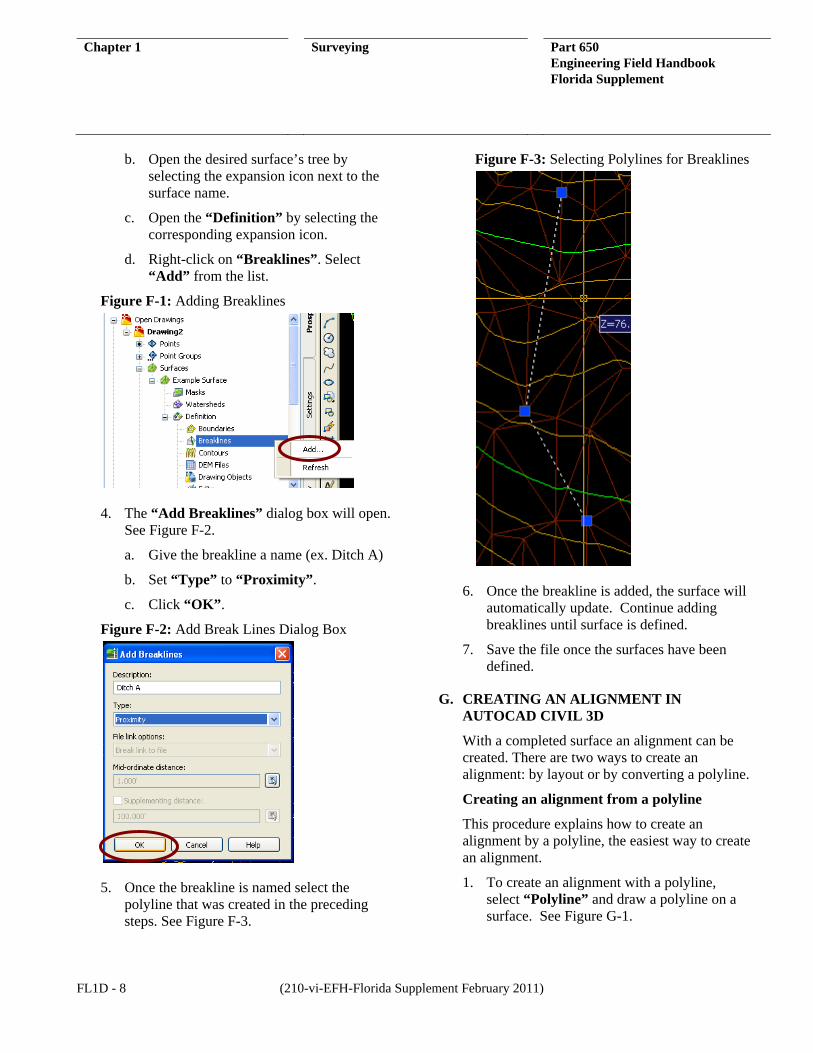
a. Right click on the name of your surface and select “Surface Properties…”. See Figure E-7.
b. In the surface properties dialog box expand the “Build” field with the corresponding expansion icon. See Figure E-8.
Figure E-7: Surface Properties
c. If “Use maximum triangle length” is set to “Yes”, either change it to “No” or adjust the “Maximum triangle length” to the desired length. Once adjustments are completed hit “Apply”>”OK”. This option is useful for excluding points from the surface. See Figure E-8.
Figure E-8: Surface Properties Dialog Box
F. MANUALLY ADDING BREAK LINES TO A SURFACE
1. Using the polyline command and the “OSNAP” node, draw a polyline from point to point, using the codes as the guide “EMB to EMB”.
2. Once all of the lines that represent a surface feature, such as an embankment line or a centerline of a ditch, have been drawn break lines can be created.
3. Go to the “Prospector” tab. See Figure F-1.
a. Go to “Surfaces”.
Chapter 1 Surveying Part 650 Engineering Field Handbook Florida Supplement
FL1D - 8 (210-vi-EFH-Florida Supplement February 2011)
b. Open the desired surface’s tree by selecting the expansion icon next to the surface name.
c. Open the “Definition” by selecting the corresponding expansion icon.
d. Right-click on “Breaklines”. Select “Add” from the list.
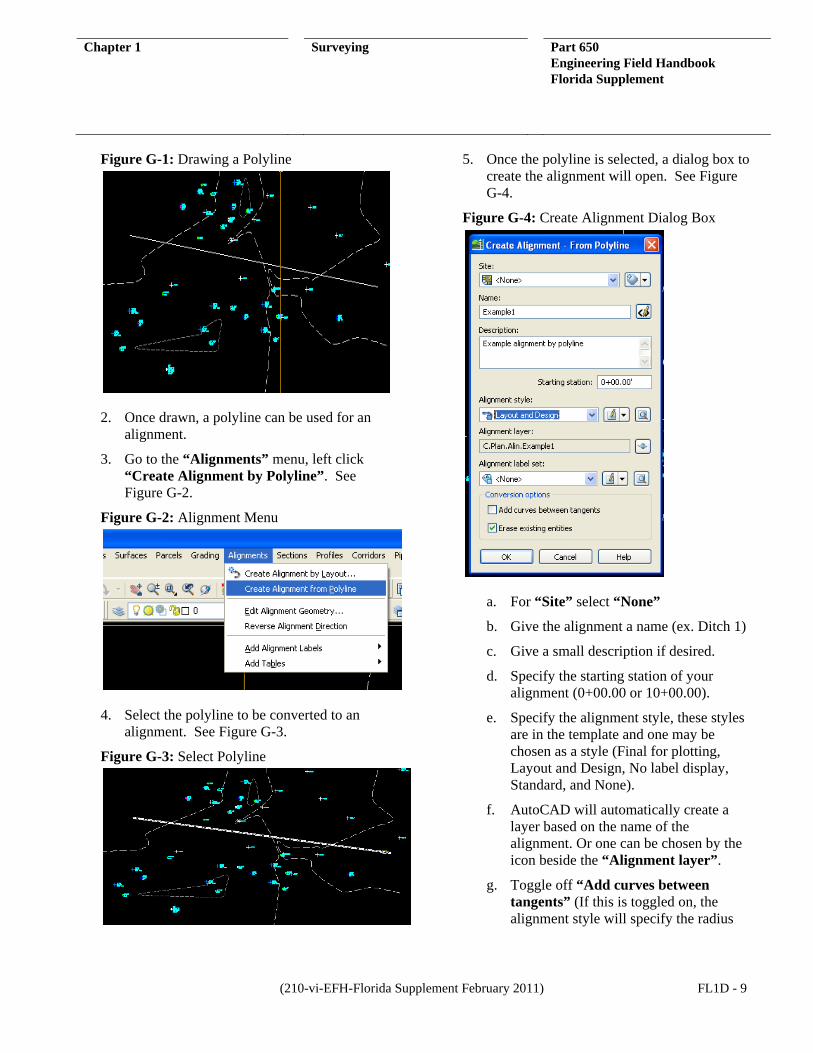
Figure F-1: Adding Breaklines
4. The “Add Breaklines” dialog box will open. See Figure F-2.
a. Give the breakline a name (ex. Ditch A)
b. Set “Type” to “Proximity”.
c. Click “OK”.
Figure F-2: Add Break Lines Dialog Box
5. Once the breakline is named select the polyline that was created in the preceding steps. See Figure F-3.
Figure F-3: Selecting Polylines for Breaklines
6. Once the breakline is added, the surface will automatically update. Continue adding breaklines until surface is defined.
7. Save the file once the surfaces have been defined.
G. CREATING AN ALIGNMENT IN AUTOCAD CIVIL 3D
With a completed surface an alignment can be created. There are two ways to create an alignment: by layout or by converting a polyline.
Creating an alignment from a polyline
This procedure explains how to create an alignment by a polyline, the easiest way to create an alignment.
1. To create an alignment with a polyline, select “Polyline” and draw a polyline on a surface. See Figure G-1.
Chapter 1 Surveying Part 650 Engineering Field Handbook Florida Supplement
(210-vi-EFH-Florida Supplement February 2011) FL1D - 9
Figure G-1: Drawing a Polyline
2. Once drawn, a polyline can be used for an alignment.
3. Go to the “Alignments” menu, left click “Create Alignment by Polyline”. See Figure G-2.
Figure G-2: Alignment Menu
4. Select the polyline to be converted to an alignment. See Figure G-3.
Figure G-3: Select Polyline
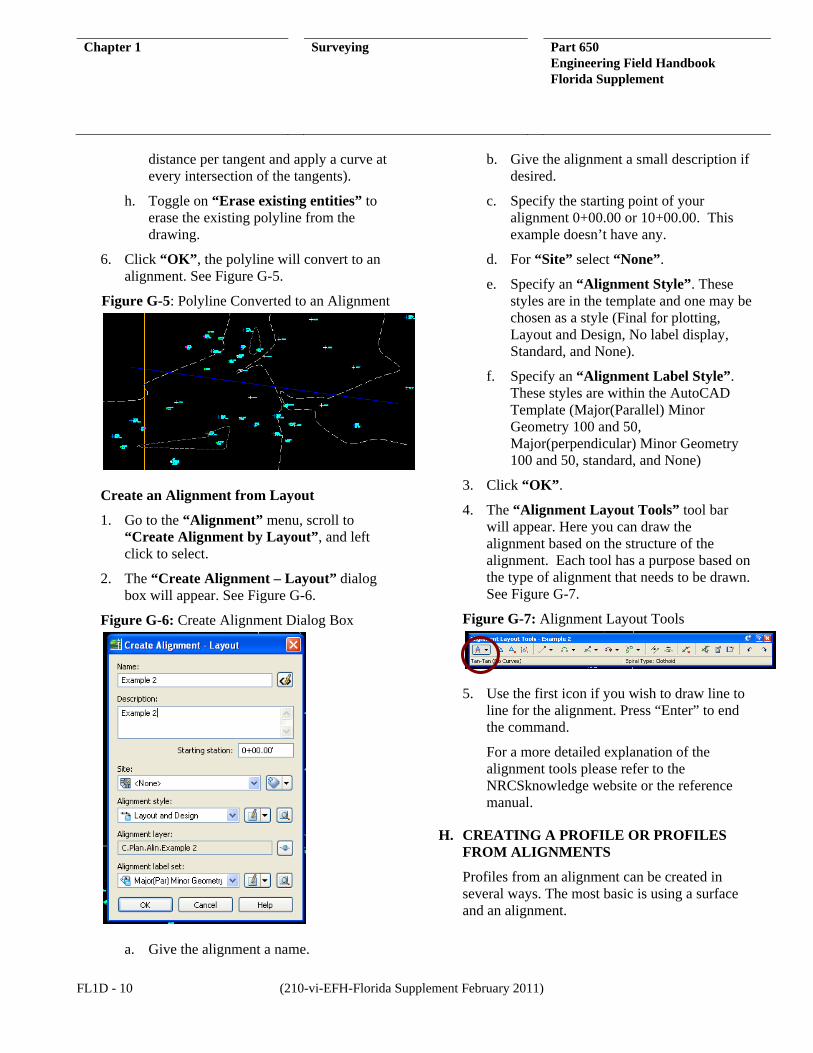
5. Once the polyline is selected, a dialog box to create the alignment will open. See Figure G-4.
Figure G-4: Create Alignment Dialog Box
a. For “Site” select “None”
b. Give the alignment a name (ex. Ditch 1)
c. Give a small description if desired.
d. Specify the starting station of your alignment (0+00.00 or 10+00.00).
e. Specify the alignment style, these styles are in the template and one may be chosen as a style (Final for plotting, Layout and Design, No label display, Standard, and None).
f. AutoCAD will automatically create a layer based on the name of the alignment. Or one can be chosen by the icon beside the “Alignment layer”.
g. Toggle off “Add curves between tangents” (If this is toggled on, the alignment style will specify the radius
Chapter 1 Surveying Part 650 Engineering Field Handbook Florida Supplement
FL1D - 10 (210-vi-EFH-Florida Supplement February 2011)
distance per tangent and apply a curve at every intersection of the tangents).
h. Toggle on “Erase existing entities” to erase the existing polyline from the drawing.
6. Click “OK”, the polyline will convert to an alignment. See Figure G-5.
Figure G-5: Polyline Converted to an Alignment
Create an Alignment from Layout
1. Go to the “Alignment” menu, scroll to “Create Alignment by Layout”, and left click to select.
2. The “Create Alignment – Layout” dialog box will appear. See Figure G-6.
Figure G-6: Create Alignment Dialog Box
a. Give the alignment a name.
b. Give the alignment a small description if desired.
c. Specify the starting point of your alignment 0+00.00 or 10+00.00. This example doesn’t have any.
d. For “Site” select “None”.
e. Specify an “Alignment Style”. These styles are in the template and one may be chosen as a style (Final for plotting, Layout and Design, No label display, Standard, and None).
f. Specify an “Alignment Label Style”. These styles are within the AutoCAD Template (Major(Parallel) Minor Geometry 100 and 50, Major(perpendicular) Minor Geometry 100 and 50, standard, and None)
3. Click “OK”.
4. The “Alignment Layout Tools” tool bar will appear. Here you can draw the alignment based on the structure of the alignment. Each tool has a purpose based on the type of alignment that needs to be drawn. See Figure G-7.
Figure G-7: Alignment Layout Tools
5. Use the first icon if you wish to draw line to line for the alignment. Press “Enter” to end the command.
For a more detailed explanation of the alignment tools please refer to the NRCSknowledge website or the reference manual.
H. CREATING A PROFILE OR PROFILES FROM ALIGNMENTS
Profiles from an alignment can be created in several ways. The most basic is using a surface and an alignment.
Chapter 1 Surveying Part 650 Engineering Field Handbook Florida Supplement
(210-vi-EFH-Florida Supplement February 2011) FL1D - 11
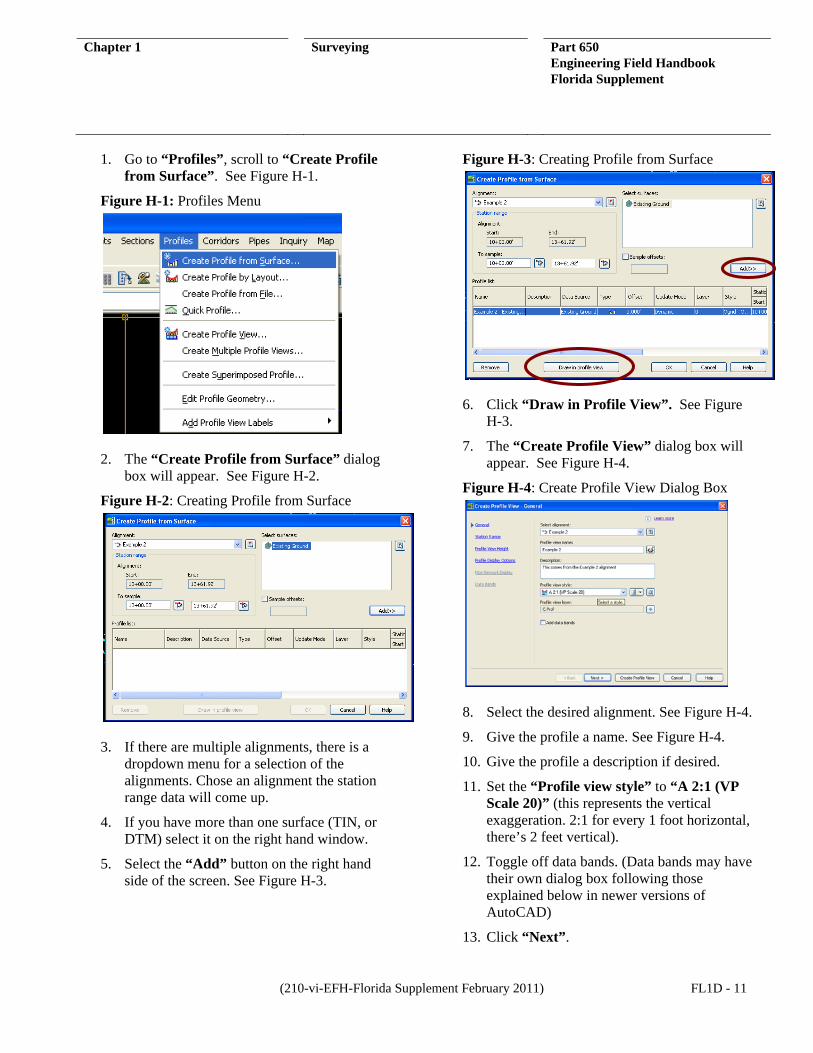
1. Go to “Profiles”, scroll to “Create Profile from Surface”. See Figure H-1.
Figure H-1: Profiles Menu
2. The “Create Profile from Surface” dialog box will appear. See Figure H-2.
Figure H-2: Creating Profile from Surface
3. If there are multiple alignments, there is a dropdown menu for a selection of the alignments. Chose an alignment the station range data will come up.
4. If you have more than one surface (TIN, or DTM) select it on the right hand window.
5. Select the “Add” button on the right hand side of the screen. See Figure H-3.
Figure H-3: Creating Profile from Surface
6. Click “Draw in Profile View”. See Figure H-3.
7. The “Create Profile View” dialog box will appear. See Figure H-4.
Figure H-4: Create Profile View Dialog Box
8. Select the desired alignment. See Figure H-4.
9. Give the profile a name. See Figure H-4.
10. Give the profile a description if desired.
11. Set the “Profile view style” to “A 2:1 (VP Scale 20)” (this represents the vertical exaggeration. 2:1 for every 1 foot horizontal, there’s 2 feet vertical).
12. Toggle off data bands. (Data bands may have their own dialog box following those explained below in newer versions of AutoCAD)
13. Click “Next”.
Chapter 1 Surveying Part 650 Engineering Field Handbook Florida Supplement
FL1D - 12 (210-vi-EFH-Florida Supplement February 2011)
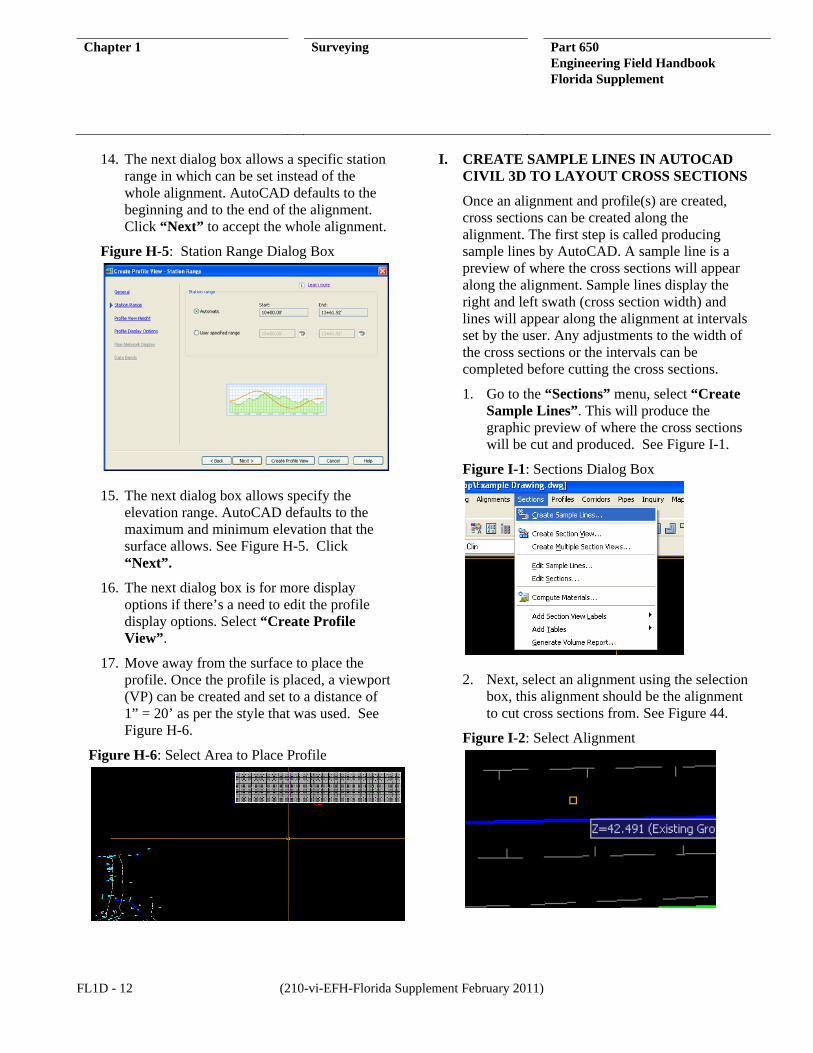
14. The next dialog box allows a specific station range in which can be set instead of the whole alignment. AutoCAD defaults to the beginning and to the end of the alignment. Click “Next” to accept the whole alignment.
Figure H-5: Station Range Dialog Box
15. The next dialog box allows specify the elevation range. AutoCAD defaults to the maximum and minimum elevation that the surface allows. See Figure H-5. Click “Next”.
16. The next dialog box is for more display options if there’s a need to edit the profile display options. Select “Create Profile View”.
17. Move away from the surface to place the profile. Once the profile is placed, a viewport (VP) can be created and set to a distance of 1” = 20’ as per the style that was used. See Figure H-6.
Figure H-6: Select Area to Place Profile
I. CREATE SAMPLE LINES IN AUTOCAD CIVIL 3D TO LAYOUT CROSS SECTIONS
Once an alignment and profile(s) are created, cross sections can be created along the alignment. The first step is called producing sample lines by AutoCAD. A sample line is a preview of where the cross sections will appear along the alignment. Sample lines display the right and left swath (cross section width) and lines will appear along the alignment at intervals set by the user. Any adjustments to the width of the cross sections or the intervals can be completed before cutting the cross sections.
1. Go to the “Sections” menu, select “Create Sample Lines”. This will produce the graphic preview of where the cross sections will be cut and produced. See Figure I-1.
Figure I-1: Sections Dialog Box
2. Next, select an alignment using the selection box, this alignment should be the alignment to cut cross sections from. See Figure 44.
Figure I-2: Select Alignment
Chapter 1 Surveying Part 650 Engineering Field Handbook Florida Supplement
(210-vi-EFH-Florida Supplement February 2011) FL1D - 13
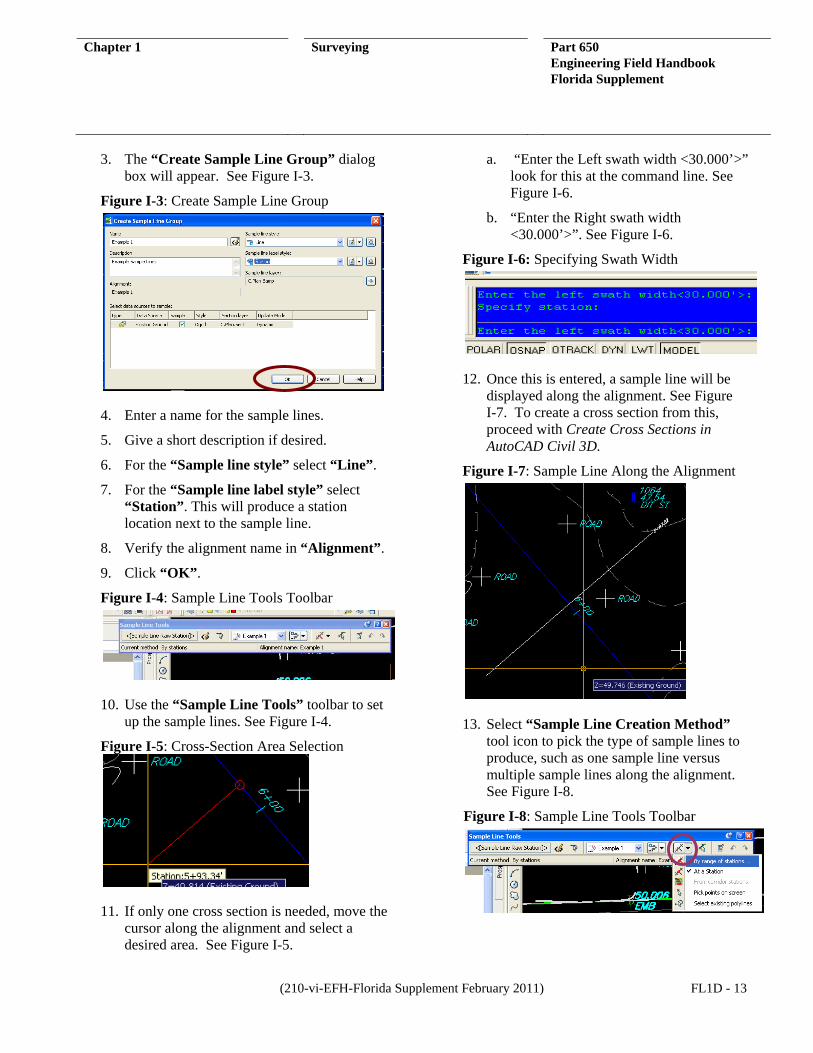
3. The “Create Sample Line Group” dialog box will appear. See Figure I-3.
Figure I-3: Create Sample Line Group
4. Enter a name for the sample lines.
5. Give a short description if desired.
6. For the “Sample line style” select “Line”.
7. For the “Sample line label style” select “Station”. This will produce a station location next to the sample line.
8. Verify the alignment name in “Alignment”.
9. Click “OK”.
Figure I-4: Sample Line Tools Toolbar
10. Use the “Sample Line Tools” toolbar to set up the sample lines. See Figure I-4.
Figure I-5: Cross-Section Area Selection
11. If only one cross section is needed, move the cursor along the alignment and select a desired area. See Figure I-5.
a. “Enter the Left swath width <30.000’>” look for this at the command line. See Figure I-6.
b. “Enter the Right swath width <30.000’>”. See Figure I-6.
Figure I-6: Specifying Swath Width
12. Once this is entered, a sample line will be displayed along the alignment. See Figure I-7. To create a cross section from this, proceed with Create Cross Sections in AutoCAD Civil 3D.
Figure I-7: Sample Line Along the Alignment
13. Select “Sample Line Creation Method” tool icon to pick the type of sample lines to produce, such as one sample line versus multiple sample lines along the alignment. See Figure I-8.
Figure I-8: Sample Line Tools Toolbar
Chapter 1 Surveying Part 650 Engineering Field Handbook Florida Supplement
FL1D - 14 (210-vi-EFH-Florida Supplement February 2011)
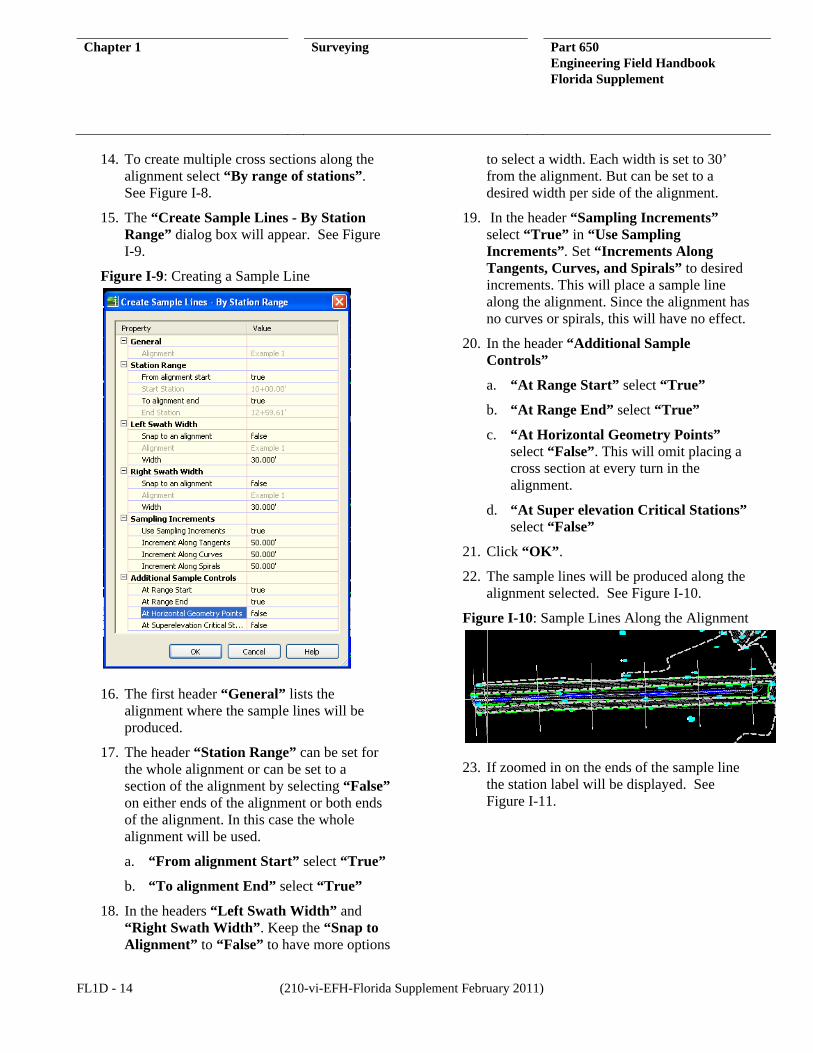
14. To create multiple cross sections along the alignment select “By range of stations”. See Figure I-8.
15. The “Create Sample Lines - By Station Range” dialog box will appear. See Figure I-9.
Figure I-9: Creating a Sample Line
16. The first header “General” lists the alignment where the sample lines will be produced.
17. The header “Station Range” can be set for the whole alignment or can be set to a section of the alignment by selecting “False” on either ends of the alignment or both ends of the alignment. In this case the whole alignment will be used.
a. “From alignment Start” select “True”
b. “To alignment End” select “True”
18. In the headers “Left Swath Width” and “Right Swath Width”. Keep the “Snap to Alignment” to “False” to have more options
to select a width. Each width is set to 30’ from the alignment. But can be set to a desired width per side of the alignment.
19. In the header “Sampling Increments” select “True” in “Use Sampling Increments”. Set “Increments Along Tangents, Curves, and Spirals” to desired increments. This will place a sample line along the alignment. Since the alignment has no curves or spirals, this will have no effect.
20. In the header “Additional Sample Controls”
a. “At Range Start” select “True”
b. “At Range End” select “True”
c. “At Horizontal Geometry Points” select “False”. This will omit placing a cross section at every turn in the alignment.
d. “At Super elevation Critical Stations” select “False”
21. Click “OK”.
22. The sample lines will be produced along the alignment selected. See Figure I-10.
Figure I-10: Sample Lines Along the Alignment
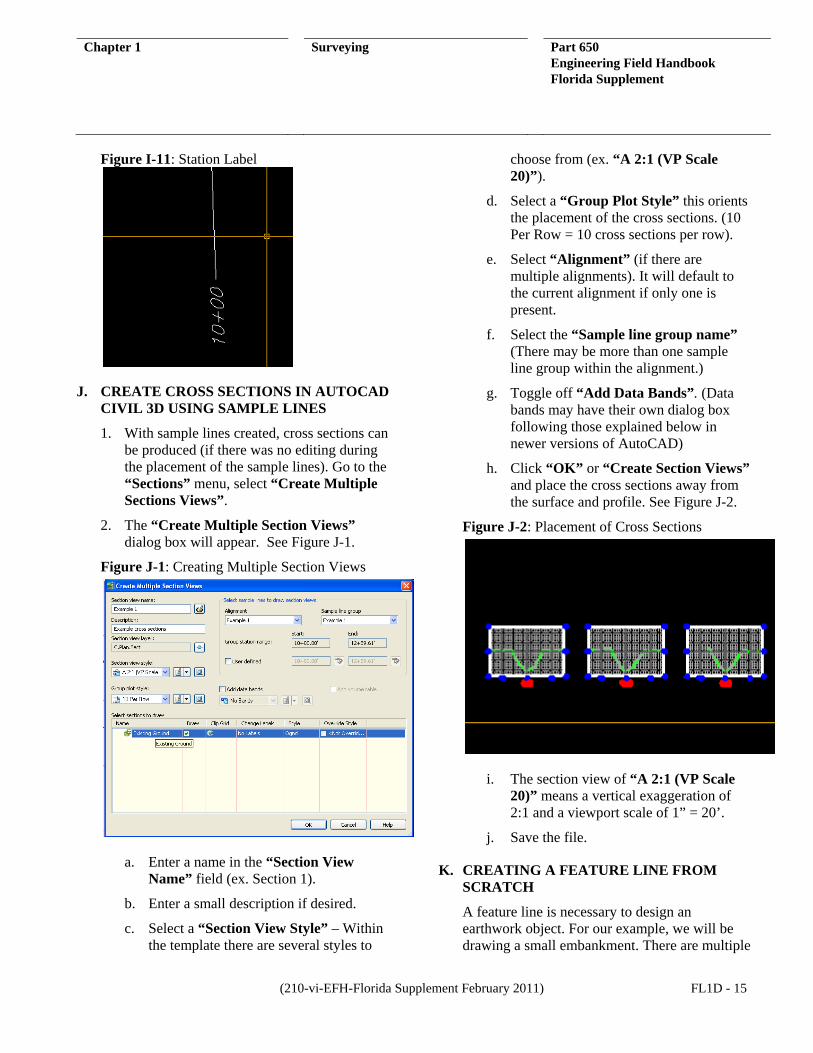
23. If zoomed in on the ends of the sample line the station label will be displayed. See Figure I-11.
Chapter 1 Surveying Part 650 Engineering Field Handbook Florida Supplement
(210-vi-EFH-Florida Supplement February 2011) FL1D - 15
Figure I-11: Station Label
J. CREATE CROSS SECTIONS IN AUTOCAD CIVIL 3D USING SAMPLE LINES
1. With sample lines created, cross sections can be produced (if there was no editing during the placement of the sample lines). Go to the “Sections” menu, select “Create Multiple Sections Views”.
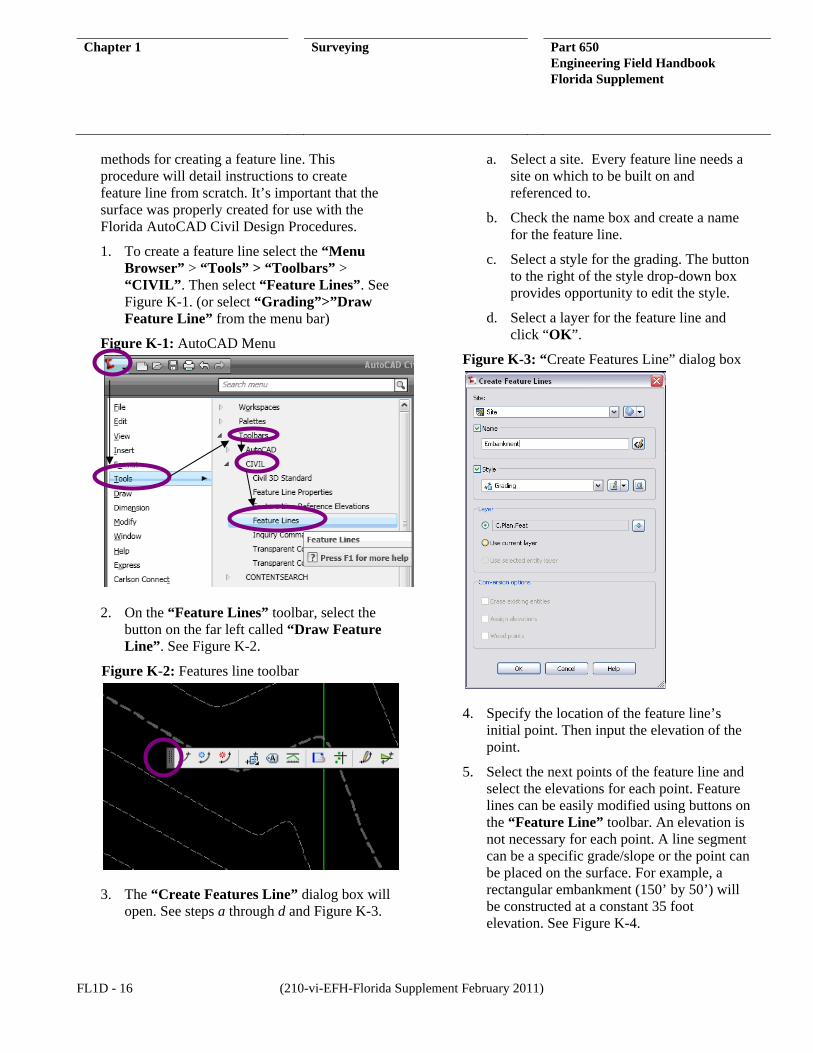
2. The “Create Multiple Section Views” dialog box will appear. See Figure J-1.
Figure J-1: Creating Multiple Section Views
a. Enter a name in the “Section View Name” field (ex. Section 1).
b. Enter a small description if desired.
c. Select a “Section View Style” – Within the template there are several styles to
choose from (ex. “A 2:1 (VP Scale 20)”).
d. Select a “Group Plot Style” this orients the placement of the cross sections. (10 Per Row = 10 cross sections per row).
e. Select “Alignment” (if there are multiple alignments). It will default to the current alignment if only one is present.
f. Select the “Sample line group name” (There may be more than one sample line group within the alignment.)
g. Toggle off “Add Data Bands”. (Data bands may have their own dialog box following those explained below in newer versions of AutoCAD)
h. Click “OK” or “Create Section Views” and place the cross sections away from the surface and profile. See Figure J-2.
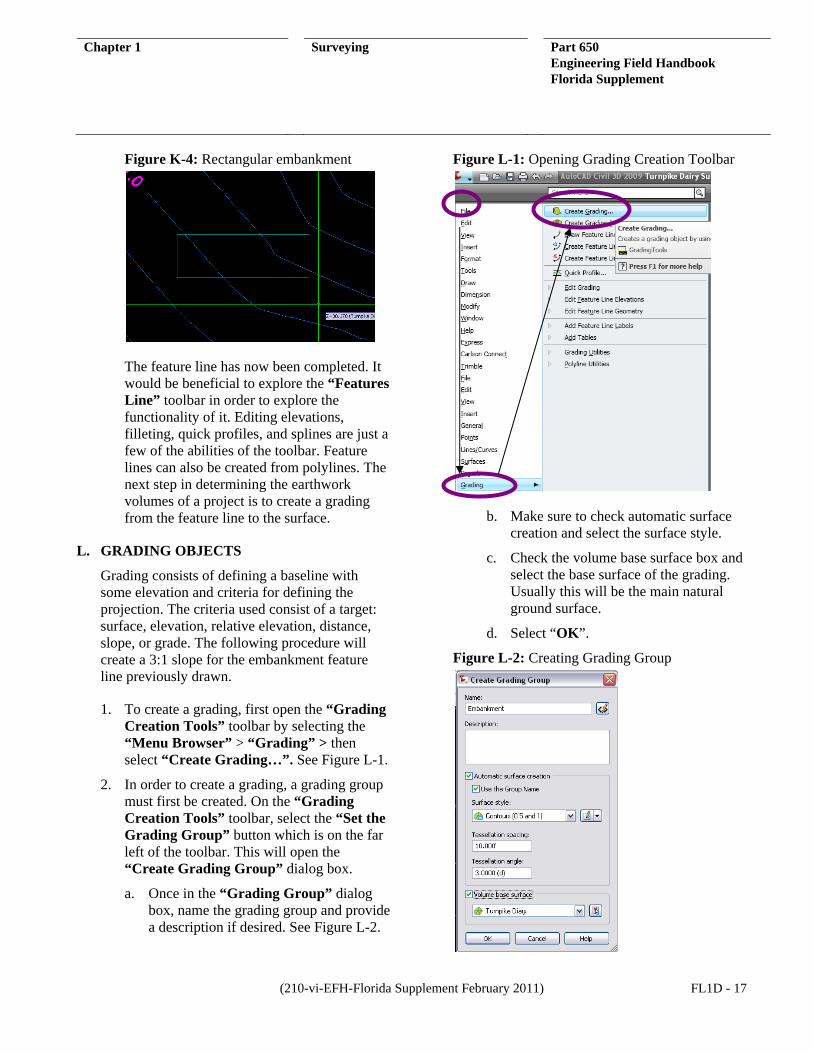
Figure J-2: Placement of Cross Sections
i. The section view of “A 2:1 (VP Scale 20)” means a vertical exaggeration of 2:1 and a viewport scale of 1” = 20’.
j. Save the file.
K. CREATING A FEATURE LINE FROM SCRATCH
A feature line is necessary to design an earthwork object. For our example, we will be drawing a small embankment. There are multiple
Chapter 1 Surveying Part 650 Engineering Field Handbook Florida Supplement
FL1D - 16 (210-vi-EFH-Florida Supplement February 2011)
methods for creating a feature line. This procedure will detail instructions to create feature line from scratch. It’s important that the surface was properly created for use with the Florida AutoCAD Civil Design Procedures.
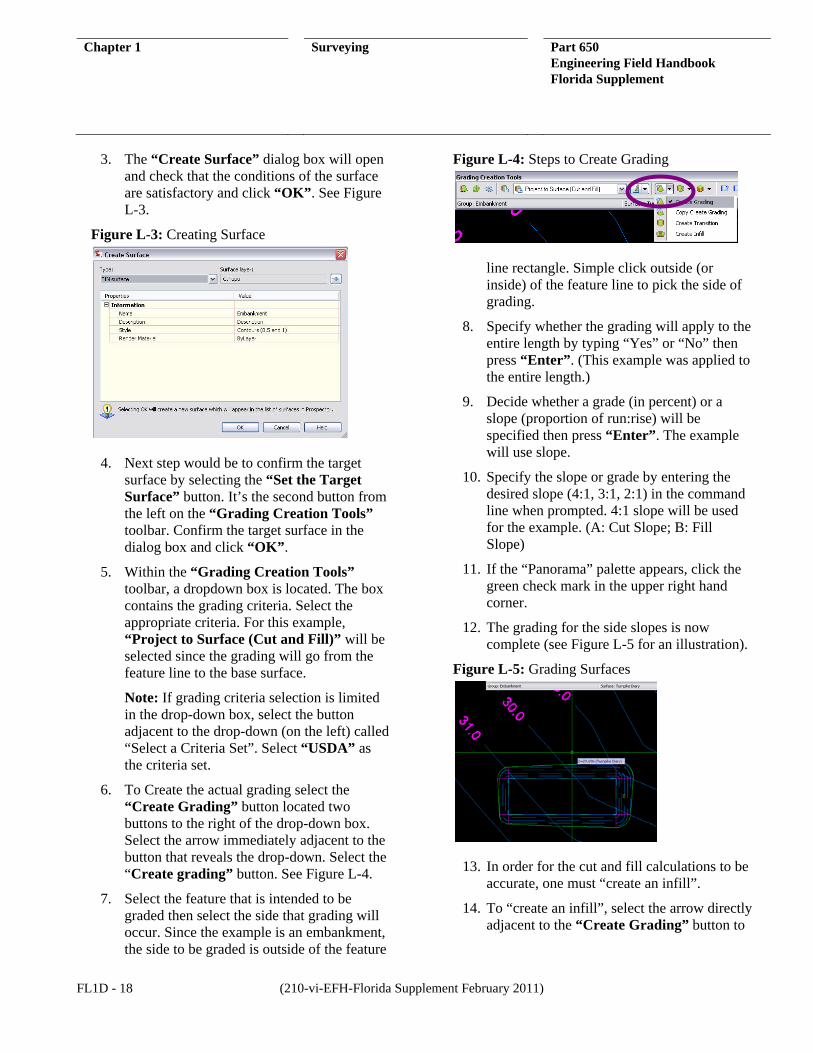
1. To create a feature line select the “Menu Browser” > “Tools” > “Toolbars” > “CIVIL”. Then select “Feature Lines”. See Figure K-1. (or select “Grading”>”Draw Feature Line” from the menu bar)
Figure K-1: AutoCAD Menu
2. On the “Feature Lines” toolbar, select the button on the far left called “Draw Feature Line”. See Figure K-2.
Figure K-2: Features line toolbar
3. The “Create Features Line” dialog box will open. See steps a through d and Figure K-3.
a. Select a site. Every feature line needs a site on which to be built on and referenced to.
b. Check the name box and create a name for the feature line.
c. Select a style for the grading. The button to the right of the style drop-down box provides opportunity to edit the style.
d. Select a layer for the feature line and click “OK”.
Figure K-3: “Create Features Line” dialog box
4. Specify the location of the feature line’s initial point. Then input the elevation of the point.
5. Select the next points of the feature line and select the elevations for each point. Feature lines can be easily modified using buttons on the “Feature Line” toolbar. An elevation is not necessary for each point. A line segment can be a specific grade/slope or the point can be placed on the surface. For example, a rectangular embankment (150’ by 50’) will be constructed at a constant 35 foot elevation. See Figure K-4.
Chapter 1 Surveying Part 650 Engineering Field Handbook Florida Supplement
(210-vi-EFH-Florida Supplement February 2011) FL1D - 17
Figure K-4: Rectangular embankment
The feature line has now been completed. It would be beneficial to explore the “Features Line” toolbar in order to explore the functionality of it. Editing elevations, filleting, quick profiles, and splines are just a few of the abilities of the toolbar. Feature lines can also be created from polylines. The next step in determining the earthwork volumes of a project is to create a grading from the feature line to the surface.
L. GRADING OBJECTS
Grading consists of defining a baseline with some elevation and criteria for defining the projection. The criteria used consist of a target: surface, elevation, relative elevation, distance, slope, or grade. The following procedure will create a 3:1 slope for the embankment feature line previously drawn.
1. To create a grading, first open the “Grading Creation Tools” toolbar by selecting the “Menu Browser” > “Grading” > then select “Create Grading…”. See Figure L-1.
2. In order to create a grading, a grading group must first be created. On the “Grading Creation Tools” toolbar, select the “Set the Grading Group” button which is on the far left of the toolbar. This will open the “Create Grading Group” dialog box.
a. Once in the “Grading Group” dialog box, name the grading group and provide a description if desired. See Figure L-2.
Figure L-1: Opening Grading Creation Toolbar
b. Make sure to check automatic surface creation and select the surface style.
c. Check the volume base surface box and select the base surface of the grading. Usually this will be the main natural ground surface.
d. Select “OK”.
Figure L-2: Creating Grading Group
Chapter 1 Surveying Part 650 Engineering Field Handbook Florida Supplement
FL1D - 18 (210-vi-EFH-Florida Supplement February 2011)
3. The “Create Surface” dialog box will open and check that the conditions of the surface are satisfactory and click “OK”. See Figure L-3.
Figure L-3: Creating Surface
4. Next step would be to confirm the target surface by selecting the “Set the Target Surface” button. It’s the second button from the left on the “Grading Creation Tools” toolbar. Confirm the target surface in the dialog box and click “OK”.
5. Within the “Grading Creation Tools” toolbar, a dropdown box is located. The box contains the grading criteria. Select the appropriate criteria. For this example, “Project to Surface (Cut and Fill)” will be selected since the grading will go from the feature line to the base surface.
Note: If grading criteria selection is limited in the drop-down box, select the button adjacent to the drop-down (on the left) called “Select a Criteria Set”. Select “USDA” as the criteria set.
6. To Create the actual grading select the “Create Grading” button located two buttons to the right of the drop-down box. Select the arrow immediately adjacent to the button that reveals the drop-down. Select the “Create grading” button. See Figure L-4.
7. Select the feature that is intended to be graded then select the side that grading will occur. Since the example is an embankment, the side to be graded is outside of the feature
Figure L-4: Steps to Create Grading
line rectangle. Simple click outside (or inside) of the feature line to pick the side of grading.
8. Specify whether the grading will apply to the entire length by typing “Yes” or “No” then press “Enter”. (This example was applied to the entire length.)
9. Decide whether a grade (in percent) or a slope (proportion of run:rise) will be specified then press “Enter”. The example will use slope.
10. Specify the slope or grade by entering the desired slope (4:1, 3:1, 2:1) in the command line when prompted. 4:1 slope will be used for the example. (A: Cut Slope; B: Fill Slope)
11. If the “Panorama” palette appears, click the green check mark in the upper right hand corner.
12. The grading for the side slopes is now complete (see Figure L-5 for an illustration).
Figure L-5: Grading Surfaces
13. In order for the cut and fill calculations to be accurate, one must “create an infill”.
14. To “create an infill”, select the arrow directly adjacent to the “Create Grading” button to
Chapter 1 Surveying Part 650 Engineering Field Handbook Florida Supplement
(210-vi-EFH-Florida Supplement February 2011) FL1D - 19
reveal the drop down box. See Figure L-4. Select “Create Infill”.
15. Select the area within the feature line in order to infill the volume between the base surface and the embankment surface. Press “Enter”.
Now that the feature line, grading, and infill steps have been done, the model of the desired embankment has been complete. Rotating the drawing into an isometric view displays the embankment in three dimensions. See Figure L-5.
Figure L-5: 3D View of Embankment
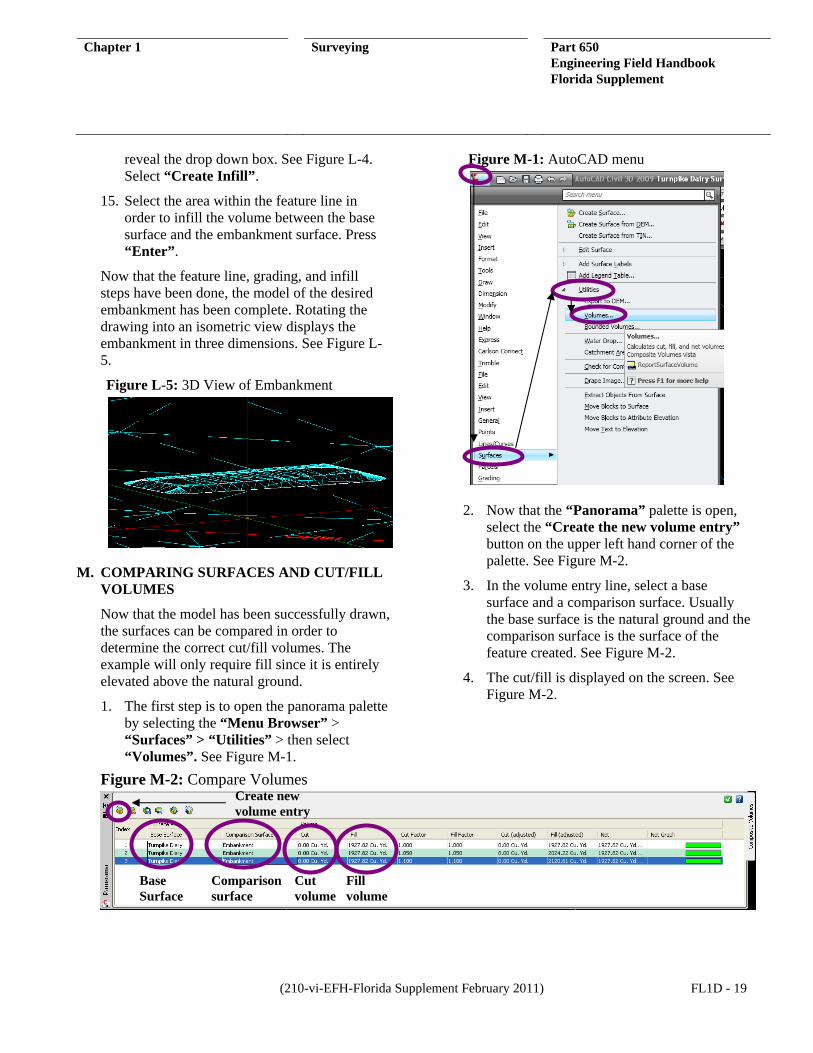
M. COMPARING SURFACES AND CUT/FILL VOLUMES
Now that the model has been successfully drawn, the surfaces can be compared in order to determine the correct cut/fill volumes. The example will only require fill since it is entirely elevated above the natural ground.
1. The first step is to open the panorama palette by selecting the “Menu Browser” > “Surfaces” > “Utilities” > then select “Volumes”. See Figure M-1.
Figure M-1: AutoCAD menu
2. Now that the “Panorama” palette is open, select the “Create the new volume entry” button on the upper left hand corner of the palette. See Figure M-2.
3. In the volume entry line, select a base surface and a comparison surface. Usually the base surface is the natural ground and the comparison surface is the surface of the feature created. See Figure M-2.
4. The cut/fill is displayed on the screen. See Figure M-2.
Figure M-2: Compare VolumesCreate new volume entry
Base Surface
Comparison surface
Cut volume
Fill volume

Chapter 1 Surveying Part 650 Engineering Field Handbook Florida Supplement
FL1D - 20 (210-vi-EFH-Florida Supplement February 2011)
THIS PAGE INTENTIONALLY LEFT BLANK