Embed Size (px)
Citation preview

1
CHAPTER 1
Quantitative analysis for the BMAT and the UKCAT
Part A: First glance
Problem solving is an essential and common skill. In everyday life, it is a process that makes us stop and think because it is a skill that usually involves deriving new knowledge or information from what we already know or have. In the context of the BMAT and UKCAT we are provided with novel problems and scenarios (usually involving quantitative data) where prior knowledge alone is insuffi cient. It is the analysis required to be able to derive a solution from the quantitative data that this chapter aims to cover.
There are various steps involved in solving problems of this kind. Firstly you must pick out the relevant information from all the information you have been provided, then you must think and decide how to go about using this data to achieve the solution; fi nally you then go ahead and manipu-late the data, drawing on basic understanding and experience of how the world works, leading to your solution.
Data → Extract relevant data → Determine optimum strategy for achieving solution → Manipulate data appropriately (apply basic skills/functions) → Solution.
Different types of problems give emphasis to different parts of this proc-ess. Some problems will require you to decide on the most relevant data in a situation and not much else while others will test the whole range of sub-skills.
Part of this process of problem solving is usually done automatically and is arguably best left that way. What you can do to improve speed and accuracy is consider the tools commonly used in solving problems; the kind of infor-mation you will be given and the basic skills and functions you have availa-ble in order to manipulate the available data. In this vein, this chapter looks at the various functions that underpin problem solving. These functions are the basic abilities everyone is presumed to have in order to be able to solve problems. Some are very basic indeed and are covered very early in formal education but it is exactly this fact – that they are basic – that seems to be the undoing of many candidates. Getting a fi rm grasp of these skills/processes
2 Chapter 1
helps you understand problems better and therefore allows you select the best strategy for solving them – a process you no doubt already carry out automatically.
The following example shows the different stages of problem solving:
The problem contains given data as well as what end-product is required. The given data must then be understood so that the relevant data can beextracted.
Hand in hand with this goes the executive strategy – Deciding what broadapproach to take with the question.
The actual manipulation of the data whichcan be simple or difficult.
The solution
Problem Strategy Manipulation Solution
What is the combinedmonthly income of Jackand Jill?
INFORMATION
Income(£/week)
52
Jack 5John 6Jill 8Jimmy 12
(5 � 8) � 4
Findcombinedweekly incomeand multiplyby number ofweeks in amonth
Part B: The approach
NumeracyNumber is a way of quantifying or measuring how big or how much some-thing is. Numbers can best be thought of as being on a continuous line or “continuum” starting at zero. Numeracy involves manipulating numbers by means of numerical functions.
Infinity0
Basic function areas
Simple functions“Simple” functions are one of the following four basic numerical functions:
● Addition● Subtraction
Quantitative analysis for the BMAT and the UKCAT 3
● Multiplication● Division.
Obviously you will be very familiar with these functions and how to use them. Everyone knows how to add, subtract, divide and multiply but what do these functions actually mean? Let us take a brief look at them.
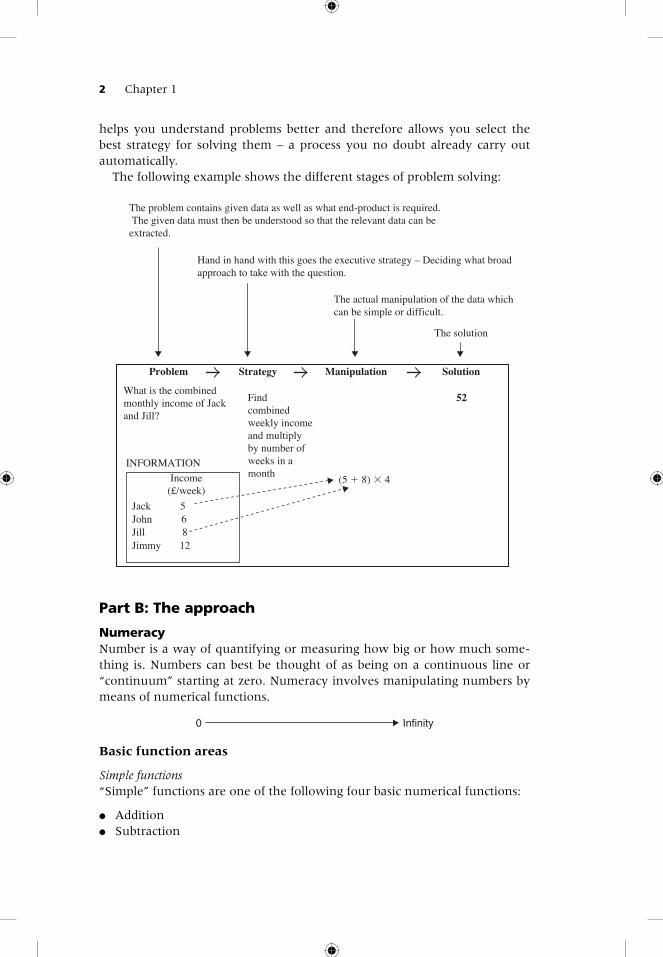
Consider the number line above. Think about these functions in the context of changes on a number line. Addition is moving forward along the number line. Subtraction is moving backward/down along it; alternatively it can be thought of as the “gap” between two numbers on the line, and this is often an easier approach when more diffi cult subtractions are involved.
Take for example the sum 935 � 537.
0937935537
400
When thinking about the difference between numbers it is often easier to ask yourself: “what is the gap between them?” or “what do I need to add to the lower number to reach the higher number?” In this particular example, it is immediately obvious that adding 400 to 537 gives 937. The target of 935 is only 2 less than this; therefore 400 � 2 (398) gives the answer.
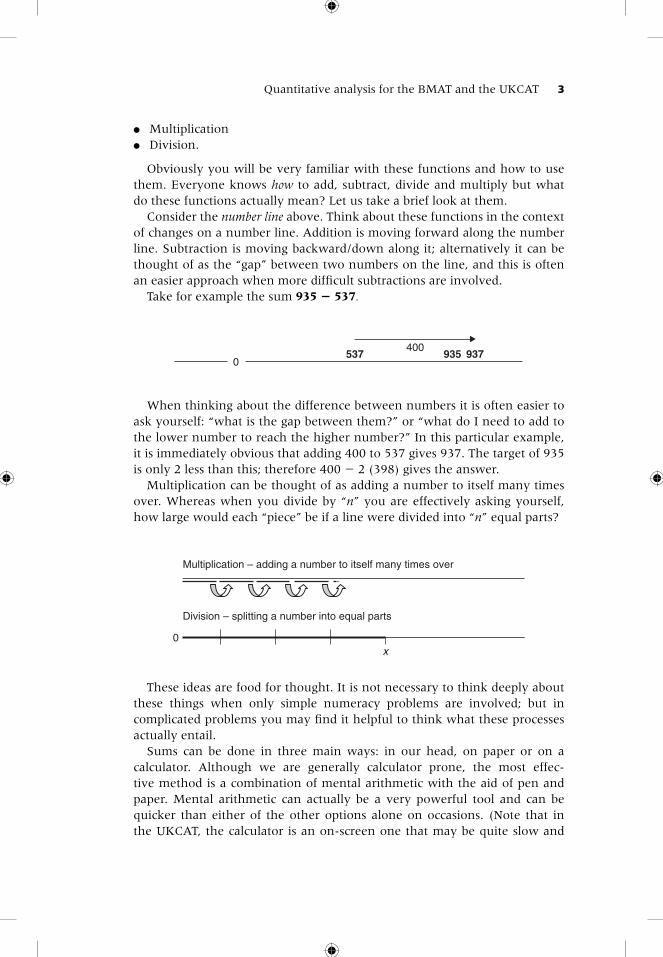
Multiplication can be thought of as adding a number to itself many times over. Whereas when you divide by “n” you are effectively asking yourself, how large would each “piece” be if a line were divided into “n” equal parts?
0x
Multiplication – adding a number to itself many times over
Division – splitting a number into equal parts
These ideas are food for thought. It is not necessary to think deeply about these things when only simple numeracy problems are involved; but in complicated problems you may fi nd it helpful to think what these processes actually entail.
Sums can be done in three main ways: in our head, on paper or on a calculator. Although we are generally calculator prone, the most effec-tive method is a combination of mental arithmetic with the aid of pen and paper. Mental arithmetic can actually be a very powerful tool and can be quicker than either of the other options alone on occasions. (Note that in the UKCAT, the calculator is an on-screen one that may be quite slow and
4 Chapter 1
frustrating to use and that in the BMAT you will not be allowed to use a cal-culator at all!)
Have a look at the following example:
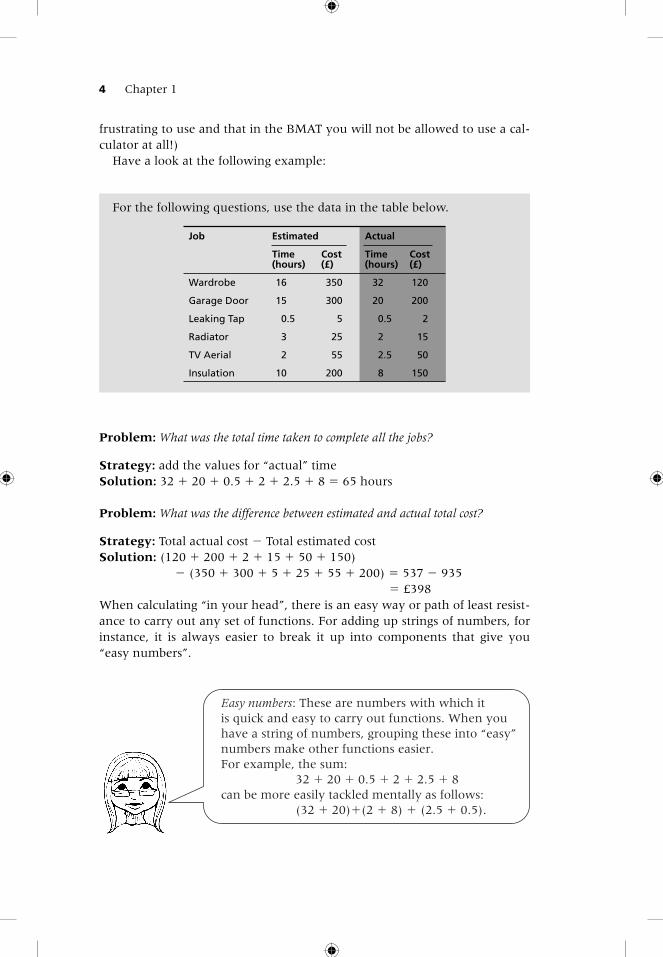
For the following questions, use the data in the table below.
Job Estimated Actual
Time Cost Time Cost(hours) (£) (hours) (£)
Wardrobe 16 350 32 120
Garage Door 15 300 20 200
Leaking Tap 0.5 5 0.5 2
Radiator 3 25 2 15
TV Aerial 2 55 2.5 50
Insulation 10 200 8 150
Problem: What was the total time taken to complete all the jobs?
Strategy: add the values for “actual” timeSolution: 32 � 20 � 0.5 � 2 � 2.5 � 8 � 65 hours
Problem: What was the difference between estimated and actual total cost?
Strategy: Total actual cost � Total estimated costSolution: (120 � 200 � 2 � 15 � 50 � 150) � (350 � 300 � 5 � 25 � 55 � 200) � 537 � 935 � £398When calculating “in your head”, there is an easy way or path of least resist-ance to carry out any set of functions. For adding up strings of numbers, for instance, it is always easier to break it up into components that give you “easy numbers”.
Easy numbers: These are numbers with which itis quick and easy to carry out functions. When youhave a string of numbers, grouping these into “easy”numbers make other functions easier.For example, the sum: 32 � 20 � 0.5 � 2 � 2.5 � 8can be more easily tackled mentally as follows: (32 � 20)�(2 � 8) � (2.5 � 0.5).
Quantitative analysis for the BMAT and the UKCAT 5
Problem: What is the hourly cost of fi xing the TV aerial?
Strategy: Divide total cost by hours workedSolution: 50/2.5 � £20/hour
Problem: How much time would it take to fi x 6 wardrobes (using “Estimated” fi gures)?
Strategy: Multiply estimated time per wardrobe by 6.Solution: 6 � 16 � (6 � 10) � (6 � 6) � 60 � 36 � 96
You are provided with number drills at various points in this chapter. Make sure to time yourself and feel free to review them as many times as you wish, noting how your speed changes.
Quick test 1
Number drill(Calculator not allowed!)
1 (30 � 60 � 180)/1000 2 (5 � 4 � 3 � 2 � 1) � 4 3 33 � 16 � 12 � 89 � 145 4 1036 � (12 � 48 � 156) 5 589 � 42 6 349,239/16,899 (nearest whole number) 7 500/36 (nearest whole number) 8 36/5 (nearest decimal place) 9 2/200 � 2/50 (nearest decimal place)10 1/(0.75 � 0.8) (as a whole number fraction)
Percentages/Ratios/FractionsPercentages, ratios and fractions all do the same thing: they compare one number with another.
The following illustration demonstrates this:
3 2The absolute value of ‘A’ is 3As a fraction of the total A = 3/5As a percentage of the total A = 60% (60/100)The ratio of A:B is 3:2
BA
Another way to think about a fraction or percentage is as a part of a whole, with the “part” expressed by the numerator and the “whole” expressed by the denominator. As long as the fraction remains the same, the relationship between them must always be constant therefore any change to one must be refl ected in the other. (A the denominator or “whole” is always 100.)
6 Chapter 1
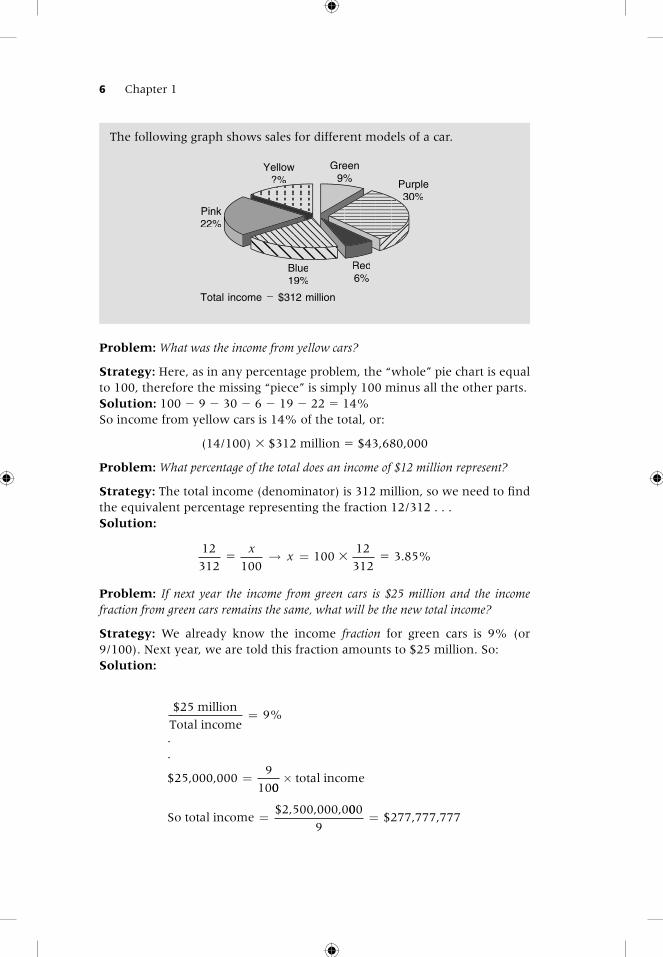
Problem: What was the income from yellow cars?
Strategy: Here, as in any percentage problem, the “whole” pie chart is equal to 100, therefore the missing “piece” is simply 100 minus all the other parts.Solution: 100 � 9 � 30 � 6 � 19 � 22 � 14%So income from yellow cars is 14% of the total, or:
(14/100) � $312 million � $43,680,000
Problem: What percentage of the total does an income of $12 million represent?
Strategy: The total income (denominator) is 312 million, so we need to fi nd the equivalent percentage representing the fraction 12/312 . . .Solution:
12
312 100100
12
3123.85%� � �
xx→ =
Problem: If next year the income from green cars is $25 million and the income fraction from green cars remains the same, what will be the new total income?
Strategy: We already know the income fraction for green cars is 9% (or 9/100). Next year, we are told this fraction amounts to $25 million. So:Solution:
The following graph shows sales for different models of a car.
Blue19%
Pink22%
Green9% Purple
30%
Red6%
Total income � $312 million
Yellow?%
$25 million
Total income9%
.
.
$25,000,0009
10
=
=00
total income
So total income$2,500,000,0
×
=000
9$277,777,777=
Quantitative analysis for the BMAT and the UKCAT 7
Problem: What is the ratio of the number of Red: Green: Purple cars sold?
Strategy: Whereas the fraction compares one part to the whole, the ratio compares one part to another part.
The question asks us about the actual number sold – the number sold would be the total sales from each type of car divided by the cost per car. In this case, although the ratio of sales of red: green: purple would be 6:9:30 (or 2:3:10), the ratio of the number of cars would be:
6
Price of red car
9
Price of green car
30
Price of purple car: :
Since we don’t know the price of each type of car, we cannot go any further.
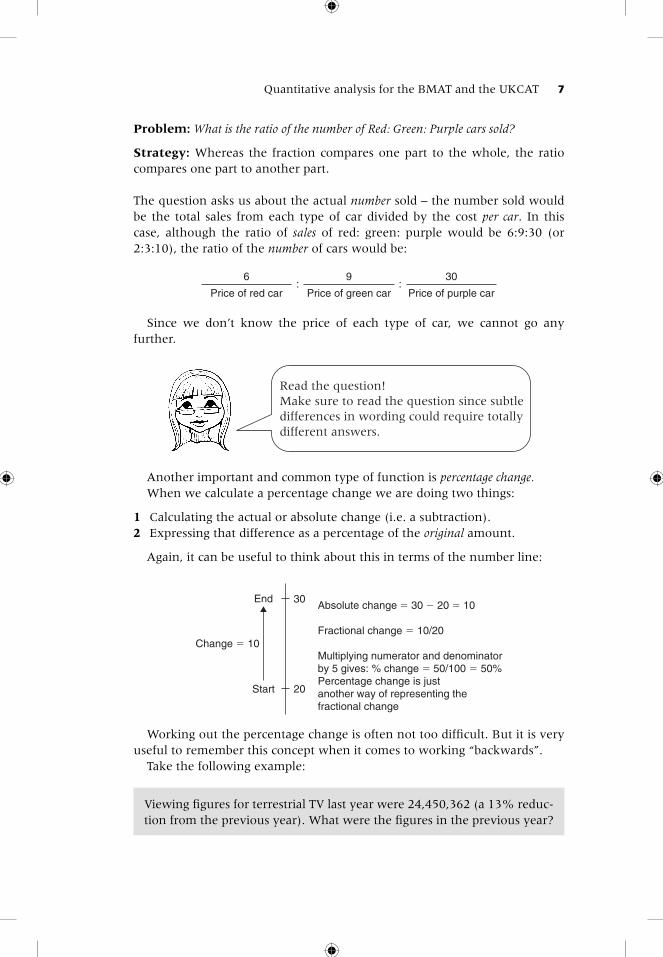
Read the question!Make sure to read the question since subtledifferences in wording could require totallydifferent answers.
Another important and common type of function is percentage change.When we calculate a percentage change we are doing two things:
1 Calculating the actual or absolute change (i.e. a subtraction).2 Expressing that difference as a percentage of the original amount.
Again, it can be useful to think about this in terms of the number line:
20
30
Start
End
Change � 10
Absolute change � 30 � 20 � 10
Fractional change � 10/20
Multiplying numerator and denominatorby 5 gives: % change � 50/100 � 50%Percentage change is justanother way of representing thefractional change
Working out the percentage change is often not too diffi cult. But it is very useful to remember this concept when it comes to working “backwards”.
Take the following example:
Viewing fi gures for terrestrial TV last year were 24,450,362 (a 13% reduc-tion from the previous year). What were the fi gures in the previous year?
8 Chapter 1
Quick test 2
For the following questions, use the data in the table below:
Sales (000s £)
1994 400
1995 385
1996 ?
1997 542
1998 650
1 What is the percentage change in sales from 1994 to 1995?2 If sales were projected to increase by 2% from 1994 to 1995, what is the
shortfall in sales in 1995, compared with projected fi gures?3 Bob calculates that the fi gures for 1998 are 20% higher than the previous
year. Is Bob correct?
Percentage change
Always make sure you are certain about the “start” and “end”points of any percentage change.Understand that fractions and percentages do not exist ontheir own; they always refer to something – a baseline valueor Start point. A percentage change occurs when you take afraction of a certain baseline value and add it to or remove itfrom that same value.120 is 20% greater than 100 but 96 (not 100) is 20%smaller than 120. The first 20% is as a fraction of 100 butthe second 20% is as a fraction of 120.
•
•
•
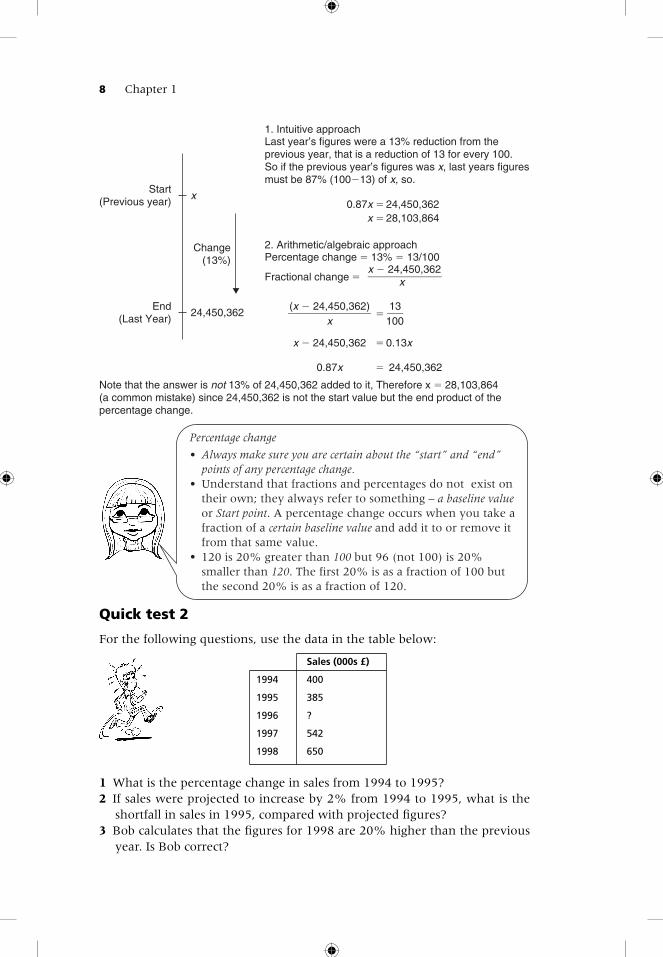
x
24,450,362End
(Last Year)
Start(Previous year)
Change(13%)
1. Intuitive approachLast year’s figures were a 13% reduction from theprevious year, that is a reduction of 13 for every 100.So if the previous year’s figures was x, last years figuresmust be 87% (100�13) of x, so.
0.87x � 24,450,362x � 28,103,864
2. Arithmetic/algebraic approachPercentage change � 13% � 13/100
Fractional change �x � 24,450,362
x
(x � 24,450,362)�
13x 100
x � 24,450,362 � 0.13x
0.87x � 24,450,362
Note that the answer is not 13% of 24,450,362 added to it, Therefore x � 28,103,864(a common mistake) since 24,450,362 is not the start value but the end product of thepercentage change.
Quantitative analysis for the BMAT and the UKCAT 9
4 The fi gure for 1997 represents a 12.5% increase from the previous year. Fill in the fi gure for 1996.
5 The percentage change in sales is projected to be 10% higher from last year to this year than between 1996 and 1997. If sales were £1,320,000 last year, what is the value of predicted sales this year?
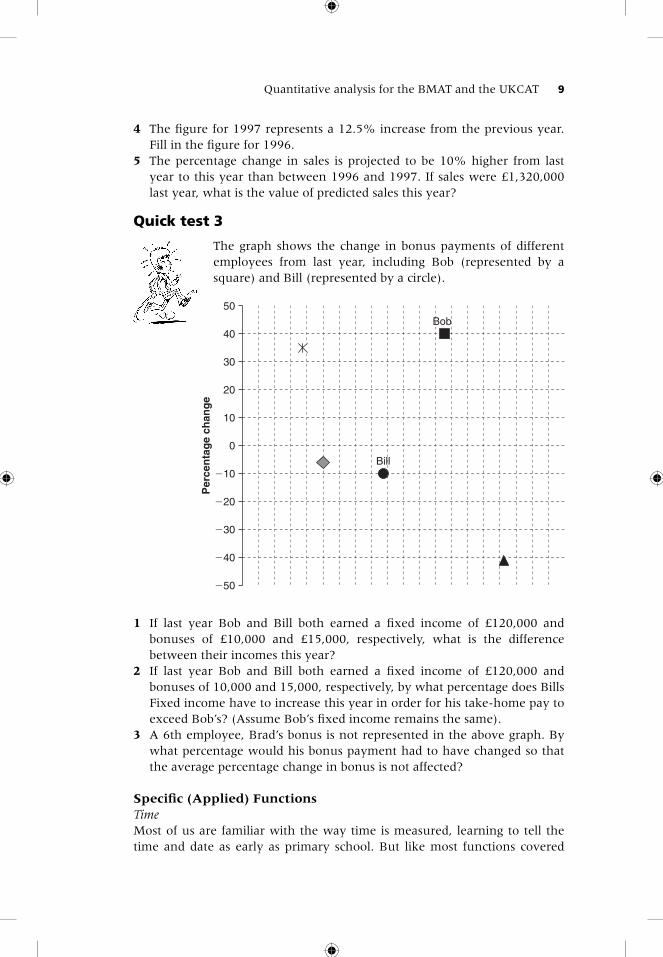
Quick test 3
The graph shows the change in bonus payments of different employees from last year, including Bob (represented by a square) and Bill (represented by a circle).
0
10
�10
�30
�40
�20
�50
20
30
40
50
Per
cen
tag
e ch
ang
e
Bob
Bill
1 If last year Bob and Bill both earned a fi xed income of £120,000 and bonuses of £10,000 and £15,000, respectively, what is the difference between their incomes this year?
2 If last year Bob and Bill both earned a fi xed income of £120,000 and bonuses of 10,000 and 15,000, respectively, by what percentage does Bills Fixed income have to increase this year in order for his take-home pay to exceed Bob’s? (Assume Bob’s fi xed income remains the same).
3 A 6th employee, Brad’s bonus is not represented in the above graph. By what percentage would his bonus payment had to have changed so that the average percentage change in bonus is not affected?
Specifi c (Applied) FunctionsTimeMost of us are familiar with the way time is measured, learning to tell the time and date as early as primary school. But like most functions covered
10 Chapter 1
in this chapter we don’t often give the concept of time, clocks and calendars more than rudimentary thought. This part of the chapter hopes to give you the opportunity to think a little more about this function.
Quick test 4
Number drill(No calculator!)
How many seconds in 1 day?How many minutes in a week?How many hours in January?
The analogue clock measures the hours of the day using numbers 1–12 while the 24-hour clock uses numbers 0–23.
The 14:43 train actually arrives at the platform at 8 p.m. and further delays of 42 minutes occur before it departs. What is the total delay to the start of the journey?
Firstly calculate the time that has elapsed from 14:43 to 20:00:
20:00 � 14:43 � 05:17.
Secondly add the further delay of 42 minutes:
05:17 � 42 � 05:59
Answer: 5 hours 59 minutes delay.
Subtraction of times can be thought of injust the same way as conventional numbers –think of a “time line” instead of the numberline.
I wake up in the middle of the night: my digital clock reads 23:43. I am woken up again at 06:30 by my alarm clock. How many complete circles did the minute hand of my analogue watch make between these two times?
Quantitative analysis for the BMAT and the UKCAT 11
Think about the position of the analogue watch at the time I was woken (i.e. at 11:43 p.m.). For each complete circle, the minute hand would have to move all the way around to 43 minutes past the hour.
Complete circles Time
1 00:432 01:433 02:434 03:435 04:436 05:43
The next time it makes a full circle it will be 6:43 but I wake up at 06:30, so answer is six times.
It is 3 p.m. By 3:20 p.m., how far will the hour hand have moved?
Think about how the hour hand and minute hand move in relation to one another. Using this example, the hour hand would move from 3 to 4 when the minute hand moves all the way around the face of the clock (i.e. from 12 to 12).
In other words the hour hand moves the equivalent of 5 “minutes” every time the minute hand moves 60 minutes. Therefore in 20 minutes the hour hand would move a third of the distance between 3 and 4 p.m. (20/60 � 1/3).
No. of minutes moved by hour hand
No. of minuutes moved by minute hand�
5
60
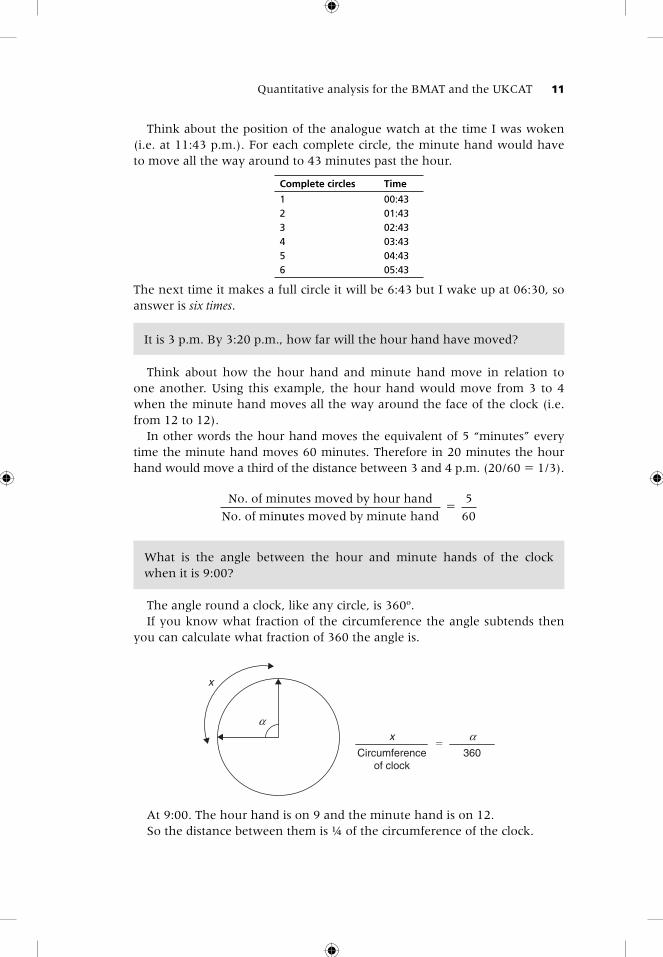
What is the angle between the hour and minute hands of the clock when it is 9:00?
The angle round a clock, like any circle, is 360º.If you know what fraction of the circumference the angle subtends then
you can calculate what fraction of 360 the angle is.
x
x
Circumferenceof clock
360�
At 9:00. The hour hand is on 9 and the minute hand is on 12.So the distance between them is ¼ of the circumference of the clock.
12 Chapter 1
So the angle between them is ¼ � 360º � 90º.
What is the angle between the hour and minute hands of the clock when it is 8:20?
The same principle applies to this question.You might think that because at 8:20 the hour hand is on 8 and the
minute hand is on 4 then you might calculate the angle as (8 � 4)/12 � 360 � 120º.
But this would be wrong because at 8:20 the hour hand is not on 8 but is somewhere between 8 and 9. So we must fi rst fi nd out where exactly it is and then calculate the angle.
At 8 the hour hand was on 8, since then the minute hand has moved 20 minutes. Using our understanding of ratios:
20 minutes
Minutes moved by hour hand�
60
5
So minutes moved by hour hand is 100/60 � 1.66 minutes.
So the hour hand is about 1.66 “minutes” from 8 on the clock.
So the angle between them � 20 � 1.66 � 21.66/60 � 360º � 129.96º.
Quick test 5
1 If the 4:56 train will be approximately 4 hours 13 minutes late at what time will it arrive?
2 How long has it taken me to travel from London to New York, if my time of departure was 8:43 a.m. (London time) and my time of arrival was 3:32 p.m. (New York time) and if New York is 5 hours behind London?
3 The clock shows the time as being 3:45. If, by 4 p.m. the minute hand has covered a circumference of 18 cm, what distance has the hour hand covered?
4 What is the angle between the minute and hour hands of the clock when it is 8:24?
1 To improve your speed at doing time-calculations: (a) Think of the “time line” (b) Practice! (mental arithmetic involving times).2 Think about the relationship between analogue and digital time; and in analogue time the relation between the hour and minute hands.

Quantitative analysis for the BMAT and the UKCAT 13
CalendarThere are just a few things to bear in mind with calculations involving calendars.
Firstly, different months have different days – 28, 29, 30 or 31 depend-ing on the month – (use this information in calculations if you know which months are involved!).
Secondly, common approximations that we use in day-to-day life (such as, “4 weeks in a month”, “30 days in a month”) are not always safe to use in calculations.
If there are roughly 4 weeks in a month and 12 monthsin a year, that means there must be 48 weeks in a year.True or False? Why?
What is a leap year? Why do we have them?
The following shows the page of a calendar from February and early March in a particular year.
MON TUE WED THU FRI SAT SUN
1 2 3 4
5 6 7 8 9 10 11
12 13 14 15 16 17 18
19 20 21 22 23 24 25
26 27 28 1 2 3 4
In this year, John and Jack both have birthdays that fall on Sundays (on 25th February and 4th March, respectively).
1 After Jack’s birthday how many weeks will elapse before a Sunday falls on a date which is a multiple of 4?
2 If next year is a leap year, on what days of the week will their birth-days fall?
3 If next year is a leap year, how many days before their birthdays both fall on a Sunday again?
1 Counting the dates over months which are comprised of different num-bers of days can be a bit tricky. It can help to use a pictorial representa-tion for example like the following diagram:
March April
4 11 18 25 // 1
//
8
14 Chapter 1
Here we have jotted down the dates of all the subsequent Sundays (being mindful of the total number of days in each month). From this it is clear that this will next happen 5 weeks later on 8th April.
2 Each year, the day of the week on which a given date falls shifts along by one day; e.g. if this year, 29th June is a Monday, next year it will be a Tuesday. The signifi cance of the leap year is that the additional day at the end of February shifts this by one extra day for every date after it.
If it was not a leap year, both birthdays would fall on Mondays next year. However, in a leap year, Jack’s birthday (25th February), which lies before the added day at 29th February will be on a Monday, however this added day will cause John’s birthday (4th March) to be not on a Monday but on a Tuesday.
3 First we should try and fi nd when one of the birthdays (let’s take 25th February) next falls on the same day. This is best fi gured out using a dia-gram to help visualise things. Let’s say this year is 2007 and next year is 2008 (leap year), we can fi ll in which days the 25th February falls on in each year subsequently.
MON WED THU FRI SAT SUN
2007
2008 2009 2010 2011 2012
2013 2014 2015 2016 2017 2018
Leap years
TUE
(Note that after every leap year, there is a “jump” of two days for earlier dates.)From this we can see that the 25th February will next fall on a Sunday in
2018. Jack’s birthday (4th March) should also fall on a Sunday on this year as it is not a leap year. There are 11 years (3 leap years) therefore:
(11 � 365) � 3 � 4018 days during this period.
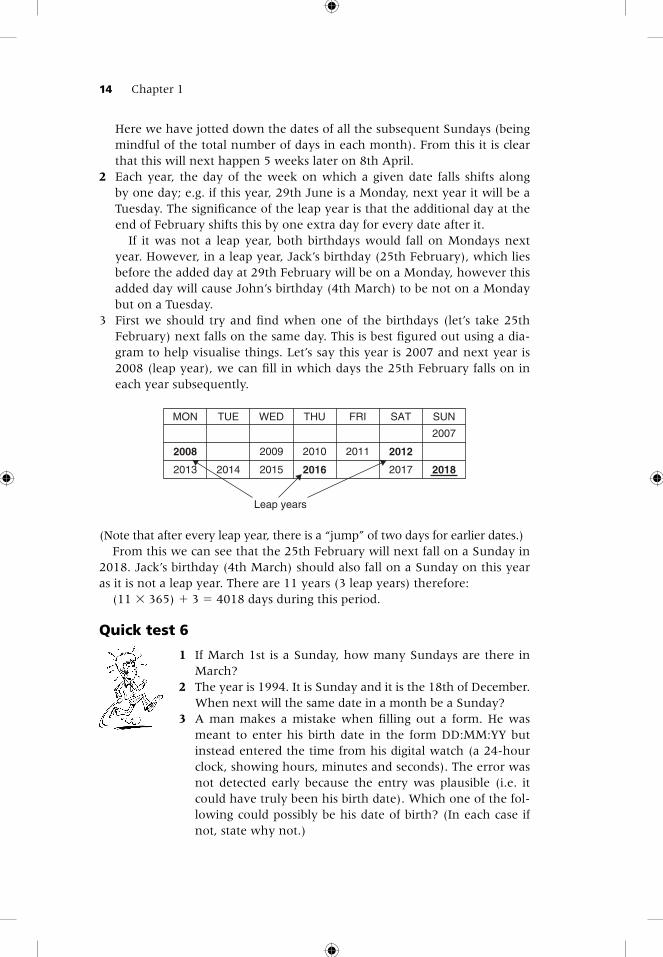
Quick test 6
1 If March 1st is a Sunday, how many Sundays are there in March?
2 The year is 1994. It is Sunday and it is the 18th of December. When next will the same date in a month be a Sunday?
3 A man makes a mistake when fi lling out a form. He was meant to enter his birth date in the form DD:MM:YY but instead entered the time from his digital watch (a 24-hour clock, showing hours, minutes and seconds). The error was not detected early because the entry was plausible (i.e. it could have truly been his birth date). Which one of the fol-lowing could possibly be his date of birth? (In each case if not, state why not.)

Quantitative analysis for the BMAT and the UKCAT 15
A 12th January 1984 B 15th December 1938 C 1st March 1960 D 28th June 1900
Questions 4 to 6 refer to the following information: The year is 1982. Jim underlines his birthday on his calendar (below)
December
MON TUE WED THU FRI SAT SUN
1 2 3 4 5
6 7 8 9 10 11 12
13 14 15 16 17 18 19
20 21 22 23 24 25 26
27 28 29 30 31
4 On what day of the week will his next birthday fall?5 How many Sundays will fall between the New Year (1983) and Jim’s next
birthday?6 Next year (1983) how many months will have three or more even-dated
Wednesdays?
MoneyUse of money is common and essential to everyday life. We also con-vert money from one currency to another. Calculations involving money are probably the most common numerical activity performed by the gen-eral public. Therefore being confi dent dealing with numbers in the form of money is very useful. Money-related problems also bring in many other numerical skills. When money is converted from one currency to the other, this brings in the topic of ratios and fractions.
Quick test 7
Number drillCalculate the following (not using a calculator!):
1 (£4.52 � £3.88 � £12.67) �122 12% of £3.853 A 30% increase on your answer to question 14 What is the percentage profi t made by a shopkeeper who
sells 12 vases at £34.99 per vase, each costing him £24.99?5 If £2 buys me $3.80, how much will a $550.00 airplane
ticket cost in pounds?
In every country, there is a system of organising money into differ-ent “denominations” or discrete values. This system, like any other, has

16 Chapter 1
rules – therefore another potential territory for specifi cally testing problem-solving skills!
The Monetary System: example using pounds and pence
100p � £1Notes: £5, £10, £20, £50Coins: 1p, 2p, 5p, 10p, 20p, 50p, £1, £2
I want to buy a shirt with a price of £41 and I only have a £50 note. The cashier has only 20 coins (consisting of 50p and 20p coins only). After the transaction what combination of notes and coins would allow me to have the maximum number of 20p coins (and still receive exact change)?
Firstly, breakdown the question (which is quite “wordy”) and ask your-self, what do I need to fi nd out? In this case, the change is £9.00 exactly.
Therefore the problem is how do I make £9.00 change using notes and 20ps and 50ps (up to a maximum of 20 in total), so that the number of 20p coins is maximised?Strategy: The strategy to maximise the coins is to use as many 20p coins as possible and as few 50p coins as possible (within the rules we have been told).Solution:● Set the limits: We don’t know the exact number of each type of coin but
the cashier clearly has at least 1 of each type, so the maximum number of either type of coin he could have is 19.
● We could make the full amount using 18 � 50p’s (� £9.00), but obviously this would not give us any 20p coins.
● If he gave us 19 � 20p coins, we would have £3.80 (this cannot be made up to a whole number using 50p coins alone).
● By now you can see that we will need to use a £5 note and try and make £4.00 with the coins.
● The next number of 20p coins he could give us and still make it up to £4.00 is 15 (15 � 20p � £3.00).
● Therefore the answer is (15 � 20p’s) � (2 � 50p’s) � £5 note.
Quick test 8
1 How many “amounts” of money between £5 and £10 can be made up using an equal number of notes and coins?
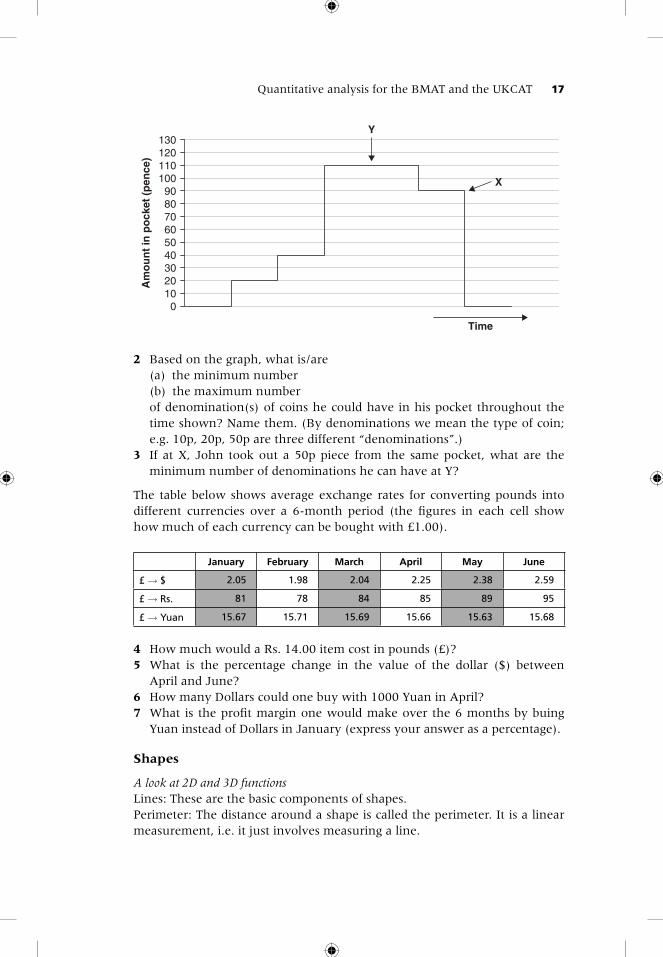
The graph below shows the total value of money in John’s pocket over time.
Quantitative analysis for the BMAT and the UKCAT 17
2 Based on the graph, what is/are (a) the minimum number (b) the maximum number of denomination(s) of coins he could have in his pocket throughout the
time shown? Name them. (By denominations we mean the type of coin; e.g. 10p, 20p, 50p are three different “denominations”.)
3 If at X, John took out a 50p piece from the same pocket, what are the minimum number of denominations he can have at Y?
The table below shows average exchange rates for converting pounds into different currencies over a 6-month period (the fi gures in each cell show how much of each currency can be bought with £1.00).
January February March April May June
£ → $ 2.05 1.98 2.04 2.25 2.38 2.59
£ → Rs. 81 78 84 85 89 95
£ → Yuan 15.67 15.71 15.69 15.66 15.63 15.68
4 How much would a Rs. 14.00 item cost in pounds (£)?5 What is the percentage change in the value of the dollar ($) between
April and June?6 How many Dollars could one buy with 1000 Yuan in April?7 What is the profi t margin one would make over the 6 months by buing
Yuan instead of Dollars in January (express your answer as a percentage).
Shapes
A look at 2D and 3D functionsLines: These are the basic components of shapes.Perimeter: The distance around a shape is called the perimeter. It is a linear measurement, i.e. it just involves measuring a line.
0102030405060708090
100110120130
Am
ou
nt
in p
ock
et (
pen
ce)
Time
X
Y
18 Chapter 1
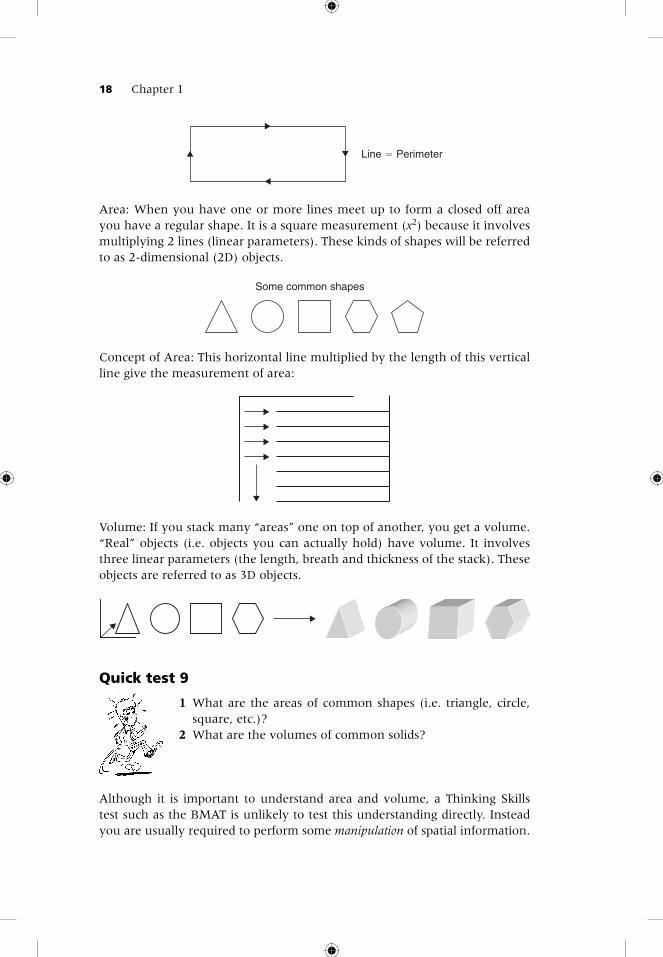
Area: When you have one or more lines meet up to form a closed off area you have a regular shape. It is a square measurement (x2) because it involves multiplying 2 lines (linear parameters). These kinds of shapes will be referred to as 2-dimensional (2D) objects.
Line � Perimeter
Some common shapes
Concept of Area: This horizontal line multiplied by the length of this vertical line give the measurement of area:
Volume: If you stack many “areas” one on top of another, you get a volume. “Real” objects (i.e. objects you can actually hold) have volume. It involves three linear parameters (the length, breath and thickness of the stack). These objects are referred to as 3D objects.
Quick test 9
1 What are the areas of common shapes (i.e. triangle, circle, square, etc.)?
2 What are the volumes of common solids?
Although it is important to understand area and volume, a Thinking Skills test such as the BMAT is unlikely to test this understanding directly. Instead you are usually required to perform some manipulation of spatial information.
Quantitative analysis for the BMAT and the UKCAT 19
This is the same principle as all the previous functions already discussed in this chapter but the information presented in this case is spatial.
FoldingNow that we understand the basics of shapes and objects generally, an important problem-solving skill is to be able to fold 2D shapes. The way a shape looks when it is folded depends on the lines along which it is folded. An object can be folded along any line you choose but if it is to be folded in half it must be folded along a line of symmetry.
Take this circle, for example. It has two small bits missing at opposite ends. Imagine we are asked to fold it in half twice; there are several possible out-comes. These of course depend on the lines along which it is folded. What each diagram shows is the result when it is folded twice along the lines of symmetry shown.
If we fold it along the dotted lines shown in Diagram A, it will look like Ai from both sides. If we fold it along the lines shown in Diagram B, it may look like Bi or Bii depending on which side we look at.
Diagram A Diagram B
Ai
Bi
Bii
Quick test 10
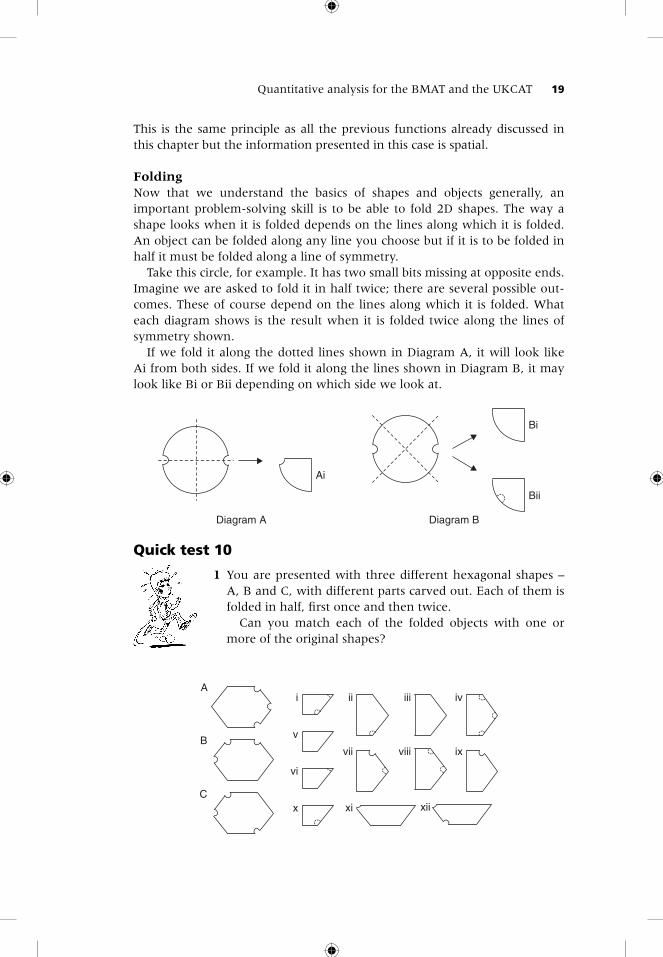
1 You are presented with three different hexagonal shapes – A, B and C, with different parts carved out. Each of them is folded in half, fi rst once and then twice. Can you match each of the folded objects with one or more of the original shapes?
A
B
C
i ii iv
v
vi
vii viii
x xiixi
iii
ix
20 Chapter 1
Rotations and Refl ections
RotationsAnother manipulative skill is the ability to rotate 3D objects and thus deter-mine how they might look from different angles. Below are different sets of 3D objects which have been rotated to give different views. Try to determine which views are possible and which are not and why.
Are these two possible views of the same object?
A B
Yes they are. We are shown end-on views in both cases, so it is possible that they are end-on views of different sides of the same object. You must be careful here as we cannot be certain that they are exactly the same object. But it is possible that they are.
Are these two possible views of the same object?
A B
No, they are not. In A, the two horse-shoe parts of the shape are not as aligned in the same way as B. We are able to tell this because we are given more than just an end-on view.
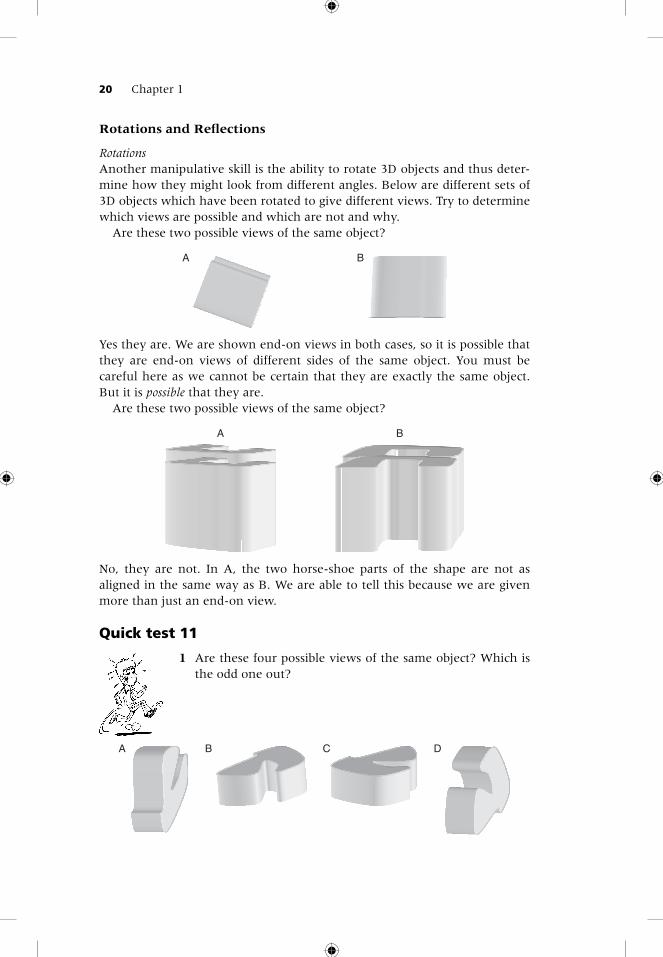
Quick test 11
1 Are these four possible views of the same object? Which is the odd one out?
A B C D

Quantitative analysis for the BMAT and the UKCAT 21
2 Are these two possible views of the same object?
Refl ectionsUnderstanding the way mirrors work is fundamental but can be quite tricky. As shown in the diagram below a mirror performs lateral inversion. What this means is that each equivalent point on the object and in the image is the same distance from the mirror and directly opposite each other.
In this fi rst example point 1 on the object is the same distance from point 1 on the image and they are directly opposite each other (i.e. the line attach-ing them is perpendicular to the mirror). This is the same for points 2, 3, 4, and 5.
1
2
3
4 5
1
2
3
45
Object Mirror Image
In the next example, point A on the object and point A on the image are directly opposite each other and are equidistant from the mirror. Also con-sider how the curves are refl ected; a curve to the right becomes a curve to the left when refl ected and a curve to the left becomes a curve to the right when refl ected.
Object Mirror Image
A
B
C
D
A
B
C
D
22 Chapter 1
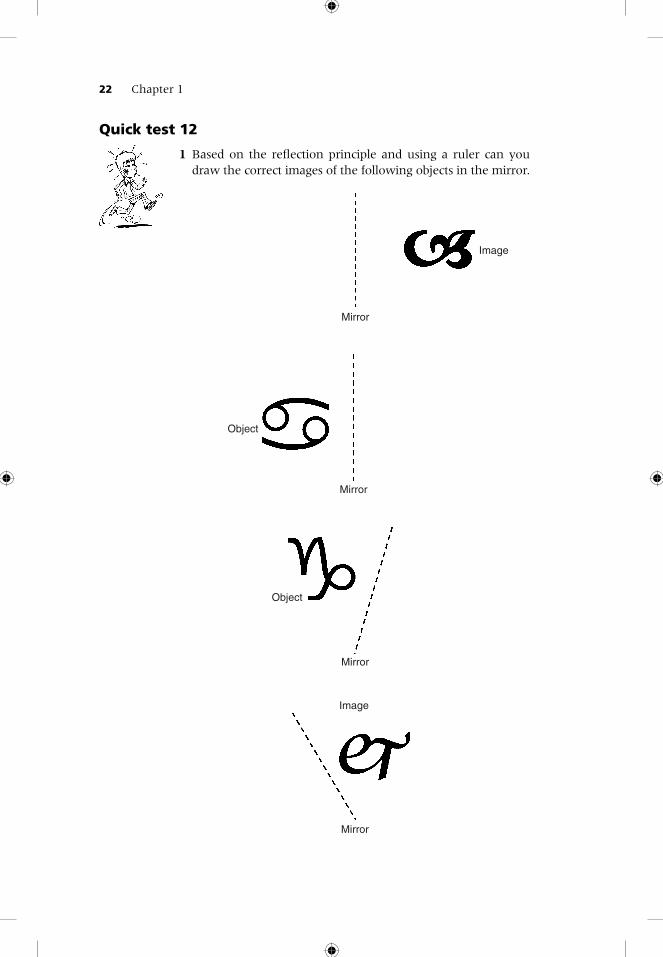
Quick test 12
1 Based on the refl ection principle and using a ruler can you draw the correct images of the following objects in the mirror.
Object
Mirror
Mirror
Image
Object
Mirror
Image
Mirror
Quantitative analysis for the BMAT and the UKCAT 23
2D to 3D conversionIt is also important to be able to convert 2D objects to 3D objects or at least imagine the 2D views of 3D objects. 2D–3D conversion is very important as in “real life” we often represent 3D objects as plain 2D drawings and it is important to be able to deduce important information like proportions and relative positions from this limited information.
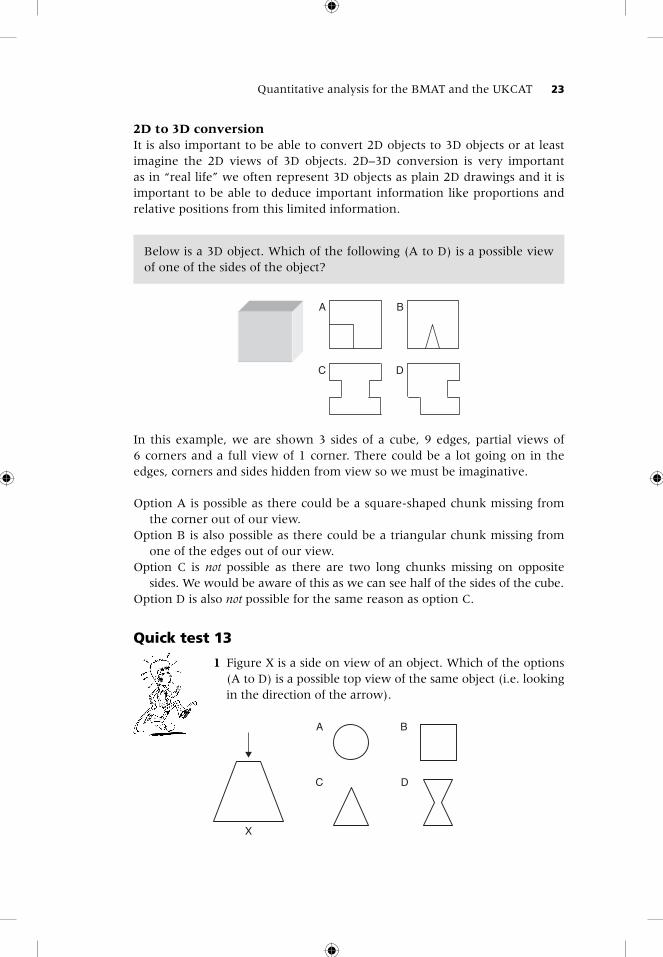
Below is a 3D object. Which of the following (A to D) is a possible view of one of the sides of the object?
A B
C D
In this example, we are shown 3 sides of a cube, 9 edges, partial views of 6 corners and a full view of 1 corner. There could be a lot going on in the edges, corners and sides hidden from view so we must be imaginative.
Option A is possible as there could be a square-shaped chunk missing from the corner out of our view.
Option B is also possible as there could be a triangular chunk missing from one of the edges out of our view.
Option C is not possible as there are two long chunks missing on opposite sides. We would be aware of this as we can see half of the sides of the cube.
Option D is also not possible for the same reason as option C.
Quick test 13
1 Figure X is a side on view of an object. Which of the options (A to D) is a possible top view of the same object (i.e. looking in the direction of the arrow).
A B
C D
X

24 Chapter 1
The key to spatial reasoning is familiarity whichcomes with practice. Why don’t you take matters intoyour own hand: observe how everyday objects can bemanipulated, how they look from different directionsand how they look when reflected in a mirror.
GraphsA graph or table is just another way of representing data. Although graphs are meant to be easily digestible forms of data representation, their interpre-tation can often be confusing so they are worth a separate look. There are different types of graphs which can be used in many different ways, depend-ing on the emphasis required. Below are a few examples.
There are several skills involved. These will test your ability to:
– Extract data– Analyse the data in order to solve a problem– Make inferences from the information– Relate one graph or chart to another or a non-graphical form of data
representation
Extracting and analysing dataThe ability to extract and derive information from the graph is the most common and basic function you can do. It is extremely important to get a good grasp of what exactly the graph shows and, just as importantly, what
Quantitative analysis for the BMAT and the UKCAT 25
it does not show. The fi rst way to do this is by carefully looking at the axes or other parameters of the graphs and making sure you know exactly what each result or value means.
You may be asked to obtain two main types of information from a graph: (a) where the information is directly demonstrated; (b) where the informa-tion is not immediately obvious – for this latter type of question you have to ask yourself, “can this be derived from the information in the graph?”
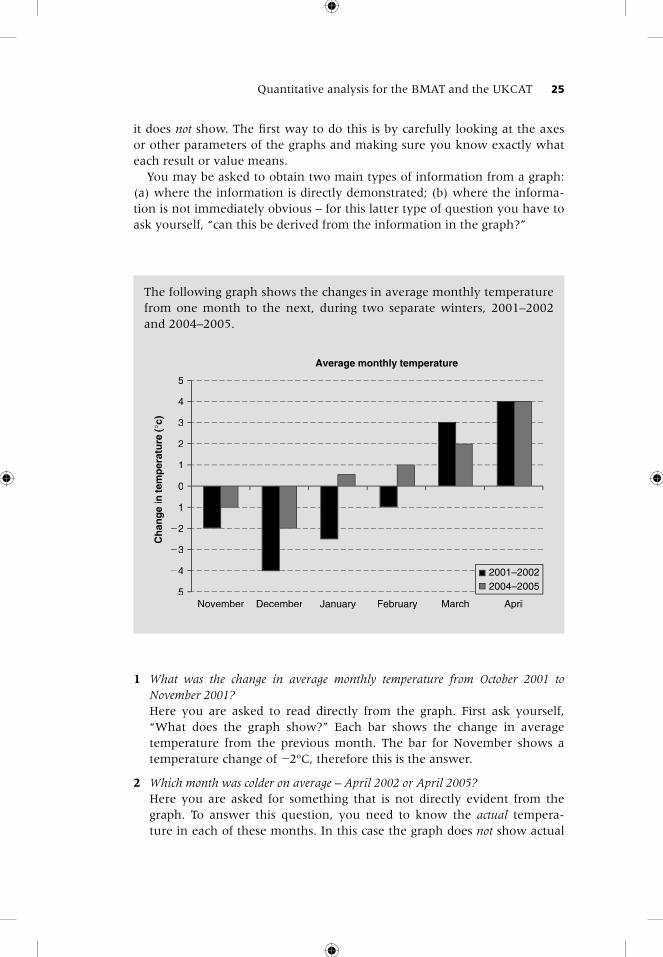
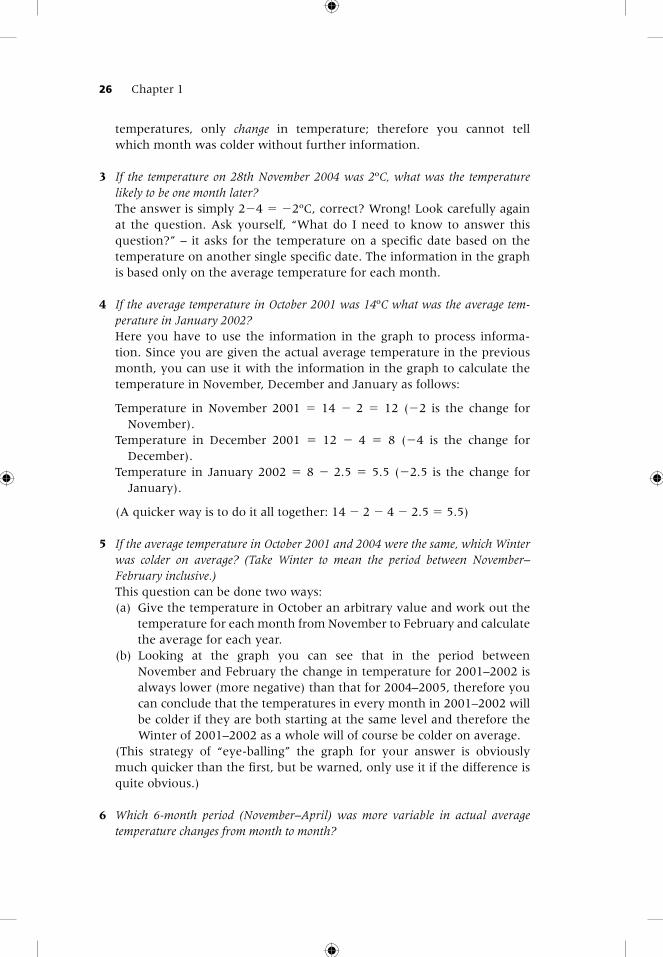
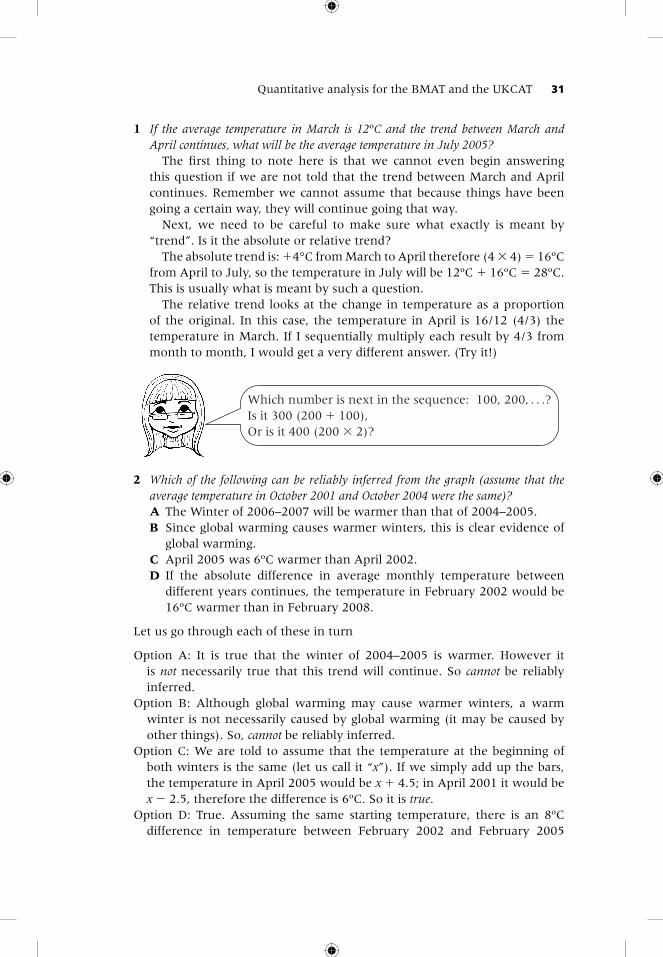
The following graph shows the changes in average monthly temperature from one month to the next, during two separate winters, 2001–2002 and 2004–2005.
Average monthly temperature
�5
�4
�3
�2
�1
0
1
2
3
4
5
November December January February March April
Ch
ang
ein
tem
per
atu
re(°
c)
2001–20022004–2005
1 What was the change in average monthly temperature from October 2001 to November 2001?
Here you are asked to read directly from the graph. First ask yourself, “What does the graph show?” Each bar shows the change in average temperature from the previous month. The bar for November shows a temperature change of �2ºC, therefore this is the answer.
2 Which month was colder on average – April 2002 or April 2005? Here you are asked for something that is not directly evident from the
graph. To answer this question, you need to know the actual tempera-ture in each of these months. In this case the graph does not show actual
26 Chapter 1
temperatures, only change in temperature; therefore you cannot tell which month was colder without further information.
3 If the temperature on 28th November 2004 was 2ºC, what was the temperature likely to be one month later?
The answer is simply 2�4 � �2ºC, correct? Wrong! Look carefully again at the question. Ask yourself, “What do I need to know to answer this question?” – it asks for the temperature on a specifi c date based on the temperature on another single specifi c date. The information in the graph is based only on the average temperature for each month.
4 If the average temperature in October 2001 was 14ºC what was the average tem-perature in January 2002?
Here you have to use the information in the graph to process informa-tion. Since you are given the actual average temperature in the previous month, you can use it with the information in the graph to calculate the temperature in November, December and January as follows:
Temperature in November 2001 � 14 � 2 � 12 (�2 is the change for November).
Temperature in December 2001 � 12 � 4 � 8 (�4 is the change for December).
Temperature in January 2002 � 8 � 2.5 � 5.5 (�2.5 is the change for January).
(A quicker way is to do it all together: 14 � 2 � 4 � 2.5 � 5.5)
5 If the average temperature in October 2001 and 2004 were the same, which Winter was colder on average? (Take Winter to mean the period between November–February inclusive.)
This question can be done two ways: (a) Give the temperature in October an arbitrary value and work out the
temperature for each month from November to February and calculate the average for each year.
(b) Looking at the graph you can see that in the period between November and February the change in temperature for 2001–2002 is always lower (more negative) than that for 2004–2005, therefore you can conclude that the temperatures in every month in 2001–2002 will be colder if they are both starting at the same level and therefore the Winter of 2001–2002 as a whole will of course be colder on average.
(This strategy of “eye-balling” the graph for your answer is obviously much quicker than the fi rst, but be warned, only use it if the difference is quite obvious.)
6 Which 6-month period (November–April) was more variable in actual average temperature changes from month to month?
Quantitative analysis for the BMAT and the UKCAT 27
Without going into formal statistical concepts such as “variance” etc. (which you would not be expected to know), we all know that the concept of vari-ability is about the degree of change (irrespective of the direction, positive or negative). In this case, therefore, the one way to get an idea of this would be to add up the size of the bars for each group.
For 2001–2002, it is: 2 � 4 � 2.5 � 1 � 3 � 4 � 16.5 For 2004–2005, it is: 3 � 2 � 0.5 � 1 � 2 � 4 � 12.5
This gives us a general idea of degree of change or variability (although it is not a formal mathematical formula). Another way to see this difference is again by simply “eye-balling” the graph, where it is quite clear that the bars for 2001–2002 are larger.
With any graphical question ask yourself:1 What does it show? (look at the axes!)2 What does it not show?Before looking back at the graph, ask yourself,“What information do I need to answer this question?
Does the graph show this information directly? If not,can it be derived from the graph with the informationprovided?”
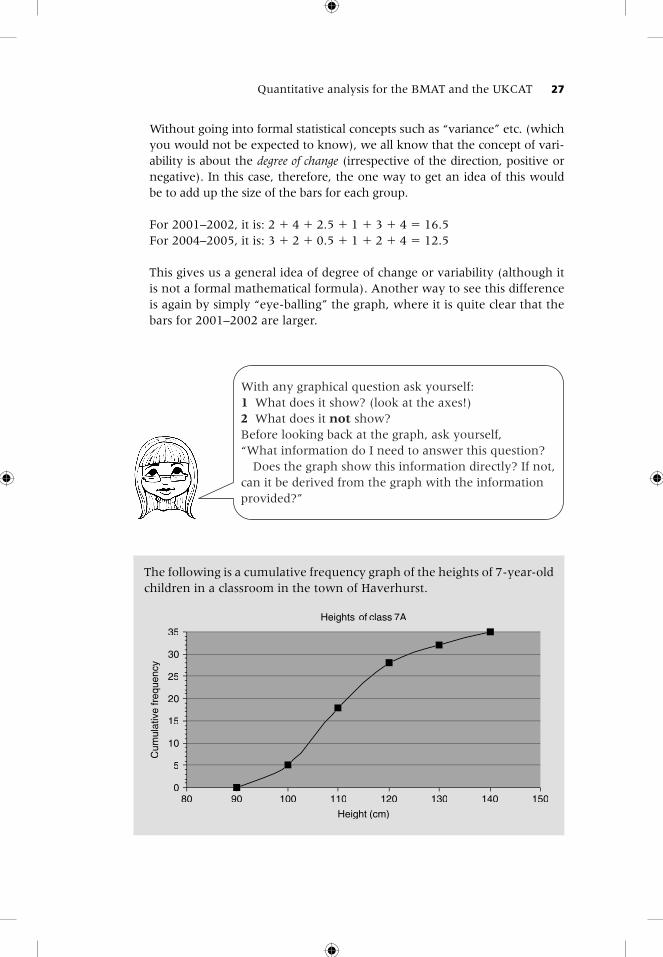
The following is a cumulative frequency graph of the heights of 7-year-old children in a classroom in the town of Haverhurst.
Heights of class 7A
0
5
10
15
20
25
30
35
80 90 100 110 120 130 140 150
Height (cm)
Cum
ulat
ive
freq
uenc
y
28 Chapter 1
1 What is the height of the smallest pupil? What does the graph show? In this case the cumulative frequency at
any height shows the number of pupils who are at that height or lower. (An even better way to imagine this is to think about how the graph was made: imagine if someone took a bar and placed it at 90 cm above the ground and then counted how many pupils came under it, and then repeated this for 100 cm, 110 cm, and so on. This is a good way to under-stand what cumulative frequency represents.) In this case we know that no pupils are 90 cm or lower, but 5 are 100 cm or lower (the smallest pupil is clearly somewhere in this group but his/her height maybe any-thing from 90.0000001 cm to 100 cm, according to the graph!), so we cannot tell what his actual height is.
2 What is the mean height of the class? What do you need to calculate this? You need the height of each indi-
vidual pupil which you add together and divide by the total number of pupils. The total number is easy – that’s simply where the graph ends, i.e. 35. What about individual heights? Do you have this information? No. Can you derive it from the graph? No. Therefore the question cannot be answered.
3 How many pupils are taller than 120 cm? What do you need to calculate this? Well, we know 28 students
are 120 cm or lower. The rest, (35 � 28) � 7, must therefore be taller than this.
4 How many pupils are between 100 cm and (up to and including) 120 cm tall? 28 pupils are 120 cm or shorter 5 pupils are 100 cm or shorter
Therefore, 28 � 5 � 23 pupils must lie in between. (In other words take away those pupils who are 100 cm or shorter from those who are 120 cm or shorter – think about the “bar” analogy described above.)
InferenceInference is something you deduce from the graph without it directly being shown. This tests your understanding of the implications of the information presented and to deduce what this might mean when applied to different circumstances. It requires a certain amount of critical thinking about the information you derive from the graph.
Taking our previous examples, think about what you can and cannot infer or deduce from this information.
Quantitative analysis for the BMAT and the UKCAT 29
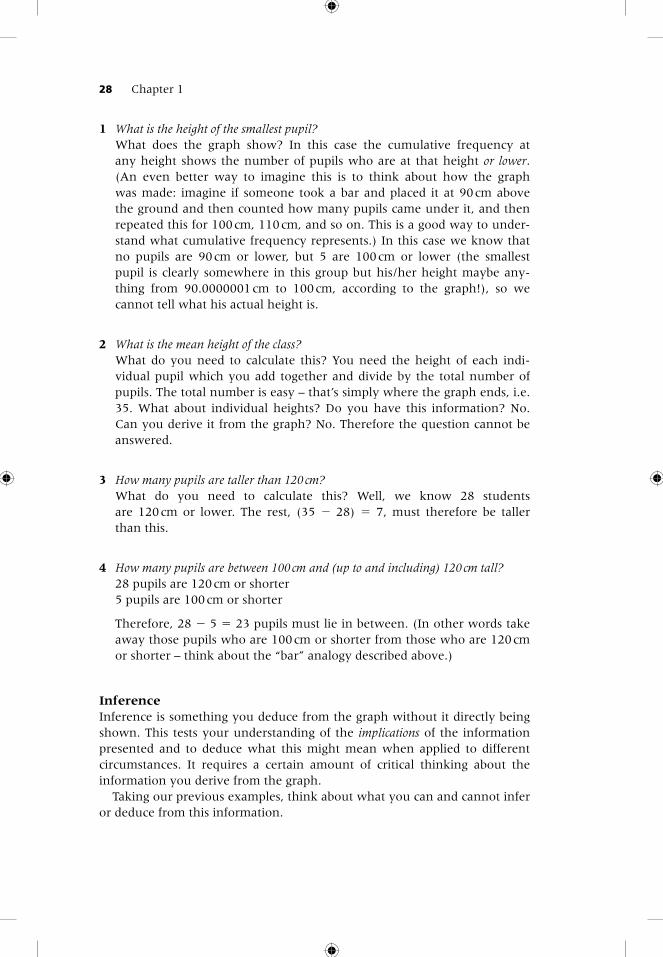
Here we are given a new piece of information and have to infer from that. If we look at 120 cm on the graph, it is obvious that the majority of pupils in Class 7A fall below this height. So, looking at the statements:
Option A: We are told most children who are malnourished are short, but the converse, i.e. that most children who are short are malnourished does not necessarily apply. So it cannot be reliably inferred.
Option B: Since most of the pupils’ heights fall below 120 cm it would be fair to say that most people in Class 7A are below average in height. So it is true.
Option C: Here some more analysis is needed. We know 28 of 35 are less than or equal to 120 cm. Therefore 7/35 (20%) are taller than 120 cm. So it is true.
Option D: This is quite irrelevant – there is nothing in the question to asso-ciate athleticism with height. So it cannot be reliably inferred. (Remember: use only the information in the question!)
Option E: This may or may not be true; however, we have no information on how a child’s height at age 7 predicts their height in later life. So this cannot be reliably inferred.
The following is a cumulative frequency graph of the heights of 7-year-old children in a classroom in the town of Haverhurst.
Heights of class 7A
0
5
10
15
20
25
30
35
80 90 100 110 120 130 140 150
Height (cm)
Cum
ulat
ive
freq
uenc
y
Assuming that the average height of a 7-year-old nationally is 120 cm and that most children who are malnourished are shorter than aver-age, which of the following can be reliably inferred about the pupils in Class 7A?
A Most pupils in Class 7A are probably malnourishedB Most pupils of Class 7A are shorter than averageC Less than a quarter of pupils in Class 7A are taller than averageD Generally, the pupils in Class 7A are less athletic than averageE Most pupils in 7A will be shorter than average as adults
30 Chapter 1
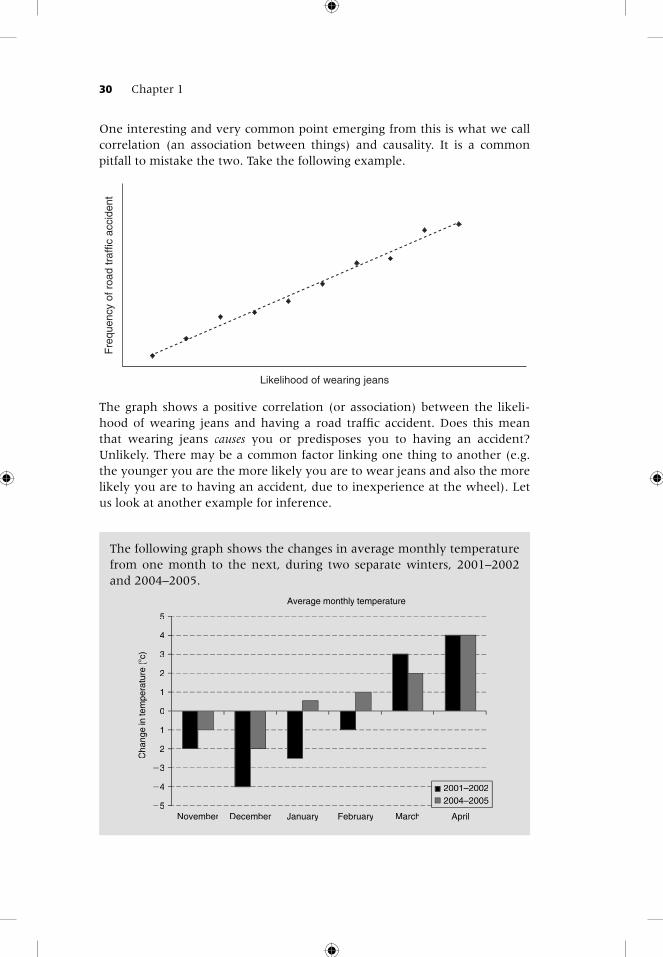
One interesting and very common point emerging from this is what we call correlation (an association between things) and causality. It is a common pitfall to mistake the two. Take the following example.
Likelihood of wearing jeans
Fre
quen
cy o
f roa
d tr
affic
acc
iden
t
The graph shows a positive correlation (or association) between the likeli-hood of wearing jeans and having a road traffi c accident. Does this mean that wearing jeans causes you or predisposes you to having an accident? Unlikely. There may be a common factor linking one thing to another (e.g. the younger you are the more likely you are to wear jeans and also the more likely you are to having an accident, due to inexperience at the wheel). Let us look at another example for inference.
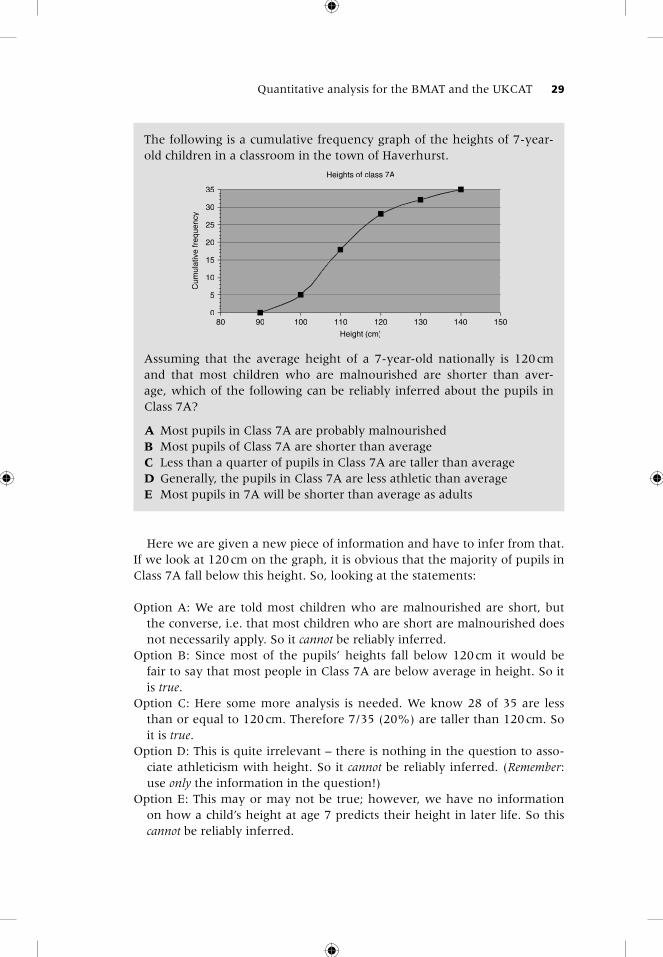
The following graph shows the changes in average monthly temperature from one month to the next, during two separate winters, 2001–2002 and 2004–2005.
Average monthly temperature
�5
�4
�3
�2
�1
0
1
2
3
4
5
November December January February March April
Cha
nge
inte
mpe
ratu
re(�
c)
2001–20022004–2005
Quantitative analysis for the BMAT and the UKCAT 31
1 If the average temperature in March is 12ºC and the trend between March and April continues, what will be the average temperature in July 2005?
The fi rst thing to note here is that we cannot even begin answering this question if we are not told that the trend between March and April continues. Remember we cannot assume that because things have been going a certain way, they will continue going that way.
Next, we need to be careful to make sure what exactly is meant by “trend”. Is it the absolute or relative trend?
The absolute trend is: �4°C from March to April therefore (4 � 4) � 16ºC from April to July, so the temperature in July will be 12ºC � 16ºC � 28ºC. This is usually what is meant by such a question.
The relative trend looks at the change in temperature as a proportion of the original. In this case, the temperature in April is 16/12 (4/3) the temperature in March. If I sequentially multiply each result by 4/3 from month to month, I would get a very different answer. (Try it!)
Which number is next in the sequence: 100, 200, . . .?Is it 300 (200 � 100),Or is it 400 (200 � 2)?
2 Which of the following can be reliably inferred from the graph (assume that the average temperature in October 2001 and October 2004 were the same)?A The Winter of 2006–2007 will be warmer than that of 2004–2005.B Since global warming causes warmer winters, this is clear evidence of
global warming.C April 2005 was 6ºC warmer than April 2002.D If the absolute difference in average monthly temperature between
different years continues, the temperature in February 2002 would be 16ºC warmer than in February 2008.
Let us go through each of these in turn
Option A: It is true that the winter of 2004–2005 is warmer. However it is not necessarily true that this trend will continue. So cannot be reliably inferred.
Option B: Although global warming may cause warmer winters, a warm winter is not necessarily caused by global warming (it may be caused by other things). So, cannot be reliably inferred.
Option C: We are told to assume that the temperature at the beginning of both winters is the same (let us call it “x”). If we simply add up the bars, the temperature in April 2005 would be x � 4.5; in April 2001 it would be x � 2.5, therefore the difference is 6ºC. So it is true.
Option D: True. Assuming the same starting temperature, there is an 8ºC difference in temperature between February 2002 and February 2005

32 Chapter 1
(using the same method as above). This is equivalent to an 8/3 difference per year. Over 6 years (2002–2006) this would be a difference of 16ºC (8/3�6). We are safe in using absolute trend as this is clearly stated in the question. So it is true.
The following graphs show data relating to house prices in the town of Bridgewater.
House price trends
80
90
100
110
120
130
140
150
160
170
2001 2002 2003 2004 2005 2006 2007
Mea
nho
use
pric
e (£
000s
)
House prices 20040–50,000
8%
50,000–100,00021%
100,000–200,00054%
200,000–500,00017%
House prices 20070–50,000
8%
50,000–100,00017%
100,000–200,00052%
200,000–500,00023%
1 What was the price of an average house in Bridgewater in 2004? £118,000 approximately (read off graph)
2 What was the percentage difference in mean house prices between 2002 and 2004? Price in 2002 � £95,000 Price in 2004 � £118,000 Difference � 118,000 � 95,000 � 23,000 % Difference � (23,000/95,000) � 100 � 24%
3 What was the difference between the actual house prices in 2007 compared with the house price predicted based on the absolute trend between 2002 and 2004?
This question asks you to do 2 things:
1 Extrapolate the absolute trend between 2002 and 2004 to predict a price for 2007.
2 Compare that with the actual price for 2007.

Quantitative analysis for the BMAT and the UKCAT 33
The absolute difference between 2002 and 2004 is £23,000. This represents an increase of £11,500 per year. From 2002 to 2007 there are 5 years. Therefore if this trend continues the 2007 price would be (11,500 � 5) � 95,000 � £152,500.
The actual price in 2007 is £162,500 (from the graph).
Therefore the difference is £162,500 � £152,500 � £10,000
4 Which of the following can be reliably inferred about house prices in Bridgewater?A House prices will continue to increase.B Based on the absolute trend in the last 2 years, the average price in
2010 will be approximately £185,000.C The average house in 2006 would have to depreciate by approximately
40% to reach 2001 levels.D The acceleration in house price between 2004 and 2007 was caused by
the increase in the proportion of £200,000–£500,000 houses.
Option A: Can’t tell. There is no information to support this. (Remember: only use the information provided whatever your instinct or prior knowledge tells you!)
Option B: True. There is an approximately £8,000 per year increase between 2005 and 2007; therefore by 2010 this trend should reach approximately £185,000 when extrapolated.
Option C: True.2006 price � £150,0002001 price � £90,000Difference � £60,000
Percentage difference � 60/150 � 100 � 40%Note: “depreciation” is a change in the downward direction. It is treated exactly the same as any other change, but remembering that the “start-ing point” is the higher value (150,000) not the lower one (90,000), therefore we use this as the denominator.
Option D: False. It is true there was an acceleration in house price from 2004. From the pie chart we can see that there was also an increase in proportion of the £200,000–£500,000 houses. However, the pie chart simply refl ects this increase in average house price in a different form. It does not tell us about underlying causes.
5 Which of the following may explain the trend in house prices after 2004?A General market forces such as reductions in interest rates making con-
sumers more likely to buy a house.B Increase in local demand for homes.C A new development of luxury apartments at an average price of
£350,000 each.D A relative increase in the number of £50,000–£100,000 homes between
2004 and 2007.
34 Chapter 1
With this type of question the emphasis changes. The key word here is “may” – this should prompt you to now consider each possibility more gen-erally and ask “could this possibly be a link?” Also notice that the question specifi cally refers to the trend after 2004; implicit in this question is the ref-erence to the clear change in the trend after 2004 – as you can see the graph becomes steeper at this point.
Option A: True. A general entity such as this is almost always possibly a factor.Option B: True. If demand increases, one can conceive prices increasing.Option C: True. As you can see, this is well above the average house price
and therefore may cause a steeper rise in average house price on top of the current trend; it also fi ts in the changes shown in the pie chart.
Option D: False. These houses are lower than average even at 2004. Therefore an increase in this bracket would tend to pull average prices down. Also, if you look at the pie chart you will see that the proportion of houses in this bracket actually decreases between these 2 years.
Relating graphs: AnalogyFinally you may be required to relate the information (or part of it) pre-sented in one graphical form to that presented in another form. This involves spotting analogy or patterns between graphs.
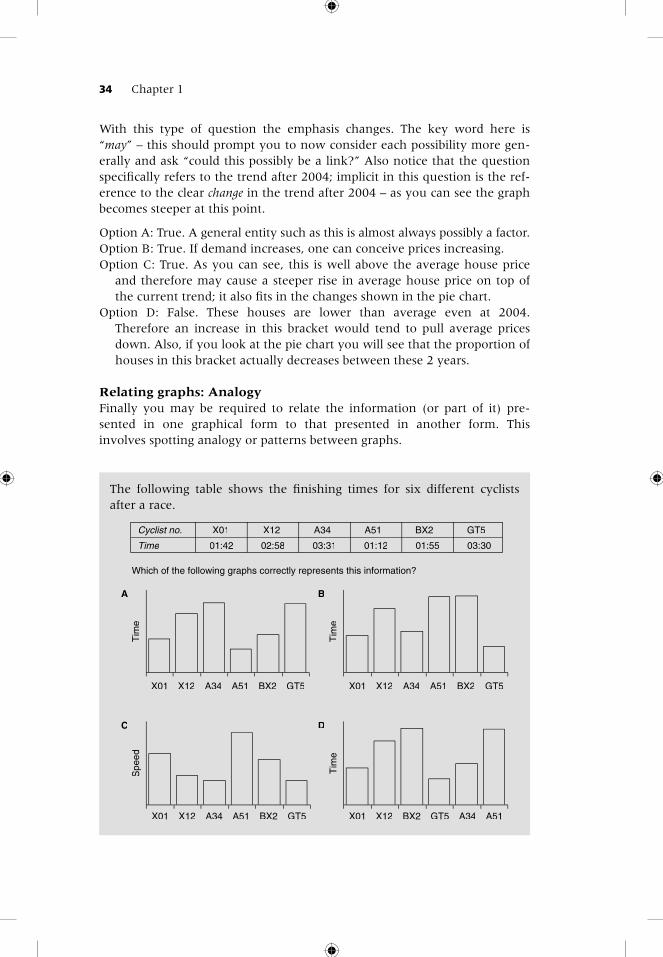
The following table shows the fi nishing times for six different cyclists after a race.
Which of the following graphs correctly represents this information?
X01 X12 A34 A51 BX2 GT5
X01 X12 A34 A51 BX2 GT5
Tim
e
X01 X12
X01 X12
A34 A51
A34 A51
BX2 GT5
BX2 GT5
Tim
e
Spe
ed
Tim
e
Cyclist no. X01 X12 BX2 GT5A51A34
Time 01:42 02:58 03:31 03:3001:5501:12
A
C
B
D
Quantitative analysis for the BMAT and the UKCAT 35
The general principle is that the numerical quantity is refl ected by the size of the bar. Therefore, the relative sizes of the bars should refl ect the times.
Graph A is correct since it correctly refl ects the relative times of the different cyclists.
Graph B is wrong since it doesn’t. The quick way to pick this up is to look for the obvious differences. For example it shows cyclists A51 and BX2 having the same times, but they clearly do not; also, it shows that GT5 has the quickest time, whereas he is actually one of the slowest.
Graph C is actually correct. The axis is speed not time. We know that speed is inversely proportional to time therefore the relative heights for speed should be exactly the opposite for time. Compare its shape with graph A.
Graph D seems to have exactly the same shape as A however, if you look carefully, the order of the cyclists is different. Therefore it doesn’t accu-rately refl ect the relative times of the cyclists.
Make sure you know what each graph representsseparately, before drawing links between graphs.
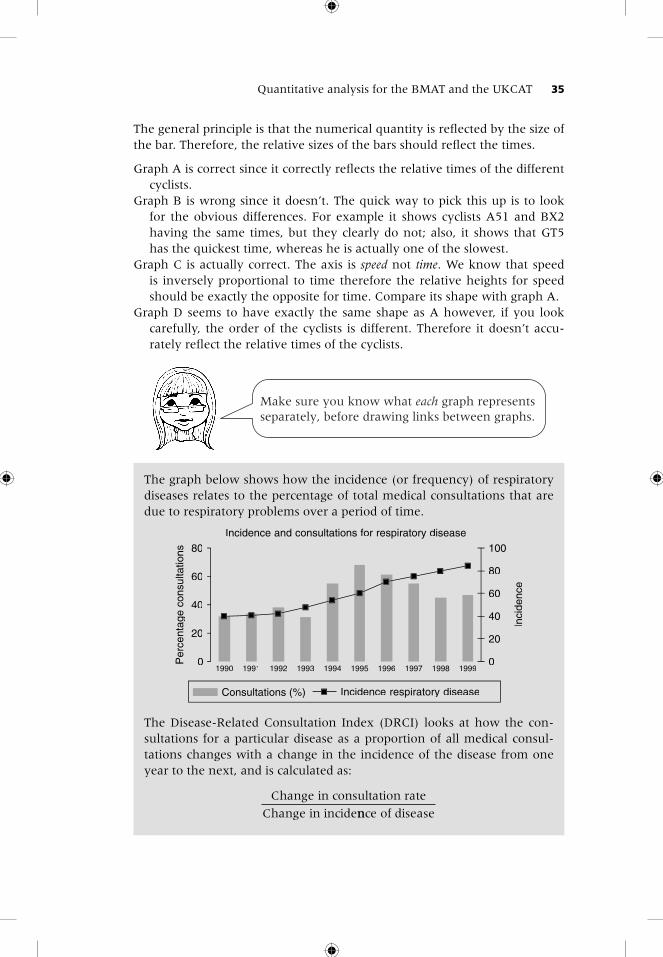
The graph below shows how the incidence (or frequency) of respiratory diseases relates to the percentage of total medical consultations that are due to respiratory problems over a period of time.
Incidence and consultations for respiratory disease
0
20
40
60
80
1990 1991 1992 1993 1994 1995 1996 1997 1998 1999
Per
cent
age
cons
ulta
tions
0
20
40
60
80
100
Inci
denc
e
Consultations (%) Incidence respiratory disease
The Disease-Related Consultation Index (DRCI) looks at how the con-sultations for a particular disease as a proportion of all medical consul-tations changes with a change in the incidence of the disease from one year to the next, and is calculated as:
Change in consultation rate
Change in incidennce of disease
36 Chapter 1
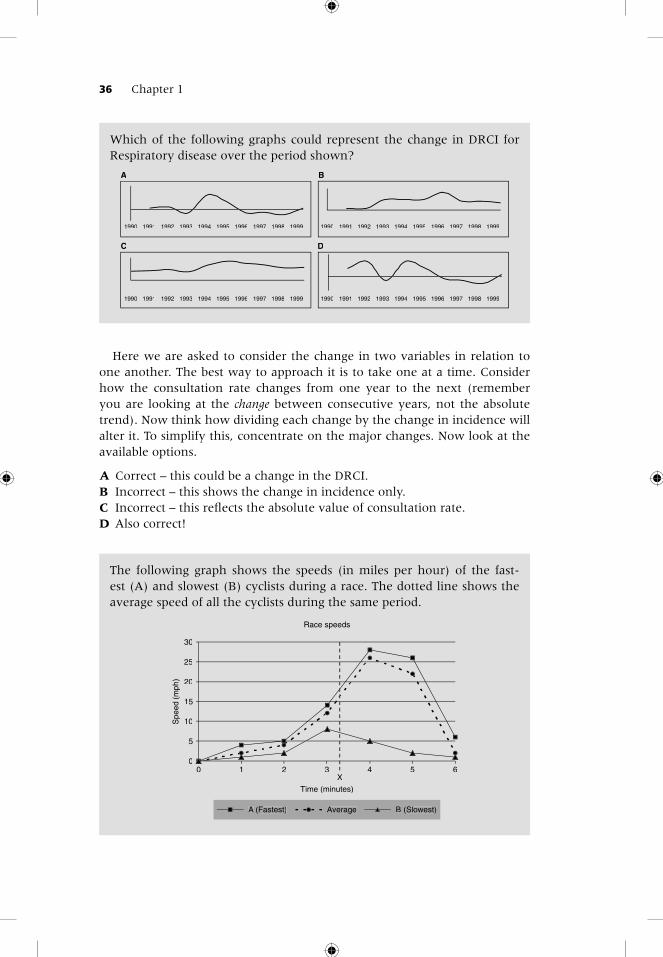
Here we are asked to consider the change in two variables in relation to one another. The best way to approach it is to take one at a time. Consider how the consultation rate changes from one year to the next (remember you are looking at the change between consecutive years, not the absolute trend). Now think how dividing each change by the change in incidence will alter it. To simplify this, concentrate on the major changes. Now look at the available options.
A Correct – this could be a change in the DRCI.B Incorrect – this shows the change in incidence only.C Incorrect – this refl ects the absolute value of consultation rate.D Also correct!
Which of the following graphs could represent the change in DRCI for Respiratory disease over the period shown?
A
1990 1991 1992 1993 1994 1995 1996 1997 1998 1999
1990 1991 1992 1993 1994 1995 1996 1997 1998 1999
C
B
1990 1991 1992 1993 1994 1995 1996 1997 1998 1999
1990 1991 1992 1993 1994 1995 1996 1997 1998 1999
D
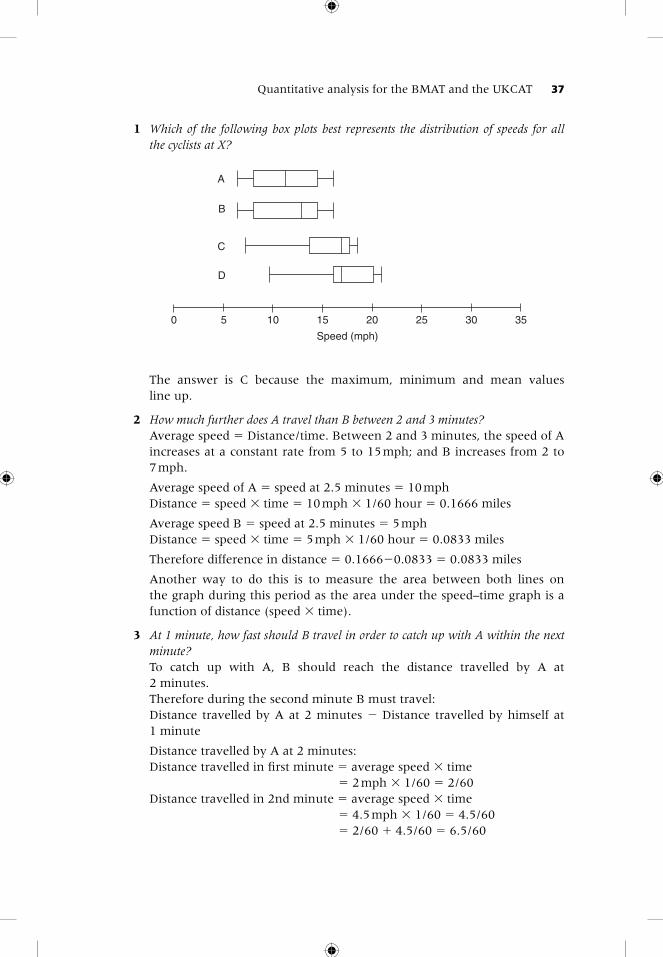
The following graph shows the speeds (in miles per hour) of the fast-est (A) and slowest (B) cyclists during a race. The dotted line shows the average speed of all the cyclists during the same period.
Race speeds
0
5
10
15
20
25
30
0 1 2 3 4 5 6
Time (minutes)
Spe
ed(m
ph)
A (Fastest) Average B (Slowest)
X
Quantitative analysis for the BMAT and the UKCAT 37
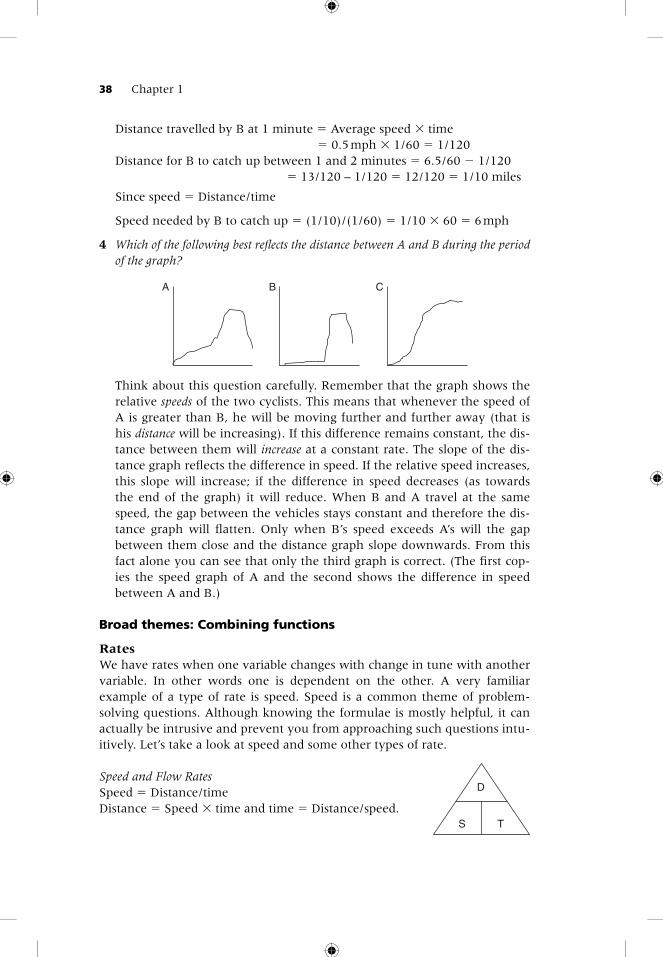
1 Which of the following box plots best represents the distribution of speeds for all the cyclists at X?
A
B
C
D
Speed (mph)
0 5 10 15 20 30 3525
The answer is C because the maximum, minimum and mean values line up.
2 How much further does A travel than B between 2 and 3 minutes? Average speed � Distance/time. Between 2 and 3 minutes, the speed of A
increases at a constant rate from 5 to 15 mph; and B increases from 2 to 7 mph.
Average speed of A � speed at 2.5 minutes � 10 mph Distance � speed � time � 10 mph � 1/60 hour � 0.1666 miles
Average speed B � speed at 2.5 minutes � 5 mph Distance � speed � time � 5 mph � 1/60 hour � 0.0833 miles
Therefore difference in distance � 0.1666�0.0833 � 0.0833 miles
Another way to do this is to measure the area between both lines on the graph during this period as the area under the speed–time graph is a function of distance (speed � time).
3 At 1 minute, how fast should B travel in order to catch up with A within the next minute?
To catch up with A, B should reach the distance travelled by A at 2 minutes.
Therefore during the second minute B must travel: Distance travelled by A at 2 minutes � Distance travelled by himself at
1 minute
Distance travelled by A at 2 minutes: Distance travelled in fi rst minute � average speed � time
� 2 mph � 1/60 � 2/60 Distance travelled in 2nd minute � average speed � time
� 4.5 mph � 1/60 � 4.5/60 � 2/60 � 4.5/60 � 6.5/60
38 Chapter 1
Distance travelled by B at 1 minute � Average speed � time � 0.5 mph � 1/60 � 1/120
Distance for B to catch up between 1 and 2 minutes � 6.5/60 � 1/120 � 13/120 – 1/120 � 12/120 � 1/10 miles
Since speed � Distance/time
Speed needed by B to catch up � (1/10)/(1/60) � 1/10 � 60 � 6 mph
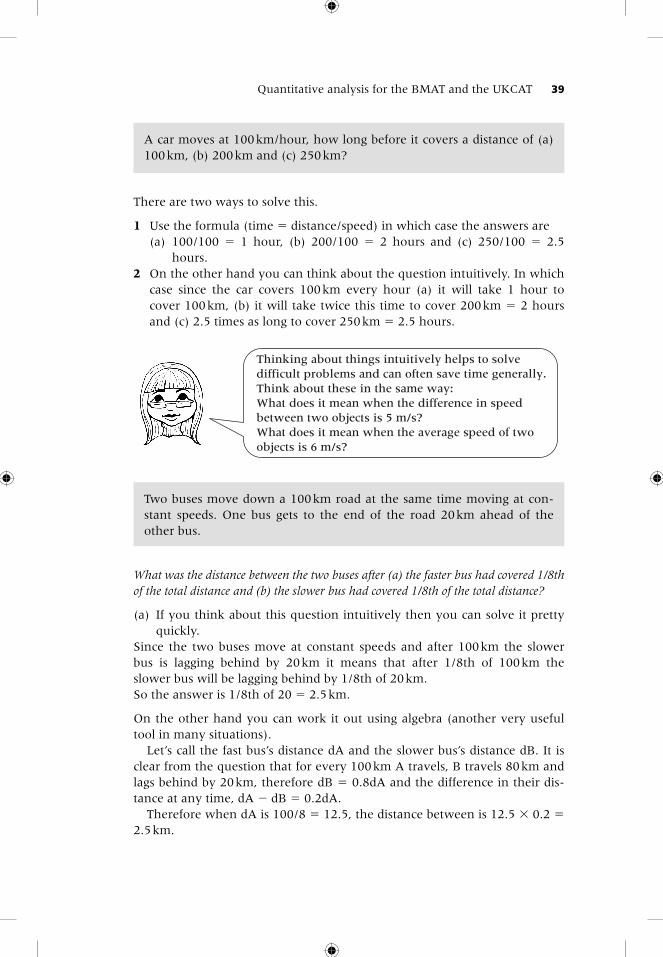
4 Which of the following best refl ects the distance between A and B during the period of the graph?
A B C
Think about this question carefully. Remember that the graph shows the relative speeds of the two cyclists. This means that whenever the speed of A is greater than B, he will be moving further and further away (that is his distance will be increasing). If this difference remains constant, the dis-tance between them will increase at a constant rate. The slope of the dis-tance graph refl ects the difference in speed. If the relative speed increases, this slope will increase; if the difference in speed decreases (as towards the end of the graph) it will reduce. When B and A travel at the same speed, the gap between the vehicles stays constant and therefore the dis-tance graph will fl atten. Only when B’s speed exceeds A’s will the gap between them close and the distance graph slope downwards. From this fact alone you can see that only the third graph is correct. (The fi rst cop-ies the speed graph of A and the second shows the difference in speed between A and B.)
Broad themes: Combining functions
RatesWe have rates when one variable changes with change in tune with another variable. In other words one is dependent on the other. A very familiar example of a type of rate is speed. Speed is a common theme of problem-solving questions. Although knowing the formulae is mostly helpful, it can actually be intrusive and prevent you from approaching such questions intu-itively. Let’s take a look at speed and some other types of rate.
Speed and Flow RatesSpeed � Distance/timeDistance � Speed � time and time � Distance/speed.
D
S T
Quantitative analysis for the BMAT and the UKCAT 39
There are two ways to solve this.
1 Use the formula (time � distance/speed) in which case the answers are (a) 100/100 � 1 hour, (b) 200/100 � 2 hours and (c) 250/100 � 2.5
hours.2 On the other hand you can think about the question intuitively. In which
case since the car covers 100 km every hour (a) it will take 1 hour to cover 100 km, (b) it will take twice this time to cover 200 km � 2 hours and (c) 2.5 times as long to cover 250 km � 2.5 hours.
A car moves at 100 km/hour, how long before it covers a distance of (a) 100 km, (b) 200 km and (c) 250 km?
Thinking about things intuitively helps to solvedifficult problems and can often save time generally.Think about these in the same way:What does it mean when the difference in speedbetween two objects is 5 m/s?What does it mean when the average speed of twoobjects is 6 m/s?
Two buses move down a 100 km road at the same time moving at con-stant speeds. One bus gets to the end of the road 20km ahead of the other bus.
What was the distance between the two buses after (a) the faster bus had covered 1/8th of the total distance and (b) the slower bus had covered 1/8th of the total distance?
(a) If you think about this question intuitively then you can solve it pretty quickly.
Since the two buses move at constant speeds and after 100 km the slower bus is lagging behind by 20 km it means that after 1/8th of 100 km the slower bus will be lagging behind by 1/8th of 20 km.So the answer is 1/8th of 20 � 2.5 km.
On the other hand you can work it out using algebra (another very useful tool in many situations).
Let’s call the fast bus’s distance dA and the slower bus’s distance dB. It is clear from the question that for every 100 km A travels, B travels 80 km and lags behind by 20 km, therefore dB � 0.8dA and the difference in their dis-tance at any time, dA � dB � 0.2dA.
Therefore when dA is 100/8 � 12.5, the distance between is 12.5 � 0.2 � 2.5 km.
40 Chapter 1
(b) In this novel scenario, the algebraic solution is quicker dA � dB � 0.2dA (we need to fi nd dA) 12.5 � 0.8dA dA � 12.5/0.8 � 15.625 so, dA � dB � 15.625 � 12.5 � 3.125 km
Intuitively, if we say the speed of the faster and slower buses in the given time, T are 100 and 80, respectively, to cover 1/8th of the total distance (100/8, i.e. 12.5 km) it will take 12.5/80 � 0.15625T.
In the same time the faster bus would have covered the distance 0.15625 �
100 � 15.625 km. So the difference in distance covered is � 15.625 � 12.5 � 3.125 km.
This question illustrates how having a good grasp of the concept of speed more than the formulae can help you resolve these questions.
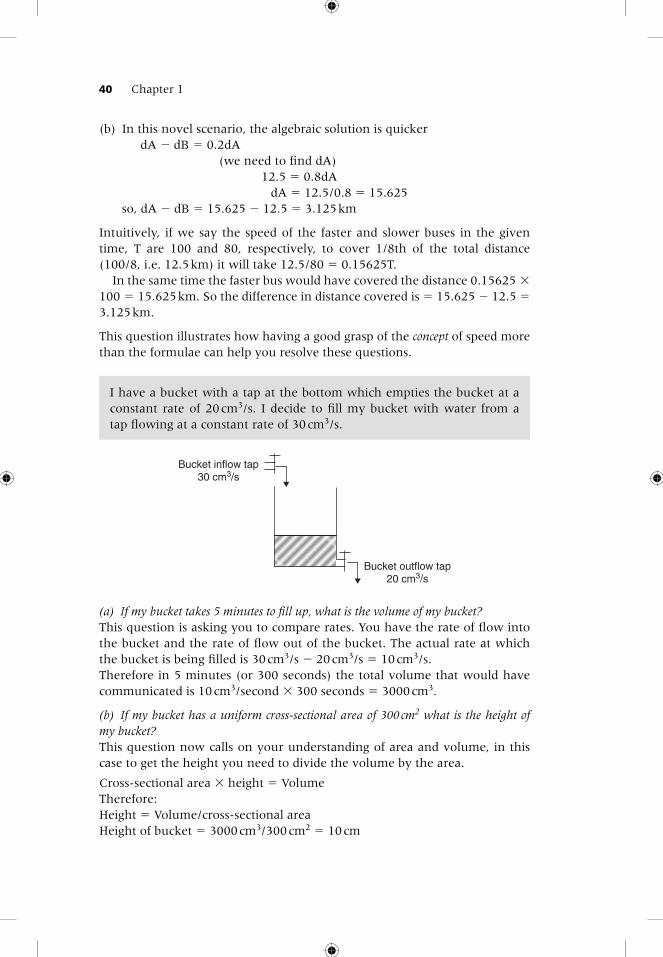
I have a bucket with a tap at the bottom which empties the bucket at a constant rate of 20 cm3/s. I decide to fi ll my bucket with water from a tap fl owing at a constant rate of 30 cm3/s.
(a) If my bucket takes 5 minutes to fi ll up, what is the volume of my bucket?This question is asking you to compare rates. You have the rate of fl ow into the bucket and the rate of fl ow out of the bucket. The actual rate at which the bucket is being fi lled is 30 cm3/s � 20 cm3/s � 10 cm3/s.Therefore in 5 minutes (or 300 seconds) the total volume that would have communicated is 10 cm3/second � 300 seconds � 3000 cm3.
(b) If my bucket has a uniform cross-sectional area of 300 cm2 what is the height of my bucket?This question now calls on your understanding of area and volume, in this case to get the height you need to divide the volume by the area.
Cross-sectional area � height � VolumeTherefore:Height � Volume/cross-sectional areaHeight of bucket � 3000 cm3/300 cm2 � 10 cm
Bucket inflow tap30 cm3/s
Bucket outflow tap20 cm3/s

Quantitative analysis for the BMAT and the UKCAT 41
(c) I now have this exact same bucket but operating by different rules: the rate of fl ow from the tap at the bottom of the bucket is not constant but dependent on the height of water in the bucket. It is initially 20 cm3/s but increases linearly by 10 cm3/s for every 1 cm increase in the height of fl uid in the bucket. If I start fi lling the bucket at 30 cm3/s as before (i) what is the maximum height the fl uid will reach and (ii) how long will it take to get there?
Now the question has got a bit more complicated; it is asking you to compare two dynamic rates that are dependent on each other. This kind of question does not lend itself very easily to a formulaic approach which you may be used to. This is why it is important to have an intuitive grasp of the problem.
(i) Initially the net rate is 10 cm3/s, as we have seen. But this changes very quickly as the bucket fi lls up because the bucket begins to empty at a faster rate. Since we know the way the bucket empties we can predict that it would begin to empty at 30 cm3/s when it reaches a height of 1 cm. At this stage there is a net rate of fl ow of 0 cm3/s. So it means this is the maximum height the fl uid would reach.
(ii) Finding the time it takes to reach the maximum height of 1 cm is a bit trickier because the net rate at which the bucket fi lls up is not constant. It fi lls up fast initially but slows down till it gets to zero. What we need is some sort of average rate we can apply. The clue is that the rate of exit from the bucket has a linear relationship to the height of fl uid in the bucket.
For simplicity let us take the average rate during that period as 25 cm3/s (halfway between 20 cm3/s and 30 cm3/s).
So all we have to fi nd out is how long will it take to get to the height of 1 cm at a net rate of (30 cm3/s � 25 cm3/s) � 5 cm3/s. To know this we need to divide the volume by the rate. The volume at 1 cm height is 300 cm3 (1 cm � 300 cm2).
So the time taken to fi ll this volume will be (300 cm3/second)/(5cm3/second) � 60 seconds.
30 cm3/s
Rate of inflow Rate of outflow
Average rate ofapproximateout flow
20 cm3/s
25 cm3/s
Rate
Height of water in bucket1 cm
Approximate rateof outflow
42 Chapter 1
Concentration and other ratesConcentration is a concept you will be familiar with from chemistry but you can also think of it as a kind of rate as the amount of solute changes in a given way with the amount of solution. There a lot of interesting problems that concentrations can throw up.
A more complex problem: In addition to the first tap,I open up another tap which fills the bucketsimultaneously at 40cm3/s. Can you draw a graph of(i) rate of fluid exit against time; (ii) height of thebucket against time?
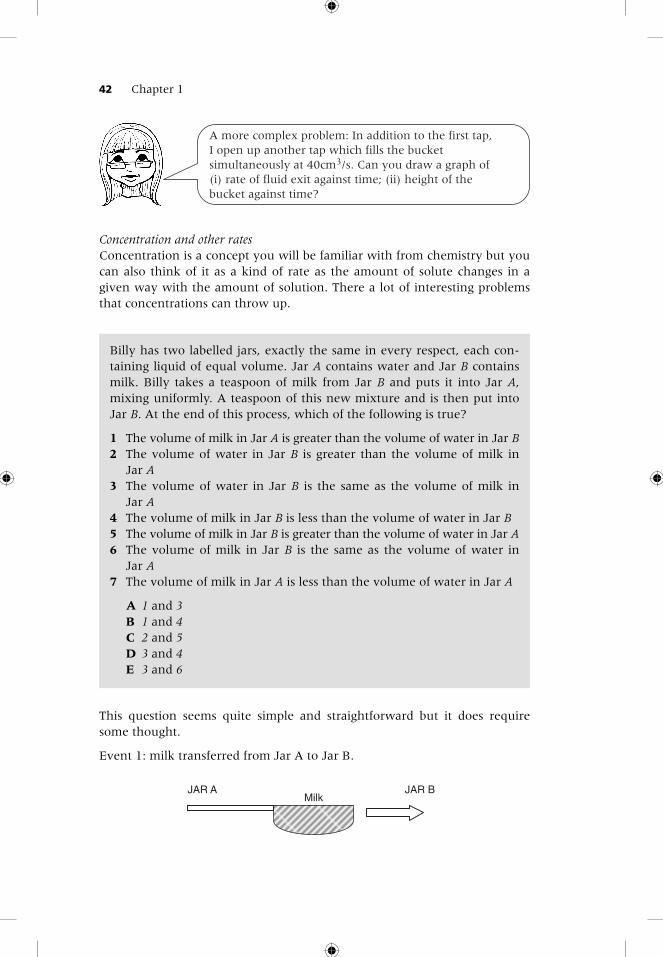
Billy has two labelled jars, exactly the same in every respect, each con-taining liquid of equal volume. Jar A contains water and Jar B contains milk. Billy takes a teaspoon of milk from Jar B and puts it into Jar A, mixing uniformly. A teaspoon of this new mixture and is then put into Jar B. At the end of this process, which of the following is true?
1 The volume of milk in Jar A is greater than the volume of water in Jar B2 The volume of water in Jar B is greater than the volume of milk in
Jar A3 The volume of water in Jar B is the same as the volume of milk in
Jar A4 The volume of milk in Jar B is less than the volume of water in Jar B5 The volume of milk in Jar B is greater than the volume of water in Jar A6 The volume of milk in Jar B is the same as the volume of water in
Jar A7 The volume of milk in Jar A is less than the volume of water in Jar A
A 1 and 3B 1 and 4C 2 and 5D 3 and 4E 3 and 6
This question seems quite simple and straightforward but it does require some thought.
Event 1: milk transferred from Jar A to Jar B.
MilkJAR A JAR B
Quantitative analysis for the BMAT and the UKCAT 43
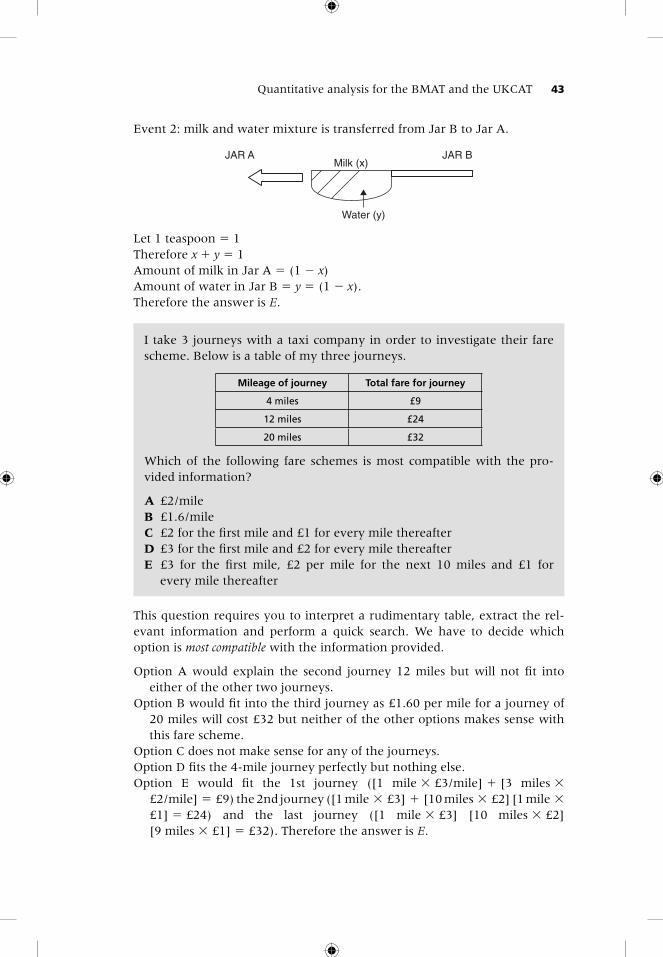
Event 2: milk and water mixture is transferred from Jar B to Jar A.
JAR A JAR BMilk (x)
Water (y)
Let 1 teaspoon � 1Therefore x � y � 1Amount of milk in Jar A � (1 � x)Amount of water in Jar B � y � (1 � x).Therefore the answer is E.
I take 3 journeys with a taxi company in order to investigate their fare scheme. Below is a table of my three journeys.
Mileage of journey Total fare for journey
4 miles £9
12 miles £24
20 miles £32
Which of the following fare schemes is most compatible with the pro-vided information?
A £2/mileB £1.6/mileC £2 for the fi rst mile and £1 for every mile thereafterD £3 for the fi rst mile and £2 for every mile thereafterE £3 for the fi rst mile, £2 per mile for the next 10 miles and £1 for
every mile thereafter
This question requires you to interpret a rudimentary table, extract the rel-evant information and perform a quick search. We have to decide which option is most compatible with the information provided.
Option A would explain the second journey 12 miles but will not fi t into either of the other two journeys.
Option B would fi t into the third journey as £1.60 per mile for a journey of 20 miles will cost £32 but neither of the other options makes sense with this fare scheme.
Option C does not make sense for any of the journeys.Option D fi ts the 4-mile journey perfectly but nothing else.Option E would fi t the 1st journey ([1 mile � £3/mile] � [3 miles �
£2/mile] � £9) the 2nd journey ([1 mile � £3] � [10 miles � £2] [1 mile � £1] � £24) and the last journey ([1 mile � £3] [10 miles � £2] [9 miles � £1] � £32). Therefore the answer is E.

44 Chapter 1
A quick look at the options will eliminate options A and B and C initially; options D and E can then be eliminated systematically.
Note that the question asks for the option most compatible with the given information. So if the best option was compatible with two of the journeys, that would be the most compatible answer.
Performing searches is common on the BMAT andUKCAT. Looking at the question broadly and applyingcommon sense will usually help you narrow down youroptions and save you time.
Integrative processesA lot of the time on the BMAT, you will be asked to carry out what we could call integrative processes. This is a way of fi nding the solution that demands you be able to break down or build-up groups or procedures into (from) their component parts.
There is a peace-brokering conference being held for the leaders of two nations. In attendance are a 20-member delegation from each par-ticipant nation and the Conference leader, so 41 people in total. The Conference leader kisses all the delegates once on the cheek while each delegate kisses each member from their own delegation twice and kisses each member from the other delegation only once.
How many kisses were there in all?
This question requires you to select relevant information and build-up (inte-grate) the total number of kisses from their component parts (noting wher-ever there might be overlap).
We have to be careful not to trip over ourselves here – we must write down carefully all the parts we want to integrate and approach the problem logically.
First: The conference leader kisses everyone.Second: There are two sets of kisses between the two groups.Third: There are two sets of kisses within the groups – 1 set per group.
If we can fi nd the number of each set of kisses, we can fi nd the total number of kisses. It is important to note that there are two sets of kisses between the groups as each group must kiss and also be kissed.
First: The conference leader kisses 40 people once � 40 kissesSecond: Each of the 20 members of group 1 kisses each of the 20 members of group 2 once � 20 � 20 � 400
Quantitative analysis for the BMAT and the UKCAT 45
And, each of the 20 members of group 2 now kisses each of the 20 members of group 1 once � 20 � 20 � 400
Third: Group 1: Each member kisses the other 19 members twice � 19 � 20 �
2 � 760
Group 2: Each member kisses others twice � 19 � 20 � 2 � 760. So the total number of kisses � 40 � 400 � 400 � 760 � 760 � 2,360 kisses in all!
How many kisses does each delegation member receive?Imagine you are delegate:
First you are kissed once by the conference leader � 1. Second you are kissed once by each member of the opposing delegation � 20. Third you are kissed twice by each of the other 19 members of your delegation � 38. Total number of kisses received by a delegate � 1�20�38 � 59.
(This makes sense as 40 delegates each receiving 59 kisses (40�59) � 2,360 kisses in all.)
Properly identifying the component parts makesbuilding the big picture much easier. Make sure towrite clearly on paper so as not to confuse yourself.
In a sample population, people either possess gene X, or they do not. 95% of people with a certain Disease A in this sample population possess the X gene. 99% of people with the X gene do not have Disease A. Of the sample population without the X gene, 99.75% do not have the disease.
If in a sample group 10 people have Disease A, what is the size of the sample population?
A 4000B 1000C 1250D 1100E 1150
This question is another type of integrative process asking you to breakdown a population into its component parts again noting where there are over-laps. There are two main ways to approach this question: (1) the mathe-matical approach; (2) the more intuitive approach. We will go through each approach.

46 Chapter 1
1 A more conventional mathematical approach:
Of people with Disease A: 95% have the X gene (X positive) (1) 5% do not have the X gene (X negative) (2)Of X positive (�ve) people: 1% have Disease A (3) 99% do not have Disease A (4)Of X negative (�ve) people: 0.25% have Disease A (5) 99.75% do not have Disease A (6)
People with Disease A � X �ve people (95%) plus X �ve people (5%)
Therefore, of the 10 people with Disease A 9.5 people are X �ve and 0.5 people are X �ve
The 9.5 people that are X �ve � 1% of total X �ve population (from (3))Therefore, 100% of X �ve people � 950
The 0.5 people that are X �ve � 0.25% of total X �ve population (from (5))Therefore, 100% of X �ve people � 200
Total population of sample size � X �ve plus X �ve � 950�200 � 1150 (E).
2 A more intuitive approach.We can see from the question: In a sample population, people either possess gene X, or they do not. Let us represent the whole population with a line:
X �veX �ve
Let the box represent those with Disease A. There is obviously some overlap between those with Disease A and those with and without the X genes.
Disease A
X �veX �ve
According to the question: 95% of people with a certain Disease A in this sample population possess the X gene. This is represented in the diagram:
95%
Disease A
5%
X �veX �ve
Also according to the question: 99% of people with the X gene do not have Disease A. Of the sample population without the X gene, 99.75% do not have the dis-ease. This is shown in the diagram below.

Quantitative analysis for the BMAT and the UKCAT 47
It should be clear from the diagram that 1% of those with the X gene � 95% of those with Disease A. Also, 0.25% of these without the X gene � 5% of those with Disease A. We have thus integrated the information given to form a composite diagram and we have done this intuitively. We can now go on to answer the question.
Number of people with Disease A � 10.
To fi nd the whole population we need to fi nd the people in the population with the X gene and the people in the population without the X gene and add them together.
Since number of people with Disease A � 10.
95% of them � 1% of the population with the X gene � 9.5 people.
Therefore, total number of people in the population with the X gene � 9.5/1 � 100 � 950. Also, 5% of the people with Disease A � 0.25% of peo-ple without the X gene. Therefore total number of people in the population without the X gene � 0.5/0.25 � 100 � 200.
Total population � 950 � 200 � 1150 (E).
AnalogyThe ability to fi nd similarities between different items or groups of items is in itself a basic skill of problem solving. It may apply to any type of prob-lem; based on words, shapes, graphs or numerical data. The ability to detect analogies requires a combination of different skills and functions we have already looked at in this chapter. You might be asked to determine similari-ties between entities – anything from numbers, words or graphical data. In these questions, you must fi rst try and work out the entity from a given chunk of information and then try and fi nd it in or relate it to the various options you are given. You might also be asked to determine the similarities between processes. Let us go through a few examples.
Disease A
5%95%
1% 0.25%X �veX �ve
99% 99.75%
The diagram shows a square whose area is a2
a
a
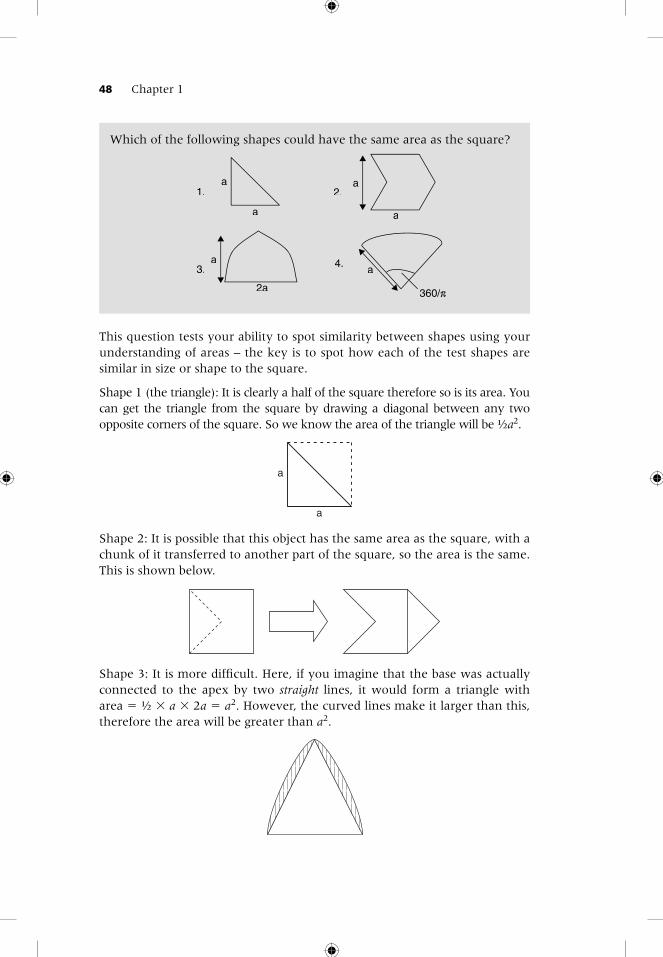
48 Chapter 1
This question tests your ability to spot similarity between shapes using your understanding of areas – the key is to spot how each of the test shapes are similar in size or shape to the square.
Shape 1 (the triangle): It is clearly a half of the square therefore so is its area. You can get the triangle from the square by drawing a diagonal between any two opposite corners of the square. So we know the area of the triangle will be ½a2.
Which of the following shapes could have the same area as the square?
a
a
a
360/π/π/
a
a1. 2.
4.a
2a
3.
a
a
Shape 2: It is possible that this object has the same area as the square, with a chunk of it transferred to another part of the square, so the area is the same. This is shown below.
Shape 3: It is more diffi cult. Here, if you imagine that the base was actually connected to the apex by two straight lines, it would form a triangle with area � ½ � a � 2a � a2. However, the curved lines make it larger than this, therefore the area will be greater than a2.

Quantitative analysis for the BMAT and the UKCAT 49
Shape 4: It is a sector. Its area will relate to how large the angle at the apex is, specifi cally it will be:
(angle/360) � πr2, in this case:
( )360
3602 2/π
π� �a a
Bus A travelling at 30 km per hour and Bus B travelling at 40 km per hour simultaneously leave from two separate termini 140 km apart. They are travelling towards each other on the same road and therefore meet at some point. Because the difference in distance covered by these two buses in any given time will be 1/3rd of Bus A’s distance and since they are travelling toward each other, it must mean the differences between the distances covered must be 1/7th of the total distance covered (i.e. 20 km at the point which they meet).
Which of the following shows an analogous process of reaching the solution?
(a) Buses C4 and C8 travel toward each other from two termini 100 miles apart at 30 mph and 40 mph, respectively. Because the differ-ence in distance covered by these two buses in any given time will be 1/4th of C8’s distance and since they are travelling toward each other, it must mean the differences between the distances covered must be 1/8th of the total distance covered, that is 14.3 km.
(b) A car (50 mph) and moped (20 mph) travel towards each other on the same road, starting 140 miles apart. It takes the car 2.8 hours to cover the distance while it takes the moped 7 hours to cover the same distance. The difference in distance when they meet is the difference in distance each of them covers in the mean times, i.e. (7�2.8/2).
(c) Two Bees fl ying towards each other at the same speed are brought to an abrupt halt when they bump into each other and cover the same distance in getting there because there is no difference in dis-tance covered per unit time.
(d) A car and moped, both travelling at 75 mph, starting 300 miles apart will each cover ½ of the total distance when they meet, i.e. 150 km.
(e) John (walking at 3 mph) and Bill (jogging at 7 mph) move around an 8 mile circuit starting out at the same point but in opposite direc-tions. Per given time, the difference in distance covered by each of them will be 4/7th Bill’s own distance, and as they are running in opposite directions on the track, when they meet, Bill would have covered 3.2 km more than John (that is 4/10ths of the total distance).

50 Chapter 1
In any question like this, we fi rst need to establish what we are comparing each of the options with – it is the process of fi nding out some measure of the difference in distance covered when two objects meet.
First of all we need to understand the process itself:
Bus A(30 km/h)
q
x x 1/3x
140 km
This process uses the fractional relationship of the speeds of the moving object to work out the difference between their distances. It has 3 parts:
1 It fi rst expresses the difference in their distances at any given time as a fraction of the distance of Bus A. For every 30 km Bus A travels, the dif-ference is 40 � 30 � 10 km; as a fraction of Bus A’s distance this is 10/30 � 1/3 (we could just as validly say that the difference in their distances is ¼ of Bus B’s distance).
2 Then, it goes on to relate this difference to the total distance travelled. Lets call Bus A’s distance “x”. We know that since the gap between them at any time is (1/3)x, Bus B must have travelled x � (1/3)x.
Total distance travelled (by both of them) is therefore: x � x � (1/3)x � (7/3)x.
The distance between them, as we have said, is (1/3)x. It is clear that this is 1/7th [(1/3)/(7/3)] of the total distance.
3 Finally, it goes on to calculate the actual distance this difference equates to when they meet. Since we know that when they meet the total distance covered is 140 km it is now easy to calculate this value since
x � x � (1/3)x � 140 (7/3)x � 140 (1/3)x � 20 km
Now look at each of the options.
(a) Here, the difference is expressed in terms of the faster bus (C8), but the calculations based on this are wrong. Therefore, the process is wrong (and therefore not completely analogous).
(b) This option is clearly not using the idea of fractional relationships to reach a solution.
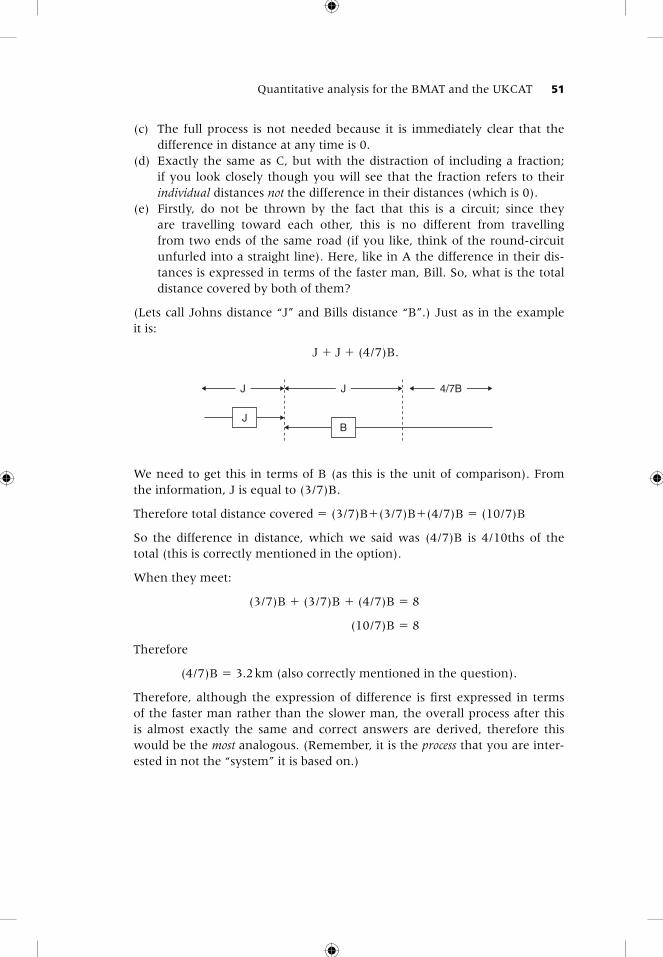
Quantitative analysis for the BMAT and the UKCAT 51
(c) The full process is not needed because it is immediately clear that the difference in distance at any time is 0.
(d) Exactly the same as C, but with the distraction of including a fraction; if you look closely though you will see that the fraction refers to their individual distances not the difference in their distances (which is 0).
(e) Firstly, do not be thrown by the fact that this is a circuit; since they are travelling toward each other, this is no different from travelling from two ends of the same road (if you like, think of the round-circuit unfurled into a straight line). Here, like in A the difference in their dis-tances is expressed in terms of the faster man, Bill. So, what is the total distance covered by both of them?
(Lets call Johns distance “J” and Bills distance “B”.) Just as in the example it is:
J � J � (4/7)B.
JJ 4/7B
BJ
We need to get this in terms of B (as this is the unit of comparison). From the information, J is equal to (3/7)B.
Therefore total distance covered � (3/7)B�(3/7)B�(4/7)B � (10/7)B
So the difference in distance, which we said was (4/7)B is 4/10ths of the total (this is correctly mentioned in the option).
When they meet:
(3/7)B � (3/7)B � (4/7)B � 8
(10/7)B � 8
Therefore
(4/7)B � 3.2 km (also correctly mentioned in the question).
Therefore, although the expression of difference is fi rst expressed in terms of the faster man rather than the slower man, the overall process after this is almost exactly the same and correct answers are derived, therefore this would be the most analogous. (Remember, it is the process that you are inter-ested in not the “system” it is based on.)
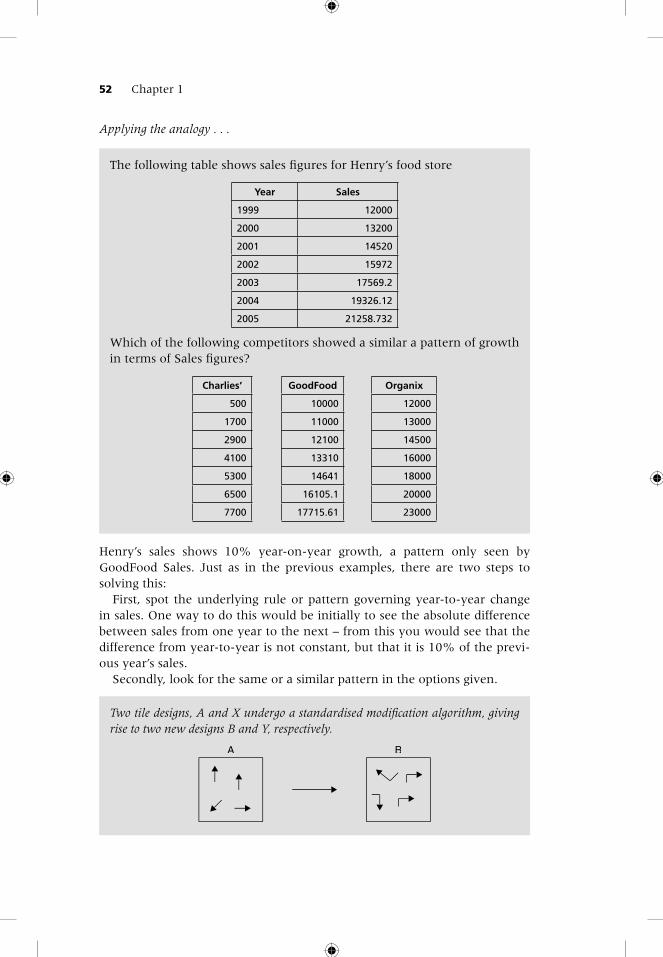
52 Chapter 1
Applying the analogy . . .
The following table shows sales fi gures for Henry’s food store
Year Sales
1999 12000
2000 13200
2001 14520
2002 15972
2003 17569.2
2004 19326.12
2005 21258.732
Which of the following competitors showed a similar a pattern of growth in terms of Sales fi gures?
Charlies’ GoodFood Organix
500 10000 12000
1700 11000 13000
2900 12100 14500
4100 13310 16000
5300 14641 18000
6500 16105.1 20000
7700 17715.61 23000
Two tile designs, A and X undergo a standardised modifi cation algorithm, giving rise to two new designs B and Y, respectively.
BA
Henry’s sales shows 10% year-on-year growth, a pattern only seen by GoodFood Sales. Just as in the previous examples, there are two steps to solving this:
First, spot the underlying rule or pattern governing year-to-year change in sales. One way to do this would be initially to see the absolute difference between sales from one year to the next – from this you would see that the difference from year-to-year is not constant, but that it is 10% of the previ-ous year’s sales.
Secondly, look for the same or a similar pattern in the options given.
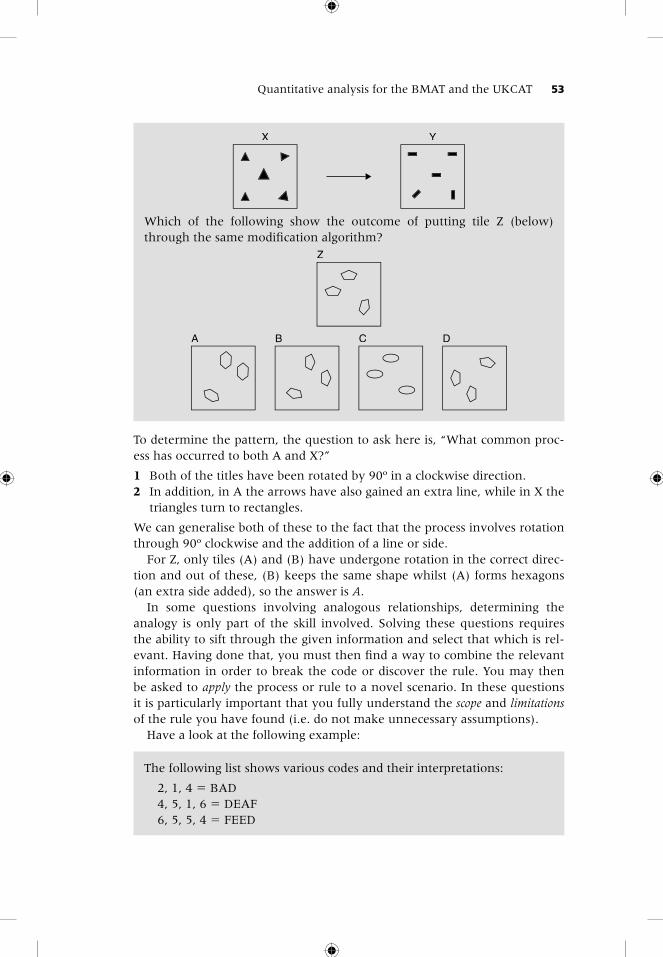
Quantitative analysis for the BMAT and the UKCAT 53
To determine the pattern, the question to ask here is, “What common proc-ess has occurred to both A and X?”
1 Both of the titles have been rotated by 90º in a clockwise direction.2 In addition, in A the arrows have also gained an extra line, while in X the
triangles turn to rectangles.
We can generalise both of these to the fact that the process involves rotation through 90º clockwise and the addition of a line or side.
For Z, only tiles (A) and (B) have undergone rotation in the correct direc-tion and out of these, (B) keeps the same shape whilst (A) forms hexagons (an extra side added), so the answer is A.
In some questions involving analogous relationships, determining the analogy is only part of the skill involved. Solving these questions requires the ability to sift through the given information and select that which is rel-evant. Having done that, you must then fi nd a way to combine the relevant information in order to break the code or discover the rule. You may then be asked to apply the process or rule to a novel scenario. In these questions it is particularly important that you fully understand the scope and limitations of the rule you have found (i.e. do not make unnecessary assumptions).
Have a look at the following example:
YX
Which of the following show the outcome of putting tile Z (below) through the same modifi cation algorithm?
A B C D
Z
The following list shows various codes and their interpretations:
2, 1, 4 � BAD4, 5, 1, 6 � DEAF6, 5, 5, 4 � FEED

54 Chapter 1
From the codes already given it seems that each number stands for a letter and that this number is exclusively used for that letter only. Indeed we can accumulate the information to fi nd that:
A � 1, B � 2, D � 4, E � 5, F � 6
So 6, 5, 4 would be “FED”.We can see that it seems that each letter is coded for by a number depend-
ing on its place in the English alphabet, so we might go on to assume that C would be 3 and therefore that the second code – 3, 1, 6, 5 – reads “CAFÉ” (but this is not an absolutely safe assumption: it lies on the limits of the scope of the rule; the only way we might make this assumption for example is if this is the only reasonable option out of many).
Based on this information, decode the following:
(i) 6, 5, 4(ii) 3, 1, 6, 5
The following show the results of some encoded sums, where each letter represents a single digit.
Sum 1 ZO/(Y�Q) � ZOSum 2 Y � Q � ZOSum 3 Y � Q � OPSum 4 Q � (Y � Q) � P
Based on the above information, solve the following encoded sums, giv-ing your answer only in the form of the encoded digits already given:
(i) Y � Z � (ii) Z � Q � (iii) Y � Q/P � Q �
To answer this, you fi rst need to decode the information given in the box just like in the previous example (except here we use numbers).
1 ZO/(Y � Q) � ZO: from this (Y � Q) must be 1, therefore Y and Q must be two consecutive numbers from 0 to 9.
2 Y � Q � ZO: since adding Y and Q gives a double-fi gure digit, they can-not be anything below 7 (if Y and Q were 6 and 5, adding them would give an encoded number of the same digit repeated).
Combining these two facts, Y and Q must be one of:9 and 8 or 8 and 7 or 7 and 6

Quantitative analysis for the BMAT and the UKCAT 55
3 Y�Q � OP. “O” is a common digit with the previous sum (i.e. adding Y and Q gives a number with a common digit with the multiple of Y and Q). Using our shortlist:9, 8: 9 � 8 � 72; 9 � 8 � 178, 7: 8 � 7 � 56; 8 � 7 � 156, 7: 6 � 7 � 42; 6 � 7 � 13
From this, we can eliminate 6 and 7, thus leaving us with two options:9, 8: 9 � 8 � 72 9 � 8 � 178, 7: 8 � 7 � 56 8 � 7 � 15
4 Q � (Y � Q) � P: since Y � Q � 1, then this tells us that 1 number less than Q is P (which you will notice is also the units digit that is obtained by multiplying Q and Y). The only numbers that fi t this are 8 and 7, so Y � 8, Q � 7; (and we can work out the rest from that).
Therefore, the answers to the sums are:
(i) Y � Z � 8 � 1 � 7 � Q(ii) Z � Q � 1 � 7 � 7 � Q(iii) Y � Q/P � Q � (8 � 7)/(6 � 5) � 1 � Z
Part C: Practice
1 Two jars A and B, one three times larger than the other but with the same cross-sectional area are fi lled to the top with water. Water pours out of jar B at fi ve times the rate that it pours out of jar A until the water levels are the same – at this point 10 ml of water is left in each of the jars. How much water has been obtained from jar A?
A 3B 5C 7D 10
2 The combined age of Alex and Lewis is 85. How old is Lewis presently, if Alex was twice the age that Lewis was, when Alex was the age that Lewis is now?
A 30B 34C 36D 38E 42
3 Billy’s grandfather has a rare Zenith Blue stamp in his collection. When issued, this cost twenty-fi ve pence. In perfect condition today, he could sell it to collectors for £5. Assuming the prices of stamps have been infl ated by 25% since he purchased it, what percentage profi t will he

56 Chapter 1
make by selling a perfect stamp to collectors compared to obtaining its current monetary value?
A 125B 1250C 1350D 1500E 15500
4 What is the largest amount of money you can have in coins and still not be able to give change for one pound?
(The only coins allowed are 1 pence, 5 pence, 10 pence, 20 pence, and 50 pence. One pound is equal to 100 pence.)
5 If there are 20 people at a party and everybody shakes hands with one another once, how many handshakes are made altogether?
A 40B 80C 160D 185E 190
6 If I sleep-in in the morning, I miss breakfast. If I work until 3 a.m. in the middle of the night, I will sleep-in the following morning. I never sleep-in two mornings in a row. I always sleep-in on Sunday and Wednesday mornings.
It is 3 a.m. in the middle of the night and I am working. Look at the statements and decide which must be true.
1 It is not Saturday tomorrow2 I won’t eat breakfast3 It is Wednesday or Sunday tomorrow
A 1 onlyB 2 onlyC 1 and 2 onlyD 2 and 3 onlyE 1, 2 and 3
7 A car with six doors is shown in the diagram below. It has been custom made, so that upon manually closing one door another door or doors open, if already closed, or close, if already open according to the table below:
P Q R
T US
Door Closed Manually ResultP Closes both S and UQ Closes T and opens PR Closes Q and opens SS Closes both R and UT Closes R and opens PU Closes both Q and T
Quantitative analysis for the BMAT and the UKCAT 57
What order of manual door closure will result in all doors being shut?
A (T → P → R → S)B (S → T → P → Q)C (P → T → Q → P)D (S → Q → T → U)
8 At Alabaster College meal tickets for whole-day feeding cost £4.50 each. Each student must purchase a book of 40 tickets. At Marble College stu-dents cook for themselves. For use of the kitchen equipment they must pay a fi xed charge of £55 per term. Assuming that each term is 6 weeks long and one ticket is used per day, what is the maximum amount, to the nearest 5 pence, that each student at Marble College should spend on average per day in order to be economically better off than students at Alabaster College? (Assume that the students at Alabaster College spend this same amount on the extra days not covered by dinner tickets.)
A £3.00B £3.05C £3.10D £3.15E £3.20
9 Jimmy runs a zoo with zebras, tigers, hyenas and giraffes. He is allowed to keep a maximum of 50 animals. The number of hyenas he is allowed to keep must not exceed twice the number of zebras he keeps. The attendance at the zoo varies in direct proportion to the total number of animals kept and the maximum possible attendance at the zoo is 126.
What is the number of tigers being kept today, if today he is keeping 4 giraffes and 10 hyenas and the attendance is 76?
A 11B 12C 13D 14E 15
10 Alice, Bhat, Ching and Daly are friends. Alice lent Ching £30, Bhat lent Ching £10, Daly lent Alice £20 and Bhatt £50. Which of the following actions will clear the debts between them?
A Alice gives Daly £20 and Bhat gives Daly £40B Alice gives Daly £40 and Bhat gives Daly £30C Ching gives Alice £10 and Daly £10. Bhat gives Daly £40D Ching gives Bhat £10 and Daly £40. Bhat gives Daly £40E Ching gives Daly £30 and Alice £10. Bhat gives Daly £40
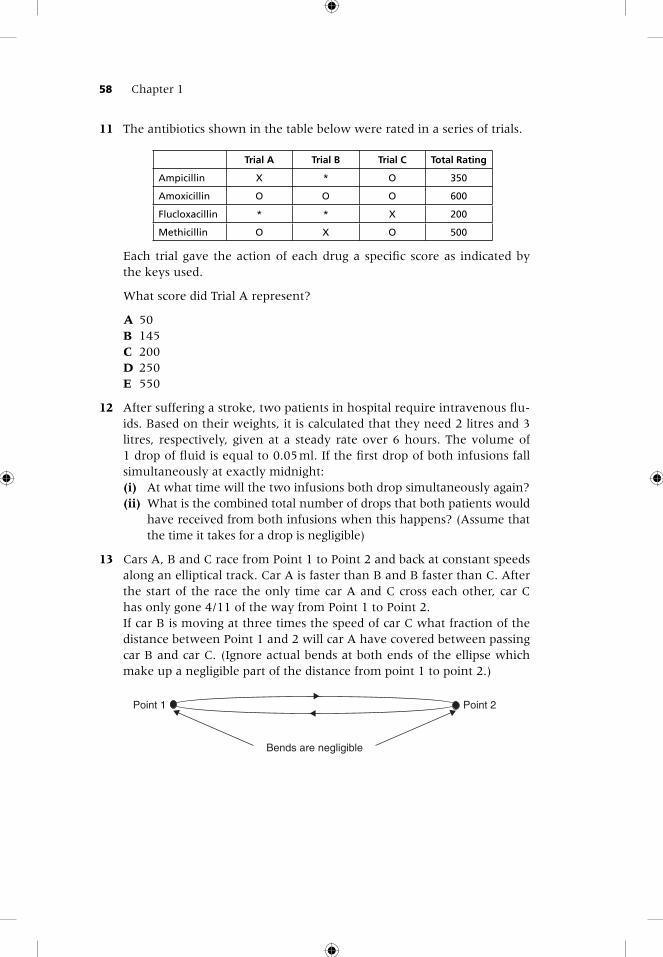
58 Chapter 1
11 The antibiotics shown in the table below were rated in a series of trials.
Trial A Trial B Trial C Total Rating
Ampicillin X * O 350
Amoxicillin O O O 600
Flucloxacillin * * X 200
Methicillin O X O 500
Each trial gave the action of each drug a specifi c score as indicated by the keys used.
What score did Trial A represent?
A 50B 145C 200D 250E 550
12 After suffering a stroke, two patients in hospital require intravenous fl u-ids. Based on their weights, it is calculated that they need 2 litres and 3 litres, respectively, given at a steady rate over 6 hours. The volume of 1 drop of fl uid is equal to 0.05 ml. If the fi rst drop of both infusions fall simultaneously at exactly midnight:(i) At what time will the two infusions both drop simultaneously again?(ii) What is the combined total number of drops that both patients would
have received from both infusions when this happens? (Assume that the time it takes for a drop is negligible)
13 Cars A, B and C race from Point 1 to Point 2 and back at constant speeds along an elliptical track. Car A is faster than B and B faster than C. After the start of the race the only time car A and C cross each other, car C has only gone 4/11 of the way from Point 1 to Point 2.If car B is moving at three times the speed of car C what fraction of the distance between Point 1 and 2 will car A have covered between passing car B and car C. (Ignore actual bends at both ends of the ellipse which make up a negligible part of the distance from point 1 to point 2.)
Point 1 Point 2
Bends are negligible


![RESEARCH ARTICLE Open Access The UKCAT-12 study ...€¦ · (UKCAT) [20], which is the principle interest of the present study, and the Biomedical Admissions Test (BMAT) [21,22]](https://img.pdfslide.us/doc/110x75/613af4b0f8f21c0c8268bb67/research-article-open-access-the-ukcat-12-study-ukcat-20-which-is-the-principle.jpg)