Embed Size (px)
Citation preview

Notes and figures are based on or taken from materials in the course textbook: Charles Boncelet, Probability, Statistics, and Random Signals, Oxford University Press, February 2016.
B.J. Bazuin, Spring 2022 1 of 33 ECE 3800
Charles Boncelet, “Probability, Statistics, and Random Signals," Oxford University Press, 2016. ISBN: 978-0-19-020051-0
Chapter 1: PROBABILITY BASICS
Sections 1.1 What Is Probability? 1.2 Experiments, Outcomes, and Events 1.3 Venn Diagrams 1.4 Random Variables 1.5 Basic Probability Rules 1.6 Probability Formalized 1.7 Simple Theorems 1.8 Compound Experiments 1.9 Independence 1.10 Example: Can S Communicate With D?
1.10.1 List All Outcomes 1.10.2 Probability of a Union 1.10.3 Probability of the Complement
1.11 Example: Now Can S Communicate With D? 1.11.1 A Big Table 1.11.2 Break Into Pieces 1.11.3 Probability of the Complement
1.12 Computational Procedures Summary Problems

Notes and figures are based on or taken from materials in the course textbook: Charles Boncelet, Probability, Statistics, and Random Signals, Oxford University Press, February 2016.
B.J. Bazuin, Spring 2022 2 of 33 ECE 3800
An understanding of Probability and Statistics is necessary in most if not all work related to science and engineering.
Statistics: the study of and the dealing with data.
Probability: the study of the likeliness of result, action or event occurring.
Often based on prior knowledge or the statistics of similar or past events!
Terms: Random Variables, Random Processes or Stochastic Processes
For any measured phenomenon there will be Uncertainty, Expected Variations, Randomness, or even Expected Errors included.
when an outcome is non-deterministic
where an exact value is subject to errors … e.g. noise, measurement noise and error
Easy examples of such phenomenon include all games of chance Flipping coins, rolling dice, dealing cards, etc.
Engineering Applications include Realistic signals – with noise or characteristic “unknown” parts
Signal-to-noise Ratios, Noise-Power Measurements, Background Noise
Expected Values, Variances, Distributions
Thermal Motion, Electron Movement
Reliability, Quality, Failure Rates, etc.
Probability theory is necessary for engineering system modeling and simulations. unknown initial conditions (random)
noisy measurements, expected inaccuracies, etc. during operation
Notes and figures are based on or taken from materials in the course textbook: Charles Boncelet, Probability, Statistics, and Random Signals, Oxford University Press, February 2016.
B.J. Bazuin, Spring 2022 3 of 33 ECE 3800
Different Kinds of Probability
Suggested that there are essentially 4 types
Probability by Intuition o “Lucky Numbers”
Probability as the Ratio of Favorable to Total Outcomes (Classical Theory)
o Measured Statistical Expectations
Probability as a Measure of the Frequency of Outcomes
Probability Based on Axiomatic Theory o Theory and mathematical derivations. o Should be validated by experimentation.
Notes and figures are based on or taken from materials in the course textbook: Charles Boncelet, Probability, Statistics, and Random Signals, Oxford University Press, February 2016.
B.J. Bazuin, Spring 2022 4 of 33 ECE 3800
Definitions used in Probability
Experiment
An experiment is some action that results in an outcome.
A random experiment is one in which the outcome is uncertain before the experiment is performed.
Possible Outcomes
A description of all possible experimental outcomes.
The set of possible outcomes may be discrete or form a continuum.
Trials
The single performance of a well-defined experiment.
Event
An elementary event is one for which there is only one outcome.
A composite event is one for which the desired result can be achieved in multiple ways. Multiple outcomes result in the event described.
Equally Likely Events/Outcomes
When the set of events or each of the possible outcomes is equally likely to occur.
A term that is used synonymously to equally likely outcomes is a uniform random variable.

Notes and figures are based on or taken from materials in the course textbook: Charles Boncelet, Probability, Statistics, and Random Signals, Oxford University Press, February 2016.
B.J. Bazuin, Spring 2022 5 of 33 ECE 3800
Probability as the Ratio of Favorable to Total Outcomes (Classical Theory) – 2 Dice example
Probability, Statistics and Random Processes for Engineers, 4th ed., Henry Stark and John W. Woods, Pearson
Education, Inc., 2012.
An elemental event can be defined as the total of the two die …
There are 36 possible outcomes
The total number of outcomes resulting in each unique event is known.
The probability of each event can be computed and described … if the die are “fair”.
So … the “true odds” can be computed … and a gambling game with skewed odds in “the houses” favor can be created …
from: https://en.wikipedia.org/wiki/Craps
Notes and figures are based on or taken from materials in the course textbook: Charles Boncelet, Probability, Statistics, and Random Signals, Oxford University Press, February 2016.
B.J. Bazuin, Spring 2022 6 of 33 ECE 3800
Probability as the Ratio of Favorable to Total Outcomes (Classical Theory) – flipping two coins example
Flip two coins:
What are the possible outcomes {HH, HT, TH, TT}
Define an event as the getting of at least one Tail.
Probability is the favorable outcomes/total outcomes = 3/4
Possible Outcomes with Probabilities:
HH – probability ¼ or 25%
HT – probability ¼ or 25%
TH – probability ¼ or 25%
TT – probability ¼ or 25%
Possible events: one head, one tail, at least one head, at least one tail, at most one head, at most one tail, two heads, two tails, no heads, or no tails.
The events can be a single possible outcome or a combination of multiple outcomes.
As a note … “not possible outcome(s)” can be defined …. a “null” event. (prob. 0%)
(e.g. three heads with two coins)
Notes and figures are based on or taken from materials in the course textbook: Charles Boncelet, Probability, Statistics, and Random Signals, Oxford University Press, February 2016.
B.J. Bazuin, Spring 2022 7 of 33 ECE 3800
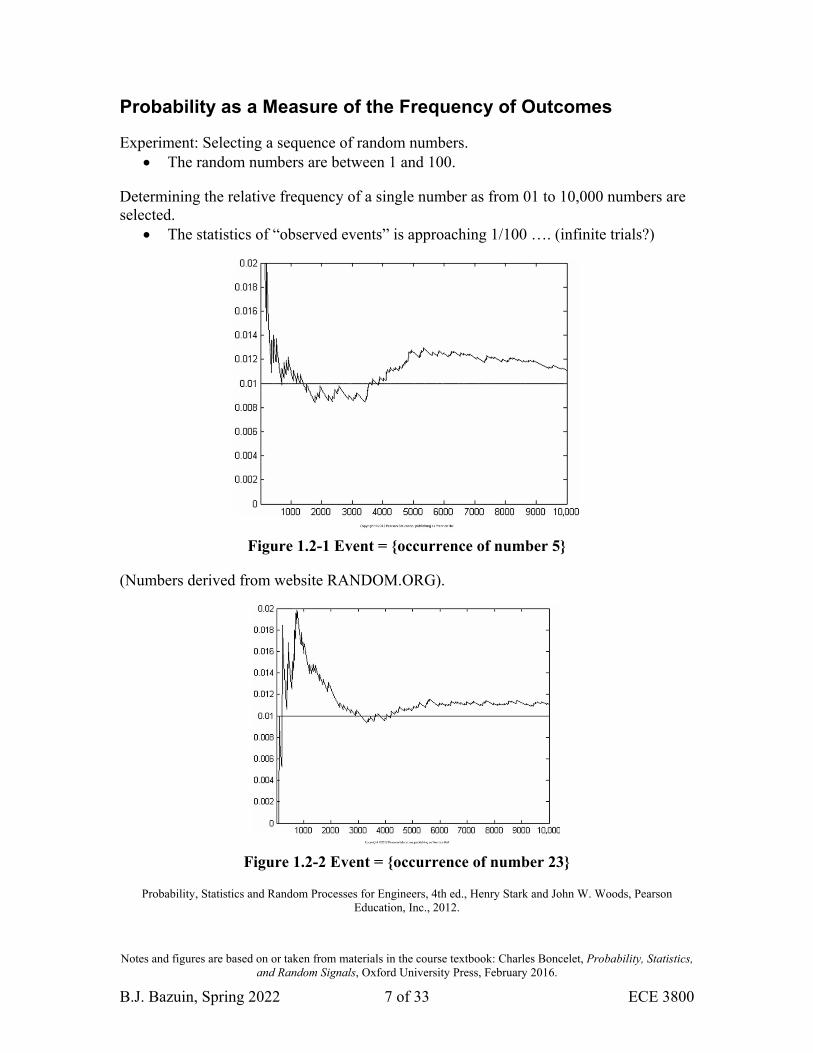
Probability as a Measure of the Frequency of Outcomes
Experiment: Selecting a sequence of random numbers. The random numbers are between 1 and 100.
Determining the relative frequency of a single number as from 01 to 10,000 numbers are selected.
The statistics of “observed events” is approaching 1/100 …. (infinite trials?)
Figure 1.2-1 Event = {occurrence of number 5}
(Numbers derived from website RANDOM.ORG).
Figure 1.2-2 Event = {occurrence of number 23}
Probability, Statistics and Random Processes for Engineers, 4th ed., Henry Stark and John W. Woods, Pearson Education, Inc., 2012.

Notes and figures are based on or taken from materials in the course textbook: Charles Boncelet, Probability, Statistics, and Random Signals, Oxford University Press, February 2016.
B.J. Bazuin, Spring 2022 8 of 33 ECE 3800
Probability Based on an Axiomatic Theory
Develop the coherent mathematical theory:
Statistics collected data on random experiments o Possible outcomes, sample space, events, etc.
From the statistics, probability structure can be observed and defined o Random processes follow defined probabilistic models of
performance.
Mathematical properties applied to probability derives new/alternate expectations
o Probabilistic expectations can be verified by statistical measurement.
This can be considered as modeling a system prior to or instead of performing an experiment. Note that the results are only as good as the model or “theory” matching the actual experiment.
Misuses, Miscalculations, and Paradoxes in Probability
Old time quotation … “There are three kinds of lies: lies, damned lies, and statistics!” https://en.wikipedia.org/wiki/Lies,_damned_lies,_and_statistics
From the CNN headlines …
“Math is racist: How data is driving inequality”, by Aimee Rawlins, September 6, 2016 http://money.cnn.com/2016/09/06/technology/weapons-of-math-destruction/index.html
Think of a “blind” allocation system vs. a statistically derived allocation system. Who are the winners and the losers ? Were some “losers” “statistically included or excluded”?
Another example … As a person, you are a unique individual and not a statistical probability …
but future “chances” may be based on others like you that have come before.
The class as a whole may exhibit statistical expectations … although it is made up of unique individuals.
For Sci-Fi readers …. Issac Asimov’s Foundation Trilogy – “psychohistory” used to predict the future ….
https://en.wikipedia.org/wiki/Psychohistory_(fictional)

Notes and figures are based on or taken from materials in the course textbook: Charles Boncelet, Probability, Statistics, and Random Signals, Oxford University Press, February 2016.
B.J. Bazuin, Spring 2022 9 of 33 ECE 3800
Sets, Fields and Events
Conceptually Defining a Problem
Relative Frequency Approach (statistics)
Set Theory Approach (formal math)
Venn Diagrams (pictures based on set theory)
Find the best method that works for you to conceptualize probability.
If you like “pictures” try to use Venn Diagrams to help understand the concepts.
Figure 1.4-1 Venn diagrams for set operations.
Probability, Statistics and Random Processes for Engineers, 4th ed., Henry Stark and John W. Woods, Pearson Education, Inc., 2012.
Notes and figures are based on or taken from materials in the course textbook: Charles Boncelet, Probability, Statistics, and Random Signals, Oxford University Press, February 2016.
B.J. Bazuin, Spring 2022 10 of 33 ECE 3800
Set Theory Definitions – (A review?!)
Set
A collection of objects known as elements
naaaA ,,, 21
Subset
The set whose elements are all members of another set (usually larger but possible the same size).
knaaaB ,,, 21 therefore AB
Space
The set containing the largest number of elements or all elements from all the subsets of interest. For probability, the set containing the event description of all possible experimental outcomes.
SAi , for all i subsets
Null Set or Empty Set
The set containing no elements … A
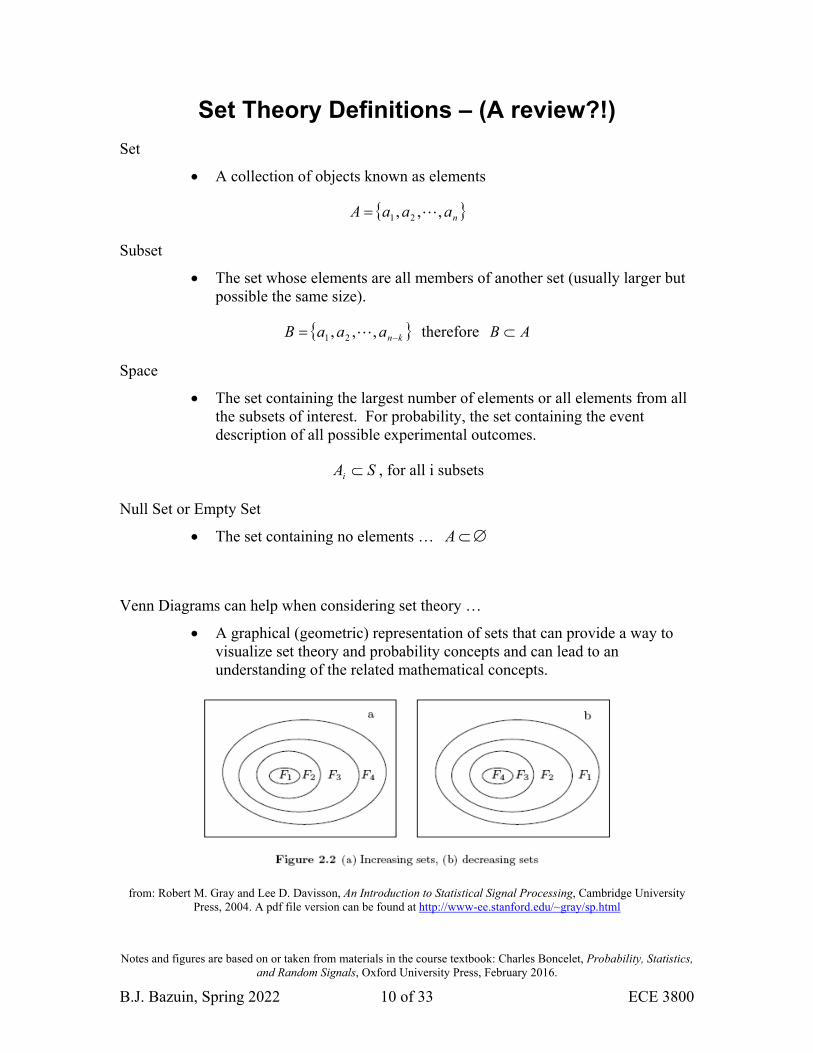
Venn Diagrams can help when considering set theory …
A graphical (geometric) representation of sets that can provide a way to visualize set theory and probability concepts and can lead to an understanding of the related mathematical concepts.
from: Robert M. Gray and Lee D. Davisson, An Introduction to Statistical Signal Processing, Cambridge University Press, 2004. A pdf file version can be found at http://www-ee.stanford.edu/~gray/sp.html
Notes and figures are based on or taken from materials in the course textbook: Charles Boncelet, Probability, Statistics, and Random Signals, Oxford University Press, February 2016.
B.J. Bazuin, Spring 2022 11 of 33 ECE 3800
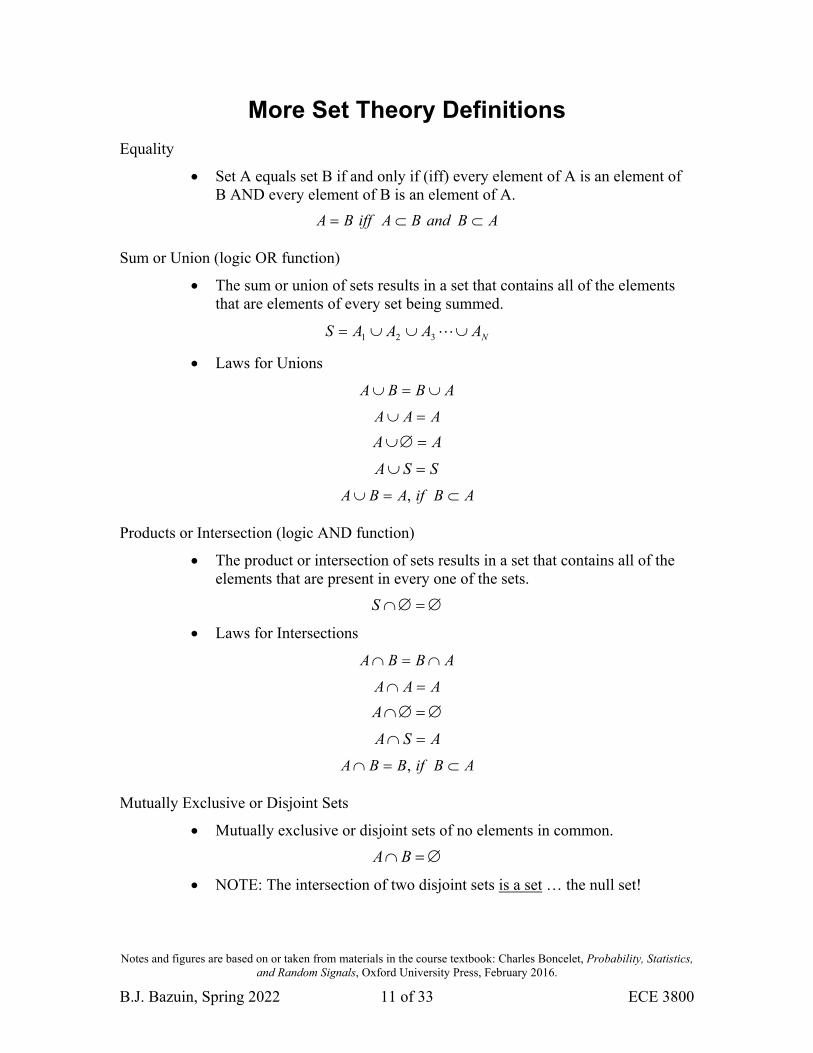
More Set Theory Definitions
Equality
Set A equals set B if and only if (iff) every element of A is an element of B AND every element of B is an element of A.
ABandBAiffBA
Sum or Union (logic OR function)
The sum or union of sets results in a set that contains all of the elements that are elements of every set being summed.
NAAAAS 321
Laws for Unions
ABBA
AAA
AA
SSA
ABifABA ,
Products or Intersection (logic AND function)
The product or intersection of sets results in a set that contains all of the elements that are present in every one of the sets.
S
Laws for Intersections
ABBA
AAA
A
ASA
ABifBBA ,
Mutually Exclusive or Disjoint Sets
Mutually exclusive or disjoint sets of no elements in common.
BA
NOTE: The intersection of two disjoint sets is a set … the null set!
Notes and figures are based on or taken from materials in the course textbook: Charles Boncelet, Probability, Statistics, and Random Signals, Oxford University Press, February 2016.
B.J. Bazuin, Spring 2022 12 of 33 ECE 3800
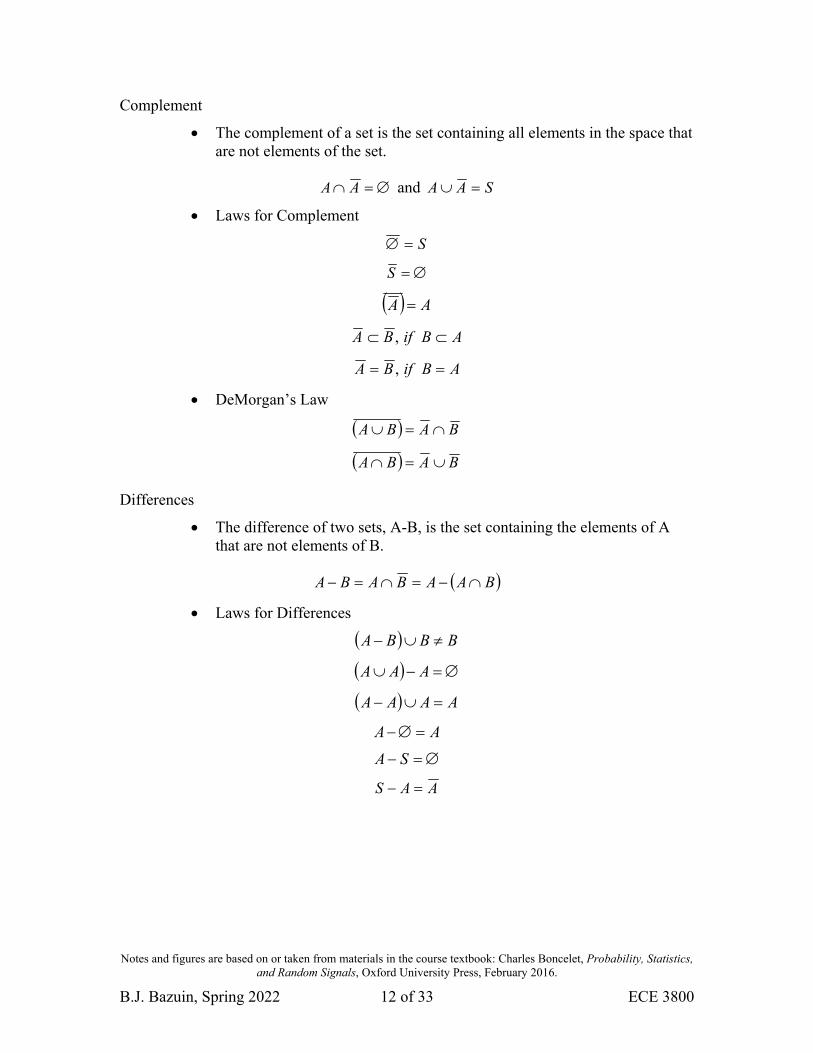
Complement
The complement of a set is the set containing all elements in the space that are not elements of the set.
AA and SAA
Laws for Complement
S
S
AA
ABifBA ,
ABifBA ,
DeMorgan’s Law
BABA
BABA
Differences
The difference of two sets, A-B, is the set containing the elements of A that are not elements of B.
BAABABA
Laws for Differences
BBBA
AAA
AAAA
AA
SA
AAS
Notes and figures are based on or taken from materials in the course textbook: Charles Boncelet, Probability, Statistics, and Random Signals, Oxford University Press, February 2016.
B.J. Bazuin, Spring 2022 13 of 33 ECE 3800
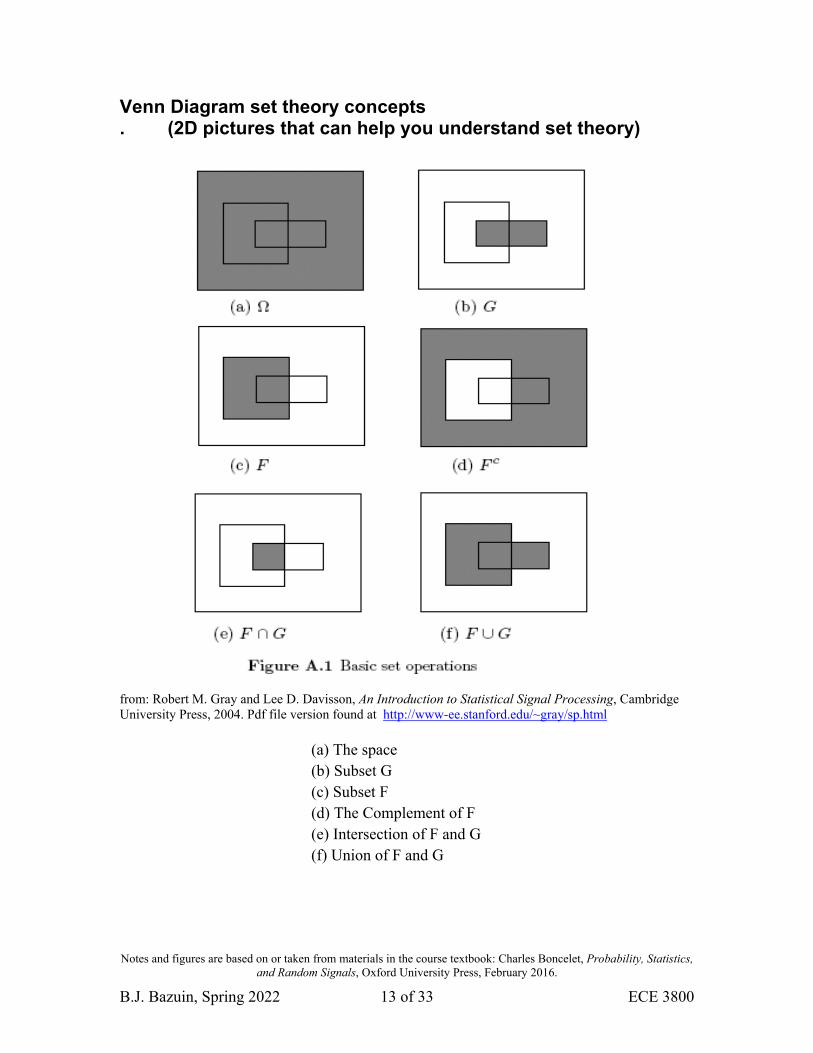
Venn Diagram set theory concepts . (2D pictures that can help you understand set theory)
from: Robert M. Gray and Lee D. Davisson, An Introduction to Statistical Signal Processing, Cambridge University Press, 2004. Pdf file version found at http://www-ee.stanford.edu/~gray/sp.html
(a) The space (b) Subset G (c) Subset F (d) The Complement of F (e) Intersection of F and G (f) Union of F and G
Notes and figures are based on or taken from materials in the course textbook: Charles Boncelet, Probability, Statistics, and Random Signals, Oxford University Press, February 2016.
B.J. Bazuin, Spring 2022 14 of 33 ECE 3800
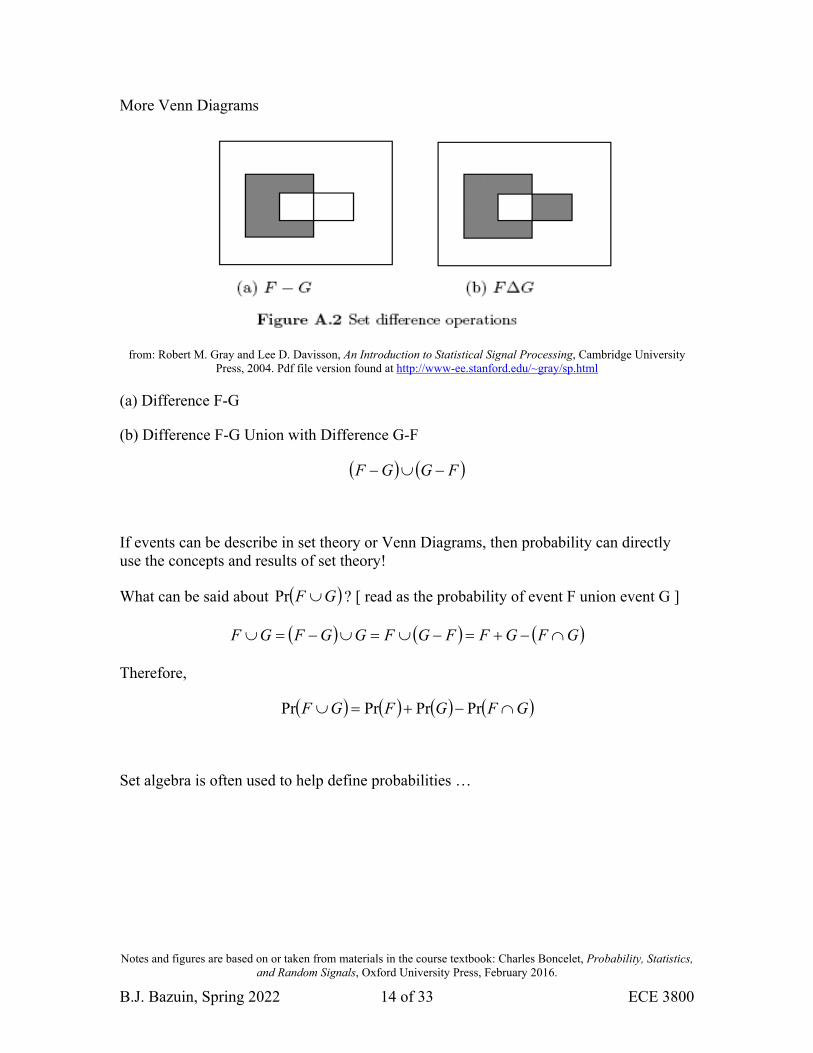
More Venn Diagrams
from: Robert M. Gray and Lee D. Davisson, An Introduction to Statistical Signal Processing, Cambridge University Press, 2004. Pdf file version found at http://www-ee.stanford.edu/~gray/sp.html
(a) Difference F-G
(b) Difference F-G Union with Difference G-F
FGGF
If events can be describe in set theory or Venn Diagrams, then probability can directly use the concepts and results of set theory!
What can be said about GF Pr ? [ read as the probability of event F union event G ]
GFGFFGFGGFGF
Therefore,
GFGFGF PrPrPrPr
Set algebra is often used to help define probabilities …
Notes and figures are based on or taken from materials in the course textbook: Charles Boncelet, Probability, Statistics, and Random Signals, Oxford University Press, February 2016.
B.J. Bazuin, Spring 2022 15 of 33 ECE 3800
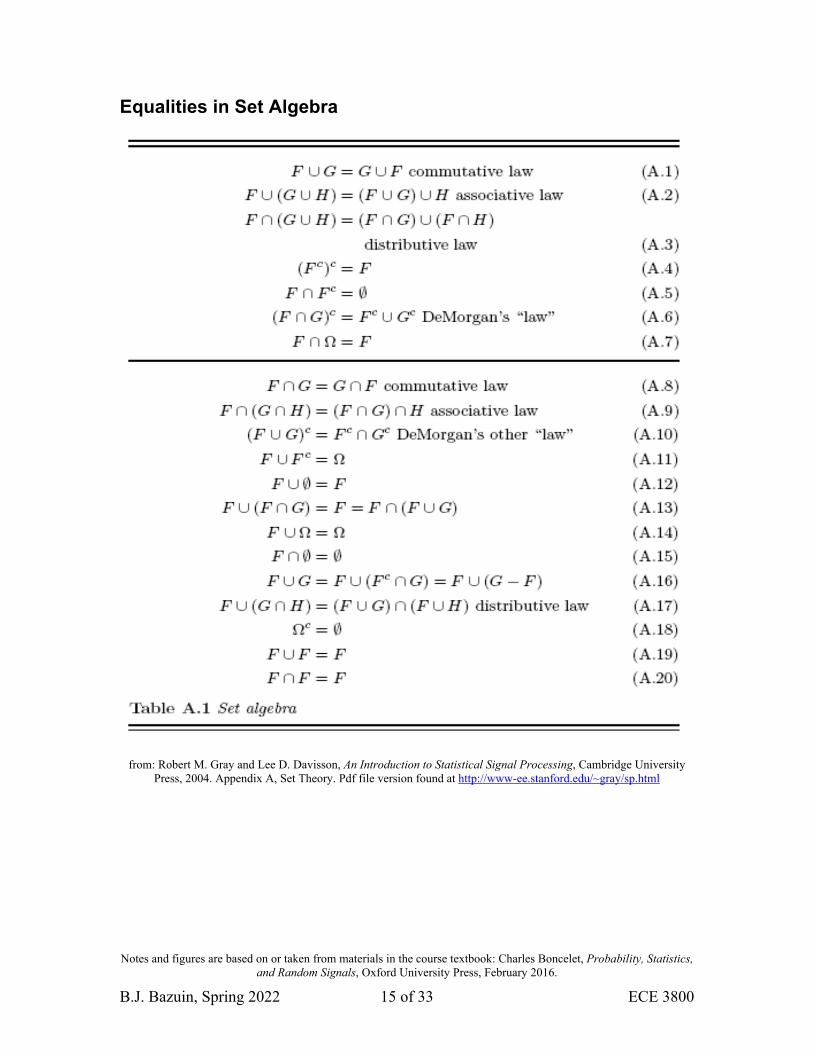
Equalities in Set Algebra
from: Robert M. Gray and Lee D. Davisson, An Introduction to Statistical Signal Processing, Cambridge University Press, 2004. Appendix A, Set Theory. Pdf file version found at http://www-ee.stanford.edu/~gray/sp.html
Notes and figures are based on or taken from materials in the course textbook: Charles Boncelet, Probability, Statistics, and Random Signals, Oxford University Press, February 2016.
B.J. Bazuin, Spring 2022 16 of 33 ECE 3800
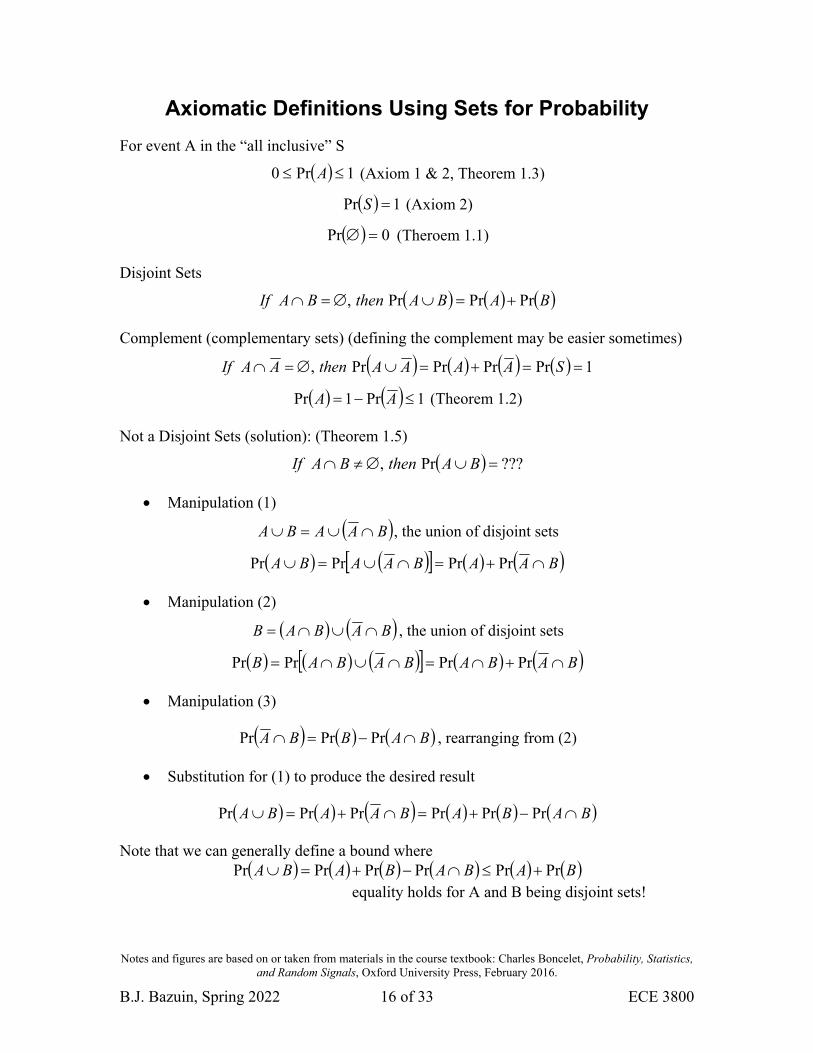
Axiomatic Definitions Using Sets for Probability
For event A in the “all inclusive” S
1Pr0 A (Axiom 1 & 2, Theorem 1.3)
1Pr S (Axiom 2)
0Pr (Theroem 1.1)
Disjoint Sets
BABAthenBAIf PrPrPr,
Complement (complementary sets) (defining the complement may be easier sometimes)
1PrPrPrPr, SAAAAthenAAIf
1Pr1Pr AA (Theorem 1.2)
Not a Disjoint Sets (solution): (Theorem 1.5)
???Pr, BAthenBAIf
Manipulation (1)
BAABA , the union of disjoint sets
BAABAABA PrPrPrPr
Manipulation (2)
BABAB , the union of disjoint sets
BABABABAB PrPrPrPr
Manipulation (3)
BABBA PrPrPr , rearranging from (2)
Substitution for (1) to produce the desired result
BABABAABA PrPrPrPrPrPr
Note that we can generally define a bound where BABABABA PrPrPrPrPrPr
equality holds for A and B being disjoint sets!

Notes and figures are based on or taken from materials in the course textbook: Charles Boncelet, Probability, Statistics, and Random Signals, Oxford University Press, February 2016.
B.J. Bazuin, Spring 2022 17 of 33 ECE 3800
Example: 6-sided die
6
1Pr i
A: The probability of rolling a 1 or a 3, event 313,1 A
3
1
6
1
6
13Pr1PrPr A
B: The probability of rolling a 3 or 5, event 535,3 B
3
1
6
1
6
15Pr3PrPr B
C: The probability of event A or event B, event BAC
BABABAC PrPrPrPrPr
2
1
6
1
3
1
3
1Pr C
Note: 5,3,1 BAC
2
1
6
1
6
1
6
15Pr3Pr1PrPr C
When in doubt, write it out to double check your results!
A Venn diagram may also help.

Notes and figures are based on or taken from materials in the course textbook: Charles Boncelet, Probability, Statistics, and Random Signals, Oxford University Press, February 2016.
B.J. Bazuin, Spring 2022 18 of 33 ECE 3800
Probability of A union of events (Theorem 1.6: Inclusion-Exclusion Formula)
An extension of the set theory for unions ….
Probability, Statistics and Random Processes for Engineers, 4th ed., Henry Stark and John W. Woods, Pearson Education, Inc., 2012.
Figure 1.5-1 Partitioning
7
1
3
1 j ji iE into seven disjoint regions Δ1,...,Δ7.)
If BABABA PrPrPrPr , what about ???Pr CBA
CBA
CBCABA
CBACBA
Pr
PrPrPr
PrPrPrPr
1
1
2
1
3
1
2
1
3
1
3
1321
Pr
Pr
PrPr
i ij jk kji
i ij ji
i i
EEE
EE
EEEE
Can you recognize a pattern … “+”singles … “-“doubles … “+”triples … “-“quads … etc
What about ???Pr FEDCBA

Notes and figures are based on or taken from materials in the course textbook: Charles Boncelet, Probability, Statistics, and Random Signals, Oxford University Press, February 2016.
B.J. Bazuin, Spring 2022 19 of 33 ECE 3800
More Definitions
Probability, the relative frequency method:
The number of trials and the number of times an event occurs can be described as
CBA NNNN
the relative frequency is then
N
NAr A
note that
1
CrBrArN
NNN
N
N CBA
When experimental results appear with “statistical regularity”, the relative frequency tends to approach the probability of the event.
ArAN
limPr
and
1PrPrPr CBA
Where APr is defined as the probability of event A.
Mathematical definition of probability:
1. 1Pr0 A
2. 1PrPrPr CBA , for mutually exclusive events
3. An impossible event, A, can be represented as 0Pr A .
4. A certain event, A, can be represented as 1Pr A .
Odds or probabilities can be assigned to every possible outcome of a “future” trial, experiment, contests, game that has some prior historical basis of events or outcomes.
Notes and figures are based on or taken from materials in the course textbook: Charles Boncelet, Probability, Statistics, and Random Signals, Oxford University Press, February 2016.
B.J. Bazuin, Spring 2022 20 of 33 ECE 3800
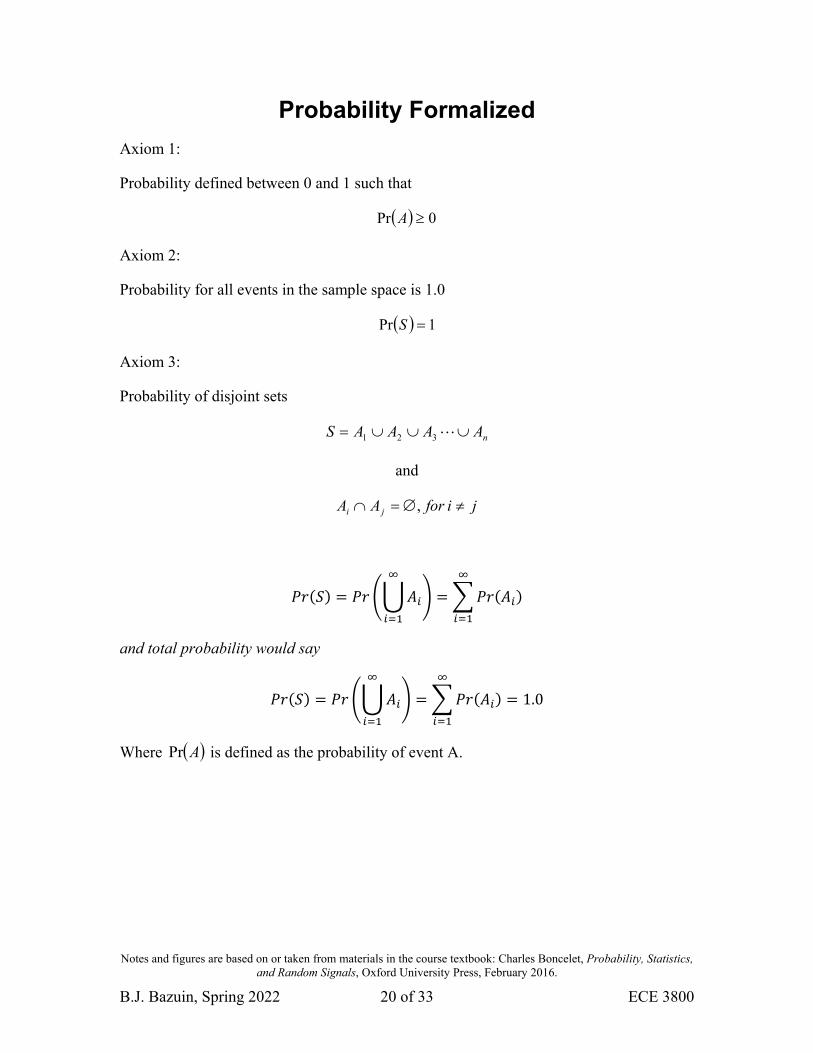
Probability Formalized
Axiom 1:
Probability defined between 0 and 1 such that
0Pr A
Axiom 2:
Probability for all events in the sample space is 1.0
1Pr S
Axiom 3:
Probability of disjoint sets
nAAAAS 321
and
jiforAA ji ,
𝑃𝑟 𝑆 𝑃𝑟 𝐴 𝑃𝑟 𝐴
and total probability would say
𝑃𝑟 𝑆 𝑃𝑟 𝐴 𝑃𝑟 𝐴 1.0
Where APr is defined as the probability of event A.

Notes and figures are based on or taken from materials in the course textbook: Charles Boncelet, Probability, Statistics, and Random Signals, Oxford University Press, February 2016.
B.J. Bazuin, Spring 2022 21 of 33 ECE 3800
Joint Probability – Compound Experiments
Defining probability based on multiple events … two classes for considerations.
Independent experiments: The outcome of one experiment is not affected by past or future experiments.
o flipping coins o repeating an experiment after initial conditions have been restored o Note: these problems are typically easier to solve
Dependent experiments: The result of each subsequent experiment is affected by
the results of previous experiments. o drawing cards from a deck of cards o drawing straws o selecting names from a hat o for each subsequent experiment, the previous results change the possible
outcomes for the next event. o Note: these problems can be very difficult to solve (the “next experiment”
changes based on previous outcomes!)
Notes and figures are based on or taken from materials in the course textbook: Charles Boncelet, Probability, Statistics, and Random Signals, Oxford University Press, February 2016.
B.J. Bazuin, Spring 2022 22 of 33 ECE 3800
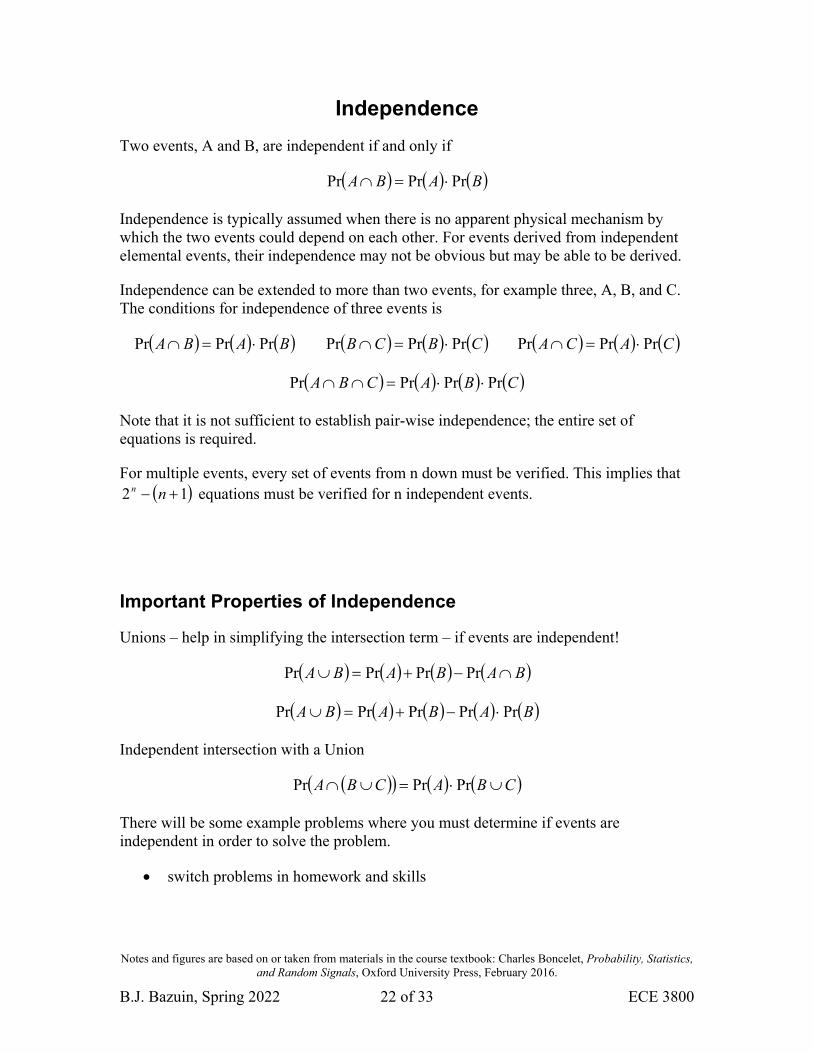
Independence
Two events, A and B, are independent if and only if
BABA PrPrPr
Independence is typically assumed when there is no apparent physical mechanism by which the two events could depend on each other. For events derived from independent elemental events, their independence may not be obvious but may be able to be derived.
Independence can be extended to more than two events, for example three, A, B, and C. The conditions for independence of three events is
BABA PrPrPr CBCB PrPrPr CACA PrPrPr
CBACBA PrPrPrPr
Note that it is not sufficient to establish pair-wise independence; the entire set of equations is required.
For multiple events, every set of events from n down must be verified. This implies that 12 nn equations must be verified for n independent events.
Important Properties of Independence
Unions – help in simplifying the intersection term – if events are independent!
BABABA PrPrPrPr
BABABA PrPrPrPrPr
Independent intersection with a Union
CBACBA PrPrPr
There will be some example problems where you must determine if events are independent in order to solve the problem.
switch problems in homework and skills
Notes and figures are based on or taken from materials in the course textbook: Charles Boncelet, Probability, Statistics, and Random Signals, Oxford University Press, February 2016.
B.J. Bazuin, Spring 2022 23 of 33 ECE 3800
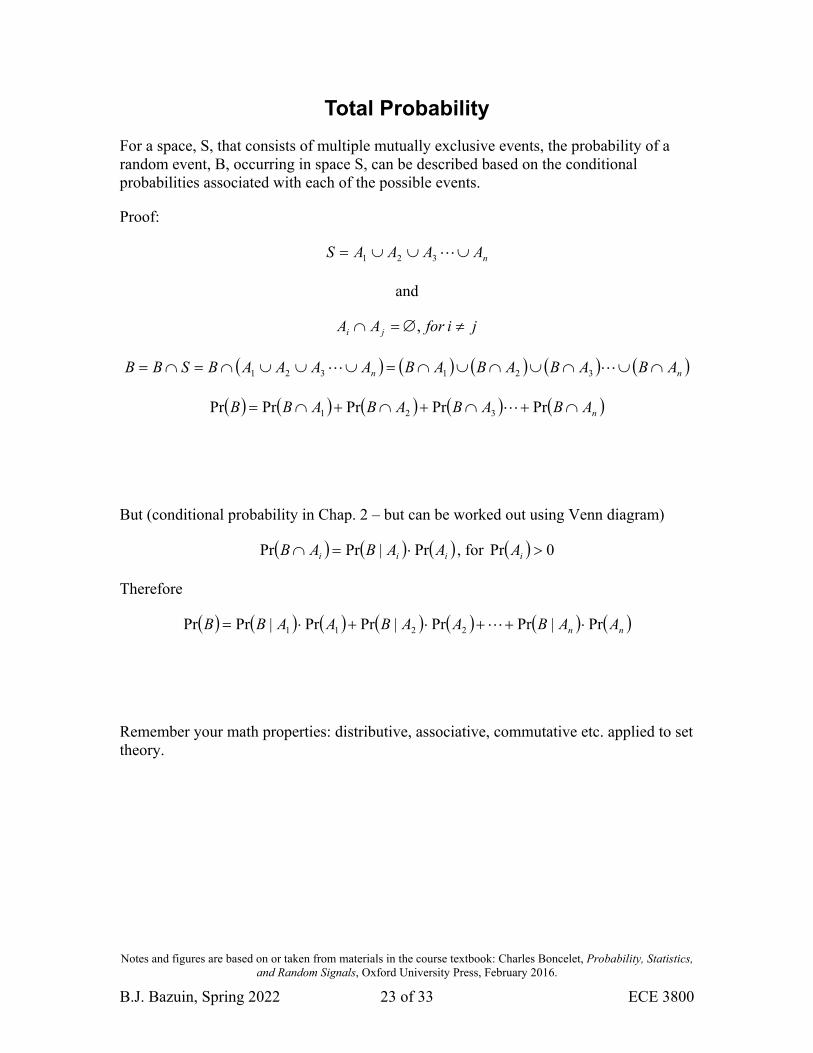
Total Probability
For a space, S, that consists of multiple mutually exclusive events, the probability of a random event, B, occurring in space S, can be described based on the conditional probabilities associated with each of the possible events.
Proof:
nAAAAS 321
and
jiforAA ji ,
nn ABABABABAAAABSBB 321321
nABABABABB PrPrPrPrPr 321
But (conditional probability in Chap. 2 – but can be worked out using Venn diagram)
iii AABAB Pr|PrPr , for 0Pr iA
Therefore
nn AABAABAABB Pr|PrPr|PrPr|PrPr 2211
Remember your math properties: distributive, associative, commutative etc. applied to set theory.
Notes and figures are based on or taken from materials in the course textbook: Charles Boncelet, Probability, Statistics, and Random Signals, Oxford University Press, February 2016.
B.J. Bazuin, Spring 2022 24 of 33 ECE 3800
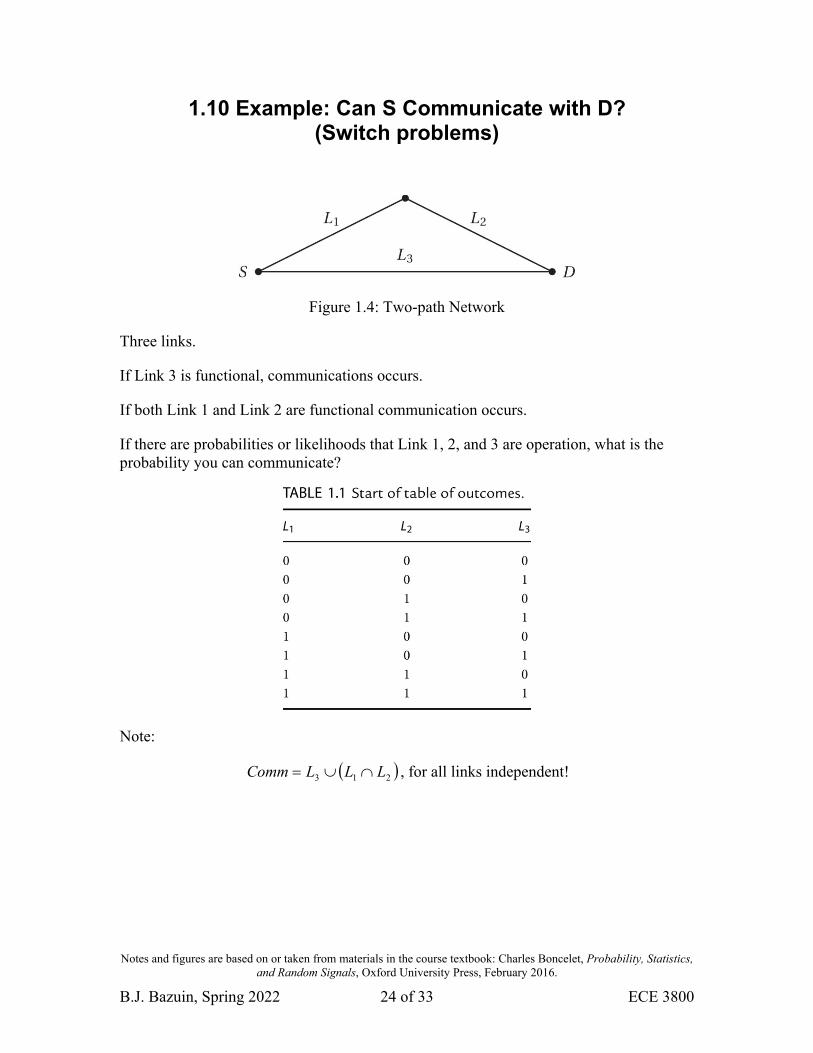
1.10 Example: Can S Communicate with D? (Switch problems)
Figure 1.4: Two-path Network
Three links.
If Link 3 is functional, communications occurs.
If both Link 1 and Link 2 are functional communication occurs.
If there are probabilities or likelihoods that Link 1, 2, and 3 are operation, what is the probability you can communicate?
Note:
213 LLLComm , for all links independent!

Notes and figures are based on or taken from materials in the course textbook: Charles Boncelet, Probability, Statistics, and Random Signals, Oxford University Press, February 2016.
B.J. Bazuin, Spring 2022 25 of 33 ECE 3800
Consider three independent links and there probabilities
Basic probability
000Pr000Pr 321 LLL
0Pr0Pr0Pr000Pr 321 LLL
31111000Pr pppp
101Pr101Pr 321 LLL ,
1Pr0Pr1Pr101Pr 321 LLL
322 11101Pr ppppppp
213 LLLDSComm , for all links independent!
111,101,011,001,110 DSComm
111,101,011,001,110PrPr DS
111Pr101Pr011Pr001Pr110PrPr DS
32Pr pppDS
Alternate Derivation
Notes and figures are based on or taken from materials in the course textbook: Charles Boncelet, Probability, Statistics, and Random Signals, Oxford University Press, February 2016.
B.J. Bazuin, Spring 2022 26 of 33 ECE 3800
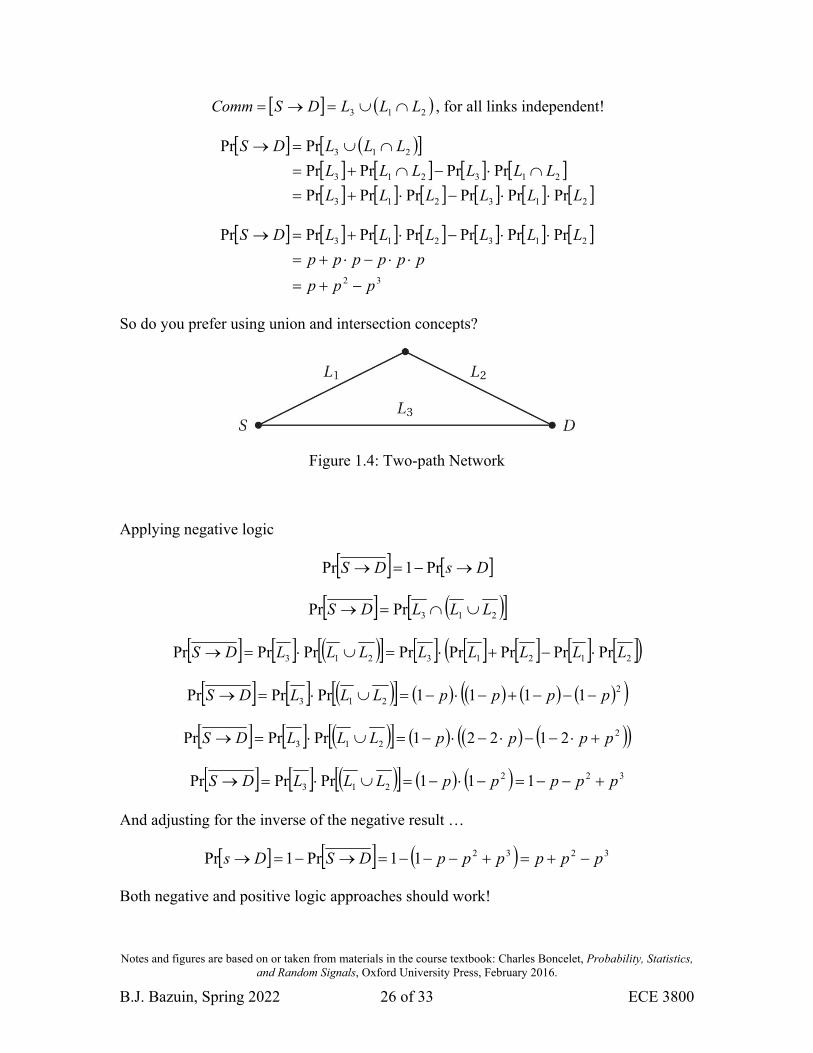
213 LLLDSComm , for all links independent!
213213
213213
213
PrPrPrPrPrPr
PrPrPrPr
PrPr
LLLLLL
LLLLLL
LLLDS
32
213213 PrPrPrPrPrPrPr
ppp
pppppp
LLLLLLDS
So do you prefer using union and intersection concepts?
Figure 1.4: Two-path Network
Applying negative logic
DsDS Pr1Pr
213PrPr LLLDS
21213213 PrPrPrPrPrPrPrPr LLLLLLLLDS
2213 1111PrPrPr ppppLLLDS
2213 21221PrPrPr ppppLLLDS
322213 111PrPrPr pppppLLLDS
And adjusting for the inverse of the negative result …
323211Pr1Pr ppppppDSDs
Both negative and positive logic approaches should work!

Notes and figures are based on or taken from materials in the course textbook: Charles Boncelet, Probability, Statistics, and Random Signals, Oxford University Press, February 2016.
B.J. Bazuin, Spring 2022 27 of 33 ECE 3800
A Big Table
Breaking it down into smaller pieces.
CBADSComm
CBACBCABACBA
CBACBCABACBA
CBADS
PrPrPrPrPrPrPrPrPrPrPrPr
PrPrPrPrPrPrPr
PrPr
Alternately consider
CBA
CBADS
PrPrPr
PrPr
Then
Notes and figures are based on or taken from materials in the course textbook: Charles Boncelet, Probability, Statistics, and Random Signals, Oxford University Press, February 2016.
B.J. Bazuin, Spring 2022 28 of 33 ECE 3800
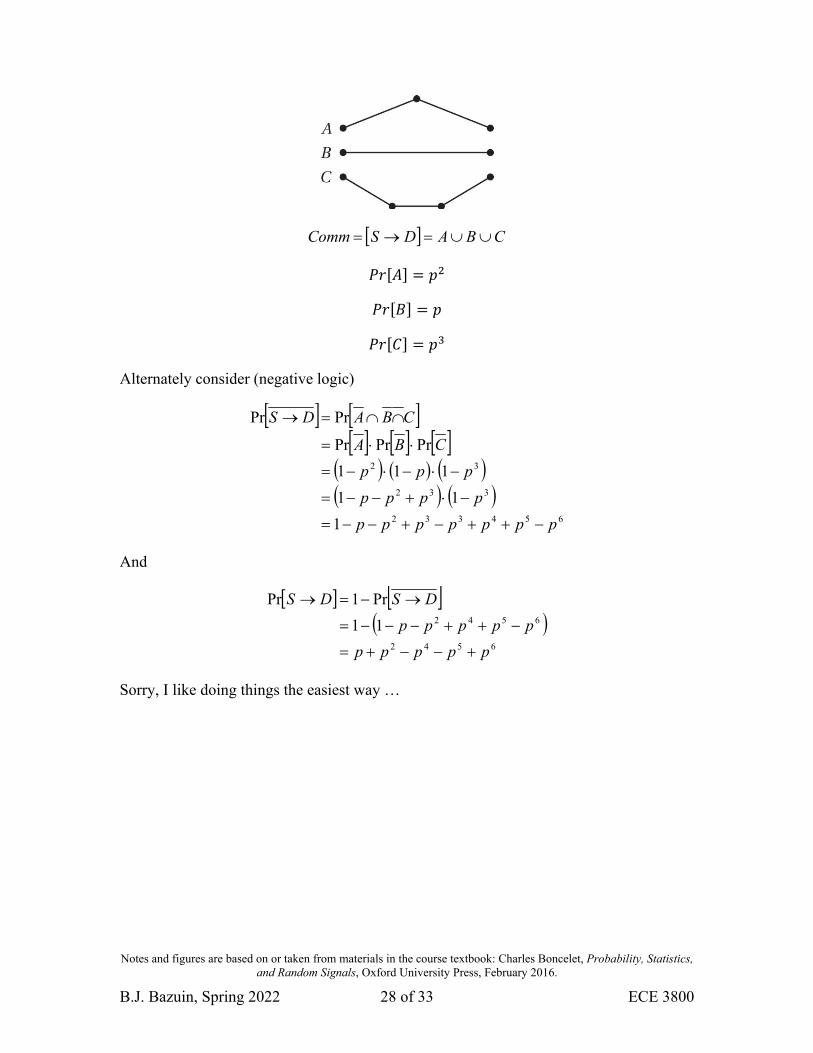
CBADSComm
𝑃𝑟 𝐴 𝑝
𝑃𝑟 𝐵 𝑝
𝑃𝑟 𝐶 𝑝
Alternately consider (negative logic)
654332
332
32
1
11
111
PrPrPr
PrPr
ppppppp
pppp
ppp
CBA
CBADS
And
6542
654211
Pr1Pr
ppppp
ppppp
DSDS
Sorry, I like doing things the easiest way …
Notes and figures are based on or taken from materials in the course textbook: Charles Boncelet, Probability, Statistics, and Random Signals, Oxford University Press, February 2016.
B.J. Bazuin, Spring 2022 29 of 33 ECE 3800
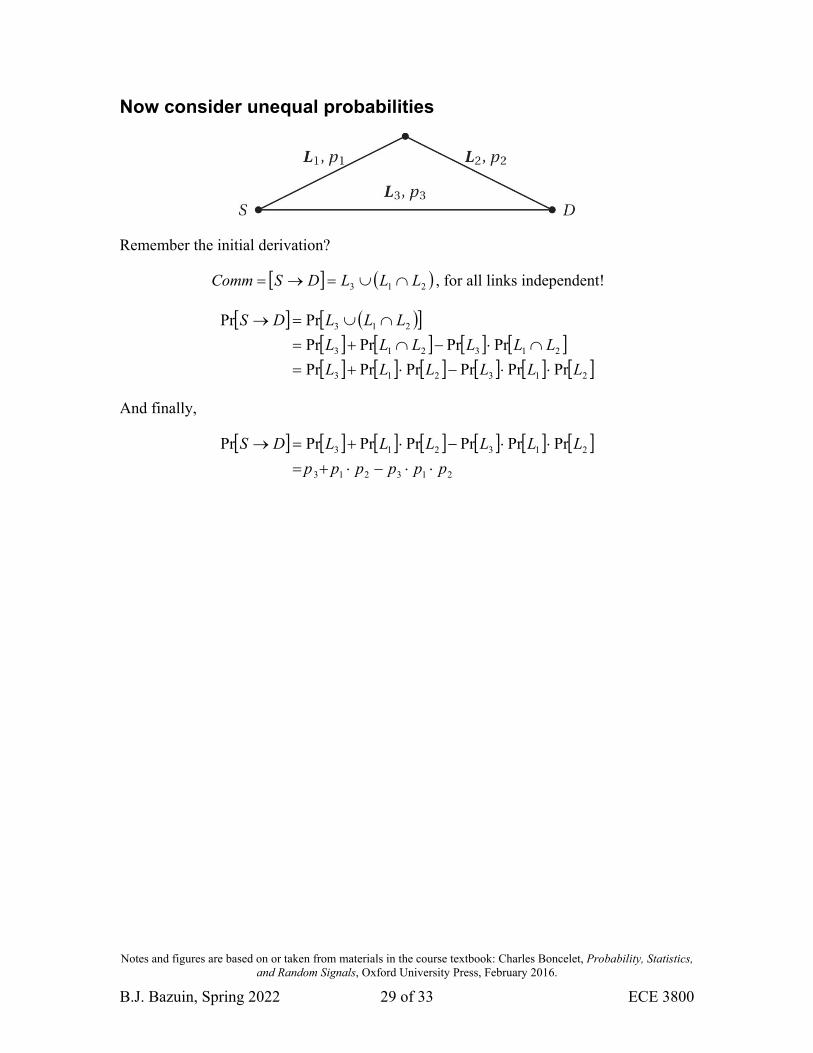
Now consider unequal probabilities
Remember the initial derivation?
213 LLLDSComm , for all links independent!
213213
213213
213
PrPrPrPrPrPr
PrPrPrPr
PrPr
LLLLLL
LLLLLL
LLLDS
And finally,
213213
213213 PrPrPrPrPrPrPr
pppppp
LLLLLLDS
Notes and figures are based on or taken from materials in the course textbook: Charles Boncelet, Probability, Statistics, and Random Signals, Oxford University Press, February 2016.
B.J. Bazuin, Spring 2022 30 of 33 ECE 3800
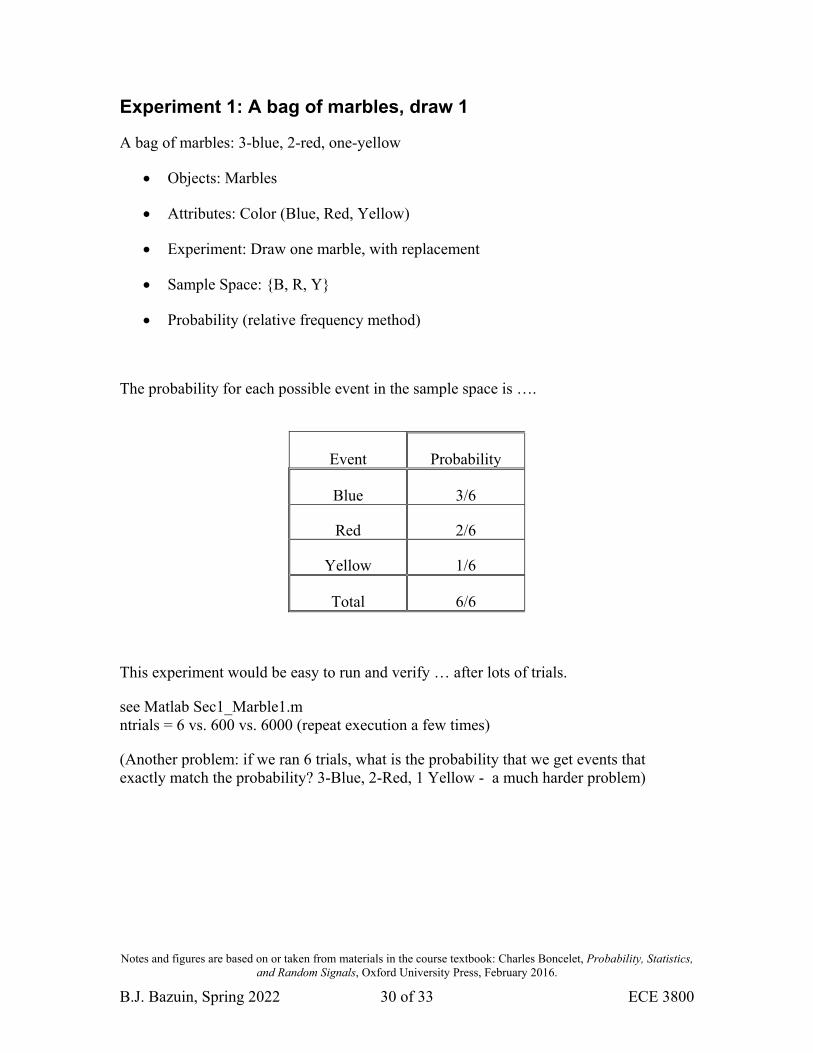
Experiment 1: A bag of marbles, draw 1
A bag of marbles: 3-blue, 2-red, one-yellow
Objects: Marbles
Attributes: Color (Blue, Red, Yellow)
Experiment: Draw one marble, with replacement
Sample Space: {B, R, Y}
Probability (relative frequency method)
The probability for each possible event in the sample space is ….
Event Probability
Blue 3/6
Red 2/6
Yellow 1/6
Total 6/6
This experiment would be easy to run and verify … after lots of trials.
see Matlab Sec1_Marble1.m ntrials = 6 vs. 600 vs. 6000 (repeat execution a few times)
(Another problem: if we ran 6 trials, what is the probability that we get events that exactly match the probability? 3-Blue, 2-Red, 1 Yellow - a much harder problem)
Notes and figures are based on or taken from materials in the course textbook: Charles Boncelet, Probability, Statistics, and Random Signals, Oxford University Press, February 2016.
B.J. Bazuin, Spring 2022 31 of 33 ECE 3800
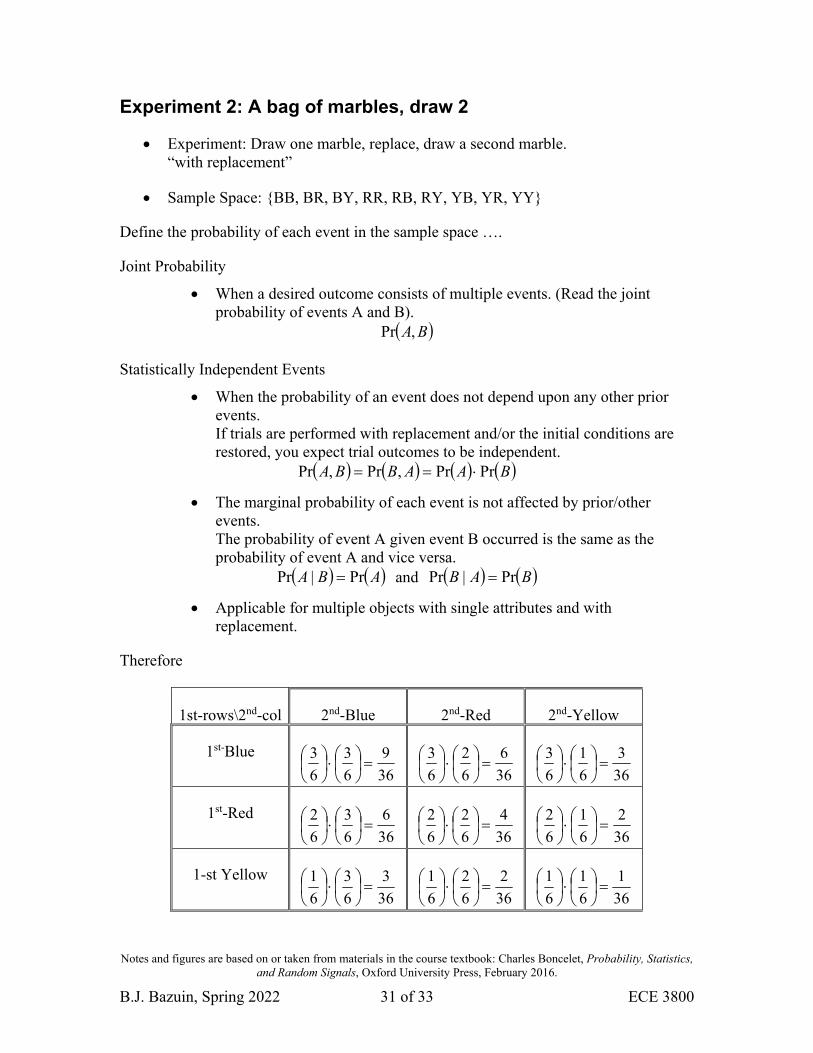
Experiment 2: A bag of marbles, draw 2
Experiment: Draw one marble, replace, draw a second marble. “with replacement”
Sample Space: {BB, BR, BY, RR, RB, RY, YB, YR, YY}
Define the probability of each event in the sample space ….
Joint Probability
When a desired outcome consists of multiple events. (Read the joint probability of events A and B).
BA,Pr
Statistically Independent Events
When the probability of an event does not depend upon any other prior events. If trials are performed with replacement and/or the initial conditions are restored, you expect trial outcomes to be independent.
BAABBA PrPr,Pr,Pr
The marginal probability of each event is not affected by prior/other events. The probability of event A given event B occurred is the same as the probability of event A and vice versa.
ABA Pr|Pr and BAB Pr|Pr
Applicable for multiple objects with single attributes and with replacement.
Therefore
1st-rows\2nd-col 2nd-Blue 2nd-Red 2nd-Yellow
1st-Blue
36
9
6
3
6
3
36
6
6
2
6
3
36
3
6
1
6
3
1st-Red
36
6
6
3
6
2
36
4
6
2
6
2
36
2
6
1
6
2
1-st Yellow
36
3
6
3
6
1
36
2
6
2
6
1
36
1
6
1
6
1
Notes and figures are based on or taken from materials in the course textbook: Charles Boncelet, Probability, Statistics, and Random Signals, Oxford University Press, February 2016.
B.J. Bazuin, Spring 2022 32 of 33 ECE 3800
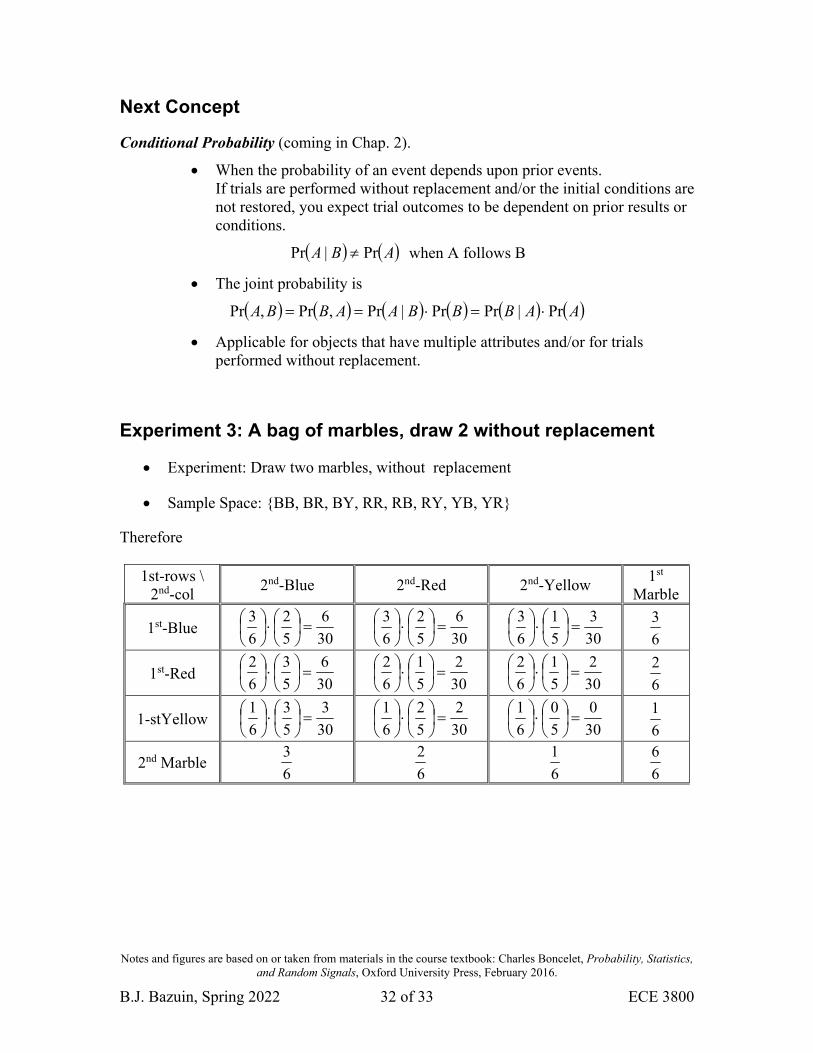
Next Concept
Conditional Probability (coming in Chap. 2).
When the probability of an event depends upon prior events. If trials are performed without replacement and/or the initial conditions are not restored, you expect trial outcomes to be dependent on prior results or conditions.
ABA Pr|Pr when A follows B
The joint probability is
AABBBAABBA Pr|PrPr|Pr,Pr,Pr
Applicable for objects that have multiple attributes and/or for trials performed without replacement.
Experiment 3: A bag of marbles, draw 2 without replacement
Experiment: Draw two marbles, without replacement
Sample Space: {BB, BR, BY, RR, RB, RY, YB, YR}
Therefore
1st-rows \ 2nd-col
2nd-Blue 2nd-Red 2nd-Yellow 1st
Marble
1st-Blue 30
6
5
2
6
3
30
6
5
2
6
3
30
3
5
1
6
3
6
3
1st-Red 30
6
5
3
6
2
30
2
5
1
6
2
30
2
5
1
6
2
6
2
1-stYellow 30
3
5
3
6
1
30
2
5
2
6
1
30
0
5
0
6
1
6
1
2nd Marble 6
3
6
2
6
1
6
6

Notes and figures are based on or taken from materials in the course textbook: Charles Boncelet, Probability, Statistics, and Random Signals, Oxford University Press, February 2016.
B.J. Bazuin, Spring 2022 33 of 33 ECE 3800
Matlab Marble Simulation Examples:
Sec1_Marble1.m
example to show small versus large number of sample statistics vs. probability
Sec1_Marble2.m
example to validate probability and/or small versus large number of trials
Sec1_Marble3.m
example to validate probability and/or small versus large number of trials