Embed Size (px)
Citation preview
1
Chapter 1
Pattern of Failure
Why It Needs Fixing Now
CATALYST
Let me be very clear regarding a fundamental bias I currently have:
Effectively aligning a company’s services strategy to the overall company
strategy will become the defining discipline in any product company’s
success.
Product companies that do not successfully align services strategy to drive company strategy find themselves following a predictable failure. The abstract for this pattern is shown in Figure 1-1. Later in this chapter, I will describe the details behind this fatal pattern.
I predict you are doing one of two things right now. Either you are nodding your head up and down in violent agreement and uttering “Amen brother!” Or, you are shrugging your shoulders and thinking “I’m not sure that is really true.”1 In this chapter, I will defend this bias.
Figure 1-1 The Failure Pattern
1 Or you are violently shaking your head left to right and shouting “What the $%## is he talking about? Services might be important but they certainly don’t make or break our overall company success.”
2 Bridging the Services Chasm
I am not claiming products no longer matter to the success of product companies. Product innovation, product capabilities, and product success will remain at the heart of a technology company’s success. However, the approach of optimizing product economics in a vacuum, devoid of any services strategy, is outdated. The only economics that matter are the economics of the entire system: the products and the services sold to the customer. Product companies need to understand what services secure prod-uct success. Also, product companies need to accurately model the impact of services offerings on total account profitability. Based on my work in the Technology Professional Services Association (TPSA) since 2005, I can report from the field that the technology industry is woefully underprepared for this new reality.
In 2001, my focus was documenting how professional services organiza-tions are structured for success within product companies. The catalyst for this work was my personal experience as part of a management team that was attempting to build a profitable professional services organization within a large product company, Silicon Graphics (now SGI). Way back in 1996, SGI decided to build out a professional services (PS) capability for all the reasons your company may have the capability. Customers were asking for help imple-menting complex technologies. Executives believed easy revenue opportunities existed if SGI could attach services to hardware sales. Also, some executives believed a service presence could increase account control. What that experi-ence taught me is that building service capabilities within product companies is fundamentally different than building a pure service company. The cul-mination of this work was captured in Building Professional Services: The Sirens’ Song.
In 2004, my focus was creating a framework professional services manage-ment teams could use to align their PS strategy to executive expectations. My consulting experiences from 2001 to 2004 showed me two fundamental truths regarding PS strategy within product companies. First, the friction points surrounding the PS strategy were almost identical from product company to product company. It didn’t matter if the company was selling hardware, soft-ware, scales, or industrial air conditioners. The disconnects between executive expectations and PS execution were very similar. Do we have PS to improve customer satisfaction or secure new sources of service profit? Does PS focus on the installed base or new emerging markets? Should the company simply be pushing all PS activities to service partners? And so on. The second truth was that PS leaders were having a very tough time articulating these strategy disconnects to their CEOs, COOs, CFOs, and sales executives. They needed a framework to anchor and accelerate the conversations. The culmination of this work was captured in Mastering Professional Services.
Pattern of Failure 3
Five years have passed. Since publishing my last book, I helped incubate a new industry association focused on technology professional services organi-zations (www.tpsaonline.com). More importantly, that association is part of a family of associations that serves multiple service lines within technology companies. First, the Service and Support Professionals Association, or SSPA (www.thesspa.com), was founded over 20 years ago and focuses on support services. SSPA helped incubate TPSA in 2005. Then, SSPA and TPSA acquired the Association for Services Management International, or AFMSI (www.afsmi.com), which has a long heritage in technical field services. This family of associations and its CEO, J.B. Wood, exposed me to the broader issues facing product companies and their services businesses.
Through our discussions and data collection with the over 200 tech-nology companies in these associations, it became clear that the role of service was changing dramatically regarding the economic success of product companies. It also became clear that a majority of product compa-nies were not sure how to align their business strategies to these new economic realities. This reality dragged me and the other association executives into conversations that went way beyond the typical domain of an industry associa-tion. We were well prepared to answer questions surrounding common prac-tices and results for service lines. “How much margin do companies achieve on professional service engagements?” “What percentage of support calls is handled by offshore resources?” “Should we implement a separate sales force to sell our service offerings?” These were the types of questions securely in our wheelhouse.
Starting in 2006, new questions arose that companies were attempting to resolve that did not map to our benchmarking data and operational frame-works. “How big should service revenues be in a product company?” “What is the most profitable mix of products and services for a product company?” “Why are my product revenues continuing to become a smaller portion of my overall revenues?” “What is the true economic impact of service activities on overall company success?” Companies were questioning the very basis of what it means to be a product company. It felt like service leaders were standing at the sea shore and noticing a significant drop in the water level. They could sense a large, strong, disruptive wave was coming. But how big? A real tsunami or just a sand castle crasher? These questions led me and my association col-leagues on a new quest. How can we help product companies accelerate their services strategy decisions? How can we help them effectively gain the atten-tion of product-centric executives and convince these executives that indeed a shift in the market tides took place? This book represents one of the frameworks we developed to help executive teams survive the potentially treacherous wave surging over their historical business models.
4 Bridging the Services Chasm
Consequences
This pending shift in market tides is not the imagination of a few nervous service executives. Several very real-world examples exist of the consequences faced by product companies when they do not successfully align their services strategy to market realities. We will spend more time on the gap between ser-vices strategy and market requirements later in the book. For now, let’s focus on the pattern of failure that is very recognizable in established product com-panies:
1. Disruption: Product market matures or disruptive technology enters the market, making current product less competitive. This phenom-enon is well documented and discussed in texts such as The Innovator’s Dilemma by Clayton Christensen.
2. Denial: Company focuses on old technology and old consumption models for too long. The important observation here is that often it is not only what the customer is buying that changes, but also how the customer buys. For example, the shift from closed mainframe systems to open systems in the early 1990s was not just a shift from closed mainframes to open Unix servers, but also a shift from buying hardware, software, and support from one provider to buying best-of-breed components from separate providers.
3. Decline: Top-line revenues stagnate or shrink, and operating income begins to shrivel.
Once again, these first three steps in the failure pattern are well documented and discussed in the literature focused on product company success. It is the next four steps that are less well understood:
4. Services Focus: In an attempt to shore up top-line revenues and prof-its, the executive management team belatedly announces a focus on service opportunities. There are significant changes in service leader-ship announced by the company. Often, executives from pure service firms are brought into the product company executive suite. Press releases are sent out detailing a new focus on service revenue opportu-nities and capabilities.
5. Services False Positive: Service revenues do become a larger portion of total company revenues, but this is largely due to continued main-tenance streams on top of a shrinking installed-product base. Very few product companies report the mix of their service revenues. How-ever, the industry associations I work with, AFMSI, SSPA, and TPSA, do collect this mix information in industry benchmarks. Throughout
Pattern of Failure 5
this book, I will refer to this group of executives and analysts at these industry associations that I work with as the collective “we.” “We” can see the swell in maintenance revenues as a total percentage of com-pany revenues.
6. Services Failure: Despite the belated focus on services, total company revenues continue to flatten or shrink. Operating income shrinks as a percentage of total revenues. Product revenues continue to evaporate. Advanced service offerings such as professional, consulting, or man-aged services gain little traction.
7. Demise: Finally, an abrupt change in corporate direction takes place. Services leadership or overall company leadership is suddenly changed. The company does one of three things: declares a renewed focus on product innovation, declares bankruptcy, or is acquired.
Company circumstances vary greatly as they go through this pattern of failure. Sometimes the disruptive technology was impossible to predict. Some-times executive improprieties or missteps accelerate the company demise. Despite the variances in circumstances, an undeniable and clear pattern, as it relates to product and service synergies, can be seen. The opportunity is to understand the pattern and identify the window of opportunity where services initiatives can create a buffer of both revenue and margin that can be used to fund new strategic directions. We will explore this concept later in the text. First, let’s review a few of the classic examples of product com-panies migrating through this failure pattern.
Example: Baan and ERP
Enterprise Resource Planning (ERP) software is the easy poster child to start with. If you are in the world of business, you are well aware ERP implementa-tions are challenging. The magnitude of the failure is staggering. According to CIO Magazine, “today’s ERP rollout has only a 7 percent chance of coming in on time, will probably cost more than what you estimated, and will likely deliver very unsatisfying results.”2 This overpromising of business benefits and the emergence of new e-business platforms caught up with many ERP vendors in the late 1990s, and the number of vendors began to shrink. One of the cau-salities was the Baan Company out of the Netherlands.
2 ERP Backlash Coming Soon to a Company Near You, Thomas Wailgum, blog http://advice.cio.com/thomas_wailgum/erp_backlash_coming_soon_to_a_company_near_you at, from Jan. 15, 2009.
6 Bridging the Services Chasm
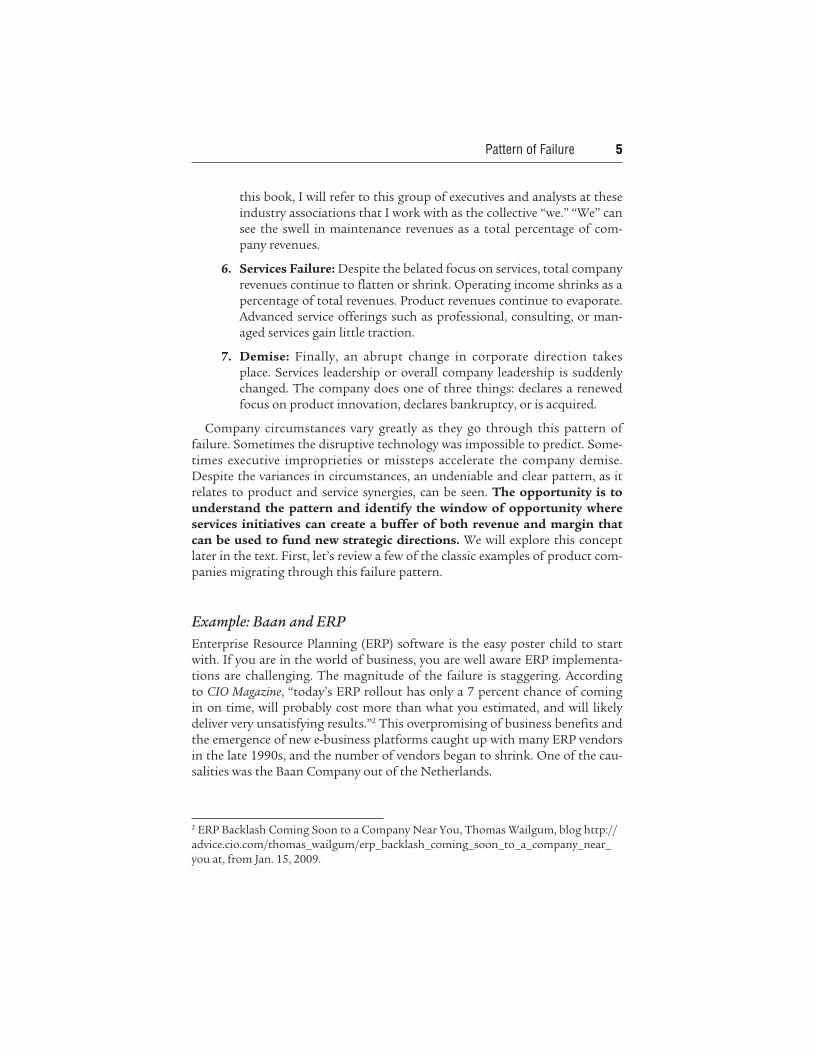
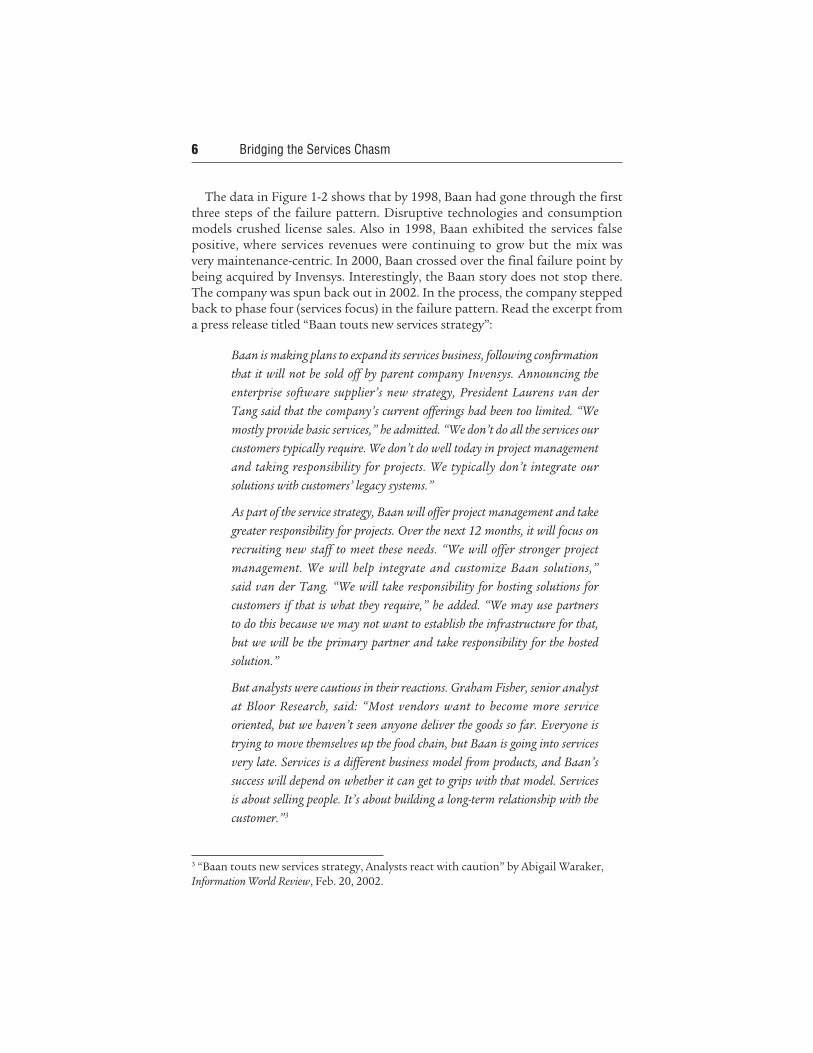
The data in Figure 1-2 shows that by 1998, Baan had gone through the first three steps of the failure pattern. Disruptive technologies and consumption models crushed license sales. Also in 1998, Baan exhibited the services false positive, where services revenues were continuing to grow but the mix was very maintenance-centric. In 2000, Baan crossed over the final failure point by being acquired by Invensys. Interestingly, the Baan story does not stop there. The company was spun back out in 2002. In the process, the company stepped back to phase four (services focus) in the failure pattern. Read the excerpt from a press release titled “Baan touts new services strategy”:
Baan is making plans to expand its services business, following confirmation
that it will not be sold off by parent company Invensys. Announcing the
enterprise software supplier’s new strategy, President Laurens van der
Tang said that the company’s current offerings had been too limited. “We
mostly provide basic services,” he admitted. “We don’t do all the services our
customers typically require. We don’t do well today in project management
and taking responsibility for projects. We typically don’t integrate our
solutions with customers’ legacy systems.”
As part of the service strategy, Baan will offer project management and take
greater responsibility for projects. Over the next 12 months, it will focus on
recruiting new staff to meet these needs. “We will offer stronger project
management. We will help integrate and customize Baan solutions,”
said van der Tang. “We will take responsibility for hosting solutions for
customers if that is what they require,” he added. “We may use partners
to do this because we may not want to establish the infrastructure for that,
but we will be the primary partner and take responsibility for the hosted
solution.”
But analysts were cautious in their reactions. Graham Fisher, senior analyst
at Bloor Research, said: “Most vendors want to become more service
oriented, but we haven’t seen anyone deliver the goods so far. Everyone is
trying to move themselves up the food chain, but Baan is going into services
very late. Services is a different business model from products, and Baan’s
success will depend on whether it can get to grips with that model. Services
is about selling people. It’s about building a long-term relationship with the
customer.”3
3 “Baan touts new services strategy, Analysts react with caution” by Abigail Waraker, Information World Review, Feb. 20, 2002.
Pattern of Failure 7
The question is why did Baan not consider this new services strategy back in 1997 or 1998 when it was clear customers were seeking more service assis-tance? Why did the company need to lose so much money before realizing services strategy needed to dramatically change? This is the pattern of failure we want to break.
Example: Novell and Networking
In 2001, struggling software provider Novell had entered phase three of the failure pattern. Revenues were flat and profits were shrinking. The company decided to enter phase four (focus on services) with a big bang by purchasing systems integrator Cambridge Technology Partners. The objective was simple:
The acquisition significantly expands Novell’s ability to deliver consulting
support to customers and other IT services companies. The two companies
are both addressing the deployment of business processes and IT resources
across the Internet through new, secure, yet simplified, Web-based access.
Cambridge accelerates Novell’s adoption of a solutions-selling model that
supports customers and partners transforming their businesses.4
Figure 1-2 Baan Financial Results
4 Novell to acquire Cambridge Technology Partners; IT consulting and systems integra-tion capabilities to accelerate Novell’s move to solutions-selling model for net services. Novell Press Release, March 21, 2001.
8 Bridging the Services Chasm
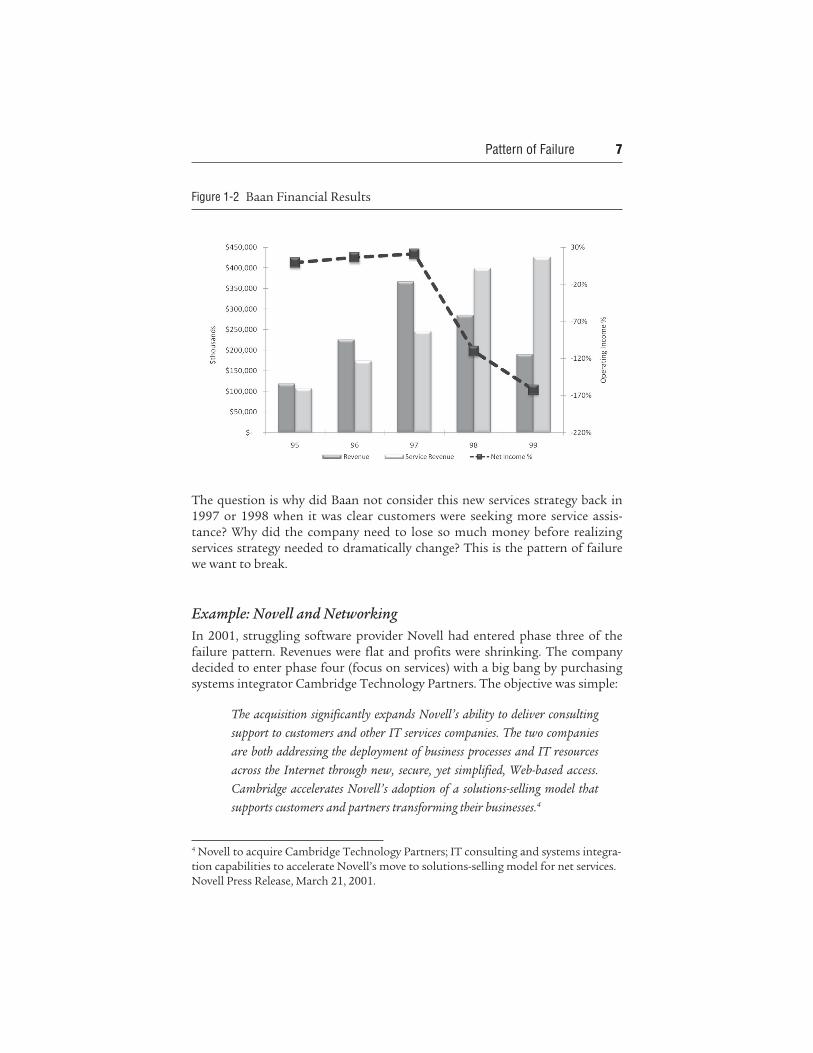
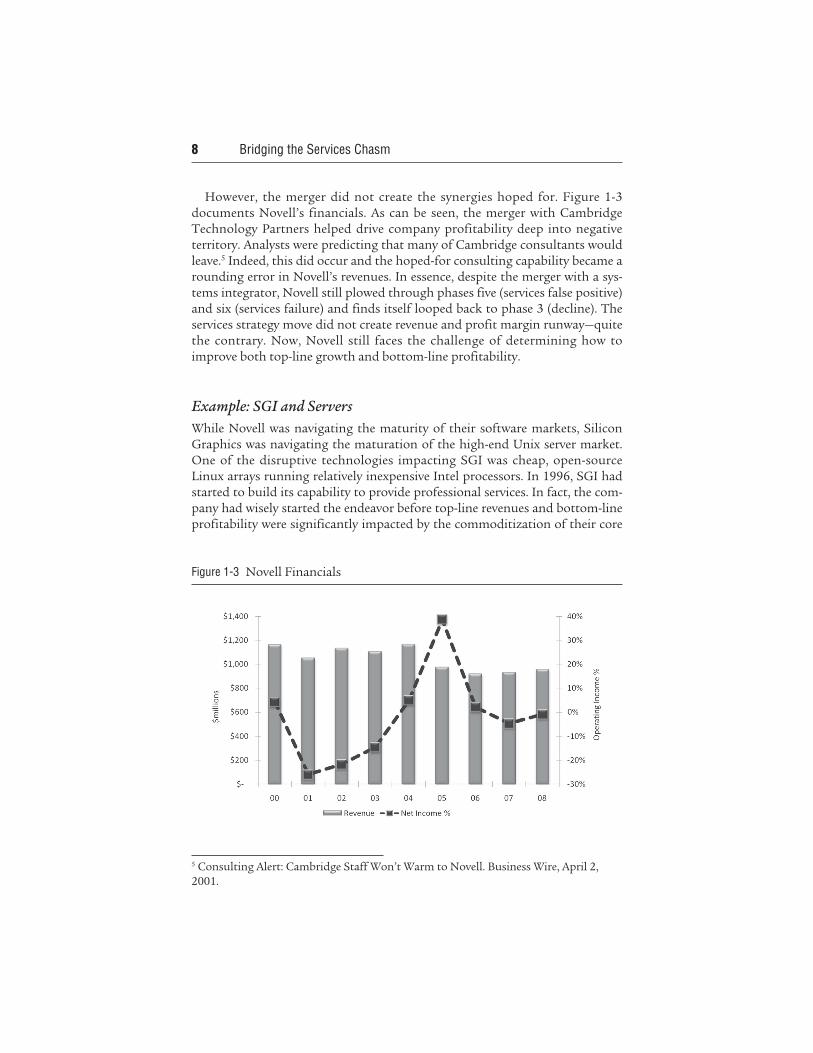
However, the merger did not create the synergies hoped for. Figure 1-3 documents Novell’s financials. As can be seen, the merger with Cambridge Technology Partners helped drive company profitability deep into negative territory. Analysts were predicting that many of Cambridge consultants would leave.5 Indeed, this did occur and the hoped-for consulting capability became a rounding error in Novell’s revenues. In essence, despite the merger with a sys-tems integrator, Novell still plowed through phases five (services false positive) and six (services failure) and finds itself looped back to phase 3 (decline). The services strategy move did not create revenue and profit margin runway—quite the contrary. Now, Novell still faces the challenge of determining how to improve both top-line growth and bottom-line profitability.
Example: SGI and Servers
While Novell was navigating the maturity of their software markets, Silicon Graphics was navigating the maturation of the high-end Unix server market. One of the disruptive technologies impacting SGI was cheap, open-source Linux arrays running relatively inexpensive Intel processors. In 1996, SGI had started to build its capability to provide professional services. In fact, the com-pany had wisely started the endeavor before top-line revenues and bottom-line profitability were significantly impacted by the commoditization of their core
Figure 1-3 Novell Financials
5 Consulting Alert: Cambridge Staff Won’t Warm to Novell. Business Wire, April 2, 2001.
Pattern of Failure 9
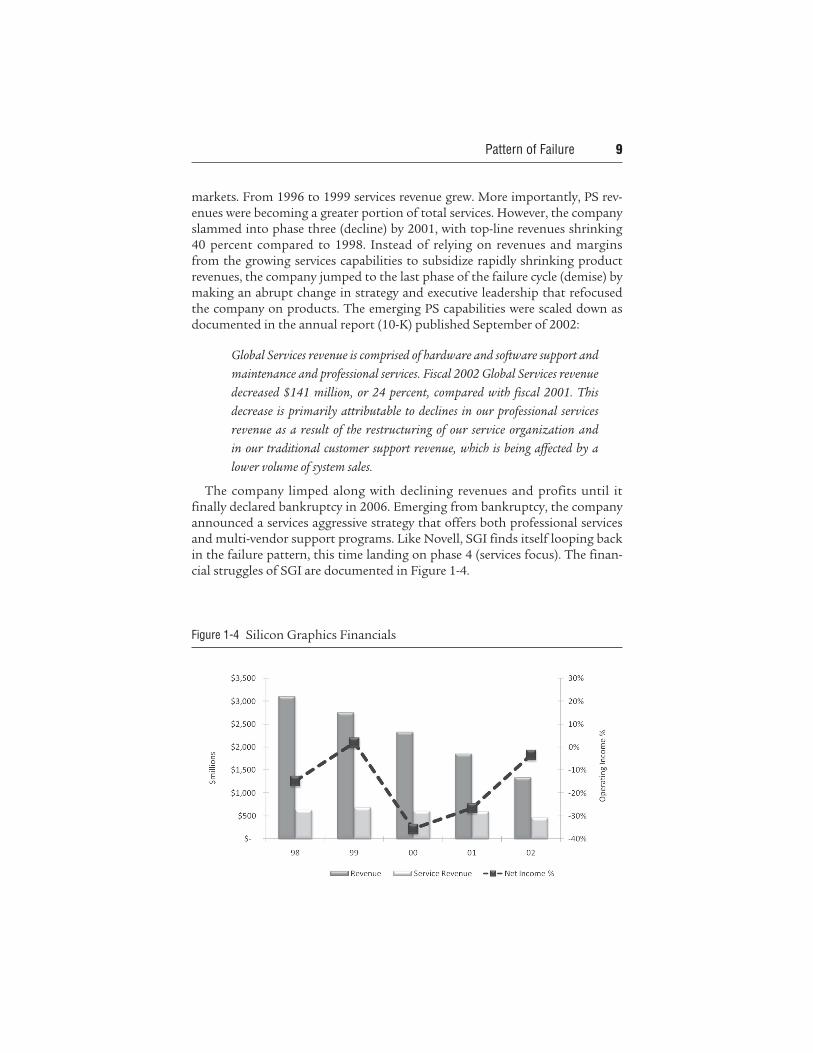
markets. From 1996 to 1999 services revenue grew. More importantly, PS rev-enues were becoming a greater portion of total services. However, the company slammed into phase three (decline) by 2001, with top-line revenues shrinking 40 percent compared to 1998. Instead of relying on revenues and margins from the growing services capabilities to subsidize rapidly shrinking product revenues, the company jumped to the last phase of the failure cycle (demise) by making an abrupt change in strategy and executive leadership that refocused the company on products. The emerging PS capabilities were scaled down as documented in the annual report (10-K) published September of 2002:
Global Services revenue is comprised of hardware and software support and
maintenance and professional services. Fiscal 2002 Global Services revenue
decreased $141 million, or 24 percent, compared with fiscal 2001. This
decrease is primarily attributable to declines in our professional services
revenue as a result of the restructuring of our service organization and
in our traditional customer support revenue, which is being affected by a
lower volume of system sales.
The company limped along with declining revenues and profits until it finally declared bankruptcy in 2006. Emerging from bankruptcy, the company announced a services aggressive strategy that offers both professional services and multi-vendor support programs. Like Novell, SGI finds itself looping back in the failure pattern, this time landing on phase 4 (services focus). The finan-cial struggles of SGI are documented in Figure 1-4.
Figure 1-4 Silicon Graphics Financials
10 Bridging the Services Chasm
Example: Lucent and Telecom
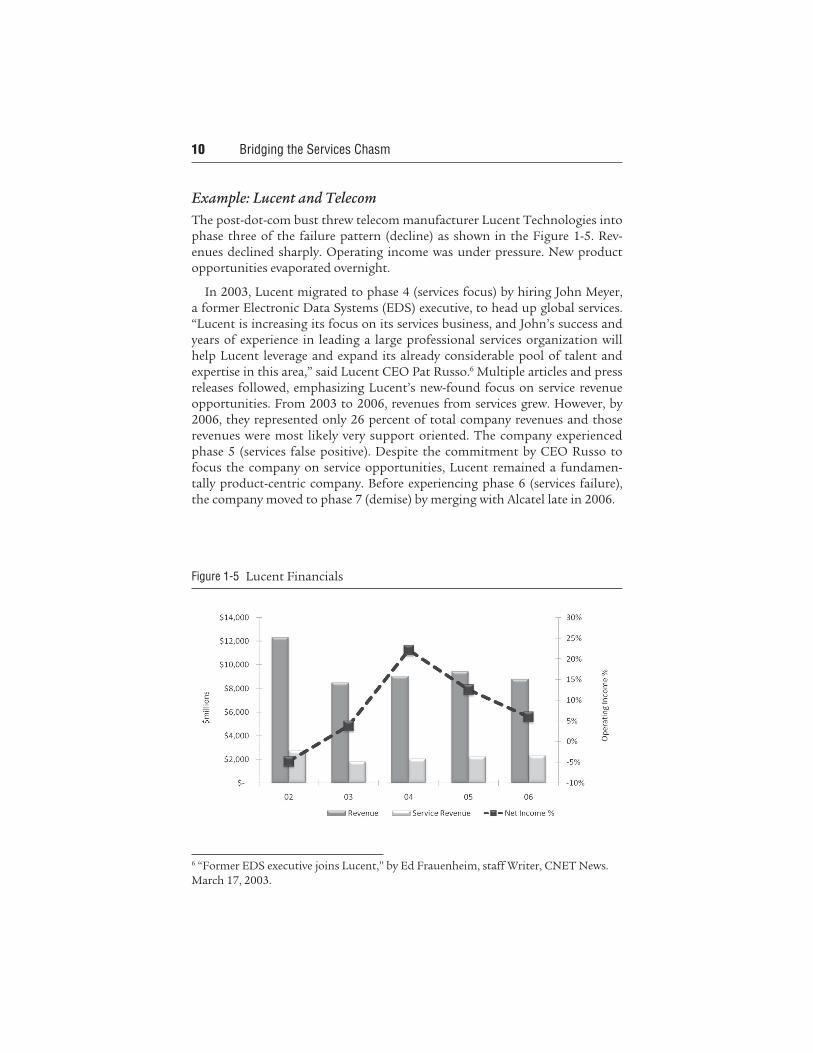
The post-dot-com bust threw telecom manufacturer Lucent Technologies into phase three of the failure pattern (decline) as shown in the Figure 1-5. Rev-enues declined sharply. Operating income was under pressure. New product opportunities evaporated overnight.
In 2003, Lucent migrated to phase 4 (services focus) by hiring John Meyer, a former Electronic Data Systems (EDS) executive, to head up global services. “Lucent is increasing its focus on its services business, and John’s success and years of experience in leading a large professional services organization will help Lucent leverage and expand its already considerable pool of talent and expertise in this area,” said Lucent CEO Pat Russo.6 Multiple articles and press releases followed, emphasizing Lucent’s new-found focus on service revenue opportunities. From 2003 to 2006, revenues from services grew. However, by 2006, they represented only 26 percent of total company revenues and those revenues were most likely very support oriented. The company experienced phase 5 (services false positive). Despite the commitment by CEO Russo to focus the company on service opportunities, Lucent remained a fundamen-tally product-centric company. Before experiencing phase 6 (services failure), the company moved to phase 7 (demise) by merging with Alcatel late in 2006.
Figure 1-5 Lucent Financials
6 “Former EDS executive joins Lucent,” by Ed Frauenheim, staff Writer, CNET News. March 17, 2003.
Pattern of Failure 11
Example: Siebel and CRM
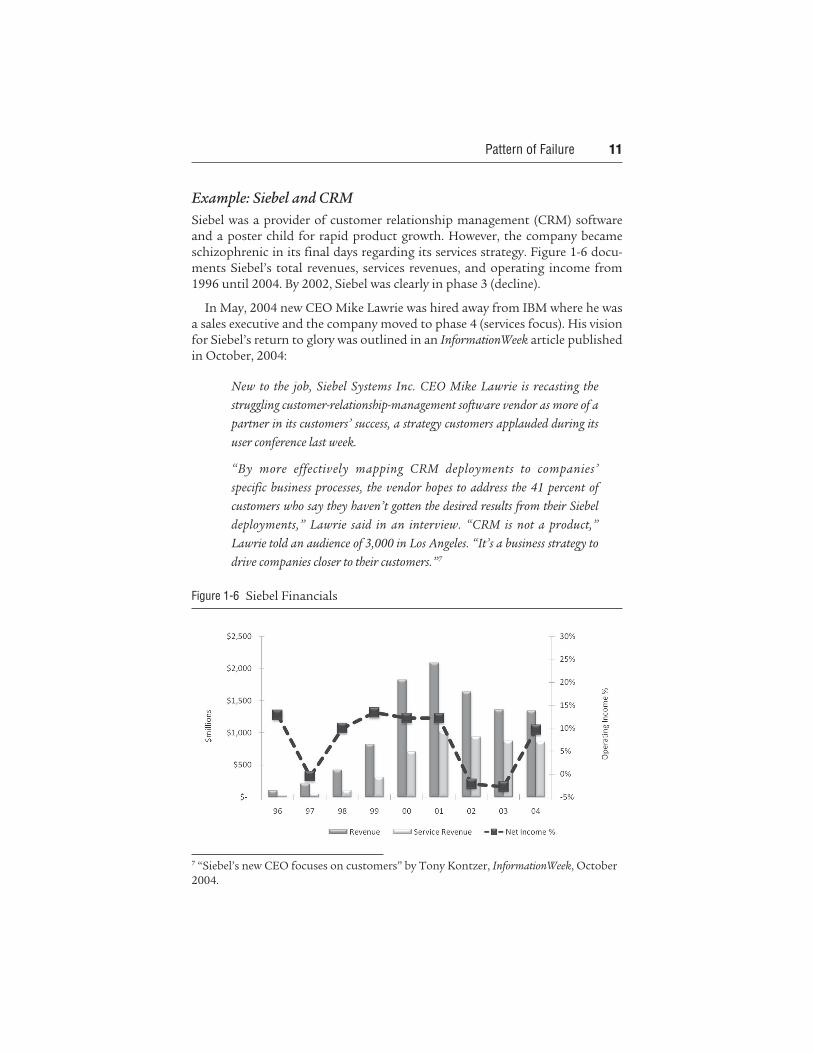
Siebel was a provider of customer relationship management (CRM) software and a poster child for rapid product growth. However, the company became schizophrenic in its final days regarding its services strategy. Figure 1-6 docu-ments Siebel’s total revenues, services revenues, and operating income from 1996 until 2004. By 2002, Siebel was clearly in phase 3 (decline).
In May, 2004 new CEO Mike Lawrie was hired away from IBM where he was a sales executive and the company moved to phase 4 (services focus). His vision for Siebel’s return to glory was outlined in an InformationWeek article published in October, 2004:
New to the job, Siebel Systems Inc. CEO Mike Lawrie is recasting the
struggling customer-relationship-management software vendor as more of a
partner in its customers’ success, a strategy customers applauded during its
user conference last week.
“By more effectively mapping CRM deployments to companies’
specific business processes, the vendor hopes to address the 41 percent of
customers who say they haven’t gotten the desired results from their Siebel
deployments,” Lawrie said in an interview. “CRM is not a product,”
Lawrie told an audience of 3,000 in Los Angeles. “It’s a business strategy to
drive companies closer to their customers.”7
Figure 1-6 Siebel Financials
7 “Siebel’s new CEO focuses on customers” by Tony Kontzer, InformationWeek, October 2004.
12 Bridging the Services Chasm
Lawrie hired Eileen McPartland from Accenture to serve as SVP of the ser-vices area. Multiple articles and interviews emphasized how critical services were to the future success and growth of Siebel. This focus on services seemed to make sense because 64 percent of 2004 revenues were based on services, not new license sales. However, less than one year later, the company rapidly moved to phase 6 (services failure) when it unexpectedly let Mr. Lawrie go and emphasized a renewed commitment to on-demand offerings that would com-pete with upstart salesforce.com and other new front office software applica-tions. This thrashing motion surrounding the services strategy was not the only chink in Siebel’s armor, but the confusion clearly accelerated the demise. The company ended up in phase 7 when it was purchased by competitor Oracle in 2005. The benefit of 20/20 hindsight shows Siebel should have been earnestly reconsidering product and services strategy shifts back in 2002, not 2004. What if Siebel could have improved customer intimacy starting in 2002 with a strong emphasis on value-added services that actually drove the usage of all the software they had previously sold?
SUMMARIZING THE FAILURE PATTERN
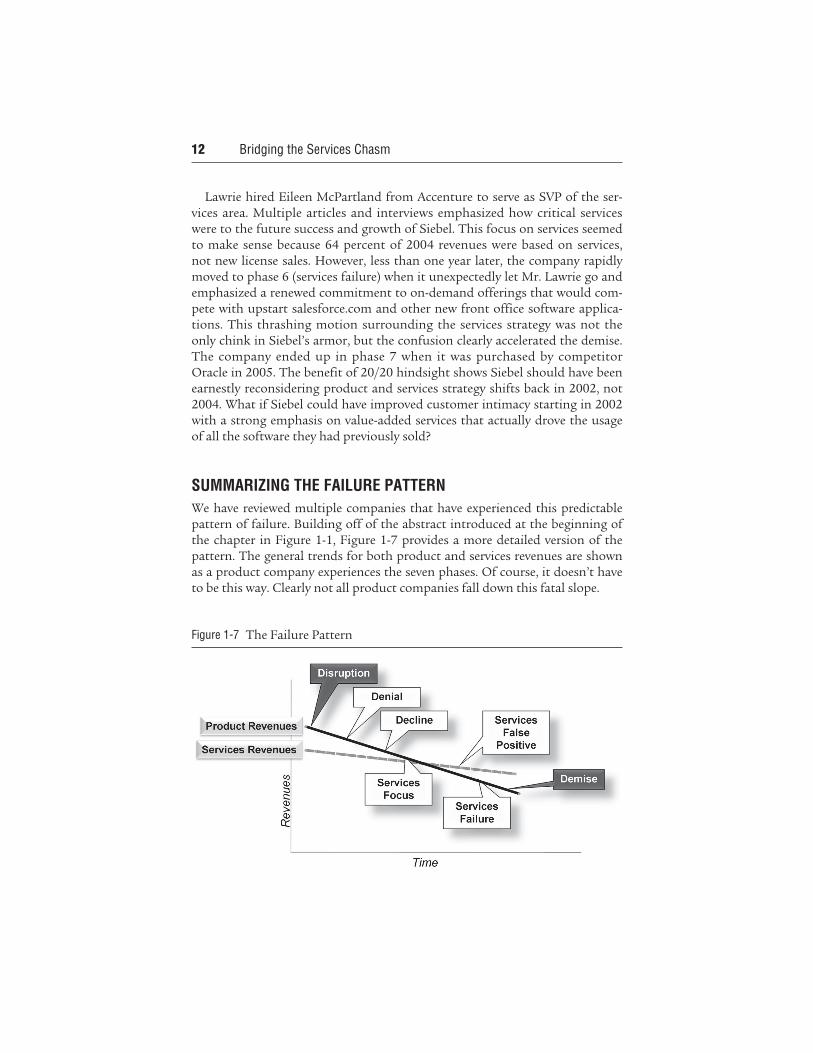
We have reviewed multiple companies that have experienced this predictable pattern of failure. Building off of the abstract introduced at the beginning of the chapter in Figure 1-1, Figure 1-7 provides a more detailed version of the pattern. The general trends for both product and services revenues are shown as a product company experiences the seven phases. Of course, it doesn’t have to be this way. Clearly not all product companies fall down this fatal slope.
Figure 1-7 The Failure Pattern
Pattern of Failure 13
The 25% Cushion
There is a clear pattern of failure that occurs as product companies lose their product mojo. Currently, services strategy is often an albatross around the neck of the flailing product company that hastens the drown-ing. Hopefully the above data makes that point very real for you. In reality, services should be serving as a lifeboat that preserves revenue and margin dollars as the product company retools its product strategy. How big is the services lifeboat in times of declining product margin dollars? We have mod-eled the answer to this question and will cover an example in a section titled “The Services Buffer” in Chapter 7. However, I wanted to get some of the math front and center in the discussion.
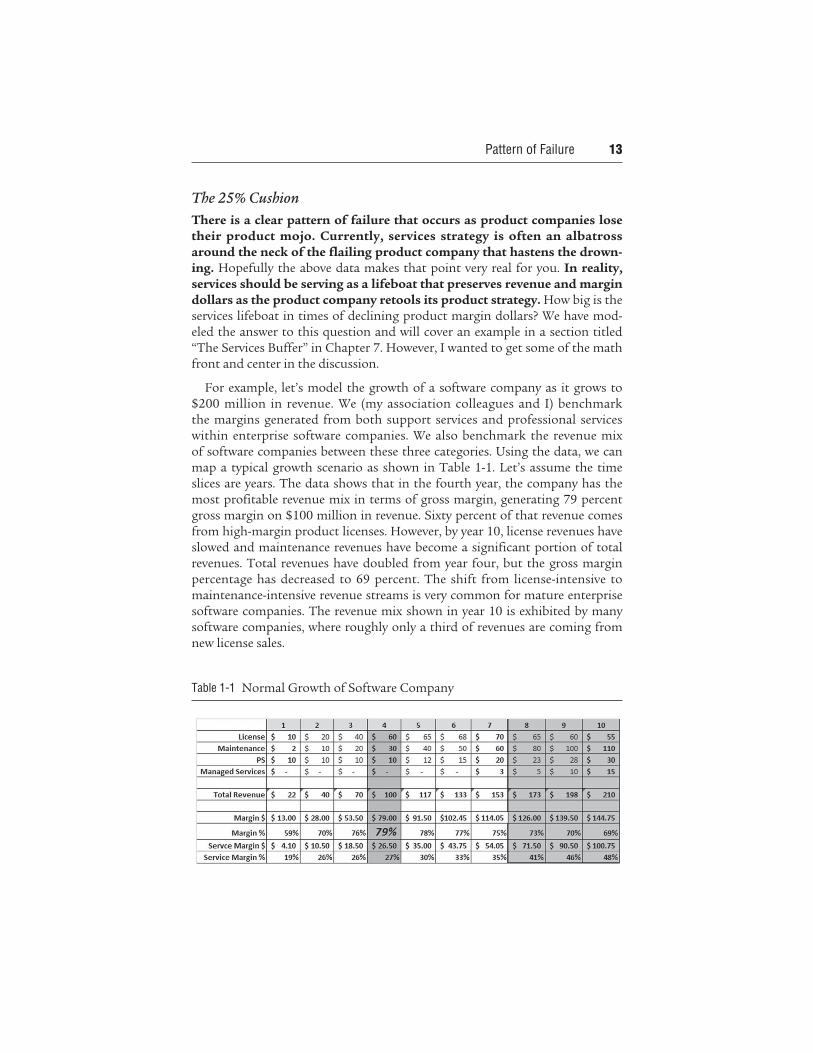
For example, let’s model the growth of a software company as it grows to $200 million in revenue. We (my association colleagues and I) benchmark the margins generated from both support services and professional services within enterprise software companies. We also benchmark the revenue mix of software companies between these three categories. Using the data, we can map a typical growth scenario as shown in Table 1-1. Let’s assume the time slices are years. The data shows that in the fourth year, the company has the most profitable revenue mix in terms of gross margin, generating 79 percent gross margin on $100 million in revenue. Sixty percent of that revenue comes from high-margin product licenses. However, by year 10, license revenues have slowed and maintenance revenues have become a significant portion of total revenues. Total revenues have doubled from year four, but the gross margin percentage has decreased to 69 percent. The shift from license-intensive to maintenance-intensive revenue streams is very common for mature enterprise software companies. The revenue mix shown in year 10 is exhibited by many software companies, where roughly only a third of revenues are coming from new license sales.
Table 1-1 Normal Growth of Software Company
14 Bridging the Services Chasm
Once again, we will spend more time on this modeling later in the book, but what if the management team decided in year four that services were really a secondary concern for the company. By using such a strategy, the executive team has made two decisions:
1. Invest more in product R&D than in services optimization.
2. Push almost all nonsupport service activities to services partners.
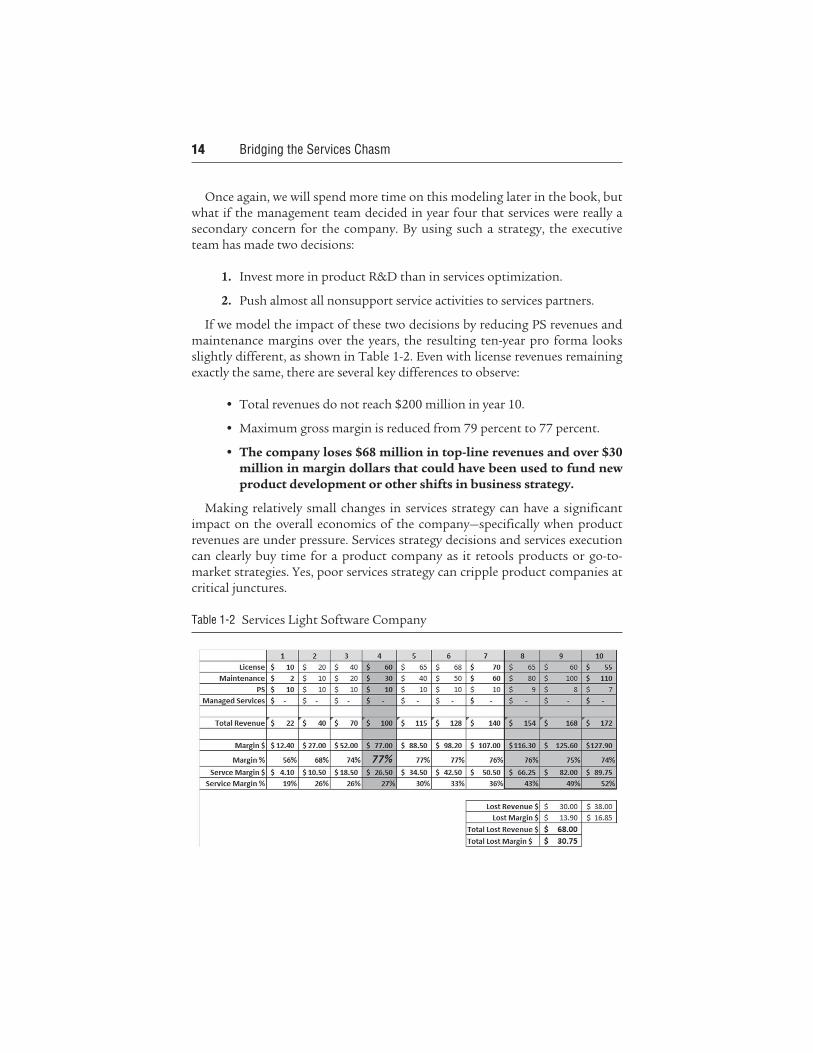
If we model the impact of these two decisions by reducing PS revenues and maintenance margins over the years, the resulting ten-year pro forma looks slightly different, as shown in Table 1-2. Even with license revenues remaining exactly the same, there are several key differences to observe:
l Total revenues do not reach $200 million in year 10.
l Maximum gross margin is reduced from 79 percent to 77 percent.
l The company loses $68 million in top-line revenues and over $30 million in margin dollars that could have been used to fund new product development or other shifts in business strategy.
Making relatively small changes in services strategy can have a significant impact on the overall economics of the company—specifically when product revenues are under pressure. Services strategy decisions and services execution can clearly buy time for a product company as it retools products or go-to-market strategies. Yes, poor services strategy can cripple product companies at critical junctures.
Table 1-2 Services Light Software Company
Pattern of Failure 15
I want to close this section by stating that, despite analyzing the failure pat-terns of many product companies and putting math behind the arguments, I don’t believe I have uncovered much new insight regarding the importance of product success and services strategy. These correlations between service capabilities and product success have been talked about for years. In fact, on my bookshelf right now, there is a tome titled Product Plus: How Product + Service = Competitive Advantage by Christopher Lovelock. The book was published in 1994. The book jacket has the following text:
“If a firm is to survive and prosper into the twenty-first century, its top
management must find ways to create a product plus organization.
Whatever your product, service holds the key. Improving or reengineering
service processes should lie at the heart of any strategy.”
The book contains chapters titled “Every Business Competes on Service” and “User-Friendly versus User-Hostile.” Many of the premises are the same ones outlined in this chapter. Here we stand as a technology industry, 15 years later, having the same discussions regarding services strategy. But so little has changed. So few product companies have taken the discipline of services strategy seriously. From our vantage point of gazing across the many companies engaged in our associations, we believe that lethargy surrounding services strategy is coming to an end. New pressures in the system force executives at product companies to take a very hard look at services strategy.
CRITICALITY
The stories of Dell, EMC, Microsoft, Sun Microsystems, and Unisys could eas-ily be added to the stories of Baan, Novell, Siebel, Lucent, and SGI. They are all product companies that face various levels of pressure to realign services strategy to achieve new levels of company success. Yet, product companies are notorious for remaining exclusively focused on product success. Why will companies have to behave differently today? Why will they be forced to embrace the services strategy dialogue when historically they have buried it? Three attributes of today’s technology market are forcing new levels of atten-tion on services strategy:
1. The shift in product-service mix
2. The increasing cost of sales and services
3. The cloud
16 Bridging the Services Chasm
PRODUCT–SERVICE REVENUE MIX
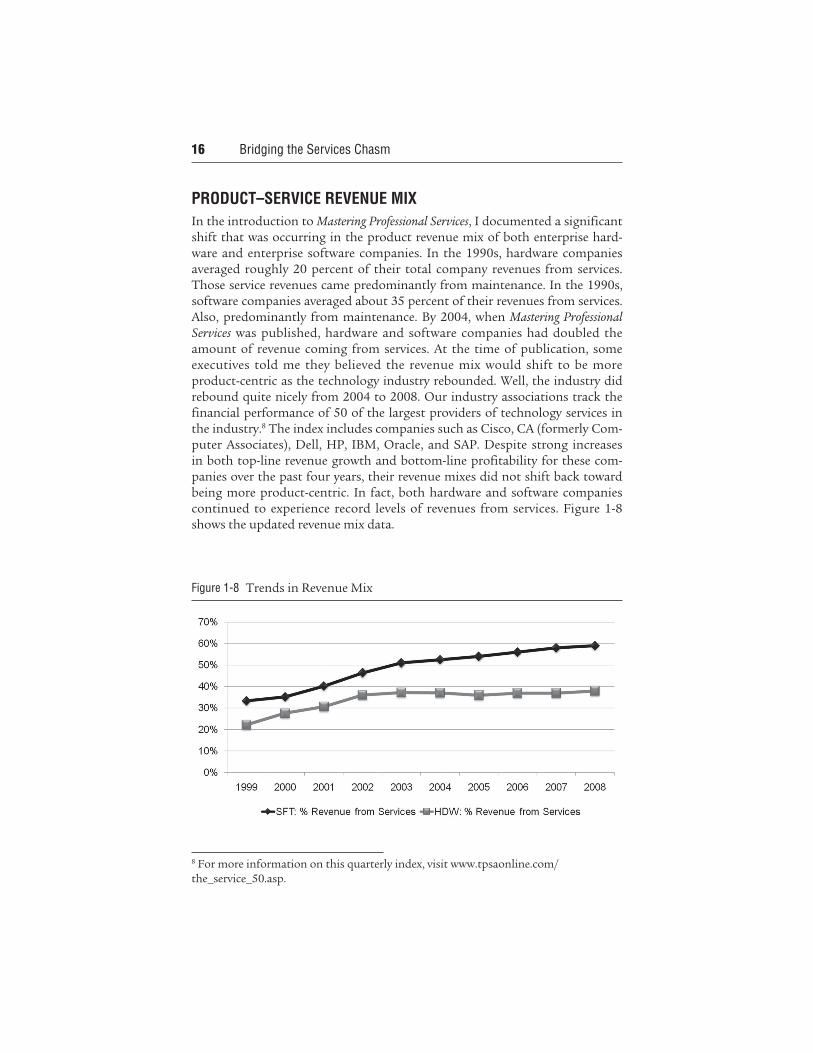
In the introduction to Mastering Professional Services, I documented a significant shift that was occurring in the product revenue mix of both enterprise hard-ware and enterprise software companies. In the 1990s, hardware companies averaged roughly 20 percent of their total company revenues from services. Those service revenues came predominantly from maintenance. In the 1990s, software companies averaged about 35 percent of their revenues from services. Also, predominantly from maintenance. By 2004, when Mastering Professional Services was published, hardware and software companies had doubled the amount of revenue coming from services. At the time of publication, some executives told me they believed the revenue mix would shift to be more product-centric as the technology industry rebounded. Well, the industry did rebound quite nicely from 2004 to 2008. Our industry associations track the financial performance of 50 of the largest providers of technology services in the industry.8 The index includes companies such as Cisco, CA (formerly Com-puter Associates), Dell, HP, IBM, Oracle, and SAP. Despite strong increases in both top-line revenue growth and bottom-line profitability for these com-panies over the past four years, their revenue mixes did not shift back toward being more product-centric. In fact, both hardware and software companies continued to experience record levels of revenues from services. Figure 1-8 shows the updated revenue mix data.
8 For more information on this quarterly index, visit www.tpsaonline.com/the_service_50.asp.
Figure 1-8 Trends in Revenue Mix
Pattern of Failure 17
While total services revenues steadily grew, product companies also expanded the types of services they offer. One set of data our associations benchmark is revenue mix not available in the public record. How much rev-enue is coming from products, support, professional services, managed ser-vices, and so on? The data shows that service capabilities, such as professional services and managed services, are on the rise. For mature software companies, professional services can easily represent 15 to 25 percent of total company revenues. Now, enter the global downturn of 2008. In these times, avail-able capital shrivels. Product companies become even more reliant on optimizing their service revenue streams. In other words, there is now too much money on the table for these product companies to ignore or sub-optimize their services business strategy. Even as I am writing this chapter, the earnings reports for technology titans EMC, IBM, and HP have just been released. In Q4 2008, EMC saw product revenues grow a measly 1 percent from the previous year while services revenues grew 14 percent. More importantly, services margin dollars represented 36 percent of total margin dollars for EMC that quarter. IBM saw product revenues drop almost 20 percent that same quarter while services revenues held flat. For their Q1 2009, HP reported that product revenues shrank 18 percent while services revenues grew 116 percent with the acquisition of EDS.
COST OF SELLING, COST OF SERVING
The second force creating new pressure is the increased cost of marketing, selling, and servicing technology products. As highlighted previously, product companies had a nice financial run from 2004 through 2008. However, if you look under the covers at their business models, you’ll find some interesting trends:
l General and administrative costs have been shrinking as a percentage of total company revenues.
l Research and development costs have been held flat.
l Sales and marketing costs are increasing for some companies.
l Cost of services as a percentage of total company revenues is increasing.
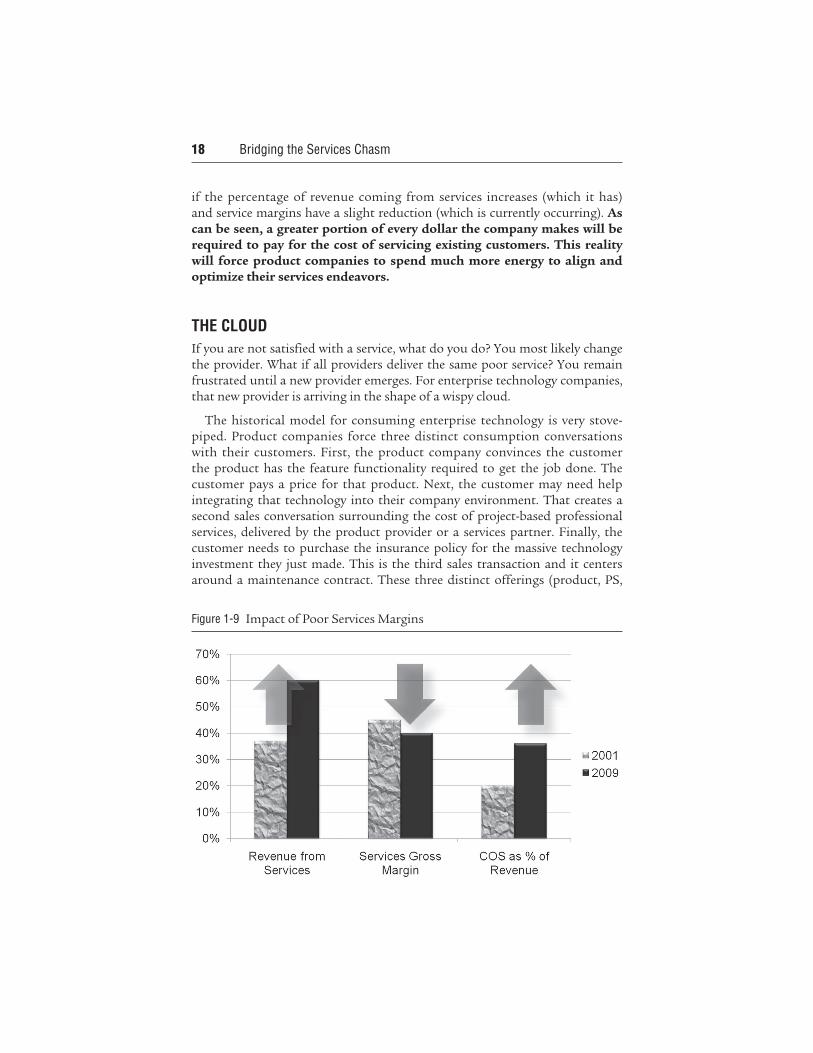
Technology companies have been doing an outstanding job of reducing general overhead and containing the costs required to develop new products. These moves have helped increase operating incomes. However, the cost to secure and serve new customers is not yet under control. This reality will put incredible pressure on operating incomes if not rectified. Figure 1-9 provides a simple example of what will happen to the financials of a product company
18 Bridging the Services Chasm
if the percentage of revenue coming from services increases (which it has) and service margins have a slight reduction (which is currently occurring). As can be seen, a greater portion of every dollar the company makes will be required to pay for the cost of servicing existing customers. This reality will force product companies to spend much more energy to align and optimize their services endeavors.
THE CLOUD
If you are not satisfied with a service, what do you do? You most likely change the provider. What if all providers deliver the same poor service? You remain frustrated until a new provider emerges. For enterprise technology companies, that new provider is arriving in the shape of a wispy cloud.
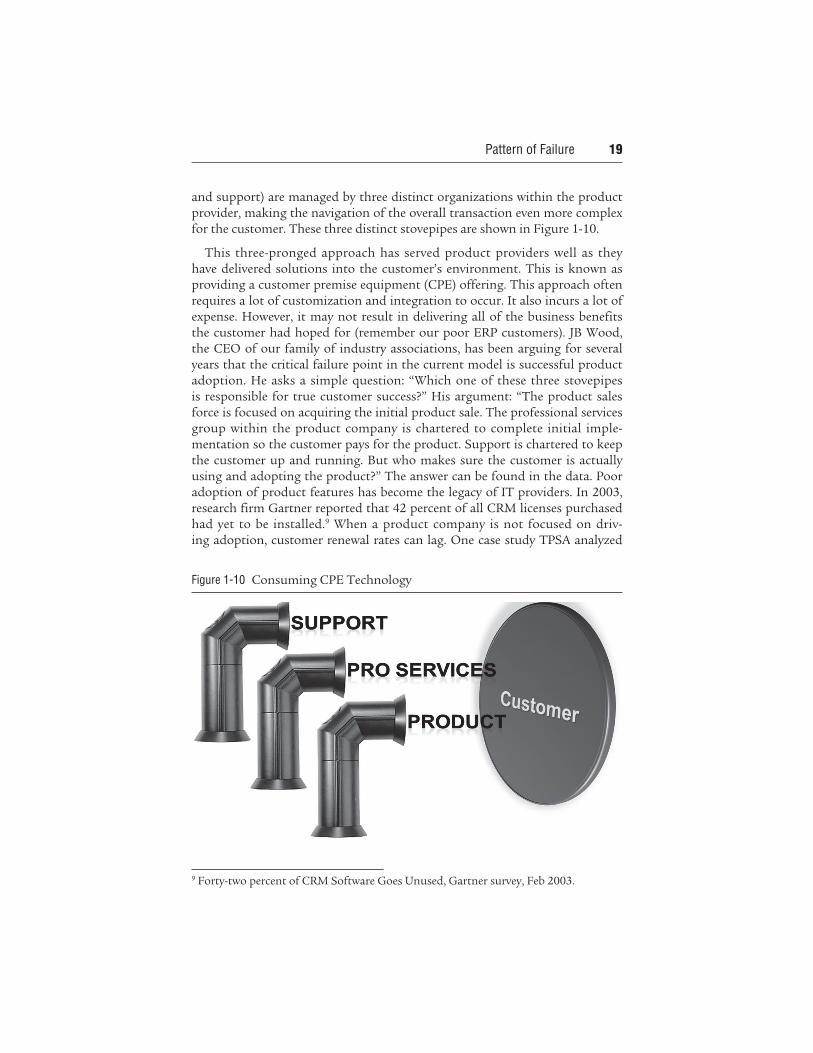
The historical model for consuming enterprise technology is very stove-piped. Product companies force three distinct consumption conversations with their customers. First, the product company convinces the customer the product has the feature functionality required to get the job done. The customer pays a price for that product. Next, the customer may need help integrating that technology into their company environment. That creates a second sales conversation surrounding the cost of project-based professional services, delivered by the product provider or a services partner. Finally, the customer needs to purchase the insurance policy for the massive technology investment they just made. This is the third sales transaction and it centers around a maintenance contract. These three distinct offerings (product, PS,
Figure 1-9 Impact of Poor Services Margins
Pattern of Failure 19
and support) are managed by three distinct organizations within the product provider, making the navigation of the overall transaction even more complex for the customer. These three distinct stovepipes are shown in Figure 1-10.
This three-pronged approach has served product providers well as they have delivered solutions into the customer’s environment. This is known as providing a customer premise equipment (CPE) offering. This approach often requires a lot of customization and integration to occur. It also incurs a lot of expense. However, it may not result in delivering all of the business benefits the customer had hoped for (remember our poor ERP customers). JB Wood, the CEO of our family of industry associations, has been arguing for several years that the critical failure point in the current model is successful product adoption. He asks a simple question: “Which one of these three stovepipes is responsible for true customer success?” His argument: “The product sales force is focused on acquiring the initial product sale. The professional services group within the product company is chartered to complete initial imple-mentation so the customer pays for the product. Support is chartered to keep the customer up and running. But who makes sure the customer is actually using and adopting the product?” The answer can be found in the data. Poor adoption of product features has become the legacy of IT providers. In 2003, research firm Gartner reported that 42 percent of all CRM licenses purchased had yet to be installed.9 When a product company is not focused on driv-ing adoption, customer renewal rates can lag. One case study TPSA analyzed
Figure 1-10 Consuming CPE Technology
9 Forty-two percent of CRM Software Goes Unused, Gartner survey, Feb 2003.
20 Bridging the Services Chasm
showed the renewal rate for a software product ranged from 52 percent when no adoption services were offered to the customer to 86 percent when adop-tion services were offered. The main point is simple: The current stovepipe model, with little focus on long-term customer adoption, is creaking and groaning under customer frustration.
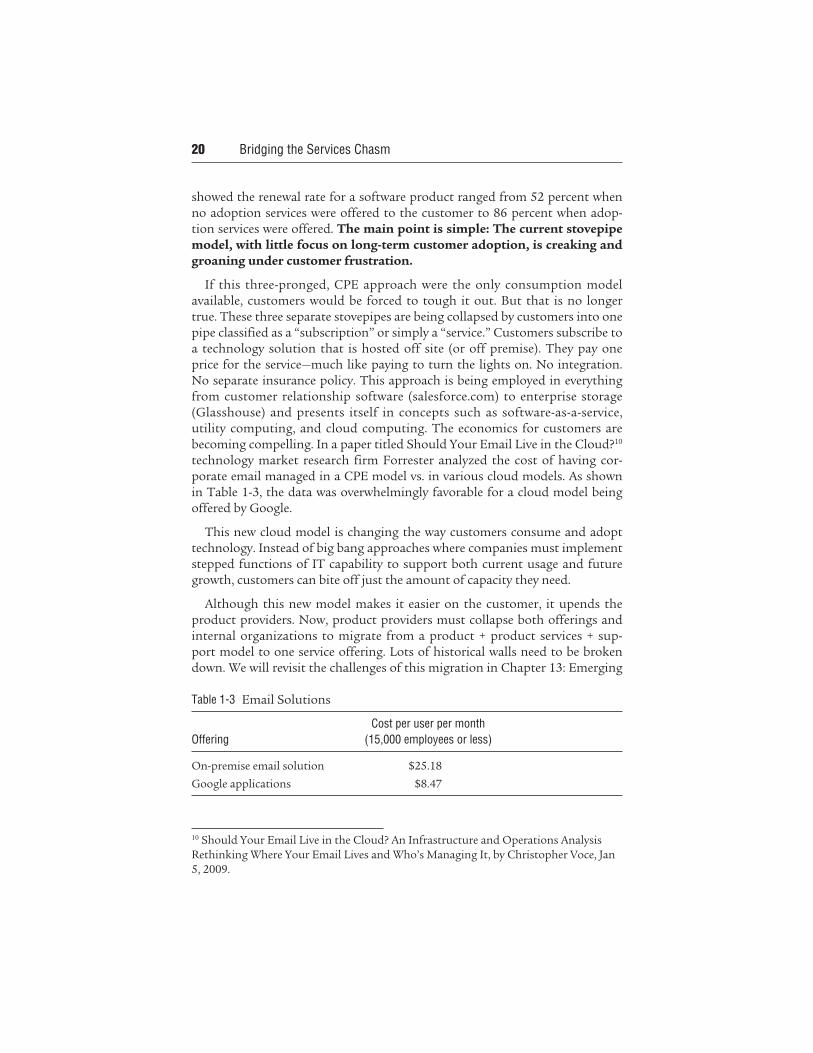
If this three-pronged, CPE approach were the only consumption model available, customers would be forced to tough it out. But that is no longer true. These three separate stovepipes are being collapsed by customers into one pipe classified as a “subscription” or simply a “service.” Customers subscribe to a technology solution that is hosted off site (or off premise). They pay one price for the service—much like paying to turn the lights on. No integration. No separate insurance policy. This approach is being employed in everything from customer relationship software (salesforce.com) to enterprise storage (Glasshouse) and presents itself in concepts such as software-as-a-service, utility computing, and cloud computing. The economics for customers are becoming compelling. In a paper titled Should Your Email Live in the Cloud?10 technology market research firm Forrester analyzed the cost of having cor-porate email managed in a CPE model vs. in various cloud models. As shown in Table 1-3, the data was overwhelmingly favorable for a cloud model being offered by Google.
This new cloud model is changing the way customers consume and adopt technology. Instead of big bang approaches where companies must implement stepped functions of IT capability to support both current usage and future growth, customers can bite off just the amount of capacity they need.
Although this new model makes it easier on the customer, it upends the product providers. Now, product providers must collapse both offerings and internal organizations to migrate from a product + product services + sup-port model to one service offering. Lots of historical walls need to be broken down. We will revisit the challenges of this migration in Chapter 13: Emerging
10 Should Your Email Live in the Cloud? An Infrastructure and Operations Analysis Rethinking Where Your Email Lives and Who’s Managing It, by Christopher Voce, Jan 5, 2009.
Table 1-3 Email Solutions
Cost per user per month
Offering (15,000 employees or less)
On-premise email solution $25.18
Google applications $8.47
Pattern of Failure 21
Profiles. Is a centralized cloud approach the future of all technology consump-tion? How real is this trend? Mark Hurd, CEO of Hewlett Packard, the first $100 billion technology company, has been aligning capabilities to migrate HP from a CPE delivery model to one that supports consumption through the cloud. In July of 2008, HP announced a partnership with Intel and Yahoo! to create multiple cloud computing research centers. Some speculation exists that the purchase of EDS was a move to augment HP’s ability to deliver their products through services offerings. And off the record, HP executives have commented that the company is convinced all enterprise products made by the company will eventually be primarily consumed in a utility, or services model.
Three critical trends exist: Revenue mixes are becoming services intensive, companies are under duress to reduce cost structures, and customers are changing the way they consume technology. All three trends are placing new pressures on product companies to truly align and optimize their services strategy. For product company executives, this is not the time to ignore the realities. This is the time to embrace the conversation and identify new market opportunities being created by the inaction of competitors locked in dated go-to-market models.
CONCLUSION
I started this chapter by stating a fact I and my industry association colleagues believe to be true:
Effectively aligning a company’s services strategy to the overall
company strategy will become the defining discipline in any product
company’s success.
The changing dynamics in technology markets are making this statement a cold reality. Product revenues are slowing in many mature technology mar-kets. Consumption models for technology infrastructure are moving from customer premise equipment-based models to subscription- and services-based models. Customers are asking for more help realizing business value from their technology investments. Service activities are generating more and more of the revenues and profits for traditionally product-centric companies. The level of traditional product revenues and product margins is receding. These are facts in the world of technology solutions. These tides have caused the profits from traditional product business models to recede and expose a rocky shore of uncertainty. There is a wave coming. Product companies will either be crushed by the weight or they will latch onto new business models that allow them to surf the surge. There will be little room for companies that simply want to tread water.