Embed Size (px)
Citation preview
Chapter 1
MODELING PATIENT FLOWS THROUGH THE HEALTHCARE SYSTEM
Randolph Hall, David Belson, Pavan Murali and Maged Dessouky Epstein Department of Industrial and Systems Engineering, 200 GER,University of Southern California, Los Angeles, California 90089-0193
Abstract: The system of health care can be evaluated from four perspectives: macro, regional, center, and department. In each case, reduction of patient delay depends on improving interfaces as patients are transferred from activity to activity or department to department. This chapter presents basic tools for resolving delays at interfaces, through mapping the processes by which patients are served, and by developing and implementing measures of system performance. These tools are demonstrated through a case study of the Los Angeles County/University of Southern California Hospital.
Key words: Process charts, performance measurement, healthcare systems
1. INTRODUCTION
Health care systems have been challenged in recent years to deliver high quality care with limited resources. In the United States, large segments of the population have inadequate health insurance coverage, forcing them to rely on an under funded public health system. At the national level, the National Institutes of Health has projected a steady increase in expenditures over the next 10 years, both in absolute terms and as a percentage of the gross-domestic-product (GDP). Total expenditures in year 2000 amounted to $1.3 trillion, or 13.2% of the GDP. While expenditures as a percentage of GDP held nearly constant between 1992 and 2000, they increased steadily from 5.2% to 13.1% in the 32-year period from 1960 to 1992. Due to aging of the population and increased costs of medical delivery, health-care costs are projected to increase to 15.9% of the GDP in 2010.
2 Chapter 1
Given the pressures to contain costs, it is critical for hospitals and health care systems to develop systems that ensure the best possible patient care within limited resources. An important aspect of this objective is to develop procedures to improve patient flow, to provide timely treatment and maximum utilization of available resources. Patient flow analysis represents the study of how patients move through the health-care system.
1.1 Emergency Departments: Example of System Delays
Emergency Departments (ED) are perhaps the most challenged components of the health-care system with respect to patient delay. Patients arrive at the emergency department through multiple channels, including walk-in (or drive-in) and ambulance. Depending on the nature of the emergency, the patient may be served through an ambulatory or a non-ambulatory section of the emergency department. The patient (or a friend) meets with a receptionist to collect background and information, and a nurse to triage (prioritize and stabilize) the patient. Patients are served by physicians and nurses in treatment rooms, which may be specialized to particular injuries (e.g., orthopedics) or specialized by level of urgency. Before treating the patient, tests (X-ray, CT Scan, MRI, etc.) may be needed through a radiology department. In some cases patients must be moved to an operating room for surgery. Once emergency treatment is completed, it may be necessary to admit the patient to the hospital, in which case the patient is exposed to additional processes and delays. Eventually, the patient undergoes a discharge process, and his or her bed must be prepared for the next patient.
As stated in a recent study by the American College of Emergency Physicians (ACEP, 2002b), "A multitude of factors are responsible for crowding, including higher patient acuity, prolonged ED evaluations, inadequate inpatient bed capacity, a severe nursing shortage, problems with access to on-call specialists and the use of the ED by those with no other alternative to medical care, such as the uninsured". In 2000, 108 million ED visits occurred in the United States, representing 39.4 visits per 100 people. Growth in ED visits has resulted from the combined effect of a reduction in the number of people with insurance coverage (just 40% of visits were paid through private or commercial insurance; McCaig and Burt, 2001) along with the mandate under the Emergency Medical Treatment and Labor Act (EMTLA) that EDs not refuse service to any patient on the basis of ability to pay (ACEP, 2002).
Emergency departments have been especially reliant on public sources, as people with no health insurance sometimes have no alternative for receiving
1. Modeling Patient Flows Through the HEALTHCARE System 3 medical care. In a recent survey, 78% of hospital administrators stated that their hospitals are inadequately reimbursed for emergency care, with 80% citing a “poor payer mix” (Greene, 1995). The mismatch between available funding and potential demand has made emergency departments particularly susceptible to patient delays, with their attendant consequences on quality of care (also see Derlet and Richards, 2000; Schneider et al, 2001, and Schull et al, 2001). For instance, Bindman et al (1991) found, in their study of San Francisco General Hospital, 15% had left the hospital before being called for their examination and that “almost twice as many patients who left without being seen reported at follow-up that their pain or the seriousness of their problem was worse.” (Dershewitze and Paichel (1986), Buesching et al (1985), Derlet and Nishio (1990) and Shaw et al (1990) provide additional studies of patients who did not receive care after visiting EDs.)
In this description, it should be apparent that medical care is delivered through a network of service stations, and that there is potential for delay in multiple locations. It should also be apparent that emergency departments, as a system, closely interact with other systems. Emergency departments are part of the “emergency medical system” (EMS), which includes the management of responders (fire, paramedic, ambulance), and the distribution of service among hospitals (e.g., the routing of an ambulance to a particular hospital). Emergency departments (EDs) also interact with general hospital care, as a frequent source of queueing is the inability to place a patient in a hospital bed once treatment is completed in the ED. Less obviously, emergency departments interact with clinical care, as ED demand is a byproduct of the patient’s ability to receive treatment through a primary care provider, access preventive care and adopt a healthy lifestyle.
1.2 Goal of Book
This book presents strategies, concepts and methods that can radically improve the delivery of health care by reducing delays. Our supposition is that much of the delay accepted by the public is both unnecessary and costly. Patients are harmed in the process of delay, not only through wasted time, but through unnecessary suffering, and through adverse medical outcomes. Health care providers are harmed through the added cost and reduced efficiency resulting from the complications of handling delayed patients. For these reasons, it is imperative for all providers to seek out and implement solutions that reduce delay.
The study of health care delay is an application of the discipline of queueing theory (i.e., the study of lines and waits). Health care is similar to other forms of queueing in these respects:
4 Chapter 1 • The demand for service is in part predictable (e.g., result of time-of-day
patterns) and in part random. • Health services require coordination of multiple resources, such as
physicians, medications, and diagnostic equipment. • Services are provided in multiple steps, through a network of services,
with the attendant issues of “grid lock” and “bottlenecks.” • Delays can be reduced through careful forecasting, scheduling, process
improvement and information management.
In these respects, reducing health care delays is similar to the efficient coordination of work in a factory. But health care has unique features, which demand specialized methods and research, as presented in this book. • Services can usually only be provided when the patient is physically
present (unlike a piece of work that can be dropped off and picked up later), which makes rapid service particularly important.
• A patient awaiting treatment may require significant continuing care (thus, waits translate into demand for more work).
• The outcome of the service – including survival, recovery time, and suffering -- is adversely affected by waits.
• Schedules and plans are likely to be disrupted due to the arrival of critical patients, who can both require an exceptional amount of attention, and be exceptionally urgent.
• A patient’s condition may independently change while waiting and require more or different care.
Foremost, however, health care is a system that can be improved through a better understanding of the system components and their relationships to each other, as will be discussed in the following section.
1.3 Modeling Health Care as a System
As should be apparent from the prior sections, EDs are but one component of the entire health care system, which might be better characterized as a system of systems, as described below.
1.3.1 Macro System
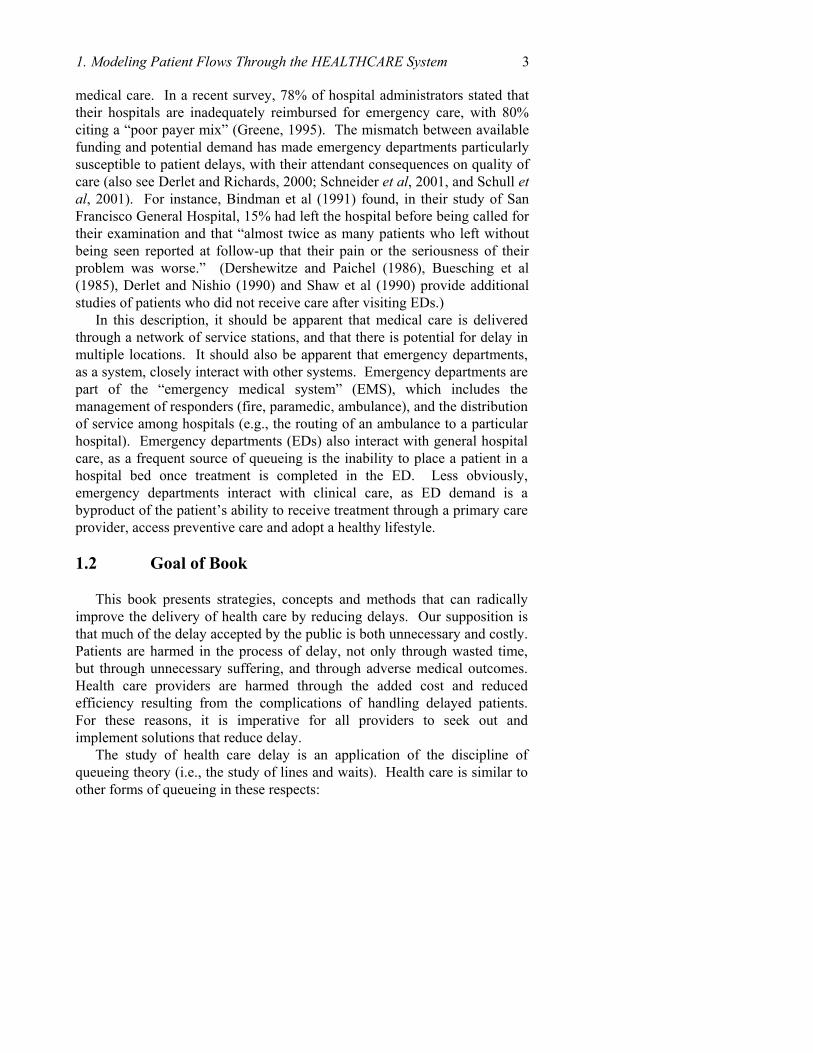
The macro system, depicted in Figure 1-1, encompasses the set of activities that affect a person’s well being, from birth to death. From the macro perspective an individual only leaves the health care system at the end of life because he or she is constantly making decisions and engaging in
1. Modeling Patient Flows Through the HEALTHCARE System 5 activities that affect his or her health, whether or not under the direct care of a health-care provider.
Figure 1-1 portrays six states of being, reflecting one’s state of health, and reflecting whether (and for what purpose) one is present at a health care facility. The state of recuperation, for instance, is a period of recovery spent outside of health facilities (typically at home), with diminished health and likely under the supervision of a physician (necessitating occasional post-care visits).1
Broadly speaking, the goals of the macro system are simple:
• Maximize the years from birth to death (length of life). • Maximize the proportion of one’s life spent in the “well” state. • Maximize the quality of life when not in the well state. Reducing patient delay and improving patient flow accomplish these macro goals by: (1) improving access to care, we increase expected length of life; (2) minimizing the length of time spent in undesirable states (e.g., at a health care facility awaiting treatment, undergoing treatment or recuperating from treatment); and (3) reducing waiting time until treatment, we improve quality of life when not well.
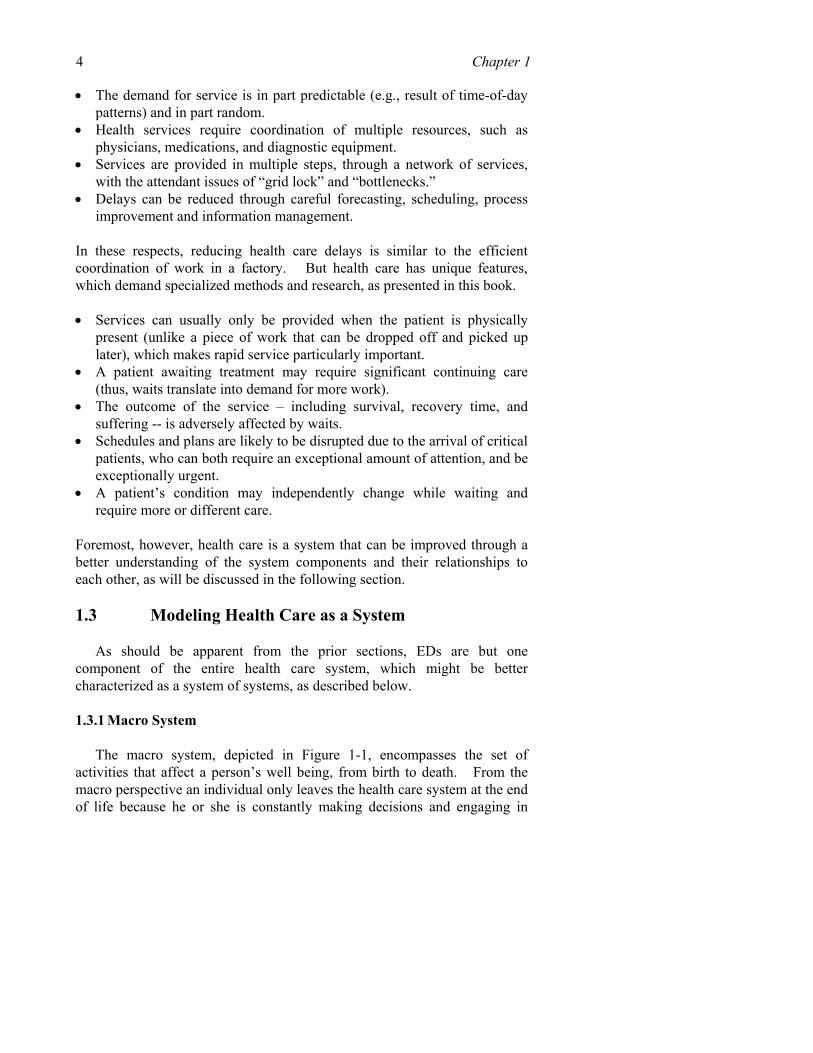
By improving access to care, we also hope to minimize the frequency by which we enter into the undesirable states (e.g., minimize dotted line transitions shown in Figure 1-1, such as becoming ill or being readmitted for new treatment after beginning recuperation) and maximize the likelihood of transitioning to a desirable state (e.g., bold line transitions, such as becoming well after being ill). More broadly, personal health is optimized through an inter-related set of actions over the course of one’s life, some of which are the consequence of health care delay, and some of which lead to changes in health care delay by changing societal demand for health services (Table 1-1).
1 The model is a simplification as it does not explicitly account for co-morbidities. For
certain chronic conditions, the patient may never be cured, but achieve an improved state of wellness, and patients may be cured of some conditions but not others.
6 Chapter 1
Figure 1-1. The Macro Health System
Table 1-1. Goals and Actions to Improve Macro Health
State Goal Actions ExamplesWell Maximize time in state
Minimize likelihood of presentinig well
Minimize Exposure, Personal Lifestyle, Reduce Societal Risks, self awareness of symptoms
Clean water and safe housing; stop smoking; no exposure to violence; patient education
Ill Minimize time until well or treatment
Self awareness of symptoms, self care when appropriate
Patient education; non-prescription medication
Recuperation Minimize time until well; Minimize likelihood of relapse
Home care, increase compliance; medication
Home nursing services; improved discharge instructions and assessment prior to discharge
Preventive Visit
Timely access to primary care Maximize likelihood of detection Apply appropriate care
Improve patient flow, apply appropriate diagnostics and preventive measures
Optimized appointments; apply appropriate tests based on risk factors; vaccinate on schedule
Treatment Visit Timely access and minimimum length of stay Successful treatment or medications
Improve patient flow, correct diagnosis, apply appropriate medical care
Optimized scheduling; apply appropriate care
Post-treatment Visit
Timely access to care Apply appropriate care
Improve patient flow, apply appropriate medical care
Optimized appointments; apply approprate care
Well
Ill
Recuperation
Preventive Visit
Treatment Visit
Post-care Visit
Home
Death
Well
Desirable Transition
Undesirable Transition
Neutral Transition
Birth
1. Modeling Patient Flows Through the HEALTHCARE System 7 1.3.2 The Regional Health System
While the macro system represents the state of individual health, the regional system portrays the organizational and functional relationships among health care processes. This is invariably a hierarchy, beginning with primary care providers, through private practices and local clinics; moving to secondary care providers, through community hospitals; and then moving to tertiary providers, through regional medical centers (some highly specialized quaternary care is only available at a few national centers). As the geographical scale becomes larger, increasingly specialized care becomes available, a consequence of scale economies and a consequence of aggregated patient demand. On the other end of the spectrum, more routine care is conveniently obtained from primary care providers. The primary, secondary and tertiary providers are augmented by ancillary services, such as MRI centers, laboratories or dialysis facilities, which may support multiple providers (again influenced by scale economies); continuing care facilities, such as nursing homes; or, on a more basic scale, pharmacies.
Many variations exist within this general framework, which has evolved over time as more specialized treatments have become available, health care plans have changed, costs have changed and people have become more mobile. On one hand, by creating multiple layers of care, some delays are inevitably created due to increasing difficulty of access. On the other hand, without multiple layers, some types of specialty care would not be available at all due to insufficiently trained care-givers or simply cost. Yet it is clear that the regional/national system should be designed with three (somewhat conflicting) goals in mind:
• Minimizing the cost of providing desired services. • Maximizing convenience and access to services that individuals need. • Maximizing the likelihood of a positive health outcome from service.
Reducing health care delay contributes to all three goals by: (1) removing inefficiencies in the provision of services, thus reducing cost, (2) providing timely access to the services people need, and (3) reducing waits for needed services.
It should be recognized that the regional health system is in part the result of deliberate planning (e.g., design of the emergency medical system and designation of trauma centers), in part due to happenstance (e.g., where hospitals happened to develop many years ago), in part due to market pressures (e.g., competition for patients among facilities and health plans), and in part due to factors that originate from outside the region (e.g., regulations, medical discoveries, and medical training). Thus, it would be
8 Chapter 1 impossible to fully optimize such a system, though it might be steered in a desirable direction.
1.3.3 Health Care Center
The center is a grouping of geographically proximate facilities under the management of one organization. At a minimum, this entails two or more interacting departments, each with a distinct function (e.g., a laboratory and an outpatient clinic). At a maximum, this could encompass a larger tertiary care medical center with dozens of departments.
A health care center operates as a system of interacting departments, which must be coordinated through the flow of patients, specimens, employees, information, materials and pharmaceuticals. The center leadership, facility design, organizational design, employee training and recruitment are all important factors. Centers can sometimes represent enormous multi-billion dollar investments, and are frequently judged based on standards of financial return, quality of care and medical outcomes. Patient flow is particularly important for centers, as flow from department to department needs coordination; otherwise delays at the interfaces can be significant. During a typical center visit, the patient may separately encounter waits for these services:
• Information collection as part of admission • Diagnostics and examinations • Procedures, surgeries and therapies • Education • Rehabilitation and recuperation • Transportation between departments • Discharge processes
In the background, patients may be delayed waiting for ancillary services, many of which are invisible to patients: • Transfer of medical records • Transfer and analysis of laboratory specimens • Filling prescriptions • Housekeeping to prepare rooms for new patients • Communication among departments, scheduling and decision-making in
preparation for patient arrivals • Movement and availability of wheel chairs, gurneys, and other portable
equipment • Completion of required paperwork for internal or governmental use.
1. Modeling Patient Flows Through the HEALTHCARE System 9
Thus, patient delays depend in part how he or she physically flows through the center, and in part on how information, equipment and other objects flow through the center.
In summary, the system for managing patient flows in a center should be designed and operated to achieve these goals:
• Minimizing waits as patients transition from department to department. • Achieving a high level of synchronization among patients, employees
and resources, so that services begin promptly on patient arrival and are provided with high efficiency.
• Identifying and resolving system level bottlenecks that impede the flow of patients. These goals can only be achieved through effective coordination and
communication, combined with constant attention to patient service.
1.3.4 Department
The department is the most microscopic of the systems we consider. It represents a unit within a larger center oriented toward performing a single function, or a group of closely related functions. Examples include the ED, surgery, radiology, or an inpatient ward. A department could also be ancillary, such as house-keeping, medical records, or transportation. For the patient, departments typically have clearly defined points of entry and points of exit, which may be time-stamped and correspond to responsibilities for care. Like whole centers, departments are often judged based on financial return. Medical outcomes and quality of care, however, are often more difficult to assess at the department level, as these depend on the totality of service provided by the center over the entire duration of stay.
With respect to patient flow, departments must both support the mission of the center as a whole through effective coordination, and be effective in their own right. Neither should a department create unnecessary delay within, nor should they impose delay elsewhere (e.g., delays in accepting patients, or by failing to prepare a patient for transfer when he or she is needed elsewhere). The employees must be trained and rewarded for the priority of minimizing delays through prompt service; they should employ realistic appointment systems; they should ensure proper staffing, and advance planning prior to the arrival of patients.
Later in this chapter we will use a case study to explore, in depth, patient flow issues at the department and center levels.
10 Chapter 1 1.4 Highly Congested Systems
Another unusual, though not entirely unique, property of health care systems is extreme congestion, meaning that patients have a high likelihood of encountering delay. In part, this is due to inattention to patient flow issues. However, it is also partly due to the financial structure of health care.
Again, we turn to EDs. For major public hospitals in particular, demand for service can be so large that the system rarely empties of waiting patients, either because the ED itself has insufficient capacity, or because the hospital’s wards are not absorbing the inflow of patients, thus causing spillback into the ED. For this reason, contrary to conventional queueing models, the system arrival rate exceeds the system service capacity over extended periods – perhaps perpetually. As a result, the system resides in a state of dysfunctional equilibrium, where the only thing that keeps queues from growing without bound is the propensity of some patients to leave without being seen when waits are intolerable (Figure 1-2), some of whom may return later, possibly in a worsened state, and some of whom will never receive needed treatment. At times when waits become particularly long, more patients will opt to leave without being seen, either immediately at time of arrival, or subsequently after becoming frustrated with the wait, bringing waits back into balance. When waits become shorter, fewer patients leave, causing waits to gradually build again.
Highly congested queues exist in other contexts, such as Immigration/Naturalization Service Offices, Motor Vehicle Departments and public housing. A common characteristic is that the service provider has limited economic incentive to add capacity (because it is operated at a loss), or re-price service (because EMTALA prohibits financial screening). In fact, in some circumstances, the attraction of "latent demand" (customers who would otherwise leave) may mean that an increase in capacity causes cost to increase, but only slightly reduces average waits. To draw an analogy, expansion of highway capacity may have only small effects on congestion as overall traffic volumes increase.
Another important consideration in highly congested queueing systems is degradation in the ability to deliver quality service. Crowding in waiting rooms and treatment areas, loss in privacy, delays in accessing needed equipment, and delays in providing medication can all add to patient suffering. Continual queueing de-motivates employees, as no matter how hard they work patients will still be queued. And service will be unproductive, as patients must be shuttled in and out of treatment rooms as they wait for test results or resources. Crowding can also lead to diversion of ambulances to more distant hospitals, slowing the time until patients can be treated (ACEP, 1999; Litvak et al, 2001). For all of these reasons, it is
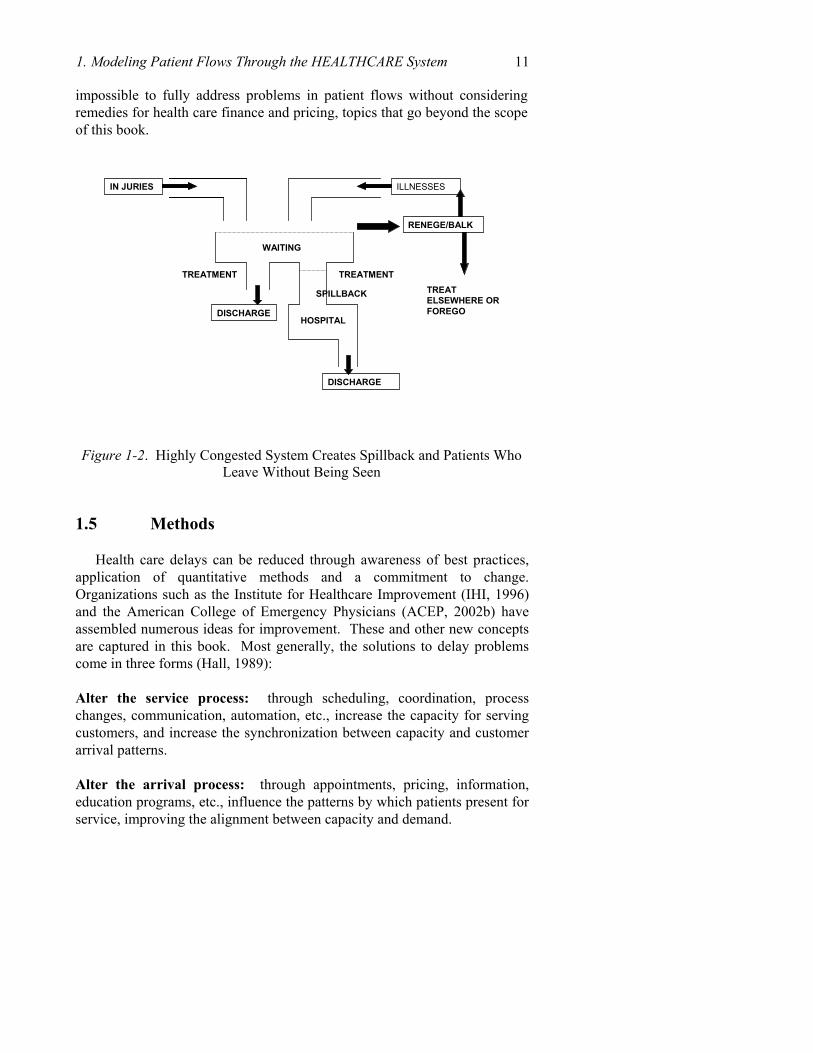
1. Modeling Patient Flows Through the HEALTHCARE System 11 impossible to fully address problems in patient flows without considering remedies for health care finance and pricing, topics that go beyond the scope of this book.
Figure 1-2. Highly Congested System Creates Spillback and Patients Who Leave Without Being Seen
1.5 Methods
Health care delays can be reduced through awareness of best practices, application of quantitative methods and a commitment to change. Organizations such as the Institute for Healthcare Improvement (IHI, 1996) and the American College of Emergency Physicians (ACEP, 2002b) have assembled numerous ideas for improvement. These and other new concepts are captured in this book. Most generally, the solutions to delay problems come in three forms (Hall, 1989):
Alter the service process: through scheduling, coordination, process changes, communication, automation, etc., increase the capacity for serving customers, and increase the synchronization between capacity and customer arrival patterns.
Alter the arrival process: through appointments, pricing, information, education programs, etc., influence the patterns by which patients present for service, improving the alignment between capacity and demand.
IN JURIES ILLNESSES
WAITING
TREATMENT TREATMENT
DISCHARGE
DISCHARGE
HOSPITAL
RENEGE/BALK
SPILLBACK TREAT ELSEWHERE ORFOREGO
12 Chapter 1
Alter the queueing process: through triage, moving waiting from the health care facility to the home, redesign of waiting areas, changes in prioritization, etc., ensure that the adverse consequences of waiting are minimized.
These three steps form a hierarchy, as the first priority should be
optimizing service to meet the needs of patients; when this is infeasible or uneconomical, explore changes to patient patterns; and, if all else fails, focus on managing queues to maximum efficiency.
Within this chapter, we provide basic methods of industrial engineering that can be used to develop all three types of patient flow solutions. Our principal focus here is process planning (representing the steps needed to deliver service and the interactions between process steps), and performance measurement. These techniques are widely used to improve the performance of manufacturing, distribution and transportation systems, and are emerging as promising approaches to improve health care.
Process planning is an approach for documenting the steps entailed in delivering patient care (or an ancillary process), and redesigning the process for improved efficiency. We will show how to plan a series of process for patient service, and we will show how to plan for the physical movement of patients. Process planning can be an effective first step toward change as it can reveal the weaknesses and strengths of the current system, and identify methods of improvement.
Performance measurement entails identifying the system goals and the measures by which attainment of the goals are judged. To be effective, performance measurement should be embedded in the continuing operation of the system, so that key decisions are influenced and evaluated, according to established objectives (JCAHO Standard LD.3.11 recommends that management identify critical patient flow processes as well as monitor relevant measures.) Performance measurement should also be transparent to all involved, so that they can witness how their actions affect the overall performance of the system, so that they can be alerted to problems when they occur, and so that they are recognized for their accomplishments. Example measures include waiting time (by step or location), number of patients waiting, number of patients served, patient satisfaction, utilization of resources and costs. Performance measurement is ultimately useful as an approach for obtaining an accurate and meaningful picture of patient flow and helping determine where improvements can be made. Unfortunately, many hospitals have considerable difficulty making such measurements due to inadequate computer information systems or due to not having the financial resources to create and operate the necessary information system.
1. Modeling Patient Flows Through the HEALTHCARE System 13 2. CASE STUDY: LOS ANGELES COUNTY HOSPITAL
The Los Angeles County/University of Southern California (LAC/USC) Hospital is used as a case study to demonstrate how the techniques of patient flow analysis can be used to create a system model of a center and its departments, and used to improve services. LAC/USC is a large urban health center serving a largely poor population. It is also the trauma center for central Los Angeles, with the busiest ED in the country, measured in admissions. Approximately 85% of the patients admitted to beds in the hospital enter through the ED.
LAC/USC, including the General Hospital (GH) and its allied Outpatient Department (OPD) and Community Health Centers (CHC), was studied as an integrated system, to identify bottlenecks and recommend improvements. This goal has been accomplished through a series of interviews with administration in 35 hospital departments, as well as focus groups with nurses, doctors, and analysts. Through these meetings we have documented the processes in place for resource scheduling, patient triage, and patient routing; and we have documented care-giver perceptions of critical issues and problems in serving patients.
Separately, we have obtained, reviewed and analyzed data sources to determine their usefulness for monitoring and evaluating patient flows. We have also performed sample analyses to demonstrate patterns of patient arrivals and interdepartmental flows.
These data sources were used to create process charts that show flows through the hospital as a whole, as well as flows within individual departments. Through our analysis of these charts, as well as our own observations, we developed a series of recommendations for improving patient flows within short-term and long-term time frames, with a focus on improving the coordination among hospital departments. Follow-up studies are in process, with focus on radiology and orthopedic surgery.
2.1 Process Map for Center and Aggregate Flows
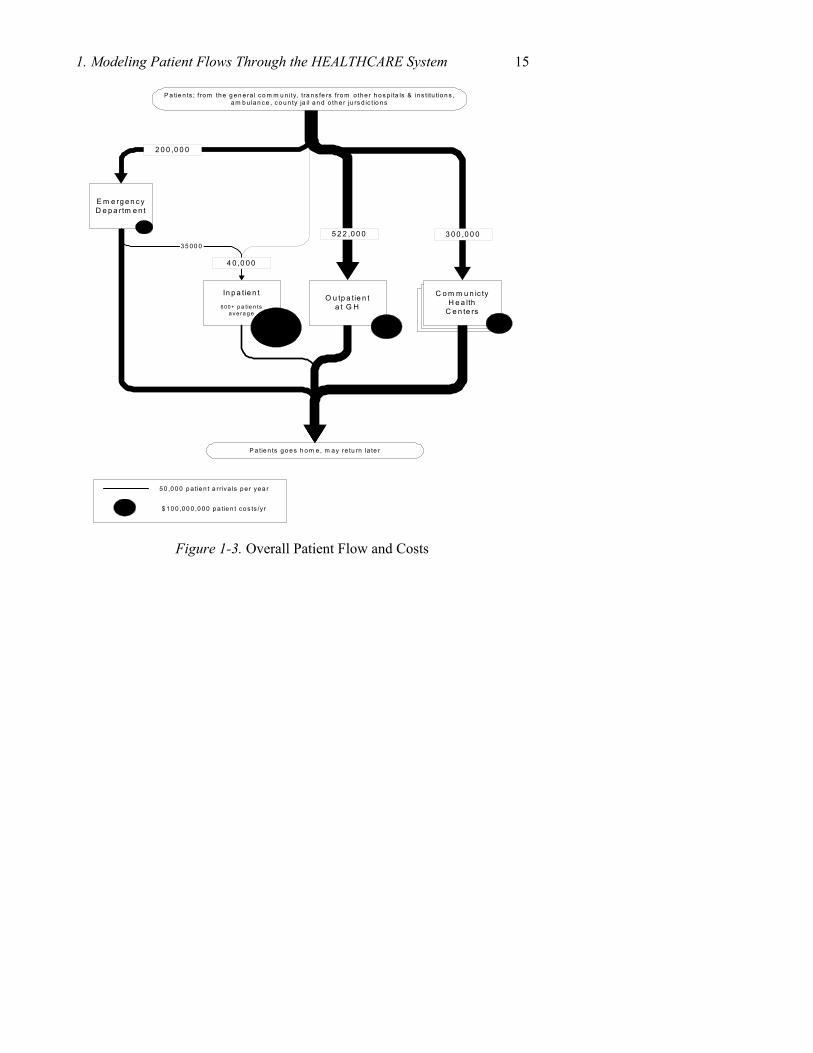
Patient flow within the center can be viewed at several levels of detail. At the highest level, the center consists of four primary areas: Emergency, Inpatient, Outpatient and the Community Health Centers. Patients frequently move between them and some may visit all four in the course of a year. The patient flow and related costs are summarized in Table 1-2.
14 Chapter 1
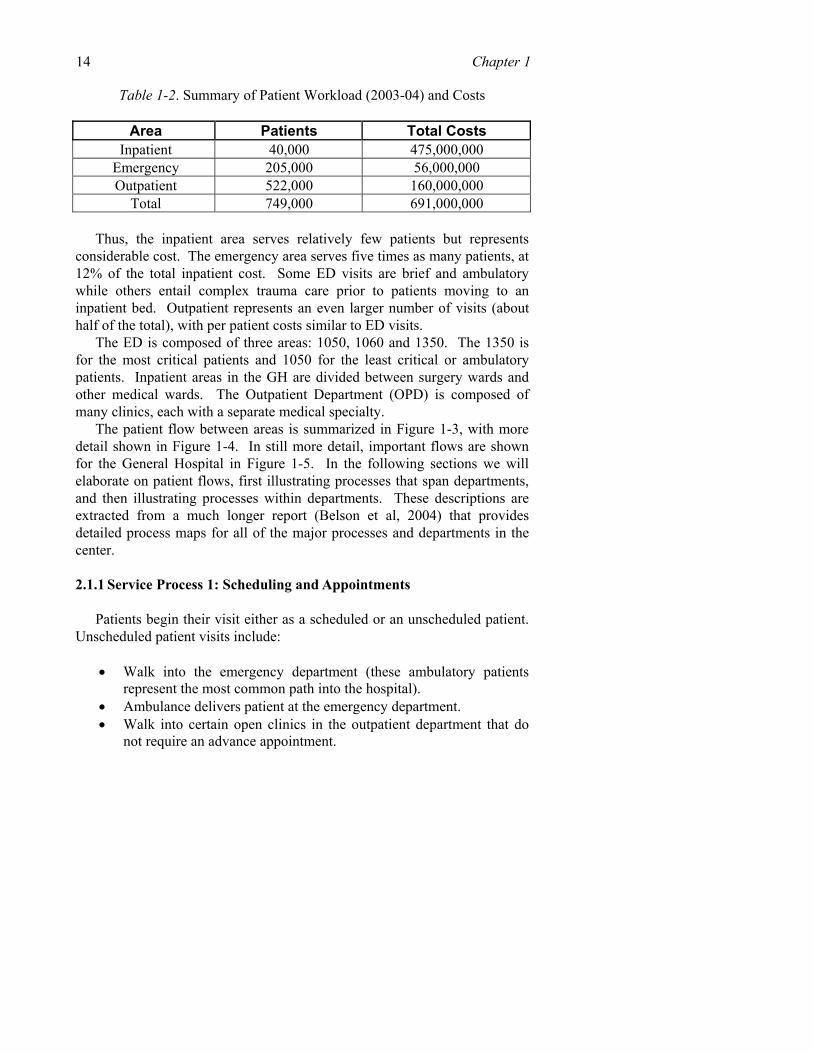
Table 1-2. Summary of Patient Workload (2003-04) and Costs
Area Patients Total Costs Inpatient 40,000 475,000,000
Emergency 205,000 56,000,000 Outpatient 522,000 160,000,000
Total 749,000 691,000,000 Thus, the inpatient area serves relatively few patients but represents
considerable cost. The emergency area serves five times as many patients, at 12% of the total inpatient cost. Some ED visits are brief and ambulatory while others entail complex trauma care prior to patients moving to an inpatient bed. Outpatient represents an even larger number of visits (about half of the total), with per patient costs similar to ED visits.
The ED is composed of three areas: 1050, 1060 and 1350. The 1350 is for the most critical patients and 1050 for the least critical or ambulatory patients. Inpatient areas in the GH are divided between surgery wards and other medical wards. The Outpatient Department (OPD) is composed of many clinics, each with a separate medical specialty.
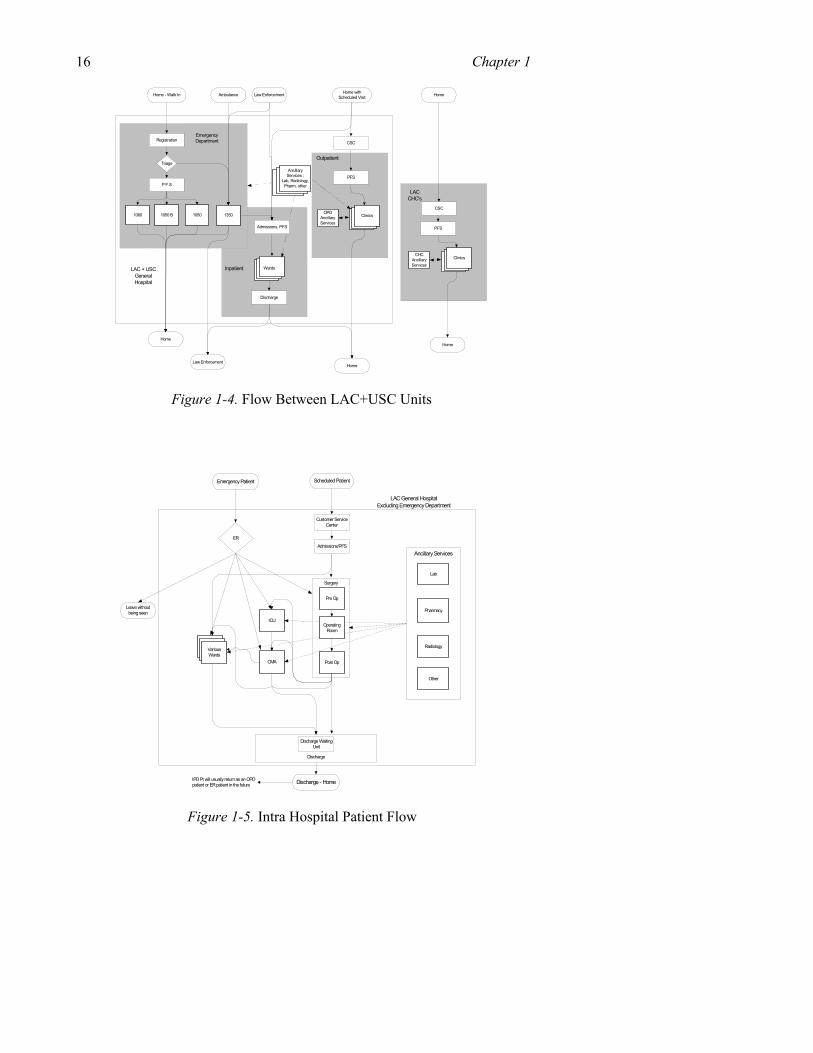
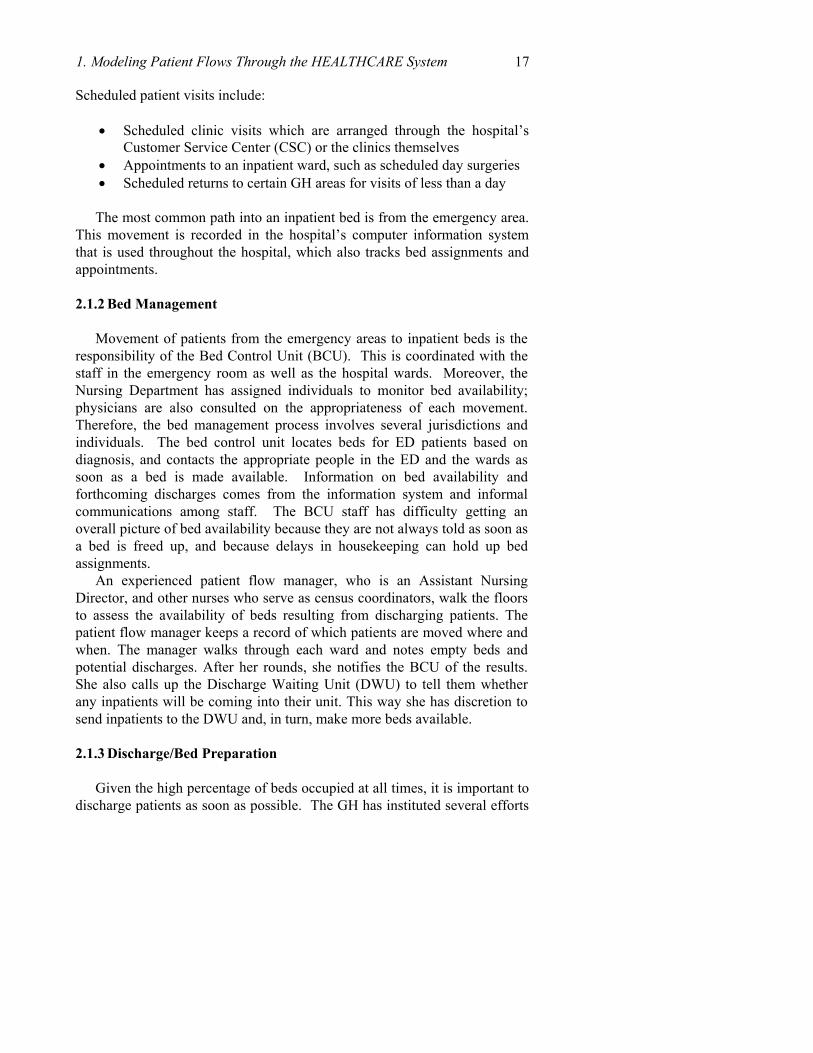
The patient flow between areas is summarized in Figure 1-3, with more detail shown in Figure 1-4. In still more detail, important flows are shown for the General Hospital in Figure 1-5. In the following sections we will elaborate on patient flows, first illustrating processes that span departments, and then illustrating processes within departments. These descriptions are extracted from a much longer report (Belson et al, 2004) that provides detailed process maps for all of the major processes and departments in the center.
2.1.1 Service Process 1: Scheduling and Appointments
Patients begin their visit either as a scheduled or an unscheduled patient. Unscheduled patient visits include:
• Walk into the emergency department (these ambulatory patients
represent the most common path into the hospital). • Ambulance delivers patient at the emergency department. • Walk into certain open clinics in the outpatient department that do
not require an advance appointment.
1. Modeling Patient Flows Through the HEALTHCARE System 15
C o m m u n ic tyH e a lth
C e n te rs
C o m m u n ic tyH e a lth
C e n te rs
E m e rg e n c yD e p a rtm e n t
In p a tie n t
6 00 + p a tie n tsa ve ra g e
O u tp a tie n ta t G H
C o m m u n ic tyH e a lth
C e n te rs
3 5 0 0 0
P a tie n ts g o e s h o m e , m a y re tu rn la te r
2 0 0 ,0 0 0
4 0 ,0 0 0
5 2 2 ,0 0 0 3 0 0 ,0 0 0
5 0 ,0 0 0 p a tie n t a r riva ls p e r ye a r
$ 1 0 0 ,0 0 0 ,0 0 0 p a tie n t co s ts /yr
P a tie n ts ; f ro m th e g e n era l co m m u n ity, tra n s fe rs fro m o the r h o s p ita ls & in s titu tio n s ,a m b u lan ce , c o u n ty ja il a n d o th e r ju rs d ic tio n s
Figure 1-3. Overall Patient Flow and Costs
16 Chapter 1
Law Enforcement Home withScheduled Visit
Registration
Triage
1060 1050 13501050 B
P F S
Wards
Discharge
CSC
PFS
Clinics
CSC
PFS
CHCAncillaryServices
Clinics
HomeLaw Enforcement
AmbulanceHome - Walk In
EmergencyDepartment
Inpatient
Outpatient
Home
AncillaryServices ;
Lab, Radiology,Pharm, other
Admissions, PFS
OPDAncillaryServices
Home
Home
LAC + USCGeneralHospital
LACCHC's
Figure 1-4. Flow Between LAC+USC Units
Surgery
ICU
Post OpCMA
Ancillary Services
Lab
Admissions/PFS
Scheduled PatientEmergency Patient
OperatingRoom
Pre Op
Discharge - Home
ER
SurgeryVariousWards
Discharge
Pharmacy
Radiology
Other
LAC General HospitalExcluding Emergency Department
IPD Pt will usually return as an OPDpatient or ER patient in the future
Customer ServiceCenter
Leave withoutbeing seen
Discharge WaitingUnit
Figure 1-5. Intra Hospital Patient Flow
1. Modeling Patient Flows Through the HEALTHCARE System 17 Scheduled patient visits include:
• Scheduled clinic visits which are arranged through the hospital’s
Customer Service Center (CSC) or the clinics themselves • Appointments to an inpatient ward, such as scheduled day surgeries • Scheduled returns to certain GH areas for visits of less than a day
The most common path into an inpatient bed is from the emergency area.
This movement is recorded in the hospital’s computer information system that is used throughout the hospital, which also tracks bed assignments and appointments.
2.1.2 Bed Management
Movement of patients from the emergency areas to inpatient beds is the responsibility of the Bed Control Unit (BCU). This is coordinated with the staff in the emergency room as well as the hospital wards. Moreover, the Nursing Department has assigned individuals to monitor bed availability; physicians are also consulted on the appropriateness of each movement. Therefore, the bed management process involves several jurisdictions and individuals. The bed control unit locates beds for ED patients based on diagnosis, and contacts the appropriate people in the ED and the wards as soon as a bed is made available. Information on bed availability and forthcoming discharges comes from the information system and informal communications among staff. The BCU staff has difficulty getting an overall picture of bed availability because they are not always told as soon as a bed is freed up, and because delays in housekeeping can hold up bed assignments.
An experienced patient flow manager, who is an Assistant Nursing Director, and other nurses who serve as census coordinators, walk the floors to assess the availability of beds resulting from discharging patients. The patient flow manager keeps a record of which patients are moved where and when. The manager walks through each ward and notes empty beds and potential discharges. After her rounds, she notifies the BCU of the results. She also calls up the Discharge Waiting Unit (DWU) to tell them whether any inpatients will be coming into their unit. This way she has discretion to send inpatients to the DWU and, in turn, make more beds available.
2.1.3 Discharge/Bed Preparation
Given the high percentage of beds occupied at all times, it is important to discharge patients as soon as possible. The GH has instituted several efforts
18 Chapter 1 to improve this aspect of patient flow, including creating committees charged with removing bottlenecks, implementing buffers between processes to reduce queuing, creating a housekeeping group specialized for making the rooms ready for new patients, and creating a discharge waiting room. The nursing staff records the availability of a bed within the information system, which provides automatic notification to housekeeping that a room needs to be cleaned, which then assigns cleaning staff. However, delays sometimes force nurses to clean rooms, and because there is some ambiguity as to when the cleaning is completed, there can be confusion as to when a new patient can be assigned to a bed.
2.1.4 Staffing
Nursing administration uses the number of patients and their levels of acuity in the various wards as a basis for its staffing decisions. Other than nursing, hospital staffing levels do not fluctuate greatly from day-to-day and are based on budgetary decisions concerning each functional area. A common issue is unfilled positions, as well as absenteeism.
The nursing organization is large; there are about 1,875 RN’s and LVN’s and a total of about 2,700 nurses. The director of nursing has a staffing office where they primarily accumulate the staffing information. Staffing, vacations and rotation are determined at the Nurse Manager level. The nursing department uses a computer system, which reports and records the daily staffing, but actual work schedules are largely planned manually. Staffing levels are based on an acuity system. A computer system processes acuity information on the mix of patients in each area and determines the desired level of staffing. Schedules for nurses are generally posted six weeks in advance but are adjusted more frequently. The staffing levels are fairly stable but the number of nurses available changes often – and is a major challenge. To manage the staff to patient ratio, which is monitored closely, there are several available options: (1) Overtime for nurses currently working, (2) Registry (the use of outside contractors), (3) Pool nurses, shared among departments, which is limited, (4) Close beds to reduce the requirement for staff.
2.1.5 Admission/Registration/PFS
A patient’s entry to the hospital’s data is recorded at a number of points for inpatients and outpatients. Generally this represents the entry of the patient into the information system to record a visit. Each patient is assigned a unique ID number (an “MRUN” number) on the initial visit that is used for all subsequent visits. Each visit of the patient is recorded as an “Account” in the information system.
1. Modeling Patient Flows Through the HEALTHCARE System 19
Patient Financial Services (PFS) personnel are responsible for gathering information about the patient so that it can be reimbursed. They enter demographic data about a patient or “register” them in the system. If they detect an existing MRUN number, they locate it. If not, they generate a new one for the patient. PFS also explains financial obligations to patients.
PFS responsibilities are time consuming. They must get the general consent form completed for each patient, distribute brochures, work with triage nurses to complete patient registration, initiate the patient chart, complete a limited financial screening and provide insurance information. For outpatient areas, certain patients meet with PFS. They can determine PFS need by looking at the backside of the patient’s ID card that they have received from a previous visit. Scheduled admissions and day surgery patients are financially screened by PFS prior to coming for surgery.
2.1.6 Transportation
LA County supplies patient transportation between the hospital and the outside by telephone requests by patients and by the hospital to the County’s service, when the patients cannot provide it themselves. An internal transport unit sometimes supplies patient transportation by wheelchair or gurney within the hospital, but often nursing moves the patient when the transport group represents a delay. Transportation delays are common due to insufficient staffing and the difficulties in navigating through a crowded hospital. Elevator waits can also be long. These delays create a cascading effect, and have a significant impact on surgery, radiology and bed utilization, as resources can be left idle while waiting for patients, or because appointment systems cannot be followed due to delays.
2.1.7 Medical Records
Hospital Information Management (HIM) is responsible for storage and access to patient medical records (charts). They store a large volume of paper records in the hospital basement and use long-term storage off site. LAC/USC is moving to a more digital system with images of records and transcribed doctor notes. This should dramatically change the physical logistic issues, as well as provide more timely access to records, which can in turn reduce delays in surgery and other locations.
HIM has several functions: maintenance of medical records for each patient, assuring their completeness, copying the chart for several types of requests, and alerting clinicians for missing chart elements. They also make sure that the records follow professional and legal guidelines. They store about 1,000,000 charts at the hospital (basement) and 2,500,000 at an offsite
20 Chapter 1 warehouse. More information is stored in the paper chart than in the information system. The chart has the patient’s laboratory results, radiology results, X-ray results, etc. These are all bound in the patient’s chart folder.
The Central Discharge Unit (CDU) clerk checks through the information system three times a day for discharges. After the discharges have been identified, a clerk from the CDU visits the wards to pick up the patients’ charts. This is done between 3.30 – 4.00 pm and 7.30 – 8.00 pm. The CDU keeps track of the records of the inpatients, scheduled admissions and day surgeries.
All charts go through a “coding” process where data are added to the record for statistical and research purposes. The next stage is “abstracting” information, such as length of state, the Rx, tests ordered, physician attending, etc. This is done within 24 hours of the time the chart is brought to the CDU. If a chart is deficient, then it is stacked on the shelves in the CDU for the physician to complete. Also, the HIM staff visits the wards three times a week to identify data deficiencies before a patient is discharged, reducing the time wasted in waiting for a physician to complete the chart.
Patients who have transferred from other hospitals have a copy of their chart brought to LAC GH. This copy is included in the chart at the GH. When they return to their initial clinic or hospital, GH sends a copy of their new GH records along with the patient. They also receive about 3,000-3,500 requests a month from patients requesting a copy of their records.
2.2 Flows for Key Departments
At this point we turn to patient flows within individual departments. Several key departments are used for illustration: (1) Emergency, (2) Radiology, (3) Pharmacy, (4) Laboratory and (5) Surgery
2.2.1 Emergency Department
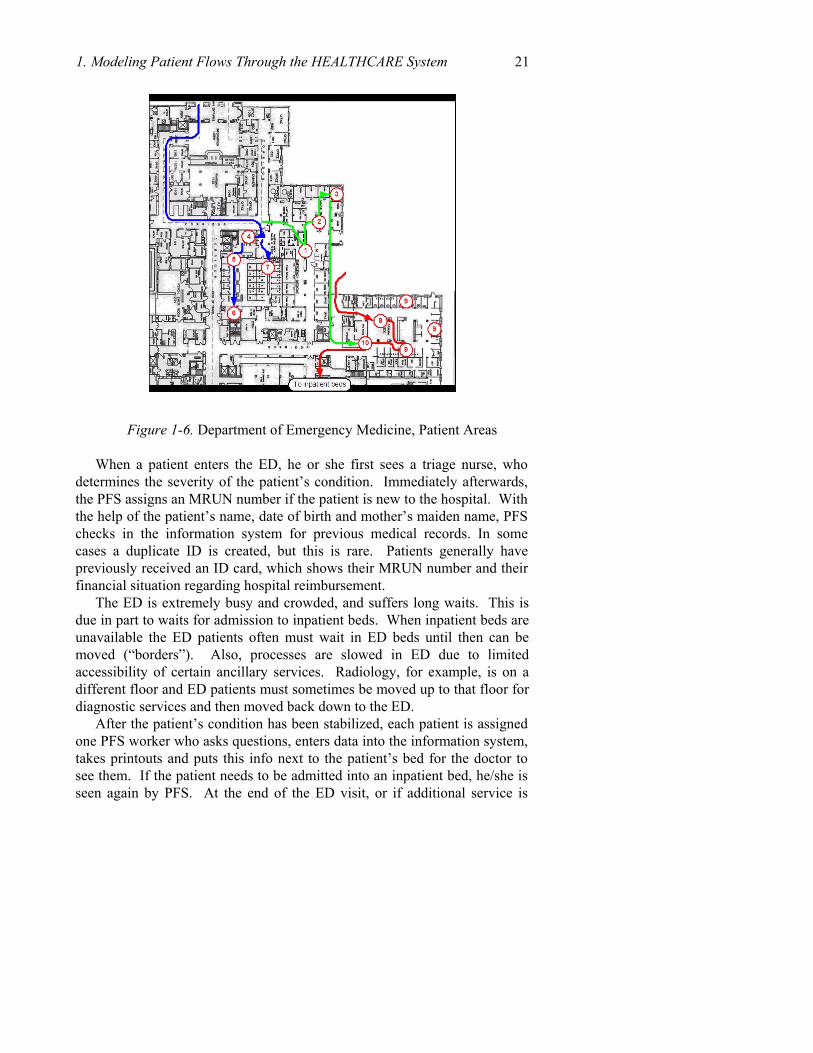
The ED is organized into three areas: Major medical/trauma (Room 1350), Minor Medical/Trauma (Room 1060) and ED Walk-in (Room 1050). The room numbers are used as the departmental identifier. Each has a separate physical area (Figure 1-6 and Figure 1-7). Each also serves a different set of patients.
1. Modeling Patient Flows Through the HEALTHCARE System 21
Figure 1-6. Department of Emergency Medicine, Patient Areas When a patient enters the ED, he or she first sees a triage nurse, who
determines the severity of the patient’s condition. Immediately afterwards, the PFS assigns an MRUN number if the patient is new to the hospital. With the help of the patient’s name, date of birth and mother’s maiden name, PFS checks in the information system for previous medical records. In some cases a duplicate ID is created, but this is rare. Patients generally have previously received an ID card, which shows their MRUN number and their financial situation regarding hospital reimbursement.
The ED is extremely busy and crowded, and suffers long waits. This is due in part to waits for admission to inpatient beds. When inpatient beds are unavailable the ED patients often must wait in ED beds until then can be moved (“borders”). Also, processes are slowed in ED due to limited accessibility of certain ancillary services. Radiology, for example, is on a different floor and ED patients must sometimes be moved up to that floor for diagnostic services and then moved back down to the ED.
After the patient’s condition has been stabilized, each patient is assigned one PFS worker who asks questions, enters data into the information system, takes printouts and puts this info next to the patient’s bed for the doctor to see them. If the patient needs to be admitted into an inpatient bed, he/she is seen again by PFS. At the end of the ED visit, or if additional service is
22 Chapter 1 needed, such as admission to an inpatient bed, then the patient receives “financial screening” from PFS.
W a lk I n A m b u la n c e
1 0 5 0T r ia g e
1 3 5 0T r ia g e
1 0 5 0E x a m
1 0 6 0E x a m
1 3 5 0E x a m
H o m e
1 3 5 0B o o th
S u r g e A r e a
In p a t ie n tB e d
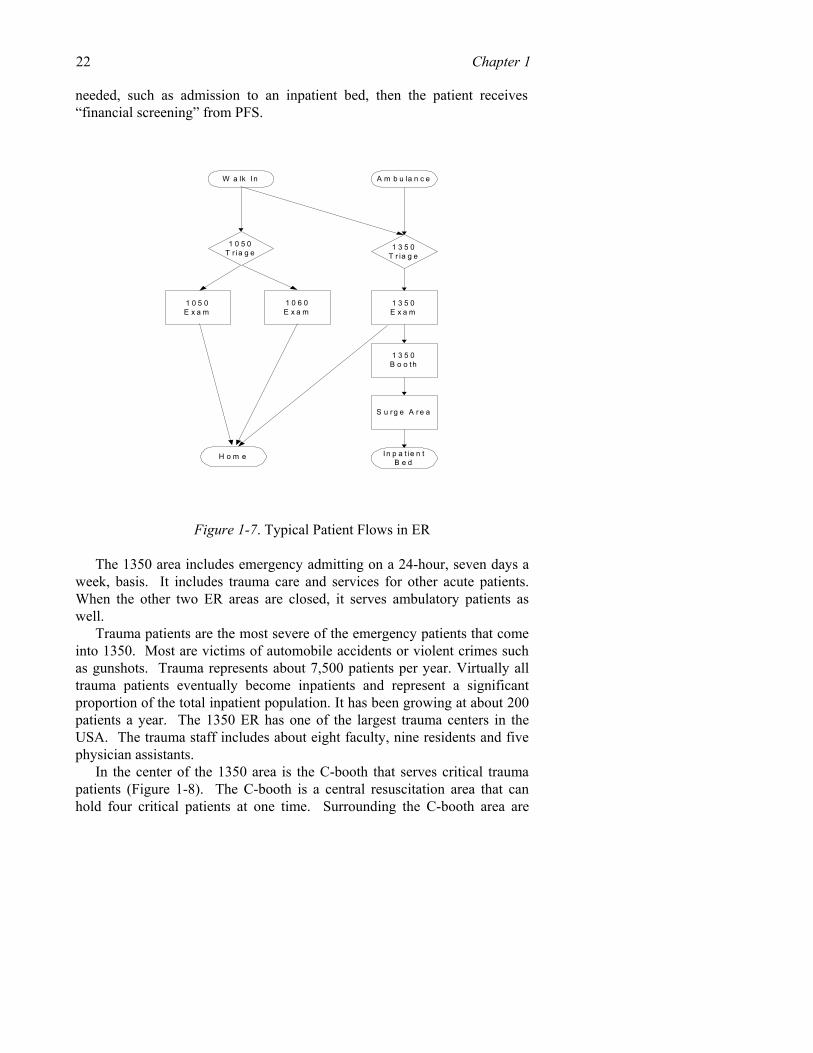
Figure 1-7. Typical Patient Flows in ER The 1350 area includes emergency admitting on a 24-hour, seven days a
week, basis. It includes trauma care and services for other acute patients. When the other two ER areas are closed, it serves ambulatory patients as well.
Trauma patients are the most severe of the emergency patients that come into 1350. Most are victims of automobile accidents or violent crimes such as gunshots. Trauma represents about 7,500 patients per year. Virtually all trauma patients eventually become inpatients and represent a significant proportion of the total inpatient population. It has been growing at about 200 patients a year. The 1350 ER has one of the largest trauma centers in the USA. The trauma staff includes about eight faculty, nine residents and five physician assistants.
In the center of the 1350 area is the C-booth that serves critical trauma patients (Figure 1-8). The C-booth is a central resuscitation area that can hold four critical patients at one time. Surrounding the C-booth area are
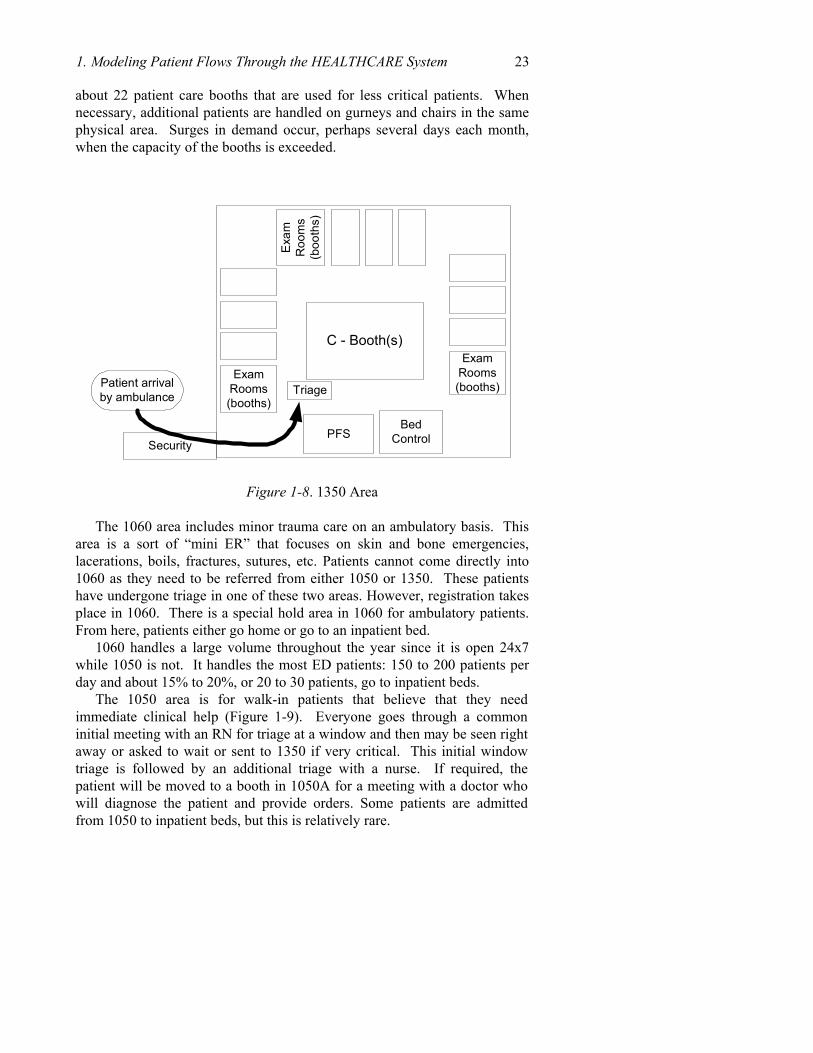
1. Modeling Patient Flows Through the HEALTHCARE System 23 about 22 patient care booths that are used for less critical patients. When necessary, additional patients are handled on gurneys and chairs in the same physical area. Surges in demand occur, perhaps several days each month, when the capacity of the booths is exceeded.
C - Booth(s)
ExamRooms(booths)
PFSBed
Control
Triage
ExamRooms(booths)
Exa
mR
oom
s(b
ooth
s)
Patient arrivalby ambulance
Security
Figure 1-8. 1350 Area The 1060 area includes minor trauma care on an ambulatory basis. This
area is a sort of “mini ER” that focuses on skin and bone emergencies, lacerations, boils, fractures, sutures, etc. Patients cannot come directly into 1060 as they need to be referred from either 1050 or 1350. These patients have undergone triage in one of these two areas. However, registration takes place in 1060. There is a special hold area in 1060 for ambulatory patients. From here, patients either go home or go to an inpatient bed.
1060 handles a large volume throughout the year since it is open 24x7 while 1050 is not. It handles the most ED patients: 150 to 200 patients per day and about 15% to 20%, or 20 to 30 patients, go to inpatient beds.
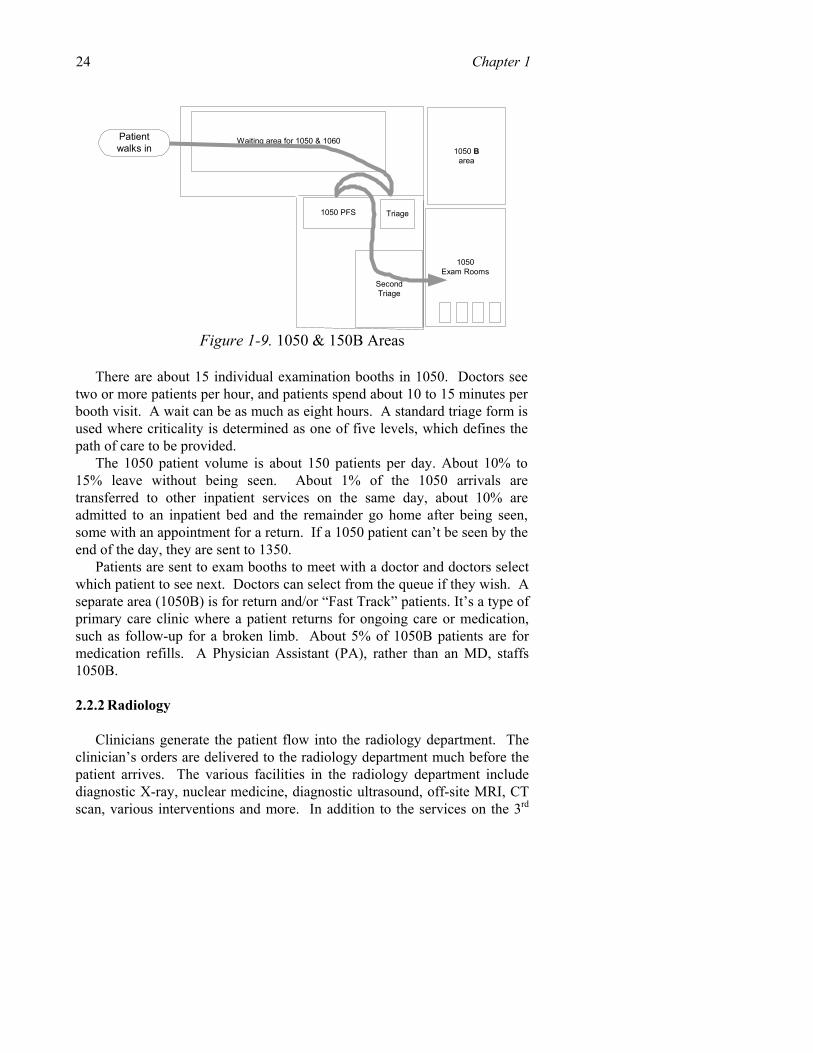
The 1050 area is for walk-in patients that believe that they need immediate clinical help (Figure 1-9). Everyone goes through a common initial meeting with an RN for triage at a window and then may be seen right away or asked to wait or sent to 1350 if very critical. This initial window triage is followed by an additional triage with a nurse. If required, the patient will be moved to a booth in 1050A for a meeting with a doctor who will diagnose the patient and provide orders. Some patients are admitted from 1050 to inpatient beds, but this is relatively rare.
24 Chapter 1
1050 PFS Triage
SecondTriage
1050Exam Rooms
Waiting area for 1050 & 1060Patientwalks in 1050 B
area
Figure 1-9. 1050 & 150B Areas
There are about 15 individual examination booths in 1050. Doctors see
two or more patients per hour, and patients spend about 10 to 15 minutes per booth visit. A wait can be as much as eight hours. A standard triage form is used where criticality is determined as one of five levels, which defines the path of care to be provided.
The 1050 patient volume is about 150 patients per day. About 10% to 15% leave without being seen. About 1% of the 1050 arrivals are transferred to other inpatient services on the same day, about 10% are admitted to an inpatient bed and the remainder go home after being seen, some with an appointment for a return. If a 1050 patient can’t be seen by the end of the day, they are sent to 1350.
Patients are sent to exam booths to meet with a doctor and doctors select which patient to see next. Doctors can select from the queue if they wish. A separate area (1050B) is for return and/or “Fast Track” patients. It’s a type of primary care clinic where a patient returns for ongoing care or medication, such as follow-up for a broken limb. About 5% of 1050B patients are for medication refills. A Physician Assistant (PA), rather than an MD, staffs 1050B.
2.2.2 Radiology
Clinicians generate the patient flow into the radiology department. The clinician’s orders are delivered to the radiology department much before the patient arrives. The various facilities in the radiology department include diagnostic X-ray, nuclear medicine, diagnostic ultrasound, off-site MRI, CT scan, various interventions and more. In addition to the services on the 3rd
1. Modeling Patient Flows Through the HEALTHCARE System 25 floor, three X-ray rooms are allotted to the ground floor ED. There is also a portable X-ray machine placed in the 1350 ER, which can X-ray the body parts that are most likely to need X-rays. For specialized X-rays, patients are taken to the 3rd floor. OPD also has its own radiology department.
Separate scheduling systems are used for each of the radiology services. Outpatient scheduling is separate from inpatient. Priority is given to ED patients then outpatients. Since inpatients are available for a greater time period they are given a lower priority. To avoid long delays arising from the radiology department waiting for an inpatient to be brought in, they call more inpatients than required. The inpatients are served on a first-come, first-served basis. The radiology waiting area is open and the inpatients and outpatients must wait along with the jail patients.
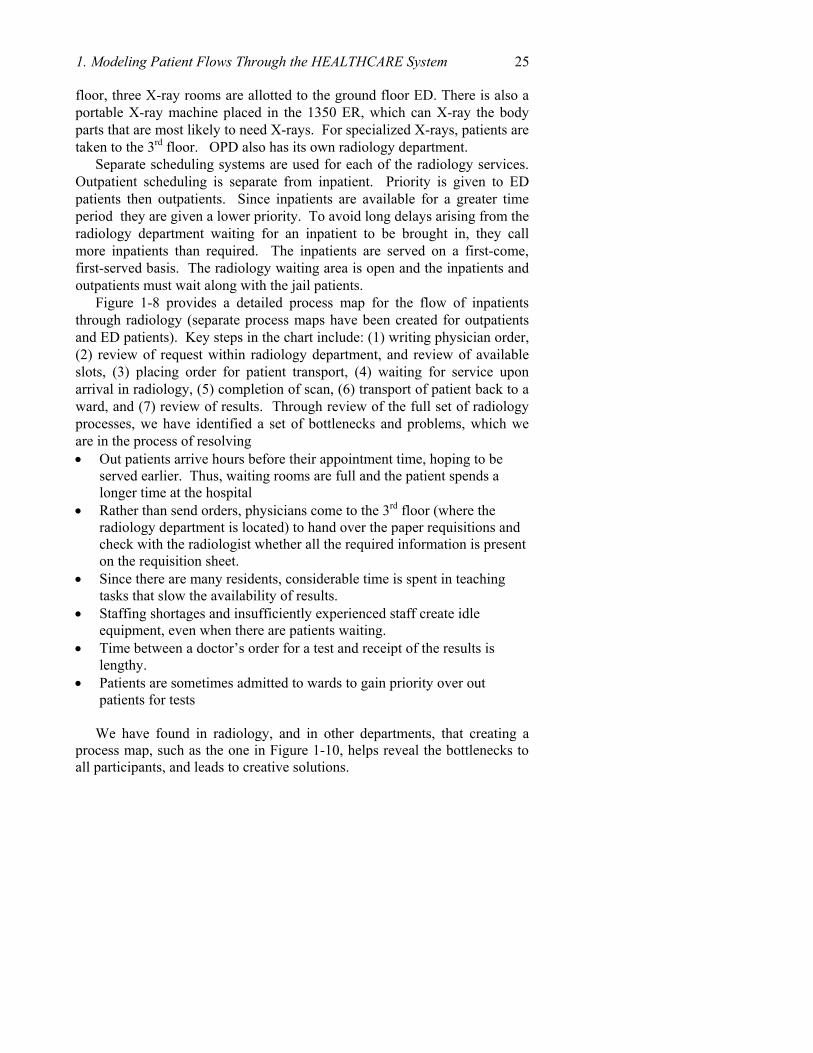
Figure 1-8 provides a detailed process map for the flow of inpatients through radiology (separate process maps have been created for outpatients and ED patients). Key steps in the chart include: (1) writing physician order, (2) review of request within radiology department, and review of available slots, (3) placing order for patient transport, (4) waiting for service upon arrival in radiology, (5) completion of scan, (6) transport of patient back to a ward, and (7) review of results. Through review of the full set of radiology processes, we have identified a set of bottlenecks and problems, which we are in the process of resolving • Out patients arrive hours before their appointment time, hoping to be
served earlier. Thus, waiting rooms are full and the patient spends a longer time at the hospital
• Rather than send orders, physicians come to the 3rd floor (where the radiology department is located) to hand over the paper requisitions and check with the radiologist whether all the required information is present on the requisition sheet.
• Since there are many residents, considerable time is spent in teaching tasks that slow the availability of results.
• Staffing shortages and insufficiently experienced staff create idle equipment, even when there are patients waiting.
• Time between a doctor’s order for a test and receipt of the results is lengthy.
• Patients are sometimes admitted to wards to gain priority over out patients for tests
We have found in radiology, and in other departments, that creating a
process map, such as the one in Figure 1-10, helps reveal the bottlenecks to all participants, and leads to creative solutions.
26 Chapter 1
The clerk or nurse at the ward adds order topatient cardex and enters it into Af f nity -Order
Management
Radiology Department in GH observ esrequest f or serv ices
The scheduler at the radiology dept. checksf or any coming up empty slots in the
appropriage schedule
Are there anyempty slots in theday 's schedule?
The clerk places a request with thetransportation pool to take the patient to
radiology
Transportation staf f takes gurney /wheelchair to the ward.
Istransportation
av ailable?
Patient waits inroom
Pt is transported to RAD andreports to the radiology ward
Are there anyempty slots?
Is there any ER/jailpatient/prev iousinpat waiting?
Pt waits f or thenext empty slot
Patient requires radiology serv ices
Yes
No
Yes
No
Yes
No
No
Yes
RadiologySchedules
Radiology - Inpatient
USC / ISE + LAC Patient FlowProject
Phy sician writes order f or scan/X-ray onPhy sician Order f orm
Radiology rev iews OM request andapprov es or replies,
Phy sician OrderForm
Departmentalapprov al process
Pt waits in room
A
B
Figure 1-10a. Process Map for Inpatient Radiology, Part 1
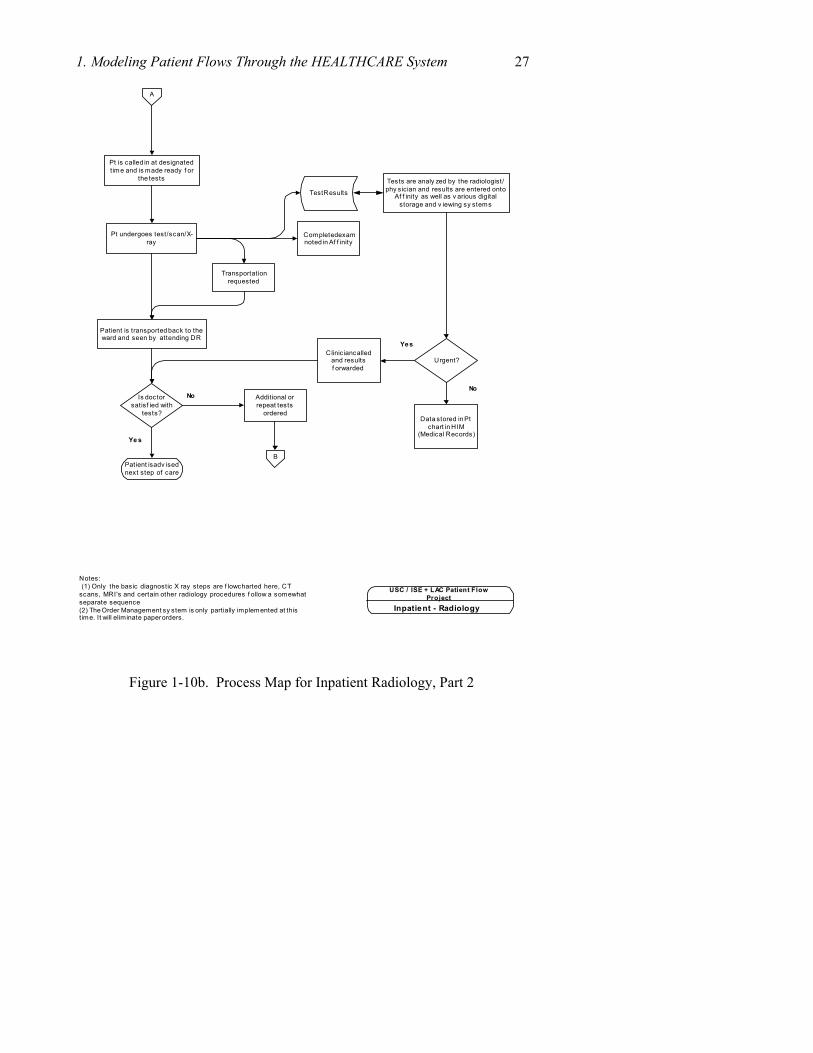
1. Modeling Patient Flows Through the HEALTHCARE System 27
Pt is called in at designatedtime and is made ready f or
the tests
Pt undergoes test/scan/X-ray
Patient is transported back to theward and seen by attending DR
Tests are analy zed by the radiologist/phy sician and results are entered onto
Af f inity as well as v arious digitalstorage and v iewing sy stems
Is doctorsatisf ied with
tests?
Patient is adv isednext step of care
Ye s
No
Test Results
Inpatient - Radiology
USC / ISE + LAC Patient FlowProject
A
Additional orrepeat tests
ordered
Completed examnoted in Af f inity
Transportationrequested
Data stored in Ptchart in HIM
(Medical Records)
Urgent?Clinician called
and resultsf orwarded
B
Yes
No
Notes: (1) Only the basic diagnostic X ray steps are f lowcharted here, CTscans, MRI's and certain other radiology procedures f ollow a somewhatseparate sequence(2) The Order Management sy stem is only partially implemented at thistime. It will eliminate paper orders.
Figure 1-10b. Process Map for Inpatient Radiology, Part 2
28 Chapter 1 2.2.3 Pharmacy
Pharmacy services are provided inpatients, outpatients and patient discharges. The GH has a 1st floor pharmacy, which operates 24x7; a 24x7 8th floor pharmacy, which is for inpatients, and an outpatient pharmacy in the OPD building. The first floor pharmacy also serves outpatients when the OPD pharmacy is closed and provides medications for patients when they are discharged.
The 1st floor pharmacy fills about 900 prescriptions per day, about 700 during the day shift. They get some prescriptions by fax but most are on paper. A ward nurse, a patient or a patient’s family, brings prescriptions to the pharmacy. Refill orders are received by phone. The 8th floor pharmacy fills cassettes, which are one day supplies for inpatient beds. Many orders are received from wards to this pharmacy by fax.
Patients don’t pay at the pharmacy in advance for their medicine. After the order is ready, patients are given a cash receipt and are sent to the cashier to pay. After payment, they come to pick up the medicines. Some are given a mail-in envelope for payment.
Pharmacy staff and other personnel noted bottlenecks and problems:
• Staffing shortages and insufficiently experienced staff • Waiting for medications was said to contribute to delays in discharging
patients from hospital inpatient beds. • On IPD discharge the doctor is supposed to provide prescriptions in
advance, on the day before, but they often don’t write it until their morning rounds.
2.2.4 Lab
The GH lab provides a centralized service for a wide variety of tests. The primary flow is: specimens, mostly blood in tubes, are received in the lab area by pneumatic tube, hand carried to a receiving window or gathered by an outside transportation contractor to gather samples from CHC locations and various satellite locations. An initial set of steps involves receiving the material and paperwork; a second phase involves organizing the samples (for which they have automated equipment) and then doing the test itself. The tubes are generally bar coded and other information is printed as text on the tube.
The exact volume of work was said to be unknown, but in the central lab they do about 1,000 chemistry tests a day and about 700 of other tests a day. About 200 people work in the department, with about 80 test technicians and a number of open positions. The lab has a modern information system that is
1. Modeling Patient Flows Through the HEALTHCARE System 29 linked to the information system. Electronic orders from doctors are received through an order management system.
Some “outlying” lab people work in the ED and elsewhere, which do some of the receiving tasks. Lab turn-around time was targeted at one hour for stat work (30-40% of orders) and four hours for routine work. Results are often delivered electronically and paper results are sent to medical records for the patient’s chart (seven days later for inpatients). Doctors must take the initiative to check lab results, so there is no certainty that they have been checked.
2.2.5 Surgery
The hospital has about 20 surgery suites (operating rooms) on several floors of the hospital. The exact number of rooms used on any day varies with staffing availability. Surgeries are of three basic types: emergency, inpatient and outpatient (or day surgeries). Non-emergency surgeries are scheduled one day in advance with a homegrown stand-alone computer system and priorities are set by various physicians responsible for their respective specialty. Surgery days are blocked out for various specialties on a two-week rotation pattern. Thus, a room is scheduled weeks in advance for a specific type of surgery (such as “cardiac”) and may not be available for that type of surgery again for days or weeks. Doctors from each specialty define the sequence of patients within their specialty. Queues for each specialty may be weeks or months in length.
On the day before each surgery, the surgeon estimates duration of surgery, which is used to schedule the next day’s use of the operating rooms. Surgeries often take longer than their estimated time. As a result, the last scheduled surgery for the day often is not done on the day scheduled. This missed surgery might not be done the next day due to what has already been blocked out and the surgery may be scheduled for sometime later in the month. This practice sometimes prolongs the number of days an inpatient occupies a bed, because an inpatient must stay in the GH until their surgery is completed. In the case of outpatients, they must then go home and come back for their re-scheduled surgery and repeat their pre op visit. Also, some scheduled surgery patients do not show up for their appointment. If a patient doesn’t turn up at the scheduled time then another patient must be identified and prepared for surgery, which results in a delay.
The GH’s 20 OR suites handle about 28 – 30 surgeries per day, out of which about 35% are outpatient and 65% inpatient. They generally use three ORs in the evening – one for red blanket patient (trauma), other two for scheduled or ED surgeries. A “white board” on the surgery floor lists pending emergency surgeries throughout the day.
30 Chapter 1
Bottlenecks related to surgery include:
• Inpatient beds unavailable, which cause a back up of patients completing surgery.
• Scheduling which does not fully utilize the available surgery time. • Patients for day surgeries who do not show up as expected. • Incorrect or unavailable ancillary service results (Radiology, lab reports,
Medical records). • Staffing shortages resulting in fewer rooms or services available. • Frequent rescheduling and bumping of surgeries for a variety of causes. • Late start times and an early shift cutoff time. • Slow clean-up between surgeries. • Delays in transport service lacking and waits for elevators. • Allocation of rooms to specialties may not match the relative demand
among specialties. Paperwork is not always available or correctly completed on time.
3. EVALUATION AND IMPROVEMENT STRATEGIES
We now turn to some of the methods for measuring system performance. It is important for every patient flow improvement project to develop quantitative measures of both problems and successes, to guide implementation of changes, and to create ongoing monitoring systems to make continual improvements. Unfortunately, desired data are not always collected, and are frequently not presented in a meaningful form. In this section we describe some of the more important measurements for patient flow, and describe our challenges in obtaining data.
3.1 Understanding Patient Arrival Patterns
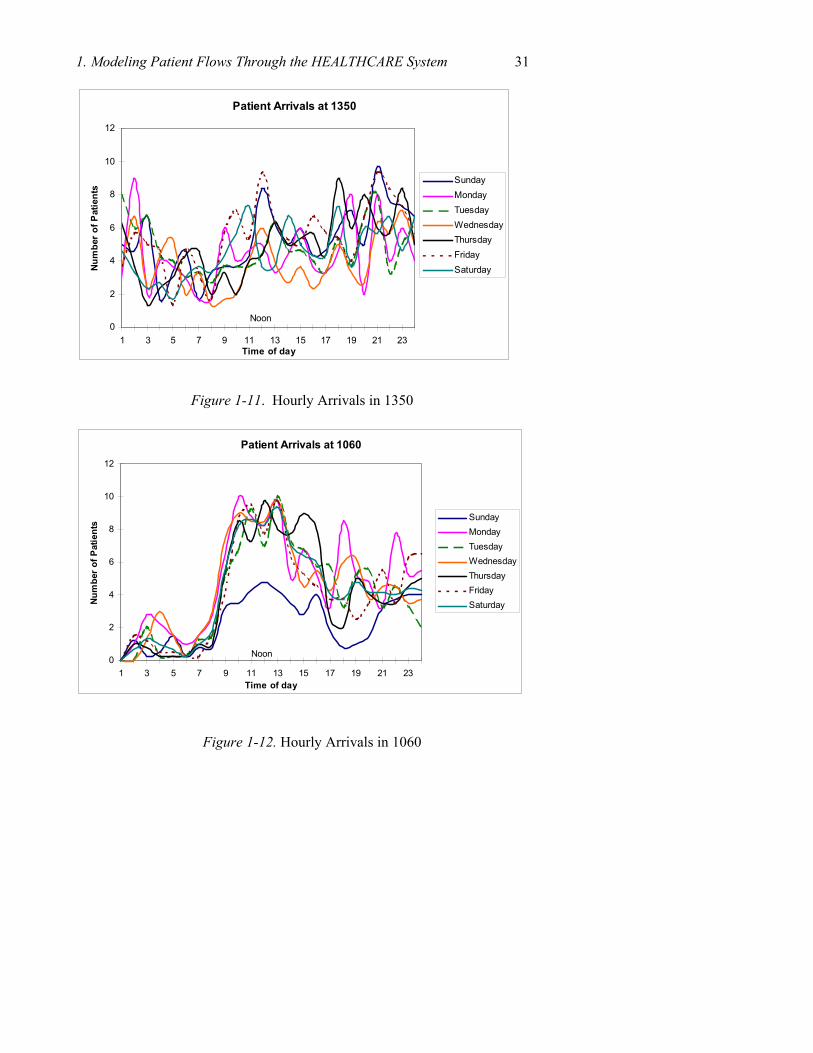
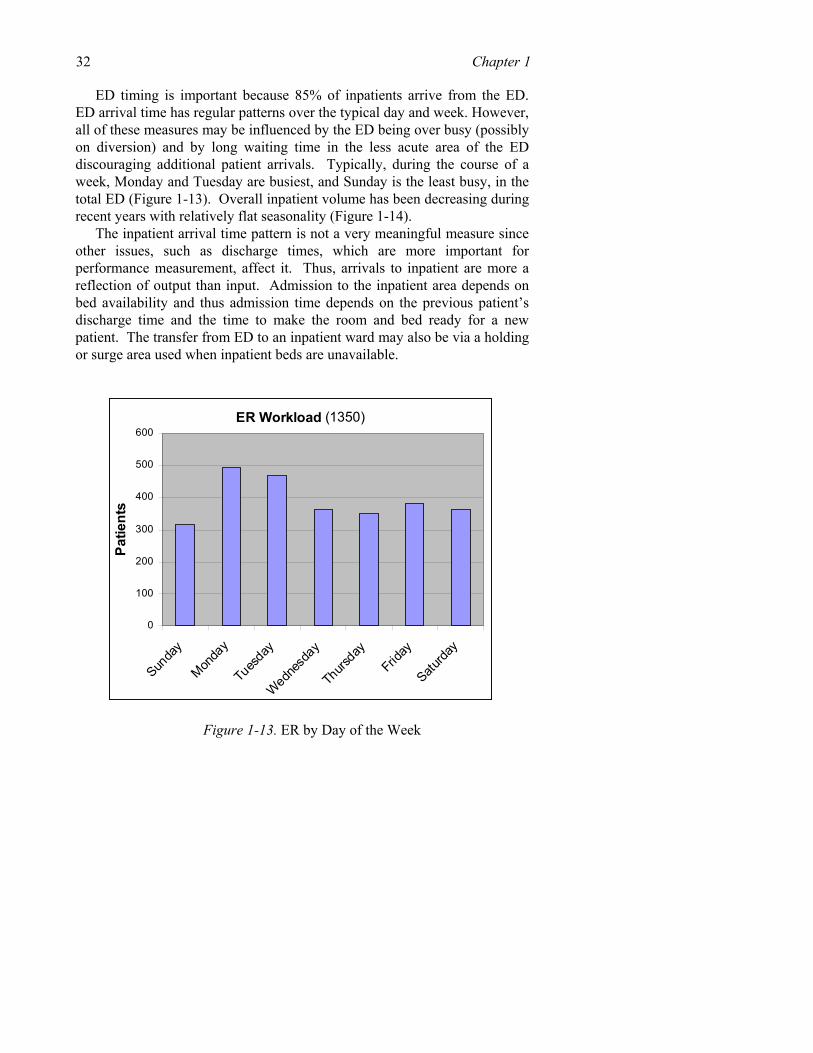
Patient arrival patterns drive systems for scheduling staff and other resources. The patterns are somewhat predictable, even for the unscheduled ED. Hospital scheduling controls most of the other arrivals. The following time of day graphs for the 1350 and 1060 ER areas (Figures 1-11 and 1-12) show a strong peak early in the day (particularly 9-11:00 a.m.). The arrival pattern is somewhat different in 1350, with a peak in the evening hours, from about 5:00 p.m. until 1:00 a.m., which may reflect the severity and incidence of injuries resulting from accidents and violence.
1. Modeling Patient Flows Through the HEALTHCARE System 31
Figure 1-11. Hourly Arrivals in 1350
Figure 1-12. Hourly Arrivals in 1060
Patient Arrivals at 1350
0
2
4
6
8
10
12
1 3 5 7 9 11 13 15 17 19 21 23Time of day
Num
ber
of P
atie
nts
SundayMondayTuesdayWednesdayThursdayFridaySaturday
Noon
Patient Arrivals at 1060
0
2
4
6
8
10
12
1 3 5 7 9 11 13 15 17 19 21 23Time of day
Num
ber o
f Pat
ient
s SundayMondayTuesdayWednesdayThursdayFridaySaturday
Noon
32 Chapter 1
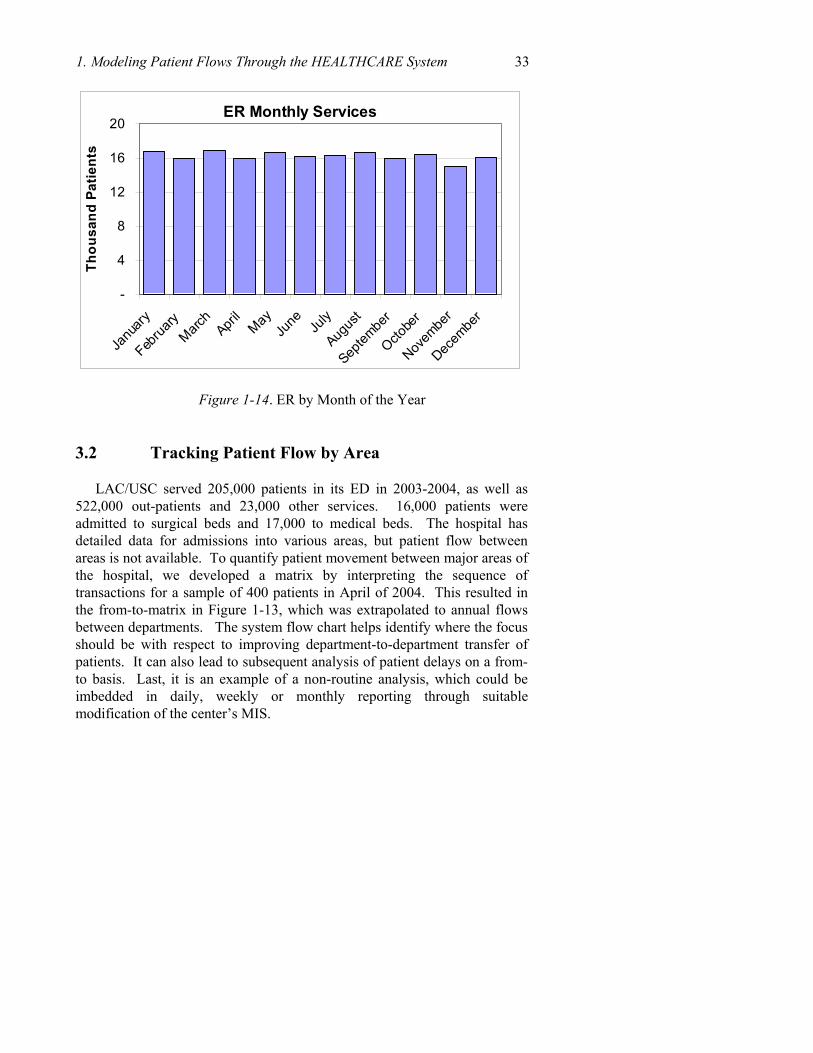
ED timing is important because 85% of inpatients arrive from the ED. ED arrival time has regular patterns over the typical day and week. However, all of these measures may be influenced by the ED being over busy (possibly on diversion) and by long waiting time in the less acute area of the ED discouraging additional patient arrivals. Typically, during the course of a week, Monday and Tuesday are busiest, and Sunday is the least busy, in the total ED (Figure 1-13). Overall inpatient volume has been decreasing during recent years with relatively flat seasonality (Figure 1-14).
The inpatient arrival time pattern is not a very meaningful measure since other issues, such as discharge times, which are more important for performance measurement, affect it. Thus, arrivals to inpatient are more a reflection of output than input. Admission to the inpatient area depends on bed availability and thus admission time depends on the previous patient’s discharge time and the time to make the room and bed ready for a new patient. The transfer from ED to an inpatient ward may also be via a holding or surge area used when inpatient beds are unavailable.
ER Workload (1350)
0
100
200
300
400
500
600
Sunda
y
Monda
y
Tues
day
Wednes
day
Thursday
Friday
Saturda
y
Patie
nts
Figure 1-13. ER by Day of the Week
1. Modeling Patient Flows Through the HEALTHCARE System 33
ER Monthly Services
-
4
8
12
16
20
Janu
ary
Februa
ryMarc
hApri
lMay
June Ju
ly
Augus
t
Septem
ber
Octobe
r
Novem
ber
Decem
ber
Thou
sand
Pat
ient
s
Figure 1-14. ER by Month of the Year
3.2 Tracking Patient Flow by Area
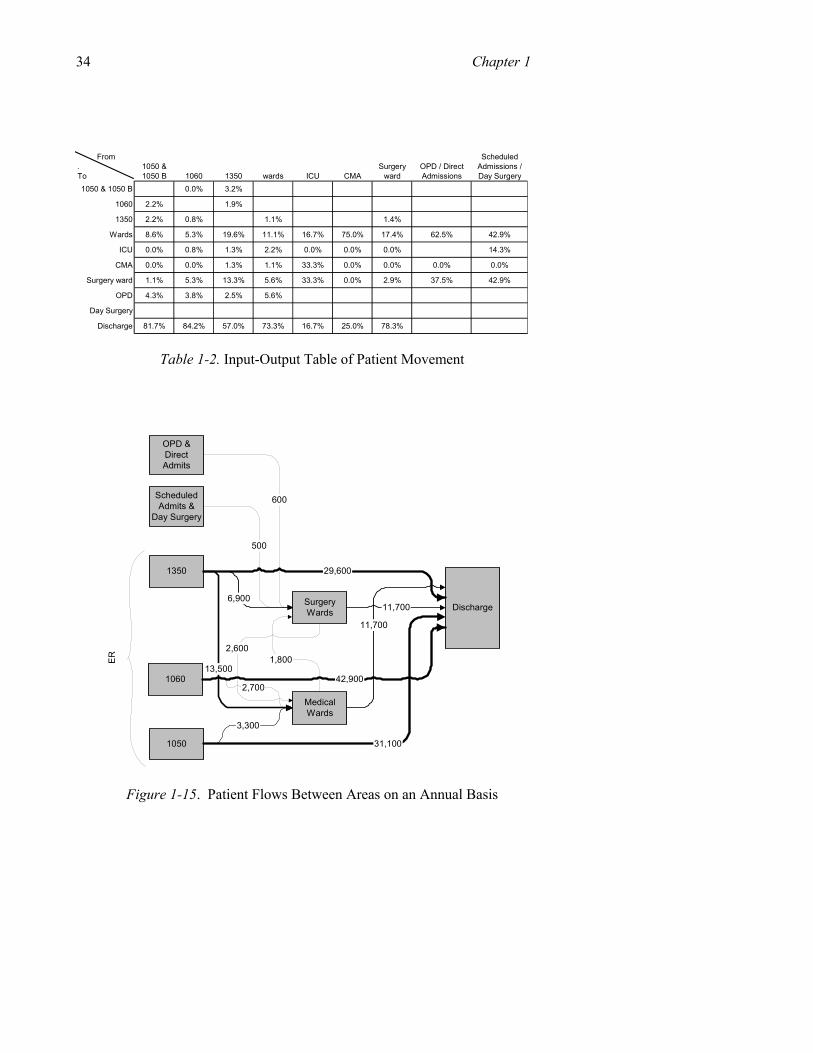
LAC/USC served 205,000 patients in its ED in 2003-2004, as well as 522,000 out-patients and 23,000 other services. 16,000 patients were admitted to surgical beds and 17,000 to medical beds. The hospital has detailed data for admissions into various areas, but patient flow between areas is not available. To quantify patient movement between major areas of the hospital, we developed a matrix by interpreting the sequence of transactions for a sample of 400 patients in April of 2004. This resulted in the from-to-matrix in Figure 1-13, which was extrapolated to annual flows between departments. The system flow chart helps identify where the focus should be with respect to improving department-to-department transfer of patients. It can also lead to subsequent analysis of patient delays on a from-to basis. Last, it is an example of a non-routine analysis, which could be imbedded in daily, weekly or monthly reporting through suitable modification of the center’s MIS.
34 Chapter 1
From . To
1050 & 1050 B 1060 1350 wards ICU CMA
Surgery ward
OPD / Direct Admissions
Scheduled Admissions / Day Surgery
1050 & 1050 B 0.0% 3.2%
1060 2.2% 1.9%
1350 2.2% 0.8% 1.1% 1.4%
Wards 8.6% 5.3% 19.6% 11.1% 16.7% 75.0% 17.4% 62.5% 42.9%
ICU 0.0% 0.8% 1.3% 2.2% 0.0% 0.0% 0.0% 14.3%
CMA 0.0% 0.0% 1.3% 1.1% 33.3% 0.0% 0.0% 0.0% 0.0%
Surgery ward 1.1% 5.3% 13.3% 5.6% 33.3% 0.0% 2.9% 37.5% 42.9%
OPD 4.3% 3.8% 2.5% 5.6%
Day Surgery
Discharge 81.7% 84.2% 57.0% 73.3% 16.7% 25.0% 78.3%
Table 1-2. Input-Output Table of Patient Movement
OPD &DirectAdmits
1050
1060
1350
ScheduledAdmits &
Day Surgery
SurgeryWards
MedicalWards
Discharge
600
3,300
2,700
6,900
500
31,100
42,900
11,700
11,700
29,600
1,8002,600
ER
13,500
Figure 1-15. Patient Flows Between Areas on an Annual Basis
1. Modeling Patient Flows Through the HEALTHCARE System 35 3.3 Defining Performance Measures
At this point we turn to measuring specific performance outcomes, such as waiting time, number of patients waiting, denied days, and utilization.
3.3.1 Time in System and Waiting Time
Time in system and wait time are reported in certain areas of the hospital but their accuracy is uncertain and may not provide a useful picture regarding patient flow. The basic problem is that the hospital does not time stamp events at the exact time when they occur. Event times are often recorded retrospectively (if at all), and exact times may get rounded to the nearest day, which is insufficient for tracking delays. Ideally, the time of every key event in the patient’s stay should be recorded automatically as it happens, for instance with a simple bar code scan. With these data, it is possible to track waits by location and activity. It is also possible to optimize resource utilization, as staff can be alerted immediately when a resource is made available, thus eliminating idle time. We now turn to the actual data that we had available at LAC/USC.
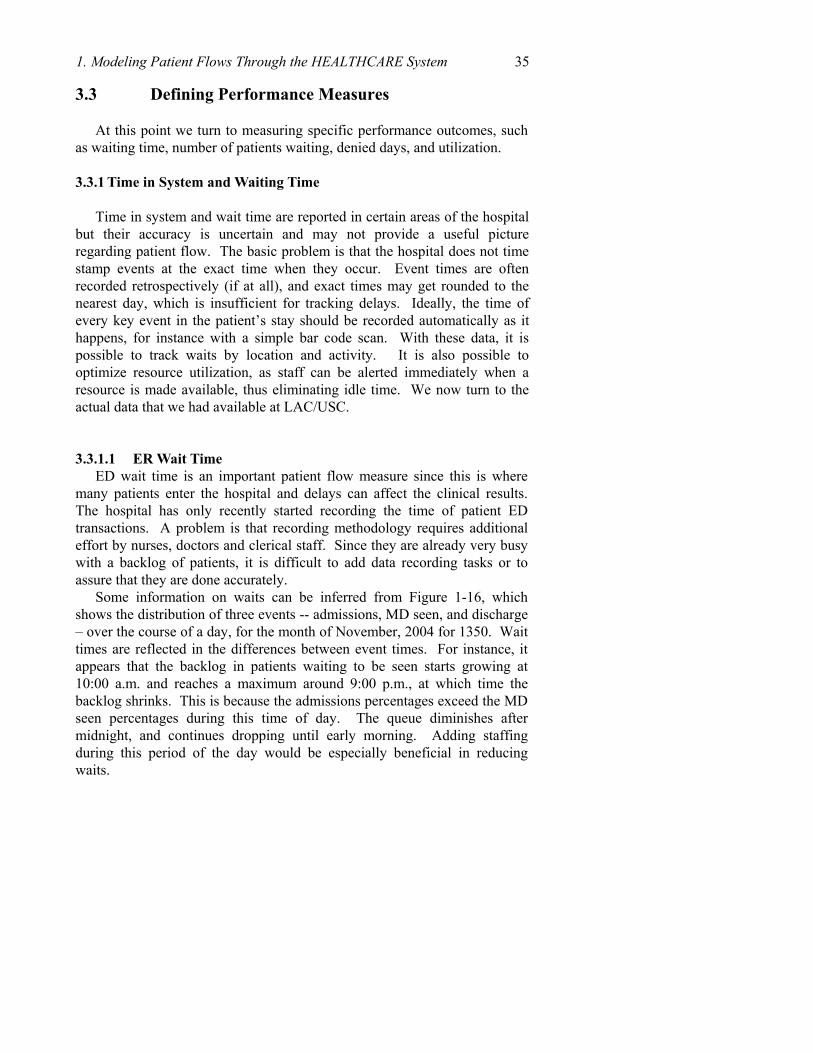
3.3.1.1 ER Wait Time ED wait time is an important patient flow measure since this is where
many patients enter the hospital and delays can affect the clinical results. The hospital has only recently started recording the time of patient ED transactions. A problem is that recording methodology requires additional effort by nurses, doctors and clerical staff. Since they are already very busy with a backlog of patients, it is difficult to add data recording tasks or to assure that they are done accurately.
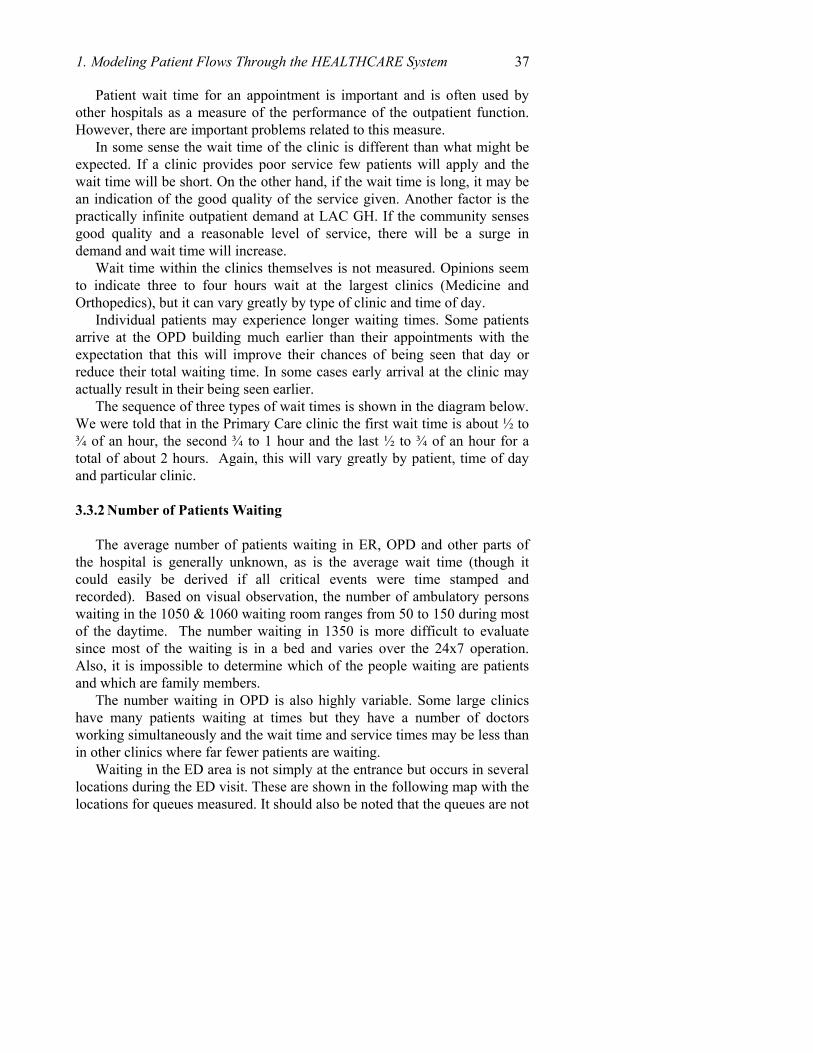
Some information on waits can be inferred from Figure 1-16, which shows the distribution of three events -- admissions, MD seen, and discharge – over the course of a day, for the month of November, 2004 for 1350. Wait times are reflected in the differences between event times. For instance, it appears that the backlog in patients waiting to be seen starts growing at 10:00 a.m. and reaches a maximum around 9:00 p.m., at which time the backlog shrinks. This is because the admissions percentages exceed the MD seen percentages during this time of day. The queue diminishes after midnight, and continues dropping until early morning. Adding staffing during this period of the day would be especially beneficial in reducing waits.
36 Chapter 1
ER 1350 Patient Flow
0%
1%
2%
3%
4%
5%
6%
7%
1 3 5 7 9 11 1 3 5 7 9 11Time of Day
% o
f Day
's P
atie
nts
Admissions
MD Seen
ER Discharge
Source data: Affinity, November, 2004, 2,735 records
Figure 1-16. Patient Movement within 1350 ER
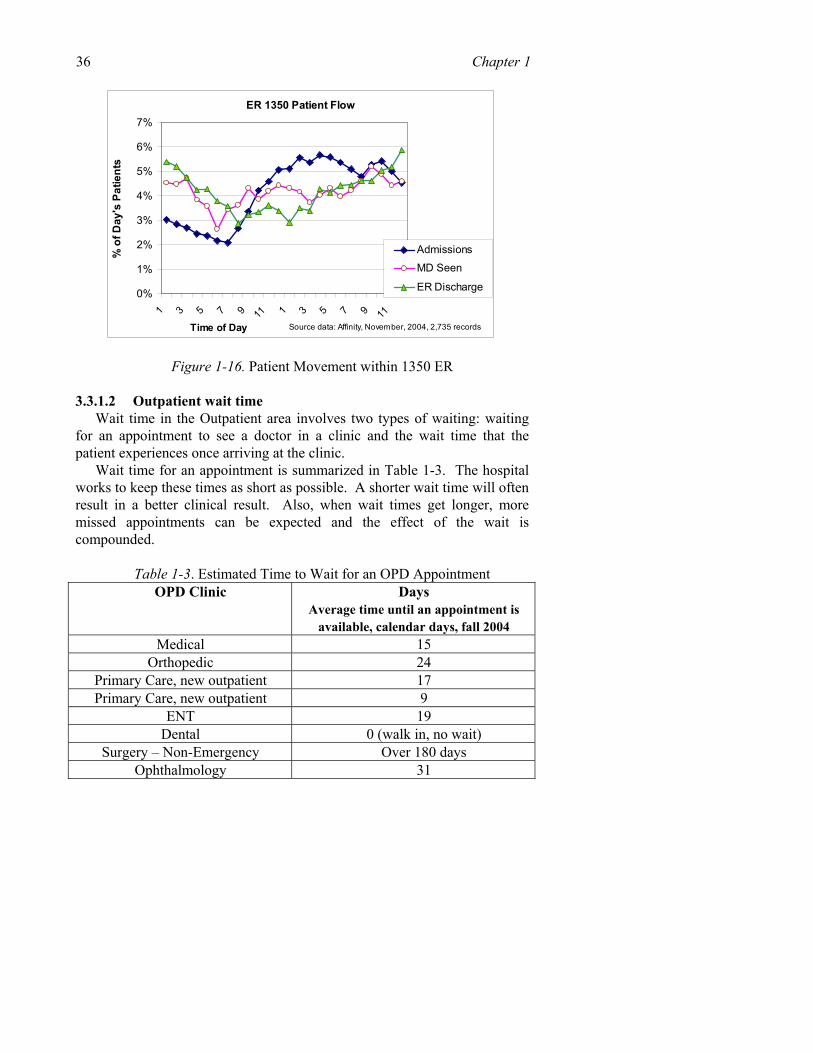
3.3.1.2 Outpatient wait time Wait time in the Outpatient area involves two types of waiting: waiting
for an appointment to see a doctor in a clinic and the wait time that the patient experiences once arriving at the clinic.
Wait time for an appointment is summarized in Table 1-3. The hospital works to keep these times as short as possible. A shorter wait time will often result in a better clinical result. Also, when wait times get longer, more missed appointments can be expected and the effect of the wait is compounded.
Table 1-3. Estimated Time to Wait for an OPD Appointment
OPD Clinic Days Average time until an appointment is
available, calendar days, fall 2004 Medical 15
Orthopedic 24 Primary Care, new outpatient 17 Primary Care, new outpatient 9
ENT 19 Dental 0 (walk in, no wait)
Surgery – Non-Emergency Over 180 days Ophthalmology 31
1. Modeling Patient Flows Through the HEALTHCARE System 37
Patient wait time for an appointment is important and is often used by other hospitals as a measure of the performance of the outpatient function. However, there are important problems related to this measure.
In some sense the wait time of the clinic is different than what might be expected. If a clinic provides poor service few patients will apply and the wait time will be short. On the other hand, if the wait time is long, it may be an indication of the good quality of the service given. Another factor is the practically infinite outpatient demand at LAC GH. If the community senses good quality and a reasonable level of service, there will be a surge in demand and wait time will increase.
Wait time within the clinics themselves is not measured. Opinions seem to indicate three to four hours wait at the largest clinics (Medicine and Orthopedics), but it can vary greatly by type of clinic and time of day.
Individual patients may experience longer waiting times. Some patients arrive at the OPD building much earlier than their appointments with the expectation that this will improve their chances of being seen that day or reduce their total waiting time. In some cases early arrival at the clinic may actually result in their being seen earlier.
The sequence of three types of wait times is shown in the diagram below. We were told that in the Primary Care clinic the first wait time is about ½ to ¾ of an hour, the second ¾ to 1 hour and the last ½ to ¾ of an hour for a total of about 2 hours. Again, this will vary greatly by patient, time of day and particular clinic.
3.3.2 Number of Patients Waiting
The average number of patients waiting in ER, OPD and other parts of the hospital is generally unknown, as is the average wait time (though it could easily be derived if all critical events were time stamped and recorded). Based on visual observation, the number of ambulatory persons waiting in the 1050 & 1060 waiting room ranges from 50 to 150 during most of the daytime. The number waiting in 1350 is more difficult to evaluate since most of the waiting is in a bed and varies over the 24x7 operation. Also, it is impossible to determine which of the people waiting are patients and which are family members.
The number waiting in OPD is also highly variable. Some large clinics have many patients waiting at times but they have a number of doctors working simultaneously and the wait time and service times may be less than in other clinics where far fewer patients are waiting.
Waiting in the ED area is not simply at the entrance but occurs in several locations during the ED visit. These are shown in the following map with the locations for queues measured. It should also be noted that the queues are not
38 Chapter 1 independent. Waiting in one queue, such as waiting for PFS, reduces the flow to subsequent processes.
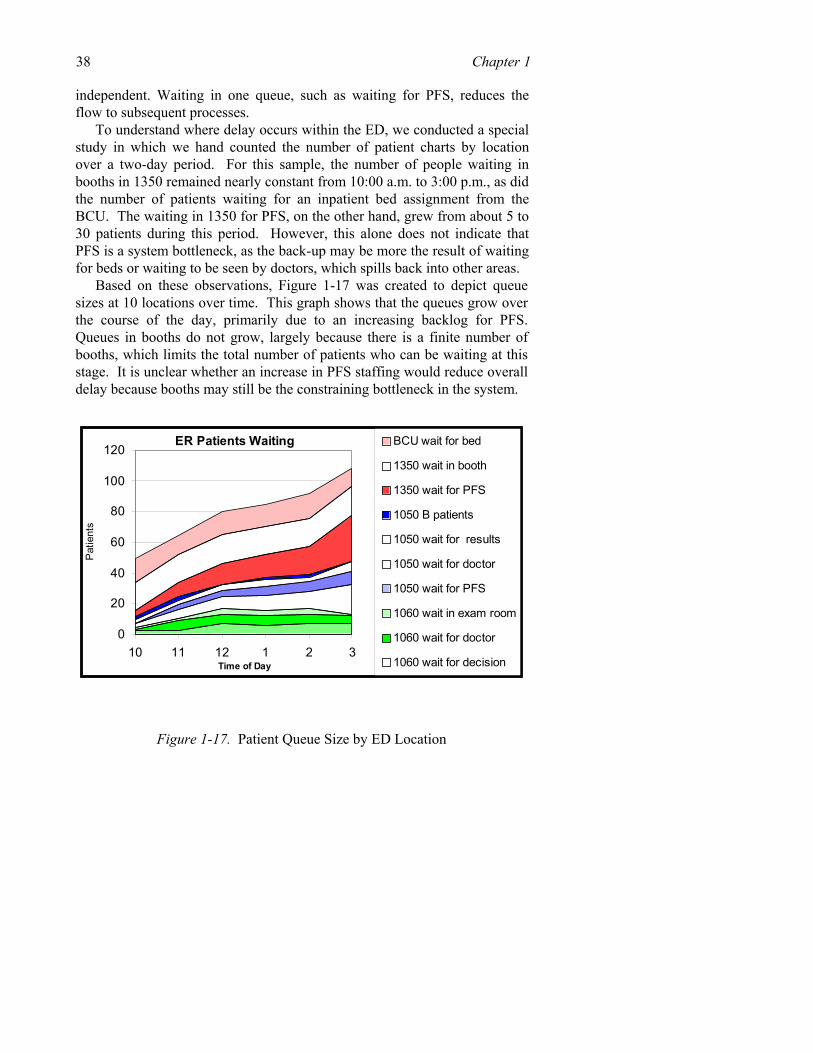
To understand where delay occurs within the ED, we conducted a special study in which we hand counted the number of patient charts by location over a two-day period. For this sample, the number of people waiting in booths in 1350 remained nearly constant from 10:00 a.m. to 3:00 p.m., as did the number of patients waiting for an inpatient bed assignment from the BCU. The waiting in 1350 for PFS, on the other hand, grew from about 5 to 30 patients during this period. However, this alone does not indicate that PFS is a system bottleneck, as the back-up may be more the result of waiting for beds or waiting to be seen by doctors, which spills back into other areas.
Based on these observations, Figure 1-17 was created to depict queue sizes at 10 locations over time. This graph shows that the queues grow over the course of the day, primarily due to an increasing backlog for PFS. Queues in booths do not grow, largely because there is a finite number of booths, which limits the total number of patients who can be waiting at this stage. It is unclear whether an increase in PFS staffing would reduce overall delay because booths may still be the constraining bottleneck in the system.
ER Patients Waiting
0
20
40
60
80
100
120
10 11 12 1 2 3Time of Day
Pat
ient
s
BCU wait for bed
1350 wait in booth
1350 wait for PFS
1050 B patients
1050 wait for results
1050 wait for doctor
1050 wait for PFS
1060 wait in exam room
1060 wait for doctor
1060 wait for decision
Figure 1-17. Patient Queue Size by ED Location
1. Modeling Patient Flows Through the HEALTHCARE System 39 3.3.3 Productivity and Service Time
Productivity is defined as useful output divided by input or as work completed divided by resources used, such as the resource of labor. In the case of hospitals, output can be measured in terms of patient admissions, patient days or the number of specific services done. Input can be measured by staff size in FTEs or labor hours.
An alternative but indirect measure of productivity is hospital cost per patient day. This may be helpful on an overall basis in comparing the LAC GH to other similar institutions but probably not helpful when evaluating a functional area or a specific process. Service times, such as the time for a complete outpatient or ER visit, are a measure of how well the hospital is organized to provide prompt care. They can be compared to benchmarks from other hospitals or organizations. Service times at LAC GH are generally not measured with any useful precision by the hospital’s HIS. Cycle times are known on a detailed level by technicians and other staff familiar with specific procedures. For example, the average scan time of 30 to 45 minutes for an MRI is known. Of greater interest is the time for an MRI appointment, and how this compares to benchmarks and historical data to measure trends in improvement.
Some anecdotal service times were reported but rarely were they based on a true independent measurement. Such details are particularly helpful in managing patient flow if they can be compared to benchmark times or be compared to the hospital’s own past performance. Tracking of such time would be helpful as a component in managing and improving patient flow.
3.3.4 Denied Days
An important financial consideration of the hospital is “denied days”. These represent days that are not reimbursed because the insurance provider does not view excessive inpatient days as appropriate. An example is inpatient days spent waiting for a surgery due to scheduling delays. This is a costly event exceeding 15% of total days and the hospital works to avoid such a situation. Improved patient flow will inevitably reduce denied days by assuring that patient movement is appropriate and prompt. Patient flow improvement is also important for patient satisfaction and the extent to which the hospital can serve the community. Long wait times and crowding are avoided by efficient patient flow throughout the hospital.
40 Chapter 1 3.3.5 Utilization (Beds, OR, Staff) and Length of Stay
Utilization of beds in the GH is generally very high. The demand for beds exceeds the supply, which is determined by how many beds the hospital can open based on the availability of staff. The supply also depends on the ability to discharge patients rapidly, as well as to rapidly prepare the bed for the next patient, as well as transport that patient. Efficient utilization also depends on achieving a good match between the types of beds available and the population of patients waiting to be admitted.
More nursing staff also means more beds can be made available. Where there is a shortage of nursing staff, the hospital uses outside services, but this is costly and inefficient, so the use is limited. If staff cannot be gathered, beds are closed and patients must wait for beds to become available. However, bed utilization can be a misleading measure, as many inpatients are queued, waiting for surgery or waiting for tests. If these processes were completed more rapidly, the need for beds would diminish, which could in turn reduce delays in the ED. They could also significantly reduce the length of stay, which is in itself in part a measure of waiting time (i.e., wait for surgery, wait for test, wait for discharge). Though it is impossible to reduce length of stay to zero (as minimum times are needed for procedures and recuperation) much of the stay is devoted to costly waiting that should be eliminated.
Utilization is important in other areas, such as surgery and radiology. While an effort is made to keep these resources scheduled, resources are often left under utilized due to difficulties in predicting service times, cancellations or late arrivals, and slack times in preparing equipment or rooms. Thus, it is possible for a department to have a long backlog while simultaneously working below its capacity. In some instances long backlogs can cause efficiency to drop, as additional attention is needed to support waiting patients and service processes become disrupted.
Thus, an objective at LAC GH is to operate with prompt and efficient patient flow to process the maximum number of patients while maintaining high quality. Utilization of resources must be considered in regard to the inevitable backlog with no likelihood of idle time.
The average length of stay at the GH is about 6.5 days. This is considered long by the hospital administration, which is working to reduce it by one day. Utilization of hospital beds is high relative to other hospitals. At most times all beds are in use, in preparation to be used by the next patient, or closed due to shortage of staff. In 2005, while the hospital was typically staffed for 700 beds out of a theoretical capacity of 1,000 beds. Ancillary Performance Measures
1. Modeling Patient Flows Through the HEALTHCARE System 41
In addition to patient wait time, non-labor resources should also be measured. For example, managers of ancillary services should have accessible and relevant measures of performance of their diagnostic equipment. The lab should monitor equipment related data such as downtime (time equipment is unavailable due to maintenance, failure, etc.) and idle time. The extent of downtime should be tracked and compared to past levels, trends and to industry benchmarks. Maintenance vendors should be required to provide such data if it is not readily available from the equipment itself.
Most service areas (Radiology, Pharmacy, etc.) have industry standards available to represent typical performance numbers. Error rates, cycle time, and throughput by equipment type should be compared to past performance and to figures typical for each type of equipment.
3.4 Improving System Performance
Our study of LAC/USC resulted in numerous recommendations that are in various stages of implementation. We summarize some of the major findings.
3.4.1 Improvement Process
Create a team of motivated, knowledgeable and empowered individuals to make needed changes related to patient flow. Provide them training and guidance in process mapping, analysis and operations improvement tools. Fact based data analysis must be a key ingredient and starting point. Give teams specific goals, deadline dates and incentives. Include necessary disciplines (nurses, clerical, administration and physicians) needed to implement changes.
3.4.2 Use Existing Data to Track Patient Flow
Patient arrivals, waiting time, service time and other measures can be created from existing data. Patient flow management requires facts that are best gathered from processes already in place. The current information system is not ideal, but it can provide additional information.
3.4.3 Discharge Waiting Unit Expansion
Continue expansion of this function so that it better serves the entire hospital and maximizes the utilization of inpatient beds while considering patient satisfaction. By evaluating the discharge workflow and facts concerning patient flow it is possible to determine the optimum size of the discharge waiting unit. Also, a training program for nursing staff focusing
42 Chapter 1 on the capabilities of the discharge unit and the steps that can be followed by wards to expedite discharge would be very useful.
3.4.4 Transportation Level Optimized
Determine a cost effective level of internal patient transportation and implement it. This must include the necessary staff, equipment and scheduling. It does not represent an added cost because the staff is already doing the transportation. The recommendation is to make it more efficient by analyzing the workflow and define the optimal assignment of staff.
3.4.5 Appointment/Scheduling Systems Using Simulations
Tools such as computer simulation and an optimized scheduling system will support better decisions. Scheduling requires complex tradeoffs and such decisions should be based on forecasts and determination of their likely impact before they occur.
3.4.6 Bed Management System
The bed control function is particularly critical to patient flow. As noted, the current system seems to need good information and has been criticized by users from all sides. Therefore, bed control related tools as well as communications must be improved. Various parties, including the inpatient wards and the emergency room staff, regularly criticize bed assignment decisions. Thus, a strong, clear and well publicized set of rules is needed to support prompt decisions. Also, part of the improvement to bed control is better information regarding bed availability. Discharge orders must be promptly entered into the information system and planned discharges should be frequently reported the day before the discharge is to occur.
3.4.7 Patient Tracking System and ID
By enforcing a system with a clear patient ID, costs can be avoided. Many computerized patient tracking systems, such as those the hospital is considering, have capabilities in electronic tracking. Operational data related to patient flow requires a clear, consistent and efficient patient identification system. A variety of alternatives are available, such as bar-codes and radio frequency ID, which will save operating costs and offer very useful data on patient flows.
3.4.8 Hospital Portal
Patient appointments and referrals are received by the hospital at a variety of points. This complicates the scheduling process and harms patient satisfaction through a lack of consistency and control. A single centralized point of access and a strengthened CSC would support a more efficient hospital operation and improve customer service.
1. Modeling Patient Flows Through the HEALTHCARE System 43 4. CONCLUSIONS AND EXTENSIONS
Clinicians and administrators can form collaboratives to reduce health care delays. Success depends on an ability to understand health care as a system, including the many interactions between patients, clinicians, support services and other resources. Success also depends on an ability to pinpoint the bottlenecks and system failures, particularly with respect to interactions among departments as patients flow through the system.
This chapter presented process charting and performance measurement approaches, which have been used to model and evaluate patient flow delays at the LA County/USC health center. These tools can be used elsewhere, provided that hospital management is committed to improvement, and that it carries that message to its staff.
5. ACKNOWLEDGMENT
We gratefully acknowledge the Los Angeles County Department of Health Services, whose financial support enabled the completion of this study. Our work relied on the close cooperation and assistance of the staff of the LA County/USC Hospital. In particular, we would like to acknowledge the dedication and support of Mr. Pete Delgado, Mr. Cecil Clark, Dr. David Altman, Ms. Irene Recendez, RN, Ms. Shiela Mallete, RN and Ms. Behnaz Hekmatnia. We also acknowledge the support and guidance of Dr. Thomas Garthwaite and Ms. Paula Packwood of the Department of Health Services.
6. REFERENCES
American College of Emergency Physicians, ACEP (1999). Ambulance diversion policy statement)
American College of Emergency Physicians, ACEP (2001). Emergency department planning and resource guidelines.
American College of Emergency Physicians, ACEP (2002a). Emergency medical treatment and labor act policy statement.
American College of Emergency Physicians, ACEP (2002b). Responding to emergency department crowding: a guidebook for chapters.
Ancker, C.J. and A.V. Gafarian (1963). Some queueing problems with balking and reneging, I and II. Operations Research, V. 11, pp. 88-100; 928-937
Badri, M. (1993). A simulation model for scheduling emergency room. International Journal of Operations and Production Management, V. 13, pp. 13-24.
Badri, M.A. and J. Hillingsworth (1993). A simulation model for scheduling in the emergency room. International Journal of Operations and Production Management, V. 13, pp. 13-24.
44 Chapter 1 Bindman, A.B., K. Grumbach, D. Keane, L. Rauch and J.M. Luce (1991). Consequences of
queueing for care at a public hospital emergency department. Journal of the Americal Medical Association, V. 266, pp. 1091-1096.
Blake, J., M.W. Carter and S. Richardson (1996). An analysis of emergency room wait time issues via computer simulation. INFOR, V. 34, pp. 263-273.
Bolling, W.B. (1972). Queuing model of a hospital emergency room. Industrial Engineering. pp. 26-31.
Brewster, L.R., L. Rudell and C.S. Lesser (2001). Emergency room diversions: a symptom of hospitals under stress. Center for Studying Health System Change, Issue Brief N. 38.
Buesching, D.P., A. Jablonowski and E. Vesta (1985). Inappropriate emergency department visits. Annals of Emergency Medicine. V. 14, pp. 672-676.
Cobham, A. (1954). “Priority Assignment in Waiting Line Problems,” Operations Research, V. 2, pp. 70-76.
Dawson, K.A., O.M. Ulgen, K. O'Connor and P. Sanchez (2000). How to conduct a successful emergency center staffing simulation study. Production Modeling Corporation Report.
Derlet, R.W. and D.A. Nishio. (1990). Refusing care to patients who present to an emergency department. Annals of Emergency Medicine. V. 19, pp. 262-267.
Derlet, R.W. and J.R. Richards (2000). Overcrowding in the nation's emergency departments: complex causes and disturbing effects. Annals of Emergency Medicine, V. 35, pp. 63-68.
Dershewitz, R.A., W. Paichel (1986). Patients who leave a pediatric emergency department without treatment. Annals of Emergency Medicine, V. 15, pp. 717-720.
Evans, G.W., T.B. Gor and E. Unger (1996). A simulation model for evaluating personnel schedules in a hospital emergency department. Proceedings of the 1996 Winter Simulation Conference
Fries, B.E., C.E. Gutkin and A.S. Ginsberg (1977) Emergency Room Utilization: Data reconstruction using a deterministic model, Computers and Biomedical Research, V. 10, pp. 153-163.
Garcia, M.L., M.A. Centeno, C. Rivera and N. DeCario (1995). Reducing time in an emergency room via a fast-track. Proceedings of the 1995 Winter Simulation Conference, pp. 1048-1053.
Greene, J. (1995). Challenges entering the ER. Modern Healthcare, pp. 31-34. Institute for Healthcare Improvement (1995). Reducing Delays and Waiting Times
Throughout the Healthcare System, IHI, Boston, MA. Jacobson, S.H., J.B. Jun and J.R. Swisher (1999). Application of discrete-event simulation in
health care clinics: a survey. Journal of the Operational Research Society, V. 50, pp. 109-123.
Jones, L.K. (1999). Inferring balking behavior from transactional data. Operations Research, V. 47, pp. 778-784.
Kuban, A. and E. Ulacs (1996). Simulation modeling for emergency bed requirement planning. Annals of Operations Research, V. 67, pp. 183-210.
Litvak, E., M.C. Long and A.B. Cooper (2001). Emergency department diversion: causes and solutions. Academy of Emergency Medicine. V. 8, pp. 1108-1110.
Lopez-Valcarcel, B. and P. Perez (1994). Evaluation of alternative functional designs in an emergency department by means of simulation. Simulation, V. 63, pp. 20-28.
McCaig, L.F. and C.W. Burt (2001). National Hospital Ambulatory Medical Care Survey: 1999 Emergency Departmetn Summary. Centers for Disease Control and Prevention,
Movaghar, A. (1998). On queueing with customer impatience until the beginning of service. Queueing Systems, V. 29, pp. 337-350.
1. Modeling Patient Flows Through the HEALTHCARE System 45 Panayiotopoulos, J.-C. and G. Vassilacopoulos (1984). Simulating hospital emergency
departments queueing systems. European Journal of Operational Research, V. 18, pp. 250-258.
Puig-Junoy, J., M. Saez and E. Martinez-Garcia (1998). Why do patients prefer hospital emergency visits? A nested multinomial logit. Health Care Management Science. V. 1, pp. 39-52.
Rossetti, M.D., G.F. Trzcinski and S.A. Syverud (2000). Emergency department simulation and determination of optimal attending physician staffing schedules. Proceedings of the 2000 Winter Simulation Conference.
Schneider, S., F. Zwemer, A. Doniger (2001). New York: a decade of emergency department overcrowding. Academy of Emergency Medicine, V. 8, pp. 1044-1050.
Schull, M.J., J.-P. Szalai and B. Schwartz (2001). Emergency department overcrowding following systematic hospital restructuring: trends at twenty hospitals over ten years. Academy of Emergency Medicine, V. 8, pp. 1037-1043.
Shaw, K.M., S.M. Selbst and F.M. Gill. (1990). Indigent children who are denied care in the emergency department. Annals of Emergency Medicine. V. 19, pp. 59-62.
Vissers, J.M.H. (1998). Patient flow-based allocation of inpatient resources: a case study. European Journal of Operational Research, V. 105, pp. 356-370.
Whitt, W. (1999). Improving service by informing customers about anticipated delays. Management Science, V. 45, pp. 192-207.
Zenios, S.A. (1998). Modeling the transplant waiting list: a queueing model with reneging. Queueing Systems, V. 31, pp. 239-251.