Embed Size (px)
Citation preview
Chapter 1
Introductory Background, Research Design and Framework of the Study
1.1 Introduction
1.2 Statement of the Problems
1.3 Review of Literature
1.4 Research Gap
1.5 Scope of the Study
1.6 Objectives of the Study
1.7 Hypotheses of the Study
1.8 Methodology of the Study
1.9 Limitations of the Study
1.10 Expected Contribution of the Study
1.11 Conclusion

Introductory Background, Research Design and Framework of the Study
1
1.1 Introduction
Mutual Funds (MFs) play a vital role in resource mobilization and
their efficient allocation in a developing economy like India. Mutual funds
are financial intermediaries in the investment business. It mobilizes
resources from the small investors. The mobilized funds are, thereafter,
utilised to purchase the securities of companies and corporations. It is thus
an institutional arrangement for resource mobilization from small,
marginal and household sector investors. The mobilized funds are used to
acquire shares and securities of reputed companies. The importance of
mutual funds has increased manifold in the capital market, particularly
after liberalization. It has helped in increasing the investor‟s base.
In the 1992-93 budget, the finance minister‟s proposal to allow
setting up mutual funds in joint and private sectors has further accelerated
the growth of mutual funds1. Far reaching changes have taken place in
our economic system since liberalization. India is now one of the fastest
growing economies in the world with average GDP growth rate of eight
percent annually. According to the latest World Bank data, India is now
the twelfth largest economy of the world.
The savings and investment pattern in our country have undergone
some significant changes since liberalization. Investors now have various
avenues to invest their hard earned money. In this context, mutual funds
appears the best investment avenue, where the money of the investors is
professionally managed having lesser risks and good return. Due to this
very fact mutual funds are popular avenues for investments for small
investors. This very fact was highlighted by the then Finance Minister, T.
T. Krishnamachary, when he introduced the UTI Bill in Parliament in
Introductory Background, Research Design and Framework of the Study
2
November 1963. He said “the unit trusts provide an opportunity for the
middle and lower income groups to acquire without much difficulty
property in the form of shares”2. Hence our economic policy makers were
convinced that mutual funds could offer a safe conduit for household
participation in equity market.
The process of liberalization initiated in 1991 to boost the ailing
economy has brought in a lot of changes in various aspects of the financial
market. This had a positive impact in all sphere, increasing the saving rate
to 23 percent in the last few years one of the highest in the world. The
performance of the stock market has been tremendous and has become one
of the largest markets in the world in terms of capitalisation. All these
factors directly or indirectly have led to the tremendous growth of Indian
mutual fund industry. People willing to earn higher rate of return by
taking minimal risks are finding Mutual Funds (MFs) a good avenue to
invest their savings.
Mutual funds have shown consistency in its performance and for the
past eight years or so, the Indian MFs industry has registered a growth
rate of around 16.68% and it is expected to continue in future. With the
entrance of new fund houses and the introduction of new funds into the
market, investors are now being presented with a broad array of fund
choices. Fund houses with the better known brand equity are sure to
capture the biggest spending investors. The present study therefore aims
to find out the how liberalization has helped the industry to flourish and
how HDFC mutual fund, a private sector mutual fund has performed on
various counts, to asses the advantages of investment in mutual funds in
comparison to other available option of investment.
Introductory Background, Research Design and Framework of the Study
3
1.2 Statement of the Problems
The Indian mutual funds industry is going through a phase of
transformation since liberalization. Liberalization has paved the way for
foreign investors in the mutual fund industry. This has increased the pace
of evolution in the industry and made more products and services
available to investors. Institutional investors dominate the mutual fund
industry. They hold about 57 percent the total net assets whereas, retail
investors account for about 37percent.
Thus the present study is an endeavour to study the impact of
liberalization on the mutual fund industry, how the financial sector
reforms necessitated due to liberalization, have led to growth and
development of the Indian mutual fund industry. The study also attempts
to find out the performance of select mutual funds schemes of HDFC
mutual funds in the changed environment. Their performance in
comparison to S&P CNX Nifty Index and 91- Day Treasury bill used as
surrogate for risk- free rate of return. The following paragraphs present
review of literature.
1.3 Review of Literature
Various aspects of mutual fund have been studied by the researcher
in the following section.
(Kelly and Others, 2009), In their study “A Case Study of Ethics and Mutual
Funds Mismanagement at Putnam”, examines the failure of top management
at Putnam to exercise ethical behaviour in the face of their clear knowledge
of corruption in the company. Market timing by employees was expressly
forbidden by Putnam. In spite of this six employees, including two
portfolio managers, were repeatedly engaged in market timing activities
Introductory Background, Research Design and Framework of the Study
4
from 1998 to 2003, garnered over a million dollars in personal profit. The
study found that CEO and key senior executives had factual knowledge of
the abuses but the management failed to stop the abuses or to discipline
those involved until faced with charges from government regulators. By
failing to do so, top management breached ethical duties to its
shareholders and inflicted serious damage to the organization. The end
results of top management‟s failure to address ethical violations were
significant outflow of assets from Putnam‟s funds, payment of penalties,
and loss of trust among investors. The author raised concern about ethical
issues surrounding mutual fund trading practices and the impact that top
management can have on the ethical behaviour of employees 3.
(Das and Others , 2008), on the basis of their study “Mutual Fund vs. Life
Insurance: Behavioural Analysis of Retail Investors”, found that that the post
1990 period, the service sector in most of the Asian economies witnessed
growth fuelled by significant changes in their financial sector. They
analyzed the role of Indian insurance and mutual fund industry in
financial market .To understand the retail investors‟ behaviour towards
different savings avenues on the basis of their age, gender, education and
profession. The study identified the features the retail investors look for in
investment products like the investor‟s preference for fund/scheme
selection. They also identified the source of information that influences the
fund/scheme selection decision and tried to find out the behavioural
pattern of retail investors towards two important investment
opportunities, i.e., mutual fund and life insurance4.
(Tripathy,2007), in her book, “ Mutual Funds in India emerging Issues” ,
discussed about the basic concepts of mutual fund, operational policies,
Introductory Background, Research Design and Framework of the Study
5
practices, investment in securities, some aspects of portfolio management,
selection, mutual fund marketing, and detailed analysis of the latest
developments in mutual fund industries. Apart from this, she also
emphasize on the fundamentals of research with details of statistical tools
required for analysis in research work and discussed in detail about the
current status of development and future prospects of mutual fund
industry in India 5.
(Agrawal and Gupta, 2007), “Performance of Mutual funds in India: An
Empirical study”, evaluated the performance of mutual funds operation in
India. To carry out their empirical work, the quarterly return of all equity
diversified mutual funds return for the period January 2002 to December
2006 was tested. Analysis was carried out with the help of Capital Asset
Pricing Model (CAPM) and Fama-French Model. On the basis of their
study they suggest that mutual funds actually added value and investing
in them was worthwhile for investors. However, application of Fama-
French model opposes this. This model, which predicates returns on excess
market returns, size factor, and value factor, suggests that returns earned
by mutual funds were actually due to exposure to these factors only and
the fund managers did not add any value. Moreover, the only factor that
seems to impact mutual fund returns is the excess market returns; size and
value factors when taken along with excess market returns do not hold any
significance. In contrast, both size and value factors when taken
individually with excess market returns show that they have significant
impact on returns6.
(Sujatha,2007), in her article “Real Estate Mutual Funds in India”, discussed
the SEBI guidelines for Real Estate Mutual Funds (REMFs) with regard to
investment criteria, regulatory safeguards and structure of the REMFs. The
Introductory Background, Research Design and Framework of the Study
6
author also tried to find out the evolution of REMFs in India and
highlights the pros and cons of investing in these funds. The study
explored the impact of these funds on the growth of real estate industry in
India and highlighted the importance of REMFs in the growing real estate
industry 7.
(Rao and Mishra, 2007), in their article “MFs Industry in India “, discussed
how in recent times, the Indian Mutual Fund Industry has witnessed
several structural and regulatory reforms. The reforms were intended with
the objective of facilitating investors in investing in mutual funds, making
their investment more safer and yielding higher return. They also
discussed how the regulatory frame work were introduced for gold
traded funds and the government relaxing norms for Foreign Direct
Investments in real estate ventures. They also discussed all important
changes that have taken place in the mutual funds industry in recent years.
They have carried out a comprehensive study of various changes that has
taken place in the mutual funds industry to facilitate investment and
protect investor rights 8.
(Verma, 2007), in his study “Needs of a Healthy Investment Portfolio with
Special Reference to Hybrid Funds “, analyzed the Hybrid Funds, their
advantages, and future prospects in India. He also makes a microscopic
study of various investment avenues, the risk involved and the return
generated. He also has a look at investment styles and objectives of hybrid
funds and concluded that the Hybrid Equity-oriented Fund over
shadowed the Sensex by giving returns of 16.25% compared to 10.96% of
Sensex over a one-year time period as on May 6, 2005 9.
Introductory Background, Research Design and Framework of the Study
7
(Shukla, 2006), in his study “Mutual fund purchases by high net worth
individuals in India”, observed that Indian MFs industry is dominated by
institutional investors who hold about 65% of the Indian mutual fund
assets, whereas retail investors account for only 1.3 percent. In the last
decade, High Net worth Individuals (HNWIs) have emerged as prominent
players in the MF segment. The study aims to identify factors that drive
Indian HNWIs to invest in Mutual Funds 10.
(Verma ,2006), On the basis of his study “Can AMCs Sustain Their Big
Gains”, tried to find out the underlying reason for the growth of mutual
funds industry in India and also the factors that could affect the growth of
Asset Management Companies. On the basis of his study he deduced that
AMCs need to focus on the investor‟s financial desires and keeping their
growth track intact. They need to understand the kind of the schemes
desired by the investors so that they are able to get the share of the funds
that are lying in other investment avenues 11.
(Mendali , 2006), in his study “Mutual Funds Regulations”, discussed how
the regulatory environment in India acted as a forerunner for the overall
growth and stability of the capital market. For smooth functioning, better
efficiency, transparency and investor affability, the Government issues a
certain set of guidelines for the mutual funds industry. He also discusses
the role of Securities and Exchange Board of India (SEBI), the statutory
legal body that issues the authorization to mutual funds to do business
and how the role of SEBI, has been exemplary in controlling fraudulent
practices. He also emphasized the AMFI role in this context 12.
Introductory Background, Research Design and Framework of the Study
8
(Mohan, 2006), in his study “Mutual fund industry in India: development and
growth”, analyzed how the Indian mutual fund industry has become one of
the fastest growing sectors in the Indian capital and financial markets. He
also makes study of the various developments in mutual fund industry in
India which has experienced dramatic improvements in quantity as well as
quality of product and service offerings in recent years. He also makes
study of Mutual funds assets under management which grew by 96%
between the end of 1997 and June 2003 and as a result it rose from 8% of
GDP to 15%. On the basis of his study he infers that the industry has
grown in size and manages total assets of more than $30351 million. He
also draws attention towards the fact that the private sector accounts for
nearly 91% of the resources mobilized showing their overwhelming
dominance in the market while the Individuals constitute 98.04% of the
total number of investors and contribute US $12062 million, which is
55.16% of the net assets under management 13.
(Sondhi and Jain, 2005), in their work “Financial Management of Private and
Public Equity Mutual Funds in India: An Analysis of Profitability “, examined
the rates of returns generated by equity mutual funds, vis-à-vis, 364 days
T-bills and the Bombay Stock Exchange-100 (BSE-100) National Index
during the period 1993-2002. For this they took sample of 36 equity
mutual funds from 21 asset management companies belonging to private
and public sectors. On the basis of their study they found that only one-
fourths of the equity mutual funds were able to generate superior returns
than the risk-free return (on T-bills). Lower average monthly fund return
of 0.44 percent as compared to risk-free return on T-bills (0.80%) and lower
median monthly return of 0.31 % by these mutual funds as compared to
Introductory Background, Research Design and Framework of the Study
9
0.81percent of T-bills support their above findings that mutual funds have
failed to earn returns in excess of risk-free returns. They also found that
mutual funds did not show consistent performance as less than one-tenth
of the funds only could earn higher returns than the T-bills during both the
phases. However their findings when compared with the market portfolio
(BSE-100index) displays different picture. On the basis of the data it is
evident that overall performances of equity mutual funds (mean monthly
return of 0.44%) have been far superior to the market portfolio return
(mean monthly return of 0.14%). In numbers, majority of the funds or
nearly two-thirds of the sample funds (61%) have outperformed market
portfolio returns during the aggregative period, 1993-02.Hence on the
basis of their study they concluded that private sector sponsored mutual
funds have been able to earn returns much higher than the market returns.
They believe that this is due to better stock selection and timing skill of
private sector mutual funds manager. They by employing better
management practices have been able to out perform the public sector
mutual funds14.
(Tripathy, 2004), in her study “An Empirical Analysis on Performance
Evaluation of Mutual Funds in India: A Study on Equity Linked Savings
Schemes”, evaluated the performance of 31 tax planning schemes in India
over the period 1994-95 to 2001-2002. To carry out the study she examined
the investment performance of Indian mutual funds in terms of six
performance measures. She concluded that the fund managers under
study have not been successful in reaping returns in excess of the market
or in ensuring an efficient diversification of portfolio. This was evident
from the fact that only one scheme showed linear relationship to return
Introductory Background, Research Design and Framework of the Study
10
and risk and while others failed to do so. This was attributed to fund
manager‟s acumen of selectivity and poor investment planning of the
Fund 15.
(Chander and Singh, 2004), in their work “Performance of Mutual Funds in
India An Empirical Evidence”, studied the performance of selected schemes
of mutual funds based on risk-return relationship. For the purpose, they
used the time-tested models of mutual funds performance evaluation
given by Sharpe (1966), Treynor (1965) and Jensen (1968). In all, 23 growth
schemes floated by five mutual funds viz; Alliance Capital, Prudential
ICICI, Pioneer ITI, UTI and Templeton India fund was taken for study. The
data relates to the period since inception date of a particular scheme till
March 31, 2001.They analysed the data on the basis of coefficient of
determination, diversifiable risk, beta risk, mean return in addition to
Sharpe ratio, Treynor ratio and Jensen‟s alpha and concluded that the
performance of mutual funds schemes was not so bad as compared to
market performance over the given period as has been the generalized
allegation. They also found that schemes floated by Alliance Capital,
Prudential ICICI and, to some extent, Pioneer ITI have earned better than
the market whereas UTI and Templeton India have not performed well as
compared to the market16.
(Sengupta, 2003), in his study “Efficiency test for mutual funds Portfolio”,
developed a set of nonparametric tests which includes the convex hull
method and the stochastic dominance criteria for evaluating the
performance of mutual fund portfolios. On the basis of empirical results it
is evident that some groups of funds based on new technology tend to
outperform the others and in most cases the investor shows a preference

Introductory Background, Research Design and Framework of the Study
11
for skewness, thus emphasizing an asymmetry in the mean variance
relationship. Technology funds tend to exhibit second order stochastic
dominance over the income and growth funds. This shows some new
features of the mean variance efficiency frontier 17.
(Sadhak,2003), “Mutual Funds in India Marketing Strategies and Investment
practices”, discussed that the mutual funds industry is still nascent stage in
India, but has assumed considerable significance in the post-liberalized
market economy. He critically examines the recent growth and
performance of mutual funds in India, while identifying the constraints in
their development. He addresses the major structural, regulatory and
operational issues pertaining to Indian mutual funds, keeping in mind the
changing perceptions of investors and the emerging market structure.
Considering the growing globalization of Indian financial markets and
their integration with world markets, he also outlines the conceptual
framework and established operational practices of mutual funds in
developed countries such as the USA, UK and Japan. In the process, he
provides valuable data relating to mutual funds in these countries and in
India. Overall, the book focuses on strategic directions for mutual funds
with regard to marketing and investment to enable them to cope with the
emerging challenges in the fast-changing savings and capital markets in
India 18.
(Singh ,2003), in his book “Mutual Funds in India” covered all aspects of
mutual funds like theoretical aspects regulatory frame work of mutual
funds in India and mutual funds organised by banks and private sector.
He has made a comparative analysis of performance of various mutual
funds in order to provide better insight about the working of mutual
Introductory Background, Research Design and Framework of the Study
12
funds and also given various suggestions for the improvement of mutual
funds industry in India 19.
(Borensztein and Gelos, 2003), in their article, “A Panic-Prone Pack? The
Behaviour of Emerging Market Mutual Funds”, explored the behaviour of
emerging market mutual funds using a novel data base covering the
holdings of individual funds over the period January 1996to December
2000. On the basis of their findings they deduced that the degree of
herding among funds is statistically significant, but moderate. Herding is
more widespread among open-ended funds than among closed-ended
funds, but not more prevalent during crises than during tranquil times.
They also found some evidence that funds tend to follow momentum
strategies, selling past losers and buying past winners. The study
observed that degree of herding and momentum trading is not enough to
account for the large observed volatility on international capital markets 20.
(Chander, 2002), in his book “Performance Appraisals of Mutual Funds in
India”, examined the risk –return of mutual funds with a view to
investigate mutual funds performance in terms of theoretical performance
evaluation model developed by Sharpe, Treynor and Jensen. In his study
he also made a comprehensive decomposition of portfolio performance to
attribute it to various activities of fund manager such as stock selectivity,
market timing risk bearing and diversification. In addition the author also
examines the contemporary portfolio management practices with regard to
portfolio construction, portfolio management, portfolio performance
evaluation, and investor service and disclosure practices21.
(Gupta, 2000) in his article “Investment Performance of Indian Mutual Funds:
An Empirical Study”, has examined the investment performance of Indian
Introductory Background, Research Design and Framework of the Study
13
mutual funds in terms of six performance measures, using weekly NAV
data for 73 mutual fund schemes from 1994 to 1999. On the basis of his
study he found that the schemes selected for the study could not perform
better than the market22.
(Singla and Singh, 2000), in their study “Evaluation of Performance of
Mutual Funds Using Risk-return Relationship Model”, evaluated performance
of mutual funds using risk-return relationship models given by Sharpe,
Treynor and Jensen. On the basis of their study they found that the
performance of the 12 growth oriented schemes was inferior compared to
that of market return. Sharpe‟s ratio shows that mutual funds have
performed poorly with regard to return on investment as compared to
market. Treynor measure calculated showed investors did not earn
adequate returns per unit of systematic risk undertaken. Also, Jensen
measure calculated indicated that on an average fund earned about 0.2%
less per month given their level of systematic risk. The negative value of
alpha is indicative of the fact the schemes could not earn enough to
recover various expenses involved in ooperation23.
(Sethu, 1999), conducted a study “The Mutual Fund Puzzle”, to establish
whether the fund portfolios are adequately diversified, do they give excess
returns after adjusting for systematic risk; and do the portfolios show
market timing. For this the author selected 18 open-ended growth
schemes. On examining 18 open-ended growth schemes for the period
March 1985-July 1999 the percentage of beta risk (73.38 to 44.43) and
percentage diversifiable risk (55.57 to 26.62) indicated poor diversification.
The excess return earned by the funds is statistically insignificant. Majority
of the funds showed negative returns. However, some funds showed

Introductory Background, Research Design and Framework of the Study
14
excess positive returns. No fund exhibited any ability to time the market.
Hence, these findings negate the claims by mutual fund managers that
they can sight and exploit investment opportunities better than a naïve
investor. An investor who invests in a basket of risk-free securities and an
equity index can match the fund‟s return performance and can beat the
fund‟s diversification performance24.
(Graves, 1998), in his article “The Geography of Mutual Fund Assets”,
examined the spatial aspects of mutual fund investments. He discusses the
characteristics of the mutual fund industry and compares them to other
financial industries. He used previous studies of the financial industry and
quaternary location theory to find out whether mutual funds assets are
concentrated in large urban centers. Mutual fund assets may increasingly
concentrated in financial centers over the 1986-1996 period; and the
distribution of mutual fund assets may be similar to the distribution of
other financial activities. Examination of mutual fund asset data from 1986
and 1996 did not fully support any of the three hypotheses. These findings
suggest that the standard elements of quaternary location theory may need
to be re-evaluated 25.
(Gupta and Sehgal, 1998), „„Investment Performance of Mutual Funds: The
Indian Experience,‟‟ conducted a study to evaluate investment performance
of mutual funds to find out the following : a) fund diversification b)
consistency of performance c) consistency between risk measures and
fund objectives and d) risk-return relationship in general. They found that
income – growth scheme were best performer. To find out the
diversification they used (R)² value . Low value of (R) ² indicates very low
diversification. Results showed that out of sample of 80 schemes, income-
Introductory Background, Research Design and Framework of the Study
15
growth schemes were the best performers. As regards diversification, very
low coefficient highlights lack of diversification. Regarding consistency of
fund performance, Pearson‟s product moment correlation coefficient
indicates no consistent performance from year to year. However, income-
growth scheme of few funds showed consistent performance
outperforming the market index. Regarding consistency between measures
and fund objectives, the relationship between fund objectives and
systematic risk (betas) is inconsistent with expectations. The low and even
negative values show that the fund managers are not managing their fund
portfolios well as per the desired risk levels. Finally for risk-return
relationship, the results support the relationship for the Indian market
with standard deviation as measure of risk. However this value is not
consistent with the CAPM framework which predicts a relationship
between performance and systematic risk.26
(Ramachandran,1997), in his work “Pitfalls in Portfolio Performance
Measures and their Implications to Mutual Fund Industry “,found that
imperfection in the market coupled with the outside influence have made
return on investment less reliable in India .On the basis of his study , he
rejects CAPM under predictive and non-predictive forms. So, he
concluded that median of returns and mean absolute deviation of returns
might be considered as an alternative to mean and standard deviation of
returns, while evaluating mutual fund schemes risk adjusted performance
meaningfully wherever normality is violated with high peakedness and
long tails. He concluded that when these two methods are applied
individually for ranking mutual funds schemes there is a big difference in
the two results of performance measure .27
Introductory Background, Research Design and Framework of the Study
16
(Murthi, Choi and Desai ,1997) in their work “Efficiency of Mutual Funds
and Portfolio Performance Measurement: A Non-parametric Approach”,
proposed a new index to measure portfolio performance named as Data
Envelopment Portfolio Efficiency Index (DPEI). It is an extension of
operations research technique of data envelopment analysis identified as a
relative measure of performance that does not require the specification of a
benchmark and also incorporates transaction cost. For the purpose, 731
mutual funds were put into seven categories as: Aggressive growth, asset
allocation, equity-income, growth, growth-income, balanced and income
fund. Findings showed that managers in aggressive growth, asset
allocation, and income and equity-income funds are relatively more
efficient in utilizing resources while growth, balanced and growth-income
funds show a lower efficiency index. As regards the relationship between
performance and transaction costs, the findings were that mean efficiency
scores were not related to mean expense ratios, mean loads or mean
turnover implying thereby that higher transaction costs are not correlated
with better efficiency scores (DPEI). Lastly, regarding effect of size of fund
on performance, the correlation between the mean DPEI for each category
and mean Net Asset Value (NAV) suggested that efficiency is not related
to the size of the fund. 28
(Sehgal, 1997), “An Empirical Testing of Three-parameter Capital Asset Pricing
Model in India’’, empirically tested three-parameter Capital Asset Pricing
Model in Indian capital market by taking monthly rates of return (adjusted
for bonus, stock splits and right issues) for 80 securities included in BSE
National index. The evidence indicated that CAPM is not a suitable
descriptor of asset pricing on the Indian capital market for the period of
Introductory Background, Research Design and Framework of the Study
17
the study. Slope was found negative but insignificant for the total period,
implying absence of any significant relationship between β and average
return. 29
(Thiripalraju and Patil, 1997), “Micro and Macro Forecasting Abilities of
Indian Fund Managers” made a study from 1994 to 1999. He on the basis of
his study found that none of the schemes selected for study could earn
more than the market rate of return. He also highlighted the fact that
portfolio manager were unable to book profit during the market boom this
he attributed to due to lack of knowledge about the market, the manager
could not reap benefit of investment during favourable conditions.30
(Rao and Venkateswarlu, 1997), “Performance Evaluation of Mutual Funds”
A case study of Unit Trust of India” , found that the performance of UTI
schemes were not superior that of the market and only few schemes were
able to outperform the market.31
(Madhusoodanan , 1996), “Risk and Return: A New Look at the Indian Stock
Market’’ conducted a study to find out the relationship between the
expected return and risk by using portfolio method rather than the
individual security approach. For this purpose, portfolios were formed to
test their performance. Results indicated that the risk and expected return
in the Indian market are not necessarily positively related. In Indian
market, the investor rationality and risk aversion do not appear to be
important. It is found that higher risk is not priced and investing in higher
risky securities with the expectation of high returns in future may not
produce good results. In case of yearly test periods, as against quarterly
ones, the securities, which had produced high returns in the past, did not
perform well in the next period. Hence, the policy of selling prior winners
Introductory Background, Research Design and Framework of the Study
18
and purchasing prior losers could produce excellent results over one year
investment horizon 32.
(Chordia, 1996), “The Structure of Mutual Fund Charges” provided an
explanation for diversity in investment strategies and fees of open – end
mutual funds. It sought to dissuade redemption through front – end and
back – end load feed. The empirical evidence was found consistent with
model predictions that such fees dissuade redemptions in open – end
funds, and that fund held more cash when there was uncertainty about
redemptions 33.
(Lockwood, 1996), “Macroeconomic Forces and Mutual Fund Betas”
developed a model in which fund beta were linearly related to changes in
macroeconomic factor using monthly returns. Author selected 171 mutual
funds over a period of 1978-91. On the basis of his study he concluded that
there was negative relationship between equity funds, beta and inflation
changes and default risk premium 34.
(Panigrahi, 1996), “Mutual Funds: Growth, Performance and Prospects”
examines the impact of capital market reforms on mutual funds. He found
that there has been shift in focus from individual investors to institutional
investors. The investible resources of mutual funds have increased
manifold mainly due to economic reforms and liberalisation35.
(Bekaert and Urias, 1996), “Diversification, Integration and Emerging Market
Closed-End Funds” they studied a new class of unconditional and
conditional mean-variance spanning tests that exploits the duality between
Hansen-Jagannathan bounds (1991) and mean- standard deviation
frontiers. They used it to examine the diversification benefits from
emerging equity markets using an extensive new data set on U.S. and
Introductory Background, Research Design and Framework of the Study
19
U.K.-traded closed-ended funds. In their study they found significant
diversification benefits for the U.K. country funds, but not for the U.S.
funds. They relate this difference to portfolio holdings rather than to the
behaviour of premiums in the United States versus the United Kingdom.
They concluded that emerging market funds provide statistically
significant diversification gains in unconditional tests, while comparable
U.S. funds do not 36.
(Tripathy, 1996), “Innovative Growth Oriented Mutual Funds” has evaluated
the performance of growth oriented schemes by using CAPM model and
Jensen, Treynor, Sharpe measures and concluded that performance of the
scheme depends upon the performance of mutual funds. The fund may
produce returns either above or below average, but it may be superior
over the long run. Again in her further study (1998), she concluded that it
is imperative that appropriate measures are taken to boost the mutual
funds industry as they are important for the growth and development of
capital market and spreading equity culture.37
(Yadav and Mishra, 1996), “Performance Evaluation of Mutual Funds : An
Empirical Analysis” have evaluated performance of 14 mutual fund
schemes using monthly data. They used three risk-adjusted performance
measures namely Sharpe Index, Treynor Index and Jensen measure. On
the study concluded that the funds as a whole performed well in terms of
non-risk-adjusted measure of average returns .He also deduced that fund
manager adopting a conservative investment policy and maintained a low
profile beta 38.
(Kaura and Jaydev, 1995), “Performance of Growth Oriented Mutual Funds:
An Evaluation” evaluated the performance of five growth oriented
Introductory Background, Research Design and Framework of the Study
20
schemes in the year 1993-94, by employing Sharpe, treynor and Jensen
measure. On the basis of their study they concluded that Master gain 91,
Canbonus and Indsagar have performed better than the market in terms of
systematic but not in terms of total risk 39.
(Sarkar and Majumdar, 1994), „Performance Evaluation of Mutual Funds in
India”, evaluated the performance of five growth oriented schemes for the
period February 1991 to August 1993. They used CAPM and Jensen
measures to evaluate the performance. They conclude that the selected
mutual fund schemes have not offered superior returns during the study
period than the market in general 40.
(Shah and Thomas, 1994), “Performance in Evaluation of Professional
Portfolio Management in India” studied the performance evaluation of 11
mutual fund schemes and concluded that except one scheme other
schemes earned inferior returns than the market in general 41 .
(Bhosale and Adhikary, 1994), “Risk-Return Analysis of Mutual Fund
Growth Scheme”, evaluated the performance of growth schemes using
Sharpe, Treynor, Jensen and Fama‟s measures. They used Fama‟s measure
for identifying returns due to diversification and systematic risk 42.
(Shukla and Singh, 1994), in their study, “Are CFA Charter- holders better
equity fund Managers”, found that professionally qualified fund managers
were better performer than those who were not professionally educated.
They also found that portfolios constructed by professionally educated
people were riskier but better diversified thus minimising risk and
maximising return 43.
Introductory Background, Research Design and Framework of the Study
21
(Ansari, 1993), “Mutual Funds in India: Emerging Trends”, highlighted the
importance of mutual funds industry in the Indian financial system. For its
overall growth and development, he advocated setting up of regulatory
body to regulate mutual fund operation in India 44.
(Gangadhar, 1992), “The Changing Pattern of Mutual Funds in India”, on the
basis of his study concluded that due to liberalisation the Indian capital
market had experienced structural changes and unprecedented growth. He
observed that all these will provide new avenues conducive for floating
mutual funds 45.
(Angel, 1992), in his paper “Role of Self-Regulatory Organisation in Mutual
Fund Industry in India”, advocated setting up of regulatory framework for
the oversight of mutual funds industry in India. According to him this was
necessary as paradigm changes had taken place in the financial sector due
to liberalisation 46.
(Sarkar, 1992), “Should we invest in Mutual Funds”, made a comparative
study of investment in mutual funds with that of other security
alternatives. He on the basis of his study concluded that mutual funds are
the best avenue for investment for those who are ready to bear risk in the
hope of getting superior return.47
(Sarkar, 1991), “Performance Evaluation of Mutual Funds”, pointed out in his
study that the methodology adopted by Sharpe (1996) and Trenyor (1968)
to rank the performance of mutual funds were similar in nature. Though
the methodology adopted by them were different 48.
(Barua and Varma, 1991), “Master shares: A Bonanza for Large Investors”
evaluated the performance of master share (1987-1991) using CAPM
Introductory Background, Research Design and Framework of the Study
22
approach. They used ET Index as a proxy for market behaviour. The risk
adjusted performance was evaluated by using Sharpe, Jensen and Treynor
measures. They concluded that the fund performed better than the market,
but the fund did not do well when compared to Capital Market Line
(CML) 49.
(Guy, 1978), “The Performance of the British Investment Trust Industry”, used
the Sharpe and Jensen measure to evaluate the risk adjusted performance
of UK investment trusts. For this they grouped forty – seven investment
trusts into equal and value weighted portfolio with monthly price and
investment return for the period 1960-70. Further he concluded that, no
trusts had exhibited superior performance, compared to the London Stock
Exchange 50.
(Kon and Jen, 1978), “The Investment Performance of Mutual Funds and
Empirical Investigation of Timing selectivity and Market Efficiency”,
empirically estimated the level of systematic risk and performance of 49
mutual funds over the period of 1960-71. The results indicated that a very
substantial fraction of mutual funds had two levels of systematic risks
during each of the three sub- periods. The study demonstrated that no
fund manager had the forecasting abilities 51.
(Norman, 1977), “Risk, The Pricing of Capital Assets and the evaluation of
Investment portfolios: A comment”, applied neutral risk adjusts performance
measure and concludes that approximately sixty six percent of the funds
(out of 75) had larger net returns adjusted for systematic risk 52.
(Klemkosky, 1977), “How Consistently Do Managers Manage”, examined
performance consistency of fund managers on the basis of results for 158
mutual funds for the period 1968-1975 by analyzing rank order of
Introductory Background, Research Design and Framework of the Study
23
performance over different two year and four year periods. On the basis of
results, he concluded consistency in performance between four year
periods, but relatively low consistency between adjacent two year
periods53.
(McDonald, 1974), “Objectives and Performance of Mutual Funds, 1960-67”
examined the relationship between the stated fund objectives and their
risks and return attributes. They conclude that there was positive
relationship between stated objectives and risks 54.
(Jensen, 1968), “The Performance of Mutual Funds in the period 1945-64”,
developed a composite portfolio evaluation technique that considered
returns adjusted for risk difference and used it for evaluating 115 open –
ended mutual funds during the period 1945-66. For the full period Jensen
examined returns net of expenses and gross of expenses. The analysis of
net return indicated that 89 funds had above average returns adjusted for
risks, while 76 experienced abnormally poor return. On the basis of his
analysis Jensen concluded that for the sample of 115 mutual funds, the
fund manager were not able to forecast security prices well enough to
recover research expenses and fees 55.
(Sharpe, 1966),” Mutual Fund Performance”, developed a composite
measure to consider return and risk. Based on this he evaluated the
performance of 34 open and mutual funds during the period 1944-63. He
observed that 11 funds had outperformed the bench mark. Based on this
evidence, Sharpe concluded that average mutual fund performance was
inferior to an investment in stock market. An analysis of relationship
between fund performance and its expense ratio indicated that good
Introductory Background, Research Design and Framework of the Study
24
performance was associated with low expense ratio. On the other hand,
only a low relationship was discovered between size and performance 56.
1.4 Research Gap
From the foregoing comprehensive literature review related to
mutual funds industry in India, it is evident that though few works has
been done to find out the growth of mutual fund since the inception of
UTI. But no detailed study has been undertaken to assess the impact of
liberalization on the mutual funds industry in India. Also no empirical
work has been done to find out performance evaluation of HDFC mutual
funds schemes. Therefore, the present study has been done to find out the
impact of liberalization on the net resource mobilized by mutual funds, its
impact on house hold sector savings. Also an elaborate empirical work is
carried out to assess the performance of HDFC mutual funds schemes in
comparison to benchmark indices.
The present study differs from the earlier studies as it covers all
aspects of mutual funds industry in India since 1993. The year 1993 is
important as it was in this year that SEBI Mutual Funds regulation was
enacted and also the private sector mutual funds were allowed to start
operation in India. The study makes an attempt to trace the impact of
liberalization on the Indian mutual fund industry. It also tries to find out
the performance of HDFC mutual funds in comparison S & P CNX NIFTY
index and their portfolio composition and diversification of each scheme.
1.5 Scope of the Study
The present study would cover period from 1981-2008, a period of
28 years to asses the growth and development of mutual funds industry in
general and the impact of liberalization on net resource mobilization in
Introductory Background, Research Design and Framework of the Study
25
particular. The study also covers a period of eight years from Sep. 2000 to
March 2008 for evaluating the investment performance of HDFC mutual
funds schemes. The present study focuses mainly on the growth trend of
Indian mutual funds schemes and household sector savings mobilization
by the mutual funds in India. The S & P CNX NIFTY Index is used by the
researcher to compare the performance of HDFC mutual funds schemes.
The study has used the monthly yields on 91-day Treasury bills (T-bills) as
a surrogate for the risk- free rate of return
1.6 Objectives of the Study
Mutual funds industry has grown up by leaps and bounds since
liberalization. Moreover the entry of private mutual funds (since 1993) has
injected a sense of competition and the industry has been witnessing
structural transformation from a public sector monopoly to monopolistic
industry. Therefore to find out the growth and development of Indian
mutual funds industry the present study has the following objectives:
1. To find out the impact of liberalization on the growth trend of the
Indian mutual funds industry.
2. To evaluate the role of mutual funds in the mobilization of house
hold sector savings.
3. To trace the recent issues and challenges of the Indian mutual funds
industry.
4. To find out necessary facts related to selected HDFC mutual funds
schemes which can benefit the investors and fund managers.
5. To evaluate the investment performance of selected mutual funds
schemes in terms of risk and return.
Introductory Background, Research Design and Framework of the Study
26
6. To examine the funds sensitivity to the market fluctuations.
7. To appraise investment performance of mutual funds on risk
adjusted the theoretical parameters as suggested by Sharpe, Treynor,
Jensen and Famas.
8. And finally to come out with suggestions and recommendations for
enhancing the growth of Indian mutual funds industry in general
and HDFC mutual funds in particular.
1.7 Hypotheses of the Study
In order to fulfil and achieve the above stated objectives of the
research the study has been made on the basis of certain hypothesis
bifurcated according to the various dimensions of the Indian mutual funds
industry. The hypotheses of the study have been made according to the
need and importance of the study. The study has taken into consideration
the growth and development of Indian mutual funds industry in toto and
in term of net resource mobilization related to the Indian mutual funds
industry, the performance evaluation of HDFC mutual fund schemes and
its diversification as criteria for hypothesis. For testing purpose the
following hypotheses have been formulated.
Hypothesis 1
The null hypothesis of the study assumes, H0 : There is no significant
impact of policy reforms on net resource mobilized by mutual funds since
1993-94, while the alternate hypothesis of the study assumes, H1: there is a
significant impact of policy reforms on net resource mobilized by mutual
funds since 1993-94.
Introductory Background, Research Design and Framework of the Study
27
Hypothesis 2
H0: The investment performance of HDFC mutual funds schemes is not
superior to the relevant benchmark portfolio, while the alternate
hypothesis of the study assumes, H1: The investment performance of
HDFC mutual funds schemes is superior to the relevant benchmark
portfolio.
Hypothesis 3
H0: The schemes of HDFC mutual funds are not well diversified, while
the alternate hypothesis of the study assumes,H1: The schemes of HDFC
mutual funds are well diversified.
Hypothesis 4
H0: There is a no relationship between HDFC mutual funds schemes
investment objectives and their risk characteristic, while the alternate
hypothesis of the study assumes,H1: There is a relationship between
HDFC mutual funds schemes investment objectives and their risk
characteristic.
1.8 Methodology of the Study
The study is an empirical work based on the secondary data and
primary data collected from various sources for the fulfilment of
truthfulness of the analysis and interpretation and then to ensure the
quality of research study.
1.8.1 Collection of Data
a) Secondary Data
The secondary data for the study have been collected from various
secondary sources of information such as published reports of AMFI,
SEBI, RBI annual reports and bulletin. The annual reports of various
Introductory Background, Research Design and Framework of the Study
28
mutual funds and their monthly fact sheets have also been used. Other
reports such ad various reports from Ministry of Finance, Department of
Company Affairs etc are also collected for supporting the literature
references. Altogether relevant books, journals and periodicals, research
papers, published thesis, articles, financial dailies, websites, are also
consulted by the researcher for better referencing.
b) Primary Data
The primary source is the outcome of personal interviews with
experts, fund manager, brokers and agents.
1.8.2 Analytical Tools
The statistical tools used for the analysis and interpretation are:
Mean, variance, standard deviation and linear regression. Beside these the
following six measures were used to evaluate performance:
(a) Rate of Return
(b) Sharpe Ratio
(c) Treynor Ratio
(d) Jensen Measure
(e) Sharpe Differential Measure
(f) Famas‟ Composite of Investment Performance
Considering the technical nature of certain statistical tools and the
frequent use of these tools in the study a brief discussion of some relevant
tools are as follows:
1.8.3 Regression Technique
One of the techniques used in the statistical analysis is the regression
technique. It assumes a functional relation between the dependent variable
Introductory Background, Research Design and Framework of the Study
29
and Independent variable(s). If there is only one independent variable then
the technique relevant is known as simple regression and if there are many
independent variables then it is known as multiple regressions. The title of
the present research suggests that the variable like investment is the
dependent variable, whereas there can be many independent variables like
time and policies. (Also the other macro economic factors can be the
independent variables) The single variable regression takes the linear form
of functional relations like:
Y= a + b X. Where, Y is the dependent variable,
'X' is the independent variable,
"b" is the slope of the straight line
'a' is the Y-intercept.
In case of multiple regressions the functional relation takes the following formula
Y= a + b,X, + baX2 + bJC3 +... +b„ X„ Where, Y is the dependent variable
X1. X2, X3... Xn are the independent variables. B1, b2, b3 .......... bn
are the respective slope of the independent variables Xh X2.
X3……………… Xn, and, 'a‟ is the Y-intercept.
In the present study on pattern and trends in mutual funds earnest attempt
has been made to use the adequate statistical techniques. For the analysis
of total trend in net resource mobilisation for the entire period of 28 years
i.e. from 1981 to 2008, multiple regressions has been used between the
dependent variable “net resource mobilisation” and independent variables
“time” and “policy” which is assumed as dummy variables. (Dummy
variables one and two)

Introductory Background, Research Design and Framework of the Study
30
The regression equation that:
Y = α + βt + γtd
Where α , β and γ are constant and 't' = time and 'd'=dummy variable.
For measuring impact of policy reforms since 1993 dummy variables D has
been used.
1.8.4 R-Squared
R-squared values range from 0 to 100. R-squared of 100 means that
all movements of a security are completely explained by movements in the
index. A high R-squared (between 85 and 100) indicates the fund's
performance patterns have been in line with the index. A fund with a low
R-squared (70 or less) doesn't act much like the index. A higher R-squared
value will indicate a more useful beta figure. For example, if a fund has an
R-squared value of close to 100 but has a beta below 1, it is most likely
offering higher risk-adjusted returns. A low R-squared means you should
ignore the beta.
1.8.5 Return
Return on a typical investment consists of two components. The
basic component is the periodic cash receipts (or income) on the
investment, either in the form of interest or dividends. The second
component is the change in the price of the asset commonly called the
capital gain or loss. This element of return is the difference between the
purchase price and the price at which the asset can be or is sold; therefore,
it can be a gain or a loss. In the first place, we have computed the monthly
returns for each of the sample funds by using the following equation:
Introductory Background, Research Design and Framework of the Study
31
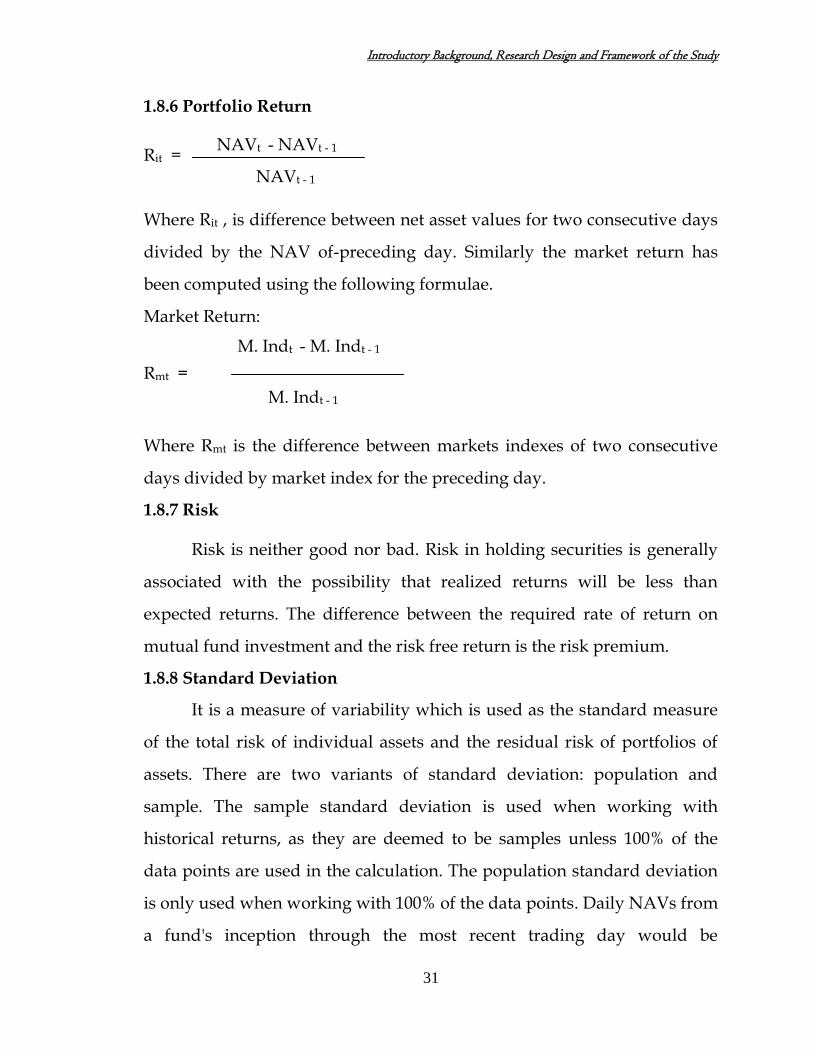
1.8.6 Portfolio Return
Rit =
Where Rit , is difference between net asset values for two consecutive days
divided by the NAV of-preceding day. Similarly the market return has
been computed using the following formulae.
Market Return:
Rmt =
Where Rmt is the difference between markets indexes of two consecutive
days divided by market index for the preceding day.
1.8.7 Risk
Risk is neither good nor bad. Risk in holding securities is generally
associated with the possibility that realized returns will be less than
expected returns. The difference between the required rate of return on
mutual fund investment and the risk free return is the risk premium.
1.8.8 Standard Deviation
It is a measure of variability which is used as the standard measure
of the total risk of individual assets and the residual risk of portfolios of
assets. There are two variants of standard deviation: population and
sample. The sample standard deviation is used when working with
historical returns, as they are deemed to be samples unless 100% of the
data points are used in the calculation. The population standard deviation
is only used when working with 100% of the data points. Daily NAVs from
a fund's inception through the most recent trading day would be
NAVt - NAVt - 1
NAVt - 1
M. Indt - M. Indt - 1
M. Indt - 1
Introductory Background, Research Design and Framework of the Study
32
considered to be a population. Monthly returns for the past ten years are a
sample.
In simple words, the standard deviation is the absolute value of the
average deviation of the data points from the mean. In mathematical terms
the it is the square root of the sample variance and the sample variance is
the sum of the squared deviations divided by the number of data points
less one, (n - 1). To compute the population variance, you would simply
divide by n instead of (n - 1) and the population standard deviation would
be the square root of the population variance.
1.8.9 Beta
Beta measures the systematic risk and shows how prices of securities
respond to the market forces. It is calculated by relating the return on a
security with return for the market. By convention, market will have beta
1.0. Mutual fund is said to be volatile, more volatile or less volatile. If beta
is greater than 1 the stock is said to be riskier than market. If beta is less
than 1, the indication is that stock is less risky in comparison to market. If
beta is zero then the risk is the same as that of the market. Negative beta is
rare.
1.8.10 Sharpe Ratio
Sharpe‟s reward to variability ratio measures the excess return per
unit of total risk as measured by standard deviation. The Sharpe‟s ratios
for different mutual funds, as well as benchmark portfolios, have been
computed by using the following equation:
Sharpe ratio = p- f)/ σ p
p = Observed average fund return
Introductory Background, Research Design and Framework of the Study
33
f = Average risk free return
σ p = Standard deviation of fund returns
If Sharpe ratio is greater than the benchmark comparison, the fund‟s
performance is superior over the market. If the Sharpe ratio is less than
market return, the fund‟s performance is not good as the market.
1.8.11 Treynor Ratio
The Treynor‟s reward to volatility ratio measures the excess return
per unit of market (systematic) risk. We calculate Treynor ratios for the
sample funds by using:
TI = (Rp - Rf)/ βp
TI = Treynor‟s ratio
Rp = Average return on fund p
Rf = Return on risk free asset
βp = Sensitivity of fund return on market return
It measures portfolio risk in terms of beta, which is the weighted
average of individual security beats. The ratio is relevant to investors, for
whom the fund represents only a fraction of their total assets. The higher
the ratio better is the performance.
1.8.12 Jensen Differential Measure
Jensen attempts to construct a measure of absolute performance on a
risk-adjusted basis that a definite standard against which performance of
various funds can be measured. This standard is based on CAPM
measures the portfolio manager‟s predictive ability to achieve higher
return than expected for the given riskiness. The basic model is
Introductory Background, Research Design and Framework of the Study
34
Rpt - Rf = α + β (Rm - Rf) + ei
Where Alpha (α) = the intercept
βp = Systemic risk
Rm = Market return
Rpt = Fund return on time period t
Rf = Return on risk free asset
A positive value of Alpha for a portfolio would indicate that the
portfolio has an average return greater than the benchmark return
indicating the superior performance. Alternatively, a negative value of
alpha would indicate that the fund has a return less than the benchmark.
1.8.13 Sharpe Differential Return Measure
Sharpe has applied this measure to know the incremental returns
earned by the mutual fund manager for the given level of risk. The Sharpe
differential return is computed by using the following equation:
Rpt - Rft = α + β [Rmt - Rft ] + Σpt
Rpt = Return for the portfolio
Rft = Risk – free return
Rmt = Return on the market portfolio
Σpt = Random error term, and α and β are parameters of the model
The Sharpe measure is based on the Capital Market Line (CML).
One of the major characteristics of CML is that only efficient portfolio can
be plotted here. So it is assumed that, a managed portfolio (mutual fund
scheme) is an efficient portfolio. In terms of CML, the risk premium
Introductory Background, Research Design and Framework of the Study
35
expected to be earned by the portfolio is in relation to the total risk of the
portfolio rather than the systematic risk. Thus, the differential return will
be the difference between the actual average return of the fund and its
expected return for the given level of risk. If a portfolio is well diversified,
the two measures (Jensen and Sharpe) should indicate same level of
differential return. If the portfolio is imperfectly diversified, the Sharpe
differential return will be smaller. The differential return will be the
difference between the actual average return of the mutual fund scheme
and its expected return for the given level of risk. Sharpe measure
therefore takes into consideration not only the manager‟s stock selection
ability but also his ability to provide diversification. A comparison of
Sharpe‟s differential returns and Jensen‟s alpha reveals the impact of
selectivity and diversification on the fund returns.
1.8.14 Fama‟s Components of Investment Performance
The performance of the funds is also examined in terms of Fama‟s
Components of Investment Performance Measure. In terms of Fama‟s
framework, portfolio return constitutes the following four components: (a)
Risk-free return, (b) compensation for systematic risk, (c) compensation for
diversification and (d)net selectivity. The different components have been
worked out using the following:
Risk – free return: Given
Compensation for systematic risk: [β (Rm – Rf) ],
Compensation for diversification: [Rm – Rf] [σ p/ σ m - β],
Net Selectivity: [Rp – Rf] – [σ p/ σ m ] [Rm – Rf]
Introductory Background, Research Design and Framework of the Study
36
The rationale for using this measure is that, the difference between
return on an active bet and return on a passive bet, which is obtained from
the security market line, may arise due to selectivity skills of fund
managers. This difference is analogous to Jensen‟s alpha. Fama developed
a methodology that helps us to decompose selectivity skills into
diversification return and net selectivity. The former is nothing but a
compensation for diversifiable risk to which the active bet is exposed,
while the latter reflects the true stock selection ability of the fund
managers. A positive net selectivity indicates superior performance for a
fund. However, in case of well diversified funds, both the net selectivity
and selectivity are not likely to be significantly different from each other.
1.9 Limitations of the Study
1.9.1Data limitations
All the sources, from where the data of the present study has been
extracted do not provide the complete data, often data available is only for
the recent two or three years, not enough for analysis. A few private
corporate bodies are providing data but getting those data is also very
difficult and often they charge exorbitantly in their coverage.
1.9.2 Sampling Errors
The study is mainly based on secondary sources of the primary
surveys conducted by AMFI and SEBI therefore error of primary surveys
bound to be occurred.
1.9.3 Impact of Time
The study on impact of policy measures on the growth and
development of AMFI can not be seen in a short span of time where the
reforms are an ongoing process.
Introductory Background, Research Design and Framework of the Study
37
1.9.4 Frequent Changes
The world is very fast and changes are happening frequently due to
the globalization and liberalization. The researcher may not be able to
consider all the changes and therefore there will be a gap of time span for
further studies in future. However, the researcher is of strong opinion, that
the result of the study in no way would be affected.
1.10 Expected Contribution of the Study
The study is an empirical work based on primary and secondary
sources of information. The study would merely not be for the fulfilment
of the requirement of the academic degree but also it is a part of my social
commitment to bring out the facts and realities of the positive policy
packages of liberalization for the promotion of mutual funds industry in
India and its influence on Indian economy as a whole. The present study
also makes an attempt to suggest for further reforms for enhancement
mutual funds industry in India. It also suggests measures for the
diversification of portfolio and optimising return on investment.
1.11 Conclusion
This chapter has dealt with the comprehensive review of literature,
research gap, scope and importance of the study. The chapter also takes
into consideration the hypotheses and statistical tools for analysis and
interpretations. Limitations of the study have also been mentioned. The
succeeding chapter would deals with conceptual review of mutual funds.

Introductory Background, Research Design and Framework of the Study
38
References
1. Rao, M.P. (1998).Working of Mutual Fund Organisations in India. New
Delhi: Kanishka Publications.
2. Sethi,G.(2006). Governance of Mutual Funds and the Institution of
Trustee. Economic and Political Weekly, 41(15), 1413-1416.
3. Kelly, et al. (2009).A Case Study of Ethics and Mutual Funds
Mismanagement at Putnam. Ethics and Behaviour, 19(1), 25-35.
4. Das, et al.(2008). Mutual Fund vs. Life Insurance: Behavioural Analysis
of Retail Investors. International Journal of Business and Management3
(10), 89-103.
5. Tripathy, N.P.(2007). Mutual Funds in India emerging Issues. New Delhi:
Excel books.
6. Agarwal,N.and Gupta, M.(2007,September).Performance of Mutual
funds in India: An Emperical study. ICFAI Journal of Applied Finance,
44-49.
7. Sujatha, B. (2007, September). Real Estate Mutual Funds in India. ICFAI
Reader, 38-42.
8. Rao,H. and Mishra,V.K. (2007, March). MFs Industry in India:
Attaining Maturity. Portfolio organizer, 18-23.
9. Verma,M. (2007). Needs of a Healthy Investment Portfolio with Special
Reference to Hybrid Funds. Portfolio Organizer, February, 8-11.
10. Shukla,K.(2006). Mutual fund purchases by high net worth individuals
in India. Journal of Management Research,6(2) ,32-37.
11. Verma, M. (2006, February).Can AMCs Sustain Their Big Gains.
Portfolio Organizer, 21-22.
12. Mendali,G. (2006,October).Mutual Funds Regulations. Portfolio
Organizer, 42-44.
Introductory Background, Research Design and Framework of the Study
39
13. Mohan,S. (2006).Mutual fund industry in India: development and
growth. Global Business and Economic Review, 8(3-4), 280-289.
14. Sondhi.H.K and Jain,P.K.(2005,July).Financial Management of Private
and Public Equity Mutual Funds in India: An Analysis of Profitability.
ICFAI Journal of Applied Finance, 14-27.
15. Tripathy,N.P. (2004,July).An Empirical Analysis on Performance
Evaluation of Mutual Funds in India: A Study on Equity Linked
Savings Schemes. The ICFAI Journal of Applied Finance, 36-55.
16. Chander,S.and Singh,J. (2004June ).Performance of Mutual Funds in
India An Empirical Evidence. The ICFAI Journal of Applied Finance,45-63.
17. Sengupta,J.K. (2003). Efficiency test for mutual funds Portfolio. Applied
Financial Economics, 13 (12), 849 – 856.
18. Sadhak, H. (2003). Mutual Funds in India Marketing Strategies and
Investment practices. New Delhi: Response Books.
19. Singh,D. (2003) . Mutual Funds in India. New Delhi: Rajat Publication.
20. Borensztein,E.and Gelos,R.G. (2003). A Panic-Prone Pack? The Behavior
of Emerging Market Mutual Funds.IMF staff paper,50(1),43-63.
21. Chander,R.( 2002).Performance Appraisals of Mutual Funds in India. New
Delhi: Excel Books.
22. Gupta, A. (2000). Investment Performance of Indian Mutual Funds: An
Empirical Study. Finance India, 14 (3), 833-866.
23. Singla, S.K. and Singh, P. (2000,October).Evaluation of Performance of
Mutual Funds Using Risk-return Relationship Model. Indian Journal of
Commerce,67-74.
24. Sethu, G. (1999, December).The Mutual Fund Puzzle. A Paper Presented
at UTI-ICM, December 23-24.
25. Graves,W. (1998).The Geography of Mutual Fund Assets. The
Professional Geographer. 50(2), 243-255.

Introductory Background, Research Design and Framework of the Study
40
26. Gupta, O. P. and Sehgal, S. (1998).Investment Performance of Mutual
Funds: The Indian Experience. A Paper Presented at UTI-ICM, December
23-24.
27. Ramachandran, G. (1998).Pitfalls in Portfolio Performance Measures
and their Implications to Mutual Fund Industry. Indian Capital Markets:
Theories and Evidence, 234-274.
28. Murthi,et al. (1997),Efficiency of Mutual Funds and Portfolio
Peformance Measurement: A Non-parametric Approach . European
Journal of Operational Research, 98(2),408-418.
29. Sehgal, S. (1997) An Empirical Testing of Three-parameter Capital
Asset Pricing Model in India. Finance India, 11(4), 919-940.
30. Thiripalraju, M. and Patil, P. R. (1998). Micro and Macro Forecasting
Abilities of Indian Fund Managers. Indian Capital Markets: Theories and
Empirical Evidence, 205-218.
31. Rao, K.V. and Venkateswarlu, R. (1998). Performance Evaluation of
Mutual Funds” A case study of Unit Trust of India. Indian Capital
Market: Theories and Empirical Evidence, 219-233.
32. Madhusoodanan, T.P. (1997).Risk and Return: A New Look at the
Indian Stock Market. Finance India, 11( 2), 285-304.
33. Chordia, T. (1996).The Structure of Mutual Fund Charges. Journal of
Financial Economic, 1, 3- 39.
34. Lockwood, L. J.(1996).Macroeconomic Forces and Mutual Fund Betas.
Financial Review, 4, 747-763.
35. Panigrahi, M. S.(1996).Mutual Funds: Growth, Performance and
Prospects. Economic and Political Weelky, 31(12), 765-775.
36. Bekaert,G. and Urais,M.S. (1996).Diversification, Integration and
Emerging Market Closed-End Funds. The Journal of Finance, 51(3),835-
869.
37. Tripathy, N. P. (1996).Innovative Growth Oriented Mutual Funds:
Innovative in Asian Management. Delhi: Delta Publishing House.
Introductory Background, Research Design and Framework of the Study
41
38. Yavad, R.A. and Mishra, B. (1996).Performance Evaluation of Mutual
Funds : An Empirical Analysis. MDI Management Journal, 9 (2),117-125.
39. Mohinder, N. K., and M. J. (1995). Performance of Growth Oriented
Mutual Funds: An Evaluation. The ICFAI Journal of Applied Finance, 1(1),
1-14.
40. Sarkar, J. and Majumdar, S(1994). Performance Evaluation of Mutual
Funds in India. NMIS Management Review,6(2), 64-78.
41. Shah, A. and Thomas, S. (1994). Performance in Evaluation of
Professional Portfolio Management in India. A Paper Prepared at CMIE,
10 April.
42. Bhosle, M. and Umesh, A. (1994, August).Risk-Return Analysis of
Mutual Fund Growth Scheme. Indian Management, 24-30.
43. Shukla, R. and Singh, S. (1994). Are CFA Charter- holders better equity
fund Managers. Financial Analyst Journal, 2, 68-74.
44. Ansari, M.N.A.(1993). Mutual Funds in India: Emerging Trends.
Chartered Accountants, 2, 88-93.
45. Gangadhar, V.(1993). The Changing Pattern of Mutual Funds in India.
Management Account, 12, 924-928.
46. Angel, M. (1992).Role of Self-Regulatory Organisation in Mutual Fund
Industry in India. Charted Financial Analysts, 5, 11-15.
47. Sarkar, A.K.(1992). Should we invest in Mutual Funds. Management
Accountant, 12,738-739.
48. Sarkar, A.K.(1992).Performance Evaluation of Mutual Funds.
Management Accountant, 9, 691-693
49. Barua. , et al. (1991). Master shares: A Bonanza for Large Investors.
Vikalpa, 16(1), 29-34.
50. Guy, J.R.F.(1978). The Performance of the British Investment Trust
Industry. The Journal of Finance, 30(2), 443-455.

Introductory Background, Research Design and Framework of the Study
42
51. Kon, J.S. and Jen C.F.(1979). The Investment Performance of Mutual
Funds and Empirical Investigation of Timing selectivity and Market
Efficiency. Journal of Business, 52(2), 263-289.
52. Norman, E.M.(1977).Risk, The Pricing of Capital Assets and the
evaluation of Investment portfolios: A comment. Journal of Business,
50(3), 371-384.
53. Klenkosky, R.C. (1977). How Consistently Do Managers Manage.
Journal of Portfolio Management, 3, 11-15.
54. Mc Donald, J.C.(1974).Objectives and Performance of Mutual Funds,
1960-67. Journal of Financial and Quantitative Analysis, 9,311-333
55. Jensen, M.C.(1968). The Performance of Mutual Funds in the period
1945-64. Journal of Finance, 23( 2), 389-416.
56. Sharpe, W.F. (1966). Mutual Fund Performance. Journal of Business,
39(1),119-138.