Embed Size (px)
Citation preview

Bus Rapid Transit System, Ahmedabad GIDB, GoG
1.1. Background
1.2. Aim & Objectives
1.3. Study Area Delineation
1.4. Data Base
1.5. Primary Surveys
Ch
apte
r 1: I
ntro
duct
ion

Bus Rapid Transit System, Ahmedabad GIDB, GoG
AMC & AUDA 1-1 CEPT University
1. INTRODUCTION
1.1 Background
Transportation is the backbone to the development of urban areas. It enables functioning of urban areas efficiently by providing access and mobility. Passenger transport has an overriding influence on the functioning of the city. With growth, the mobility needs increases. People’s personal choices and freedom get expressed in increased ownership and use of personalized vehicles. The public agencies operating public transport systems often fail to restructure service types to meet with the changing demand pattern. As a result public transport becomes financially less viable, speeds reduce, congestion levels increase and the transportation becomes a source of environmental problem. According to a study (World Bank, 1996), 70% of the world’s urban population breathes unsafe air. It is also estimated that more than one billion people live in cities with unhealthy levels of suspended particulate matter. Every year millions of people die or suffer serious health effects from air pollution. As per a WHO study (2000), an estimated 3 million people die each year because of air pollution; this figure represents about 5% of the total 55 million deaths that occur annually in the world. Vehicles are major sources of urban air pollution and greenhouse gas emissions. There are economic consequences as well. As per a recent study of the World Bank1, the costs to society due to air pollution in large cities of India, a part of which is direct productivity loss, was found to be nearly as high as one-tenth of the income generated in these cities from all economic activities.
The trends appear similar in most third world cities. The city of Ahmedabad, largest among all cities of Gujarat state, accommodating about 5 million people, has a registered vehicular strength of 1.4 Million. The rate of growth of vehicles has been about 9 to 10% per annum. Public transport situation has deteriorated rapidly over the past decade. The end result is visible in terms of increasing congestion on the city streets and the worsening of air quality.
Recognizing these problems areas, the State and the City governments have initiated a series of measures to improve urban transport situation in Ahmedabad. The significant efforts of the recent past are:
1. Integrated Public Transit System project by GIDB (1998-2002),
2. Sub-urban Rail System by AUDA & GIDB (2004),
3. Metro Rail Transit System by GIDB (2004),
4. Introduction of CNG buses by AMC (2005), and
5. Comprehensive Road Improvement Plans by AMC and AUDA (2004-5).
6. Bus Rapid Transit System (BRTS) initiated by GIDB with AMC and AUDA. (2005).
1 Kseniya Lvovsky, World Bank, Economic Costs of Air Pollution with special reference to India, World Bank

Bus Rapid Transit System, Ahmedabad GIDB, GoG
AMC & AUDA 1-2 CEPT University
The present initiative to develop BRTS is in recognition of the fact that no single mode will completely serve the mobility needs of the city, and the bus system, both in its basic form and rapid transit form, makes it a critical and major component in an integrated transit system of any mega city.
These efforts receive further fillip due to the fact that the state government has declared year 2005 as an Urban Development Year and concerted efforts are being made to improve the condition of urban areas.
1.2 Aim and Objectives
The aim of this ongoing effort is to prepare a BRTS project development report for Ahmedabad. The detailed terms of reference have been annexed to this report. (Annexure-1: TOR).
This submission titled ‘Corridor Identification and BRTS Concept design Report’ attempts to:
- Present an overview of socio-economic and physical conditions of the city, - Present an assessment of the existing transportation system in the city, - Identify and analyze corridors as potential BRTS corridors, and - Phase-out implementation of identified corridors, and - Recommend a corridor for development in phase-1. - A conceptual design of the system has also been attempted.
It has been suggested that subsequent work is expected to carry the design process to Detailed Project Report level. TOR is being revised accordingly.
1.3 Study Area Delineation
A series of studies have addressed the issues related to transport sector in Ahmedabad. The study initiated by GIDB ‘Integrated Public Transit System for Ahmedabad’ in the year 2000 carried out extensive filed survey and suggested a framework. The study carried out by LB associates also collated secondary information.
The study area having approximately 3000 sq.Kms has been initially divided in to major sub-regions such as Walled City, AMC east, AMC west, AUDA, GUDA and other villages. These sub-regions have been further divided into 427 traffic analysis zones (TAZ) based on the ward boundaries, census zones, village boundaries, district boundaries of the study area including major highways, railway lines, natural watercourses, land use and population density. For the purpose of better consistency and detailed analysis smaller zone sizes have been considered as detailed below. However the study will focus on contiguously developed areas around Ahmedabad.
As indicated above, the following four major areas were considered for zoning system. Those are:
• Zones within AMC limits • Zones outside AMC but within AUDA

Bus Rapid Transit System, Ahmedabad GIDB, GoG
AMC & AUDA 1-3 CEPT University
• Zones outside AUDA but within IPTS study area • External Zones
Zone System within AMC limits
Depending upon the type of land use and other guidelines the total area of AMC was delineated into 196 traffic analysis zones (TAZs).
Suburban and Rural Zones
AUDA has identified 150 villages in the revised Development Plan (August 1997) within the study area and these villages were grouped into 4 sectors (growth centers). These growth centers are Kalol, Sanand, Dehgam and Mehmedabad. These sectors had been identified and taken as 145 traffic analysis zones. Gandhinagar is not part of AUDA and hence LB study divided Gandhinagar urban portion into four TAZs.
External Zones
Entire Gujarat State and Rest of India, connected by National highways (NH8 & NH8A) and State highways have been divided into twelve external zones.
Overall zones of the study area are as under:
Sl. No Area No. of Zones 1 AMC (Urbanized) 196 2 Gandhinagar 4 3 Suburban (East & West) Areas 61 4 Rural Zones/ AUDA 74 5 Four Growth Centers 10 6 Gandhinagar Rural 24 7 Remainder of IPTS Study 58 8 External Zones 12 Total 439
The detailed of the Zone System has been presented in Table.1. below
Table 1-1: Study Area Zone System
Sub Area TAZS Walled City 1-34 AMC (Outside Walled City) 35-196 Peripheral Area West (contiguous) 197,270,277-78, 287-89, 291-97, 299- 316, 320-22
Peripheral Area East (contiguous) 199-204,223 - 24, 226-230,234, 237-41,243, 256-57,262, 270-71, 273
Gandhinagar GNA 341-344 Rest of Gandhinagar 339,340,345 -347,349-55 360-61,363, 408-416 Kalol (M) / Saiz (VP) 329-331-332 Mehmedabad 250,251 Dehgam 211,212

Bus Rapid Transit System, Ahmedabad GIDB, GoG
AMC & AUDA 1-4 CEPT University
Sub Area TAZS Sanand 283-286
Rest of AUDA (Rural)
198,205-10, 213-222, 225, 231-33,235, 236, 242, 244-249, 252-255, 258-261, 263-269, 272, 274-276,279-282, 290, 298, 317-319, 323-328,330, 333-338,373
Remainder of IPTS Study Area 348,356-59, 362,364-372, 374-407, 417-427
External Zones 427-439
Map 1-1: Zoning Map
Source: GIDB/LB (2000) ‘Socio-Economic & Land use Studies

Bus Rapid Transit System, Ahmedabad GIDB, GoG
AMC & AUDA 1-5 CEPT University
The details of the zones names with their numbers have been annexed to this report.
(Annexure 2 - List of Zone numbers with their names).
1.4 Data Base
The study is envisaged to base its recommendations mainly on available data from various reports. Few critical surveys have also been envisaged. Details of these have been summarized below.
1.4.1 Earlier Studies
GIDB initiated studies:
1. IPTS Study undertaken by LB Associates (2000)
2. Ahmedabad Metro and Regional Rail System study by DMRC and RITES (2004-5)
AMC /AMTS Studies:
3. Ahmedabad Traffic Management Study (1997)
4. Strategic Plan for Public Transport System in Ahmedabad (1992) by CEPT
5. Traffic Management Plan for Ahmedabad (2003) by CEPT
6. Ahmedabad Municipal Transport Service – Structure and Strategies (1996) CIRT
7. Ahmedabad City Development Strategy (2003) by CEPT
8. Ahmedabad Urban Transport Study (1995) by RITES
9. Walled City Revitalization Plan (1999) by EPC
AUDA Studies:
10. Development Plan - 2011
11. Metro - Techno-Economic Feasibility Survey (1985) by RITES
12. Sub-urban Rail Study (2004)
CEPT Studies:
13. Bus way Transit for Ahmedabad (1995)
14. CNG Plan for Public Transport System in Ahmedabad (1994)
15. Rationalization of Ahmedabad Municipal Transport Routes (1995)
16. Accident Information System: A case of Ahmedabad (1998)
17. Privatization of Public Transport: Can we innovate? (2000)
18. Planning for Bicycle Traffic: A case of Ahmedabad (2000)
19. Privatization of Public Transport System in Ahmedabad (2003)

Bus Rapid Transit System, Ahmedabad GIDB, GoG
AMC & AUDA 1-6 CEPT University
Report also draws lessons from publications of GTZ2, the World Bank, Transport Research Board, Transport Research Laboratory, Institute for Transport Development & Policy, and CUTR, Florida.
1.5 Primary Surveys
The year 2000 was when public transport supply was the highest in the history of AMTS high with the organization having a record number of buses (942 buses) serving 7.5 lakh passengers as a daily average. It would be safe to expect that such a level expectation of patronage is achievable in 2007. Hence the analysis in this report extensively uses LB data collected in the year 2000 for the purposes of assessment of corridors. Wherever necessary, updating has been done to reflect current situation.
In addition the following primary surveys have been envisaged as part of this effort. The status of each of these has been presented below. In addition, certain additional surveys will also be undertaken to prepare a Detailed Project Report.
Table 1-2: Details of Surveys Sl. No Survey Details Purpose Current Stage
1. Corridor Rapid Inventory - Visual Survey
To assess potential of road as BRTS Corridor Identification of corridors
Complete
2. Home Interview Survey within influence zone of priority corridor Total 1000 households selected as per earlier LB Study format
To Elicit travel pattern and inputs to estimation of potential transit demand Update LB Survey results
Completed Preliminary findings presented
3. Traffic Volume Survey On potential BRTS Corridor
Traffic Intensity & Mix of Vehicles
Partly Complete
4. Turning Movement Survey Important Junctions of Priority Corridor
Traffic Movement pattern to decide junction design aspects
Junctions identified/DPR stage
5. Journey Speed Survey Estimation of speeds with & without BRTS Economic Assessment
Planned
6. Topographic Survey (Sample sections) Detailed design for estimation of block costs
Complete
7. Parking Survey (Priority Corridor) Parking Demand estimation Planned 8. Land Use Survey on potential corridor To Assess potential Land Use
development Complete
9. Engineering Investigations Detailed Design and Specifications of the Project
DPR stage
10. Topographic Survey for entire corridor To assess feeder network plan
DPR stage
2 GTZ – Deutsche Gesellschaft fur Technische Zusammenarbeit GmbH – A German Overseas technical assistance agency

Bus Rapid Transit System, Ahmedabad GIDB, GoG
2.1. Introduction
2.2. The City
2.3. Location and Climate
2.4. Demographic Trends
2.5. Land use
2.6. Traffic Generating Activities
2.7. Employment Distribution
2.8. Summary
Ch
apte
r 2 T
HE C
ITY A
ND IT
S GR
OWTH

Bus Rapid Transit System, Ahmedabad GIDB, GoG
AMC & AUDA 2-1 CEPT University
2. THE CITY AND ITS GROWTH
2.1 Introduction
Demand for transportation is a derived demand. Population characteristics such as size, concentration, income, vehicle distribution, economy in terms of location of employment, education and entertainment activities etc., determine travel demand. These aspects have been described in this chapter.
2.2 The City
The city of Ahmedabad was founded in 1411 AD as a walled city on the eastern bank of the river Sabarmati, now the seventh largest metropolis in India and the largest in the state. The urban agglomeration (UA) population has increased from 3.31 Million in 1991 to 4.5 Million in 2001. Ahmedabad is the commercial capital of the state. Known as the textile capital of India, it is also a major industrial and financial city contributing about 14% of the total investments in all stock exchanges in India and 60% of the total productivity of the state3. It lies in the cotton belt of Gujarat, 552 km north of Mumbai and 96 km from the Gulf of Cambay. It has good air, road and rail links with Mumbai and Delhi and an international airport. Historically Ahmedabad has been one of the most important centers of trade and commerce in western India. The city was once famous as the ‘Manchester of India’ on account of its textile industry. It had as many as 66 mills employing a workforce of over one hundred thousand persons. It has three major industrial estates within its municipal limits. Thermal power plant in the city is operated by a private company. It is the home of several scientific and educational institutions of national importance. The city has a great architectural tradition reflected in many exquisite monuments, temples and modern buildings.
2.3 Location and Climate
Ahmedabad City lies between 22o 55’ and 23o 08’ North Latitude and 72o30’ and 72o 42’ East Longitude. The city is devoid of any major physical features except for the river Sabarmati, which is a perennial river cutting the city into two parts: eastern walled city and western Ahmedabad on either side of its banks.
The Ahmedabad-Mumbai Golden Corridor has long been recognized to be an important development axis in western India. The city acts as a terminal, rather than as an intermediate node in this linear influence. It has seven major roadways, one expressway
3 Reena Lazar, Increasing Resources to Local Government in Ahmedabad, India. Local Strategies for Accelerating Sustainability: Case Studies of Local Government Success. ICLEI Study, Canada, May 2002

Bus Rapid Transit System, Ahmedabad GIDB, GoG
AMC & AUDA 2-2 CEPT University
and five rail networks. A new corridor between Ahmedabad and Pune has recently emerged, connecting the city to four other metropolitan cities of Vadodara, Surat, Mumbai and Pune. All these factors have resulted in the axial growth of the region.
Ahmedabad has a tropical monsoon climate which is hot and dry, except in the rainy season. Summer days are very hot with mean maximum temperature of 41.30C while, nights are pleasant with mean minimum temperature of 26.30C. The mean maximum and minimum temperature in winter are 300C and 15.40C respectively. The average annual rainfall of the area is 782mm, although there is a considerable variation from year to year. It occurs generally during the months of June to September. The average relative humidity is 60% which ranges from 80% to 90% during rainy season.
2.4 Demographic Trends
The Greater Ahmedabad Urban agglomeration covering an area of about 4200 sq. Km is an amalgam of:
- an area of 190 square kilometers under the jurisdiction of Ahmedabad Municipal Corporation (AMC)4, and
- 150 villages in the periphery of the city under the jurisdiction of Ahmedabad Urban Development Authority (AUDA)5,
- ** Municipalities in the periphery of the city under the jurisdiction of Ahmedabad Urban Development Authority (AUDA),
- Gandhinagar and the surrounding villages,
- Chatral, Bhopal and other surrounding villages adjoining AUDA limits
4 The city is governed by Ahmedabad Municipal Corporation (AMC), established in July 1950. It is a huge organization with over 40,000 employees. It provides a number of urban services such as water supply, roads construction, sanitation, medical services, primary education, Solid Waste Management, city transport, public health centres, etc. The Ahmedabad Municipal Transport Service (AMTS) is the body of AMC. AMTS is expected to perform on self-financing basis. 5 The Ahmedabad Urban Development Authority (AUDA) was constituted under the Gujarat Town Planning and Urban Development Act, 1976 in 1978 to regulate and monitor the development in the periphery of the corporation limits and the adjoining 300 villages and 9 municipalities. The major functions of the authority is to undertake the preparation of the development plan, town planning schemes, regulate the development and charge the development charges in the area of its jurisdiction.

Bus Rapid Transit System, Ahmedabad GIDB, GoG
AMC & AUDA 2-3 CEPT University
Map 2-1: Greater Ahmedabad
Source: GIDB/LB (2000) , Socio-Economic & Land use Studies
The area within the Ahmedabad Municipal Corporation limits consists of:
- the traditional city center within the fort walls with relatively high-density development, large concentration of commercial activities and narrow streets,
Bus Rapid Transit System, Ahmedabad GIDB, GoG
AMC & AUDA 2-4 CEPT University
- the eastern sector accommodating large and small industries and low income residential areas, and
- a well planned western sector with wide roads accommodating major institutions and high-income residential areas
The population in the AMC limits increased to 35.15 lakh in 2001 from 28.77 lakh in 1991. The population of AUDA area in 1991 was 38.75 lakh. The Ahmedabad Urban Agglomeration (AUA) housed 23.25 % of the State’s urban population in 1991, which has gone up to about 25% in 2001. Compared to metropolises in India Ahmedabad has a lesser degree of primacy and urban population is spread evenly across other metropolitan and class I cities in the State.
The AMC area is spread over 190.84 sq km, the AUA area is about 350 sq km and AUDA area is 1330.08 sq km. Spatial distribution of this population within the city over the decades shows that up to 1981 most of the new population added to the city was concentrated within the old AMC limits itself, especially in the eastern part. Expansion of the peripheral areas began in the 1980s and has continued. Earlier only the eastern parts especially the eastern periphery registered faster growth rate, but since the 1980s even the western periphery has grown rapidly.
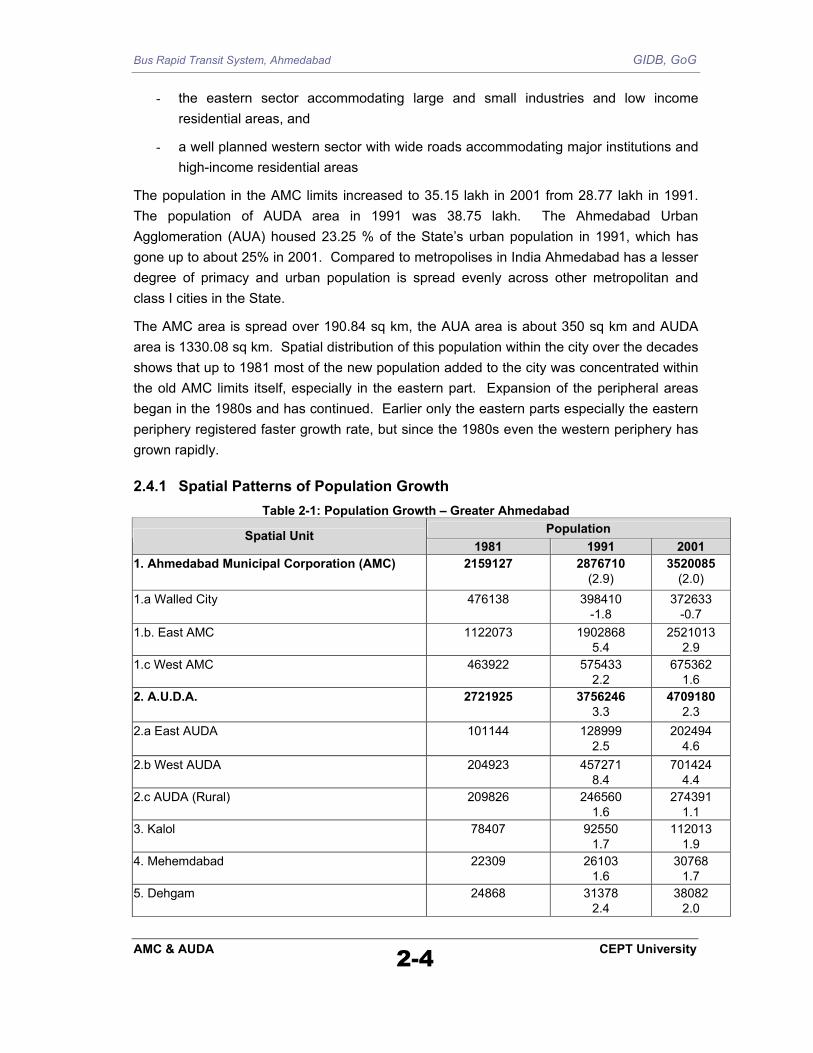
2.4.1 Spatial Patterns of Population Growth Table 2-1: Population Growth – Greater Ahmedabad
Population Spatial Unit 1981 1991 2001
1. Ahmedabad Municipal Corporation (AMC) 2159127
2876710 (2.9)
3520085 (2.0)
1.a Walled City
476138
398410 -1.8
372633 -0.7
1.b. East AMC
1122073
1902868 5.4
2521013 2.9
1.c West AMC
463922
575433 2.2
675362 1.6
2. A.U.D.A.
2721925
3756246 3.3
4709180 2.3
2.a East AUDA
101144
128999 2.5
202494 4.6
2.b West AUDA
204923
457271 8.4
701424 4.4
2.c AUDA (Rural)
209826
246560 1.6
274391 1.1
3. Kalol
78407
92550 1.7
112013 1.9
4. Mehemdabad
22309
26103 1.6
30768 1.7
5. Dehgam 24868 31378 2.4
38082 2.0

Bus Rapid Transit System, Ahmedabad GIDB, GoG
AMC & AUDA 2-5 CEPT University
Population Spatial Unit 1981 1991 2001
6. Sanand
22465
25674 1.3
32417 2.4
7. Other areas outside AUDA
264555
309871 1.6
334531 0.8
8. Gandhinagar
199353
280234 3.5
373663 2.9
8.a. Gandhinagar (GNA)
62443
123359 7.0
195926 4.7
8.b. Rest of Gandhinagar
136910
156875 1.4
177737 1.3
GREATER AHMEDABAD 3185833 4346351 3.2
5417374 2.2
Source: Respective Census Documents
Note: Figures in parenthesis indicate annual compound growth rate
The greater Ahmedabad area has grown at a moderate rate. Growth rates have declined from 3.2 and 2.2 percent compounded per annum during the past two decades. However, the rates vary across different spatial units. The population within the AMC limits appears to approach stabilization level. The areas adjoining AMC, falling within AUDA limits have shown rapid growth. Gandhinagar is also experiencing relatively high rate of growth.
As stated above the population growth in the peripheral areas is more rapid than the areas within the city limits. This is partly due to the saturation of population within the city area and the consequent large-scale housing development in the peripheral areas. The contrasting spatial patterns observed in the eastern and western areas of AMC have extended into the peripheral areas in the same manner. The western part is experiencing more rapid growth than the eastern part. Rapid growth in the form of ribbon development along the Sarkhej - Gandhinagar highway is being witnessed during the 1990’s. These trends are likely to intensify further in the coming decades. It is also a note worthy feature that the spatial expansion of Ahmedabad is largely contiguous and relatively compact.

Bus Rapid Transit System, Ahmedabad GIDB, GoG
AMC & AUDA 2-6 CEPT University
Map 2-2 Ahmedabad Growth pattern
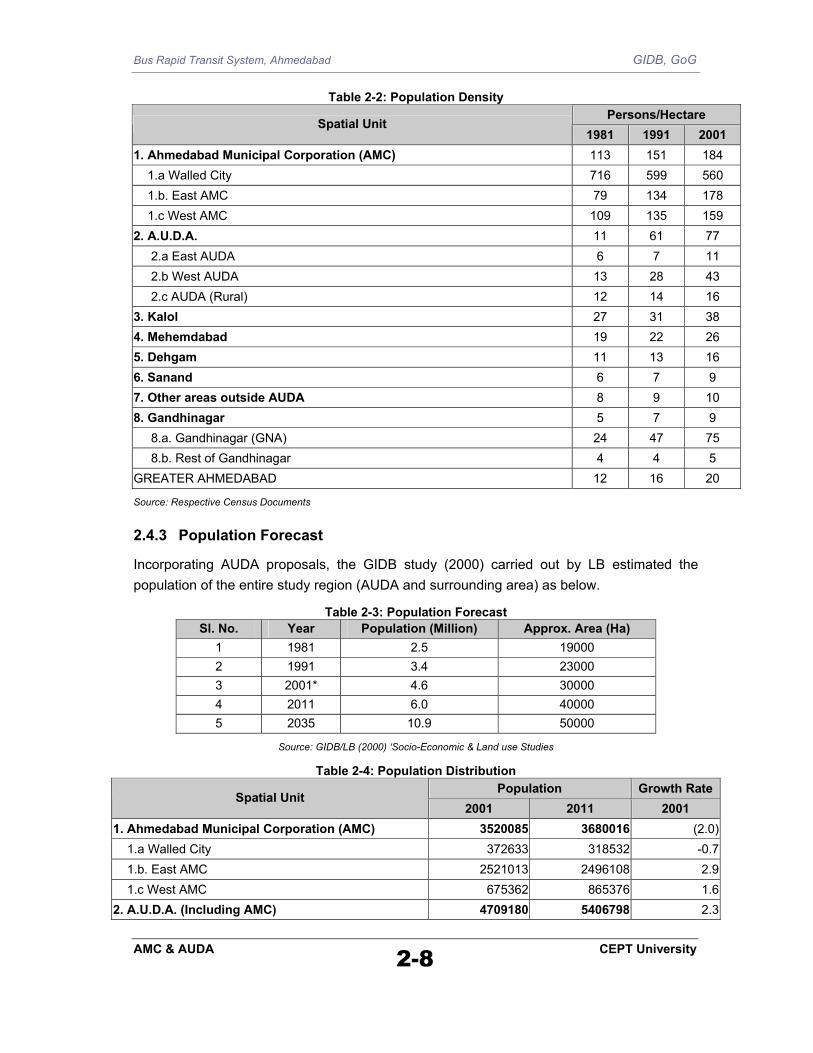
2.4.2 Population Density:
The density pattern presented below indicates the spatial expansion largely felt as limited to contiguous areas around AMC. The walled city is one of the most densely populated areas in the study area, and it has reached levels of saturation. The new outgrowths have been in the western parts of the city in the AUDA jurisdiction with people preferring to stay in the peripheral areas where they could avail of better infrastructure facilities. The zones along the 132’ Ring Road and Naroda - Narol Highway have seen a higher level of physical development in the last few years. From the map below it may be seen that most of the eastern part and few parts in the southwest and northwest have higher densities. Bus routes along these are likely to receive greater patronage.

Bus Rapid Transit System, Ahmedabad GIDB, GoG
AMC & AUDA 2-7 CEPT University
Map 2-3: Population Density
Derived from GIDB/LB (2000) , Socio-Economic & Land use Studies
Bus Rapid Transit System, Ahmedabad GIDB, GoG
AMC & AUDA 2-8 CEPT University
Table 2-2: Population Density Persons/Hectare
Spatial Unit 1981 1991 2001
1. Ahmedabad Municipal Corporation (AMC) 113 151 184 1.a Walled City 716 599 560 1.b. East AMC 79 134 178 1.c West AMC 109 135 159 2. A.U.D.A. 11 61 77 2.a East AUDA 6 7 11 2.b West AUDA 13 28 43 2.c AUDA (Rural) 12 14 16 3. Kalol 27 31 38 4. Mehemdabad 19 22 26 5. Dehgam 11 13 16 6. Sanand 6 7 9 7. Other areas outside AUDA 8 9 10 8. Gandhinagar 5 7 9 8.a. Gandhinagar (GNA) 24 47 75 8.b. Rest of Gandhinagar 4 4 5 GREATER AHMEDABAD 12 16 20
Source: Respective Census Documents
2.4.3 Population Forecast
Incorporating AUDA proposals, the GIDB study (2000) carried out by LB estimated the population of the entire study region (AUDA and surrounding area) as below.
Table 2-3: Population Forecast Sl. No. Year Population (Million) Approx. Area (Ha)
1 1981 2.5 19000 2 1991 3.4 23000 3 2001* 4.6 30000 4 2011 6.0 40000 5 2035 10.9 50000
Source: GIDB/LB (2000) ‘Socio-Economic & Land use Studies
Table 2-4: Population Distribution Population Growth Rate
Spatial Unit 2001 2011 2001
1. Ahmedabad Municipal Corporation (AMC) 3520085 3680016 (2.0) 1.a Walled City 372633 318532 -0.7 1.b. East AMC 2521013 2496108 2.9 1.c West AMC 675362 865376 1.62. A.U.D.A. (Including AMC) 4709180 5406798 2.3

Bus Rapid Transit System, Ahmedabad GIDB, GoG
AMC & AUDA 2-9 CEPT University
AUDA Land Use (1997)
Wasteland17%
Built-up50%
Waterbodies12%
Brick kiln / Quarries
4%Industries
9%
Open Land2% Recreation
1%
Transportation Node2%
Public/ Semi Public/
Institutions3%
Fig 2-1 Land Use of AUDA area (1997)
Population Growth Rate Spatial Unit
2001 2011 2001 2.a East AUDA 202494 10454 4.6 2.b West AUDA 701424 1416395 4.4 2.c AUDA (Rural) 274391 299933 1.13. Kalol 112013 124652 1.94. Mehemdabad 30768 41639 1.75. Dehgam 38082 48086 2.06. Sanand 32417 36017 2.47. Other areas outside AUDA 334531 412977 0.88. Gandhinagar 373663 490506 2.9 8.a. Gandhinagar (GNA) 195926 267238 4.7 8.b. Rest of Gandhinagar 177737 223268 1.3GREATER AHMEDABAD 5417374 6560675 2.2
Source: Based on AUDA, GIDB/LB report
2.5 Land Use
Spatial arrangements of activities determine the travel pattern in the city. This section briefly describes the land use pattern of the city.
The Ahmedabad Urban Development Authority is responsible for land use planning within its jurisdictional limits. As stated above, the area under AUDA may be seen as various subunits depending on the administrative jurisdictional limits and extent of development. Of this area delineated as Ahmedabad Urban Complex consisting of AMC, outgrowth adjoining AMC and area likely to develop in the ten years has been designated as Ahmedabad Urban Complex. It is this area, which is the focus in this study.
2.5.1 Land-use in AUDA area
Of the total AUDA area of 1294.65 sq. km, 50 percent is built up area. Water bodies and wastelands cover 12 percent and 17 percent of area respectively. Industries cover 9 percent of the area. As per the State Government Policy, no major industrial development within 24 kms of AMC limit is permitted in AUDA area. Considering existing development conditions certain area for industrial use is designated for

Bus Rapid Transit System, Ahmedabad GIDB, GoG
AMC & AUDA 2-10 CEPT University
light industry as well as for general industry, along with
existing industries at Vatwa, Naroda and Odhav (all lying within AMC), which forms nearly 10.38 percent.
Map 2-4 : AUDA Land-use map
Source: GIDB/LB (2000) , Socio-Economic & Land use Studies
Bus Rapid Transit System, Ahmedabad GIDB, GoG
AMC & AUDA 2-11 CEPT University
Existing Land Use: AMC (1997)
Commercial2%
Hospitals 1%
Education2%
Roads7%AMC Plots
2%
Waterbodies4%
Village Site / Gamtal
5%Open / Vacant
Land24%
Railway land2%
Industrial15%
Residential 36%
Proposed Land Use: AMC (2011)
Agri. /Openspace / 9%
Walled City & Gamtal
3%
Education2%
Special dev . area10%
Waterbodies (including riv ers)
5%
Spl Indl4%
General Indl11%
Residential44%
Roads and railways
11%
Commercial1%
Fig 2-1 Existing land use of AMC area (1997) Fig 2-2 Proposed Land Use of AMC area(2011)
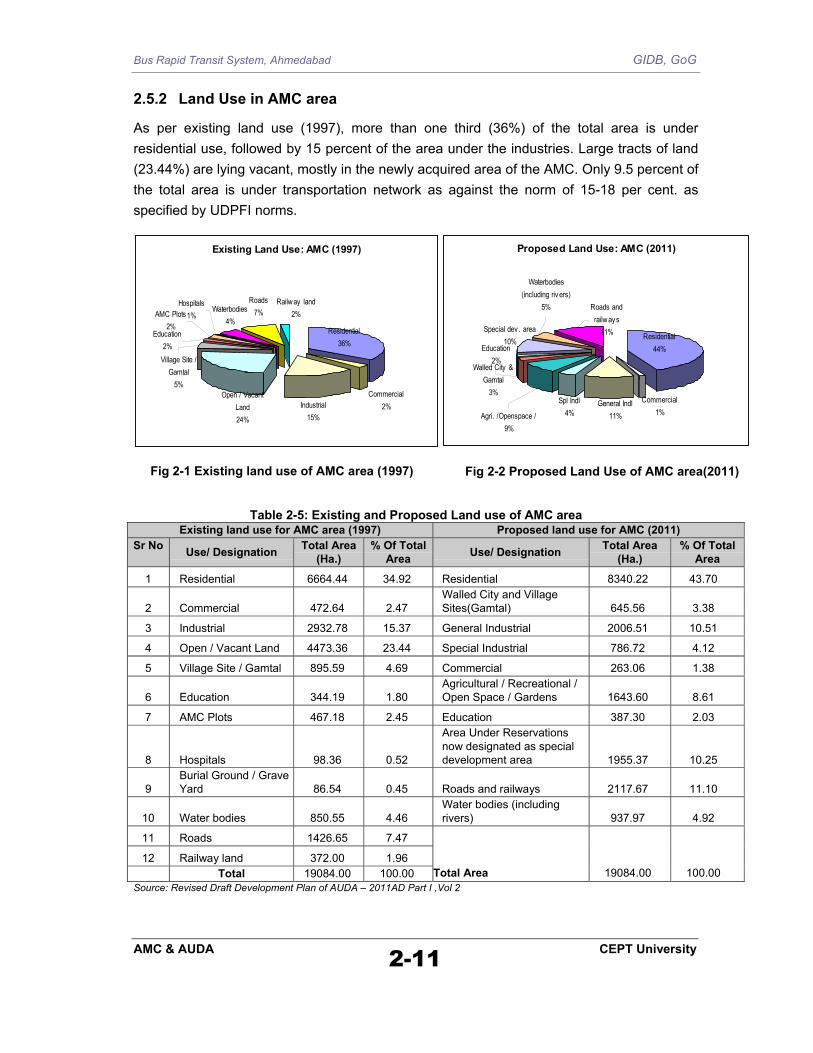
2.5.2 Land Use in AMC area
As per existing land use (1997), more than one third (36%) of the total area is under residential use, followed by 15 percent of the area under the industries. Large tracts of land (23.44%) are lying vacant, mostly in the newly acquired area of the AMC. Only 9.5 percent of the total area is under transportation network as against the norm of 15-18 per cent. as specified by UDPFI norms.
Table 2-5: Existing and Proposed Land use of AMC area Existing land use for AMC area (1997) Proposed land use for AMC (2011)
Sr No Use/ Designation Total Area (Ha.)
% Of Total Area Use/ Designation Total Area
(Ha.) % Of Total
Area
1 Residential 6664.44 34.92 Residential 8340.22 43.70
2 Commercial 472.64 2.47 Walled City and Village Sites(Gamtal) 645.56 3.38
3 Industrial 2932.78 15.37 General Industrial 2006.51 10.51
4 Open / Vacant Land 4473.36 23.44 Special Industrial 786.72 4.12
5 Village Site / Gamtal 895.59 4.69 Commercial 263.06 1.38
6 Education 344.19 1.80 Agricultural / Recreational / Open Space / Gardens 1643.60 8.61
7 AMC Plots 467.18 2.45 Education 387.30 2.03
8 Hospitals 98.36 0.52
Area Under Reservations now designated as special development area 1955.37 10.25
9 Burial Ground / Grave Yard 86.54 0.45 Roads and railways 2117.67 11.10
10 Water bodies 850.55 4.46 Water bodies (including rivers) 937.97 4.92
11 Roads 1426.65 7.47
12 Railway land 372.00 1.96 Total 19084.00 100.00 Total Area 19084.00 100.00
Source: Revised Draft Development Plan of AUDA – 2011AD Part I ,Vol 2
Bus Rapid Transit System, Ahmedabad GIDB, GoG
AMC & AUDA 2-12 CEPT University
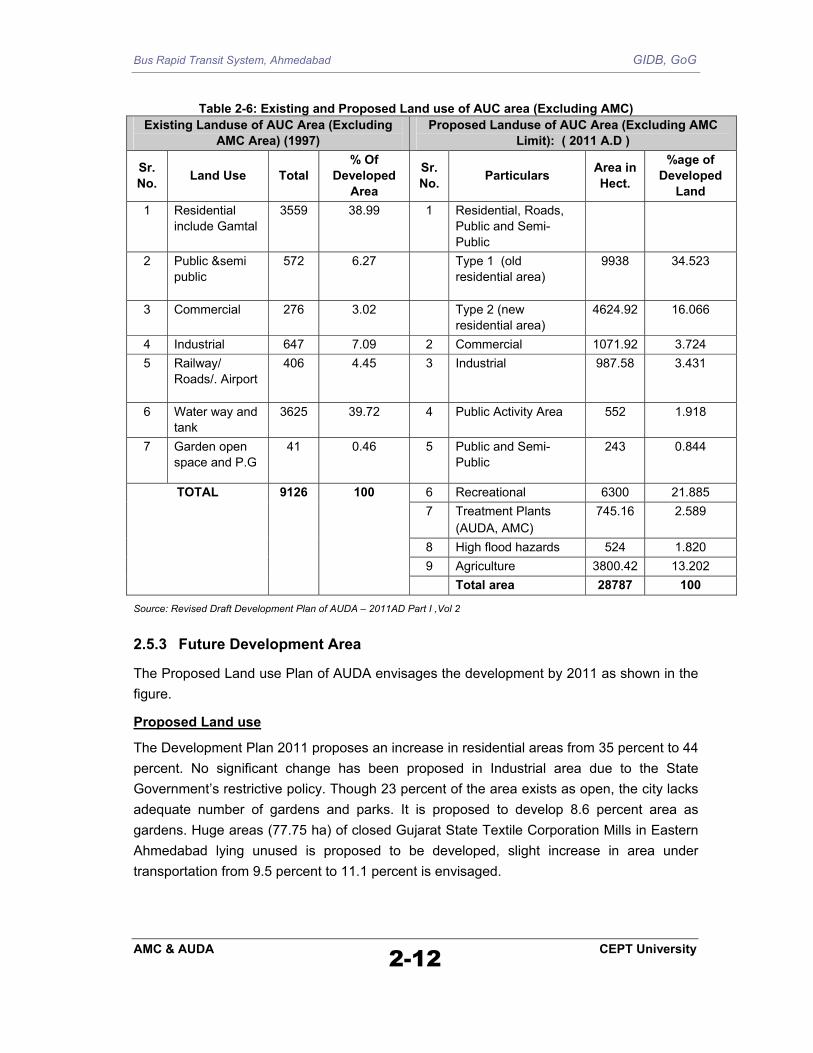
Table 2-6: Existing and Proposed Land use of AUC area (Excluding AMC)
Existing Landuse of AUC Area (Excluding AMC Area) (1997)
Proposed Landuse of AUC Area (Excluding AMC Limit): ( 2011 A.D )
Sr. No. Land Use Total
% Of Developed
Area
Sr. No. Particulars Area in
Hect.
%age of Developed
Land 1 Residential
include Gamtal 3559 38.99 1 Residential, Roads,
Public and Semi-Public
2 Public &semi public
572 6.27 Type 1 (old residential area)
9938 34.523
3 Commercial 276 3.02 Type 2 (new residential area)
4624.92 16.066
4 Industrial 647 7.09 2 Commercial 1071.92 3.724 5 Railway/
Roads/. Airport 406 4.45 3 Industrial 987.58 3.431
6 Water way and tank
3625 39.72 4 Public Activity Area 552 1.918
7 Garden open space and P.G
41 0.46 5 Public and Semi-Public
243 0.844
6 Recreational 6300 21.885 7 Treatment Plants
(AUDA, AMC) 745.16 2.589
8 High flood hazards 524 1.820 9 Agriculture 3800.42 13.202
TOTAL 9126 100
Total area 28787 100
Source: Revised Draft Development Plan of AUDA – 2011AD Part I ,Vol 2
2.5.3 Future Development Area
The Proposed Land use Plan of AUDA envisages the development by 2011 as shown in the figure.
Proposed Land use
The Development Plan 2011 proposes an increase in residential areas from 35 percent to 44 percent. No significant change has been proposed in Industrial area due to the State Government’s restrictive policy. Though 23 percent of the area exists as open, the city lacks adequate number of gardens and parks. It is proposed to develop 8.6 percent area as gardens. Huge areas (77.75 ha) of closed Gujarat State Textile Corporation Mills in Eastern Ahmedabad lying unused is proposed to be developed, slight increase in area under transportation from 9.5 percent to 11.1 percent is envisaged.
Bus Rapid Transit System, Ahmedabad GIDB, GoG
AMC & AUDA 2-13 CEPT University
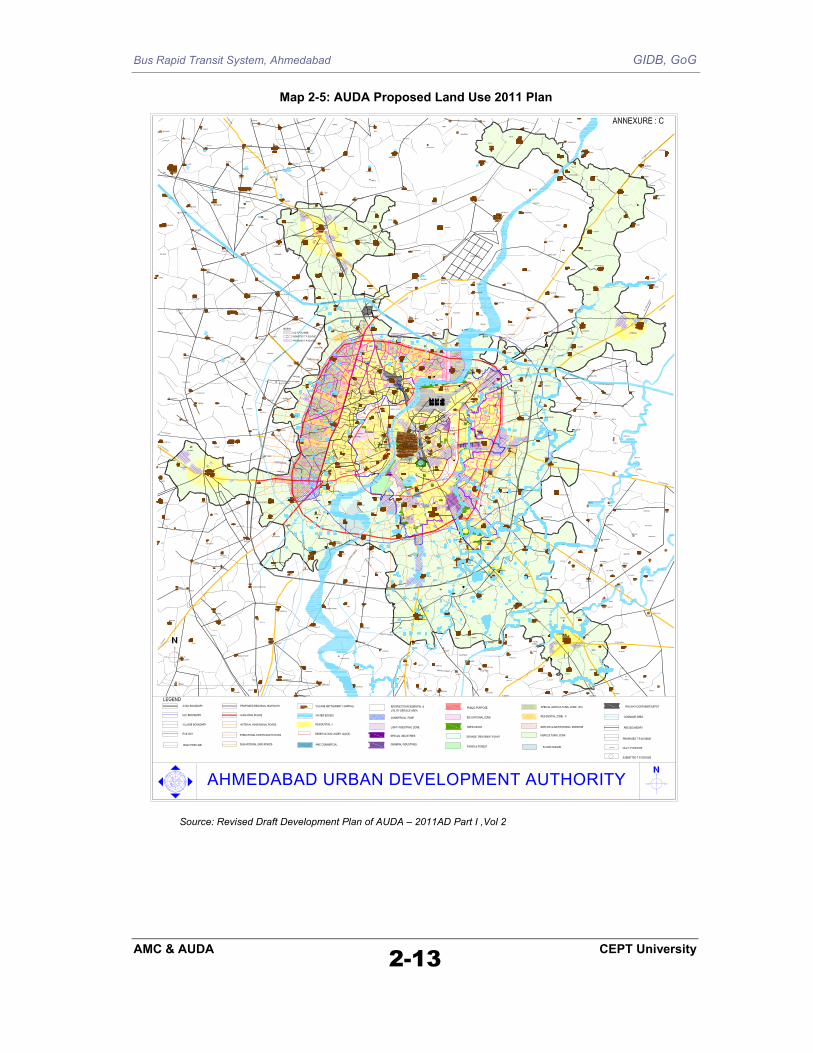
Map 2-5: AUDA Proposed Land Use 2011 Plan
AHMEDABAD URBAN DEVELOPMENT AUTHORITY
19
25
18
27
2022
26
2423
VASANT NAGER
M.G.VASHAHAT
60.0
0MT
SA
RK
HE
J -G
AN
DH
INAG
AR H
IGH
WAY
1
3 2
f t
R I
N G
R
O A
D
1 3
2 f
t
R I
N G
A S H R
A M
R O
A D
A S
H
R
A
M
R
O
A
D
60.0
0 MT
SA
RK
HE
J-G
AN
DH
INAG
AR H
IGH
WAY
32
3534
33
50
3739
38
42
41
8483
43
62
63
36
64
65
66
67
45
233 7372
234 76
21
46
77 78
44
60
232
55
59
71
40
53
58
75
69
74
215
5152
91 9089
8885
86
204
211
5470
68
228
230
229
226
225 57224
221
22256
227
220
219
218217
212 213
214216
210
208 209
207 206
205
87
202 203
201
SCIENCE CITY&SCIENCE PARK
235
236
82
79
238
239
24080
81
4748
237
109124
122123
110121101
125126 102
103 120111
119
104 112
105113
106114
107
108
115
117
118
28
29
31
30223
231
116
LAKEKANKARIA
LAKECHANDOLA
1 3 2 f t R I N G R O A D
NATIONAL HIGH WAY
NATIO
NAL HIG
H WAY
1 3
2 f
t
R I
N G
NA
TIO
NA
L H
IGH
WAY
NA
TIO
NA
L H
IGH
WA
Y
NATIONAL HIGH WAY
NATIO
NAL H IG
H WAY
TO D
EHEGAM
R O A D
R O
A D
61
Source: Revised Draft Development Plan of AUDA – 2011AD Part I ,Vol 2

Bus Rapid Transit System, Ahmedabad GIDB, GoG
AMC & AUDA 2-14 CEPT University
Map 2-6: Land Use Map of Ahmedabad Municipal Corporation
Source: City Development Strategies, Ahmedabad, CEPT University,2001
2.6 Traffic Generating Activities
The nature and location of economic activities in relation to houses determine the travel demand in a city. Nature and location of these within AMC have been presented below.
The city of Ahmedabad has had great importance in the economy of Gujarat owing to the large concentration of economic activities and their high growth rates and productivity. Ahmedabad accounts for 7% of the state’s total population and around 20% of its urban
Bus Rapid Transit System, Ahmedabad GIDB, GoG
AMC & AUDA 2-15 CEPT University
population. In 1995, with 7 percent of the total population, Ahmedabad contributed to 17 percent of the state income (4).
Ahmedabad has a strong industrial base of traditional manufacturing, especially textiles, plastics, machinery and basic metals and alloys. Ahmedabad city accounts for 21.5% of factories in the state employing 18% of workers (2000). In 1981, before the textile crisis, Ahmedabad city used to account for 19.3% of factories and 27.7% of workers in the state. During the 18th and early 19th centuries, Ahmedabad was one of the most important centers of trade and commerce in western India. The economy of Ahmedabad has passed through various phases of transformation over the years. A gradual shift has been noticed from manufacturing oriented industries to services oriented economic scenario. The tertiary sector is gaining, in terms of share which includes business and commerce, transportation and communication, and other services.
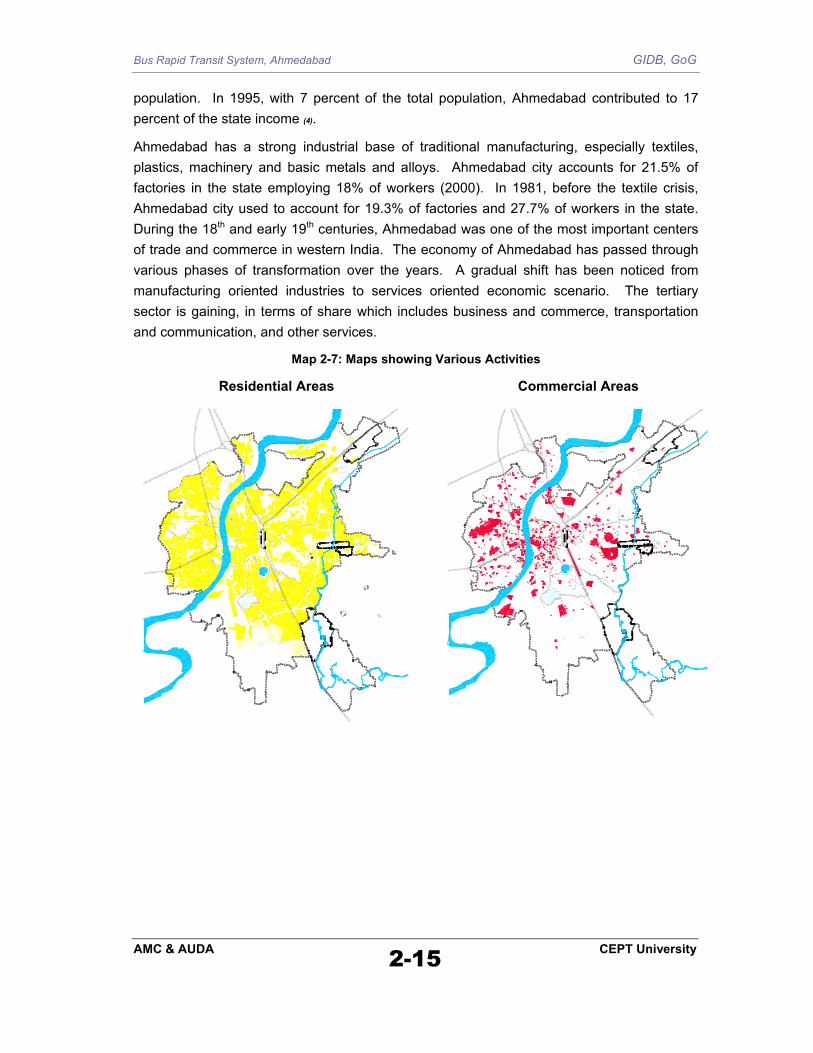
Map 2-7: Maps showing Various Activities
Residential Areas
Commercial Areas
Bus Rapid Transit System, Ahmedabad GIDB, GoG
AMC & AUDA 2-16 CEPT University
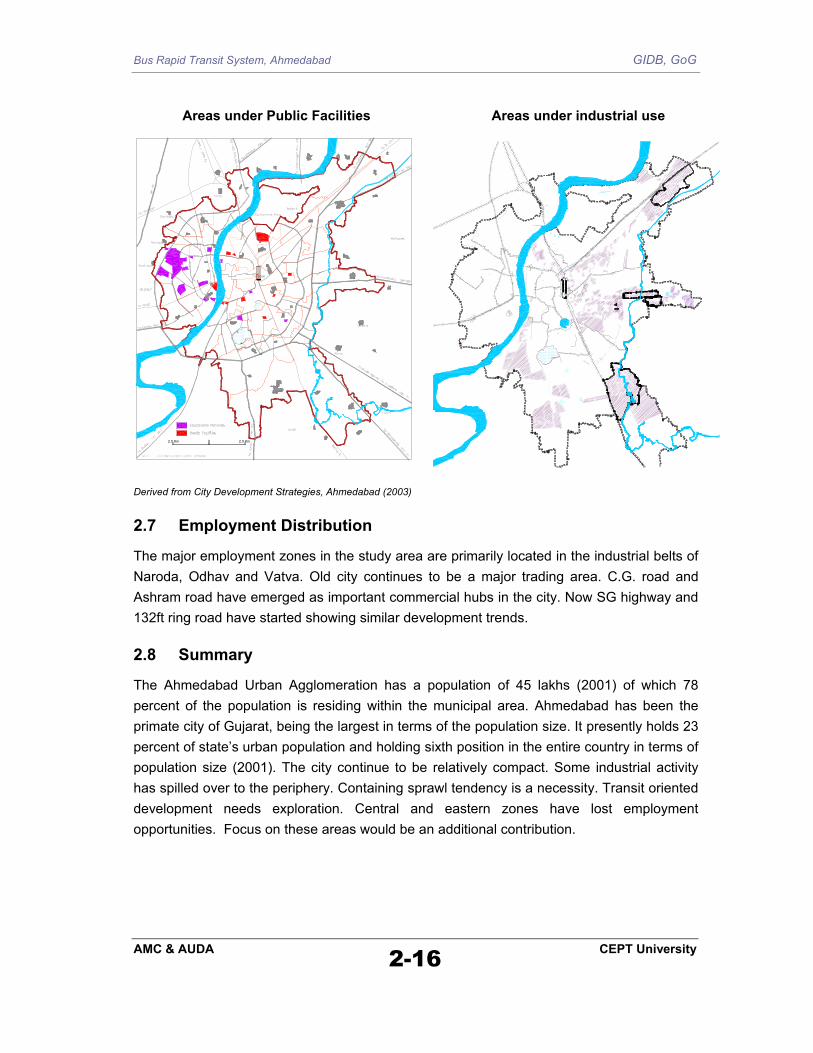
Areas under Public Facilities
02.5 Km 2.5 Km
Areas under industrial use
Derived from City Development Strategies, Ahmedabad (2003)
2.7 Employment Distribution
The major employment zones in the study area are primarily located in the industrial belts of Naroda, Odhav and Vatva. Old city continues to be a major trading area. C.G. road and Ashram road have emerged as important commercial hubs in the city. Now SG highway and 132ft ring road have started showing similar development trends.
2.8 Summary
The Ahmedabad Urban Agglomeration has a population of 45 lakhs (2001) of which 78 percent of the population is residing within the municipal area. Ahmedabad has been the primate city of Gujarat, being the largest in terms of the population size. It presently holds 23 percent of state’s urban population and holding sixth position in the entire country in terms of population size (2001). The city continue to be relatively compact. Some industrial activity has spilled over to the periphery. Containing sprawl tendency is a necessity. Transit oriented development needs exploration. Central and eastern zones have lost employment opportunities. Focus on these areas would be an additional contribution.

Bus Rapid Transit System, Ahmedabad GIDB, GoG
AMC & AUDA 2-17 CEPT University
Map 2-8: Job Distribution in Study area

Bus Rapid Transit System, Ahmedabad GIDB, GoG
3.1. System Components
3.2. Vehicles
3.3. Facilities
3.4. Public Transport
3.5. System Performance
Ch
apte
r 3 E
xist
ing
Tran
spor
tatio
n Sy
stem
- V
ehic
les,
Faci
litie
s & P
erfo
rman
ce

Bus Rapid Transit System, Ahmedabad GIDB, GoG
AMC & AUDA 3-1 CEPT University
3. EXISTING TRANSPORTATION SYSTEM - VEHICLES,
FACILITIES & PERFORMANCE
3.1 System Components
Ahmedabad city is well connected by an expressway, several national and state highways, the broad-gauge and meter-gauge railways and an international airport. The city transportation system is predominantly dependent on roadway systems. Vehicular growth has been rapid. The network is experiencing heavy congestion. Consequently air pollution has become severe.
The information below provides an overview of the existing transportation system in terms of road network, vehicular growth and composition, performance of the system and its impact. A detailed analysis of public transportation system performance has been presented separately in the next chapter.
3.2 Vehicles
At the time of formation of the state of Gujarat, in 1961, there were only 43000 vehicles registered. This figure has risen to over 70 Lakh vehicles by the year 2004, recording a rise by 160 folds in four decades. In the recent past, annual additions have been high and increasing. During the years 2001 to 2002, the increase in the number of vehicles registered was 4.3 lakh. This has risen to 5.1 and 5.7 during 2002 to 03, and 2003 to 04 respectively.
Ahmedabad district has a total number of 14.9 Lakh motor vehicles registered in the year 2004. Of this 73% were two wheelers. The district, which accommodates 11% of the state population accounts for about 21% of the vehicles registered in the State6. This high density and rapid growth of vehicles have worsened the transport situation to a significant extent.
The graph shows the composition of
6 Ahmedabad Agglomeration accounts for78% of the total district population
3Wheelers5.01%
MUV4.45%
Trucks2.03%
Bus1.64%
LCV1.06%
Cars12.50%
Taxi0.41%
2Wheelers72.91%
Fig 3-1: Figure showing the composition of vehicles in Ahmedabad
Bus Rapid Transit System, Ahmedabad GIDB, GoG
AMC & AUDA 3-2 CEPT University
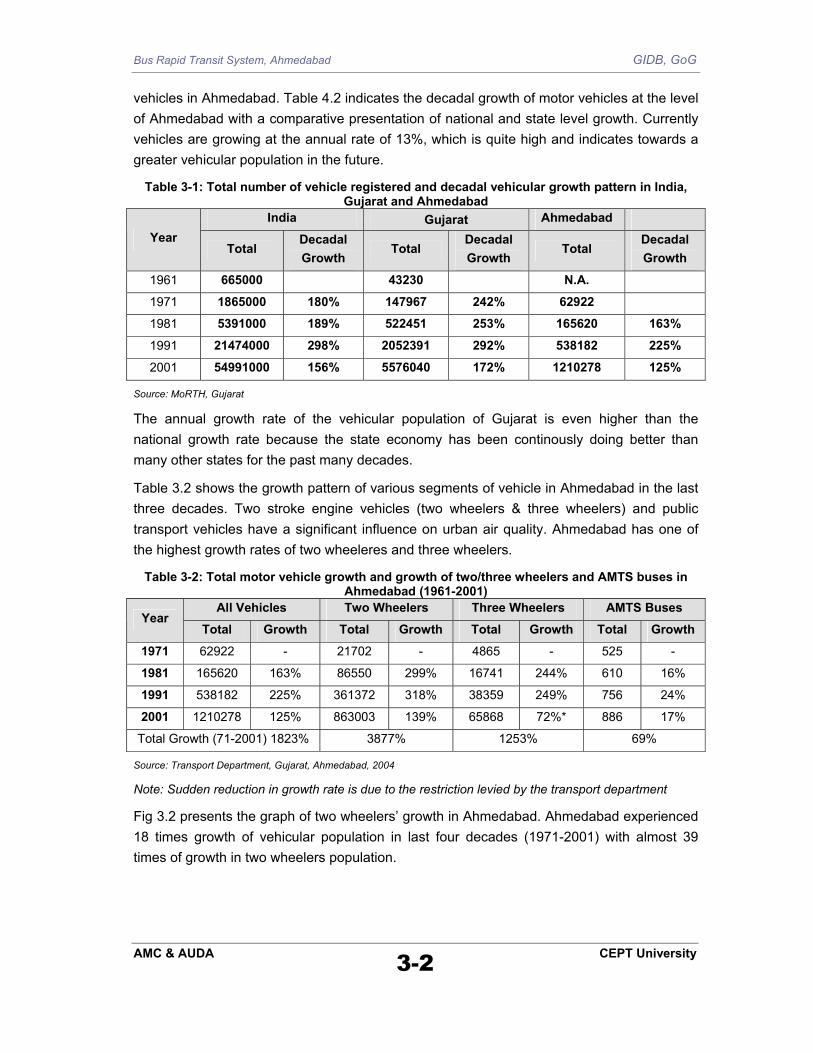
vehicles in Ahmedabad. Table 4.2 indicates the decadal growth of motor vehicles at the level of Ahmedabad with a comparative presentation of national and state level growth. Currently vehicles are growing at the annual rate of 13%, which is quite high and indicates towards a greater vehicular population in the future.
Table 3-1: Total number of vehicle registered and decadal vehicular growth pattern in India, Gujarat and Ahmedabad
India Gujarat Ahmedabad Year
Total Decadal Growth
Total Decadal Growth
Total Decadal Growth
1961 665000 43230 N.A.
1971 1865000 180% 147967 242% 62922
1981 5391000 189% 522451 253% 165620 163%
1991 21474000 298% 2052391 292% 538182 225%
2001 54991000 156% 5576040 172% 1210278 125%
Source: MoRTH, Gujarat
The annual growth rate of the vehicular population of Gujarat is even higher than the national growth rate because the state economy has been continously doing better than many other states for the past many decades.
Table 3.2 shows the growth pattern of various segments of vehicle in Ahmedabad in the last three decades. Two stroke engine vehicles (two wheelers & three wheelers) and public transport vehicles have a significant influence on urban air quality. Ahmedabad has one of the highest growth rates of two wheeleres and three wheelers.
Table 3-2: Total motor vehicle growth and growth of two/three wheelers and AMTS buses in Ahmedabad (1961-2001)
All Vehicles Two Wheelers Three Wheelers AMTS Buses Year
Total Growth Total Growth Total Growth Total Growth
1971 62922 - 21702 - 4865 - 525 -
1981 165620 163% 86550 299% 16741 244% 610 16%
1991 538182 225% 361372 318% 38359 249% 756 24%
2001 1210278 125% 863003 139% 65868 72%* 886 17%
Total Growth (71-2001) 1823% 3877% 1253% 69%
Source: Transport Department, Gujarat, Ahmedabad, 2004
Note: Sudden reduction in growth rate is due to the restriction levied by the transport department
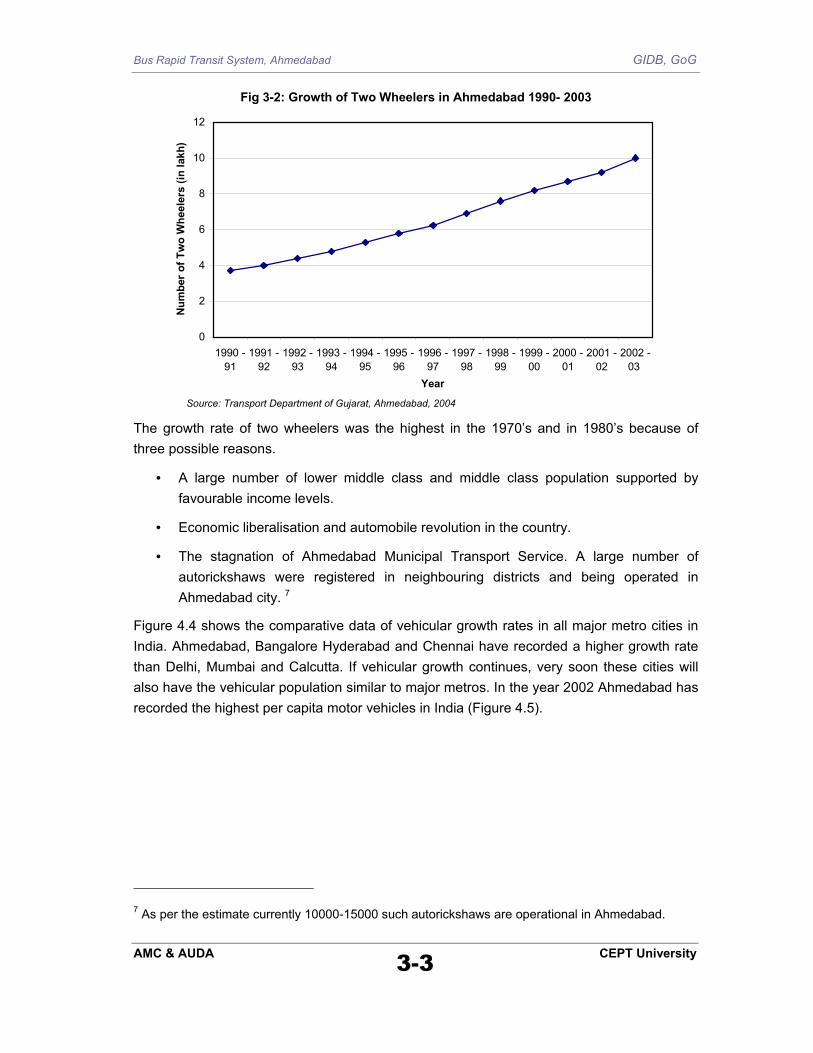
Fig 3.2 presents the graph of two wheelers’ growth in Ahmedabad. Ahmedabad experienced 18 times growth of vehicular population in last four decades (1971-2001) with almost 39 times of growth in two wheelers population.
Bus Rapid Transit System, Ahmedabad GIDB, GoG
AMC & AUDA 3-3 CEPT University
Fig 3-2: Growth of Two Wheelers in Ahmedabad 1990- 2003
0
2
4
6
8
10
12
1990 -91
1991 -92
1992 -93
1993 -94
1994 -95
1995 -96
1996 -97
1997 -98
1998 -99
1999 -00
2000 -01
2001 -02
2002 -03
Year
Num
ber o
f Tw
o W
heel
ers
(in la
kh)
Source: Transport Department of Gujarat, Ahmedabad, 2004
The growth rate of two wheelers was the highest in the 1970’s and in 1980’s because of three possible reasons.
• A large number of lower middle class and middle class population supported by favourable income levels.
• Economic liberalisation and automobile revolution in the country.
• The stagnation of Ahmedabad Municipal Transport Service. A large number of autorickshaws were registered in neighbouring districts and being operated in Ahmedabad city. 7
Figure 4.4 shows the comparative data of vehicular growth rates in all major metro cities in India. Ahmedabad, Bangalore Hyderabad and Chennai have recorded a higher growth rate than Delhi, Mumbai and Calcutta. If vehicular growth continues, very soon these cities will also have the vehicular population similar to major metros. In the year 2002 Ahmedabad has recorded the highest per capita motor vehicles in India (Figure 4.5).
7 As per the estimate currently 10000-15000 such autorickshaws are operational in Ahmedabad.

Bus Rapid Transit System, Ahmedabad GIDB, GoG
AMC & AUDA 3-4 CEPT University
Fig 3-3 : Growth rate of vehicles in major Indian cities (1990-2002)
0
5
10
15
20
Ahmedabad Bangalore Chennai Delhi GreaterMumbai
Hyderabad Kolkota
Cities
Gro
wth
rate
(%)
Source: MoRTH 2003
Fig 3-4 : Vehicle per 1000 Population in Major Cities, 1990 and 2002
0
50
100
150
200
250
300
Ahmedabad Bangalore Chennai Delhi GreaterMumbai
Hyderabad Kolkota
Cities
Num
ber
Veh./1000 popn.(1990) Veh./1000 popn.(2002)
Source: MoRTH 2003
3.3 Facilities
3.3.1 Road Network
The study area roadway system is approximately 3478 Kms. Other than the National Highway Authority, which maintains National Highways and the State Roads and Buildings Department, the two urban local bodies; AMC and AUDA, are responsible for developing, operating and maintaining road infrastructure.

Bus Rapid Transit System, Ahmedabad GIDB, GoG
AMC & AUDA 3-5 CEPT University
Table 3-3: Distribution of Roads by Width (No. of lanes) Road widths in Study Area
No. of Lanes Length % of Total Length 1 Lane 2106 61%
1.5 Lane 522 15% 2 Lane 411 12%
2.5 Lane 12 0% 3 Lane 48 1% 4 Lane 299 9% 6 Lane 46 1% 8 Lane 34 1%
Grand Total 3478 100% Source: Based on LB Study
General Form of the Network:
The street network in Ahmedabad evolved historically may be classified as ring-radial form. There are about 20 well-defined radials; 12 in the west and 8 in the east, Ashram road, running along the river Sabarmati also functions as a north-south radial. As the need to connect these roads to facilitate cross mobility arose, a series of rings / orbital were added to form ring roads. As defined by AUDA, there are at least four complete rings within the AUDA area. Even one ring is not complete as two proposed bridges across river Sabarmati are yet to be built.
The Ahmedabad Municipal Corporation manages a large road network of 1272 km, of which 93% are surfaced roads (Refer Table 3-4). Recent efforts at better management of the road network in the city have resulted in effective widening of the main corridors of the city. It is to be noted that a bye-pass road has been built as an alternative to old NH 8 as the road has become a part of the city road network. The share of area under the roads constitutes only 7.5% of the entire city area as against the desired level of 15-18 per cent8. This translates to an average road width of 12m. The road density is 6.66 per sq.km of area. Once the work on bye-pass is complete, the road (NH-8) section passing through the city is expected to be handed over to AMC. The road network in the central area (walled city of the AMC) is narrow and encroached upon by adjacent activities for parking as well as informal activities.
8 As per Urban Development Plan Formulation and Implementation (UDPFI) Guidelines, Ministry of Urban Affairs and Employment

Bus Rapid Transit System, Ahmedabad GIDB, GoG
AMC & AUDA 3-6 CEPT University
Map 3-1: AUDA DP Proposed Road Network
Source: AUDA Development Plan

Bus Rapid Transit System, Ahmedabad GIDB, GoG
AMC & AUDA 3-7 CEPT University
Table 3-4: Types of Roads in AMC Parameters 1997-98 1998-99 1999-2000 2000-2001
Surfaced roads (km) 1118.9 1149.6 1189.01 1187.1% black topped 90.66 92.25 93.50 93.34Un-surfaced roads (km) 115.3 96.6 84.6 84.64Total length of roads (km) 1234.2 1246.2 1271.7 1271.74Length of roads per sq.km 6.47 6.53 6.66 6.66
Source: AMC Statistical Outline, 2000-2001
Given the overall network based on width, continuity and functional role performed, the following roads may constitute as major roads.
Table 3-5: Road widths of Major Roads Sr.No. Road Name Average Road Width
1 Ashram Road 30.48 2 Gandhi Road 12.19 3 Tilak Road 18.29 4 Astodia Road 19.81 5 Mirzapur Road 15.24 6 Gheekantha Road 12.19 7 Circular road along fort wall
a) Gandhi bridge to Tilak road Junction b) Tilak road Junction to Sardar Bridge
24.38
8 Chandola road 24.38 9 Shyama Prasad Vasavada Road 24.38
10 Rakhial road 18.29 11 Stadium road (To sola village) 18.29 12 Satellite road 60.96 13 Sarkhej road 30.48 14 Circular Road (Sardar bridge to Gandhi bridge via Law Garden) 24.38 15 Circular Road (Usmanpura to Paldi) 36.58 16 Circular Road (New Vadaj to Sarkhej Road NH8) 40.28
Source: Report on Ahmedabad Transportation Study, CRRI.
Bus Rapid Transit System, Ahmedabad GIDB, GoG
AMC & AUDA 3-8 CEPT University
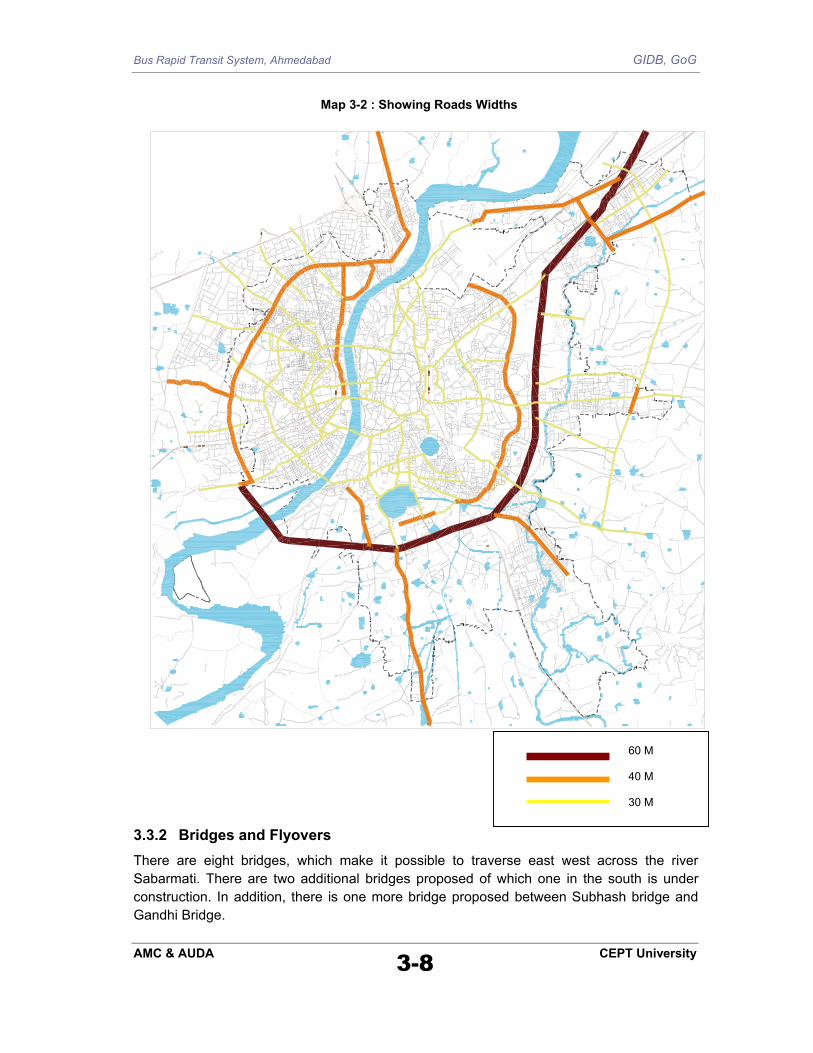
Map 3-2 : Showing Roads Widths
3.3.2 Bridges and Flyovers There are eight bridges, which make it possible to traverse east west across the river Sabarmati. There are two additional bridges proposed of which one in the south is under construction. In addition, there is one more bridge proposed between Subhash bridge and Gandhi Bridge.
60 M 40 M 30 M

Bus Rapid Transit System, Ahmedabad GIDB, GoG
AMC & AUDA 3-9 CEPT University
Map 3-3 Showing all the bridges across River Sabarmati
Table 3-6: Characteristics of Bridges across River Sabarmati Sr. No. Name of Bridge Carriageway Year of
Construction1 Indira Bridge 4-lane - 2 Subhash Bridge 4-lane 1973 3 Gandhi Bridge 4-lane 1943 4 Nehru Bridge 4-lane 1963 5 Vivekanand Bridge 4-lane 1892 6 Sardar Bridge 4-lane 1942
Indira Bridge
Subhash Bridge
Gandhi Bridge
Nehru Bridge
Vivekanand Bridge
Sardar Bridge
Proposed Vasna Pirana Bridge (Under Construction)
Proposed Bridge
Proposed Bridge
Shastri Bridge

Bus Rapid Transit System, Ahmedabad GIDB, GoG
AMC & AUDA 3-10 CEPT University
Sr. No. Name of Bridge Carriageway Year of
Construction7 Proposed (Vasna-Pirana Bridge) - Under Construction
Narsinh bhai Makwana Bridge - -
8 Shastri Bridge 4-lane - 9 Proposed Bridge (Between Subhash Bridge and Indira Bridge) - - 10 Proposed Bridge (Between Gandhi Bridge and Subhash Bridge) - -
Map 3-4: Existing/Proposed Flyovers
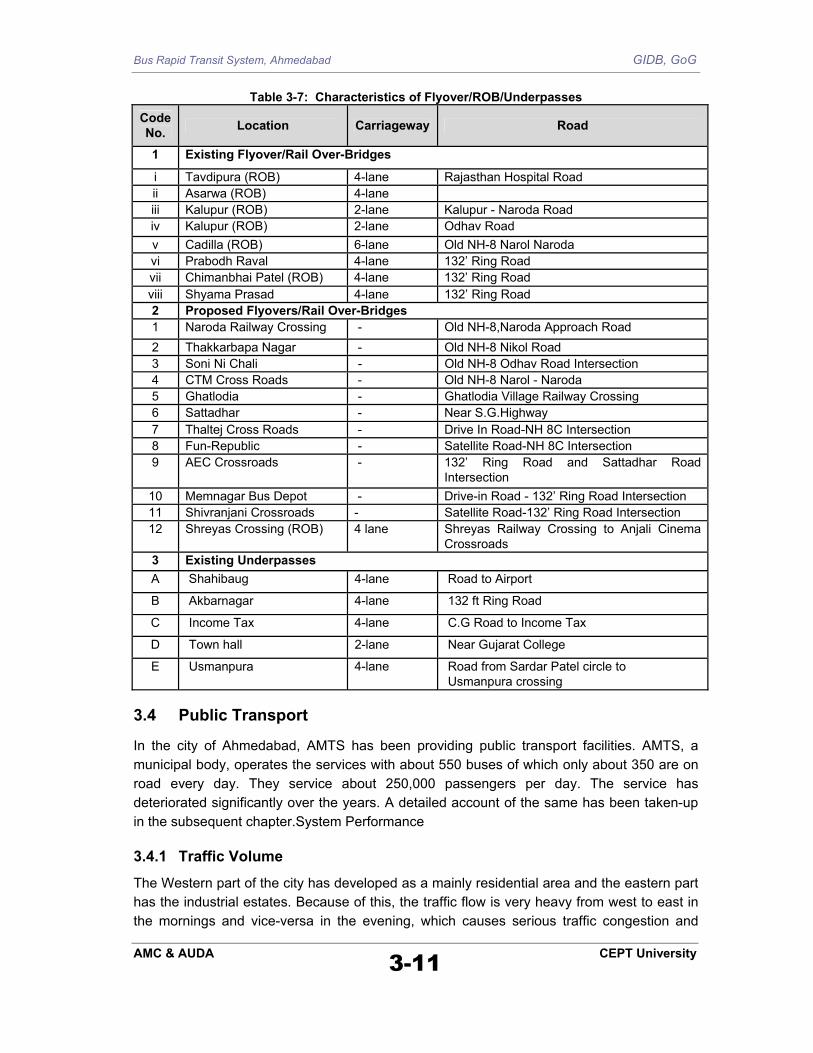
Within the study area, 106 Km long B.G. line and 126 Km long M.G line pass through the network. There are 8 flyovers / rail over-bridges existing in Ahmedabad and 5 under-passes built across railway line. Another 11 flyovers are proposed by AMC and AUDA.
4
v
1
2
3
5 6
7
8
9
11
12
i ii
iii
iv
vi vii
viii
B
A
C
D
E 10
Bus Rapid Transit System, Ahmedabad GIDB, GoG
AMC & AUDA 3-11 CEPT University
Table 3-7: Characteristics of Flyover/ROB/Underpasses Code No. Location Carriageway Road
1 Existing Flyover/Rail Over-Bridges
i Tavdipura (ROB) 4-lane Rajasthan Hospital Road ii Asarwa (ROB) 4-lane iii Kalupur (ROB) 2-lane Kalupur - Naroda Road iv Kalupur (ROB) 2-lane Odhav Road v Cadilla (ROB) 6-lane Old NH-8 Narol Naroda vi Prabodh Raval 4-lane 132’ Ring Road vii Chimanbhai Patel (ROB) 4-lane 132’ Ring Road viii Shyama Prasad 4-lane 132’ Ring Road 2 Proposed Flyovers/Rail Over-Bridges 1 Naroda Railway Crossing - Old NH-8,Naroda Approach Road 2 Thakkarbapa Nagar - Old NH-8 Nikol Road 3 Soni Ni Chali - Old NH-8 Odhav Road Intersection 4 CTM Cross Roads - Old NH-8 Narol - Naroda 5 Ghatlodia - Ghatlodia Village Railway Crossing 6 Sattadhar - Near S.G.Highway 7 Thaltej Cross Roads - Drive In Road-NH 8C Intersection 8 Fun-Republic - Satellite Road-NH 8C Intersection 9 AEC Crossroads - 132’ Ring Road and Sattadhar Road
Intersection 10 Memnagar Bus Depot - Drive-in Road - 132’ Ring Road Intersection 11 Shivranjani Crossroads - Satellite Road-132’ Ring Road Intersection 12 Shreyas Crossing (ROB) 4 lane Shreyas Railway Crossing to Anjali Cinema
Crossroads 3 Existing Underpasses A Shahibaug 4-lane Road to Airport
B Akbarnagar 4-lane 132 ft Ring Road
C Income Tax 4-lane C.G Road to Income Tax
D Town hall 2-lane Near Gujarat College
E Usmanpura 4-lane Road from Sardar Patel circle to Usmanpura crossing
3.4 Public Transport
In the city of Ahmedabad, AMTS has been providing public transport facilities. AMTS, a municipal body, operates the services with about 550 buses of which only about 350 are on road every day. They service about 250,000 passengers per day. The service has deteriorated significantly over the years. A detailed account of the same has been taken-up in the subsequent chapter.System Performance
3.4.1 Traffic Volume
The Western part of the city has developed as a mainly residential area and the eastern part has the industrial estates. Because of this, the traffic flow is very heavy from west to east in the mornings and vice-versa in the evening, which causes serious traffic congestion and

Bus Rapid Transit System, Ahmedabad GIDB, GoG
AMC & AUDA 3-12 CEPT University
frequent traffic jams on the city roads during morning and evening peak periods. Lately, road widening of the major radial roads has been undertaken which has helped ease the traffic flow to some extent. Traffic volumes on major roads has been presented in the map below. As may be observed, volumes far exceed capacities at many places.
Map 3-5: Traffic Volume at different locations in the city
The results of Traffic Volume count survey conducted at eleven locations on the potential corridor as part of this study is presented in Table 3.8.
Derived From: Interim Report on ‘Traffic Management Plan for Ahmedabad’, School of Planning, CEPT University: 2001,
< 3000 PCU3000-6000PCU6000-9000PCU
9000-12000PCU
12000-15000PCU
15000-18000PCU
18000-21000PCU
Traffic Volume (PCUs) (9.30-10.30 a.m. and 5.30-6.30 p.m.)
Bus Rapid Transit System, Ahmedabad GIDB, GoG
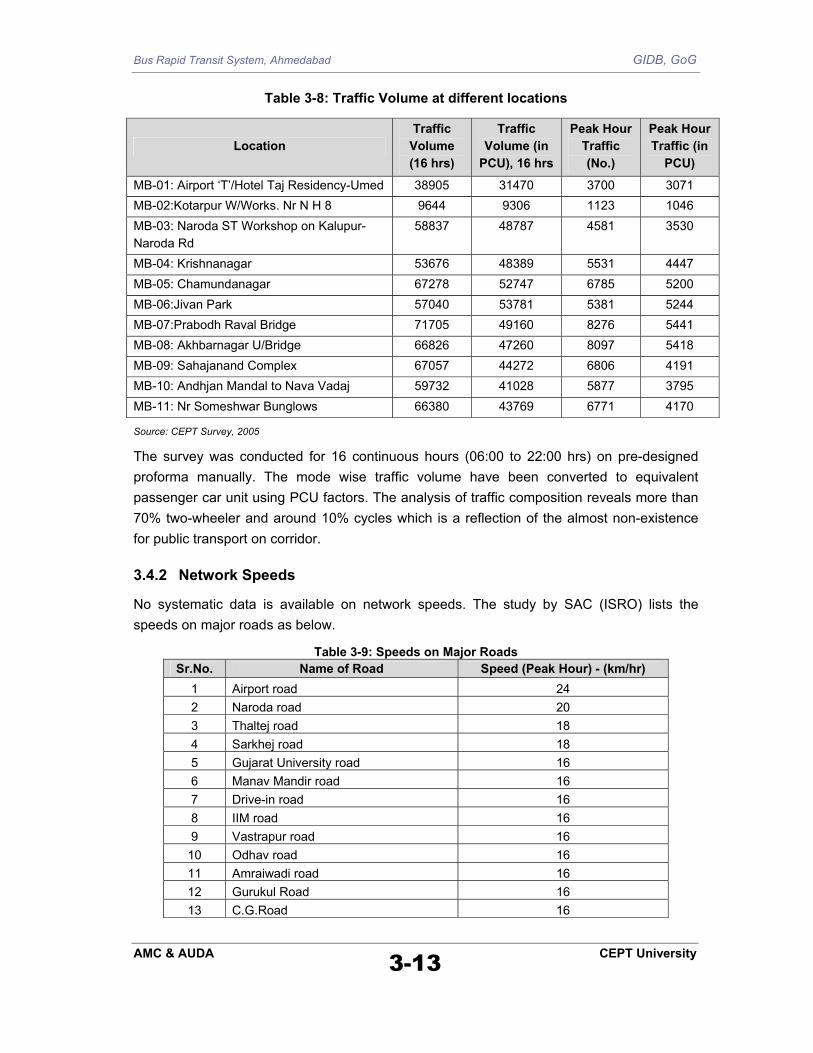
AMC & AUDA 3-13 CEPT University
Table 3-8: Traffic Volume at different locations
Location Traffic
Volume (16 hrs)
Traffic Volume (in
PCU), 16 hrs
Peak Hour Traffic (No.)
Peak Hour Traffic (in
PCU)
MB-01: Airport ‘T’/Hotel Taj Residency-Umed 38905 31470 3700 3071 MB-02:Kotarpur W/Works. Nr N H 8 9644 9306 1123 1046 MB-03: Naroda ST Workshop on Kalupur-Naroda Rd
58837 48787 4581 3530
MB-04: Krishnanagar 53676 48389 5531 4447 MB-05: Chamundanagar 67278 52747 6785 5200 MB-06:Jivan Park 57040 53781 5381 5244 MB-07:Prabodh Raval Bridge 71705 49160 8276 5441 MB-08: Akhbarnagar U/Bridge 66826 47260 8097 5418 MB-09: Sahajanand Complex 67057 44272 6806 4191 MB-10: Andhjan Mandal to Nava Vadaj 59732 41028 5877 3795 MB-11: Nr Someshwar Bunglows 66380 43769 6771 4170
Source: CEPT Survey, 2005
The survey was conducted for 16 continuous hours (06:00 to 22:00 hrs) on pre-designed proforma manually. The mode wise traffic volume have been converted to equivalent passenger car unit using PCU factors. The analysis of traffic composition reveals more than 70% two-wheeler and around 10% cycles which is a reflection of the almost non-existence for public transport on corridor.
3.4.2 Network Speeds
No systematic data is available on network speeds. The study by SAC (ISRO) lists the speeds on major roads as below.
Table 3-9: Speeds on Major Roads Sr.No. Name of Road Speed (Peak Hour) - (km/hr)
1 Airport road 24 2 Naroda road 20 3 Thaltej road 18 4 Sarkhej road 18 5 Gujarat University road 16 6 Manav Mandir road 16 7 Drive-in road 16 8 IIM road 16 9 Vastrapur road 16
10 Odhav road 16 11 Amraiwadi road 16 12 Gurukul Road 16 13 C.G.Road 16

Bus Rapid Transit System, Ahmedabad GIDB, GoG
AMC & AUDA 3-14 CEPT University
Sr.No. Name of Road Speed (Peak Hour) - (km/hr) 14 Satellite road 15 15 Danilimda road 14 16 Ankur road 14 17 Sola road 14 18 Ghatlodia road 14 19 Sola road 14 20 Rakhial road 13 21 Ashram Road 12.5 22 Gomtipur road 12 23 Civil road 12 24 Shah Alam Road 11.5 25 Kalupur 10 26 Gandhi Road 10 27 Relief Road 9.5
Source: SAC, ISRO
3.4.3 Accidents
In Ahmedabad over 2600 cases of road accidents are being reported in the year 2001 alone. About 160 to 200 persons get killed in these accidents. Some reduction in number of accidents has been observed in the recent past.
Table 3-10: Population, Vehicles and Accidents in Ahmedabad City
Year Population (lakhs) Vehicles Accidents Fatal
Accidents
Accident Rate (Per 10,000 Vehicles)
Fatality Rate
1961 12.6 N.A. 643 38 N.A. 5.91 1971 17.6 45,268 866 73 191.31 8.43 1981 23.8 120,514 1676 144 139.07 8.59 1991 29.5 431,783 2,931 192 67.88 6.55 2001 37 1,005,870 2718 162 27.02 5.96
Derived From: Safe Traffic Advocacy Cell, School of Planning, CEPT University,
0
500
1000
1500
2000
2500
3000
3500
1961 1971 1981 1991 2001
Year
Acc
iden
ts
Accidents
Fatal Accidents
Fig 3-5: showing Number of Accidents Year wise

Bus Rapid Transit System, Ahmedabad GIDB, GoG
AMC & AUDA 3-15 CEPT University
Map 3-6: Accident Rate in Ahmedabad
Derived From: Safe Traffic Advocacy Cell, School of Planning, CEPT University,
Critical (> 30)
Very High (25-30)
High (20-25)
Medium (10-20)
Low (5-10)
Very Low (0-5)

Bus Rapid Transit System, Ahmedabad GIDB, GoG
AMC & AUDA 3-16 CEPT University
Critical (3.0-5.0)
Very High (2.0-3.0)
High (1.0-2.0)
Moderate (1.0-1.5)
Low (0.5-1.0)
Very Low (0.5-1.0)
Map 3-7 : Fatality Rate in road accidents in Ahmedabad (Accidents/km)

Bus Rapid Transit System, Ahmedabad GIDB, GoG
AMC & AUDA 3-17 CEPT University
Table 3-11: Accident Rate along major roads of Ahmedabad
Sr.No. Road Stretch Total
Accidents (1995-2002)
Length (km)
Total Accidents/Km (1995-
2002)
% of Total Accidents
Fatal accidents
(2002)
Fatal accidents
/ Km (2002)
1 Vasna to Sarkhej 783 3 261 5.3 14 4.7 2 Narol to Naroda (NH 8) 2365 15.5 153 16.1 40 2.6
3 Ankur to Naranpura Railway Crossing 330 1.5 220 2.2 3 2.0
4 S.T. Geeta Mandir to Shah Alam Tolnaka Chandola 423 2.5 169 2.9 4 1.6
5 Prem Darwaja to Gandhi Bridge 359 2 180 2.4 3 1.5
6 Mirjapur to Vijali Ghar 261 0.75 348 1.8 1 1.3
7 Bhairavnath to Shah Alam Tolnaka Dakshini Society 459 2.5 184 3.1 3 1.2
8 Narol to Vasana 205 7 29 1.4 8 1.1
9 Kalupur to Police Comm. Ward Boundary 435 3.5 124 3.0 4 1.1
10 Commerce College to Thaltej 635 4.5 141 4.3 5 1.1
11 Subhash Bridge to Visat Petrol Pump 458 3 153 3.1 3 1.0
12 Sola to Naranpura Bus Stand 516 4 129 3.5 4 1.0
13 Police Commissione Office to Shahibag Subhashbridge 132 1 132 0.9 1 1.0
14 Juna Vadaj to Chandlodia 273 3.25 84 1.9 3 0.9
15 Shahibag Railway Crossing to Gymkhana Indira Bridge 892 4.5 198 6.1 4 0.9
16 Vasna to Juhapura Bus Stand 144 2.5 58 1.0 2 0.8 17 Parimal Garden to Mithakhali 331 1.5 221 2.3 1 0.7 18 Ambavadi to Jodhpur 529 4 132 3.6 2 0.5
19 Incometax to Commerce College 592 2 296 4.0 1 0.5
20 Jodhpur to Nehru Nagar 249 2.25 111 1.7 1 0.4 21 Paldi to Vasana 393 2.5 157 2.7 1 0.4
22 Sarangpur to Police Comm. Ward Boundary 382 2.5 153 2.6 1 0.4
23 Soni-ni-Chawl to Police Comm. Ward Boundary 294 2.5 118 2.0 1 0.4
24 Laldarwaja to Pachkuva 196 2.5 78 1.3 1 0.4
25 Jamalpur to Police Comm. Ward Boundary 301 6.5 46 2.0 2 0.3
26 Dargah to Paldi 203 3.5 58 1.4 1 0.3 27 Paldi to Subhash Bridge 899 7.5 120 6.1 2 0.3
28 Vejalpur to Police Comm. Ward Boundary 116 11 11 0.8 0 0.0
29 Vijali Ghar to Manilal Mansion 164 2 82 1.1 0 0.0 30 Astodia Darwaja to Kalupur 371 2 186 2.5 0 0.0 31 Astodia Darwaja to Ellisbridge 172 1.75 98 1.2 0 0.0 32 Delhi Darwaja to Dafanara 279 2.5 112 1.9 0 0.0

Bus Rapid Transit System, Ahmedabad GIDB, GoG
AMC & AUDA 3-18 CEPT University
Sr.No. Road Stretch Total
Accidents (1995-2002)
Length (km)
Total Accidents/Km (1995-
2002)
% of Total Accidents
Fatal accidents
(2002)
Fatal accidents
/ Km (2002)
33 Kankaria Round Road 338 2.5 135 2.3 0 0.0
34
Usmanpura Circle to Sardar Patel Colony's Vijay Char Rasta 218 2.25 97 1.5 0 0.0
Total 14697 122.25 4772 100.0 116 Derived From: Safe Traffic Advocacy Cell, School of Planning, CEPT University.
The stretches along Vasna-Sarkhej and Narol-Naroda highway accounted for almost 50% of the total fatal road accidents that occurred in Ahmedabad. These roads have higher travel speeds (Refer Map 3-6) and a higher composition of regional traffic, which consists of trucks and Light Commercial Vehicles. An analysis of causes of fatal accidents (Refer Fig 3-6) indicates that trucks accounted for causing about 15 per cent of total fatal deaths in the city. The pedestrian traffic accounts for causing about 18% of total fatal deaths in the city, and there is a high level of pedestrian traffic along the Narol-Naroda Highway at certain locations, but lack of proper pedestrian facilities such as footpaths and zebra crossings.
Fig 3-6: Causes of Fatal Accidents
Source: Safe Traffic Advocacy Cell, School of Planning, CEPT University
3.4.4 Effects on Air Quality
The city of Ahmedabad has seen a rapid growth in two wheeler population in the last two decades, which has also resulted in rising pollution levels in the city. Vehicular pollution generally accounts for 60-70 per cent of total pollution loads of a city. The root cause of air pollution in Ahmedabad is the two-stroke two wheelers and auto rickshaws, which contribute to the pollution load. The city has been identified as one of worst with regard to Air pollution by Honorable Supreme Court Committee
Causes of Accidents
Other Fixed Objects
Motorised 2W
Autorickshaw
Bus
Car
Truck
Other VehiclesBicyclesCycle
Rickshaw
Pedestrian
Tree

Bus Rapid Transit System, Ahmedabad GIDB, GoG
AMC & AUDA 3-19 CEPT University
SPM Levels
RSPM Levels
Source: Gujarat Pollution Control Board
The permissible SPM and RSPM levels as per National Ambient Air Quality Standards (NAAQS), have been consistently high for the past decade in industrial and residential areas.
0
50
100
150
200
250
300
350
400
450
1991199219931994199519961997199819992000200120022003
Mic
rogr
amm
e/m
3
Apr'03 May
June Ju
lyAug
Sept OctNov
'
Dec'03
Jan'0
4
Feb'04
Mar'04
IndustrialResidential
140
360
0
50
100
150
200
250
300
350
400
450
1991199219931994199519961997199819992000200120022003
Mic
rogr
amm
e/m
3
Apr'03 May
June Ju
lyAug
Sept OctNov
'
Dec'03
Jan'0
4
Feb'04
Mar'04
IndustrialResidential
140
360
Apr'03
MayJu
ne July
AugSept Oct
Nov
Dec'03
Jan'04
Feb'04
Mar'04
IndustrialResidential
0
50
100
150
200
250
300
1999 2000 2001 2002 2003
Mic
rog
ram
mes
/m3
120
60
Apr'03
MayJu
ne July
AugSept Oct
Nov
Dec'03
Jan'04
Feb'04
Mar'04
IndustrialResidential
0
50
100
150
200
250
300
1999 2000 2001 2002 2003
Mic
rog
ram
mes
/m3
120
60