Embed Size (px)
Citation preview

Chapter 1 - Introduction and Municipal Overview
Foreword by His Worship the Mayor of eThekwini Municipality , Councillor ObedMlaba
On the threshold of the FIFA 2010 World Cup, I am once again honoured to highlight therecord of the eThekwini Municipality's achievements and challenges in this AnnualReport 2009/2010.
Durban continues to make strides within our 2020 Vision to achieve the benchmarking ofenjoying `the reputation of being Africa's most caring and liveable city, where all citizens
live in harmony. This will be achieved by growing our economy and meeting people's
needs so that all citizens enjoy a high quality of life with equal opportunities in a city thatthey are truly proud of.
The City's strategic objectives are included in the Integrated Development Plan, which isalso aligned to the Provincial Growth and Development strategy. Within this framework,eThekwini has a comprehensive infrastructure delivery programme and is committed toupgrading basic household services, such as electricity, water, sanitation and refuseremoval to an acceptable standard by 2015. By this time, we hope to have made itpossible for all residents to be able to live in a house with secure tenure and basicservices, particularly in a region with over 500 informal settlements.
eThekwini Municipality has accomplished a significant development in the landmarkMoses Mabhida Stadium that will host seven matches , and boost the city economy andcreate more jobs . This milestone of magnitude , and alongside Durban ' s quest to becomea world-class , cosmopolitan city, will be enhanced by the King Shaka InternationalAirport- Dube Tradeport project and numerous infrastructural and flagship developmentsas a port city and the country ' s second largest industrial hub.
In terms of meeting the basic needs of the citizens , the City is working tirelessly toeradicate informal settlements , and this could be measured by its status as the successivewinner of the Govan Mbeki Housing Award . The City has set a target to deliver no lessthan 18 000 houses every year . The Municipality is also working on a plan for a massivehousing project to start soon , which would see building of low, middle and upper incomehouses in the north of Durban . This will be combined with industrial and commercialprojects , giving residents job opportunities within their own neighborhood.
On the environmental and climate protection side, the City is a world partner in severalprogrammes, ranging from the Cities for Climate Protection Programme to the
International Local Action for Biodiversity Project. On the global stage, eThekwini'sSister City Programme with cities straddles four continents, has opened new vistas forexchanging expertise, youth development, and sport, cultural, economic development andhealth initiatives.

The City is committed to improving customer service and taking local government to thecoalface of our communities through the Batho Pele (Putting People First ) policy. TheCity Stars Awards reward customer-care champions . More and more citizens enjoyaccess to our service centres in urban and rural areas.
In terms of public participation, the creation of appropriate and relevant communityparticipation mechanisms processes and procedures is vital . This programme aims atensuring that communities are part of decision making processes with the Council. Theprogramme encourages communities to utilize their strengths and move away from thedependency syndrome . Ward Committees and other Civil Society Organizations play acritical role in making this programme come alive.
In a City where half the population is under 25 and more than 80% are under 45, theannual SMME Fair attracts 10 000 visitors and provides a platform for black economicempowerment entrepreneurship , particularly youth talent and women-led enterprises toshowcase their services and products.
However , education , skills development and training , apprenticeship and certification ofartisans remain the largest transformational challenge in a depressed job market , where alarge percentage of the workforce is unemployed.
Together with our administration , we should harness the political will and capacity todeal with the issue of discipline in following-through and getting things done to improvethe quality of life of our people.
Finally, sincere appreciation goes to my fellow Councillors, the Municipal Manager, allmunicipal employees and the public for their commitment and dedication to the City ofDurban.
Councillor Obed Mlaba
Mayor
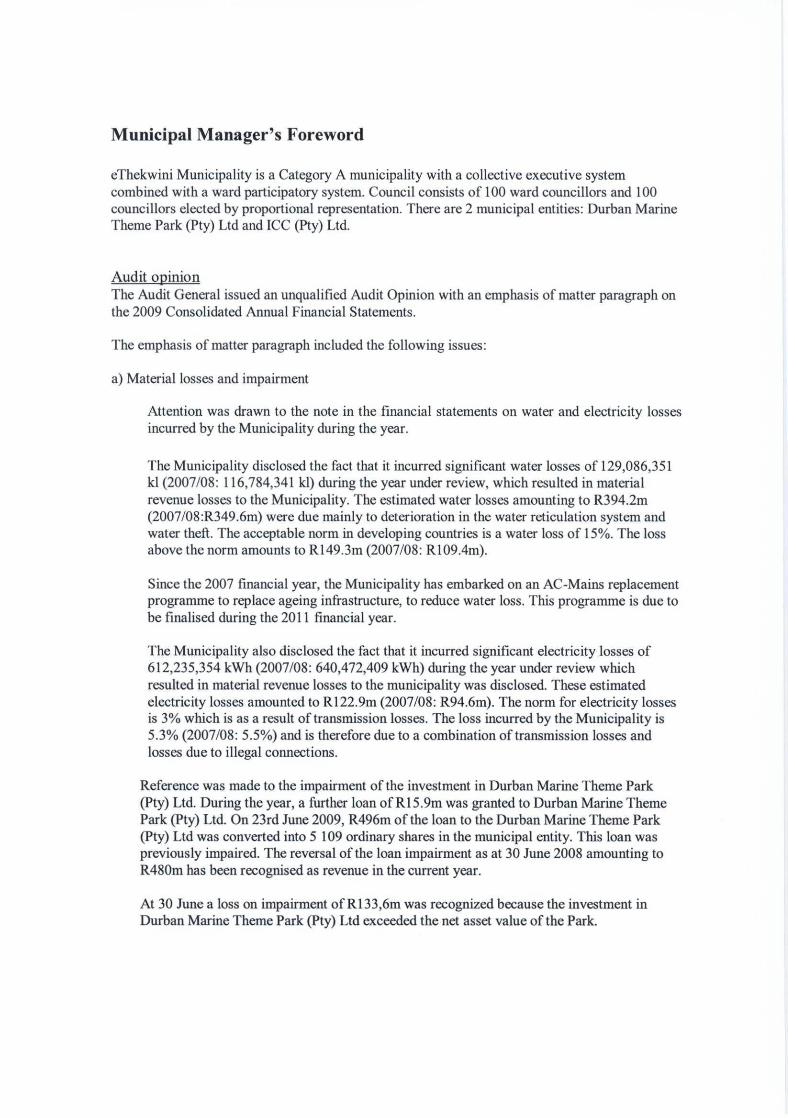
Municipal Manager 's Foreword
eThekwini Municipality is a Category A municipality with a collective executive systemcombined with a ward participatory system. Council consists of 100 ward councillors and 100councillors elected by proportional representation. There are 2 municipal entities: Durban MarineTheme Park (Pty) Ltd and ICC (Pty) Ltd.
Audit opinionThe Audit General issued an unqualified Audit Opinion with an emphasis of matter paragraph onthe 2009 Consolidated Annual Financial Statements.
The emphasis of matter paragraph included the following issues:
a) Material losses and impairment
Attention was drawn to the note in the financial statements on water and electricity lossesincurred by the Municipality during the year.
The Municipality disclosed the fact that it incurred significant water losses of 129,086,351kl (2007/08: 116,784,341 kl) during the year under review, which resulted in materialrevenue losses to the Municipality. The estimated water losses amounting to R394.2m(2007/08:R349.6m) were due mainly to deterioration in the water reticulation system andwater theft. The acceptable norm in developing countries is a water loss of 15%. The lossabove the norm amounts to R149.3m (2007/08: R109.4m).
Since the 2007 financial year, the Municipality has embarked on an AC-Mains replacementprogramme to replace ageing infrastructure, to reduce water loss. This programme is due tobe finalised during the 2011 financial year.
The Municipality also disclosed the fact that it incurred significant electricity losses of612,235,354 kWh (2007/08: 640 ,472,409 kWh) during the year under review whichresulted in material revenue losses to the municipality was disclosed. These estimatedelectricity losses amounted to R122.9m (2007/ 08: R94 . 6m). The norm for electricity lossesis 3% which is as a result of transmission losses. The loss incurred by the Municipality is5.3% (2007/08: 5.5% ) and is therefore due to a combination of transmission losses andlosses due to illegal connections.
Reference was made to the impairment of the investment in Durban Marine Theme Park(Pty) Ltd. During the year, a further loan of R15.9m was granted to Durban Marine ThemePark (Pty) Ltd. On 23rd June 2009, R496m of the loan to the Durban Marine Theme Park(Pty) Ltd was converted into 5 109 ordinary shares in the municipal entity. This loan waspreviously impaired. The reversal of the loan impairment as at 30 June 2008 amounting toR480m has been recognised as revenue in the current year.
At 30 June a loss on impairment of R133,6m was recognized because the investment inDurban Marine Theme Park (Pty) Ltd exceeded the net asset value of the Park.

b) Irregular ExpenditureThe Auditor-General drew attention to the note to the Financial Statements that reflectedIrregular expenditure.
Investigations are still in progress regarding 13 cases relating to non-compliance with SupplyChain Management policy totalling R45.5million.
Controls have been implemented and will be monitored during the year to prevent arecurrence.
In the prior year, the Auditor - General issued an unqualified Audit Opinion , with an emphasis ofmatter paragraph , on the 2008 Consolidated Annual Financial Statements.
The emphasis of matter paragraph included the following issues:
a) Attention was drawn to the note in the financial statements on events after the balance sheet
date - Acquisistion of busses from Durban Transport (Remant Alton).
b) Amendments to the applicable basis of accounting.The Auditor-General drew attention to the accounting policy note that stated that, NationalTreasury approved a deviation from the basis of accounting applicable to the Municipality interms of General Notice 522 of 2007, issued in Government Gazette No. 30013 of 29 June 2007,which granted the Municipality early adoption of the certain standards
The 2009 Financial Statements were in compliance with accounting basis as prescribed byNational Treasury.
c) Material losses owing to criminal misconduct
Attention was drawn to the following cases as disclosed in the note to the financial statements:
Fraudulent transactions at Durban Marine Theme Park (Pty) Ltd and ICC, Durban (Pty) Ltdamounting to approximately R1,8 million and RI,6 million respectively, were discovered duringthe year under review.
Controls were implemented and monitored during the 2009 year to prevent fraudulent
transactions.
Financial health
Credit Rating
• The eThekwini municipal region recorded GDP of R 137.6bn in 2008, or 6.7% of
national GDP, and has witnessed an average GDP growth rate of 5.2% over the period
2004 to 2008, above the national average of 4.6%.In addition, an expectation of
continued above average growth is favourably viewed.
• Liquidity levels were significantly undermined in F09; following the deployment of
substantial cash reserves to supplement capital spend.

• This drove an increase in net debt to R4.2bn , and a concomitant increase in net gearing to
a level well above historical norms.
• While cognisance is taken of the fact that the Municipality receives a significant amount
of grants from government to support operations and capital expenditure, additional large
borrowings are budgeted in the medium term, as the Municipality continues to roll out its
substantial infrastructural programme (currently the highest in the country). Gearing
ratios are, in turn, budgeted to rise further to 43% in F 10 and 44% in F 11.
• A deterioration in payment levels , which has resulted in large working capital
absorptions , presents a key challenge . This risk is exacerbated by the current difficult
economic climate and relatively high tariff increases being passed onto consumers.
Monthly Budget Performance Indicators
AverageBasis of Calculation for the
yearSafety of CapitalDebt to Equity Loans, Accounts Payable, Overdraft
& Tax Provision/Funds & Reserves 60%Gearing Long Term Borrowing/Funds & 31%
Reserves
Revenue Management
Annual Debtors Collection Last 12 months receipts/Last 12 93.3%Rate months billing(Payment Level %) Total Outstanding Debtors to Annual 21%
RevenueOutstanding Debtors to Debtors > 12 mths recovered /Total 100%Revenue Debtors > 12 mths old
Long Standing DebtorsReduction Due to Recovery
Creditor' s ManagementCreditors System % of Creditors paid within terms 100%Efficiency (within MFMA s 65 (a))
Credit RatingLong Term AA-Short Term Al

Revenue and Expenditure
Revenue___ ^_ _____
fl N M N N V ^N^-' o
c E
^{pp ttppO N N 1n I C] v N"! O^ I I
1^ O (WV l+f N NV
N/V 'L E -- -= = ' ^
ONi COm I N I v I
N N l'7 ^ fh ^ FC- FZI I R^^^ I O b
tNn N t v 1
A Ec, ci
N
q
01 pp y^ ^OD I I O N I 1 m(V
V ci C
Q
I N c^F OI ad N 0 ON V
v
v
z a
^ [gi ^ Si v ^ m ^̂p ^ N ^e^ C N ^f .- o
150
O N t^ O N V im"' 10
EQ
I I 1 I I v
f3 Im49
° 2
A E c^ c7 bf3 m m
m PI m 3 £ m^^cp p rnml p p oS a u. (7 >S S S A CL O U O ar
O OTC C
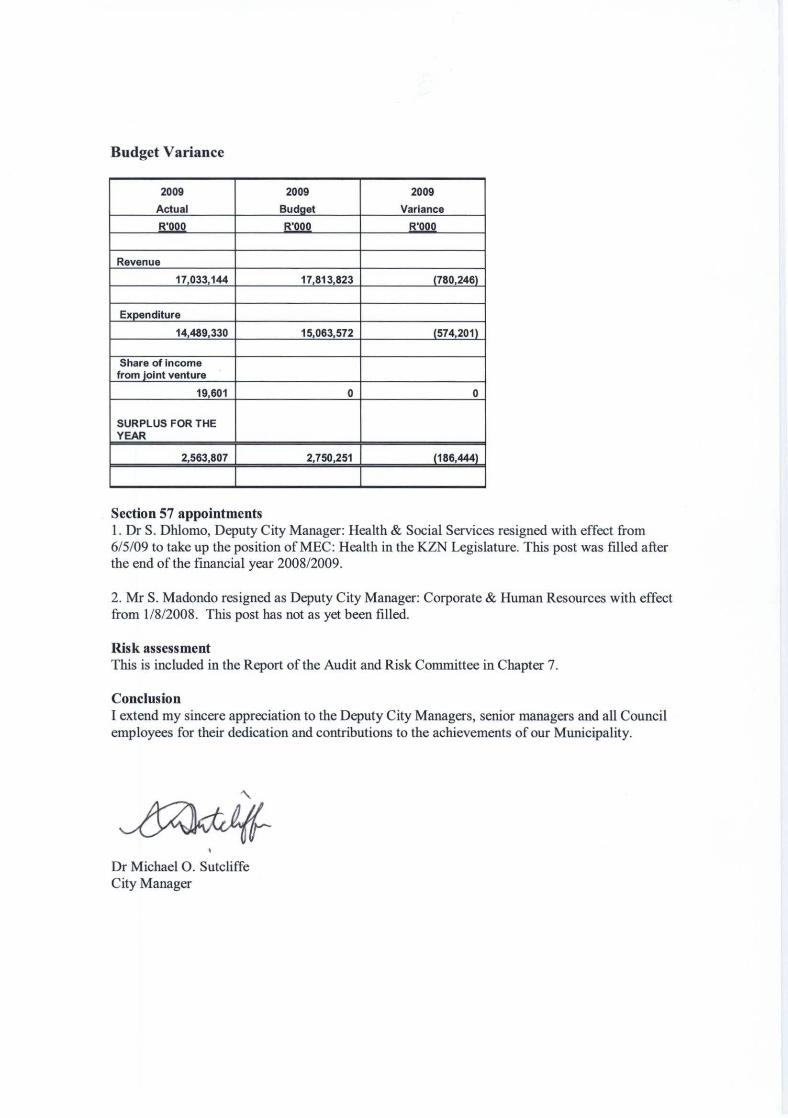
Budget Variance
2009
Actual
2009
Budg et
2009
Variance
R'000 R'00 R'000
Revenue
17 033 , 144 17 813,823 (780,246)
Ex penditure
14,489 , 330 15 , 063,572 (574 ,201 )
Share of incomefrom j oint venture
19,601 0 0
SURPLUS FOR THEYEAR
2,563,807 2 , 750,251 186,444
Section 57 appointments1. Dr S. Dhlomo, Deputy City Manager: Health & Social Services resigned with effect from6/5/09 to take up the position of MEC: Health in the KZN Legislature. This post was filled afterthe end of the financial year 2008/2009.
2. Mr S. Madondo resigned as Deputy City Manager: Corporate & Human Resources with effect
from 1/8/2008. This post has not as yet been filled.
Risk assessmentThis is included in the Report of the Audit and Risk Committee in Chapter 7.
ConclusionI extend my sincere appreciation to the Deputy City Managers, senior managers and all Councilemployees for their dedication and contributions to the achievements of our Municipality.
1
Dr Michael 0. SutcliffeCity Manager

Municipal Overview
Demographics
eThekwini Municipality is located on the KwaZulu-Natal coast and serves an area of 2300 square
kilometers. The Inanda, Ntuzuma and KwaMashu area (INK) is a Presidential Urban Renewal
Project to the north of the CBD. Another major township, Umlazi, is located to the south of the
CBD.
The eThekwini Metro Area (EMA) is an amalgamation of racial and cultural diversity, with
African, Indian and European influences creating a vibrant cosmopolitan society. According to
the last official statistics, the Statistics South Africa Community Survey 2007, the EMA currentlyhas an estimated population of just over 3.46 million. There are no official population statisticsfor the years 2008 and 2009,
The African community makes up the largest sector (68%) of the population followed by theIndian community (20%), White community (9%) and Coloured community (3%).
eThekwini Population 2007
Black 2466801
Coloured 78530Indian or Asian 647751White 275006Grand Total 3468087
eThekwini Population 2007
GVA by economic sector

Forecasted data from Global Insight shows that Gross Value Added (GVA) for 2009 may be134.4 bn and would be a -2.4% change over the 2008 figure recorded at RI 37.6 bn. The globalcrisis that sent a ripple effect through the global economy during November 2008 may still beimpacting locally, where national GDP for 2009 is expected to contract by around 2% (2009information not available).
Gross Value Added b y Region (GVA-R)Broad Economic Sectors
Constant 2000 prices (R 1000)2007
1 Agriculture 1,466,8382 Mining 184,7763 Manufacturing 27,426,3604 Electricity 3,060,9955 Construction 4,146,7946 Trade 21,788,7607 Transport 20,049,1858 Finance 24,500,0279 Community services 18,936,556
20081 Agriculture 1,770,4032 Mining 157,2203 Manufacturing 27,913,9484 Electricity 3,020,6575 Construction 4,683,4196 Trade 22,017,1517 Transport 20,948,2658 Finance 25,793,294L9
Community services 19,685,684
Building plans completed(see following page)

OI-
c0MO OO tiO OMN a)C
C)
CAO
00C)tiMON
OO
N
O
OOONN.
CnO
o.
C)O
CAO
dLL
CAO
C
7
COO
VO
COO
OZ
OOrvO
00O
aC)
aOO
O
cc10C)
CO
0N-
N
c0Occ
O
OMOO
NCoCoN.MN
ONOMti
C)OONO
NccN
rnO
N
ti
MCOO
)
OO
a
C)
OO
U)IL
OOC
OO
Ua)0
OO
OZ
COO
UO
OOaa)
U)
00O
Q)
OO
OO
O
N-cc
CoN.
N
10N10CoN-
C)O
OOlf)
c0NCO
ON
Occ
0)coC)
0
NON
O1-
0)O
dC
7
Nc0
O
OO
A
U)O10NN.
CAO
CL
CoO10
C)O
010
CAO
a)LL
00
N.
C)O
C!C
O
lf)'ct
coO
C)C)
ON.CoLf)
COO
OZ
NONN
OO
VO
OOMON
00OaC)
OOOti
CoOC)
00)OO
ccccOMCO
COO
OONON
Fu N.O cD
H Q
O)O
10a0
OC)
00
IC
N.O
Q r
0C)O
10M
L
IC^
r
M
0) CO
C)U.
O
O CO
C
7
O
00
V ~ OO
Oo
ON
OC
CO cj N 7
> N
Z O
C CD N r 'a
L
Ov N
c0o ^ aaQ Q V C
a a3 v C
mL O O 'C
r M cc
O
N
^M
wdvti
rC 7 Oc
N OZ
O

Challenges facing the Municipality:
Employment and job creationAccording to Global Insight, unemployment presently stands at 241,746 in 2008 dropping by0.64% over the previous year. The unemployment rate during 2008 was 19.1 % decreasing by 1.1percentage points over 2007.
According to Statistics South Africa there were job losses recorded during the first half of 2009and total employment is expected to show a decrease over 2008 (information for 2009 notavailable).
Employment is expected to recover during 2010 from the anticipated spin-offs from governmentsinfrastructure spending and related benefits from the 2010 FIFA World Cup. The downside,however, is the expected negative impacts from the tariff hikes in electricity over the next threeyears. This may lead to further unemployment as companies try to reduce staff or face closure inorder to keep up with these high costs.
Unemploy mentNumber of unemp loyed people, official definition
TotalTotal
2007 243,3062008 241,746
Unemployment rate, officialdefinition
TotalTotal
2007 20.2%2008 19.1%
EnvironmentDurban's natural environment plays a key role in providing essential goods and services to theresidents of Durban. These include the formation of soil, erosion control, water supply andregulation, climate regulation, cultural and recreational opportunities, raw materials for craft andbuilding, food production, pollination, nutrient cycling and waste treatment. These ecosystemgoods and services help meet our basic needs and enhance our quality of life.
In order to protect the natural resources of the city and to secure the delivery of these services,eThekwini Municipality has defined a system of open spaces known as D'MOSS (DurbanMetropolitan Open Space System). D'MOSS is a system of open spaces, some 74 000 ha of landand water, that incorporates areas of high biodiversity value linked together in a viable network.It is this biodiversity that supplies ecosystem goods and services. The protection of D'MOSS istherefore essential if sustainability is to be ensured.
From a natural resource perspective, D'MOSS includes approximately 2 000 ha of dams; 2 400ha of estuarine environment, including sand and mudbanks, mangrove and swamp forests; 11 000

ha of forests including dune, coastal and scarp forests; 7 500 ha of wetlands includingfloodplains, swamp forest and reedbeds; 6 700 ha of grassland including the threatened Ngongoniand Sandstone Sourveld grasslands; 15 500 ha of dry valley thicket; and 17 700 ha of woodland,including wooded grasslands. D'MOSS thus provides a unique opportunity to conserve many ofSouth Africa's threatened ecosystems and species including: the endangered Sandstone Sourveldgrasslands; the critically endangered Brachystelma natalensis (a small herbaceous plant); and theendangered Oribi, Spotted Ground Thrush, and Pickersgill's Reed Frog. The ecosystem goodsand services provided free of charge by the ecosystems included in D'MOSS were conservativelyvalued in 2003 to be in the order of R 3.1 billion per annum, excluding the value that open spacecontributes to tourism. Without these free services, the municipality would require anunaffordable increase to its budget to provide these services, especially in the rural areas, wherecommunities rely heavily on the natural environment for daily needs.
Areas that are ecologically vulnerableThere are a number of threats to Durban's natural resources that have resulted in massivetransformation of natural habitats, mostly through urban development and agriculture. Given theextent of these losses, the conservation value of those areas that remain, mostly included withinD'MOSS, is high.
Approximately 34% of Eastern Valley Bushveld and 40% of KZN Hinterland Thornveld have
been transformed. These habitats are well represented in D'MOSS, but they have no legal
protection and the land is generally developable. As a result, these habitats are threatened by
potential development. The fact that these habitats hold more than 34% of the carbon stored inD'MOSS, makes them important from a climate change mitigation perspective. Approximately
67% of the KZN Coastal Belt (coastal grasslands, thickets and forests) has been transformed,
mainly due to urbanization and sugar cane production. The remnants of this habitat are largelylocated along and adjacent to major river valleys.
KZN Sandstone Sourveld (a grassland habitat) has been classified nationally as Endangered, withonly 0.2% of the original area under formal conservation. This habitat is restricted to central,coastal KZN, thus requiring Durban to play a critical role in its conservation. Within the EMA,73% of this habitat has already been lost to urban development and sugar cane production.Remaining areas requiring protection are found in the western suburbs around Hillcrest and Kloofwhere they are often in private ownership and zoned for development. The other western suburbsgrassland, Ngongoni Veld, is also threatened by development as it is generally located on flatterareas that are zoned for development (e.g. the Cato Ridge industrial region). Within the EMA,62% of this habitat has already been transformed.
Scarp Forests are tall and contain many species, including a number of endemic species (i.e. theyoccur only within this habitat type). Because they are found in steep gorges and associated scarps,they are generally not directly threatened by development. Development in close proximity tothese habitats does, however, lead to indirect impacts associated with increased disturbance andthe edge effect, including invasion by alien species, increased nutrients, and increased runoff anderosion. It is for these reasons that developments need to be setback from forest systems.
Northern Coastal Forests occur on the coastal plains and dunes. Being located on the flatter areas,much of this forest type has been transformed. Although it was not possible to calculate howmuch transformation has taken place, 1930 aerial photography does indicate that this habitat typewas far more extensive than it is now.
The other forest type found in Durban, Mangrove Forest, has been classified nationally asCritically Endangered. Most Mangrove Forests have already been lost to forms of development;

three remnants remain, i.e. Beachwood Mangroves at the mouth of the Umgeni River, theIsipingo Mangroves at the mouth of the Isipingo River and the Bayhead Mangroves within
Durban bay. In the 1800's, the Bayhead Mangroves covered an area of 438 ha, today only 15 ha
remain representing a loss of 97%.
Sustainable infrastructure and servicesSee information in Chapter 3
Transportation1. Our PT system has developed in a very unregulated environment where operators dictated thetype and quality of services provided. Clearly this type of system is not sustainable and does notrespond to the users of the system. Furthermore in order to turn the system around and make itresponsive to all users government has initiated the public transport action agenda which aims todeliver a world class public transport in all major cities in SA. In eThekwini this has translatedinto 12500 taxis and about 2000 buses and 60 train sets that service different areas in the City.The biggest problem currently is the duplicated services of taxi, bus and rail on key corridorswhich results in a huge wastage of our valuable subsidy resource. Furthermore, on certaincorridors rail is heavily underutilized and fierce competition between modes occurs which oftencreates conflict and violence.
2. This has resulted in a skewed modal split where inappropriate modes are currently beingutilised along some corridors mainly due to historical reasons In order to align our plans with thePT action agenda a major shift between modes would need to be considered which is a seriouschallenge. The institutional model for ownership and operation needs intensive discussion andbuy in from the stakeholders in order to table a model that's acceptable to all parties. Appropriatemodes must be employed so that larger vehicles service the long haul and the smaller vehicles thefeeder services.
3. Currently a small proportion of PT services are subsidised. In order to implement a fullycompliant PT restructured system will inevitably translate to a 3 fold increase in PT subsidies. Itis unlikely that this increase will be affordable to the country. In the context where PT is not thehighest priority -it is unlikely to secure huge investment levels for capital and operating.Dedicated PT levies need to be pursued. It is certain that a restructured system is achievable if thefunding levels are reasonable.
Housing
Years Houses Houses Backlog Council Add 2%construc constructed 2007 CS Estim . Growthted pa Cumulative (STATSS Backlog. Rate in
A). No No BacklogGrowth GrowthRate rate
1994-1999\2000 33,843 33,843 314,9432000\1 7,623 41,466 281,1002001\2 8,000 49,466 273,477

2002\3 10,000 59,466 265,4772003\4 12,500 71,966 255,4772004\5 15,172 87,138 242,9772005\6 11,552 98,690 227,8052006\7 16,253 114,943 216,2532007\8 18,149 133,092 196,122 200,000* 200,0002008\9 16,515 149,607 177,973 181,851 185,48s2009\10 161,458 165,336 168,61_,
Total 149607
Notes:
1.Housing Backlog based on Informal settlements , informal backyard and traditional dwellingsfrom 2007 STATSSA Community Survey (CS Community Survey 2007).2. A 2% growth rate has been used based on the calculated growth rate between 2001 Census and CS 2007.3. Draft results from a count of informal and traditional dwellings are still to be fmalized butIndicate that the CS 2007 figures could be an underestimate.* CS 2007 (Nov) + estimated delivery, July - Nov 2007
Safety and security
Special service incidents
Category No. of incidents FatalitiesChemical
Exposures
7 1
Hazmat 27 0Medical 70 12
Miscellaneous 837 23Structures 34 2
Transport 3118 172Total 4093 210
Disaster management
Incidents No. of FoodPacks Issued
No. of No. of Tents No. of PlasticBlankets Issued Sheets Issued
Issued
Informal 2112
Scttlcnncnts
2612 0 0

Weather 3460 5180 46 41
Geological 100 100 0 0
Hostels 25 25 0 0
House Fires 411 411 0 0
Total 6108 8328 46 41

00 0 O O) 0 LO 0 (D N U) O
W N
0N LO -: a O h Cn O M (D O
a
6)OD
coLr)
O)(0
U)cm
M N0
O00
U) S (D U) O (o N O p D( cl^ .0 (ND N P O U)W
V
O )̂N
00 U) Lc) O 0 U) (0h
-.0(N
M(N
V QO n N M VO
O(6M U)
O)(O 00
NO
ON
O)(O
U) N •- N- N N O U) 00 N-MN Cl) CO N
M w d' 2' 2' w Q' O' K c 2' d' r . (r , X of
LL N
0 L N O O N O O 0 0 O 0 O O O 0 0 0 OZ U-
(m It U) VO
04U') C)LO Ok
O O N M M (D OM N (O
O CO h .-- O N O O O O O V O M c-
mj E U D (L) - N M O 0 O O N N 0 O co O N
OW ((j (p v
I m
O O 0 (D co O O h O
co O - 0 0 0 O O 0 O O 0 O 0 C. C. 0 0 O
w t mN cm
JM
1 - 1-
0 0 O O 0 O O O O O O O - OQU c
(0 o2S ^-- O O O O O 0 0 O 0 '- 0 0 U) 0 N O
QU
m mO c
.U) i4 to c) O 0 O O O O 0 O N O O
2
Y
00 0 M
H- 1 -
c
OM
O M CO0
OO N N '- co N O N M U) N OO r CON
LL
N _ 5 N V1LO N OD U) It V O 0 O M O O h V
w LL N M
O O)E C ' U) 0 O 0 0 O O O M ,- O N O(n Y
m _E2 C -0 1]
CL p
zJ
c ro (° i - c m V)d 00
a-iaE m ma^
vE`°
j= ^ E 0 Jm
E Q N a 2 U N (V Oc
O
l
m
0
y
U N m -
o mmp
0
YO
yt'p N
yC O) L
p pN
y (`EO V) O L 0) L 7 N (9 p J O
Iu LL LL M: T- =E ww 0M:(5 206 o:2 .
0U) 0U) 0 0A ti
`̂ m w mV G E (^ lC V)
8 ^«in'C3 ad Q UE C
IL U fl - N M in co h co 07 Or ^-
'--N'-M^ ^
ar
mrhr
aDr

NO 0 (D O O OO M O N O O 0)
N 0 0 0 O 0 1" O O O ui V O O M O V nU) O O O O (D O 0) O O 0 U) CA N to O 0 N 0 O O (DV
VO O M
M0O
(0 0 0O
cj^ U) VO V
P O OO
Mco
U)V00
U) CONOMnOO CO
NCA N 00
ON N
ON O
M(D
to(D
(DU) O U) V U) 00
CO O 0 (0 00 N-04 N V V
(d'7 O O U) CO 00 O
`CO O (D n O ,q: N N U) U) V N M U) 00 O O n to 1^ ( )CA N - N CO M r- V N- - (D N V - M N O O V V r- I- (D
U' U o o U' o! o Ctf o! r X , w (if w a s n oqo U' c o o! °
0 O O O O O 0 0 0 0 0 0 N N 0 0 O 0 0 O 0 0 0 (^
00 M (D 00 O 0 N (O P N o V n M 00 O OU)00
M00N C)
co M U)00
O O N O - N N e- O 0 O M U) co O 0 00
0 0q. CO
•- O .-- N O O V 0 0 O (.Oj '- M O ^ O O COn N O ^ U)co
O 0 0 0 0 0 O 0 0 ^ Cl O N N- 00 O N C. O 00 O O U)ID0
I , I
N
O 0 0 0 0 0 O O O O O O O O O O O O O N O O O M
O 0 0 0 0 0 O 0 0 0 0 O O 0 0 O 0 O 0 0 O CO
0 O 0 - O 0 0 - O 0 0 0 0 0 0 0 O O O M
M e-- O N 0 0 0 0 0 O M O 0 0 0 M 0 0
OO 0 0 0 0 0 O O O O O 0 0 0 0 O O O Co 0) O (D
( 0 M r - M M V '- N N . U) 0 e- O O N M ' V OU) 0
V N 0 0 U) N CD N M O V CO N V O O rn O O co U)r
vO)0 0 0 0 0 O O r- 0 0 O M 0 0 O 0 0 0 0 M CA 0)U)
yyH
p^o
N U f` N
C C C' U 6) N N f0 .^. «. 10
0 a)y N N
)^ (U
N L SC C 'C iJ pC CL a)
C
A ` N fp.fp L
a
^ l^ (n 'D U7 0) "C - 0)8
OS(D t N P (6 O 7 N N L « 7 (p _
U CL (LO O o U ^ w ^ D U E CU I> U) f- a 0 mi d m < ^
0CL
A t
r N N N N N N MCO a
M M M M^p
MpO
4N N N N
M 00) 0)
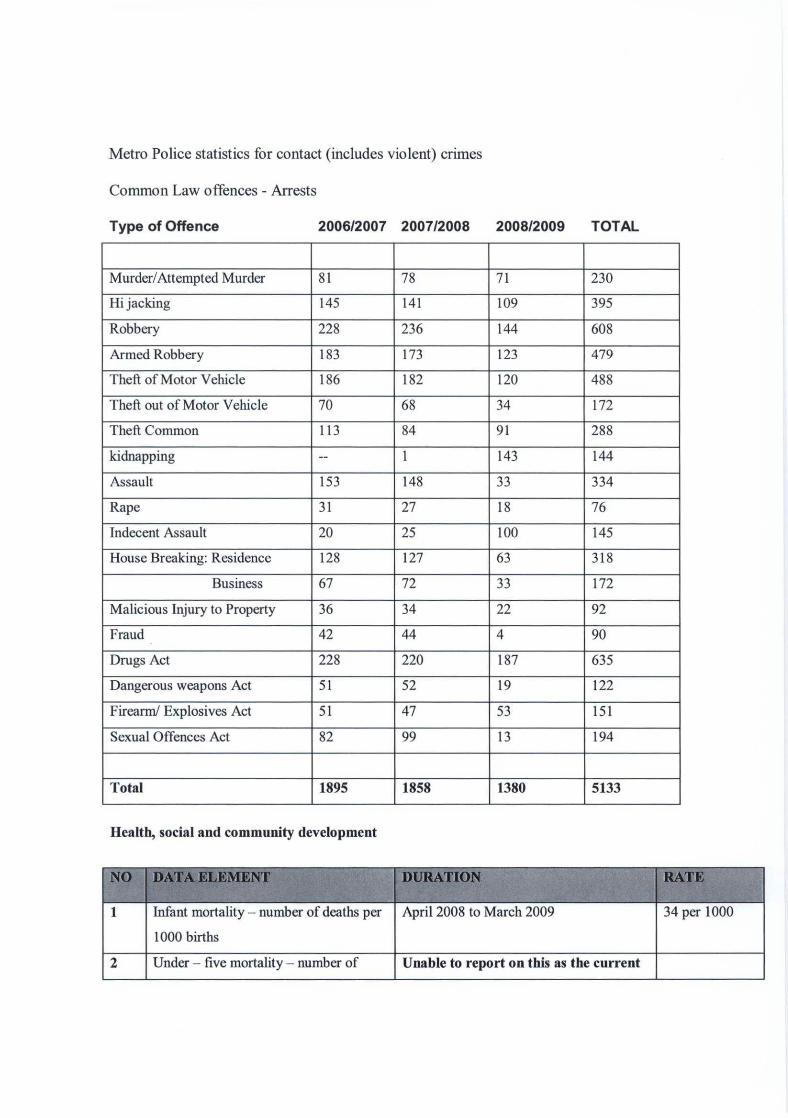
Metro Police statistics for contact (includes violent ) crimes
Common Law offences - Arrests
Type of Offence 2006/2007 2007/2008 2008/2009 TOTAL
Murder/Attempted Murder 81 78 71 230
Hijacking 145 141 109 395
Robbery 228 236 144 608
Armed Robbery 183 173 123 479
Theft of Motor Vehicle 186 182 120 488
Theft out of Motor Vehicle 70 68 34 172
Theft Common 113 84 91 288
kidnapping -- 1 143 144
Assault 153 148 33 334
Rape 31 27 18 76
Indecent Assault 20 25 100 145
House Breaking: Residence 128 127 63 318
Business 67 72 33 172
Malicious Injury to Property 36 34 22 92
Fraud 42 44 4 90
Drugs Act 228 220 187 635
Dangerous weapons Act 51 52 19 122
Firearm/ Explosives Act 51 47 53 151
Sexual Offences Act 82 99 13 194
Total 1895 1858 1380 5133
Health, social and community development
NO DATA ELEMENT DURATION RATE
1 Infant mortality - number of deaths per
1000 births
April 2008 to March 2009 34 per 1000
2 Under - five mortality - number of Unable to report on this as the current
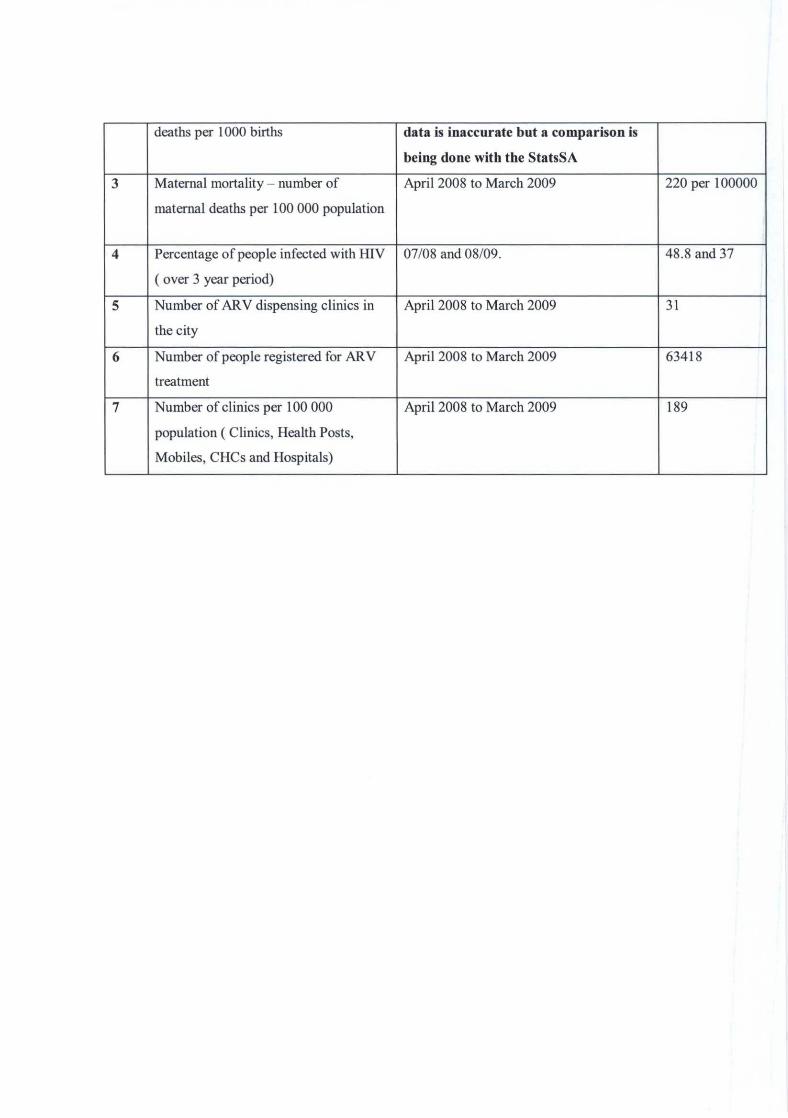
deaths per 1000 births data is inaccurate but a comparison is
being done with the StatsSA
3 Maternal mortality - number of April 2008 to March 2009 220 per 100000
maternal deaths per 100 000 population
4 Percentage of people infected with HIV 07/08 and 08/09. 48.8 and 37
( over 3 year period)
5 Number of ARV dispensing clinics in April 2008 to March 2009 31
the city
6 Number of people registered for ARV April 2008 to March 2009 63418
treatment
7 Number of clinics per 100 000 April 2008 to March 2009 189
population ( Clinics, Health Posts,
Mobiles, CHCs and Hospitals)