Embed Size (px)
Citation preview
1Copyright © 2017 Pearson Education, Inc.
Chapter 1 Graphs, Equations, and Inequalities
Section 1.1
1. 0
2. 5 3 8 8
3. 2 23 4 25 5
4. 2 2 211 60 121 3600 3721 61 Since the sum of the squares of two of the sides of the triangle equals the square of the third side, the triangle is a right triangle.
5. 12bh
6. True
7. x-coordinate; y-coordinate
8. quadrants
9. midpoint
10. False; the distance between two points is never negative.
11. False; points that lie in Quadrant IV will have a positive x-coordinate and a negative y-coordinate. The point 1, 4 lies in Quadrant II.
12. True; 1 2 1 2,2 2
x x y yM
13. d
14. c
15. (a) Quadrant II (b) x-axis (c) Quadrant III (d) Quadrant I (e) y-axis
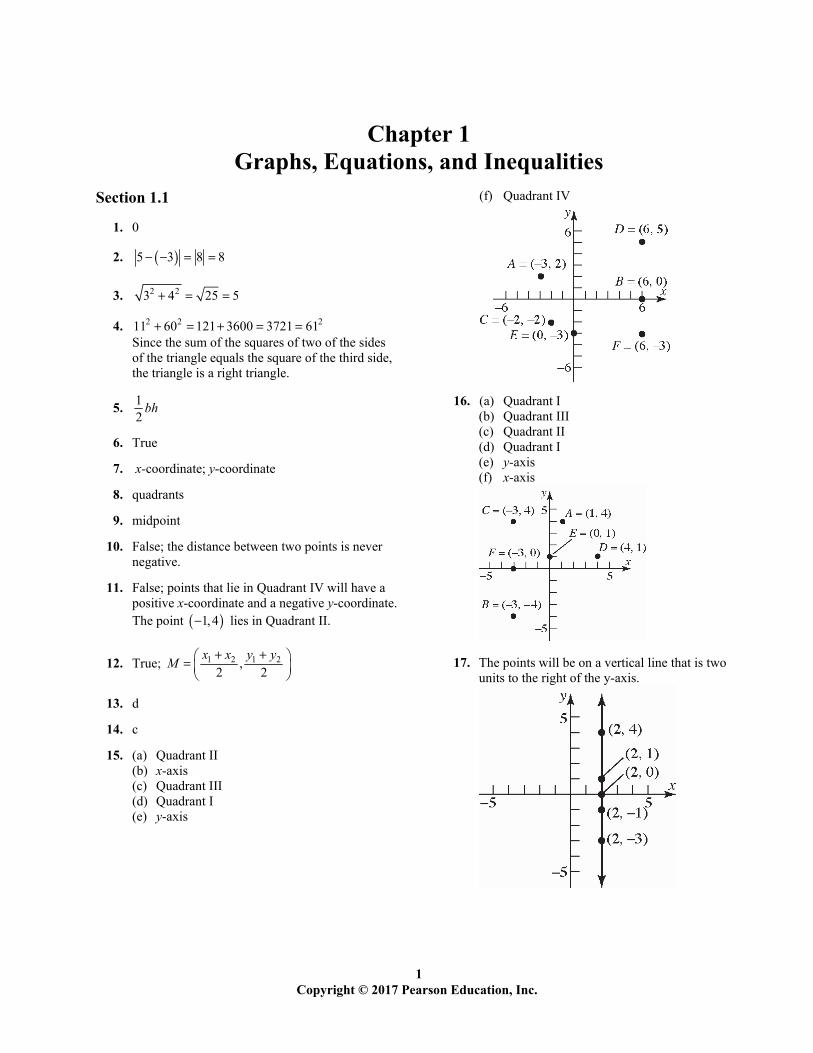
(f) Quadrant IV
16. (a) Quadrant I (b) Quadrant III (c) Quadrant II (d) Quadrant I (e) y-axis (f) x-axis
17. The points will be on a vertical line that is two units to the right of the y-axis.
Chapter 1: Graphs
2 Copyright © 2017 Pearson Education, Inc.
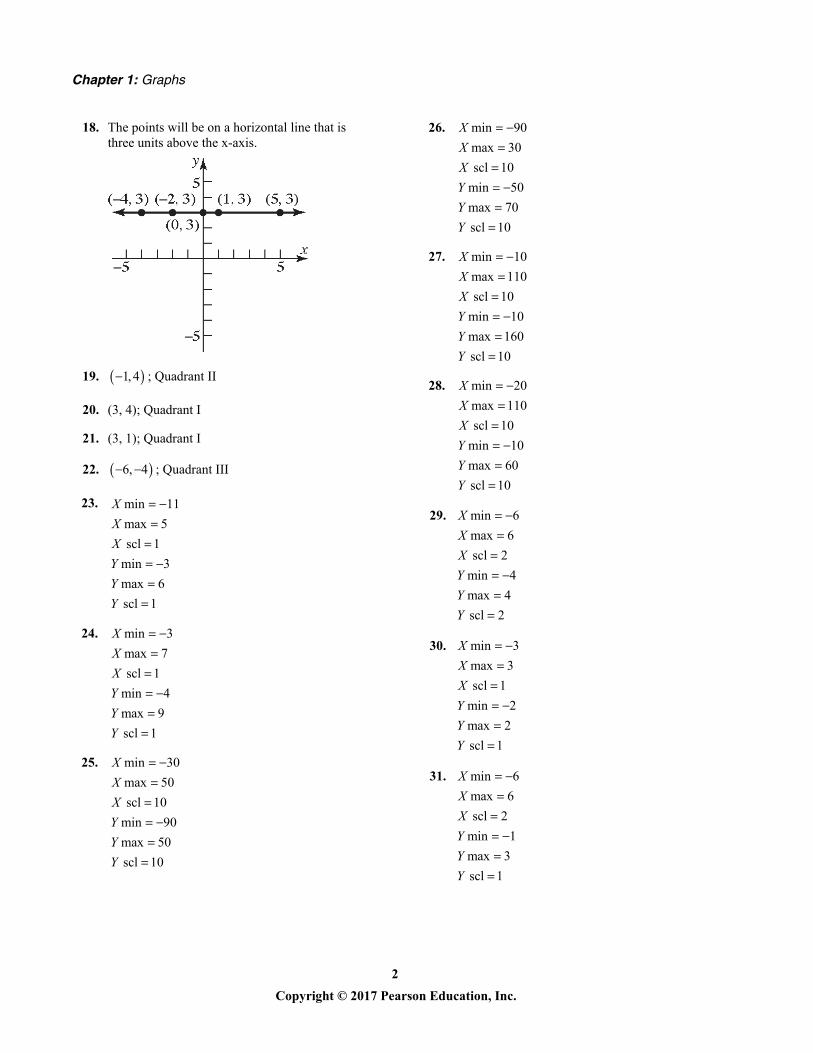
18. The points will be on a horizontal line that is three units above the x-axis.
19. 1, 4 ; Quadrant II
20. (3, 4); Quadrant I
21. (3, 1); Quadrant I
22. 6, 4 ; Quadrant III
23. min 11
max 5
scl 1
min 3
max 6
scl 1
XXXYYY
24. min 3
max 7
scl 1
min 4
max 9
scl 1
XXXYYY
25. min 30
max 50
scl 10
min 90
max 50
scl 10
XXXYYY
26. min 90
max 30
scl 10
min 50
max 70
scl 10
XXXYYY
27. min 10
max 110
scl 10
min 10
max 160
scl 10
XXXYYY
28. min 20
max 110
scl 10
min 10
max 60
scl 10
XXXYYY
29. min 6
max 6
scl 2
min 4
max 4
scl 2
XXXYYY
30. min 3
max 3
scl 1
min 2
max 2
scl 1
XXXYYY
31. min 6
max 6
scl 2
min 1
max 3
scl 1
XXXYYY
Section 1.1: The Distance and Midpoint Formulas; Graphing Utilities; Introduction to Graphing Equations
3 Copyright © 2017 Pearson Education, Inc.
32. min 9
max 9
scl 3
min 12
max 4
scl 4
XXXYYY
33. min 3
max 9
scl 1
min 2
max 10
scl 2
XXXYYY
34. min 22
max 10
scl 2
min 4
max 8
scl 1
XXXYYY
35. 2 21 2( , ) (2 0) (1 0) 4 1 5d P P
36. 2 21 2( , ) ( 2 0) (1 0) 4 1 5d P P
37. 2 21 2( , ) ( 2 1) (2 1) 9 1 10d P P
38. 2 21 2( , ) 2 ( 1) (2 1)
9 1 10
d P P
39. 2 22 21 2( , ) (5 3) 4 4 2 8
4 64 68 2 17
d P P
40. 2 2 2 21 2( , ) 2 1 4 0 3 4
9 16 25 5
d P P
41. 2 21 2
2 2
( , ) 11 ( 5) (9 3 )
16 12 256 144
400 20
d P P
42. 2 2 2 21 2( , ) 10 2 3 ( 3) 8 6
64 36 100 10
d P P
43. 22 2 21 2( , ) (6 4) 4 ( 3) 2 7
4 49 53
d P P
44. 2 21 2
2 2
( , ) 6 ( 4) 2 ( 3)
10 5 100 25
125 5 5
d P P
45. 2 2 2 21 2( , ) (0 ) (0 )d P P a b a b
46. 2 2 2 21 2
2
( , ) (0 ) (0 )
2 2
d P P a a a a
a a
47. 1 21,3 ; 5,15P P
2 21 2
2 2
, 5 1 15 3
4 12
16 144
160 4 10
d P P
48. 1 28, 4 ; 2,3P P
2 21 2
2 2
, 2 8 3 4
10 7
100 49
149
d P P
49. 1 24,6 ; 4, 8P P
2 21 2
2 2
, 4 4 8 6
8 14
64 196
260 2 65
d P P
Chapter 1: Graphs
4 Copyright © 2017 Pearson Education, Inc.
50. 1 20,6 ; 3, 8P P
2 21 2
2 2
, 3 0 8 6
3 14
9 196
205
d P P
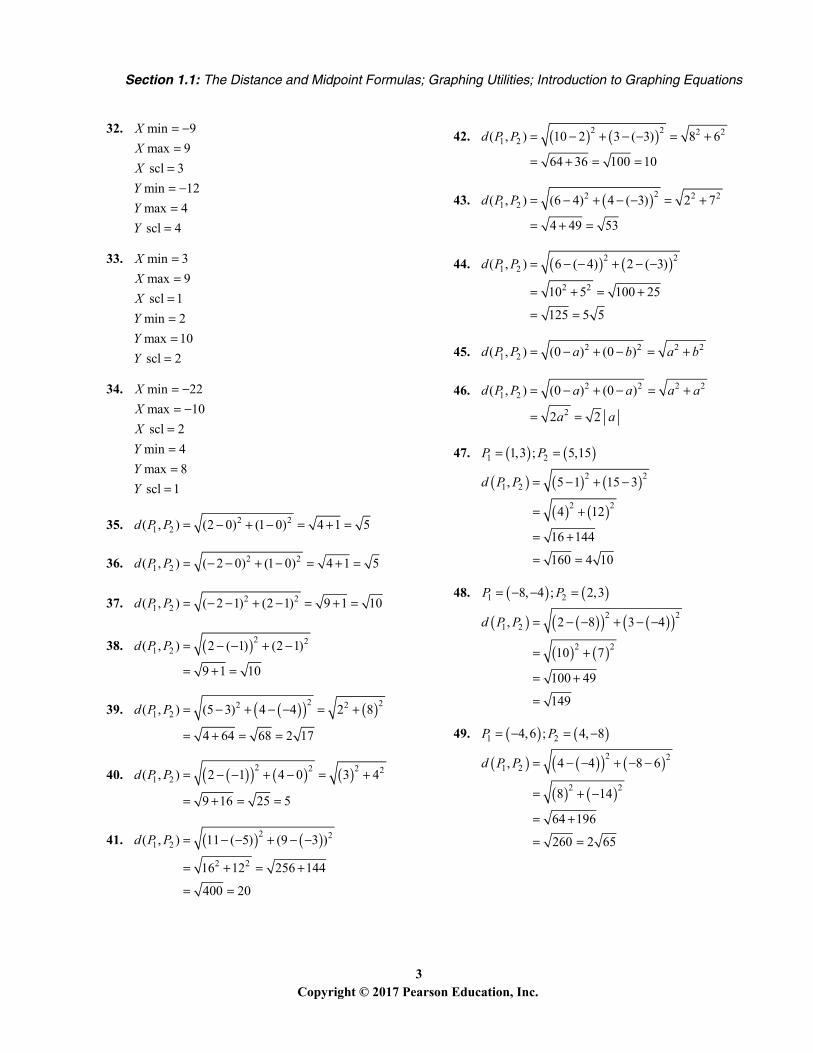
51. ( 2,5), (1,3), ( 1,0)A B C
2 2
2 2
2 2
2 2
2 2
2 2
( , ) 1 ( 2) (3 5)
3 ( 2) 9 4
13
( , ) 1 1 (0 3)
( 2) ( 3) 4 9
13
( , ) 1 ( 2) (0 5)
1 ( 5) 1 25
26
d A B
d B C
d A C
Verifying that ∆ ABC is a right triangle by the Pythagorean Theorem:
2 2 2
2 2 2
( , ) ( , ) ( , )
13 13 26
13 13 26
26 26
d A B d B C d A C
The area of a triangle is 12
A bh . In this
problem,
1 ( , ) ( , )21 13 1321 13213 square units2
A d A B d B C
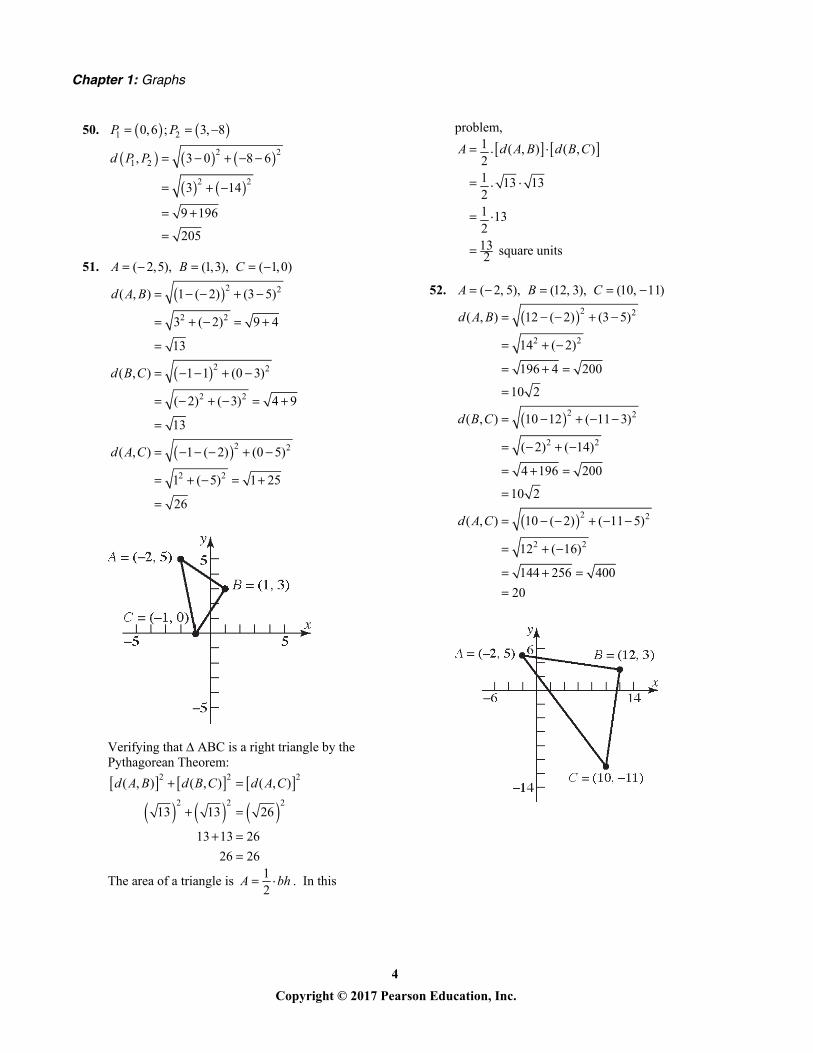
52. ( 2, 5), (12, 3), (10, 11)A B C
2 2
2 2
2 2
2 2
2 2
2 2
( , ) 12 ( 2) (3 5)
14 ( 2)
196 4 200
10 2
( , ) 10 12 ( 11 3)
( 2) ( 14)
4 196 200
10 2
( , ) 10 ( 2) ( 11 5)
12 ( 16)
144 256 400
20
d A B
d B C
d A C
Section 1.1: The Distance and Midpoint Formulas; Graphing Utilities; Introduction to Graphing Equations
5 Copyright © 2017 Pearson Education, Inc.
Verifying that ∆ ABC is a right triangle by the Pythagorean Theorem:
2 2 2
2 2 2
( , ) ( , ) ( , )
10 2 10 2 20
200 200 400
400 400
d A B d B C d A C
The area of a triangle is 12
A bh . In this
problem,
1( , ) ( , )
21
10 2 10 221
100 22100 square units
A d A B d B C
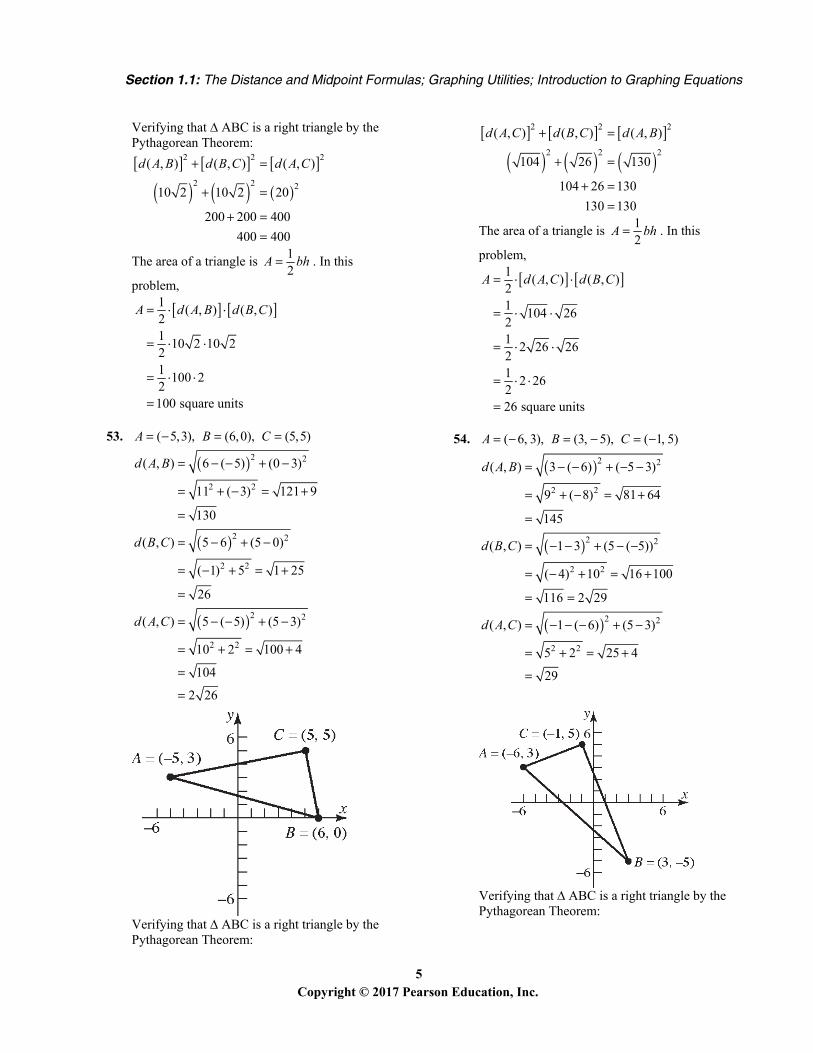
53. ( 5,3), (6,0), (5,5)A B C
2 2
2 2
2 2
2 2
2 2
2 2
( , ) 6 ( 5) (0 3)
11 ( 3) 121 9
130
( , ) 5 6 (5 0)
( 1) 5 1 25
26
( , ) 5 ( 5) (5 3)
10 2 100 4
104
2 26
d A B
d B C
d A C
Verifying that ∆ ABC is a right triangle by the Pythagorean Theorem:
2 2 2
2 2 2
( , ) ( , ) ( , )
104 26 130
104 26 130
130 130
d A C d B C d A B
The area of a triangle is 12
A bh . In this
problem,
1( , ) ( , )
21
104 2621
2 26 2621
2 26226 square units
A d A C d B C
54. ( 6, 3), (3, 5), ( 1, 5)A B C
2 2
2 2
2 2
2 2
2 2
2 2
( , ) 3 ( 6) ( 5 3)
9 ( 8) 81 64
145
( , ) 1 3 (5 ( 5))
( 4) 10 16 100
116 2 29
( , ) 1 ( 6) (5 3)
5 2 25 4
29
d A B
d B C
d A C
Verifying that ∆ ABC is a right triangle by the Pythagorean Theorem:
Chapter 1: Graphs
6 Copyright © 2017 Pearson Education, Inc.
2 2 2
2 2 2
( , ) ( , ) ( , )
29 116 145
29 116 145
145 145
d A C d B C d A B
The area of a triangle is 12
A bh . In this
problem,
1( , ) ( , )
21
29 11621
29 2 2921
2 29229 square units
A d A C d B C
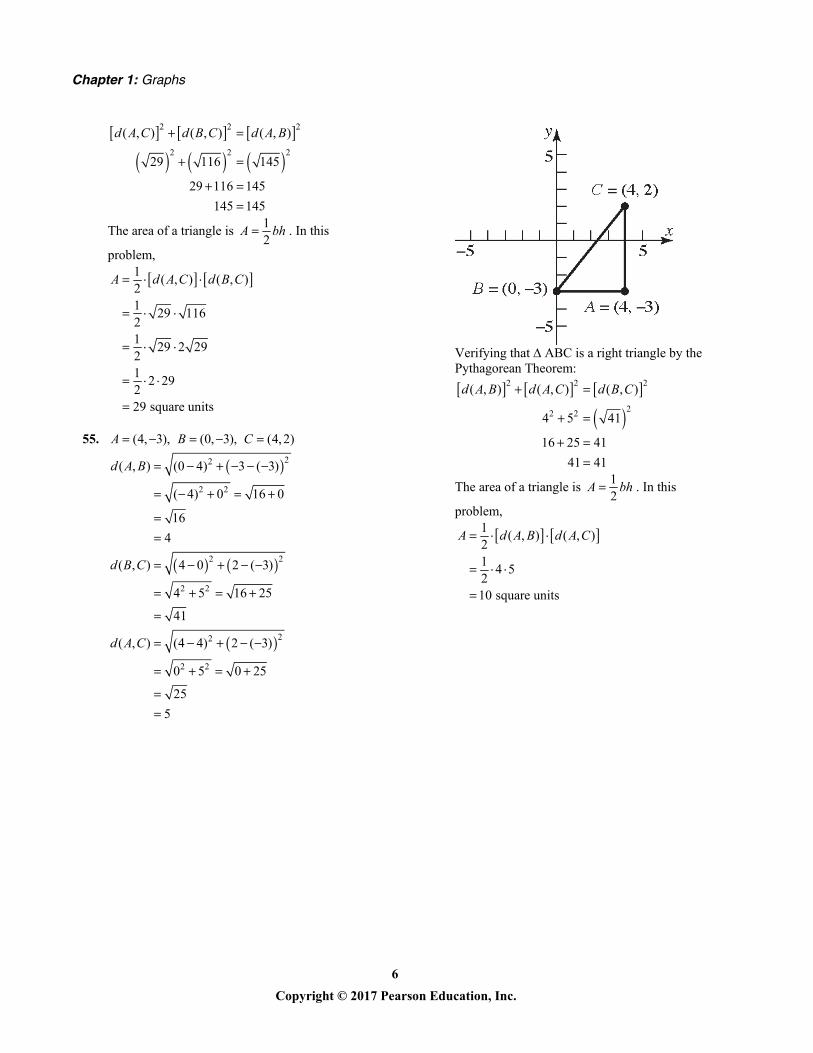
55. (4, 3), (0, 3), (4,2)A B C
22
2 2
2 2
2 2
22
2 2
( , ) (0 4) 3 ( 3)
( 4) 0 16 0
16
4
( , ) 4 0 2 ( 3)
4 5 16 25
41
( , ) (4 4) 2 ( 3)
0 5 0 25
25
5
d A B
d B C
d A C
Verifying that ∆ ABC is a right triangle by the Pythagorean Theorem:
2 2 2
22 2
( , ) ( , ) ( , )
4 5 41
16 25 41
41 41
d A B d A C d B C
The area of a triangle is 12
A bh . In this
problem,
1( , ) ( , )
21
4 5210 square units
A d A B d A C
Section 1.1: The Distance and Midpoint Formulas; Graphing Utilities; Introduction to Graphing Equations
7 Copyright © 2017 Pearson Education, Inc.
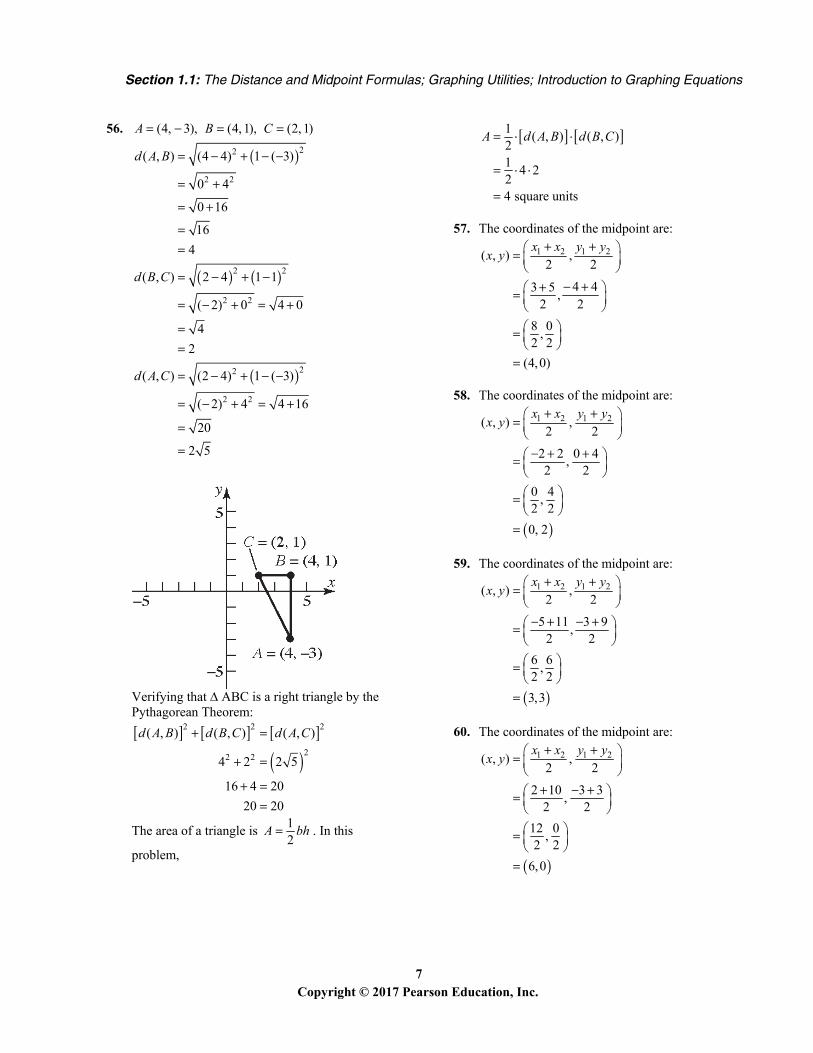
56. (4, 3), (4, 1), (2, 1)A B C
22
2 2
2 2
2 2
22
2 2
( , ) (4 4) 1 ( 3)
0 4
0 16
16
4
( , ) 2 4 1 1
( 2) 0 4 0
4
2
( , ) (2 4) 1 ( 3)
( 2) 4 4 16
20
2 5
d A B
d B C
d A C
Verifying that ∆ ABC is a right triangle by the Pythagorean Theorem:
2 2 2
22 2
( , ) ( , ) ( , )
4 2 2 5
16 4 20
20 20
d A B d B C d A C
The area of a triangle is 12
A bh . In this
problem,
1( , ) ( , )
21
4 224 square units
A d A B d B C
57. The coordinates of the midpoint are:
1 2 1 2( , ) ,2 2
4 43 5,
2 2
8 0,
2 2
(4,0)
x x y yx y
58. The coordinates of the midpoint are:
1 2 1 2( , ) ,2 2
2 2 0 4,
2 2
0 4,
2 2
0, 2
x x y yx y
59. The coordinates of the midpoint are:
1 2 1 2( , ) ,2 2
5 11 3 9,
2 2
6 6,
2 2
3,3
x x y yx y
60. The coordinates of the midpoint are:
1 2 1 2( , ) ,2 2
2 10 3 3,
2 2
12 0,
2 2
6,0
x x y yx y
Chapter 1: Graphs
8 Copyright © 2017 Pearson Education, Inc.
61. The coordinates of the midpoint
are 1 2 1 2( , ) ,2 2
4 6 3 1,
2 2
210,
2 2
(5, 1)
x x y yx y
62. The coordinates of the midpoint are:
1 2 1 2( , ) ,2 2
4 2 3 2,
2 2
2 1,
2 2
11,
2
x x y yx y
63. The coordinates of the midpoint are:
1 2 1 2( , ) ,2 2
0 0,
2 2
,2 2
x x y yx y
a b
a b
64. The coordinates of the midpoint are:
1 2 1 2( , ) ,2 2
0 0,
2 2
,2 2
x x y yx y
a a
a a
65. 4y x x 40 0 0
0 0
41 1 1
1 0
40 ( 1) 1
0 1 1
(0, 0) is on the graph of the equation.
66. 3 2y x x 30 0 2 0
0 0
31 1 2 1
1 1
31 1 2 1
1 1
(0, 0) and (1, –1) are on the graph of the equation.
67. 2 2 9y x 2 23 0 9
9 9
2 20 3 9
0 18
2 20 ( 3) 9
0 18
(0, 3) is on the graph of the equation.
68. 3 1y x 32 1 1
8 2
31 0 1
1 1
30 1 1
0 0
(0, 1) and (–1, 0) are on the graph of the equation.
69. 2 2 4x y 2 20 2 4
4 4
2 2( 2) 2 4
8 4
2 2
2 2 4
4 4
(0, 2) and 2, 2 are on the graph of the
equation.
70. 2 24 4x y 2 20 4 1 4
4 4
2 22 4 0 4
4 4
22 12
2 4 4
5 4
(0, 1) and (2, 0) are on the graph of the equation.
71. (–1, 0), (1, 0)
72. (0, 1)
73. , 0 , , 0 , (0, 1)2 2
74. (–2, 0), (2, 0), (0, –3)
75. 1,0 , 0, 2 , 0, 2
76. (2, 0), (0, 2), (–2, 0), (0, –2)
77. (–4,0), (–1,0), (4, 0), (0, –3)
78. (–2, 0), (2, 0), (0, 3)
Section 1.1: The Distance and Midpoint Formulas; Graphing Utilities; Introduction to Graphing Equations
9 Copyright © 2017 Pearson Education, Inc.
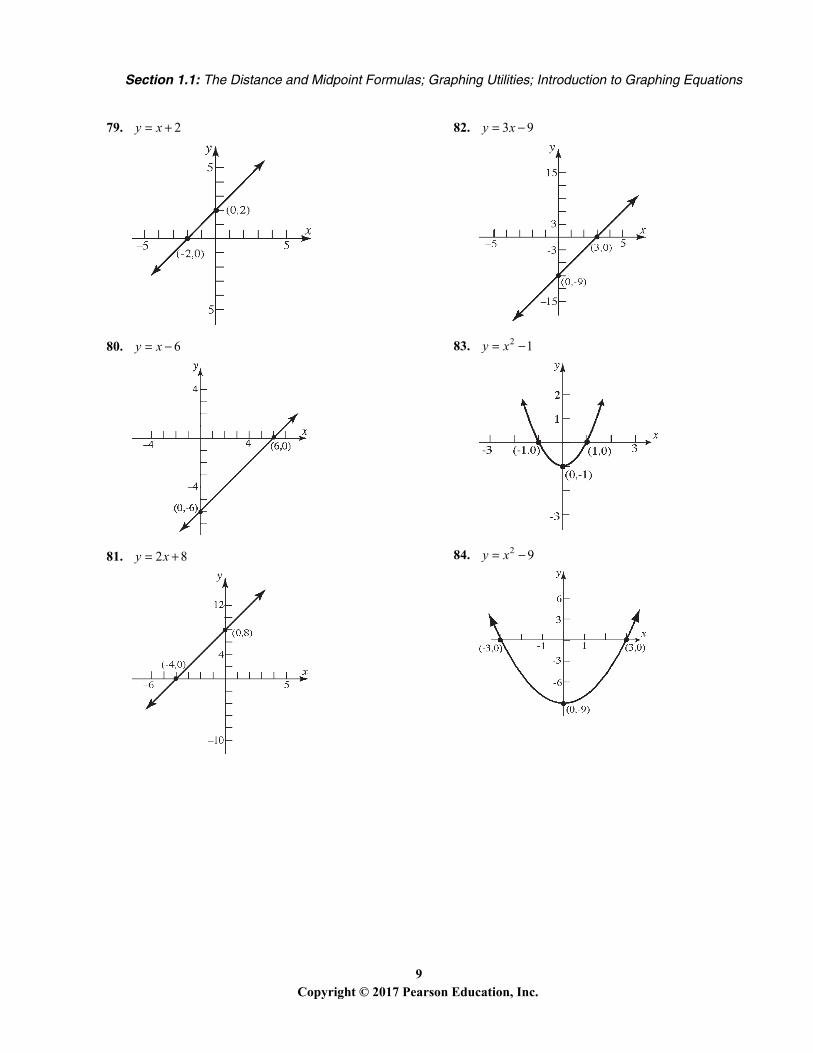
79. 2y x
80. 6y x
81. 2 8y x
82. 3 9y x
83. 2 1y x
84. 2 9y x
Chapter 1: Graphs
10 Copyright © 2017 Pearson Education, Inc.
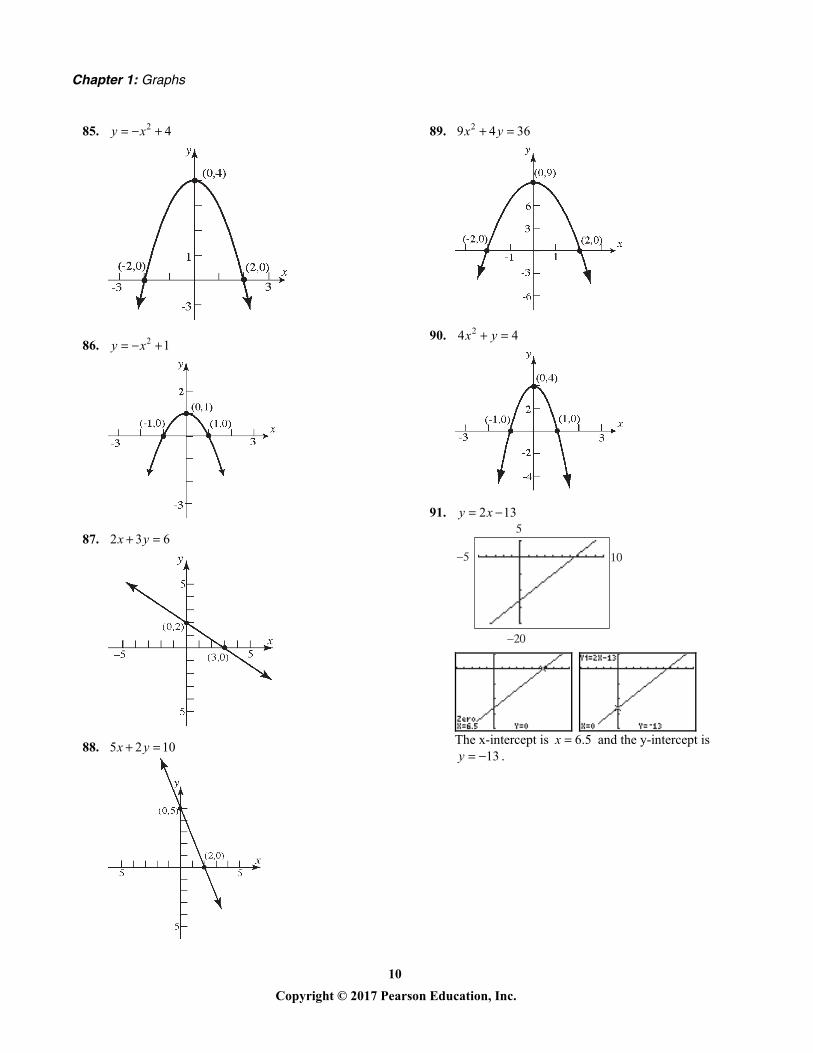
85. 2 4y x
86. 2 1y x
87. 2 3 6x y
88. 5 2 10x y
89. 29 4 36x y
90. 24 4x y
91. 2 13y x
The x-intercept is 6.5x and the y-intercept is
13y .
Section 1.1: The Distance and Midpoint Formulas; Graphing Utilities; Introduction to Graphing Equations
11 Copyright © 2017 Pearson Education, Inc.
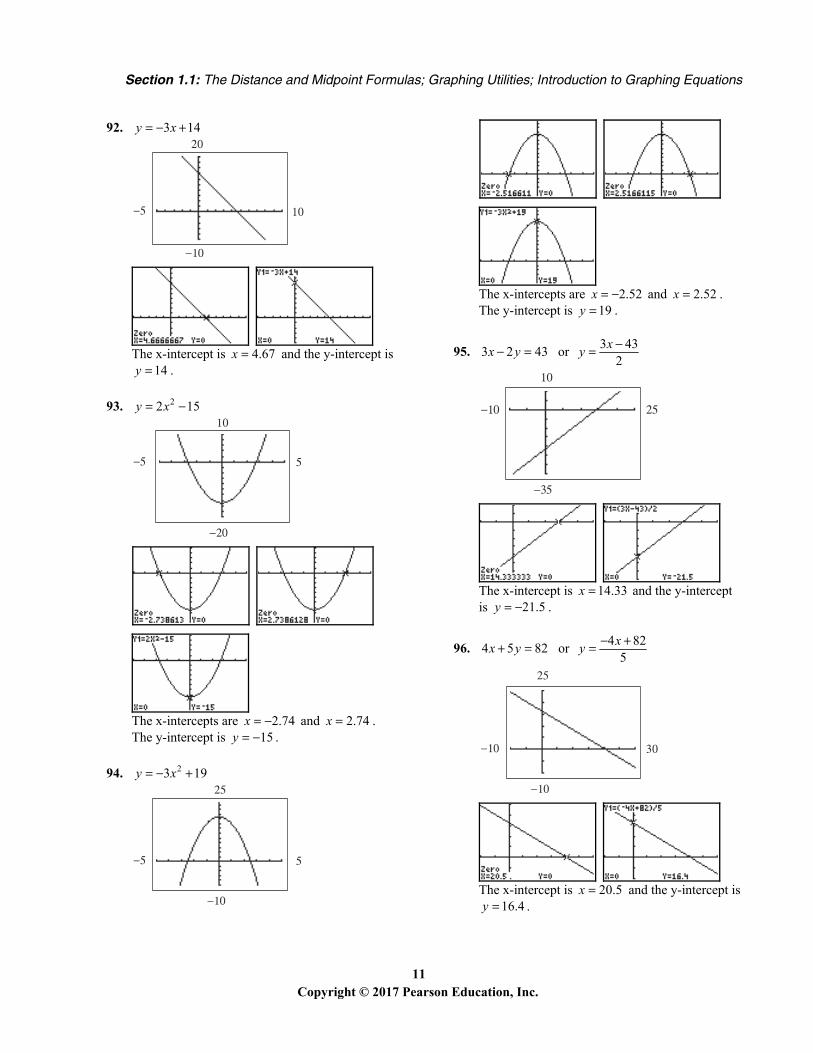
92. 3 14y x
The x-intercept is 4.67x and the y-intercept is
14y .
93. 22 15y x
The x-intercepts are 2.74x and 2.74x . The y-intercept is 15y .
94. 23 19y x
The x-intercepts are 2.52x and 2.52x . The y-intercept is 19y .
95. 3 433 2 43 or
2xx y y
The x-intercept is 14.33x and the y-intercept is 21.5y .
96. 4 824 5 82 or
5xx y y
The x-intercept is 20.5x and the y-intercept is
16.4y .
Chapter 1: Graphs
12 Copyright © 2017 Pearson Education, Inc.
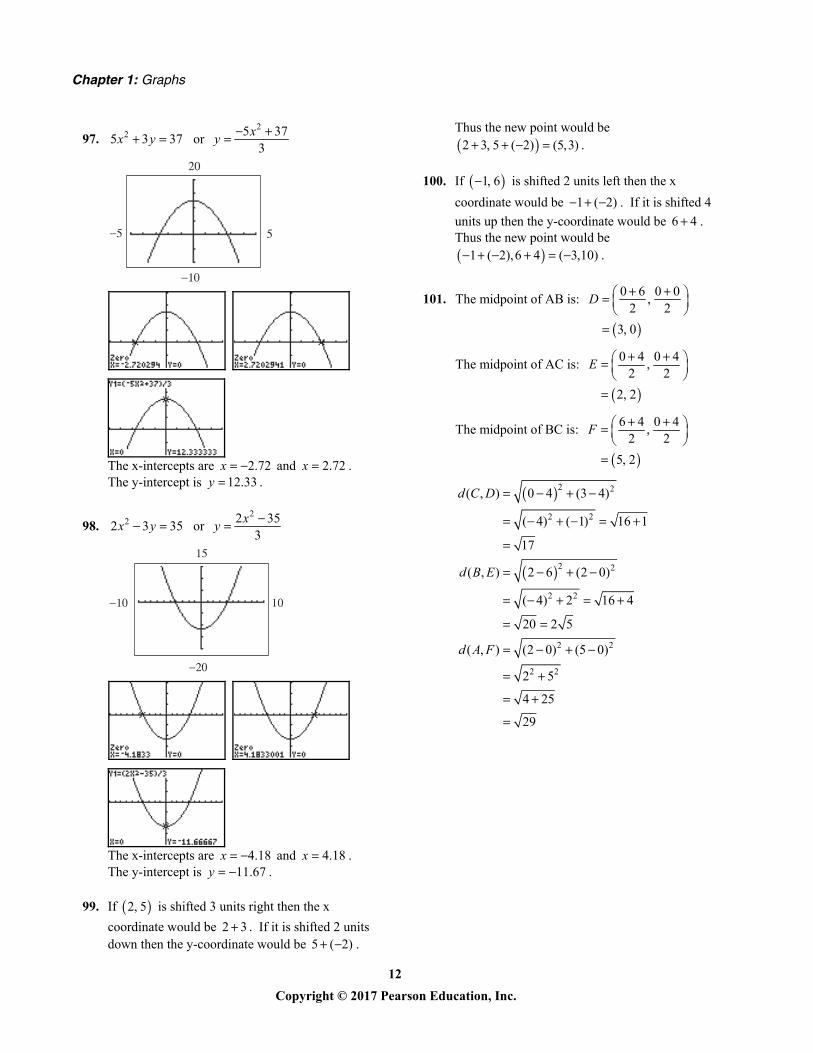
97. 2
2 5 375 3 37 or
3xx y y
The x-intercepts are 2.72x and 2.72x . The y-intercept is 12.33y .
98. 2
2 2 352 3 35 or
3xx y y
The x-intercepts are 4.18x and 4.18x . The y-intercept is 11.67y .
99. If 2, 5 is shifted 3 units right then the x
coordinate would be 2 3 . If it is shifted 2 units down then the y-coordinate would be 5 ( 2) .
Thus the new point would be
2 3, 5 ( 2) (5,3) .
100. If 1, 6 is shifted 2 units left then the x
coordinate would be 1 ( 2) . If it is shifted 4
units up then the y-coordinate would be 6 4 . Thus the new point would be
1 ( 2),6 4 ( 3,10) .
101. The midpoint of AB is:
0 6 0 0,
2 2
3, 0
D
The midpoint of AC is:
0 4 0 4,
2 2
2, 2
E
The midpoint of BC is:
6 4 0 4,
2 2
5, 2
F
2 2
2 2
2 2
2 2
2 2
2 2
( , ) 0 4 (3 4)
( 4) ( 1) 16 1
17
( , ) 2 6 (2 0)
( 4) 2 16 4
20 2 5
( , ) (2 0) (5 0)
2 5
4 25
29
d C D
d B E
d A F
Section 1.1: The Distance and Midpoint Formulas; Graphing Utilities; Introduction to Graphing Equations
13 Copyright © 2017 Pearson Education, Inc.
102. Let 1 2(0, 0), (0, 4), ( , )P P P x y
2 21 2
2 21
2 2
2 2
2 22
2 2
2 2
, (0 0) (4 0)
16 4
, ( 0) ( 0)
4
16
, ( 0) ( 4)
( 4) 4
( 4) 16
d P P
d P P x y
x y
x y
d P P x y
x y
x y
Therefore,
22
2 2
4
8 16
8 16
2
y y
y y yyy
which gives 2 2
2
2 16
12
2 3
x
x
x
Two triangles are possible. The third vertex is
2 3, 2 or 2 3, 2 .
103. 2 21 2
2 2
( , ) ( 4 2) (1 1)
( 6) 0
36
6
d P P
2 22 3
2 2
( , ) 4 ( 4) ( 3 1)
0 ( 4)
16
4
d P P
2 21 3
2 2
( , ) ( 4 2) ( 3 1)
( 6) ( 4)
36 16
52
2 13
d P P
Since 2 221 2 2 3 1 3( , ) ( , ) ( , )d P P d P P d P P ,
the triangle is a right triangle.
104. 2 21 2
2 2
( , ) 6 ( 1) (2 4)
7 ( 2)
49 4
53
d P P
2 22 3
2 2
( , ) 4 6 ( 5 2)
( 2) ( 7)
4 49
53
d P P
2 21 3
2 2
( , ) 4 ( 1) ( 5 4)
5 ( 9)
25 81
106
d P P
Since 2 221 2 2 3 1 3( , ) ( , ) ( , )d P P d P P d P P ,
the triangle is a right triangle.
Since 1 2 2 3, ,d P P d P P , the triangle is
isosceles. Therefore, the triangle is an isosceles right
triangle.
105. 2 21 2
2 2
( , ) 0 ( 2) 7 ( 1)
2 8 4 64 68
2 17
d P P
2 22 3
2 2
( , ) 3 0 (2 7)
3 ( 5) 9 25
34
d P P
2 21 3
2 2
( , ) 3 ( 2) 2 ( 1)
5 3 25 9
34
d P P
Since 2 3 1 3( , ) ( , )d P P d P P , the triangle is
isosceles.
Since 2 2 21 3 2 3 1 2( , ) ( , ) ( , )d P P d P P d P P ,
the triangle is also a right triangle. Therefore, the triangle is an isosceles right
triangle.
Chapter 1: Graphs
14 Copyright © 2017 Pearson Education, Inc.
106. 2 21 2
2 2
( , ) 4 7 0 2
( 11) ( 2)
121 4 125
5 5
d P P
2 22 3
2 2
( , ) 4 ( 4) (6 0)
8 6 64 36
100
10
d P P
2 21 3
2 2
( , ) 4 7 6 2
( 3) 4 9 16
25
5
d P P
Since 2 2 21 3 2 3 1 2( , ) ( , ) ( , )d P P d P P d P P ,
the triangle is a right triangle.
107. Let the coordinates of point B be ,x y . Using
the midpoint formula, we can write
1 82,3 ,
2 2
x y
.
This leads to two equations we can solve. 1
22
1 4
5
x
xx
8
32
8 6
2
y
yy
Point B has coordinates 5, 2 .
108. Let the coordinates of point B be ,x y . Using
the midpoint formula, we can write
7 25, 4 ,
2 2
x y .
This leads to two equations we can solve. 7
52
7 10
3
x
xx
2
42
2 8
6
y
yy
Point B has coordinates 5, 2 .
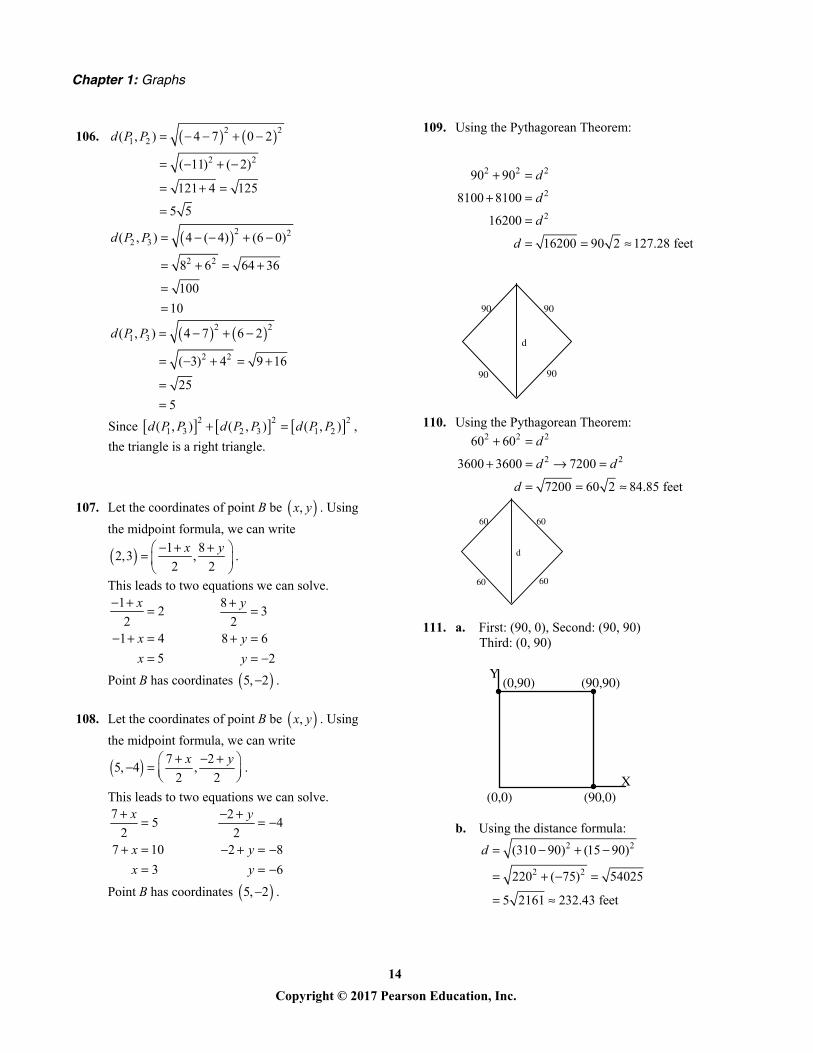
109. Using the Pythagorean Theorem:
2 2 2
2
2
90 90
8100 8100
16200
16200 90 2 127.28 feet
d
d
d
d
90
9090
90
d
110. Using the Pythagorean Theorem: 2 2 2
2 2
60 60
3600 3600 7200
7200 60 2 84.85 feet
d
d d
d
60
6060
60
d
111. a. First: (90, 0), Second: (90, 90) Third: (0, 90)
(0,0)
(0,90)
(90,0)
(90,90)
X
Y
b. Using the distance formula: 2 2
2 2
(310 90) (15 90)
220 ( 75) 54025
5 2161 232.43 feet
d
Section 1.1: The Distance and Midpoint Formulas; Graphing Utilities; Introduction to Graphing Equations
15 Copyright © 2017 Pearson Education, Inc.
c. Using the distance formula: 2 2
2 2
(300 0) (300 90)
300 210 134100
30 149 366.20 feet
d
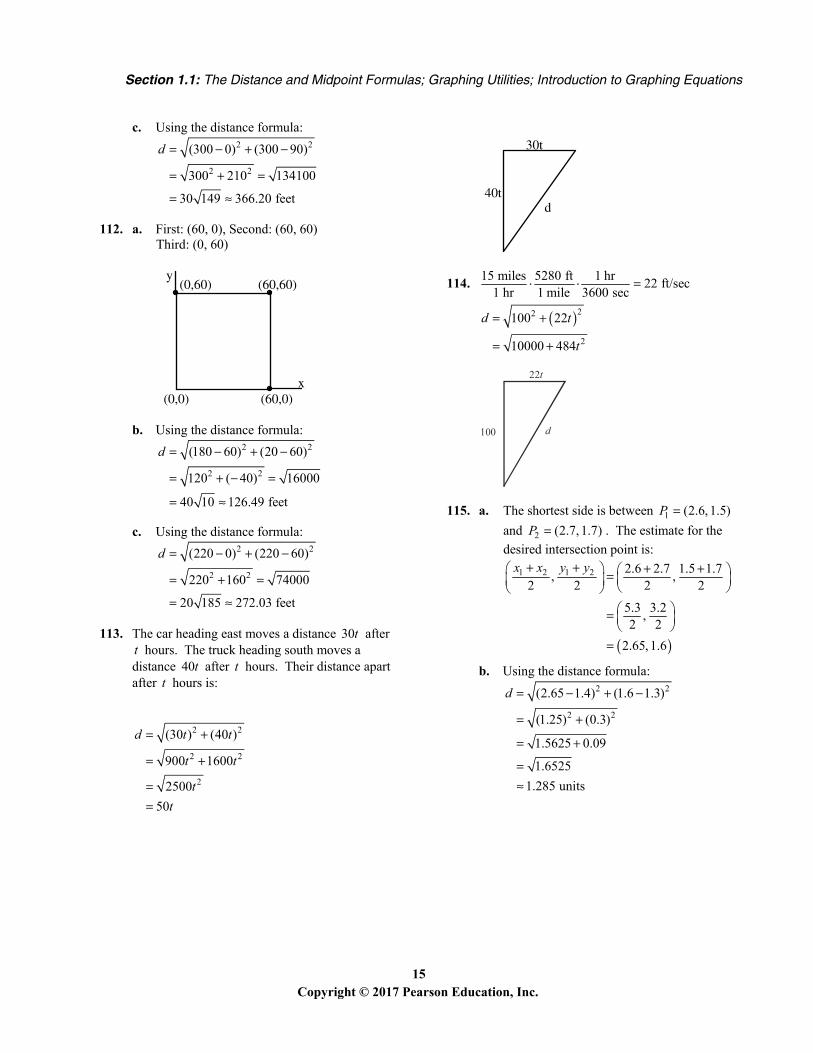
112. a. First: (60, 0), Second: (60, 60) Third: (0, 60)
(0,0)
(0,60)
(60,0)
(60,60)
x
y
b. Using the distance formula: 2 2
2 2
(180 60) (20 60)
120 ( 40) 16000
40 10 126.49 feet
d
c. Using the distance formula: 2 2
2 2
(220 0) (220 60)
220 160 74000
20 185 272.03 feet
d
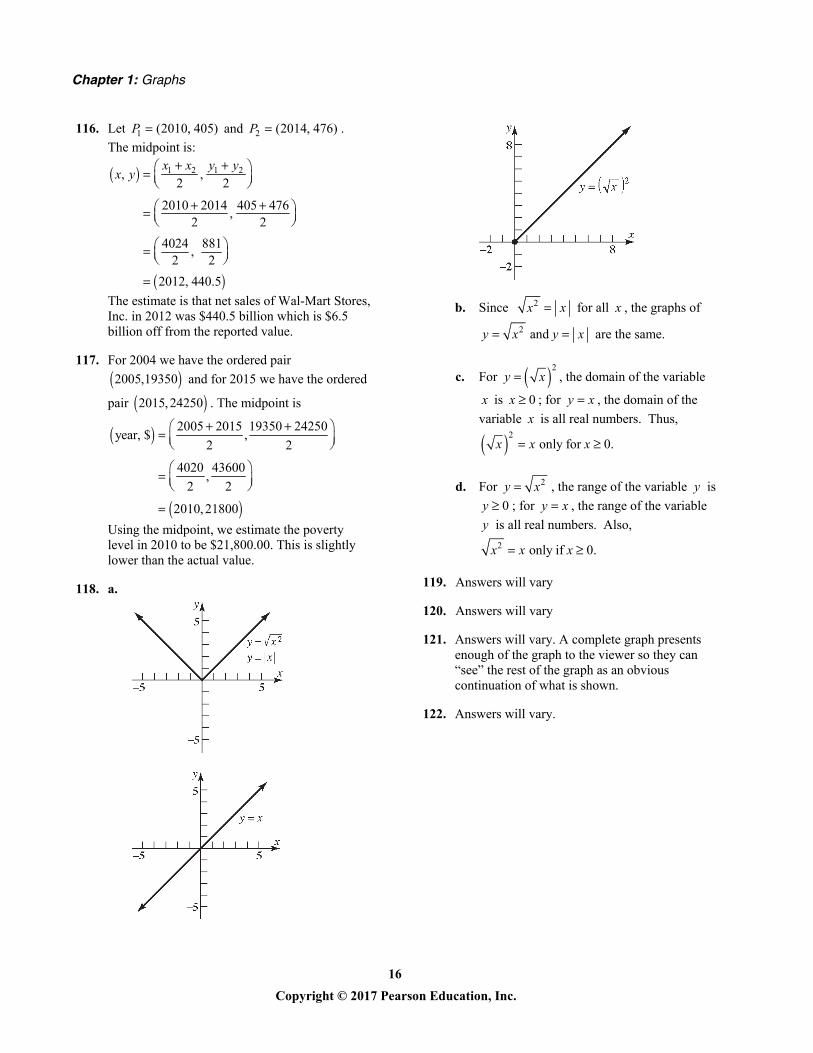
113. The car heading east moves a distance 30t after t hours. The truck heading south moves a distance 40t after t hours. Their distance apart after t hours is:
2 2
2 2
2
(30 ) (40 )
900 1600
2500
50
d t t
t t
tt
d40t
30t
114. 15 miles 5280 ft 1 hr22 ft/sec
1 hr 1 mile 3600 sec
22
2
100 22
10000 484
d t
t
100
22t
d
115. a. The shortest side is between 1 (2.6, 1.5)P
and 2 (2.7, 1.7)P . The estimate for the
desired intersection point is:
1 2 1 2 2.6 2.7 1.5 1.7, ,
2 2 2 2
5.3 3.2,
2 2
2.65, 1.6
x x y y
b. Using the distance formula: 2 2
2 2
(2.65 1.4) (1.6 1.3)
(1.25) (0.3)
1.5625 0.09
1.6525
1.285 units
d
Chapter 1: Graphs
16 Copyright © 2017 Pearson Education, Inc.
116. Let 1 (2010, 405)P and 2 (2014, 476)P .
The midpoint is:
1 2 1 2, ,2 2
2010 2014 405 476,
2 2
4024 881,
2 2
2012, 440.5
x x y yx y
The estimate is that net sales of Wal-Mart Stores, Inc. in 2012 was $440.5 billion which is $6.5 billion off from the reported value.
117. For 2004 we have the ordered pair
2005,19350 and for 2015 we have the ordered
pair 2015, 24250 . The midpoint is
2005 2015 19350 24250year, $ ,
2 2
4020 43600,
2 2
2010, 21800
Using the midpoint, we estimate the poverty level in 2010 to be $21,800.00. This is slightly lower than the actual value.
118. a.
b. Since 2x x for all x , the graphs of
2 and y x y x are the same.
c. For 2y x , the domain of the variable
x is 0x ; for y x , the domain of the
variable x is all real numbers. Thus,
2 only for 0.x x x
d. For 2y x , the range of the variable y is
0y ; for y x , the range of the variable
y is all real numbers. Also,
2 only if 0.x x x
119. Answers will vary
120. Answers will vary
121. Answers will vary. A complete graph presents enough of the graph to the viewer so they can “see” the rest of the graph as an obvious continuation of what is shown.
122. Answers will vary.
Section 1.2: Intercepts; Symmetry; Graphing Key Equations
17 Copyright © 2017 Pearson Education, Inc.
Section 1.2
1. 2( 3) 1 7
2 6 1 7
2 5 7
2 12
6
xxxxx
The solution set is 6
2.
2 4 12 0
6 2 0
x xx x
6 0
6
xx
or 2 0
2
xx
The solution set is 2,6 .
3. intercepts
4. y-axis
5. 4
6. 3,4
7. True
8. False; a graph can be symmetric with respect to both coordinate axes (in such cases it will also be symmetric with respect to the origin).
For example: 2 2 1x y
9. a
10. c
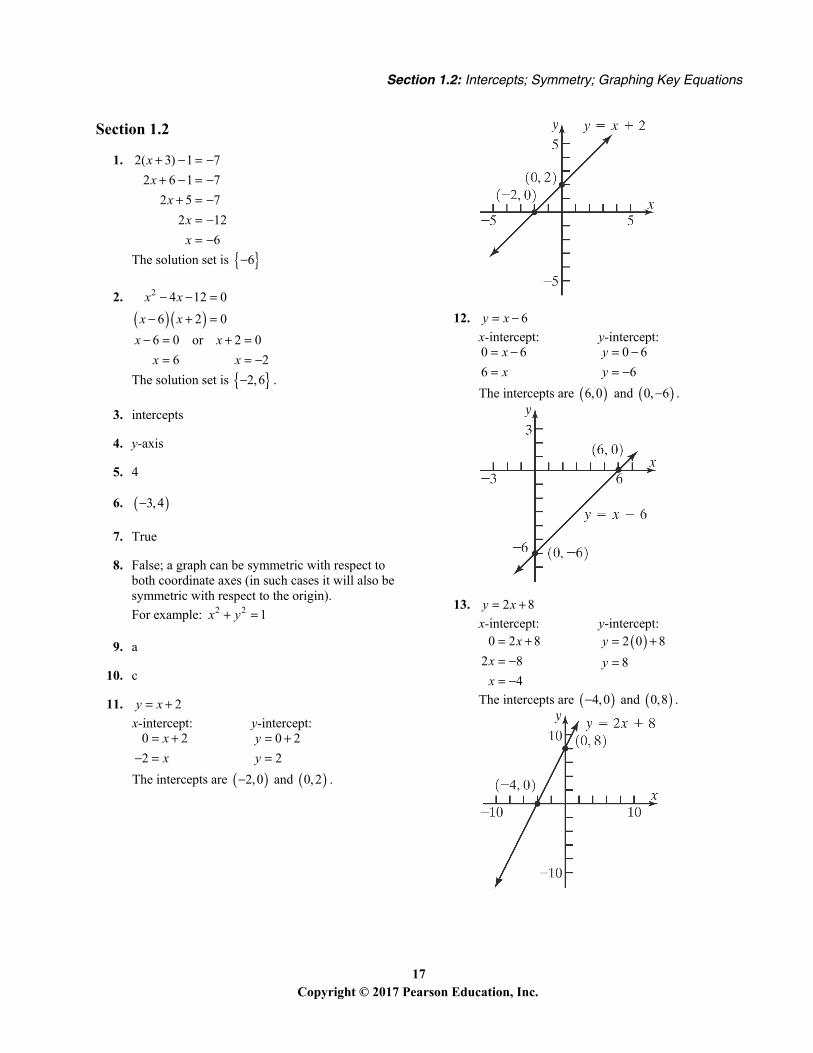
11. 2y x x-intercept: y-intercept:
0 2
2
xx
0 2
2
yy
The intercepts are 2,0 and 0, 2 .
12. 6y x x-intercept: y-intercept: 0 6
6
xx
0 6
6
yy
The intercepts are 6,0 and 0, 6 .
13. 2 8y x x-intercept: y-intercept:
0 2 8
2 8
4
xxx
2 0 8
8
yy
The intercepts are 4,0 and 0,8 .
Chapter 1: Graphs
18 Copyright © 2017 Pearson Education, Inc.
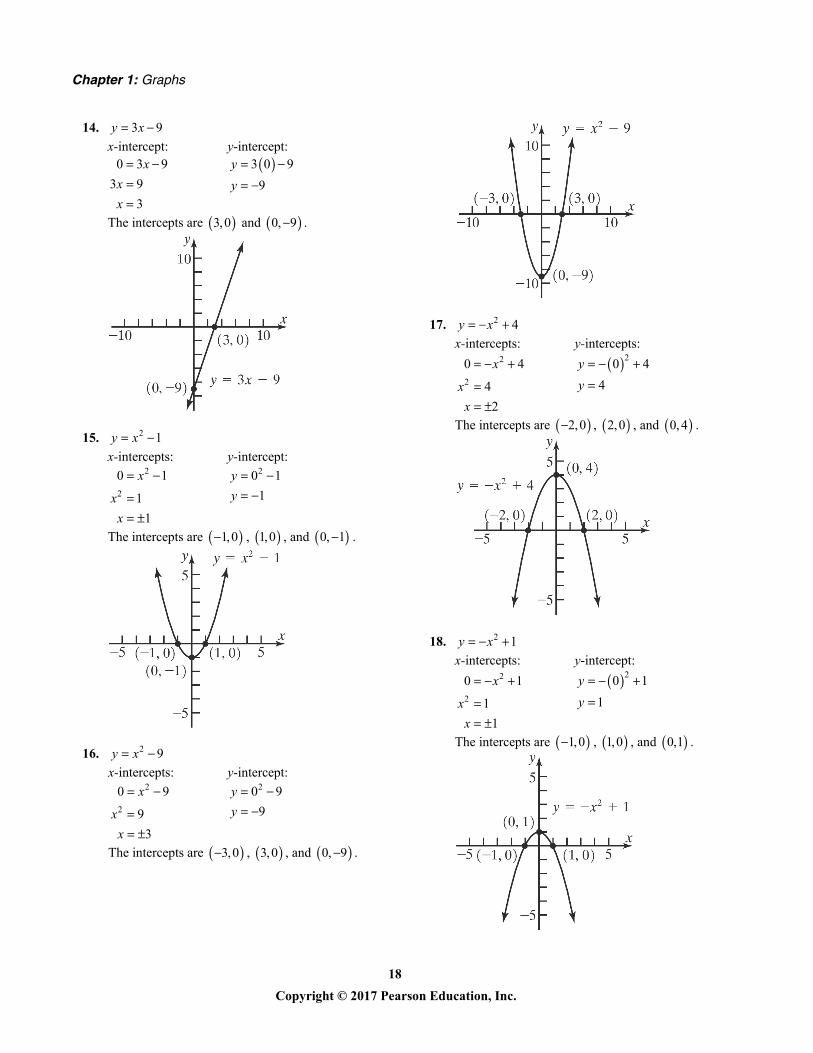
14. 3 9y x x-intercept: y-intercept:
0 3 9
3 9
3
xxx
3 0 9
9
yy
The intercepts are 3,0 and 0, 9 .
15. 2 1y x x-intercepts: y-intercept:
2
2
0 1
1
1
x
xx
20 1
1
yy
The intercepts are 1,0 , 1,0 , and 0, 1 .
16. 2 9y x x-intercepts: y-intercept:
2
2
0 9
9
3
x
xx
20 9
9
yy
The intercepts are 3,0 , 3,0 , and 0, 9 .
17. 2 4y x x-intercepts: y-intercepts:
2
2
0 4
4
2
x
xx
20 4
4
yy
The intercepts are 2,0 , 2,0 , and 0, 4 .
18. 2 1y x x-intercepts: y-intercept:
2
2
0 1
1
1
x
xx
20 1
1
yy
The intercepts are 1,0 , 1,0 , and 0,1 .
Section 1.2: Intercepts; Symmetry; Graphing Key Equations
19 Copyright © 2017 Pearson Education, Inc.
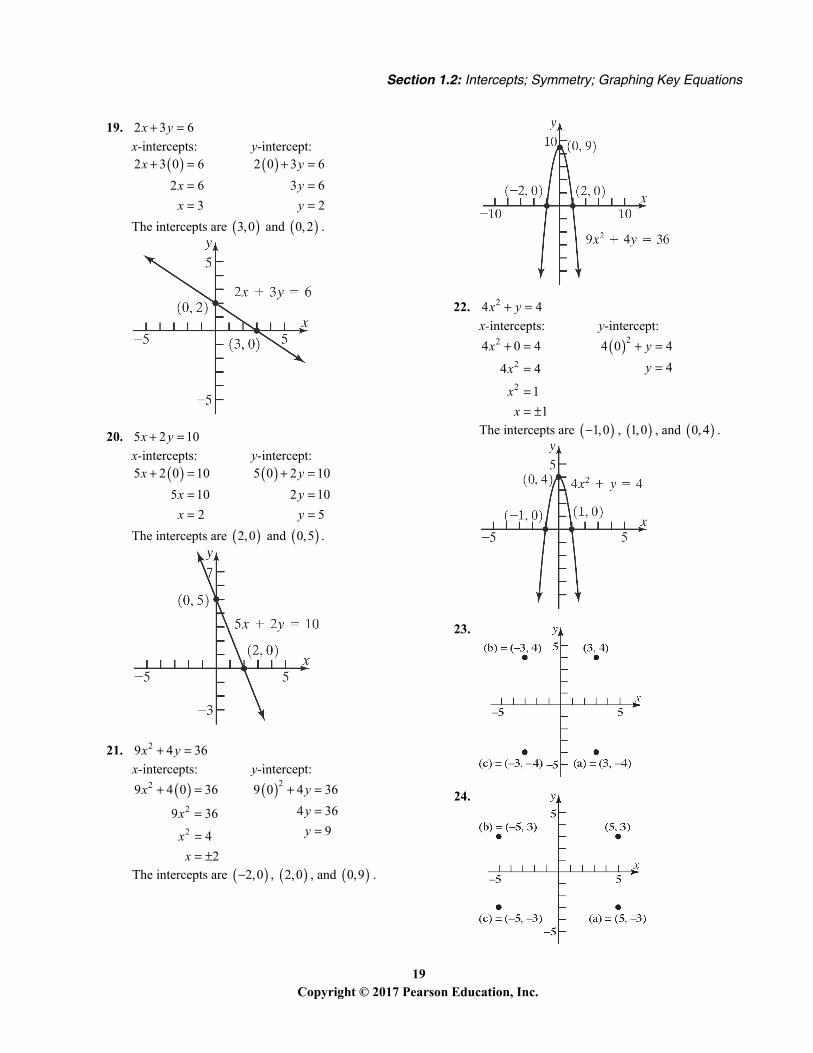
19. 2 3 6x y x-intercepts: y-intercept:
2 3 0 6
2 6
3
xxx
2 0 3 6
3 6
2
yyy
The intercepts are 3,0 and 0, 2 .
20. 5 2 10x y x-intercepts: y-intercept:
5 2 0 10
5 10
2
xxx
5 0 2 10
2 10
5
yyy
The intercepts are 2,0 and 0,5 .
21. 29 4 36x y x-intercepts: y-intercept:
2
2
2
9 4 0 36
9 36
4
2
x
x
xx
29 0 4 36
4 36
9
yyy
The intercepts are 2,0 , 2,0 , and 0,9 .
22. 24 4x y x-intercepts: y-intercept:
2
2
2
4 0 4
4 4
1
1
x
x
xx
24 0 4
4
yy
The intercepts are 1,0 , 1,0 , and 0, 4 .
23.
24.
Chapter 1: Graphs
20 Copyright © 2017 Pearson Education, Inc.
25.
26.
27.
5
5
y
55
(a) = (5, 2)
(b) = ( 5, 2)
(c) = ( 5, 2)
28.
29.
30.
31.
32.
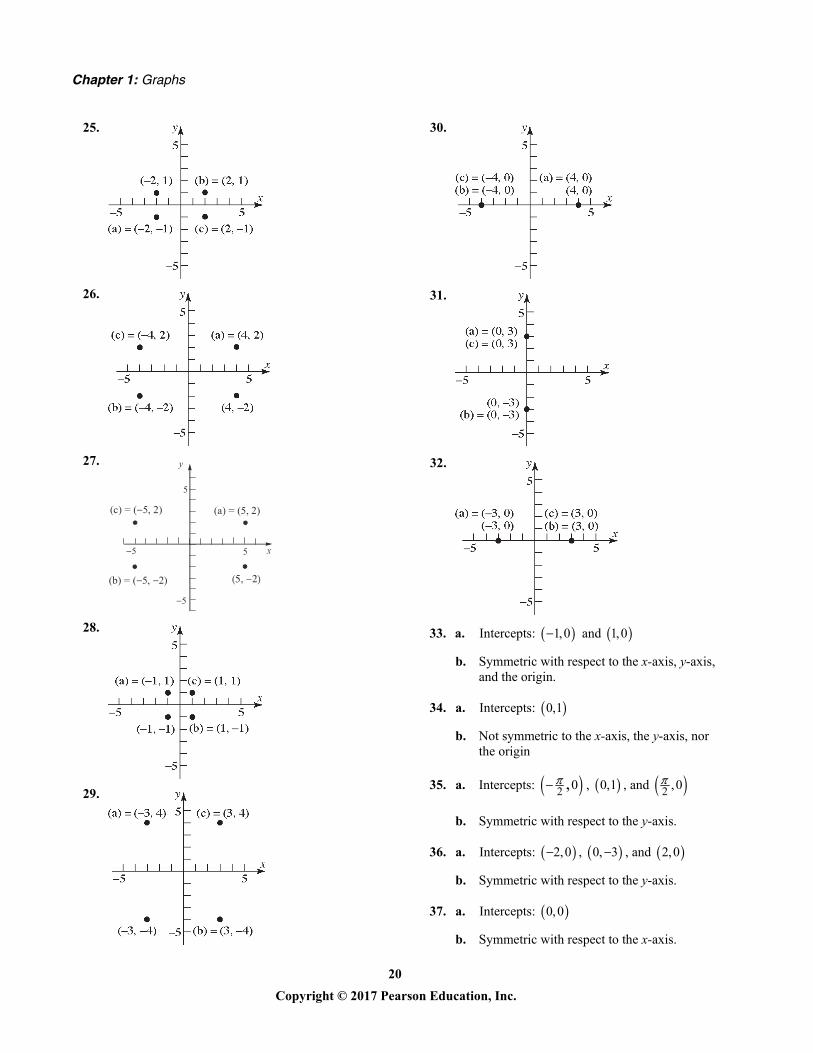
33. a. Intercepts: 1,0 and 1,0
b. Symmetric with respect to the x-axis, y-axis, and the origin.
34. a. Intercepts: 0,1
b. Not symmetric to the x-axis, the y-axis, nor the origin
35. a. Intercepts: 2 0, , 0,1 , and 2 ,0
b. Symmetric with respect to the y-axis.
36. a. Intercepts: 2,0 , 0, 3 , and 2,0
b. Symmetric with respect to the y-axis.
37. a. Intercepts: 0,0
b. Symmetric with respect to the x-axis.
Section 1.2: Intercepts; Symmetry; Graphing Key Equations
21 Copyright © 2017 Pearson Education, Inc.
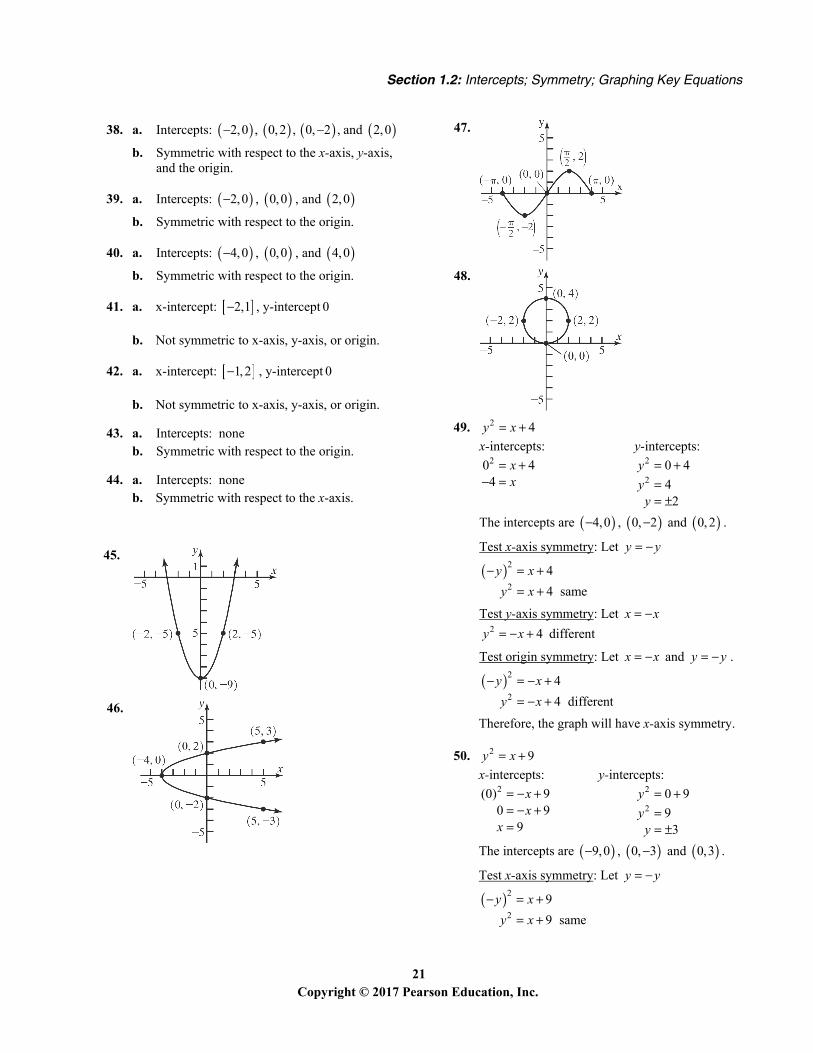
38. a. Intercepts: 2,0 , 0,2 , 0, 2 , and 2,0
b. Symmetric with respect to the x-axis, y-axis, and the origin.
39. a. Intercepts: 2,0 , 0,0 , and 2,0
b. Symmetric with respect to the origin.
40. a. Intercepts: 4,0 , 0,0 , and 4,0
b. Symmetric with respect to the origin.
41. a. x-intercept: 2,1 , y-intercept 0
b. Not symmetric to x-axis, y-axis, or origin.
42. a. x-intercept: 1,2 , y-intercept 0
b. Not symmetric to x-axis, y-axis, or origin.
43. a. Intercepts: none b. Symmetric with respect to the origin.
44. a. Intercepts: none b. Symmetric with respect to the x-axis.
45.
46.
47.
48.
49. 2 4y x x-intercepts: y-intercepts:
20 44
xx
2
2
0 4
42
yyy
The intercepts are 4,0 , 0, 2 and 0, 2 .
Test x-axis symmetry: Let y y
2
2
4
4 same
y xy x
Test y-axis symmetry: Let x x 2 4y x different
Test origin symmetry: Let x x and y y .
2
2
4
4 different
y xy x
Therefore, the graph will have x-axis symmetry.
50. 2 9y x x-intercepts: y-intercepts:
2(0) 90 9
9
xx
x
2
2
0 9
93
yyy
The intercepts are 9,0 , 0, 3 and 0,3 .
Test x-axis symmetry: Let y y
2
2
9
9 same
y xy x
Chapter 1: Graphs
22 Copyright © 2017 Pearson Education, Inc.
Test y-axis symmetry: Let x x 2 9y x different
Test origin symmetry: Let x x and y y .
2
2
9
9 different
y xy x
Therefore, the graph will have x-axis symmetry.
51. 3y x x-intercepts: y-intercepts:
30
0
xx
3 0 0y
The only intercept is 0,0 .
Test x-axis symmetry: Let y y 3 differenty x
Test y-axis symmetry: Let x x 3 3 differenty x x
Test origin symmetry: Let x x and y y 3 3
3 same
y x x
y x
Therefore, the graph will have origin symmetry.
52. 5y x x-intercepts: y-intercepts:
30
0
xx
5 0 0y
The only intercept is 0,0 .
Test x-axis symmetry: Let y y 5 differenty x
Test y-axis symmetry: Let x x 5 5 differenty x x
Test origin symmetry: Let x x and y y 5 5
5 same
y x x
y x
Therefore, the graph will have origin symmetry.
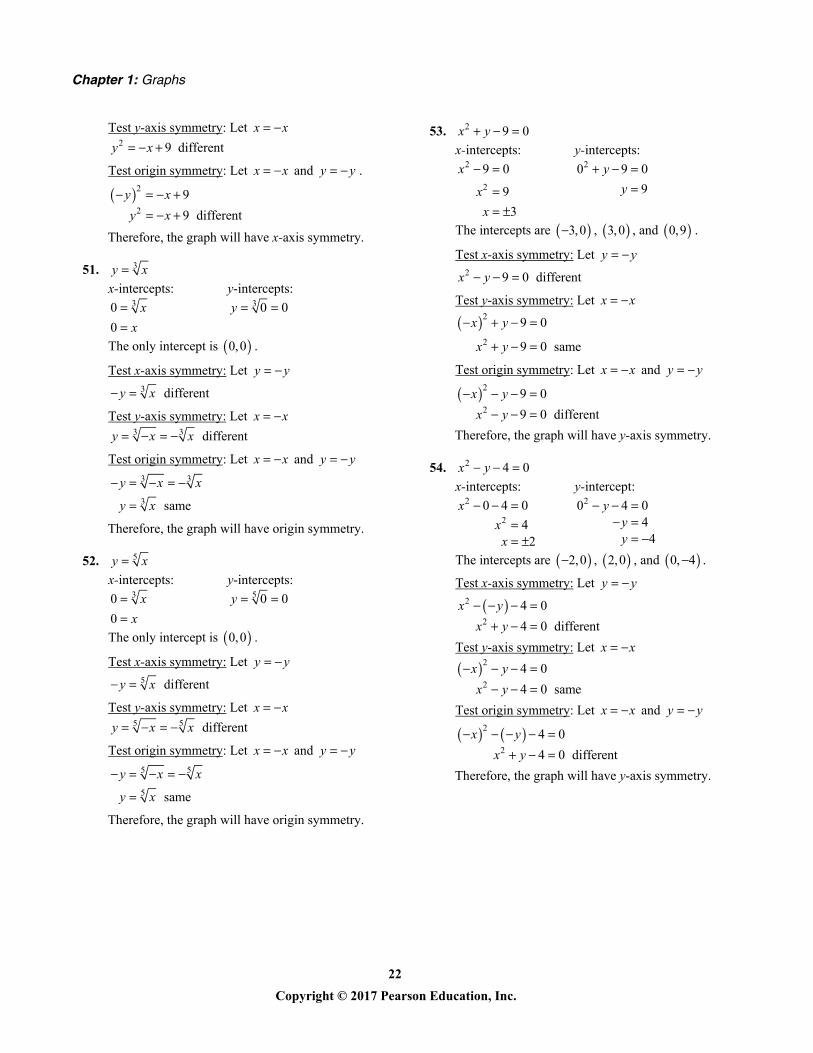
53. 2 9 0x y x-intercepts: y-intercepts:
2
2
9 0
9
3
x
xx
20 9 0
9
yy
The intercepts are 3,0 , 3,0 , and 0,9 .
Test x-axis symmetry: Let y y 2 9 0 differentx y
Test y-axis symmetry: Let x x
2
2
9 0
9 0 same
x y
x y
Test origin symmetry: Let x x and y y
2
2
9 0
9 0 different
x yx y
Therefore, the graph will have y-axis symmetry.
54. 2 4 0x y x-intercepts: y-intercept:
2
2
0 4 0
42
xxx
20 4 04
4
yyy
The intercepts are 2,0 , 2,0 , and 0, 4 .
Test x-axis symmetry: Let y y
2
2
4 0
4 0 different
x yx y
Test y-axis symmetry: Let x x
2
2
4 0
4 0 same
x yx y
Test origin symmetry: Let x x and y y
2
2
4 0
4 0 different
x yx y
Therefore, the graph will have y-axis symmetry.
Section 1.2: Intercepts; Symmetry; Graphing Key Equations
23 Copyright © 2017 Pearson Education, Inc.
55. 2 29 4 36x y x-intercepts: y-intercepts:
22
2
2
9 4 0 36
9 36
42
xxxx
2 2
2
2
9 0 4 36
4 36
93
yyyy
The intercepts are 2,0 , 2,0 , 0, 3 , and
0,3 .
Test x-axis symmetry: Let y y
22
2 2
9 4 36
9 4 36 same
x yx y
Test y-axis symmetry: Let x x
2 2
2 2
9 4 36
9 4 36 same
x yx y
Test origin symmetry: Let x x and y y
2 2
2 2
9 4 36
9 4 36 same
x yx y
Therefore, the graph will have x-axis, y-axis, and origin symmetry.
56. 2 24 4x y x-intercepts: y-intercepts:
2 2
2
2
4 0 4
4 4
1
1
x
x
xx
2 2
2
4 0 4
4
2
y
yy
The intercepts are 1,0 , 1,0 , 0, 2 , and
0, 2 .
Test x-axis symmetry: Let y y
22
2 2
4 4
4 4 same
x y
x y
Test y-axis symmetry: Let x x
2 2
2 2
4 4
4 4 same
x y
x y
Test origin symmetry: Let x x and y y
2 2
2 2
4 4
4 4 same
x y
x y
Therefore, the graph will have x-axis, y-axis, and origin symmetry.
57. 3 27y x x-intercepts: y-intercepts:
3
3
0 27
27
3
x
xx
30 27
27
yy
The intercepts are 3,0 and 0, 27 .
Test x-axis symmetry: Let y y 3 27 differenty x
Test y-axis symmetry: Let x x
33
27
27 different
y x
y x
Test origin symmetry: Let x x and y y
33
27
27 different
y x
y x
Therefore, the graph has none of the indicated symmetries.
58. 4 1y x x-intercepts: y-intercepts:
4
4
0 1
1
1
x
xx
40 1
1
yy
The intercepts are 1,0 , 1,0 , and 0, 1 .
Test x-axis symmetry: Let y y 4 1 differenty x
Test y-axis symmetry: Let x x
4
4
1
1 same
y x
y x
Test origin symmetry: Let x x and y y
4
4
1
1 different
y x
y x
Therefore, the graph will have y-axis symmetry.
Chapter 1: Graphs
24 Copyright © 2017 Pearson Education, Inc.
59. 2 3 4y x x x-intercepts: y-intercepts:
20 3 4
0 4 1
4 or 1
x xx x
x x
20 3 0 4
4
yy
The intercepts are 4,0 , 1,0 , and 0, 4 .
Test x-axis symmetry: Let y y 2 3 4 differenty x x
Test y-axis symmetry: Let x x
2
2
3 4
3 4 different
y x x
y x x
Test origin symmetry: Let x x and y y
2
2
3 4
3 4 different
y x x
y x x
Therefore, the graph has none of the indicated symmetries.
60. 2 4y x x-intercepts: y-intercepts:
2
2
0 4
4
no real solution
x
x
20 4
4
yy
The only intercept is 0,4 .
Test x-axis symmetry: Let y y 2 4 differenty x
Test y-axis symmetry: Let x x
2
2
4
4 same
y x
y x
Test origin symmetry: Let x x and y y
2
2
4
4 different
y x
y x
Therefore, the graph will have y-axis symmetry.
61. 2
3
9
xyx
x-intercepts: y-intercepts:
2
30
93 0
0
xx
xx
2
3 0 00
90 9y
The only intercept is 0,0 .
Test x-axis symmetry: Let y y
2
3 different
9
xyx
Test y-axis symmetry: Let x x
2
2
3
9
3 different
9
xy
xxy
x
Test origin symmetry: Let x x and y y
2
2
2
3
9
3
93
same9
xy
xxy
xxy
x
Therefore, the graph has origin symmetry.
62. 2 4
2
xyx
x-intercepts: y-intercepts: 2
2
2
40
2
4 0
4
2
xx
x
xx
20 4 4
2 0 0
undefined
y
The intercepts are 2,0 and 2,0 .
Test x-axis symmetry: Let y y 2 4
different2
xyx
Test y-axis symmetry: Let x x
2
2
4
2
4 different
2
xy
x
xyx
Section 1.2: Intercepts; Symmetry; Graphing Key Equations
25 Copyright © 2017 Pearson Education, Inc.
Test origin symmetry: Let x x and y y
2
2
2
4
2
4
2
4 same
2
xy
x
xyx
xyx
Therefore, the graph has origin symmetry.
63. 3
2 9
xyx
x-intercepts: y-intercepts: 3
2
3
09
0
0
xx
xx
3
2
0 00
90 9y
The only intercept is 0,0 .
Test x-axis symmetry: Let y y 3
2
3
2
9
different9
xyxxyx
Test y-axis symmetry: Let x x
3
2
3
2
9
different9
xy
x
xyx
Test origin symmetry: Let x x and y y
3
2
3
2
3
2
9
9
same9
xy
x
xyxxy
x
Therefore, the graph has origin symmetry.
64. 4
5
1
2
xyx
x-intercepts: y-intercepts:
4
5
4
10
2
1
xx
x
4
5
0 1 1
02 0
undefined
y
no real solution
There are no intercepts for the graph of this equation.
Test x-axis symmetry: Let y y 4
5
1 different
2
xyx
Test y-axis symmetry: Let x x
4
5
4
5
1
2
1 different
2
xy
x
xyx
Test origin symmetry: Let x x and y y
4
5
4
5
4
5
1
2
1
2
1 same
2
xy
x
xyx
xyx
Therefore, the graph has origin symmetry.
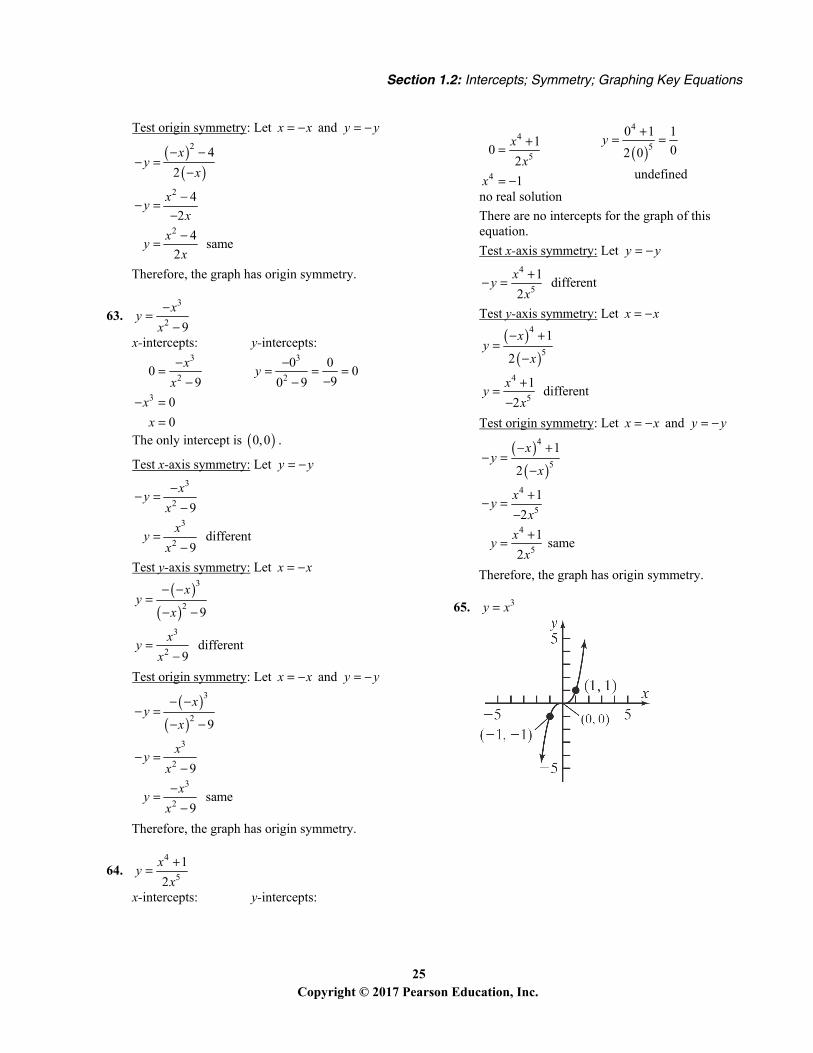
65. 3y x
Chapter 1: Graphs
26 Copyright © 2017 Pearson Education, Inc.
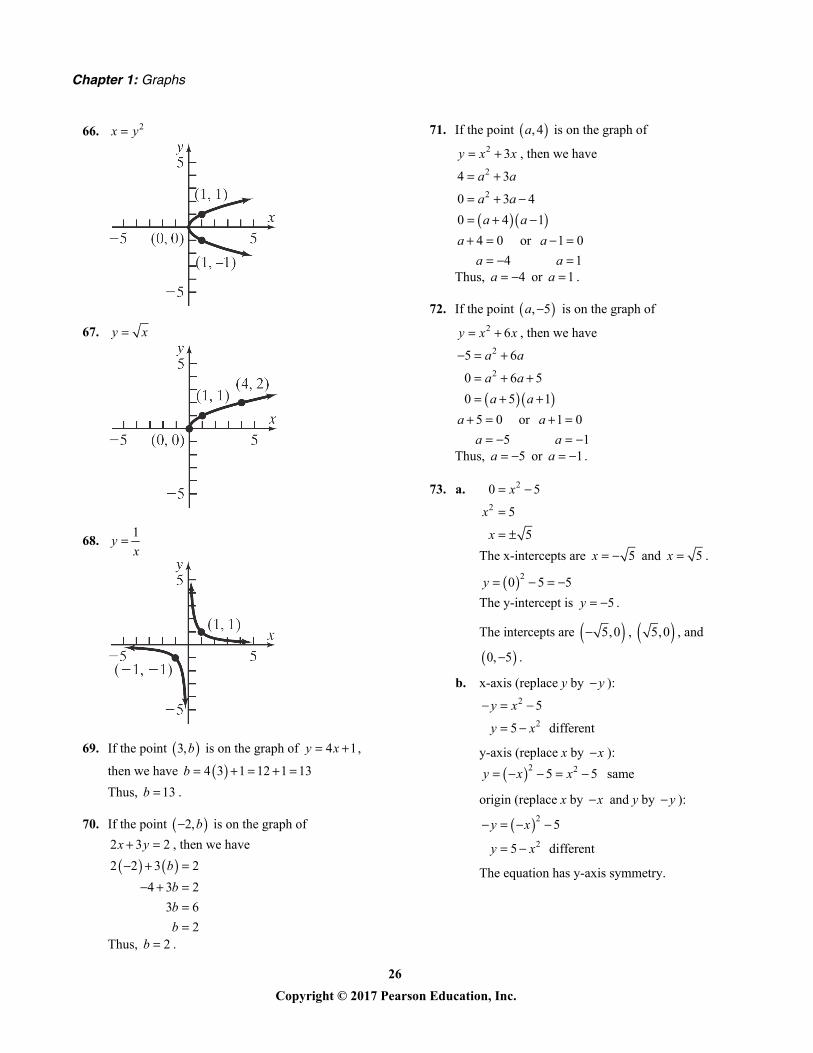
66. 2x y
67. y x
68. 1yx
69. If the point 3,b is on the graph of 4 1y x ,
then we have 4 3 1 12 1 13b
Thus, 13b .
70. If the point 2,b is on the graph of
2 3 2x y , then we have
2 2 3 2
4 3 2
3 6
2
bbbb
Thus, 2b .
71. If the point , 4a is on the graph of 2 3y x x , then we have
2
2
4 3
0 3 4
0 4 1
a a
a aa a
4 0
4
aa
or 1 0
1
aa
Thus, 4a or 1a .
72. If the point , 5a is on the graph of 2 6y x x , then we have
2
2
5 6
0 6 5
0 5 1
a a
a aa a
5 0
5
aa
or 1 0
1
aa
Thus, 5a or 1a .
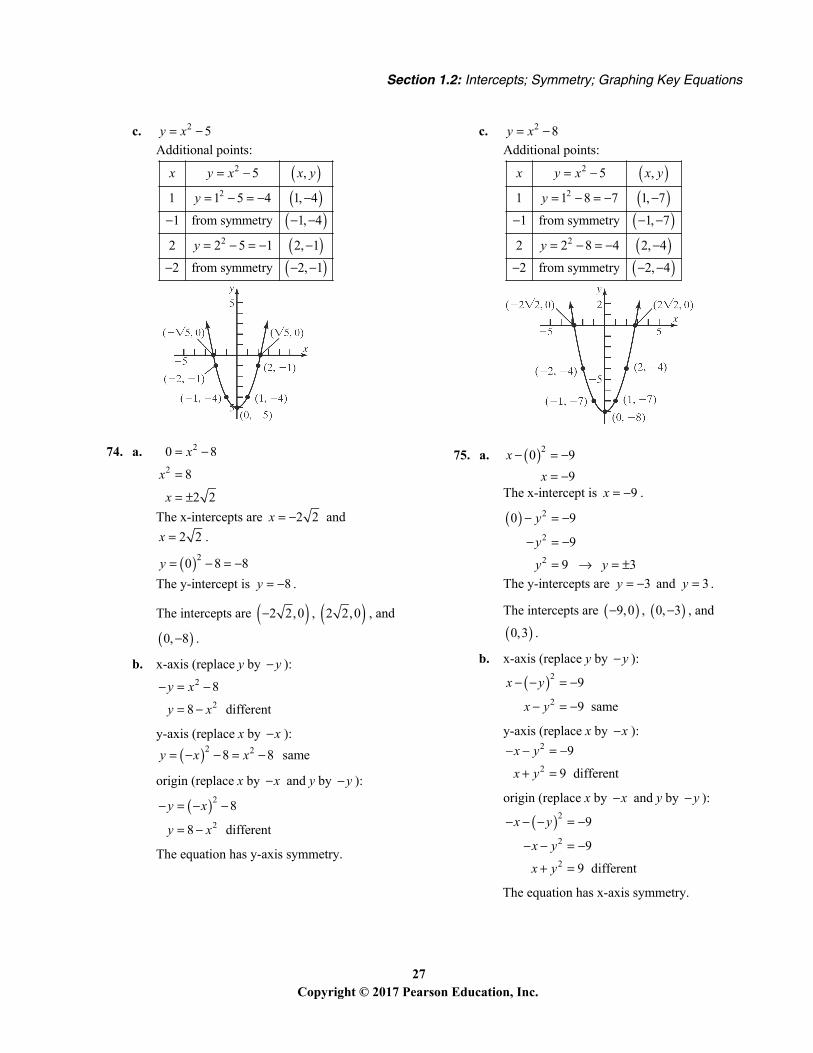
73. a. 2
2
0 5
5
5
x
x
x
The x-intercepts are 5x and 5x .
20 5 5y
The y-intercept is 5y .
The intercepts are 5,0 , 5,0 , and
0, 5 .
b. x-axis (replace y by y ): 2
2
5
5 different
y x
y x
y-axis (replace x by x ):
2 25 5y x x same
origin (replace x by x and y by y ):
2
2
5
5 different
y x
y x
The equation has y-axis symmetry.
Section 1.2: Intercepts; Symmetry; Graphing Key Equations
27 Copyright © 2017 Pearson Education, Inc.
c. 2 5y x
Additional points:
2
2
2
5 ,
1 1 5 4 1, 4
1 from symmetry 1, 4
2 2 5 1 2, 1
2 from symmetry 2, 1
x y x x y
y
y
74. a. 2
2
0 8
8
2 2
x
x
x
The x-intercepts are 2 2x and
2 2x .
20 8 8y
The y-intercept is 8y .
The intercepts are 2 2,0 , 2 2,0 , and
0, 8 .
b. x-axis (replace y by y ): 2
2
8
8 different
y x
y x
y-axis (replace x by x ):
2 28 8y x x same
origin (replace x by x and y by y ):
2
2
8
8 different
y x
y x
The equation has y-axis symmetry.
c. 2 8y x
Additional points:
2
2
2
5 ,
1 1 8 7 1, 7
1 from symmetry 1, 7
2 2 8 4 2, 4
2 from symmetry 2, 4
x y x x y
y
y
75. a. 20 9
9
xx
The x-intercept is 9x .
2
2
2
0 9
9
9 3
y
y
y y
The y-intercepts are 3y and 3y .
The intercepts are 9,0 , 0, 3 , and
0,3 .
b. x-axis (replace y by y ):
2
2
9
9 same
x y
x y
y-axis (replace x by x ): 2
2
9
9 different
x y
x y
origin (replace x by x and y by y ):
2
2
2
9
9
9 different
x y
x y
x y
The equation has x-axis symmetry.
Chapter 1: Graphs
28 Copyright © 2017 Pearson Education, Inc.
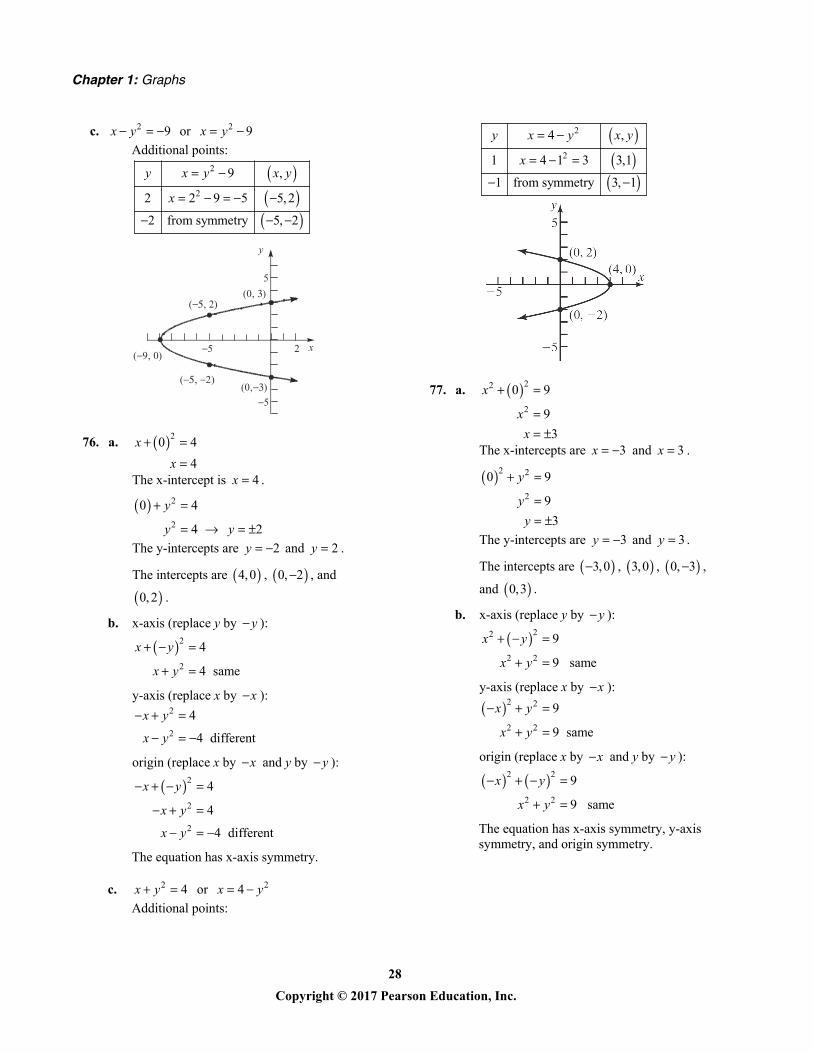
c. 2 9x y or 2 9x y
Additional points:
2
2
9 ,
2 2 9 5 5, 2
2 from symmetry 5, 2
y x y x y
x
y
x( 9, 0)
( , 2)(0, )
( , 2) (0, )
5
5
5 2
76. a. 20 4
4
xx
The x-intercept is 4x .
2
2
0 4
4 2
y
y y
The y-intercepts are 2y and 2y .
The intercepts are 4,0 , 0, 2 , and
0, 2 .
b. x-axis (replace y by y ):
2
2
4
4 same
x y
x y
y-axis (replace x by x ): 2
2
4
4 different
x y
x y
origin (replace x by x and y by y ):
2
2
2
4
4
4 different
x y
x y
x y
The equation has x-axis symmetry.
c. 2 4x y or 24x y
Additional points:
2
2
4 ,
1 4 1 3 3,1
1 from symmetry 3, 1
y x y x y
x
77. a. 22
2
0 9
9
3
x
xx
The x-intercepts are 3x and 3x .
2 2
2
0 9
9
3
y
yy
The y-intercepts are 3y and 3y .
The intercepts are 3,0 , 3,0 , 0, 3 ,
and 0,3 .
b. x-axis (replace y by y ):
22
2 2
9
9 same
x y
x y
y-axis (replace x by x ):
2 2
2 2
9
9 same
x y
x y
origin (replace x by x and y by y ):
2 2
2 2
9
9 same
x y
x y
The equation has x-axis symmetry, y-axis symmetry, and origin symmetry.
Section 1.2: Intercepts; Symmetry; Graphing Key Equations
29 Copyright © 2017 Pearson Education, Inc.
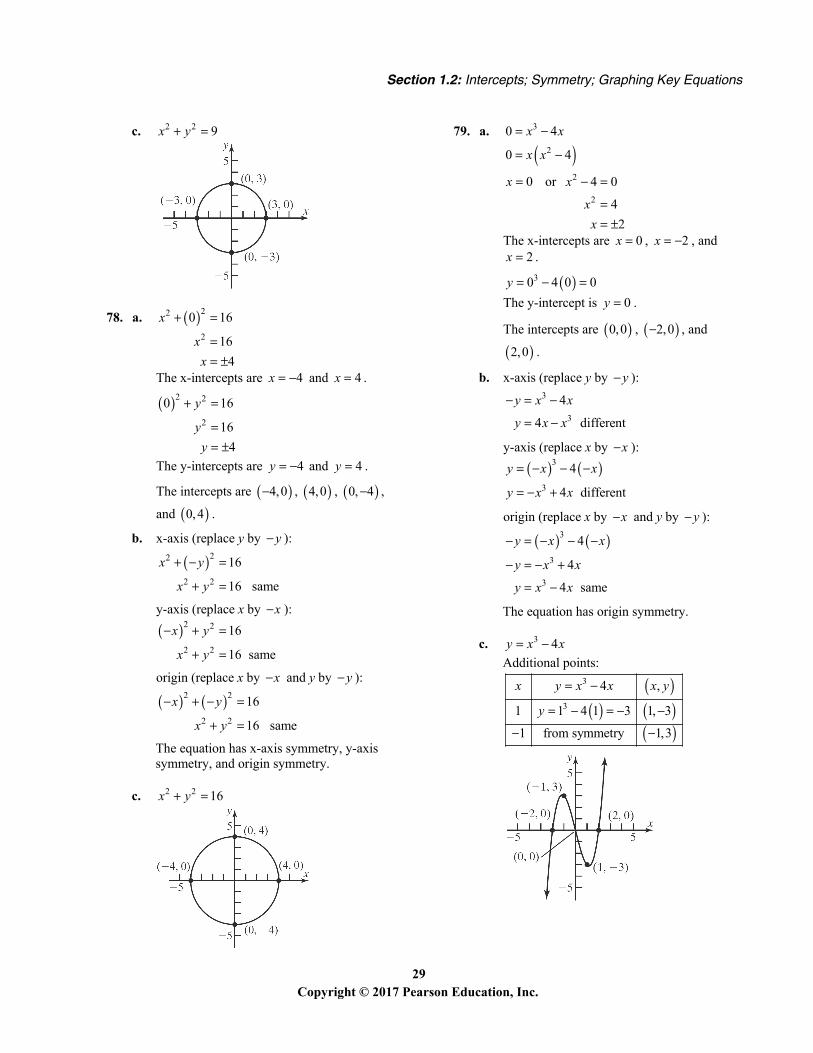
c. 2 2 9x y
78. a. 22
2
0 16
16
4
x
xx
The x-intercepts are 4x and 4x .
2 2
2
0 16
16
4
y
yy
The y-intercepts are 4y and 4y .
The intercepts are 4,0 , 4,0 , 0, 4 ,
and 0, 4 .
b. x-axis (replace y by y ):
22
2 2
16
16 same
x y
x y
y-axis (replace x by x ):
2 2
2 2
16
16 same
x y
x y
origin (replace x by x and y by y ):
2 2
2 2
16
16 same
x y
x y
The equation has x-axis symmetry, y-axis symmetry, and origin symmetry.
c. 2 2 16x y
79. a.
3
2
0 4
0 4
x x
x x
0x or 2
2
4 0
4
2
x
xx
The x-intercepts are 0x , 2x , and 2x .
30 4 0 0y
The y-intercept is 0y .
The intercepts are 0,0 , 2,0 , and
2,0 .
b. x-axis (replace y by y ): 3
3
4
4 different
y x x
y x x
y-axis (replace x by x ):
3
3
4
4 different
y x x
y x x
origin (replace x by x and y by y ):
3
3
3
4
4
4 same
y x x
y x x
y x x
The equation has origin symmetry.
c. 3 4y x x
Additional points:
3
3
4 ,
1 1 4 1 3 1, 3
1 from symmetry 1,3
x y x x x y
y
Chapter 1: Graphs
30 Copyright © 2017 Pearson Education, Inc.
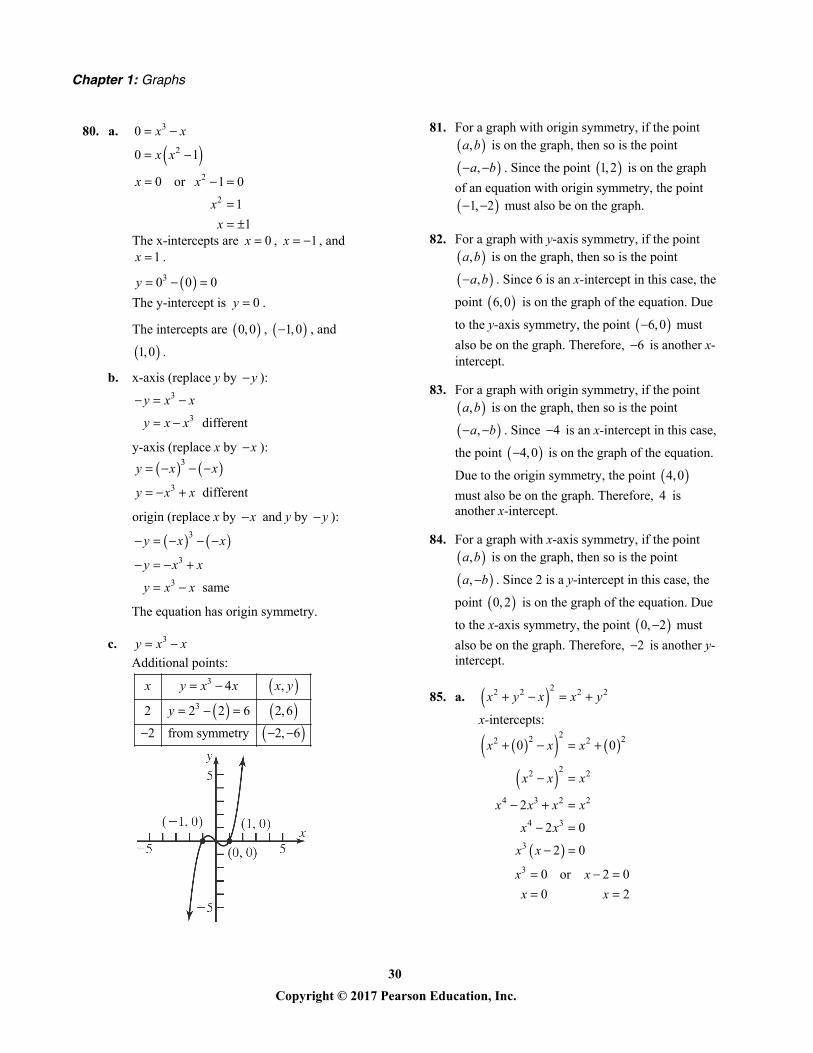
80. a.
3
2
0
0 1
x x
x x
0x or 2
2
1 0
1
1
x
xx
The x-intercepts are 0x , 1x , and 1x .
30 0 0y
The y-intercept is 0y .
The intercepts are 0,0 , 1,0 , and
1,0 .
b. x-axis (replace y by y ): 3
3 different
y x x
y x x
y-axis (replace x by x ):
3
3 different
y x x
y x x
origin (replace x by x and y by y ):
3
3
3 same
y x x
y x x
y x x
The equation has origin symmetry.
c. 3y x x
Additional points:
3
3
4 ,
2 2 2 6 2,6
2 from symmetry 2, 6
x y x x x y
y
81. For a graph with origin symmetry, if the point
,a b is on the graph, then so is the point
,a b . Since the point 1,2 is on the graph
of an equation with origin symmetry, the point
1, 2 must also be on the graph.
82. For a graph with y-axis symmetry, if the point
,a b is on the graph, then so is the point
,a b . Since 6 is an x-intercept in this case, the
point 6,0 is on the graph of the equation. Due
to the y-axis symmetry, the point 6,0 must
also be on the graph. Therefore, 6 is another x-intercept.
83. For a graph with origin symmetry, if the point
,a b is on the graph, then so is the point
,a b . Since 4 is an x-intercept in this case,
the point 4,0 is on the graph of the equation.
Due to the origin symmetry, the point 4,0
must also be on the graph. Therefore, 4 is another x-intercept.
84. For a graph with x-axis symmetry, if the point
,a b is on the graph, then so is the point
,a b . Since 2 is a y-intercept in this case, the
point 0, 2 is on the graph of the equation. Due
to the x-axis symmetry, the point 0, 2 must
also be on the graph. Therefore, 2 is another y-intercept.
85. a. 22 2 2 2x y x x y
x-intercepts:
22 22 2
22 2
4 3 2 2
4 3
3
0 0
2
2 0
2 0
x x x
x x x
x x x x
x x
x x
3 0 or 2 0
0 2
x xx x
Section 1.2: Intercepts; Symmetry; Graphing Key Equations
31 Copyright © 2017 Pearson Education, Inc.
y-intercepts:
22 22 2
22 2
4 2
4 2
2 2
0 0 0
0
1 0
y y
y y
y y
y y
y y
2 2
2
0 or 1 0
0 1
1
y yy y
y
The intercepts are 0,0 , 2,0 , 0, 1 ,
and 0,1 .
b. Test x-axis symmetry: Let y y
22 22 2
22 2 2 2 same
x y x x y
x y x x y
Test y-axis symmetry: Let x x
22 22 2
22 2 2 2 different
x y x x y
x y x x y
Test origin symmetry: Let x x and y y
22 2 2 2
22 2 2 2 different
x y x x y
x y x x y
Thus, the graph will have x-axis symmetry.
86. a. 216 120 225y x x-intercepts:
2
2
2
16 120 0 225
16 225
225
16no real solution
y
y
y
y-intercepts:
216 0 120 225
0 120 225
120 225
225 15
120 8
xx
x
x
The only intercept is 15
,08
.
b. Test x-axis symmetry: Let y y
2
2
16 120 225
16 120 225 same
y x
y x
Test y-axis symmetry: Let x x
2
2
16 120 225
16 120 225 different
y x
y x
Test origin symmetry: Let x x and y y
2
2
16 120 225
16 120 225 different
y x
y x
Thus, the graph will have x-axis symmetry.
87. Answers will vary. One example: y
x
88. Answers will vary
89. Answers will vary. Case 1: Graph has x-axis and y-axis symmetry, show origin symmetry. , on graph , on graph
(from -axis symmetry)
x y x yx
, on graph , on graph
from -axis symmetry
x y x y
y
Since the point ,x y is also on the graph, the
graph has origin symmetry.
Case 2: Graph has x-axis and origin symmetry, show y-axis symmetry.
Chapter 1: Graphs
32 Copyright © 2017 Pearson Education, Inc.
, on graph , on graph
from -axis symmetry
x y x y
x
, on graph , on graph
from origin symmetry
x y x y
Since the point ,x y is also on the graph, the
graph has y-axis symmetry.
Case 3: Graph has y-axis and origin symmetry, show x-axis symmetry.
, on graph , on graph
from -axis symmetry
x y x y
y
, on graph , on graph
from origin symmetry
x y x y
Since the point ,x y is also on the graph, the
graph has x-axis symmetry.
90. Answers may vary. The graph must contain the
points 2,5 , 1,3 , and 0, 2 . For the
graph to be symmetric about the y-axis, the graph
must also contain the points 2,5 and 1,3
(note that (0, 2) is on the y-axis).
For the graph to also be symmetric with respect to the x-axis, the graph must also contain the
points 2, 5 , 1, 3 , 0, 2 , 2, 5 , and
1, 3 . Recall that a graph with two of the
symmetries (x-axis, y-axis, origin) will necessarily have the third. Therefore, if the original graph with y-axis symmetry also has x-axis symmetry, then it will also have origin symmetry.
Section 1.3
1.
22 5 2 0
2 1 2 0
x xx x
2 1 0
2 1
1
2
xx
x
or 2 0
2
xx
The solution set is 1
2,2
.
2. 2 3 4 1 1
2 3 4 4 1
2 3 4 3
2 3 3
2 6
3
x xx xx xxxx
The solution set is 3 .
3. ZERO
4. False; exact solutions are obtained, in general, if the solution is a rational number. For irrational solutions, approximate answers are typically given, though some utilities can express certain irrational expressions in exact form.
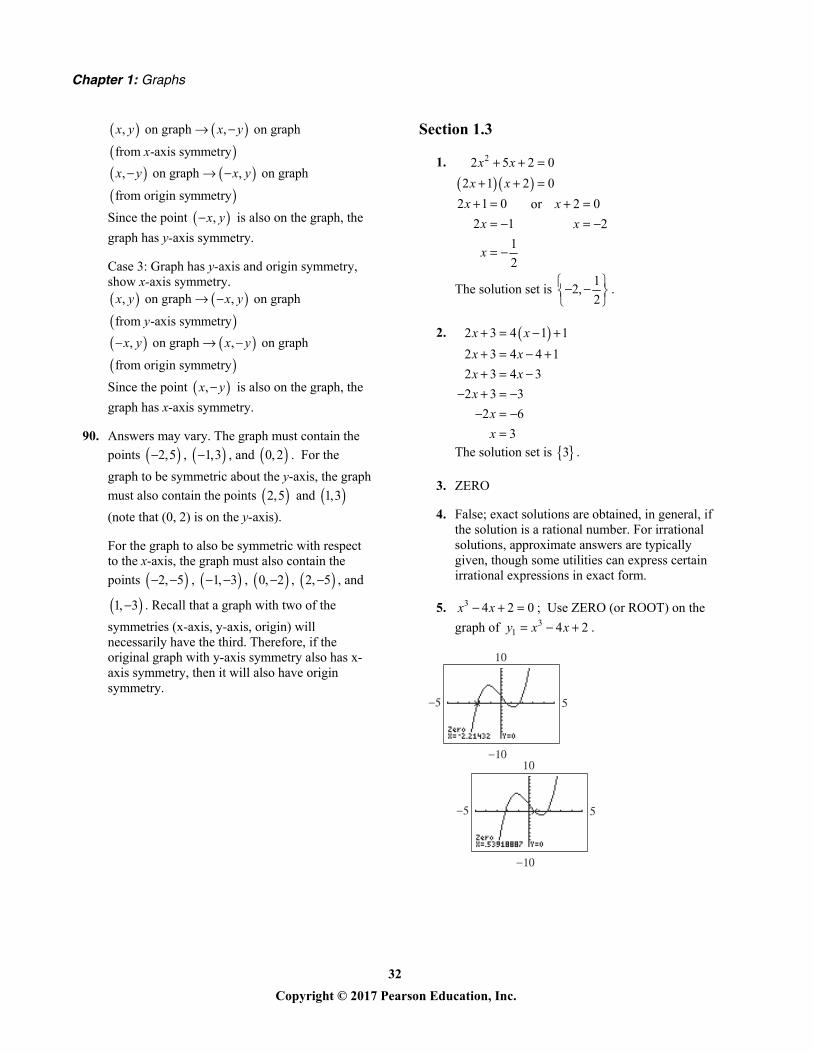
5. 3 4 2 0x x ; Use ZERO (or ROOT) on the
graph of 31 4 2y x x .
Section 1.3: Solving Equations Using a Graphing Utlilty
33 Copyright © 2017 Pearson Education, Inc.
The solution set is 2.21,0.54,1.68 .
6. 3 8 1 0x x ; Use ZERO (or ROOT) on the
graph of 31 8 1y x x .
The solution set is 2.89,0.13,2.76 .
7. 42 5 3 2x x ; Use INTERSECT on the
graphs of 41 2 5y x and 2 3 2y x .
The solution set is 1.55,1.15 .
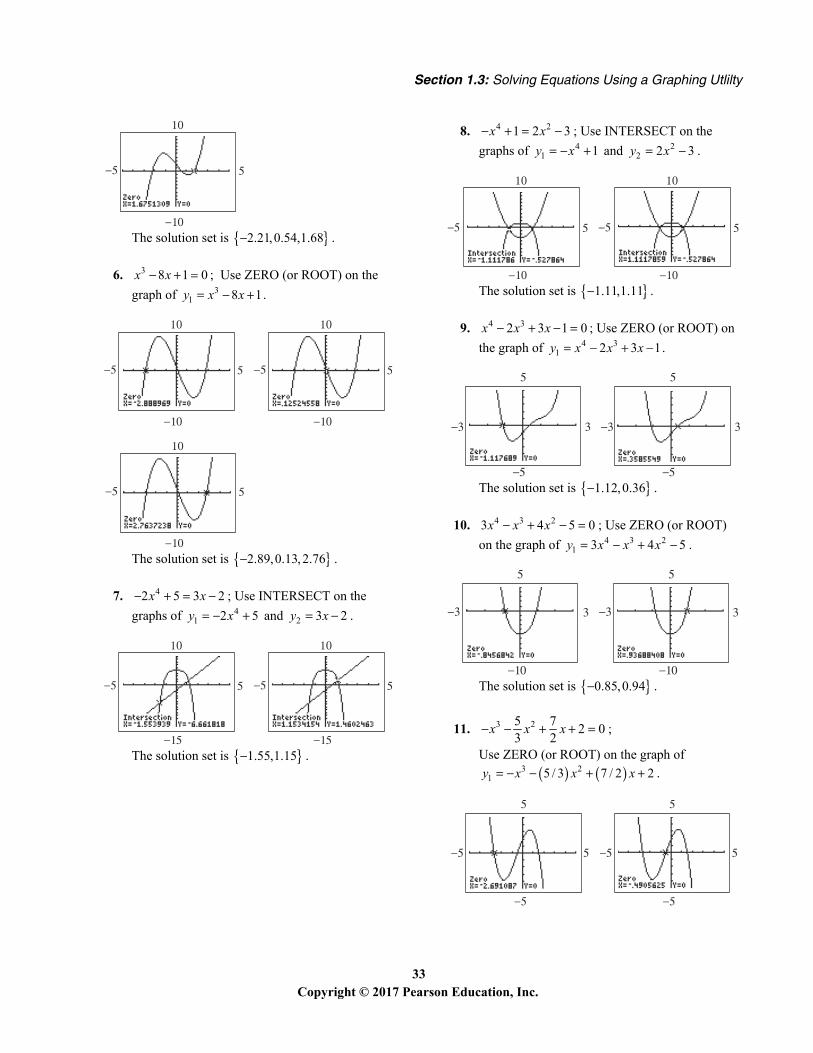
8. 4 21 2 3x x ; Use INTERSECT on the
graphs of 41 1y x and 2
2 2 3y x .
The solution set is 1.11,1.11 .
9. 4 32 3 1 0x x x ; Use ZERO (or ROOT) on
the graph of 4 31 2 3 1y x x x .
The solution set is 1.12,0.36 .
10. 4 3 23 4 5 0x x x ; Use ZERO (or ROOT)
on the graph of 4 3 21 3 4 5y x x x .
The solution set is 0.85,0.94 .
11. 3 25 72 0
3 2x x x ;
Use ZERO (or ROOT) on the graph of
3 21 5 / 3 7 / 2 2y x x x .
Chapter 1: Graphs
34 Copyright © 2017 Pearson Education, Inc.
The solution set is 2.69, 0.49,1.51 .
12. 4 3 27 153 2 0
3 2x x x x ; Use ZERO (or
ROOT) on the graph of
4 3 21 3 7 / 3 15 / 2 2y x x x x .
The solution set is 1.64,0.31,1.31,3.02 .
13. 4 3 22 5 2 12
3 2 3 2x x x x
Use INTERSECT on the graphs of
4 31 2 / 3 2 5 / 2y x x x and
22 (2 / 3) 1/ 2y x .
The solution set is 2.86, 1.34,0.20,1.00 .
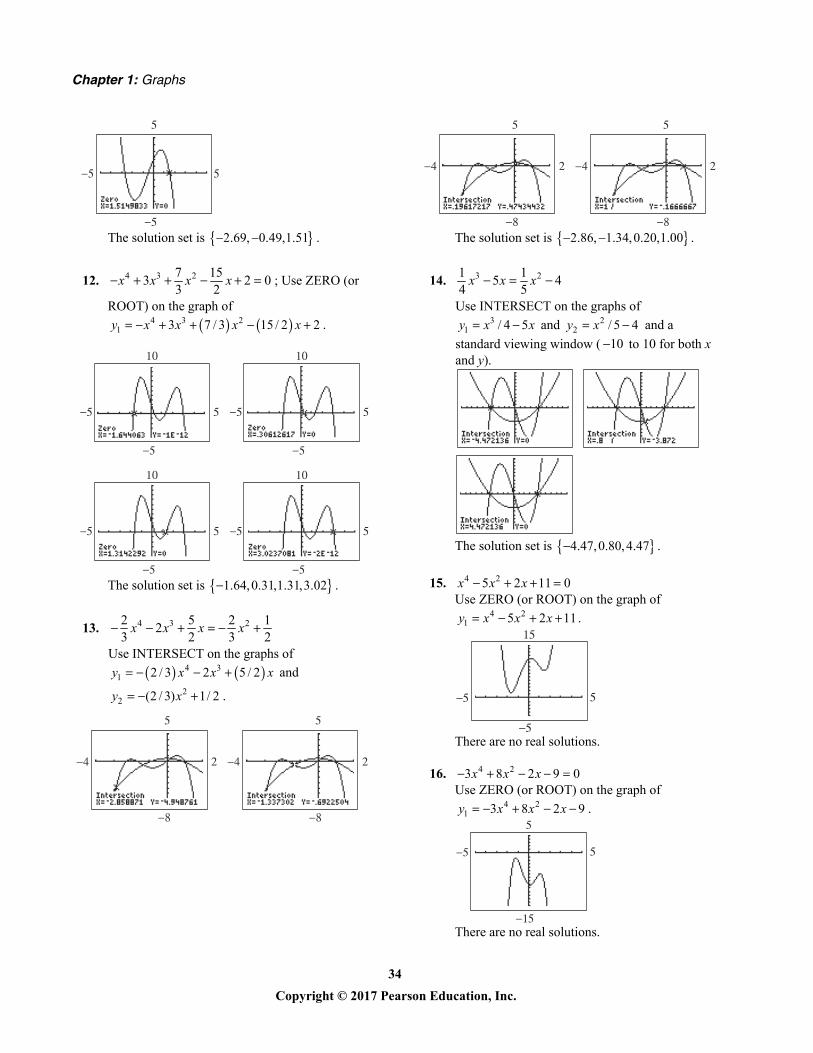
14. 3 21 15 4
4 5x x x
Use INTERSECT on the graphs of 3
1 / 4 5y x x and 22 / 5 4y x and a
standard viewing window ( 10 to 10 for both x and y).
The solution set is 4.47,0.80,4.47 .
15. 4 25 2 11 0x x x Use ZERO (or ROOT) on the graph of
4 21 5 2 11y x x x .
There are no real solutions.
16. 4 23 8 2 9 0x x x Use ZERO (or ROOT) on the graph of
4 21 3 8 2 9y x x x .
There are no real solutions.
Section 1.3: Solving Equations Using a Graphing Utlilty
35 Copyright © 2017 Pearson Education, Inc.
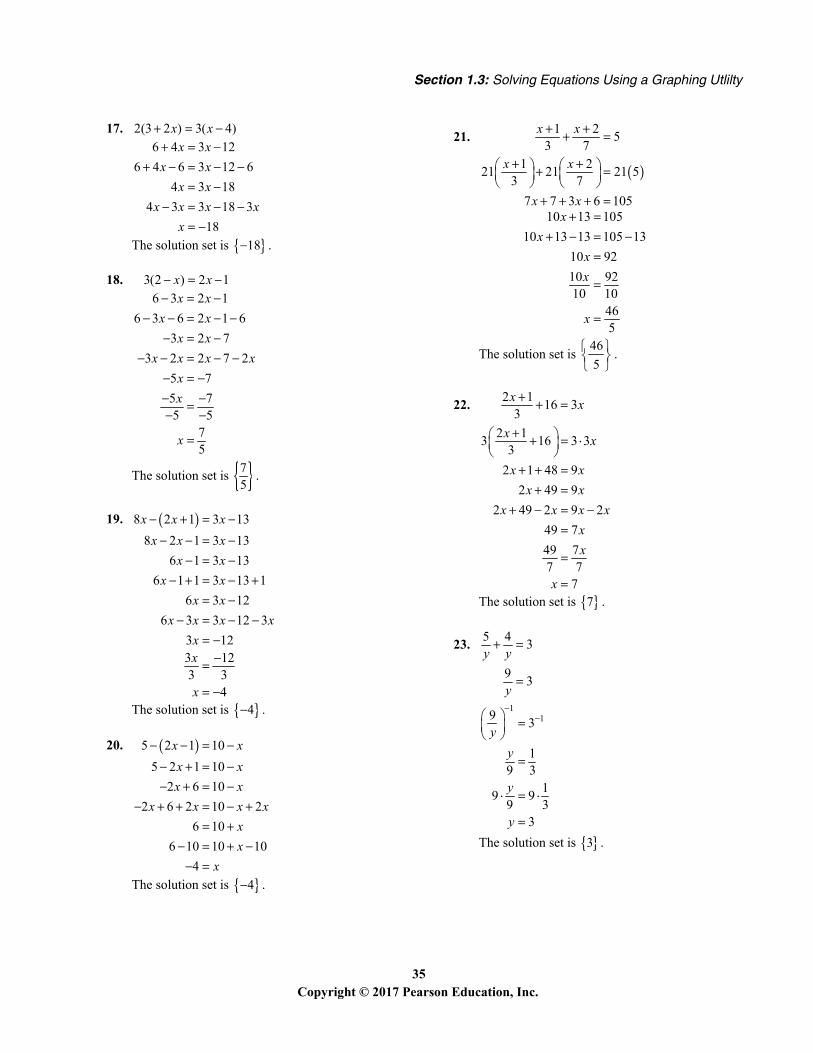
17. 2(3 2 ) 3( 4)x x 6 4 3 12
6 4 6 3 12 6
4 3 18
4 3 3 18 3
18
x xx xx x
x x x xx
The solution set is 18 .
18. 3(2 ) 2 1x x 6 3 2 1
6 3 6 2 1 6
3 2 7
3 2 2 7 2
5 7
5 75 5
75
x xx xx x
x x x xxx
x
The solution set is 75
.
19. 8 2 1 3 13
8 2 1 3 13
6 1 3 13
6 1 1 3 13 1
6 3 12
6 3 3 12 3
3 12
x x xx x x
x xx x
x xx x x x
x
3 123 3
4
x
x
The solution set is 4 .
20. 5 2 1 10
5 2 1 10
2 6 10
2 6 2 10 2
6 10
6 10 10 10
4
x xx xx x
x x x xxx
x
The solution set is 4 .
21.
1 25
3 71 2
21 21 21 53 7
7 7 3 6 105
x x
x x
x x
10 13 105
10 13 13 105 13
10 92
10 9210 10
465
xx
xx
x
The solution set is 46
5
.
22. 2 116 3
3x x
2 13 16 3 3
3
2 1 48 9
2 49 9
2 49 2 9 2
49 7
49 77 7
7
x x
x xx x
x x x xxx
x
The solution set is 7 .
23. 5 43
93
y y
y
119
3
19 3
19 9
9 33
yy
y
y
The solution set is 3 .
Chapter 1: Graphs
36 Copyright © 2017 Pearson Education, Inc.
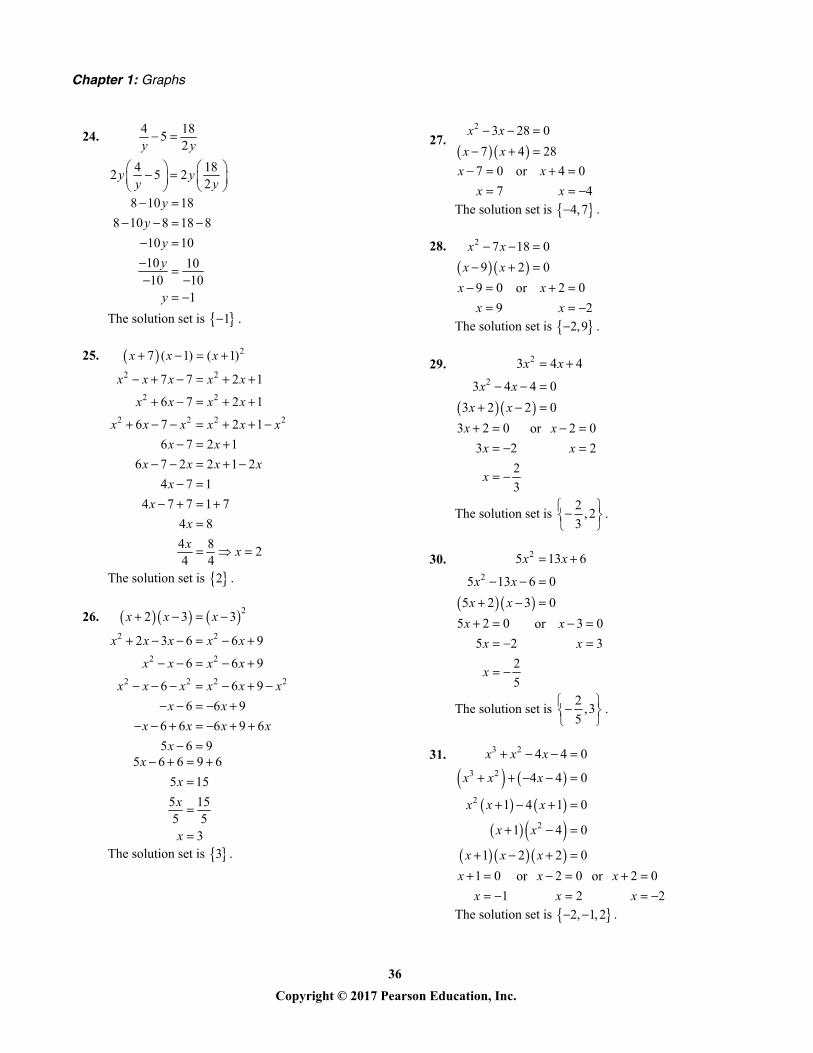
24. 4 185
2
4 182 5 2
2
y y
y yy y
8 10 18
8 10 8 18 8
10 10
10 1010 10
1
yyyy
y
The solution set is 1 .
25. 27 ( 1) ( 1)x x x 2 2
2 2
2 2 2 2
7 7 2 1
6 7 2 1
6 7 2 1
6 7 2 1
6 7 2 2 1 2
4 7 1
4 7 7 1 7
4 8
4 82
4 4
x x x x x
x x x x
x x x x x xx x
x x x xx
xxx x
The solution set is 2 .
26. 2
2 2
2 2
2 2 2 2
2 3 3
2 3 6 6 9
6 6 9
6 6 9
6 6 9
6 6 6 9 6
5 6 9
x x x
x x x x x
x x x x
x x x x x xx x
x x x xx
5 6 6 9 6
5 15
5 155 5
3
xxx
x
The solution set is 3 .
27.
2 3 28 0
7 4 28
x xx x
7 0
7
xx
or 4 0
4
xx
The solution set is 4,7 .
28.
2 7 18 0
9 2 0
x xx x
9 0
9
xx
or 2 0
2
xx
The solution set is 2,9 .
29.
2
2
3 4 4
3 4 4 0
3 2 2 0
x x
x xx x
3 2 0
3 2
2
3
xx
x
or 2 0
2
xx
The solution set is 2
, 23
.
30.
2
2
5 13 6
5 13 6 0
5 2 3 0
x x
x xx x
5 2 0
5 2
2
5
xx
x
or 3 0
3
xx
The solution set is 2
,35
.
31.
3 2
3 2
2
2
4 4 0
4 4 0
1 4 1 0
1 4 0
1 2 2 0
x x x
x x x
x x x
x x
x x x
1 0
1
xx
or 2 0
2
xx
or 2 0
2
xx
The solution set is 2, 1,2 .
Section 1.3: Solving Equations Using a Graphing Utlilty
37 Copyright © 2017 Pearson Education, Inc.
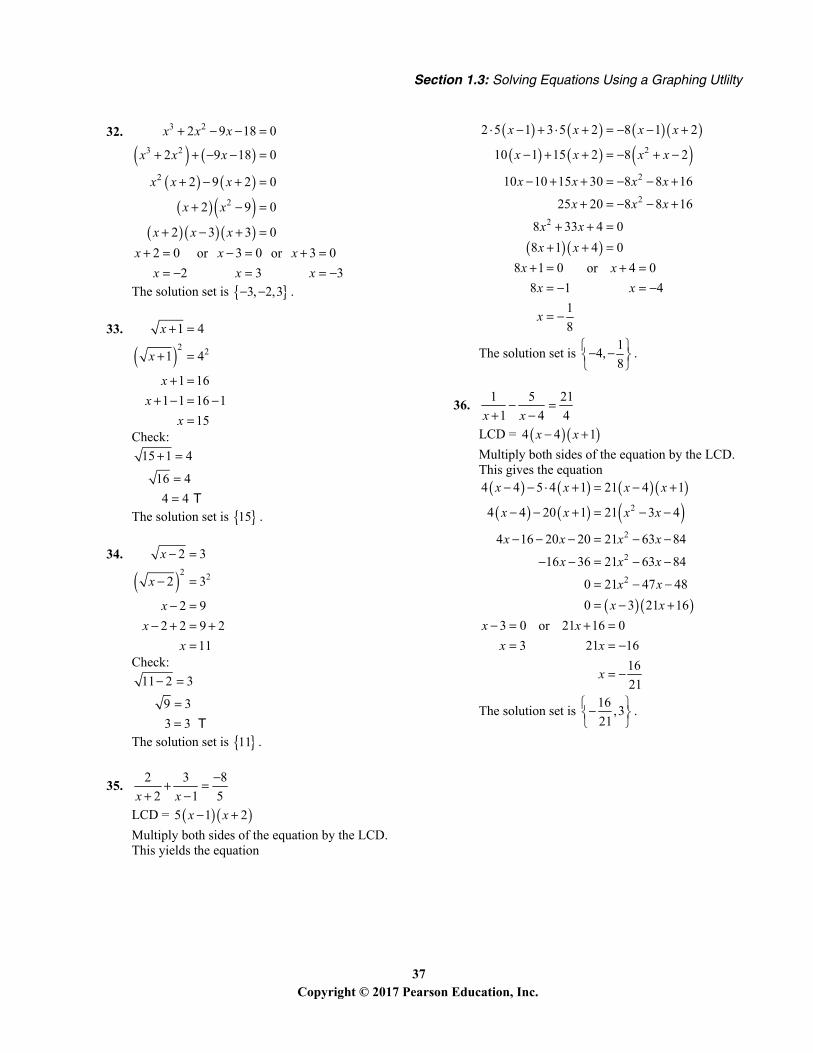
32.
3 2
3 2
2
2
2 9 18 0
2 9 18 0
2 9 2 0
2 9 0
2 3 3 0
x x x
x x x
x x x
x x
x x x
2 0
2
xx
or 3 0
3
xx
or 3 0
3
xx
The solution set is 3, 2,3 .
33.
2 2
1 4
1 4
1 16
1 1 16 1
15
x
x
xx
x
Check:
15 1 4
16 4
4 4
T
The solution set is 15 .
34.
2 2
2 3
2 3
2 9
2 2 9 2
11
x
x
xx
x
Check:
11 2 3
9 3
3 3
T
The solution set is 11 .
35. 2 3 8
2 1 5x x
LCD = 5 1 2x x
Multiply both sides of the equation by the LCD. This yields the equation
2
2
2
2
2 5 1 3 5 2 8 1 2
10 1 15 2 8 2
10 10 15 30 8 8 16
25 20 8 8 16
8 33 4 0
8 1 4 0
x x x x
x x x x
x x x x
x x x
x xx x
8 1 0
8 1
1
8
xx
x
or 4 0
4
xx
The solution set is 1
4,8
.
36. 1 5 21
1 4 4x x
LCD = 4 4 1x x
Multiply both sides of the equation by the LCD. This gives the equation
2
2
2
2
4 4 5 4 1 21 4 1
4 4 20 1 21 3 4
4 16 20 20 21 63 84
16 36 21 63 84
0 21 47 48
0 3 21 16
x x x x
x x x x
x x x x
x x x
x xx x
3 0
3
xx
or 21 16 0
21 16
16
21
xx
x
The solution set is 16
,321
.
Chapter 1: Graphs
38 Copyright © 2017 Pearson Education, Inc.
Section 1.4
1. undefined; 0
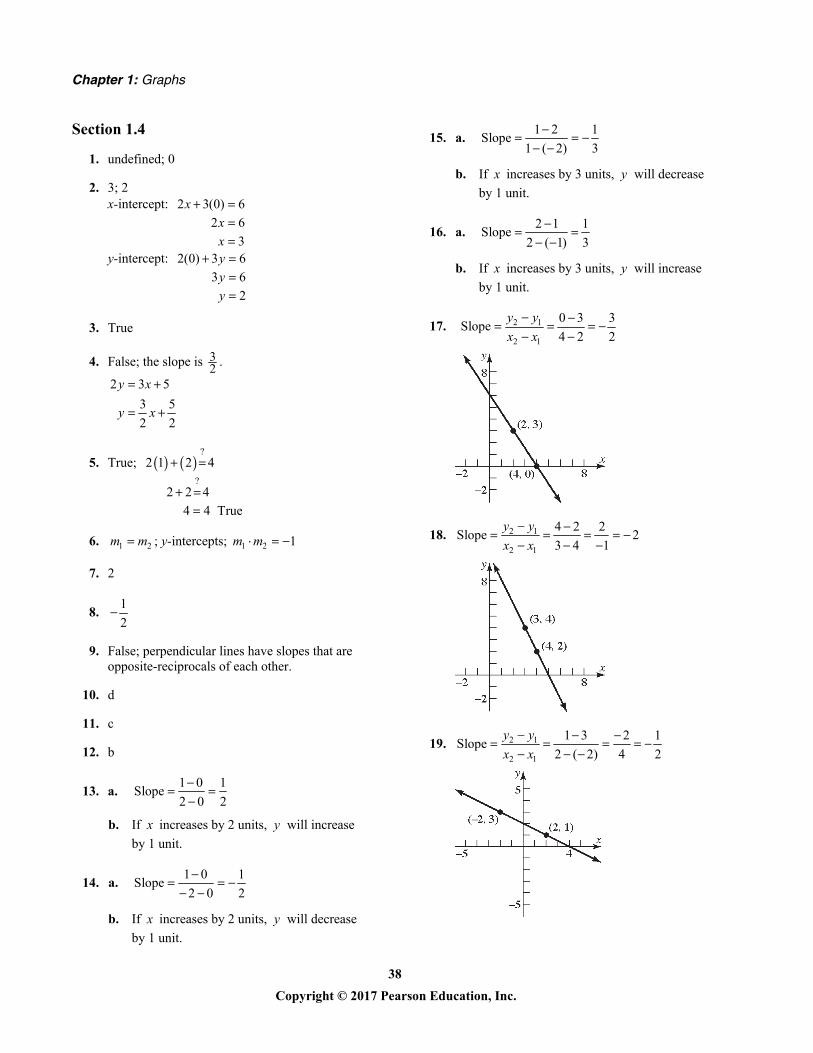
2. 3; 2 x-intercept: 2 3(0) 6
2 6
3
xxx
y-intercept: 2(0) 3 6
3 6
2
yyy
3. True
4. False; the slope is 32 .
2 3 5
3 5
2 2
y x
y x
5. True; ?
?
2 1 2 4
2 2 4
4 4 True
6. 1 2m m ; y-intercepts; 1 2 1m m
7. 2
8. 1
2
9. False; perpendicular lines have slopes that are opposite-reciprocals of each other.
10. d
11. c
12. b
13. a. 1 0 1Slope
2 0 2
b. If x increases by 2 units, y will increase
by 1 unit.
14. a. 1 0 1Slope
2 0 2
b. If x increases by 2 units, y will decrease
by 1 unit.
15. a. 1 2 1Slope
1 ( 2) 3
b. If x increases by 3 units, y will decrease
by 1 unit.
16. a. 2 1 1Slope
2 ( 1) 3
b. If x increases by 3 units, y will increase
by 1 unit.
17. 2 1
2 1
0 3 3Slope
4 2 2
y yx x
18. 2 1
2 1
4 2 2Slope 2
3 4 1
y yx x
19. 2 1
2 1
1 3 2 1Slope
2 ( 2) 4 2
y yx x
Section 1.4: Lines
39 Copyright © 2017 Pearson Education, Inc.
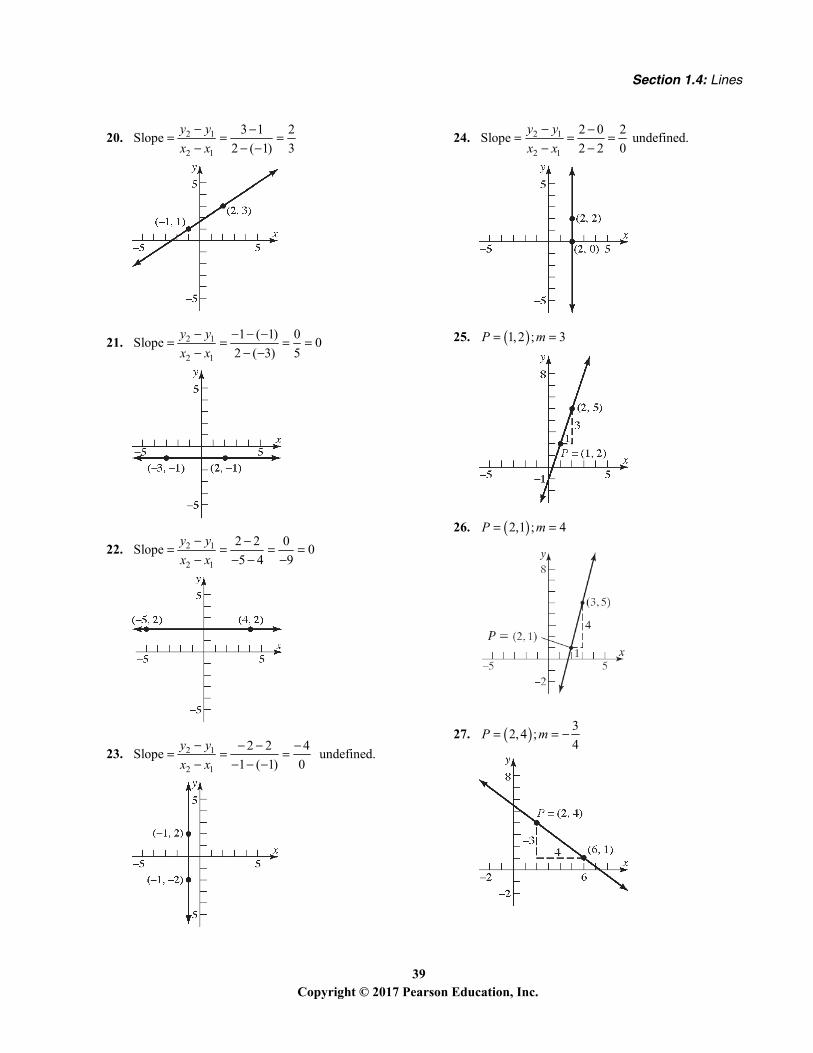
20. 2 1
2 1
3 1 2Slope
2 ( 1) 3
y yx x
21. 2 1
2 1
1 ( 1) 0Slope 0
2 ( 3) 5
y yx x
22. 2 1
2 1
2 2 0Slope 0
5 4 9
y yx x
23. 2 1
2 1
2 2 4Slope undefined.
1 ( 1) 0
y yx x
24. 2 1
2 1
2 0 2Slope undefined.
2 2 0
y yx x
25. 1,2 ; 3P m
26. 2,1 ; 4P m
27. 32,4 ;
4P m
Chapter 1: Graphs
40 Copyright © 2017 Pearson Education, Inc.
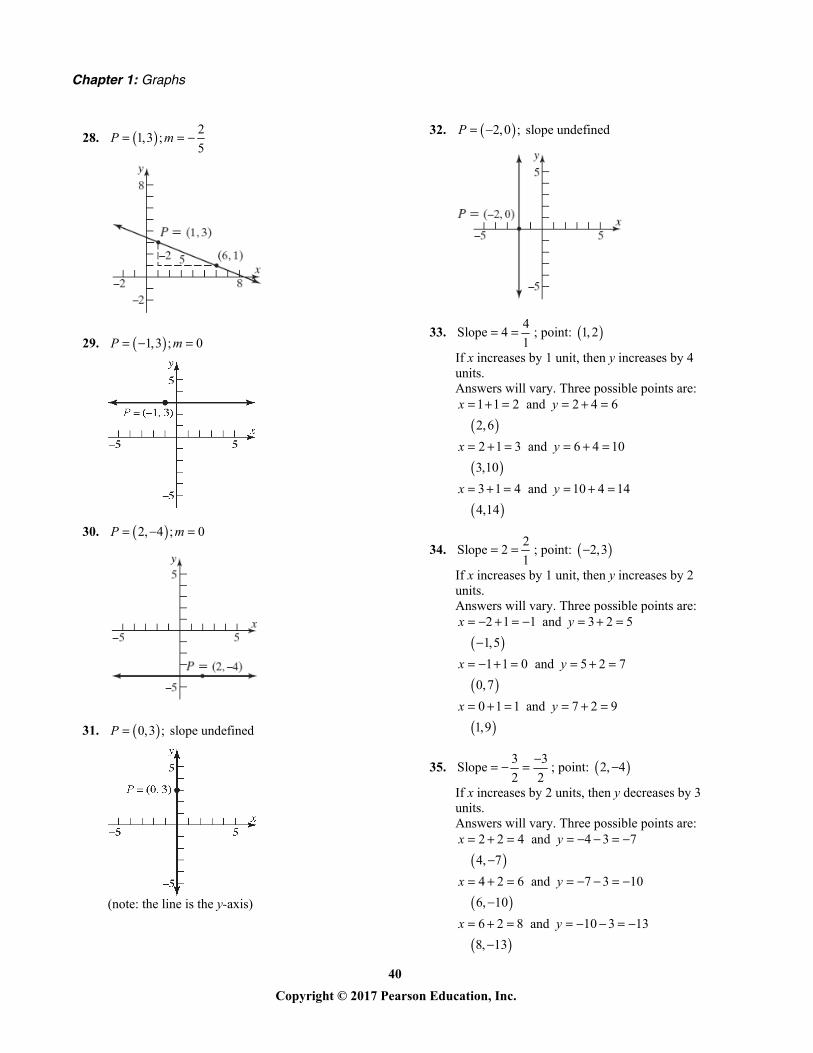
28. 21,3 ;
5P m
29. 1,3 ; 0P m
30. 2, 4 ; 0P m
31. 0,3 ; slope undefinedP
(note: the line is the y-axis)
32. 2,0 ; slope undefinedP
33. 4Slope 4
1 ; point: 1, 2
If x increases by 1 unit, then y increases by 4 units. Answers will vary. Three possible points are:
1 1 2 and 2 4 6
2,6
2 1 3 and 6 4 10
3,10
3 1 4 and 10 4 14
4,14
x y
x y
x y
34. 2Slope 2
1 ; point: 2,3
If x increases by 1 unit, then y increases by 2 units. Answers will vary. Three possible points are:
2 1 1 and 3 2 5
1,5
1 1 0 and 5 2 7
0,7
0 1 1 and 7 2 9
1,9
x y
x y
x y
35. 3 3Slope
2 2
; point: 2, 4
If x increases by 2 units, then y decreases by 3 units. Answers will vary. Three possible points are:
2 2 4 and 4 3 7
4, 7
4 2 6 and 7 3 10
6, 10
6 2 8 and 10 3 13
8, 13
x y
x y
x y
Section 1.4: Lines
41 Copyright © 2017 Pearson Education, Inc.
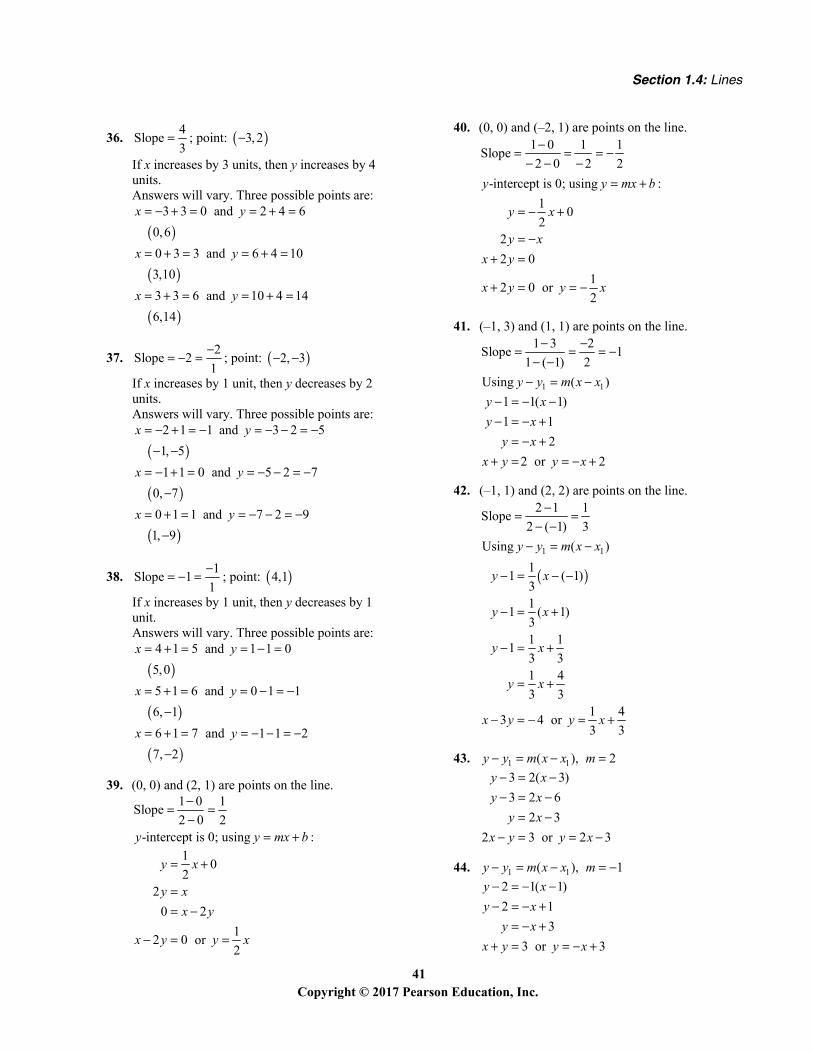
36. 4Slope
3 ; point: 3,2
If x increases by 3 units, then y increases by 4 units. Answers will vary. Three possible points are:
3 3 0 and 2 4 6
0,6
0 3 3 and 6 4 10
3,10
3 3 6 and 10 4 14
6,14
x y
x y
x y
37. 2Slope 2
1
; point: 2, 3
If x increases by 1 unit, then y decreases by 2 units. Answers will vary. Three possible points are:
2 1 1 and 3 2 5
1, 5
1 1 0 and 5 2 7
0, 7
0 1 1 and 7 2 9
1, 9
x y
x y
x y
38. 1Slope 1
1
; point: 4,1
If x increases by 1 unit, then y decreases by 1 unit. Answers will vary. Three possible points are:
4 1 5 and 1 1 0
5,0
5 1 6 and 0 1 1
6, 1
6 1 7 and 1 1 2
7, 2
x y
x y
x y
39. (0, 0) and (2, 1) are points on the line. 1 0 1
Slope2 0 2
-intercept is 0; using :y y mx b
10
22
0 2
12 0 or
2
y x
y xx y
x y y x
40. (0, 0) and (–2, 1) are points on the line. 1 0 1 1
Slope2 0 2 2
-intercept is 0; using :y y mx b
10
22
2 0
12 0 or
2
y x
y xx y
x y y x
41. (–1, 3) and (1, 1) are points on the line.
1 1
1 3 2Slope 1
1 ( 1) 2
Using ( )y y m x x
1 1( 1)
1 1
2
2 or 2
y xy xy x
x y y x
42. (–1, 1) and (2, 2) are points on the line.
1 1
2 1 1Slope
2 ( 1) 3
Using ( )y y m x x
11 ( 1)
31
1 ( 1)31 1
13 31 4
3 31 4
3 4 or 3 3
y x
y x
y x
y x
x y y x
43. 1 1( ), 2y y m x x m 3 2( 3)
3 2 6
2 3
2 3 or 2 3
y xy xy x
x y y x
44. 1 1( ), 1y y m x x m 2 1( 1)
2 1
3
3 or 3
y xy xy x
x y y x
Chapter 1: Graphs
42 Copyright © 2017 Pearson Education, Inc.
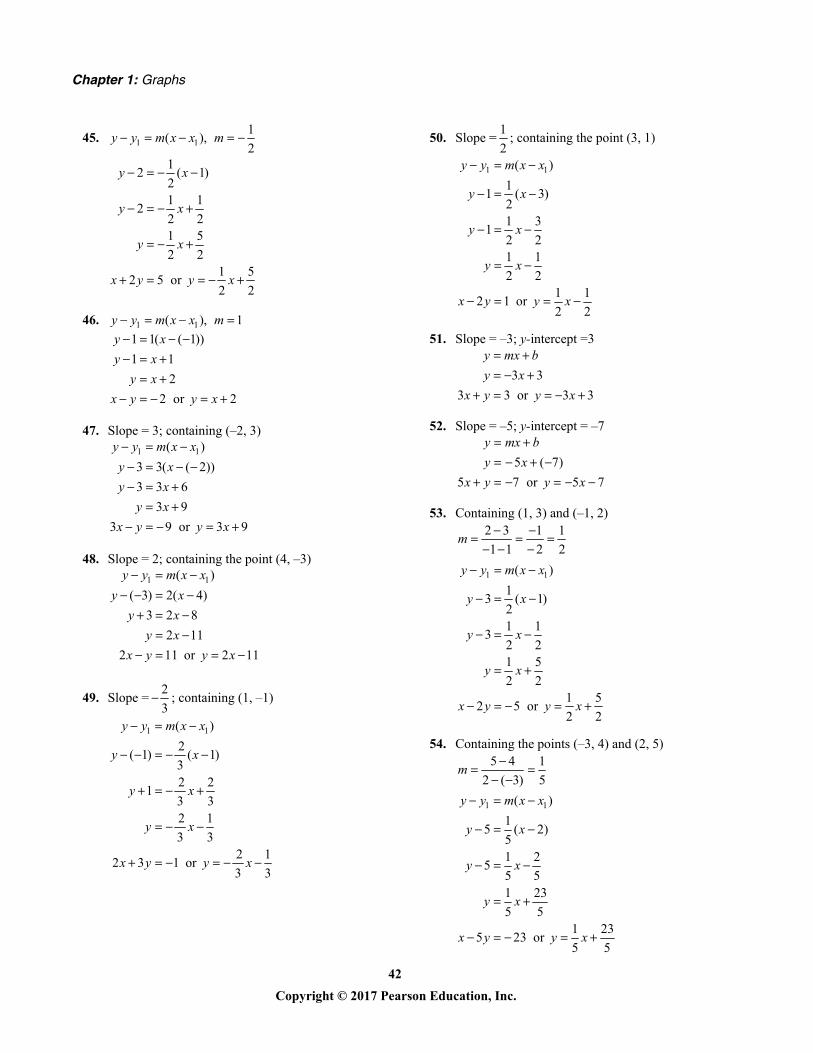
45. 1 11
( ),2
y y m x x m
12 ( 1)
21 1
22 21 5
2 21 5
2 5 or 2 2
y x
y x
y x
x y y x
46. 1 1( ), 1y y m x x m 1 1( ( 1))
1 1
2
2 or 2
y xy xy x
x y y x
47. Slope = 3; containing (–2, 3)
1 1( )
3 3( ( 2))
3 3 6
3 9
3 9 or 3 9
y y m x xy xy xy x
x y y x
48. Slope = 2; containing the point (4, –3)
1 1( )
( 3) 2( 4)
3 2 8
2 11
2 11 or 2 11
y y m x xy xy xy x
x y y x
49. Slope =2
3 ; containing (1, –1)
1 1( )
2( 1) ( 1)
32 2
13 32 1
3 32 1
2 3 1 or 3 3
y y m x x
y x
y x
y x
x y y x
50. Slope =1
2; containing the point (3, 1)
1 1( )
11 ( 3)
21 3
12 21 1
2 21 1
2 1 or 2 2
y y m x x
y x
y x
y x
x y y x
51. Slope = –3; y-intercept =3
3 3
3 3 or 3 3
y mx by x
x y y x
52. Slope = –5; y-intercept = –7
5 ( 7)
5 7 or 5 7
y mx by x
x y y x
53. Containing (1, 3) and (–1, 2) 2 3 1 1
1 1 2 2m
1 1( )
13 ( 1)
21 1
32 21 5
2 21 5
2 5 or 2 2
y y m x x
y x
y x
y x
x y y x
54. Containing the points (–3, 4) and (2, 5) 5 4 1
2 ( 3) 5m
1 1( )
15 ( 2)
51 2
55 51 23
5 51 23
5 23 or 5 5
y y m x x
y x
y x
y x
x y y x
Section 1.4: Lines
43 Copyright © 2017 Pearson Education, Inc.
55. x-intercept = 2; y-intercept = –1 Points are (2,0) and (0,–1)
1 0 1 1
0 2 2 2m
11
21
2 2 or 12
y mx b
y x
x y y x
56. x-intercept = –4; y-intercept = 4 Points are (–4, 0) and (0, 4)
4 0 41
0 ( 4) 4m
1 4
4
4 or 4
y mx by xy x
x y y x
57. Slope undefined; containing the point (2, 4) This is a vertical line.
2 No slope-intercept form.x
58. Slope undefined; containing the point (3, 8) This is a vertical line.
3 No slope-intercept form.x
59. Horizontal lines have slope 0m and take the form y b . Therefore, the horizontal line
passing through the point 3,2 is 2y .
60. Vertical lines have an undefined slope and take the form x a . Therefore, the vertical line
passing through the point 4, 5 is 4x .
61. Parallel to 4y x ; Slope = 4
Containing (–1, 2)
1 1( )
2 4( ( 1))
2 4 4 6
4 6 or 4 6
y y m x xy xy x y xx y y x
62. Parallel to 3y x ; Slope = –3; Containing the
point (–1, 2)
1 1( )
2 3( ( 1))
2 3 3 3 1
3 1 or 3 1
y y m x xy xy x y xx y y x
63. Parallel to 5 2x y ; Slope = 5
Containing the point (0, 0)
1 1( )
0 5( 0)
5
5 0 or 5
y y m x xy xy x
x y y x
64. Parallel to 2 5x y ;
1Slope ; Containing the point 0,0
2
1 1( )
1 10 ( 0)
2 21
2 0 or 2
y y m x x
y x y x
x y y x
65. Parallel to 5x ; Containing (4,2) This is a vertical line.
4 No slope-intercept form.x
66. Parallel to 5y ; Containing the point (4, 2)
This is a horizontal line. Slope = 0 2y
67. Perpendicular to 1
4;6
y x Containing (1, –2)
Slope of perpendicular = –6
1 1( )
( 2) 6( 1)
2 6 2 6
6 0 or 6
y y m x xy xy x y xx y y x
68. Perpendicular to 8 3y x ; Containing the
point (10, –2) 1
Slope of perpendicular8
1 1( )
1( 2) ( 10)
81 5 1 3
28 4 8 4
1 38 6 or
8 4
y y m x x
y x
y x y x
x y y x
Chapter 1: Graphs
44 Copyright © 2017 Pearson Education, Inc.
69. Perpendicular to 2 5 2x y ; Containing the
point (–3, –6 ) 5
Slope of perpendicular2
1 1( )
5 5 15( 6) ( ( 3)) 6
2 2 25 3
2 25 3
5 2 3 or 2 2
y y m x x
y x y x
y x
x y y x
70. Perpendicular to 3 12x y ; Containing the
point (0, 4) Slope of perpendicular = –3
3 4
3 4 or 3 4
y mx by x
x y y x
71. Perpendicular to 8x ; Containing (3, 4) Slope of perpendicular = 0 (horizontal line)
4y
72. Perpendicular to 8y ;
Containing the point (3, 4) Slope of perpendicular is undefined (vertical line). 3x No slope-intercept form.
73. 2 3y x ; Slope = 2; y-intercept = 3
74. 3 4y x ; Slope = –3; y-intercept = 4
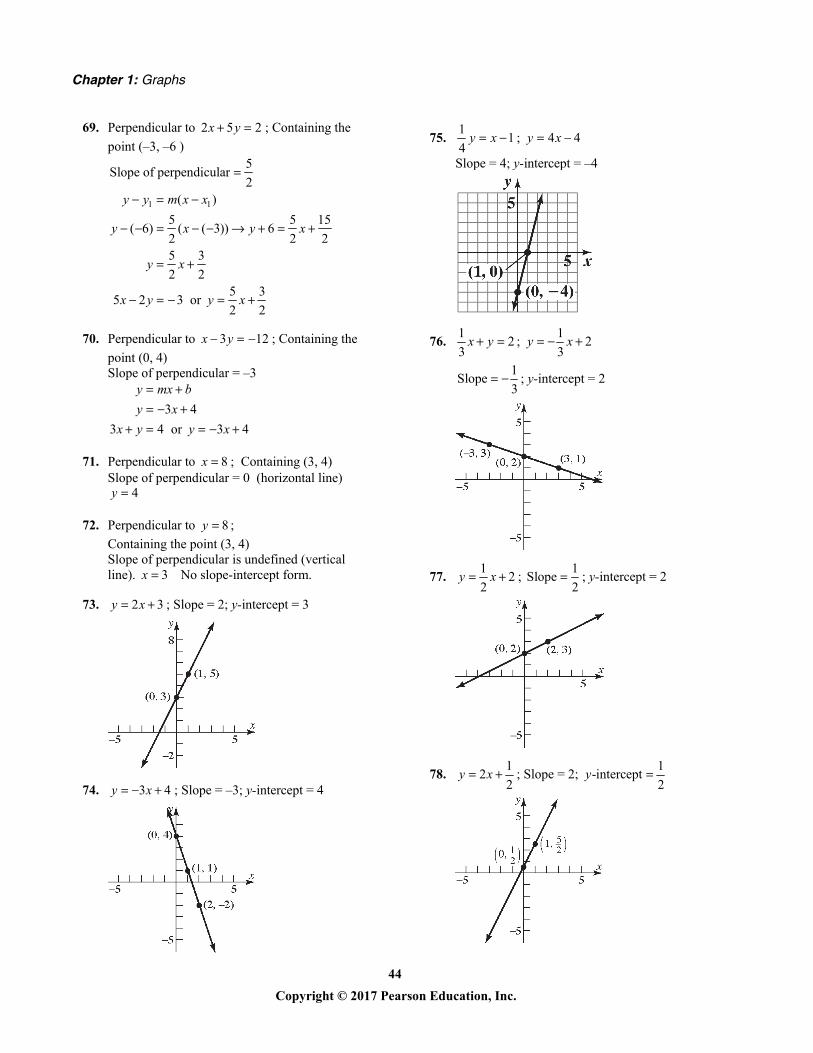
75. 11
4y x ; 4 4y x
Slope = 4; y-intercept = –4
76. 12
3x y ; 1
23
y x
1Slope
3 ; y-intercept = 2
77. 12
2y x ;
1Slope
2 ; y-intercept = 2
78. 12
2y x ; Slope = 2;
1-intercept
2y
Section 1.4: Lines
45 Copyright © 2017 Pearson Education, Inc.
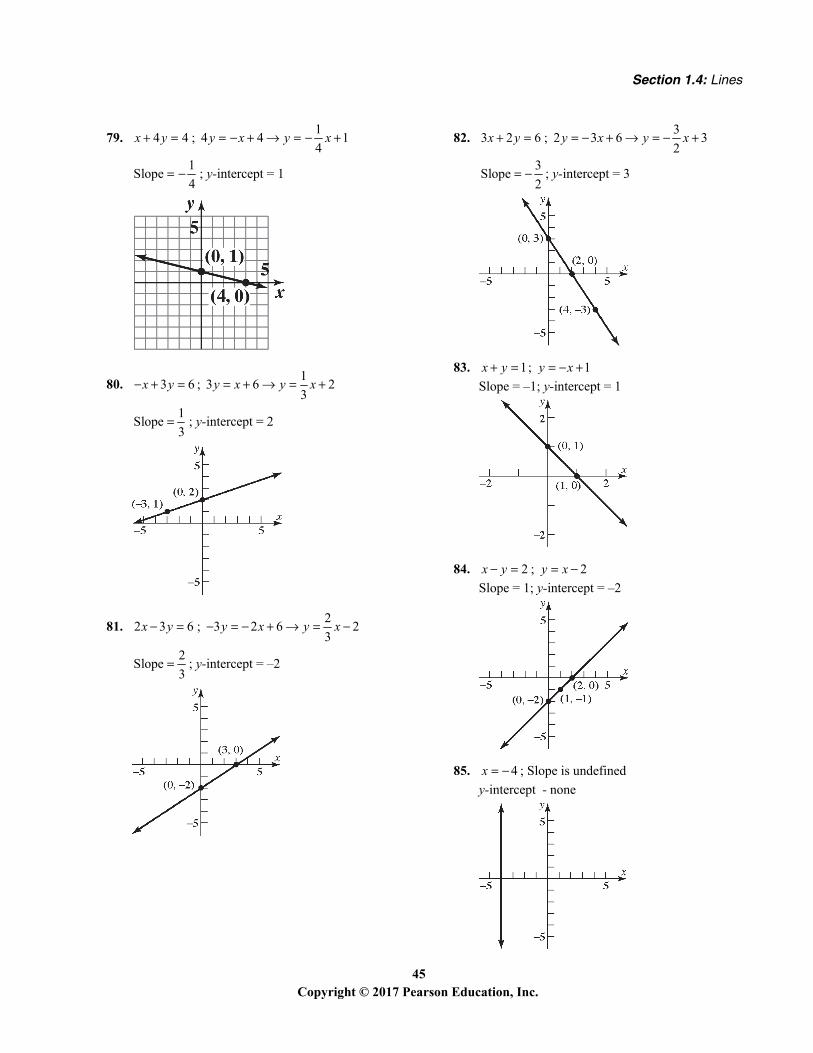
79. 4 4x y ; 1
4 4 14
y x y x
1Slope
4 ; y-intercept = 1
80. 3 6x y ; 1
3 6 23
y x y x
1Slope
3 ; y-intercept = 2
81. 2 3 6x y ; 2
3 2 6 23
y x y x
2Slope
3 ; y-intercept = –2
82. 3 2 6x y ; 3
2 3 6 32
y x y x
3Slope
2 ; y-intercept = 3
83. 1x y ; 1y x
Slope = –1; y-intercept = 1
84. 2x y ; 2y x
Slope = 1; y-intercept = –2
85. 4x ; Slope is undefined
y-intercept - none
Chapter 1: Graphs
46 Copyright © 2017 Pearson Education, Inc.
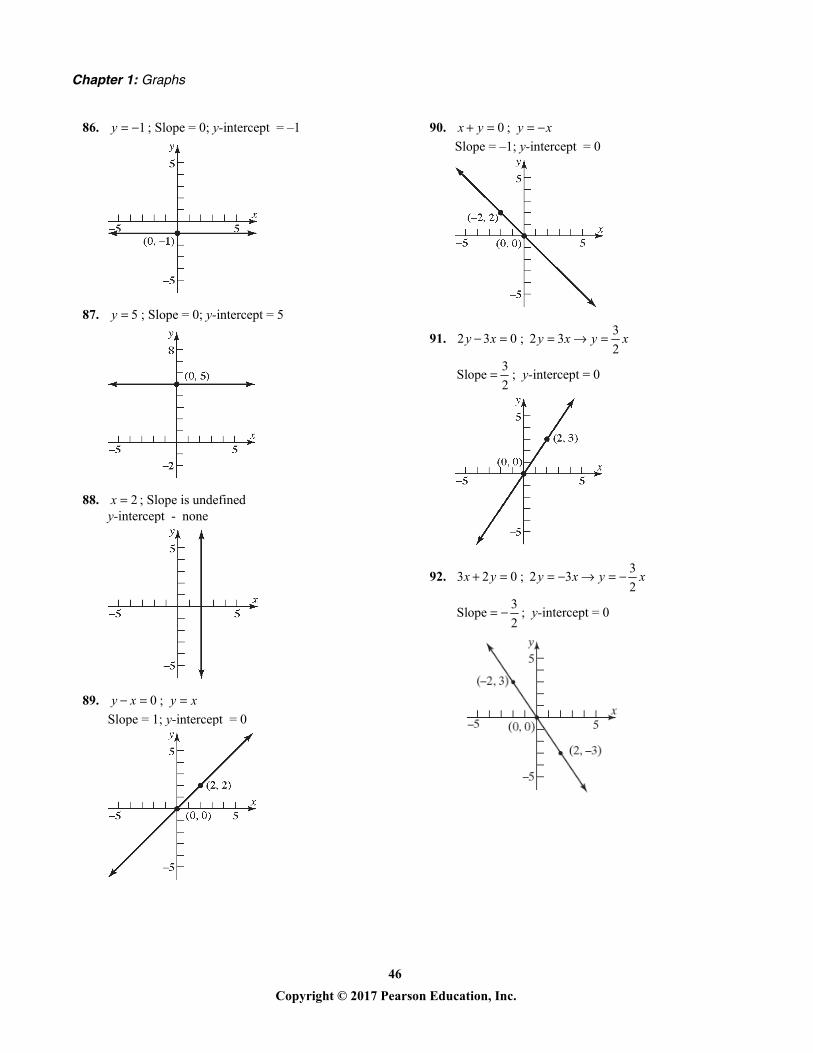
86. 1y ; Slope = 0; y-intercept = –1
87. 5y ; Slope = 0; y-intercept = 5
88. 2x ; Slope is undefined y-intercept - none
89. 0y x ; y x
Slope = 1; y-intercept = 0
90. 0x y ; y x
Slope = –1; y-intercept = 0
91. 2 3 0y x ; 3
2 32
y x y x
3Slope
2 ; y-intercept = 0
92. 3 2 0x y ; 3
2 32
y x y x
3Slope
2 ; y-intercept = 0
Section 1.4: Lines
47 Copyright © 2017 Pearson Education, Inc.
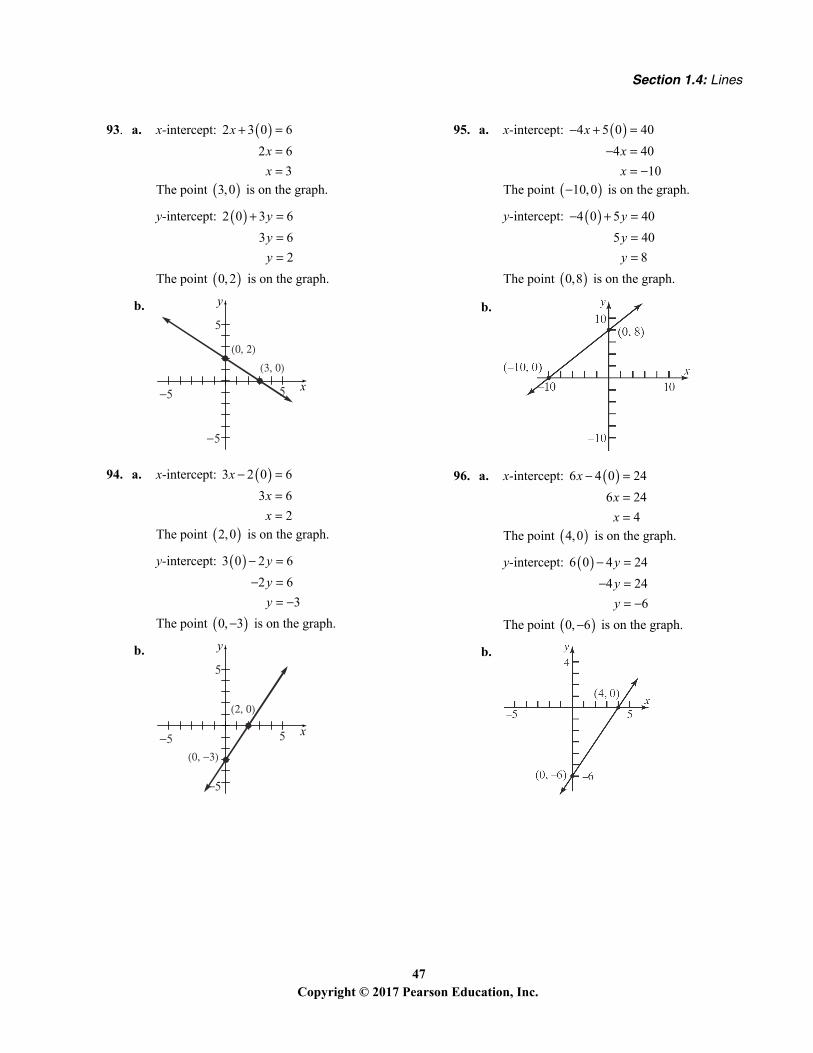
93. a. x-intercept: 2 3 0 6
2 6
3
xxx
The point 3,0 is on the graph.
y-intercept: 2 0 3 6
3 6
2
yyy
The point 0, 2 is on the graph.
b. y
x
5
55
5
94. a. x-intercept: 3 2 0 6
3 6
2
xxx
The point 2,0 is on the graph.
y-intercept: 3 0 2 6
2 6
3
yyy
The point 0, 3 is on the graph.
b.
y
x
5
55
5
95. a. x-intercept: 4 5 0 40
4 40
10
xxx
The point 10,0 is on the graph.
y-intercept: 4 0 5 40
5 40
8
yyy
The point 0,8 is on the graph.
b.
96. a. x-intercept: 6 4 0 24
6 24
4
xxx
The point 4,0 is on the graph.
y-intercept: 6 0 4 24
4 24
6
yyy
The point 0, 6 is on the graph.
b.
Chapter 1: Graphs
48 Copyright © 2017 Pearson Education, Inc.
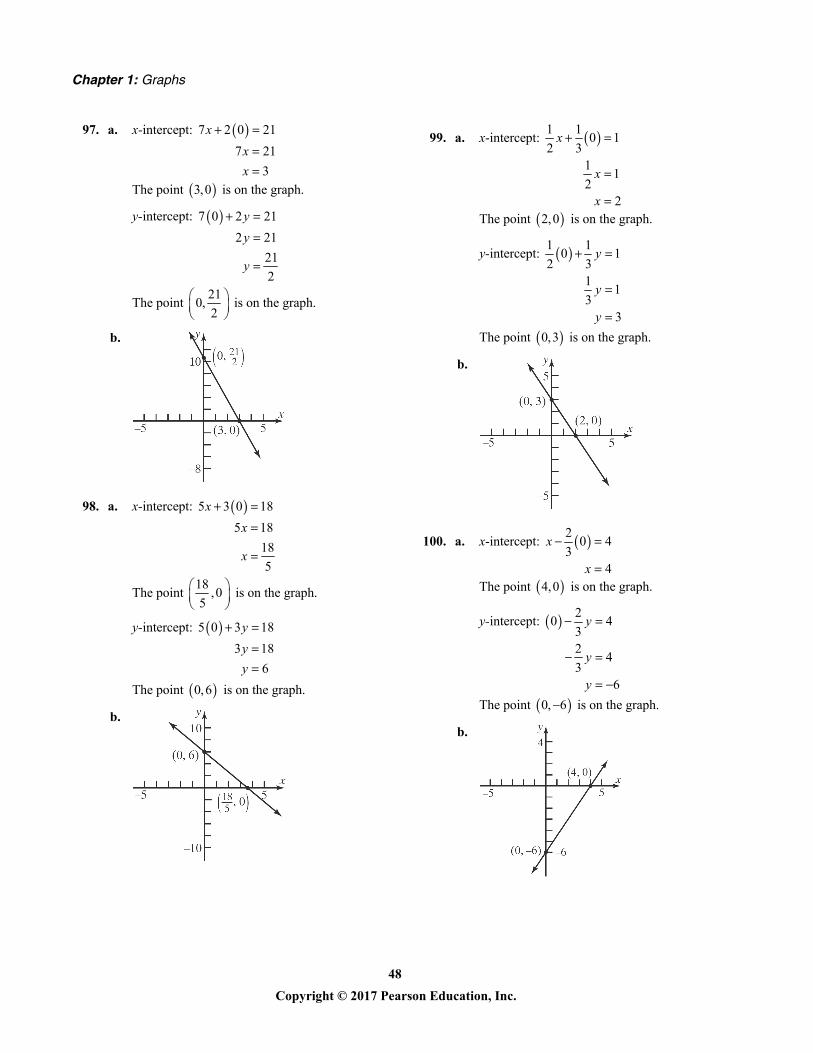
97. a. x-intercept: 7 2 0 21
7 21
3
xxx
The point 3,0 is on the graph.
y-intercept: 7 0 2 21
2 21
21
2
yy
y
The point 21
0,2
is on the graph.
b.
98. a. x-intercept: 5 3 0 18
5 18
18
5
xx
x
The point 18
,05
is on the graph.
y-intercept: 5 0 3 18
3 18
6
yyy
The point 0,6 is on the graph.
b.
99. a. x-intercept: 1 10 1
2 31
12
2
x
x
x
The point 2,0 is on the graph.
y-intercept: 1 10 1
2 31
13
3
y
y
y
The point 0,3 is on the graph.
b.
100. a. x-intercept: 20 4
34
x
x
The point 4,0 is on the graph.
y-intercept: 20 4
32
43
6
y
y
y
The point 0, 6 is on the graph.
b.
Section 1.4: Lines
49 Copyright © 2017 Pearson Education, Inc.
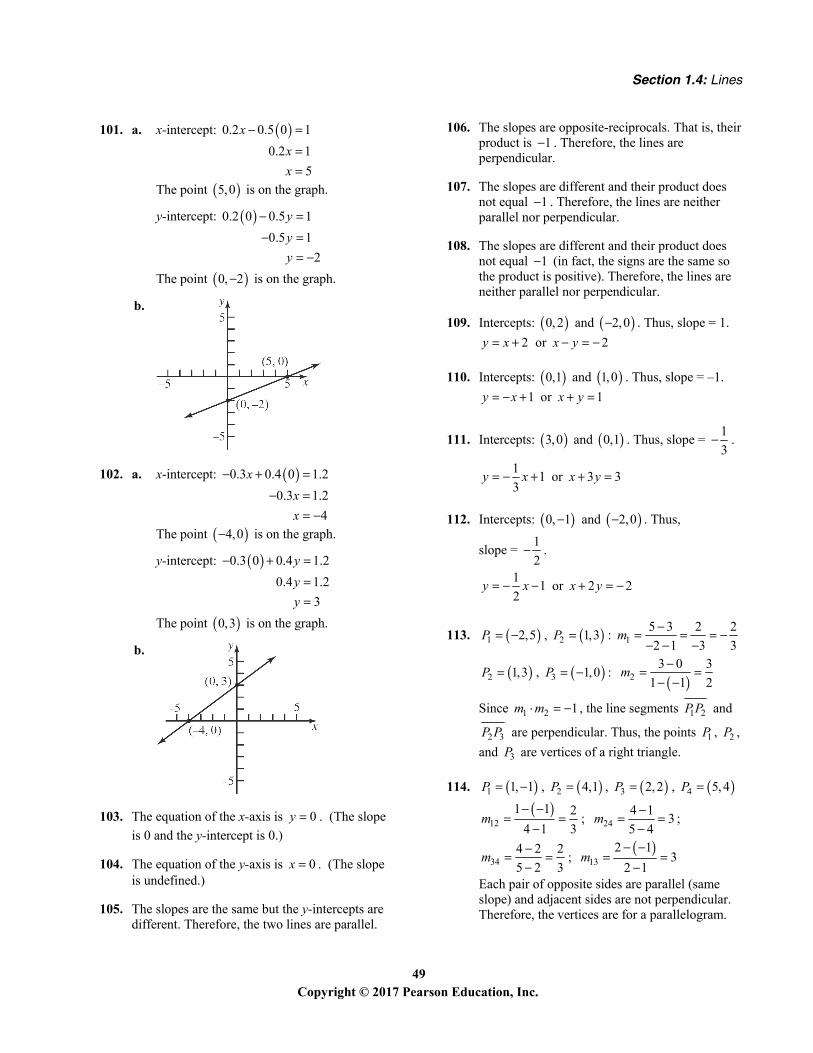
101. a. x-intercept: 0.2 0.5 0 1
0.2 1
5
xxx
The point 5,0 is on the graph.
y-intercept: 0.2 0 0.5 1
0.5 1
2
yyy
The point 0, 2 is on the graph.
b.
102. a. x-intercept: 0.3 0.4 0 1.2
0.3 1.2
4
xxx
The point 4,0 is on the graph.
y-intercept: 0.3 0 0.4 1.2
0.4 1.2
3
yyy
The point 0,3 is on the graph.
b.
103. The equation of the x-axis is 0y . (The slope
is 0 and the y-intercept is 0.)
104. The equation of the y-axis is 0x . (The slope is undefined.)
105. The slopes are the same but the y-intercepts are different. Therefore, the two lines are parallel.
106. The slopes are opposite-reciprocals. That is, their product is 1 . Therefore, the lines are perpendicular.
107. The slopes are different and their product does not equal 1 . Therefore, the lines are neither parallel nor perpendicular.
108. The slopes are different and their product does not equal 1 (in fact, the signs are the same so the product is positive). Therefore, the lines are neither parallel nor perpendicular.
109. Intercepts: 0, 2 and 2,0 . Thus, slope = 1.
2 or 2y x x y
110. Intercepts: 0,1 and 1,0 . Thus, slope = –1.
1 or 1y x x y
111. Intercepts: 3,0 and 0,1 . Thus, slope = 1
3 .
11 or 3 3
3y x x y
112. Intercepts: 0, 1 and 2,0 . Thus,
slope = 1
2 .
11 or 2 2
2y x x y
113. 1 2,5P , 2 1,3P : 15 3 2 2
2 1 3 3m
2 1,3P , 3 1,0P : 2
3 0 3
1 1 2m
Since 1 2 1m m , the line segments 1 2PP and
2 3P P are perpendicular. Thus, the points 1P , 2P ,
and 3P are vertices of a right triangle.
114. 1 1, 1P , 2 4,1P , 3 2,2P , 4 5, 4P
12
1 1 2
4 1 3m
; 24
4 13
5 4m
;
344 2 2
5 2 3m
;
13
2 13
2 1m
Each pair of opposite sides are parallel (same slope) and adjacent sides are not perpendicular. Therefore, the vertices are for a parallelogram.
Chapter 1: Graphs
50 Copyright © 2017 Pearson Education, Inc.
115. 1 1,0P , 2 2,3P , 3 1, 2P , 4 4,1P
123 0 3
12 1 3
m
; 241 3
14 2
m
;
34
1 2 31
4 1 3m
;
132 0
11 1
m
Opposite sides are parallel (same slope) and adjacent sides are perpendicular (product of slopes is 1 ). Therefore, the vertices are for a rectangle.
116. 1 0,0P , 2 1,3P , 3 4,2P , 4 3, 1P
123 0
31 0
m
; 232 3 1
4 1 3m
;
341 2
33 4
m
; 141 0 1
3 0 3m
2 212 1 0 3 0 1 9 10d
2 223 4 1 2 3 9 1 10d
2 234 3 4 1 2 1 9 10d
2 214 3 0 1 0 9 1 10d
Opposite sides are parallel (same slope) and adjacent sides are perpendicular (product of slopes is 1 ). In addition, the length of all four sides is the same. Therefore, the vertices are for a square.
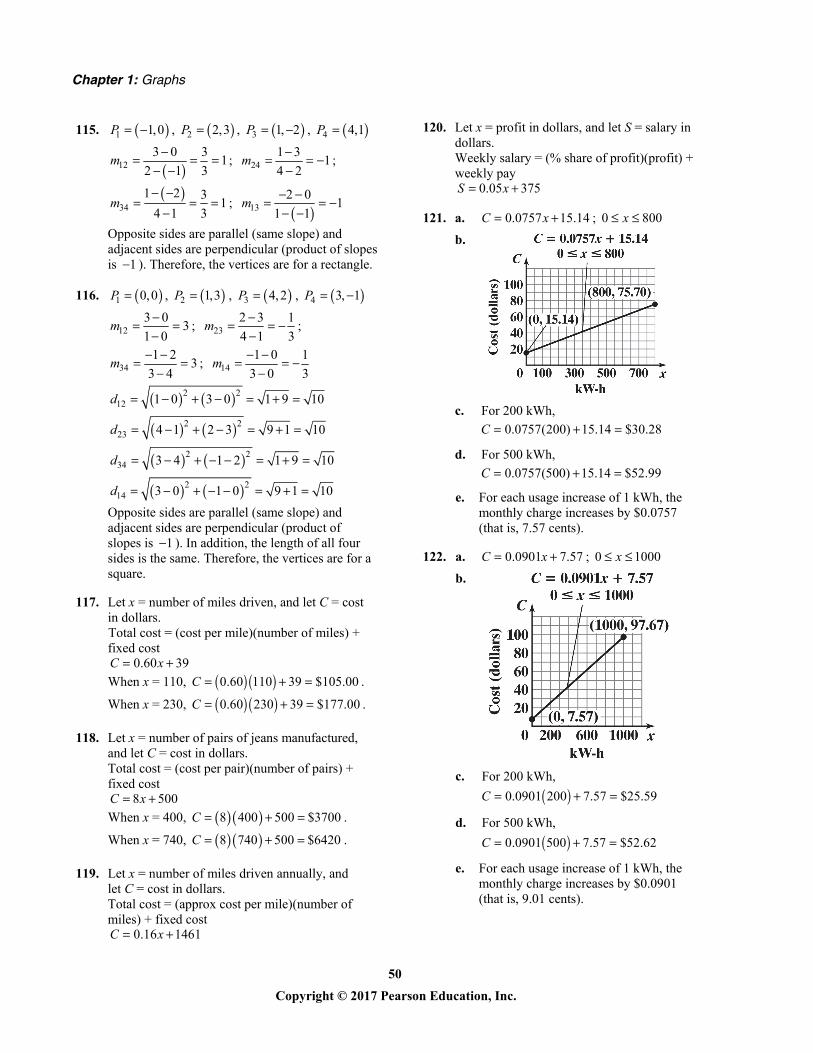
117. Let x = number of miles driven, and let C = cost in dollars. Total cost = (cost per mile)(number of miles) + fixed cost
0.60 39C x
When x = 110, 0.60 110 39 $105.00C .
When x = 230, 0.60 230 39 $177.00C .
118. Let x = number of pairs of jeans manufactured, and let C = cost in dollars. Total cost = (cost per pair)(number of pairs) + fixed cost
8 500C x
When x = 400, 8 400 500 $3700C .
When x = 740, 8 740 500 $6420C .
119. Let x = number of miles driven annually, and let C = cost in dollars. Total cost = (approx cost per mile)(number of miles) + fixed cost
0.16 1461C x
120. Let x = profit in dollars, and let S = salary in dollars. Weekly salary = (% share of profit)(profit) + weekly pay
0.05 375S x
121. a. 0.0757 15.14C x ; 0 800x
b.
c. For 200 kWh,
0.0757(200) 15.14 $30.28C
d. For 500 kWh,
0.0757(500) 15.14 $52.99C
e. For each usage increase of 1 kWh, the monthly charge increases by $0.0757 (that is, 7.57 cents).
122. a. 0.0901 7.57C x ; 0 1000x
b.
c. For 200 kWh,
0.0901 200 7.57 $25.59C
d. For 500 kWh,
0.0901 500 7.57 $52.62C
e. For each usage increase of 1 kWh, the monthly charge increases by $0.0901 (that is, 9.01 cents).
Section 1.4: Lines
51 Copyright © 2017 Pearson Education, Inc.
123. ( , ) (0, 32); ( , ) (100, 212)C F C F 212 32 180 9
slope 100 0 100 59
32 ( 0)59
32 ( )55
( 32)9
F C
F C
C F
If 70F , then 5 5
(70 32) (38)9 921.1
C
C
124. a. º 273K C
b. 5º (º 32)
9C F
5( 32) 273
95 160
º 2739 95 2297
º9 91
5 22979
K F
K F
K F
K F
125. a. The y-intercept is (0, 30), so b = 30. Since the ramp drops 2 inches for every 25 inches
of run, the slope is 2 2
25 25m . Thus,
the equation is 2
3025
y x .
b. Let y = 0.
20 30
252
3025
25 2 2530
2 25 2
375
x
x
x
x
The x-intercept is (375, 0). This means that the ramp meets the floor 375 inches (or 31.25 feet) from the base of the platform.
c. No. From part (b), the run is 31.25 feet which exceeds the required maximum of 30 feet.
d. First, design requirements state that the maximum slope is a drop of 1 inch for each
12 inches of run. This means 1
12m .
Second, the run is restricted to be no more than 30 feet = 360 inches. For a rise of 30 inches, this means the minimum slope is 30 1
360 12 . That is,
112
m . Thus, the
only possible slope is 1
12m . The
diagram indicates that the slope is negative. Therefore, the only slope that can be used to obtain the 30-inch rise and still meet design
requirements is 1
12m . In words, for
every 12 inches of run, the ramp must drop exactly 1 inch.
126. a. The year 2000 corresponds to x = 0, and the year 2013 corresponds to x = 13. Therefore, the points (0, 20.6) and (13, 8.5) are on the
line. Thus, 20.6 8.5 12.1
0.930 13 13
m
.
The y-intercept is 20.6, so b = 20.6 and the equation is 0.93 20.6y x
b. x-intercept: 0 0.93 20.6
22.15
xx
y-intercept: 0.93 0 20.6 20.6y
The intercepts are (22.15, 0) and (0, 20.6).
c. The y-intercept represents the percentage of twelfth graders in 2000 who had reported daily use of cigarettes. The x-intercept represents the number of years after 2000 when 0% of twelfth graders will have reported daily use of cigarettes.
d. The year 2025 corresponds to x = 25.
0.93 25 20.6 2.65y
This prediction is not reasonable since it is negative.
127. a. Let x = number of boxes to be sold, and A = money, in dollars, spent on advertising. We have the points
1 1( , ) (100,000, 40,000);x A
Chapter 1: Graphs
52 Copyright © 2017 Pearson Education, Inc.
2 2( , ) (200,000, 60,000)x A
60,000 40,000slope
200,000 100,000
20,000 1
100,000 5
140,000 100,000
51
40,000 20,00051
20,0005
A x
A x
A x
b. If x = 300,000, then
1300,000 20,000 $80,000
5A
c. Each additional box sold requires an additional $0.20 in advertising.
128. Find the slope of the line containing ,a b and
,b a :
slope 1a bb a
The slope of the line y x is 1.
Since 1 1 1 , the line containing the points ( , ) and ( , )a b b a is perpendicular to the line
y x .
The midpoint of ( , ) and ( , )a b b a is
,2 2
a b b aM
.
Since the coordinates are the same, the midpoint lies on the line y x .
Note: 2 2
a b b a
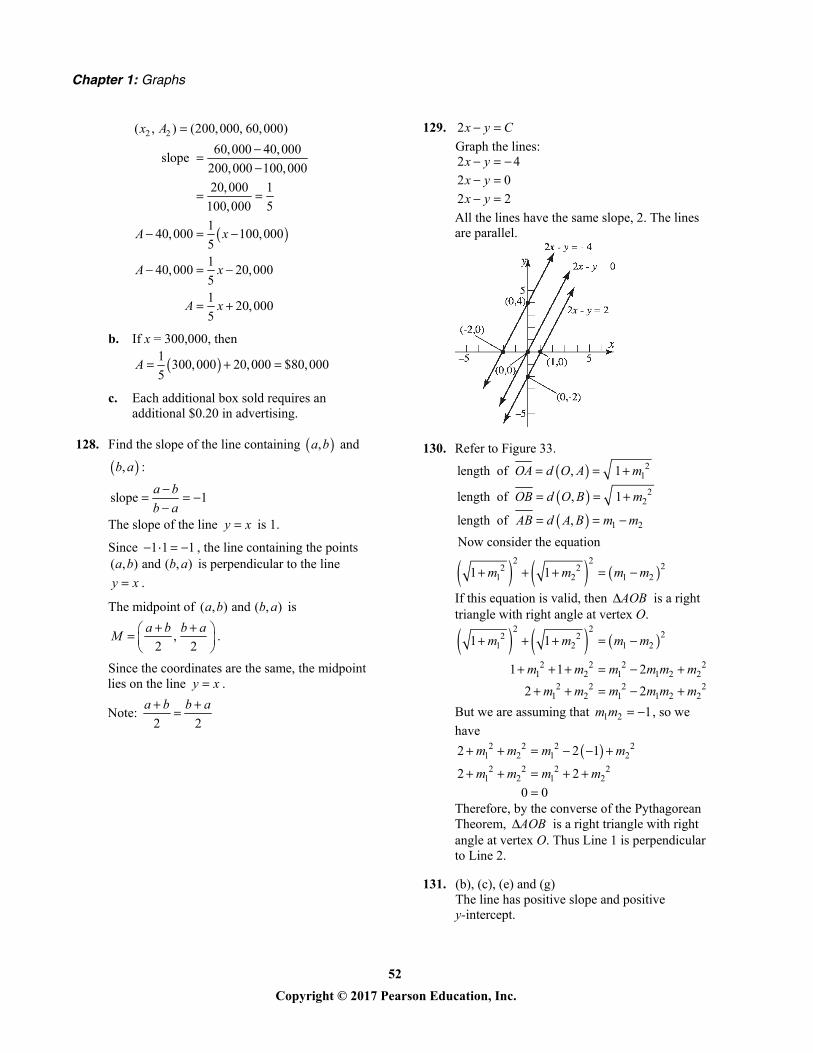
129. 2x y C Graph the lines: 2 4
2 0
2 2
x yx yx y
All the lines have the same slope, 2. The lines are parallel.
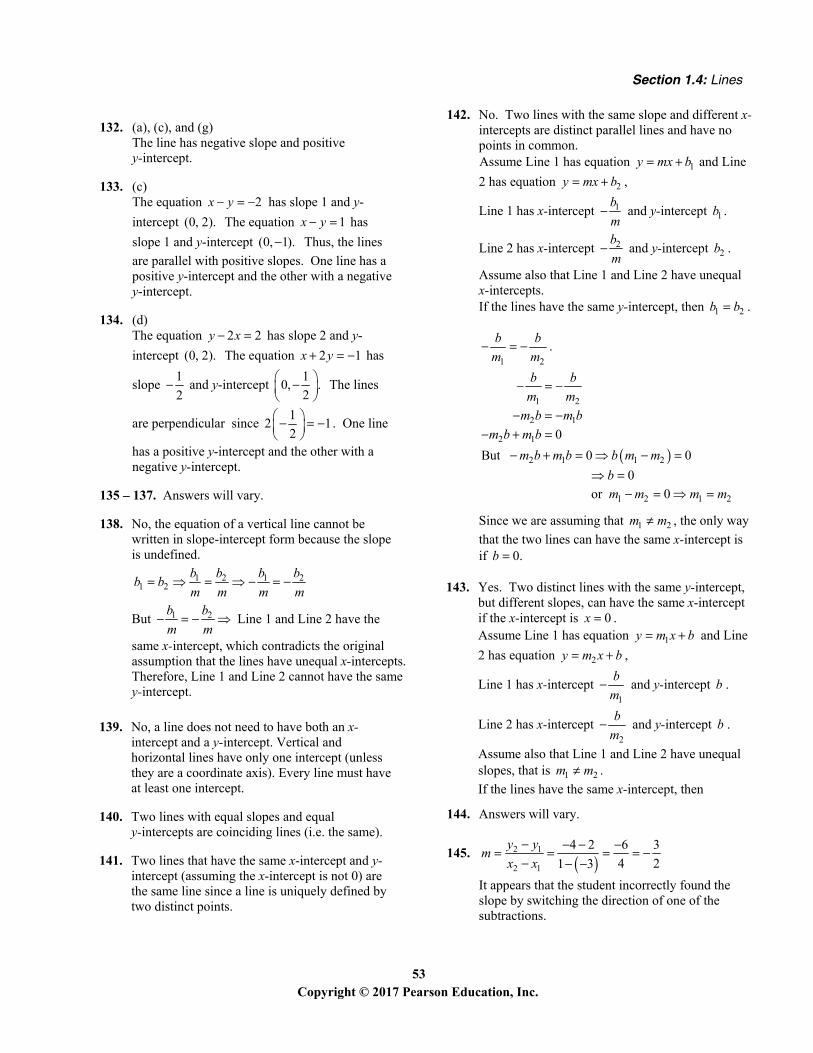
130. Refer to Figure 33.
21
22
1 2
length of , 1
length of , 1
length of ,
OA d O A m
OB d O B m
AB d A B m m
Now consider the equation
2 2
22 21 2 1 21 1m m m m
If this equation is valid, then AOB is a right triangle with right angle at vertex O.
2 2
22 21 2 1 2
2 2 2 21 2 1 1 2 2
2 2 2 21 2 1 1 2 2
1 1
1 1 2
2 2
m m m m
m m m m m mm m m m m m
But we are assuming that 1 2 1m m , so we
have
2 2 2 21 2 1 2
2 2 2 21 2 1 2
2 2 1
2 2
0 0
m m m m
m m m m
Therefore, by the converse of the Pythagorean Theorem, AOB is a right triangle with right angle at vertex O. Thus Line 1 is perpendicular to Line 2.
131. (b), (c), (e) and (g) The line has positive slope and positive y-intercept.
Section 1.4: Lines
53 Copyright © 2017 Pearson Education, Inc.
132. (a), (c), and (g) The line has negative slope and positive y-intercept.
133. (c) The equation 2x y has slope 1 and y-intercept (0, 2). The equation 1x y has
slope 1 and y-intercept (0, 1). Thus, the lines
are parallel with positive slopes. One line has a positive y-intercept and the other with a negative y-intercept.
134. (d) The equation 2 2y x has slope 2 and y-intercept (0, 2). The equation 2 1x y has
slope 1
2 and y-intercept
10, .
2
The lines
are perpendicular since 1
2 12
. One line
has a positive y-intercept and the other with a negative y-intercept.
135 – 137. Answers will vary.
138. No, the equation of a vertical line cannot be written in slope-intercept form because the slope is undefined.
139. No, a line does not need to have both an x-intercept and a y-intercept. Vertical and horizontal lines have only one intercept (unless they are a coordinate axis). Every line must have at least one intercept.
140. Two lines with equal slopes and equal y-intercepts are coinciding lines (i.e. the same).
141. Two lines that have the same x-intercept and y-intercept (assuming the x-intercept is not 0) are the same line since a line is uniquely defined by two distinct points.
142. No. Two lines with the same slope and different x-intercepts are distinct parallel lines and have no points in common. Assume Line 1 has equation 1y mx b and Line
2 has equation 2y mx b ,
Line 1 has x-intercept 1bm
and y-intercept 1b .
Line 2 has x-intercept 2bm
and y-intercept 2b .
Assume also that Line 1 and Line 2 have unequal x-intercepts. If the lines have the same y-intercept, then 1 2b b .
1 2 1 21 2
b b b bb bm m m m
But 1 2b bm m
Line 1 and Line 2 have the
same x-intercept, which contradicts the original assumption that the lines have unequal x-intercepts. Therefore, Line 1 and Line 2 cannot have the same y-intercept.
143. Yes. Two distinct lines with the same y-intercept, but different slopes, can have the same x-intercept if the x-intercept is 0x . Assume Line 1 has equation 1y m x b and Line
2 has equation 2y m x b ,
Line 1 has x-intercept 1
bm
and y-intercept b .
Line 2 has x-intercept 2
bm
and y-intercept b .
Assume also that Line 1 and Line 2 have unequal slopes, that is 1 2m m .
If the lines have the same x-intercept, then
1 2
b bm m
.
1 2
2 1
2 1 0
b bm mm b m b
m b m b
2 1 1 2
1 2 1 2
But 0 0
0
or 0
m b m b b m mbm m m m
Since we are assuming that 1 2m m , the only way
that the two lines can have the same x-intercept is if 0.b
144. Answers will vary.
145. 2 1
2 1
4 2 6 3
4 21 3
y ymx x
It appears that the student incorrectly found the slope by switching the direction of one of the subtractions.
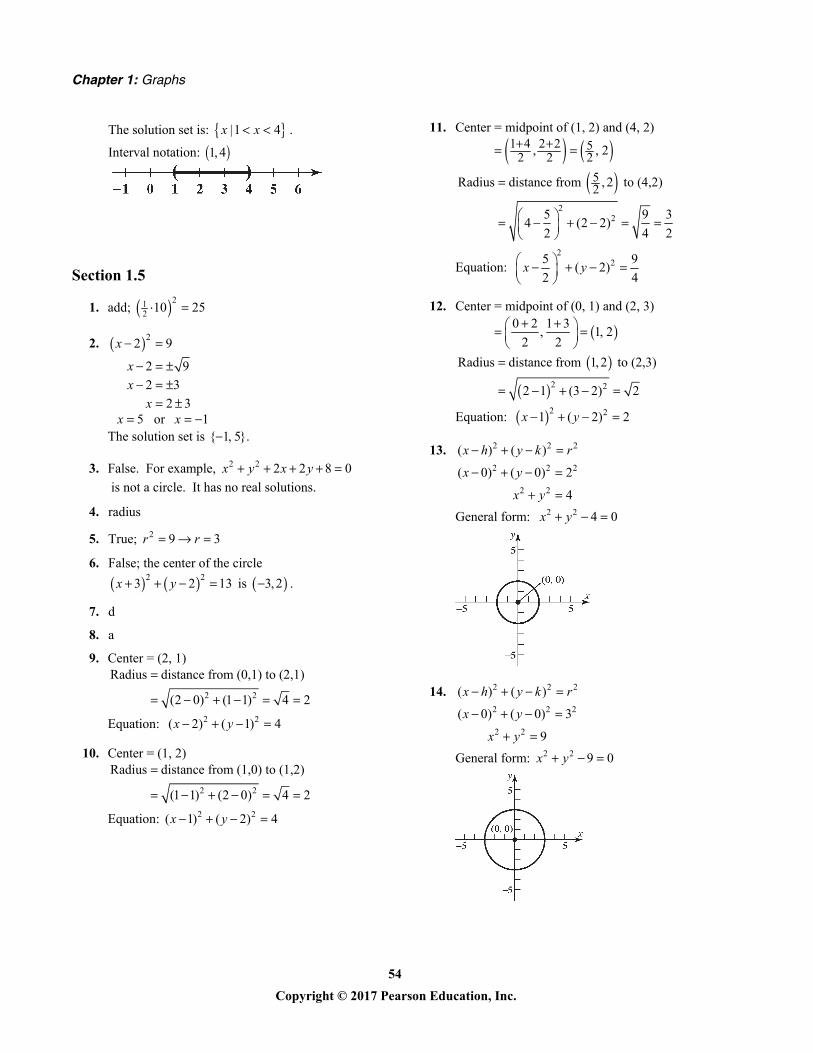
Chapter 1: Graphs
54 Copyright © 2017 Pearson Education, Inc.
The solution set is: |1 4x x .
Interval notation: 1, 4
Section 1.5
1. add; 212
10 25
2. 22 9
2 9
2 3
2 3
x
xxx
5 or 1x x The solution set is { 1, 5}.
3. False. For example, 2 2 2 2 8 0x y x y
is not a circle. It has no real solutions.
4. radius
5. True; 2 9 3r r
6. False; the center of the circle
2 23 2 13x y is 3,2 .
7. d
8. a
9. Center = (2, 1)
2 2
Radius distance from (0,1) to (2,1)
(2 0) (1 1) 4 2
Equation: 2 2( 2) ( 1) 4x y
10. Center = (1, 2)
2 2
Radius distance from (1,0) to (1,2)
(1 1) (2 0) 4 2
Equation: 2 2( 1) ( 2) 4x y
11. Center = midpoint of (1, 2) and (4, 2)
1 4 2 2 52 2 2, , 2
2
2
52Radius distance from , 2 to (4,2)
5 9 34 (2 2)
2 4 2
Equation: 2
25 9( 2)
2 4x y
12. Center = midpoint of (0, 1) and (2, 3)
0 2 1 3, 1, 2
2 2
2 2
Radius distance from 1,2 to (2,3)
2 1 (3 2) 2
Equation: 2 21 ( 2) 2x y
13. 2 2 2( ) ( )x h y k r 2 2 2
2 2
( 0) ( 0) 2
4
x y
x y
General form: 2 2 4 0x y
14. 2 2 2( ) ( )x h y k r 2 2 2
2 2
( 0) ( 0) 3
9
x y
x y
General form: 2 2 9 0x y
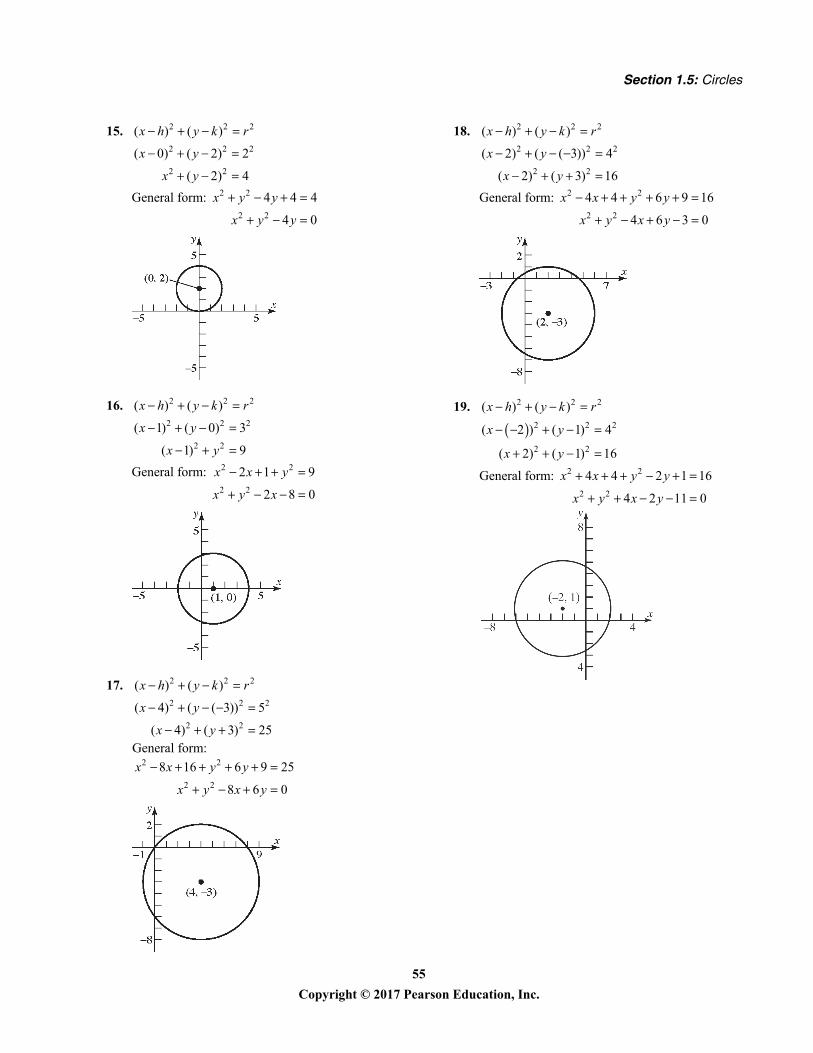
Section 1.5: Circles
55 Copyright © 2017 Pearson Education, Inc.
15. 2 2 2( ) ( )x h y k r 2 2 2
2 2
( 0) ( 2) 2
( 2) 4
x y
x y
General form: 2 2
2 2
4 4 4
4 0
x y y
x y y
16. 2 2 2( ) ( )x h y k r 2 2 2
2 2
( 1) ( 0) 3
( 1) 9
x y
x y
General form: 2 2
2 2
2 1 9
2 8 0
x x y
x y x
17. 2 2 2( ) ( )x h y k r 2 2 2
2 2
( 4) ( ( 3)) 5
( 4) ( 3) 25
x y
x y
General form: 2 2
2 2
8 16 6 9 25
8 6 0
x x y y
x y x y
18. 2 2 2( ) ( )x h y k r 2 2 2
2 2
( 2) ( ( 3)) 4
( 2) ( 3) 16
x y
x y
General form: 2 2
2 2
4 4 6 9 16
4 6 3 0
x x y y
x y x y
19. 2 2 2( ) ( )x h y k r
2 2 2
2 2
( 2 ) ( 1) 4
( 2) ( 1) 16
x y
x y
General form: 2 2
2 2
4 4 2 1 16
4 2 11 0
x x y y
x y x y
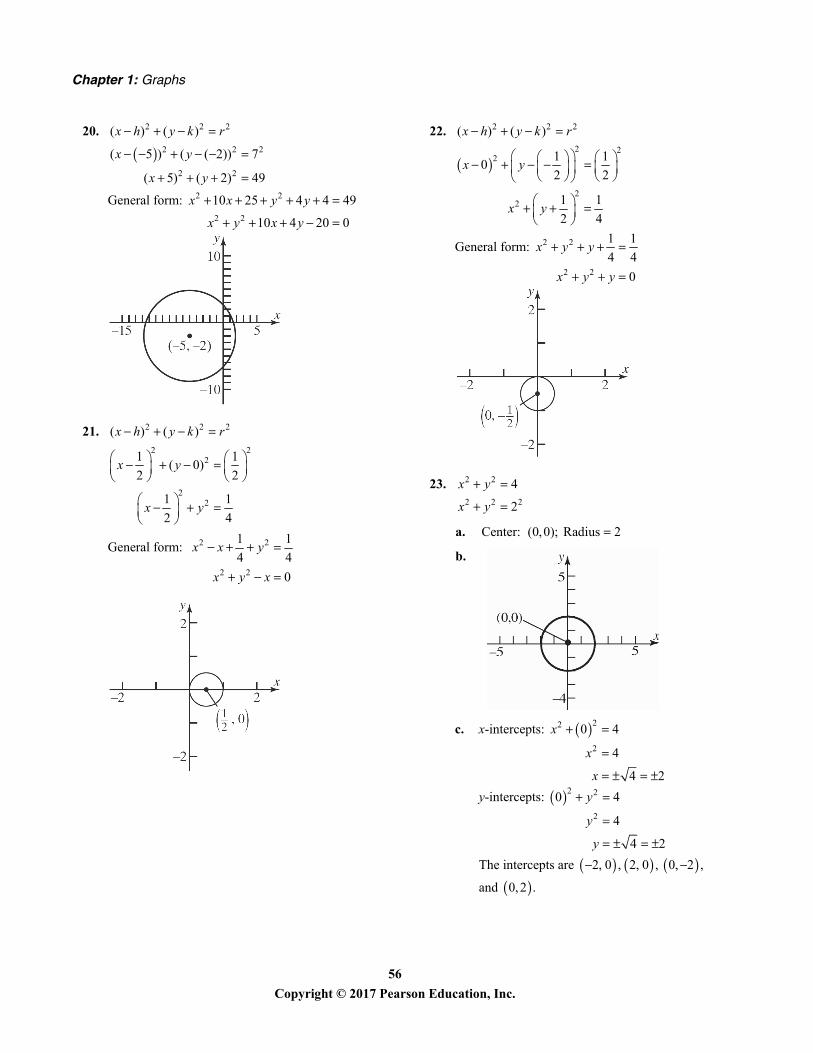
Chapter 1: Graphs
56 Copyright © 2017 Pearson Education, Inc.
20. 2 2 2( ) ( )x h y k r
2 2 2
2 2
( 5 ) ( ( 2)) 7
( 5) ( 2) 49
x y
x y
General form: 2 2
2 2
10 25 4 4 49
10 4 20 0
x x y y
x y x y
21. 2 2 2( ) ( )x h y k r 2 2
2
22
1 1( 0)
2 2
1 1
2 4
x y
x y
General form: 2 2
2 2
1 1
4 4
0
x x y
x y x
22. 2 2 2( ) ( )x h y k r
2 2
2
22
1 10
2 2
1 1
2 4
x y
x y
General form: 2 2
2 2
1 1
4 4
0
x y y
x y y
23. 2 2 4x y 2 2 22x y
a. Center: (0,0); Radius 2
b.
c. x-intercepts: 22
2
0 4
4
4 2
x
x
x
y-intercepts: 2 2
2
0 4
4
4 2
y
y
y
The intercepts are 2, 0 , 2, 0 , 0, 2 ,
and 0, 2 .
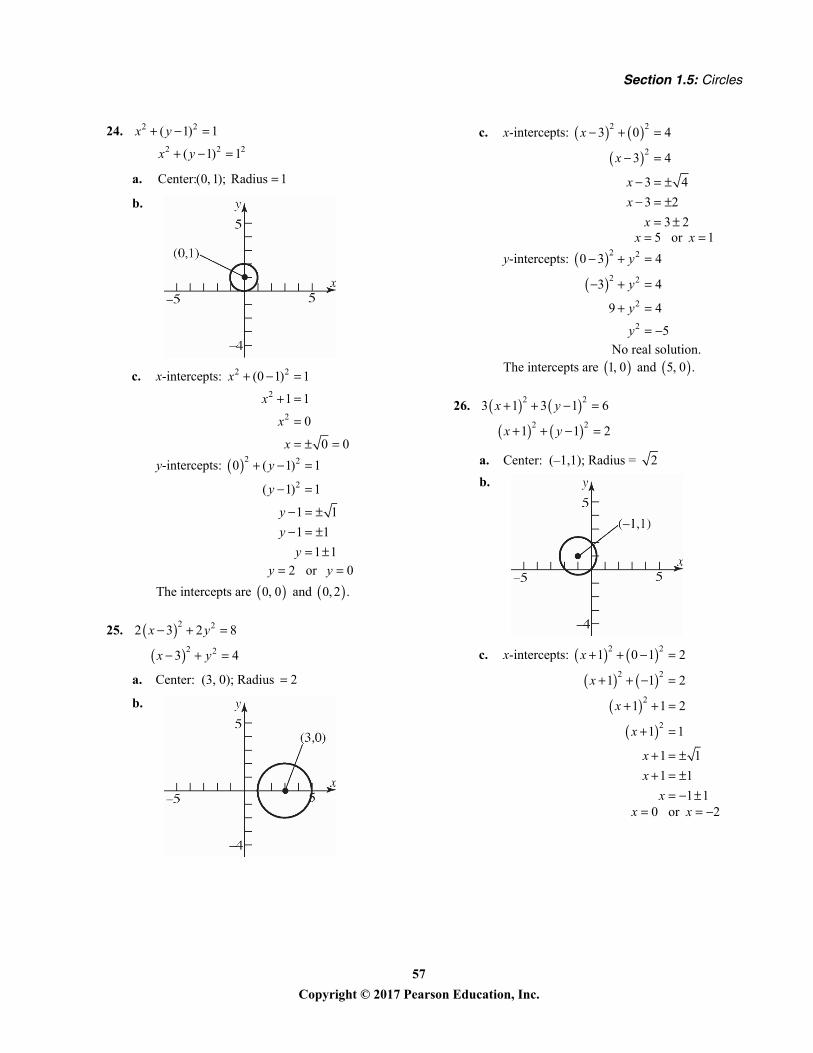
Section 1.5: Circles
57 Copyright © 2017 Pearson Education, Inc.
24. 2 2( 1) 1x y 2 2 2( 1) 1x y
a. Center:(0, 1); Radius 1
b.
c. x-intercepts: 2 2
2
2
(0 1) 1
1 1
0
0 0
x
x
x
x
y-intercepts: 2 2
2
0 ( 1) 1
( 1) 1
1 1
1 1
1 1
y
y
yyy
2 or 0y y
The intercepts are 0, 0 and 0,2 .
25. 2 22 3 2 8x y
2 23 4x y
a. Center: (3, 0); Radius 2
b.
c. x-intercepts:
2 2
2
3 0 4
3 4
3 4
3 2
3 2
x
x
xxx
5 or 1x x
y-intercepts:
2 2
2 2
2
2
0 3 4
3 4
9 4
5
y
y
y
y
No real solution. The intercepts are 1, 0 and 5, 0 .
26. 2 23 1 3 1 6x y
2 21 1 2x y
a. Center: (–1,1); Radius = 2
b.
c. x-intercepts:
2 2
2 2
2
2
1 0 1 2
1 1 2
1 1 2
1 1
1 1
1 1
1 1
x
x
x
x
xxx
0 or 2x x
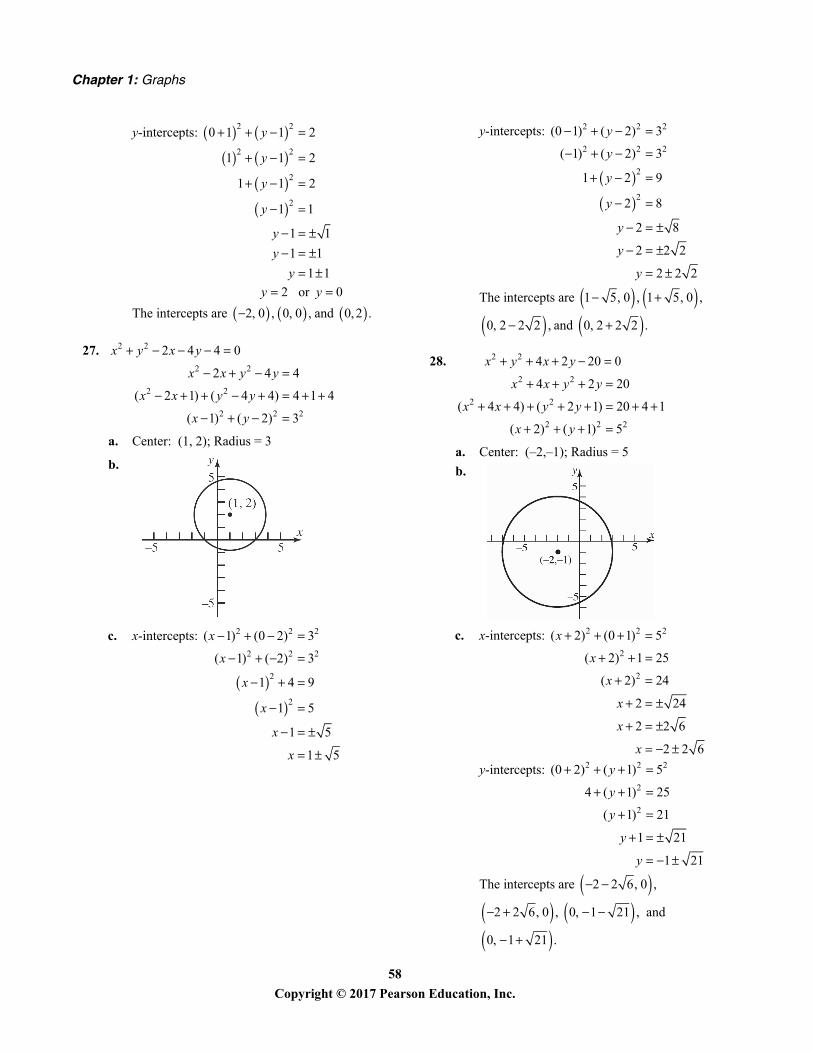
Chapter 1: Graphs
58 Copyright © 2017 Pearson Education, Inc.
y-intercepts:
2 2
2 2
2
2
0 1 1 2
1 1 2
1 1 2
1 1
1 1
1 1
1 1
y
y
y
y
yyy
2 or 0y y
The intercepts are 2, 0 , 0, 0 , and 0,2 .
27. 2 2 2 4 4 0x y x y 2 2
2 2
2 2 2
2 4 4
( 2 1) ( 4 4) 4 1 4
( 1) ( 2) 3
x x y y
x x y y
x y
a. Center: (1, 2); Radius = 3
b.
c. x-intercepts:
2 2 2
2 2 2
2
2
( 1) (0 2) 3
( 1) ( 2) 3
1 4 9
1 5
1 5
1 5
x
x
x
x
x
x
y-intercepts:
2 2 2
2 2 2
2
2
(0 1) ( 2) 3
( 1) ( 2) 3
1 2 9
2 8
2 8
2 2 2
2 2 2
y
y
y
y
y
y
y
The intercepts are 1 5, 0 , 1 5, 0 ,
0, 2 2 2 , and 0, 2 2 2 .
28. 2 2 4 2 20 0x y x y 2 2
2 2
2 2 2
4 2 20
( 4 4) ( 2 1) 20 4 1
( 2) ( 1) 5
x x y y
x x y y
x y
a. Center: (–2,–1); Radius = 5
b.
c. x-intercepts: 2 2 2
2
2
( 2) (0 1) 5
( 2) 1 25
( 2) 24
2 24
2 2 6
2 2 6
x
x
x
x
x
x
y-intercepts: 2 2 2
2
2
(0 2) ( 1) 5
4 ( 1) 25
( 1) 21
1 21
1 21
y
y
y
y
y
The intercepts are 2 2 6, 0 ,
2 2 6, 0 , 0, 1 21 , and
0, 1 21 .
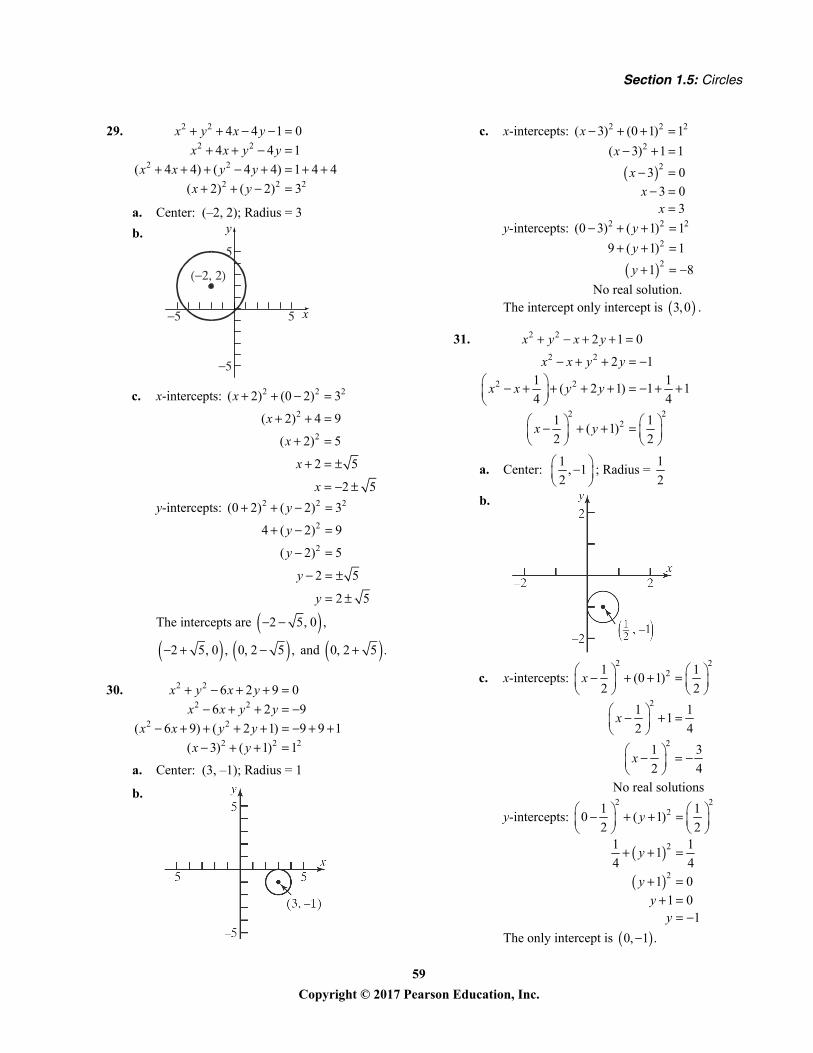
Section 1.5: Circles
59 Copyright © 2017 Pearson Education, Inc.
29. 2 2
2 2
2 2
2 2 2
4 4 1 0
4 4 1
( 4 4) ( 4 4) 1 4 4
( 2) ( 2) 3
x y x yx x y y
x x y yx y
a. Center: (–2, 2); Radius = 3
b. y
x
c. x-intercepts: 2 2 2
2
2
( 2) (0 2) 3
( 2) 4 9
( 2) 5
2 5
2 5
x
x
x
x
x
y-intercepts: 2 2 2
2
2
(0 2) ( 2) 3
4 ( 2) 9
( 2) 5
2 5
2 5
y
y
y
y
y
The intercepts are 2 5, 0 ,
2 5, 0 , 0, 2 5 , and 0, 2 5 .
30. 2 2
2 2
2 2
2 2 2
6 2 9 0
6 2 9
( 6 9) ( 2 1) 9 9 1
( 3) ( 1) 1
x y x yx x y y
x x y yx y
a. Center: (3, –1); Radius = 1
b.
c. x-intercepts:
2 2 2
2
2
( 3) (0 1) 1
( 3) 1 1
3 0
3 03
xxxxx
y-intercepts:
2 2 2
2
2
(0 3) ( 1) 1
9 ( 1) 1
1 8
yyy
No real solution. The intercept only intercept is 3,0 .
31. 2 2 2 1 0x y x y 2 2
2 2
2 22
2 11 1
( 2 1) 1 14 4
1 1( 1)
2 2
x x y y
x x y y
x y
a. Center: 1
, 12
; Radius = 1
2
b.
c. x-intercepts: 2 2
2
2
2
1 1(0 1)
2 2
1 11
2 4
1 3
2 4
x
x
x
No real solutions
y-intercepts:
2 22
2
2
1 10 ( 1)
2 21 1
14 4
1 0
1 01
y
y
yyy
The only intercept is 0, 1 .
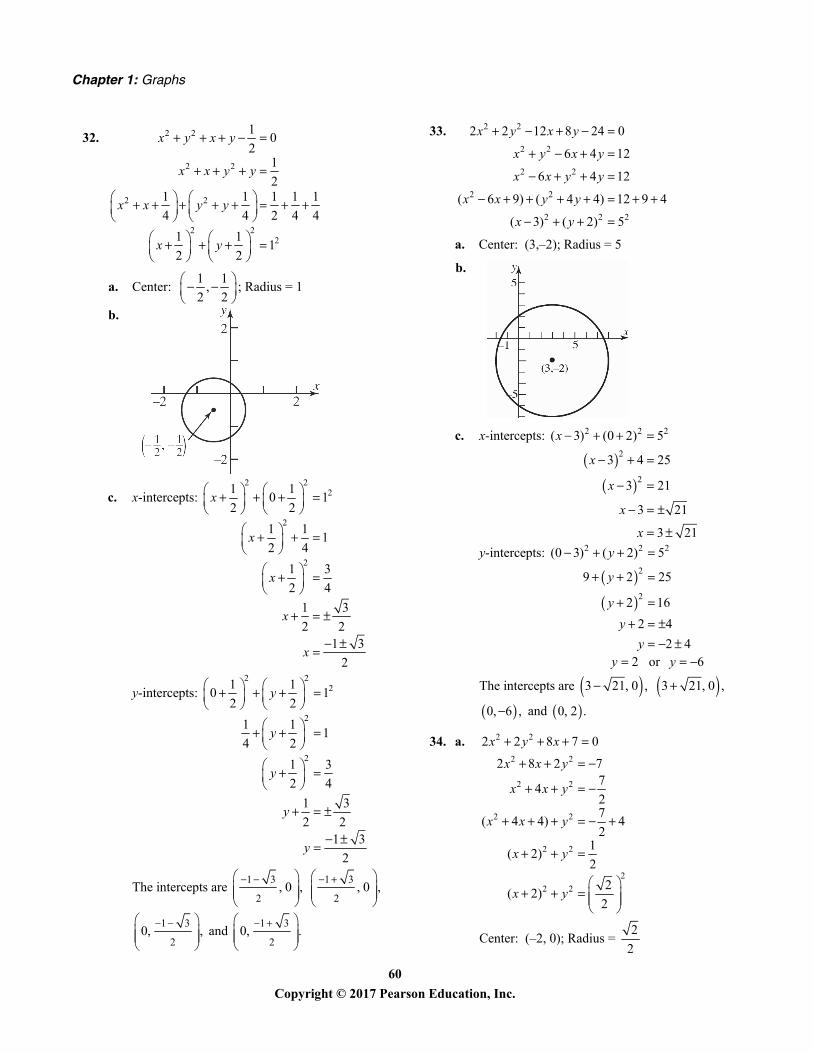
Chapter 1: Graphs
60 Copyright © 2017 Pearson Education, Inc.
32. 2 2
2 2
2 2
2 22
10
21
21 1 1 1 1
4 4 2 4 4
1 11
2 2
x y x y
x x y y
x x y y
x y
a. Center: 1 1
,2 2
; Radius = 1
b.
c. x-intercepts: 2 2
2
2
2
1 10 1
2 2
1 11
2 4
1 3
2 4
1 3
2 21 3
2
x
x
x
x
x
y-intercepts: 2 2
2
2
2
1 10 1
2 2
1 11
4 2
1 3
2 4
1 3
2 21 3
2
y
y
y
y
y
The intercepts are 1 3
2, 0 ,
1 3
2, 0 ,
1 3
20, ,
and 1 3
20, .
33. 2 2
2 2
2 2
2 2
2 2 2
2 2 12 8 24 0
6 4 12
6 4 12
( 6 9) ( 4 4) 12 9 4
( 3) ( 2) 5
x y x y
x y x y
x x y y
x x y y
x y
a. Center: (3,–2); Radius = 5
b.
c. x-intercepts:
2 2 2
2
2
( 3) (0 2) 5
3 4 25
3 21
3 21
3 21
x
x
x
x
x
y-intercepts:
2 2 2
2
2
(0 3) ( 2) 5
9 2 25
2 16
2 4
2 4
y
y
yyy
2 or 6y y
The intercepts are 3 21, 0 , 3 21, 0 ,
0, 6 , and 0, 2 .
34. a. 2 22 2 8 7 0x y x 2 2
2 2
2 2
2 2
2
2 2
2 8 2 77
427
( 4 4) 42
1( 2)
2
2( 2)
2
x x y
x x y
x x y
x y
x y
Center: (–2, 0); Radius = 2
2
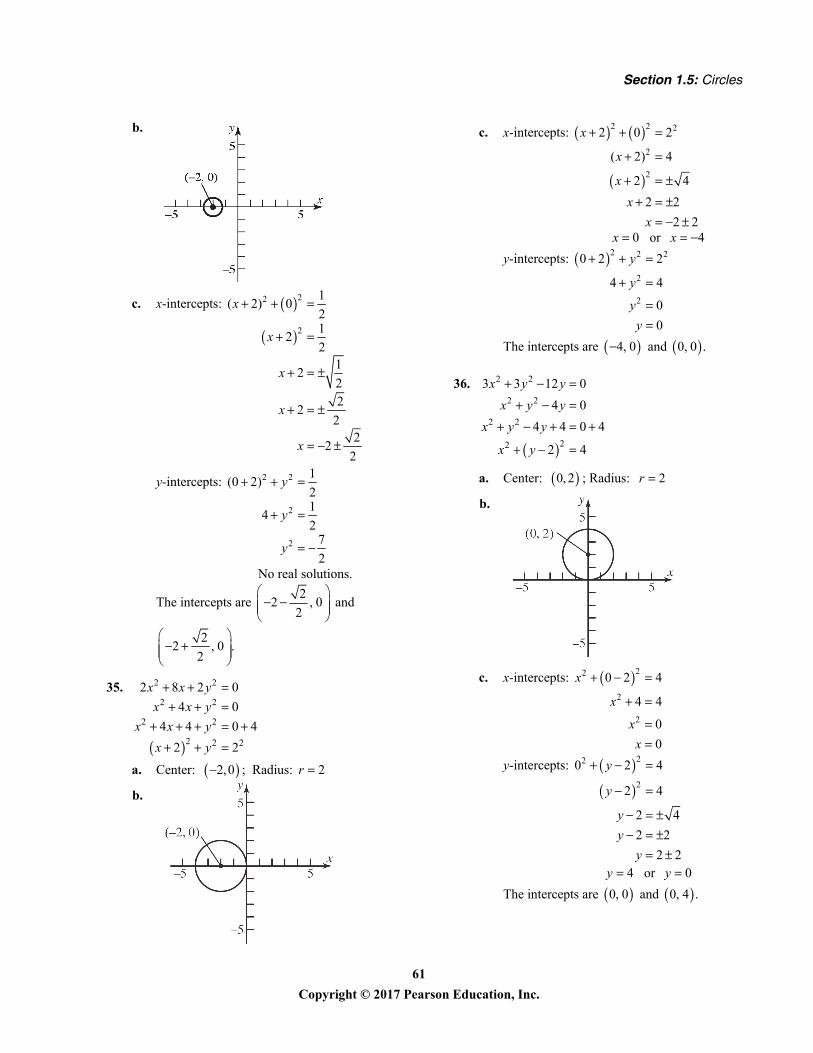
Section 1.5: Circles
61 Copyright © 2017 Pearson Education, Inc.
b.
c. x-intercepts:
22
2
1( 2) 0
21
22
12
22
22
22
2
x
x
x
x
x
y-intercepts: 2 2
2
2
1(0 2)
21
42
7
2
y
y
y
No real solutions.
The intercepts are 2
2 , 02
and
22 , 0 .
2
35.
2 2
2 2
2 2
2 2 2
2 8 2 0
4 0
4 4 0 4
2 2
x x yx x y
x x yx y
a. Center: 2,0 ; Radius: 2r
b.
c. x-intercepts:
2 2 2
2
2
2 0 2
( 2) 4
2 4
2 2
2 2
x
x
xxx
0 or 4x x
y-intercepts: 2 2 2
2
2
0 2 2
4 4
0
0
y
y
yy
The intercepts are 4, 0 and 0, 0 .
36.
2 2
2 2
2 2
22
3 3 12 0
4 0
4 4 0 4
2 4
x y yx y y
x y y
x y
a. Center: 0, 2 ; Radius: 2r
b.
c. x-intercepts: 22
2
2
0 2 4
4 4
0
0
x
x
xx
y-intercepts:
22
2
0 2 4
2 4
2 4
2 2
2 2
y
y
yyy
4 or 0y y
The intercepts are 0, 0 and 0, 4 .
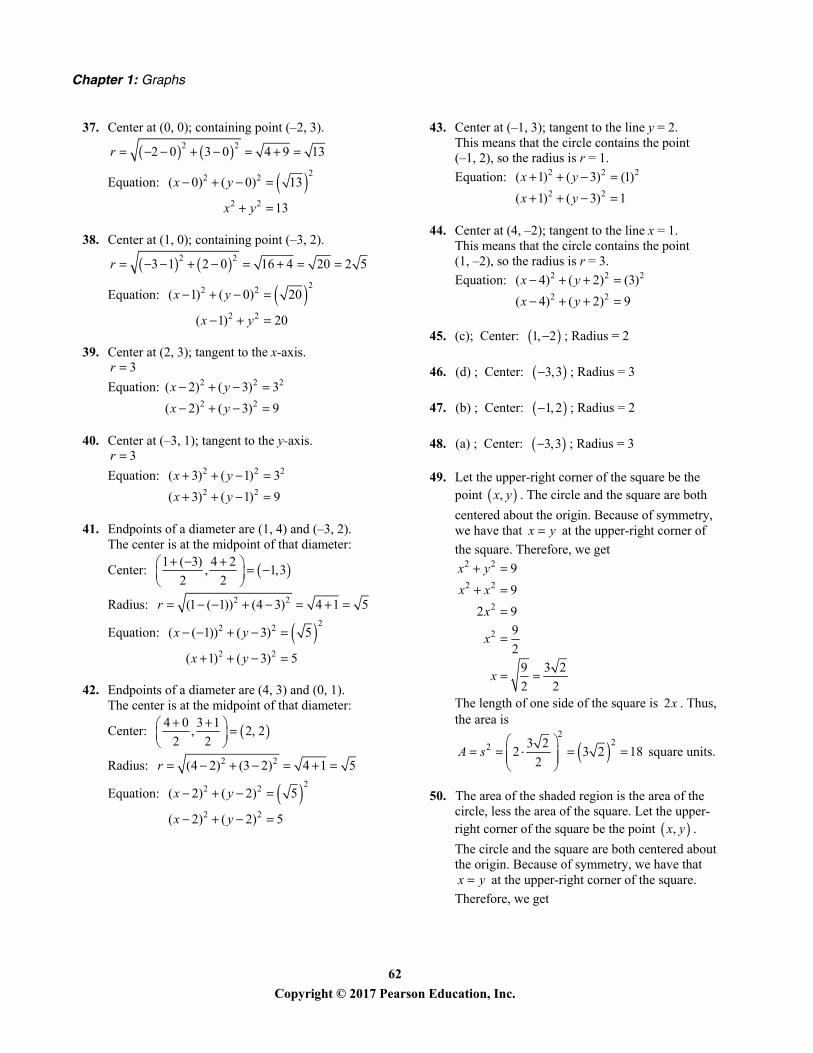
Chapter 1: Graphs
62 Copyright © 2017 Pearson Education, Inc.
37. Center at (0, 0); containing point (–2, 3).
2 22 0 3 0 4 9 13r
Equation: 22 2
2 2
( 0) ( 0) 13
13
x y
x y
38. Center at (1, 0); containing point (–3, 2).
2 23 1 2 0 16 4 20 2 5r
Equation: 22 2
2 2
( 1) ( 0) 20
( 1) 20
x y
x y
39. Center at (2, 3); tangent to the x-axis. 3r
Equation: 2 2 2
2 2
( 2) ( 3) 3
( 2) ( 3) 9
x yx y
40. Center at (–3, 1); tangent to the y-axis. 3r
Equation: 2 2 2
2 2
( 3) ( 1) 3
( 3) ( 1) 9
x yx y
41. Endpoints of a diameter are (1, 4) and (–3, 2). The center is at the midpoint of that diameter:
Center: 1 ( 3) 4 2, 1,3
2 2
Radius: 2 2(1 ( 1)) (4 3) 4 1 5r
Equation: 22 2
2 2
( ( 1)) ( 3) 5
( 1) ( 3) 5
x y
x y
42. Endpoints of a diameter are (4, 3) and (0, 1). The center is at the midpoint of that diameter:
Center: 4 0 3 1, 2, 2
2 2
Radius: 2 2(4 2) (3 2) 4 1 5r
Equation: 22 2
2 2
( 2) ( 2) 5
( 2) ( 2) 5
x y
x y
43. Center at (–1, 3); tangent to the line y = 2. This means that the circle contains the point (–1, 2), so the radius is r = 1.
Equation: 2 2 2
2 2
( 1) ( 3) (1)
( 1) ( 3) 1
x yx y
44. Center at (4, –2); tangent to the line x = 1. This means that the circle contains the point (1, –2), so the radius is r = 3.
Equation: 2 2 2
2 2
( 4) ( 2) (3)
( 4) ( 2) 9
x yx y
45. (c); Center: 1, 2 ; Radius = 2
46. (d) ; Center: 3,3 ; Radius = 3
47. (b) ; Center: 1, 2 ; Radius = 2
48. (a) ; Center: 3,3 ; Radius = 3
49. Let the upper-right corner of the square be the point ,x y . The circle and the square are both
centered about the origin. Because of symmetry, we have that x y at the upper-right corner of
the square. Therefore, we get 2 2
2 2
2
2
9
9
2 9
9
2
9 3 2
2 2
x yx x
x
x
x
The length of one side of the square is 2x . Thus, the area is
2
22 3 22 3 2 18
2A s
square units.
50. The area of the shaded region is the area of the circle, less the area of the square. Let the upper-right corner of the square be the point ,x y .
The circle and the square are both centered about the origin. Because of symmetry, we have that x y at the upper-right corner of the square.
Therefore, we get
Section 1.5: Circles
63 Copyright © 2017 Pearson Education, Inc.
2 2
2 2
2
2
36
36
2 36
18
3 2
x yx x
xxx
The length of one side of the square is 2x . Thus,
the area of the square is 22 3 2 72 square
units. From the equation of the circle, we have 6r . The area of the circle is
22 6 36r square units.
Therefore, the area of the shaded region is 36 72A square units.
51. The diameter of the Ferris wheel was 250 feet, so the radius was 125 feet. The maximum height was 264 feet, so the center was at a height of 264 125 139 feet above the ground. Since the center of the wheel is on the y-axis, it is the point (0, 139). Thus, an equation for the wheel is:
2 2 2
22
0 139 125
139 15,625
x y
x y
52. The diameter of the wheel is 520 feet, so the radius is 260 feet. The maximum height is 550 feet, so the center of the wheel is at a height of 550 260 290 feet above the ground. Since the center of the wheel is on the y-axis, it is the point (0, 290). Thus, an equation for the wheel is:
2 2 2
22
0 290 260
290 67,600
x y
x y
53. 2 2 2 4 4091 0x y x y
2 2
2 2
2 2
2 4 4091 0
2 1 4 4 4091 5
1 2 4096
x x y y
x x y y
x y
The circle representing Earth has center 1, 2
and radius = 4096 64 . So the radius of the satellite’s orbit is 64 0.6 64.6 units. The equation of the orbit is
2 2 2
2 2
1 2 64.6
2 4 4168.16 0
x y
x y x y
54. a. 2 2 2
2 2 2 2 2
2 2 2 2
( )
2
(1 ) 2 0
x mx b r
x m x bmx b r
m x bmx b r
There is one solution if and only if the discriminant is zero.
2 2 2 2
2 2 2 2 2 2 2 2
2 2 2 2
2 2 2 2
2 2 2
(2 ) 4(1 )( ) 0
4 4 4 4 4 0
4 4 4 0
0
(1 )
bm m b r
b m b r b m m r
b r m r
b r m r
r m b
b. Using the quadratic formula, the result from part (a), and knowing that the discriminant is zero, we get:
2 2 2 2(1 ) 2 0m x bmx b r 2 2
2 22
2
2
2 2 2 2 2 2
2
2(1 )
bm bm bmr mrxbm bb
r
mry m bb
m r m r b rbb b b
c. The slope of the tangent line is m . The slope of the line joining the point of tangency and the center is:
2
2
22
01
0
rb r b
b mmrmrb
Therefore, the tangent line is perpendicular to the line containing the center of the circle and the point of tangency.
55. 2 2 9x y Center: (0, 0)
Slope from center to 1, 2 2 is
2 2 0 2 22 2
1 0 1
.
Slope of the tangent line is 1 2
42 2
.
Chapter 1: Graphs
64 Copyright © 2017 Pearson Education, Inc.
Equation of the tangent line is:
22 2 1
4
2 22 2
4 4
4 8 2 2 2
2 4 9 2
2 4 9 2 0
y x
y x
y x
x y
x y
56. 2 2 4 6 4 0x y x y 2 2
2 2
( 4 4) ( 6 9) 4 4 9
( 2) ( 3) 9
x x y y
x y
Center: (2, –3)
Slope from center to 3,2 2 3 is
2 2 3 ( 3) 2 22 2
3 2 1
Slope of the tangent line is: 1 2
42 2
Equation of the tangent line:
22 2 3 ( 3)
4
2 3 22 2 3
4 4
4 8 2 12 2 3 2
2 4 11 2 12 0
y x
y x
y x
x y
57. Let ( , )h k be the center of the circle.
2 4 0
2 4
12
2
x yy x
y x
The slope of the tangent line is 1
2. The slope
from ( , )h k to (0, 2) is –2.
22
02 2
khk h
The other tangent line is 2 7y x , and it has
slope 2. The slope from ( , )h k to (3, –1) is
1
2 .
1 1
3 22 2 3
2 1
1 2
khk hk hh k
Solve the two equations in and h k : 2 2(1 2 )
2 2 4
3 0
0
k kk kkk
1 2(0) 1h
The center of the circle is (1, 0). 58. Find the centers of the two circles:
2 2
2 2
2 2
4 6 4 0
( 4 4) ( 6 9) 4 4 9
( 2) ( 3) 9
x y x y
x x y y
x y
Center: 2, 3
2 2
2 2
2 2
6 4 9 0
( 6 9) ( 4 4) 9 9 4
( 3) ( 2) 4
x y x y
x x y y
x y
Center: 3, 2
Find the slope of the line containing the centers: 2 ( 3) 1
3 2 5m
Find the equation of the line containing the centers:
13 ( 2)
55 15 2
5 13
5 13 0
y x
y xx y
x y
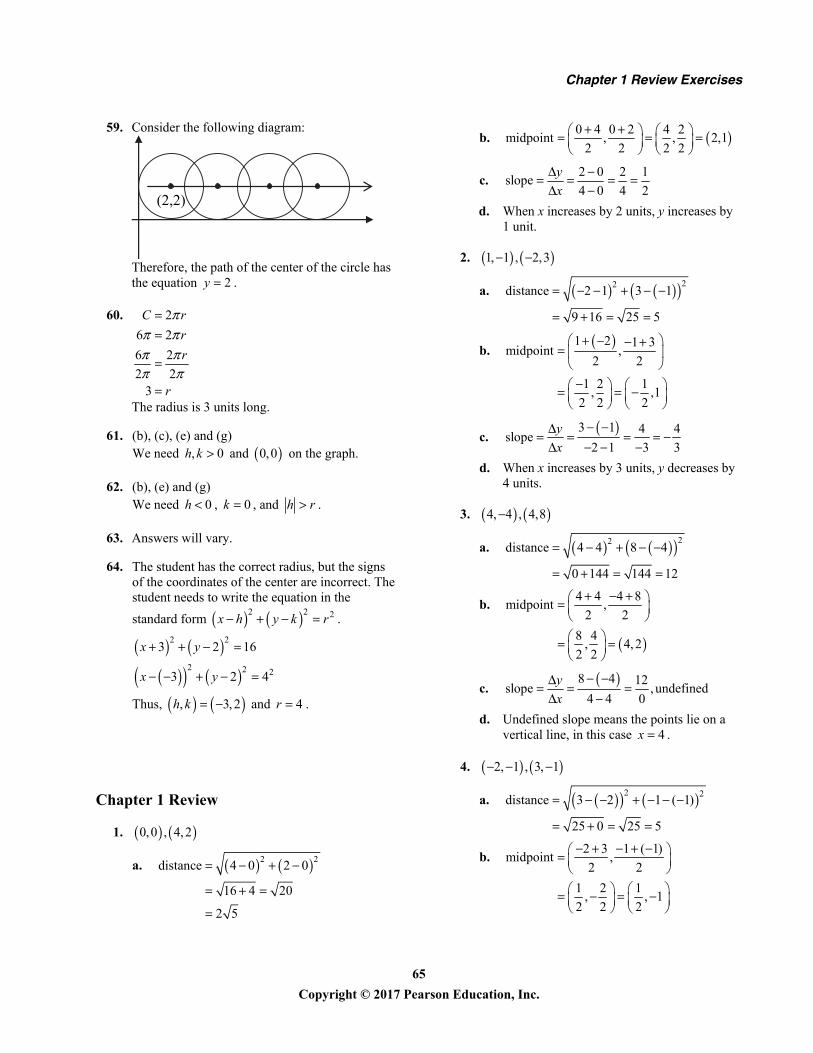
Chapter 1 Review Exercises
65 Copyright © 2017 Pearson Education, Inc.
59. Consider the following diagram:
(2,2)
Therefore, the path of the center of the circle has the equation 2y .
60. 2
6 2
6 2
2 23
C rrr
r
The radius is 3 units long.
61. (b), (c), (e) and (g) We need , 0h k and 0,0 on the graph.
62. (b), (e) and (g) We need 0h , 0k , and h r .
63. Answers will vary.
64. The student has the correct radius, but the signs of the coordinates of the center are incorrect. The student needs to write the equation in the
standard form 2 2 2x h y k r .
2 2
2 2 2
3 2 16
3 2 4
x y
x y
Thus, , 3, 2h k and 4r .
Chapter 1 Review
1. 0,0 , 4,2
a. 2 2distance 4 0 2 0
16 4 20
2 5
b. 0 4 0 2 4 2midpoint , , 2,1
2 2 2 2
c. 2 0 2 1slope
4 0 4 2
yx
d. When x increases by 2 units, y increases by 1 unit.
2. 1, 1 , 2,3
a. 22distance 2 1 3 1
9 16 25 5
b. 1 2 1 3midpoint ,
2 2
1 2 1, ,1
2 2 2
c. 3 1 4 4slope
2 1 3 3
yx
d. When x increases by 3 units, y decreases by 4 units.
3. 4, 4 , 4,8
a. 22distance 4 4 8 4
0 144 144 12
b.
4 4 4 8midpoint ,
2 2
8 4, 4,2
2 2
c. 8 4 12slope ,undefined
4 4 0
yx
d. Undefined slope means the points lie on a vertical line, in this case 4x .
4. 2, 1 , 3, 1
a. 2 2distance 3 2 1 ( 1)
25 0 25 5
b. 2 3 1 ( 1)midpoint ,
2 2
1 2 1, , 1
2 2 2
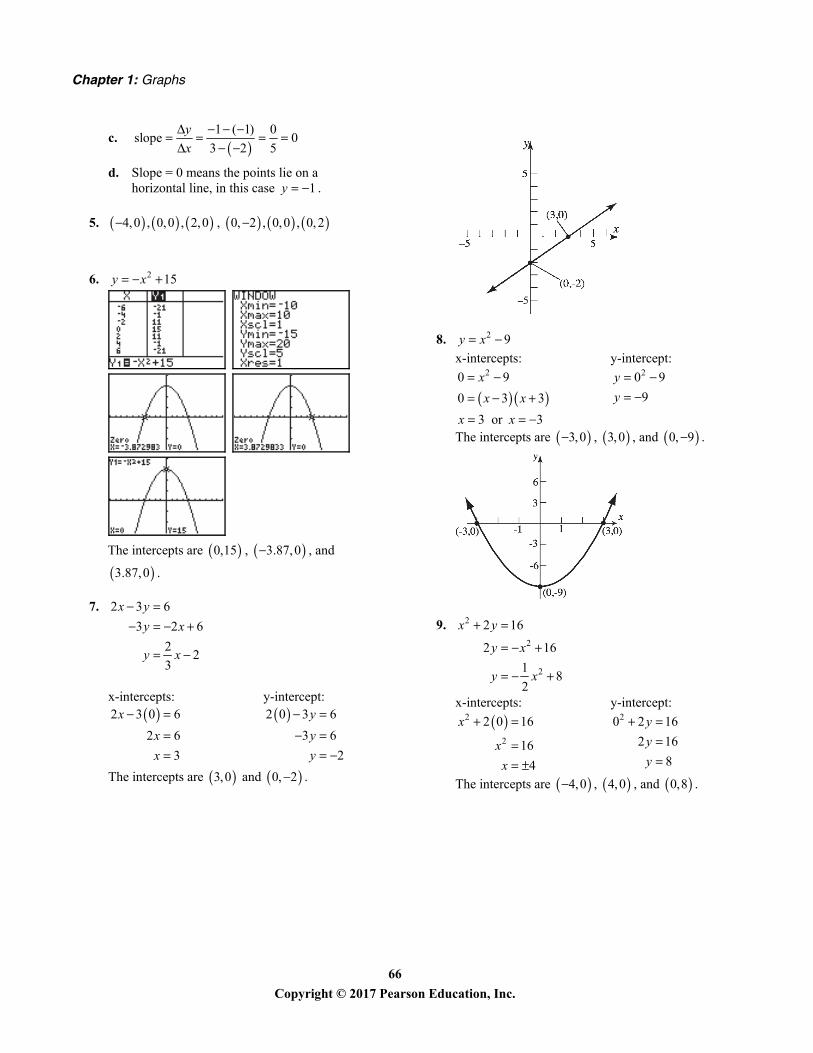
Chapter 1: Graphs
66 Copyright © 2017 Pearson Education, Inc.
c.
1 ( 1) 0slope 0
3 2 5
yx
d. Slope = 0 means the points lie on a horizontal line, in this case 1y .
5. 4,0 , 0,0 , 2,0 , 0, 2 , 0,0 , 0,2
6. 2 15y x
The intercepts are 0,15 , 3.87,0 , and
3.87,0 .
7. 2 3 6
3 2 6
22
3
x yy x
y x
x-intercepts: y-intercept:
2 3 0 6
2 6
3
xxx
2 0 3 6
3 6
2
yyy
The intercepts are 3,0 and 0, 2 .
8. 2 9y x x-intercepts: y-intercept:
20 9
0 3 3
3 or 3
xx x
x x
20 9
9
yy
The intercepts are 3,0 , 3,0 , and 0, 9 .
9. 2
2
2
2 16
2 16
18
2
x y
y x
y x
x-intercepts: y-intercept:
2
2
2 0 16
16
4
x
xx
20 2 16
2 16
8
yyy
The intercepts are 4,0 , 4,0 , and 0,8 .
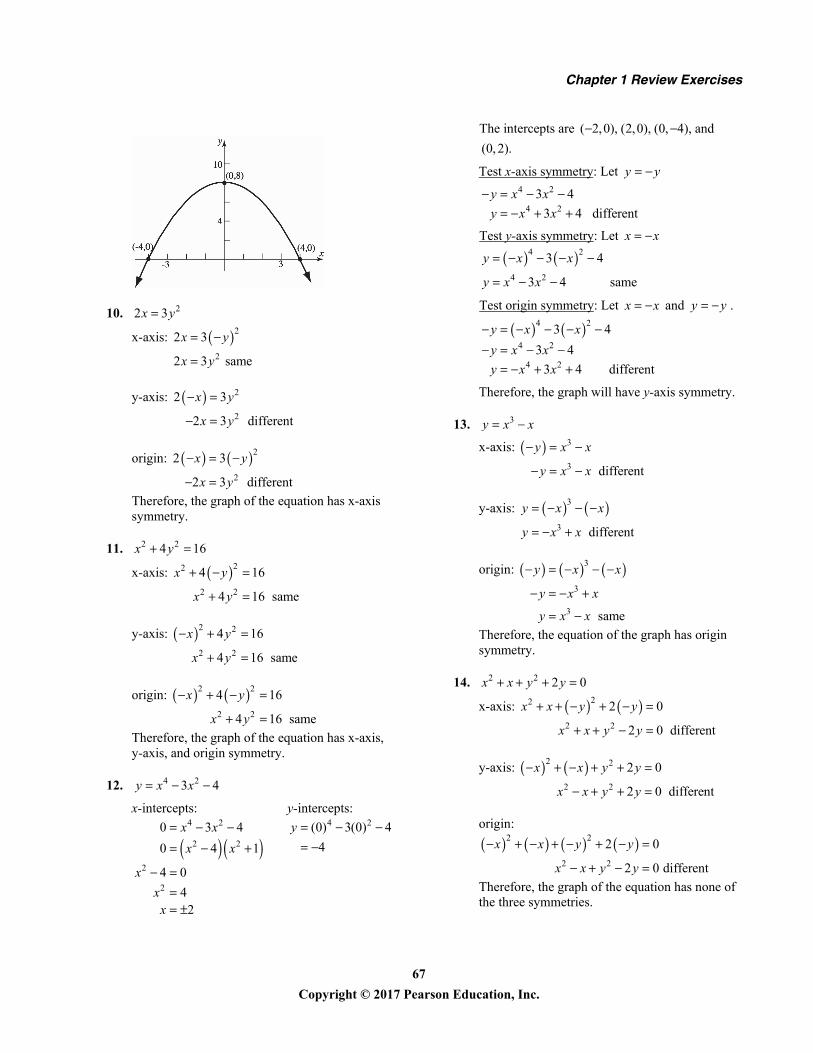
Chapter 1 Review Exercises
67 Copyright © 2017 Pearson Education, Inc.
10. 22 3x y
x-axis: 2
2
2 3
2 3 same
x y
x y
y-axis: 2
2
2 3
2 3 different
x y
x y
origin: 2
2
2 3
2 3 different
x y
x y
Therefore, the graph of the equation has x-axis symmetry.
11. 2 24 16x y
x-axis: 22
2 2
4 16
4 16 same
x y
x y
y-axis: 2 2
2 2
4 16
4 16 same
x y
x y
origin: 2 2
2 2
4 16
4 16 same
x y
x y
Therefore, the graph of the equation has x-axis, y-axis, and origin symmetry.
12. 4 23 4y x x
x-intercepts: y-intercepts:
4 2
2 2
2
2
0 3 4
0 4 1
4 0
42
x xx x
xxx
4 2(0) 3(0) 4
4
y
The intercepts are ( 2,0), (2,0), (0, 4), and
(0, 2).
Test x-axis symmetry: Let y y 4 2
4 2
3 4
3 4 different
y x xy x x
Test y-axis symmetry: Let x x
4 2
4 2
3 4
3 4 same
y x x
y x x
Test origin symmetry: Let x x and y y .
4 2
4 2
4 2
3 4
3 4
3 4 different
y x xy x xy x x
Therefore, the graph will have y-axis symmetry.
13. 3y x x
x-axis: 3
3 different
y x x
y x x
y-axis: 3
3 different
y x x
y x x
origin: 3
3
3 same
y x x
y x x
y x x
Therefore, the equation of the graph has origin symmetry.
14. 2 2 2 0x x y y
x-axis: 22
2 2
2 0
2 0 different
x x y y
x x y y
y-axis: 2 2
2 2
2 0
2 0 different
x x y y
x x y y
origin:
2 2
2 2
2 0
2 0 different
x x y y
x x y y
Therefore, the graph of the equation has none of the three symmetries.
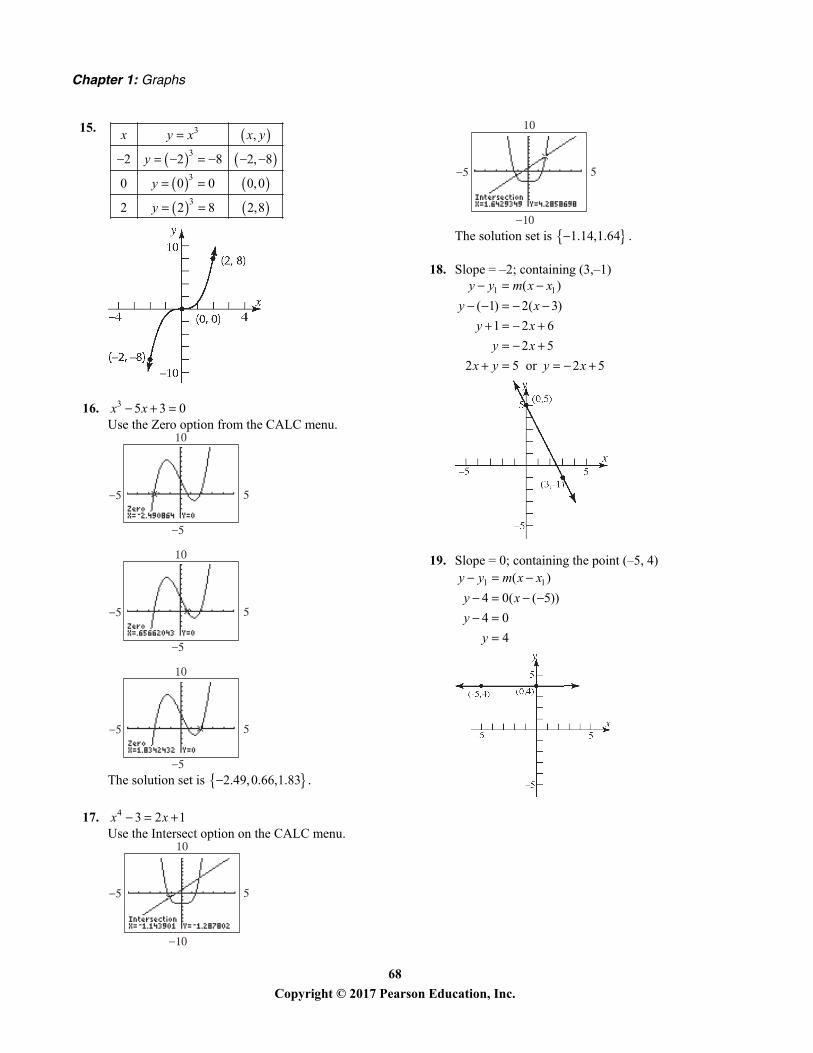
Chapter 1: Graphs
68 Copyright © 2017 Pearson Education, Inc.
15.
3
3
3
3
,
2 2 8 2, 8
0 0 0 0,0
2 2 8 2,8
x y x x y
y
y
y
16. 3 5 3 0x x Use the Zero option from the CALC menu.
The solution set is 2.49,0.66,1.83 .
17. 4 3 2 1x x Use the Intersect option on the CALC menu.
The solution set is 1.14,1.64 .
18. Slope = –2; containing (3,–1)
1 1( )
( 1) 2( 3)
1 2 6
2 5
2 5 or 2 5
y y m x xy xy xy x
x y y x
19. Slope = 0; containing the point (–5, 4)
1 1( )
4 0( ( 5))
4 0
4
y y m x xy xyy
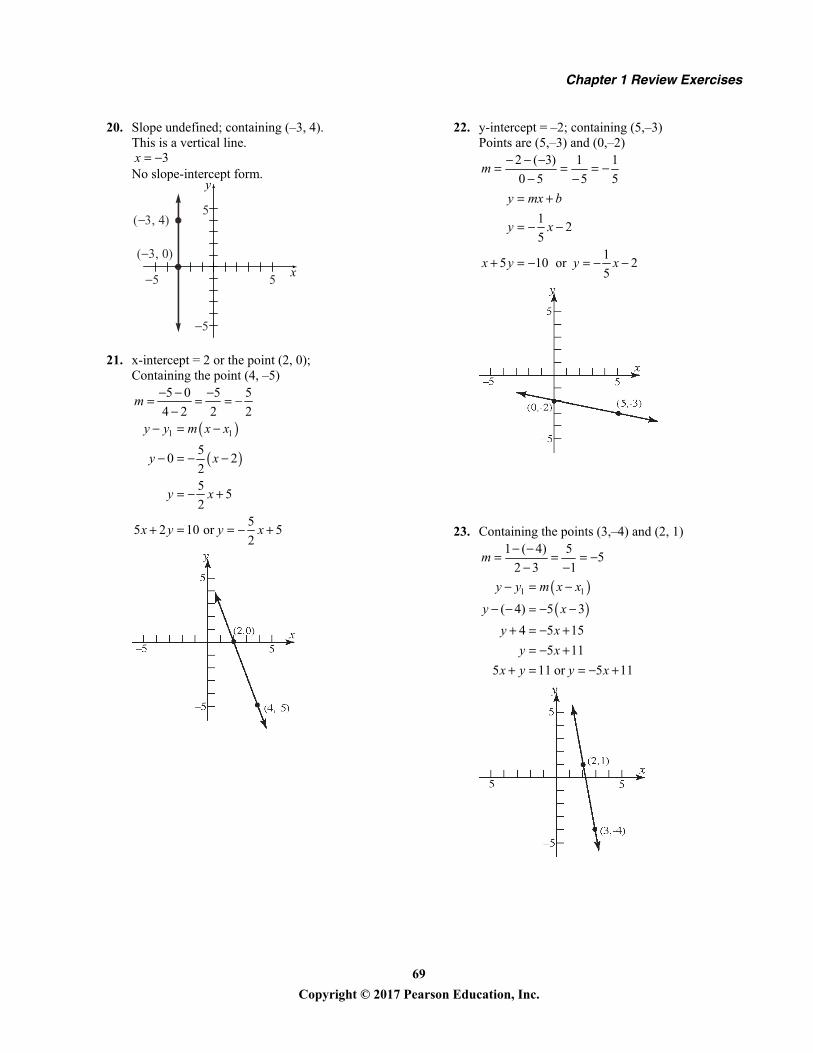
Chapter 1 Review Exercises
69 Copyright © 2017 Pearson Education, Inc.
20. Slope undefined; containing (–3, 4). This is a vertical line.
3x No slope-intercept form.
5
( 3, 0)
( 3, 4)
5
5
y
x5
21. x-intercept = 2 or the point (2, 0); Containing the point (4, –5)
5 0 5 5
4 2 2 2m
1 1
50 2
25
52
55 2 10 or 5
2
y y m x x
y x
y x
x y y x
22. y-intercept = –2; containing (5,–3) Points are (5,–3) and (0,–2)
2 ( 3) 1 1
0 5 5 5m
12
51
5 10 or 25
y mx b
y x
x y y x
23. Containing the points (3,–4) and (2, 1) 1 ( 4) 5
52 3 1
m
1 1
( 4) 5 3
4 5 15
5 11
5 11 or 5 11
y y m x x
y xy xy x
x y y x
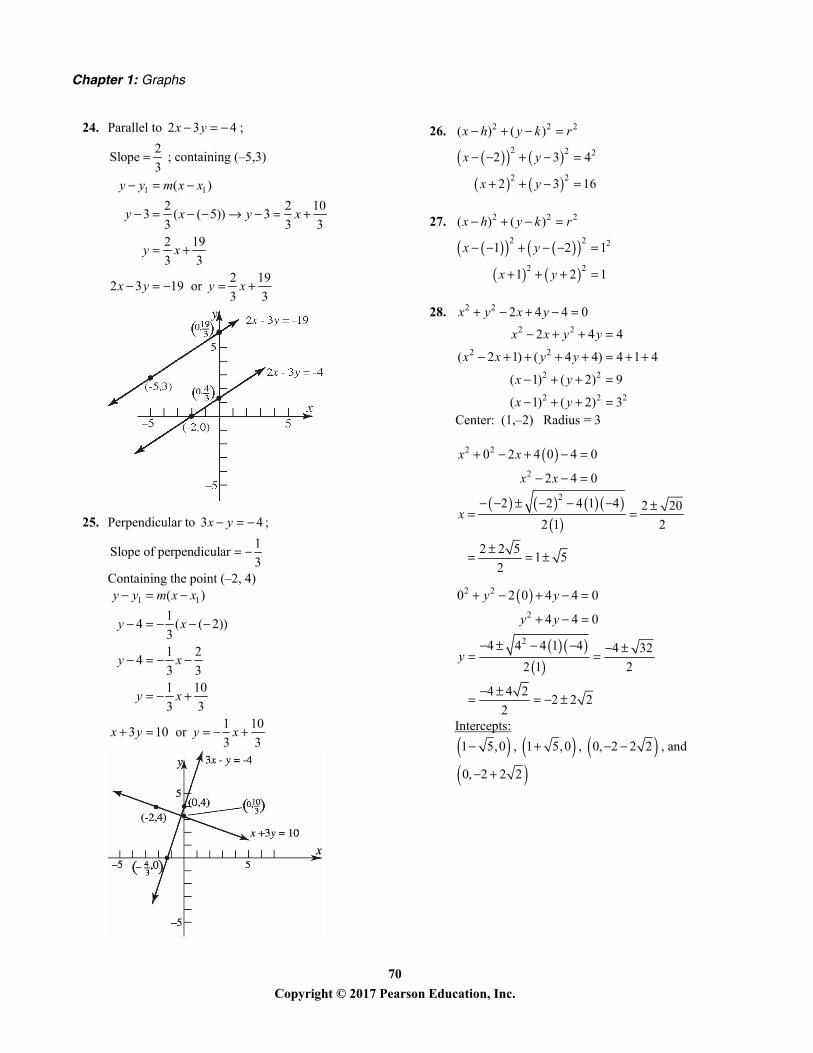
Chapter 1: Graphs
70 Copyright © 2017 Pearson Education, Inc.
24. Parallel to 2 3 4x y ;
2Slope ; containing (–5,3)
3
1 1( )
2 2 103 ( ( 5)) 3
3 3 32 19
3 32 19
2 3 19 or 3 3
y y m x x
y x y x
y x
x y y x
25. Perpendicular to 3 4x y ;
1
Slope of perpendicular3
Containing the point (–2, 4)
1 1( )
14 ( ( 2))
31 2
43 31 10
3 31 10
3 10 or 3 3
y y m x x
y x
y x
y x
x y y x
26. 2 2 2( ) ( )x h y k r
2 2 2
2 2
2 3 4
2 3 16
x y
x y
27. 2 2 2( ) ( )x h y k r
2 2 2
2 2
1 2 1
1 2 1
x y
x y
28. 2 2 2 4 4 0x y x y 2 2
2 2
2 2
2 2 2
2 4 4
( 2 1) ( 4 4) 4 1 4
( 1) ( 2) 9
( 1) ( 2) 3
x x y y
x x y y
x y
x y
Center: (1,–2) Radius = 3
2 2
2
0 2 4 0 4 0
2 4 0
x x
x x
22 2 4 1 4 2 20
2 1 2
2 2 51 5
2
x
2 2
2
0 2 0 4 4 0
4 4 0
y y
y y
24 4 4 1 4 4 32
2 1 2
4 4 22 2 2
2
y
Intercepts:
1 5,0 , 1 5,0 , 0, 2 2 2 , and
0, 2 2 2
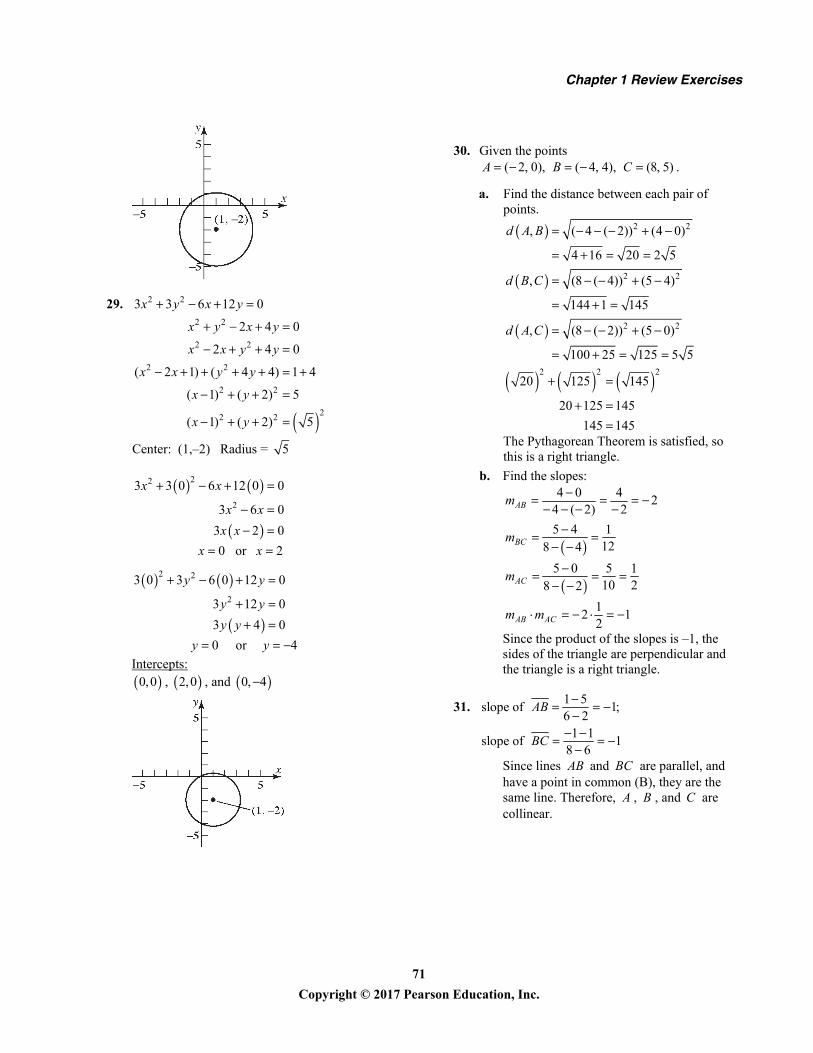
Chapter 1 Review Exercises
71 Copyright © 2017 Pearson Education, Inc.
29. 2 23 3 6 12 0x y x y
2 2
2 2
2 2
2 2
22 2
2 4 0
2 4 0
( 2 1) ( 4 4) 1 4
( 1) ( 2) 5
( 1) ( 2) 5
x y x y
x x y y
x x y y
x y
x y
Center: (1,–2) Radius = 5
22
2
3 3 0 6 12 0 0
3 6 0
3 2 0
x x
x xx x
0 or 2x x
2 2
2
3 0 3 6 0 12 0
3 12 0
3 4 0
y y
y yy y
0 or 4y y Intercepts:
0,0 , 2,0 , and 0, 4
30. Given the points ( 2, 0), ( 4, 4), (8, 5)A B C .
a. Find the distance between each pair of points.
2 2
2 2
2 2
, ( 4 ( 2)) (4 0)
4 16 20 2 5
, (8 ( 4)) (5 4)
144 1 145
, (8 ( 2)) (5 0)
100 25 125 5 5
d A B
d B C
d A C
2 2 220 125 145
20 125 145
145 145
The Pythagorean Theorem is satisfied, so this is a right triangle.
b. Find the slopes:
4 0 42
4 ( 2) 2
5 4 1128 4
5 0 5 110 28 2
AB
BC
AC
m
m
m
12 1
2AB ACm m
Since the product of the slopes is –1, the sides of the triangle are perpendicular and the triangle is a right triangle.
31. 1 5slope of 1;
6 21 1
slope of 18 6
AB
BC
Since lines AB and BC are parallel, and have a point in common (B), they are the same line. Therefore, A , B , and C are collinear.
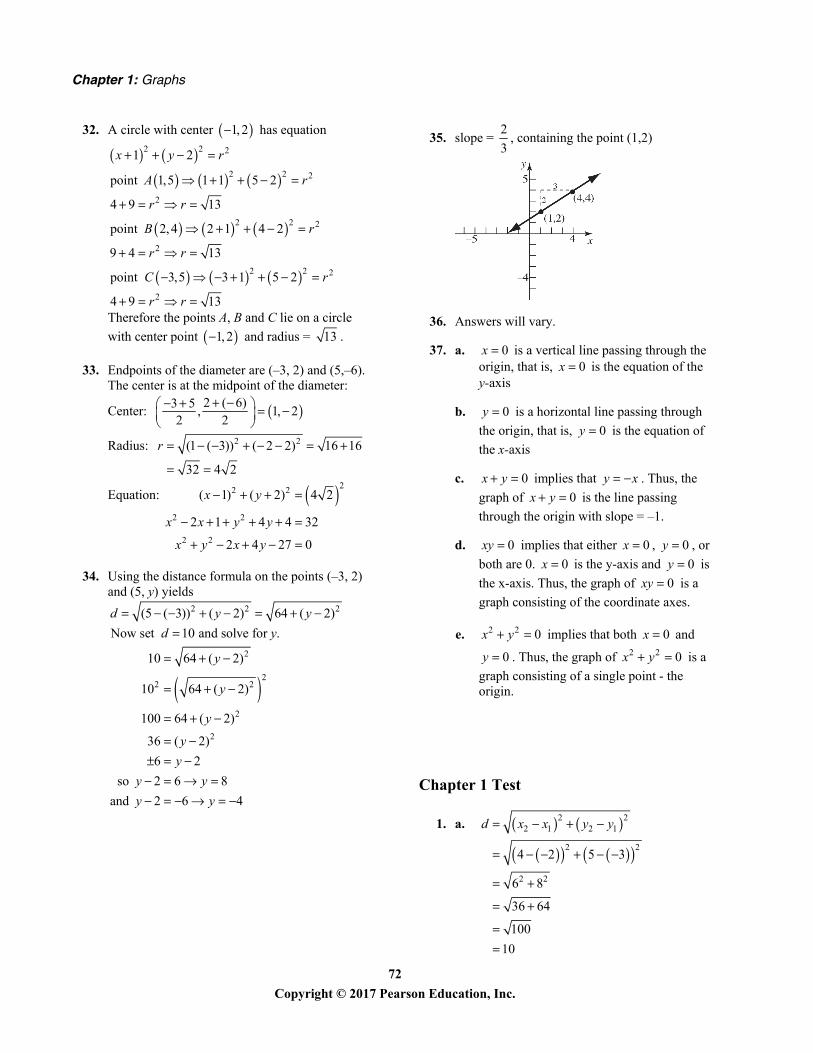
Chapter 1: Graphs
72 Copyright © 2017 Pearson Education, Inc.
32. A circle with center 1, 2 has equation
2 2 21 2x y r
2 2 2
2
2 2 2
2
2 2 2
2
point 1,5 1 1 5 2
4 9 13
point 2,4 2 1 4 2
9 4 13
point 3,5 3 1 5 2
4 9 13
A r
r r
B r
r r
C r
r r
Therefore the points A, B and C lie on a circle
with center point 1, 2 and radius = 13 .
33. Endpoints of the diameter are (–3, 2) and (5,–6). The center is at the midpoint of the diameter:
Center: 2 ( 6)3 5, 1, 2
2 2
Radius: 2 2(1 ( 3)) ( 2 2) 16 16
32 4 2
r
Equation: 22 2
2 2
2 2
( 1) ( 2) 4 2
2 1 4 4 32
2 4 27 0
x y
x x y y
x y x y
34. Using the distance formula on the points (–3, 2) and (5, y) yields
2 2 2(5 ( 3)) ( 2) 64 ( 2)d y y
Now set 10 and solve for .d y
2
22 2
2
2
10 64 ( 2)
10 64 ( 2)
100 64 ( 2)
36 ( 2)
6 2
so 2 6 8
and 2 6 4
y
y
y
yy
y yy y
35. slope = 2
3, containing the point (1,2)
36. Answers will vary.
37. a. 0x is a vertical line passing through the origin, that is, 0x is the equation of the y-axis
b. 0y is a horizontal line passing through
the origin, that is, 0y is the equation of
the x-axis
c. 0x y implies that y x . Thus, the
graph of 0x y is the line passing
through the origin with slope = –1.
d. 0xy implies that either 0x , 0y , or
both are 0. 0x is the y-axis and 0y is
the x-axis. Thus, the graph of 0xy is a
graph consisting of the coordinate axes.
e. 2 2 0x y implies that both 0x and
0y . Thus, the graph of 2 2 0x y is a
graph consisting of a single point - the origin.
Chapter 1 Test
1. a.
2 22 1 2 1
2 2
2 2
4 2 5 3
6 8
36 64
100
10
d x x y y
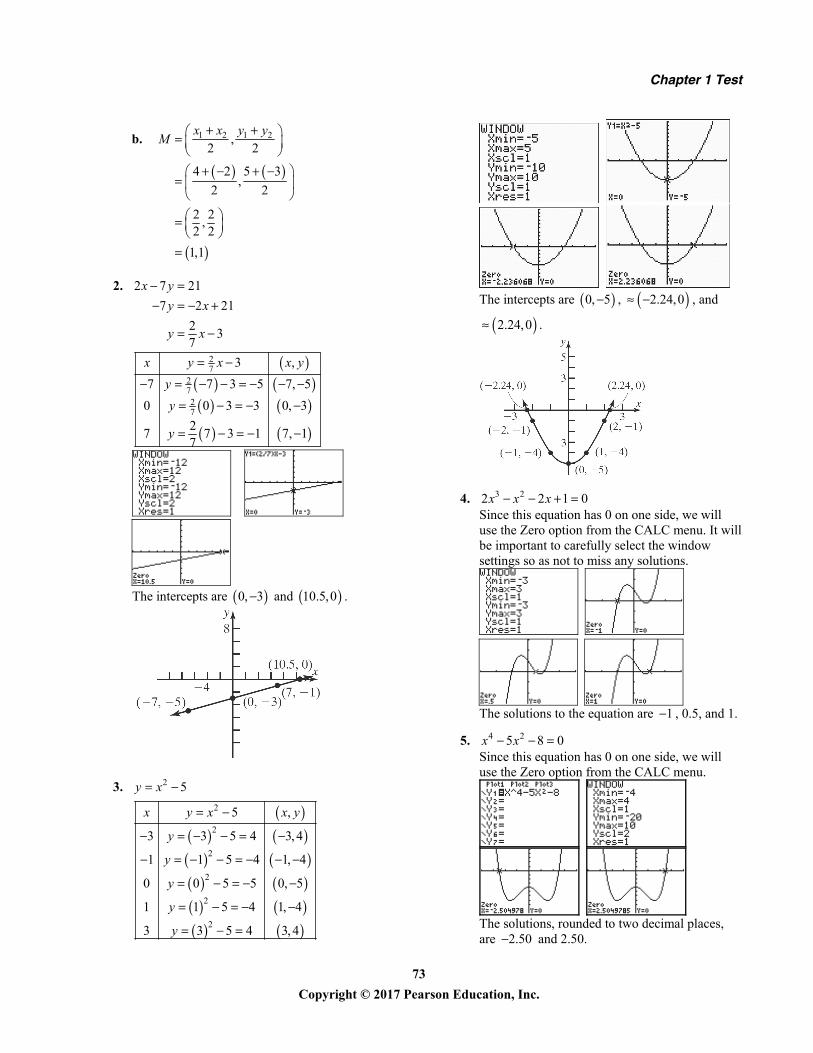
Chapter 1 Test
73 Copyright © 2017 Pearson Education, Inc.
b.
1 2 1 2,2 2
4 2 5 3,
2 2
2 2,
2 2
1,1
x x y yM
2. 2 7 21
7 2 21
23
7
x yy x
y x
27
2727
3 ,
7 7 3 5 7, 5
0 0 3 3 0, 3
27 7 3 1 7, 1
7
x y x x yyy
y
The intercepts are 0, 3 and 10.5,0 .
3. 2 5y x
2
2
2
2
2
2
5 ,
3 3 5 4 3, 4
1 1 5 4 1, 4
0 0 5 5 0, 5
1 1 5 4 1, 4
3 3 5 4 3, 4
x y x x y
y
y
y
y
y
The intercepts are 0, 5 , 2.24,0 , and
2.24,0 .
4. 3 22 2 1 0x x x Since this equation has 0 on one side, we will use the Zero option from the CALC menu. It will be important to carefully select the window settings so as not to miss any solutions.
The solutions to the equation are 1 , 0.5, and 1.
5. 4 25 8 0x x Since this equation has 0 on one side, we will use the Zero option from the CALC menu.
The solutions, rounded to two decimal places, are 2.50 and 2.50.
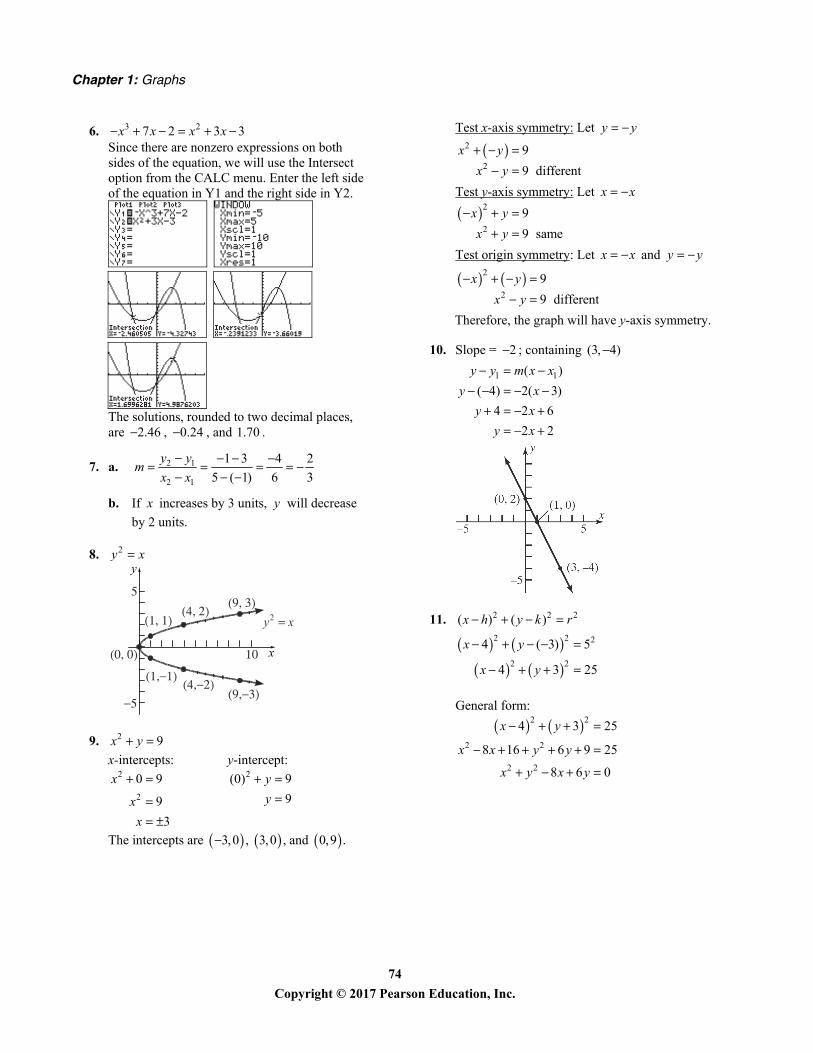
Chapter 1: Graphs
74 Copyright © 2017 Pearson Education, Inc.
6. 3 27 2 3 3x x x x Since there are nonzero expressions on both sides of the equation, we will use the Intersect option from the CALC menu. Enter the left side of the equation in Y1 and the right side in Y2.
The solutions, rounded to two decimal places, are 2.46 , 0.24 , and 1.70 .
7. a. 2 1
2 1
1 3 4 2
5 ( 1) 6 3
y ymx x
b. If x increases by 3 units, y will decrease
by 2 units.
8. 2y x y
x
2y x
9. 2 9x y x-intercepts: y-intercept:
2
2
0 9
9
3
x
xx
2(0) 9
9
yy
The intercepts are 3,0 , 3,0 , and 0,9 .
Test x-axis symmetry: Let y y
2
2
9
9 different
x yx y
Test y-axis symmetry: Let x x
2
2
9
9 same
x yx y
Test origin symmetry: Let x x and y y
2
2
9
9 different
x yx y
Therefore, the graph will have y-axis symmetry.
10. Slope = 2 ; containing (3, 4)
1 1( )
( 4) 2( 3)
4 2 6
2 2
y y m x xy xy xy x
11. 2 2 2( ) ( )x h y k r
2 2 2
2 2
4 ( 3) 5
4 3 25
x y
x y
General form:
2 2
2 2
2 2
4 3 25
8 16 6 9 25
8 6 0
x y
x x y y
x y x y
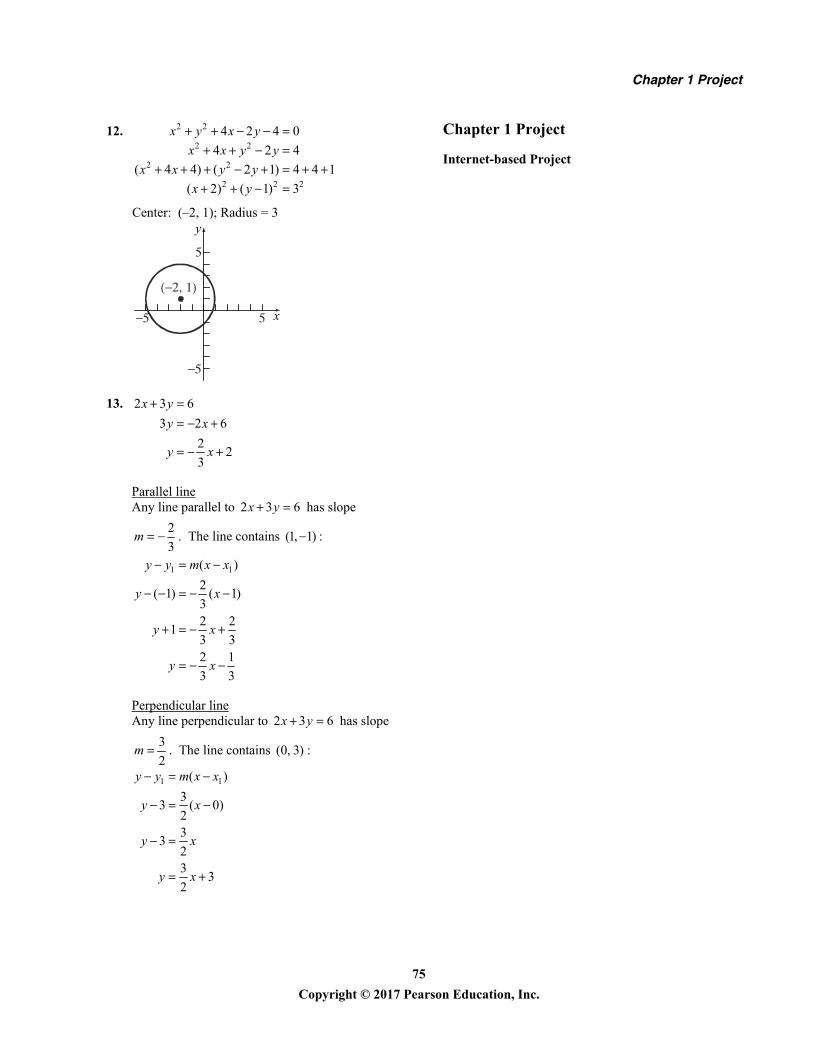
Chapter 1 Project
75 Copyright © 2017 Pearson Education, Inc.
12. 2 2
2 2
2 2
2 2 2
4 2 4 0
4 2 4
( 4 4) ( 2 1) 4 4 1
( 2) ( 1) 3
x y x yx x y y
x x y yx y
Center: (–2, 1); Radius = 3
y
x
13. 2 3 6
3 2 6
22
3
x yy x
y x
Parallel line Any line parallel to 2 3 6x y has slope
2
3m . The line contains (1, 1) :
1 1( )
2( 1) ( 1)
32 2
13 32 1
3 3
y y m x x
y x
y x
y x
Perpendicular line Any line perpendicular to 2 3 6x y has slope
3
2m . The line contains (0, 3) :
1 1( )
33 ( 0)
23
323
32
y y m x x
y x
y x
y x
Chapter 1 Project
Internet-based Project