Embed Size (px)
Citation preview


Chapter 1 Global Media Landscape
2
Global Digital Media Trendbook 2014
dmi.indd 1 07/08/2014 11:51
Source: MAGNA GlLOBAL, “Media Economy Report,” January 2014© World Newsmedia Network 2014
2.global.globalmediaadvertisingmix
Global media advertising mix Breakdown of market share for each ad medium, and advertising market regional allotments, 2013
Free TV
Pay TV
Search
Display
Mobile
Video
Other digital
Newspaper
Magazine
Radio
Out-of-home
31%
10%
9%6%3%
1% 2%
17%
7%
7%
7%
Global media mix Ad market by region
12% emerging
17% mature
33% USA
3% Canada
2% MEA4% CEE
21% WE
33%
28%
7%APAC
NORTH AMERICA
EMEA
LATAM
The story doesn’t end here: consider the in-depth, data-driven reasons why these revenue and content strategies are essential for media companies in 2014 and beyond. The World Digital Media Factbook has been published each year since 2006, studying these fast-moving trends which have inspired thousands of media companies’ strategies.
The world’s media revenue and usage pattern landscapes are changing dramatically in 2014. The constant shift of advertising spend, and device, media and shopping habit patterns are driving media companies to overhaul their digital media strategies.
After the fallout from the economic crisis of 2008 and 2009, Internet, mobile and television have emerged the victors of the advertising expenditure battle, while newspapers have suffered debilitating setbacks, which have made urgent the need for new revenue streams. In the case of new revenue development, magazines and particularly newspapers around the world have embodied the cliché, “necessity is the mother of invention” by implementing new businesses and advertising genres.
A host of other revenue streams are emerging: e-commerce and a variety of non-traditional advertising
GlobalDiGital MeDia trenDbook 2014
ExEcutivE Summary
all things considered, if the biggest opportunities for media company revenue and content strategies for 2014 could be summed up in a few words, they would be Big Data analytics, paid content, native advertising, programmatic advertising, product development, tablets, e-commerce and smartphones.
3
Executive Summary World Digital Media Factbook 2014
genres: particularly programmatic, native, video and mobile. All of these present opportunities – but also competitive threats – for the media industry. All of these changes are being driven by irreversible patterns in buying and advertising consumption behaviour, from traditional to digital media.
The world’s advertising expenditure
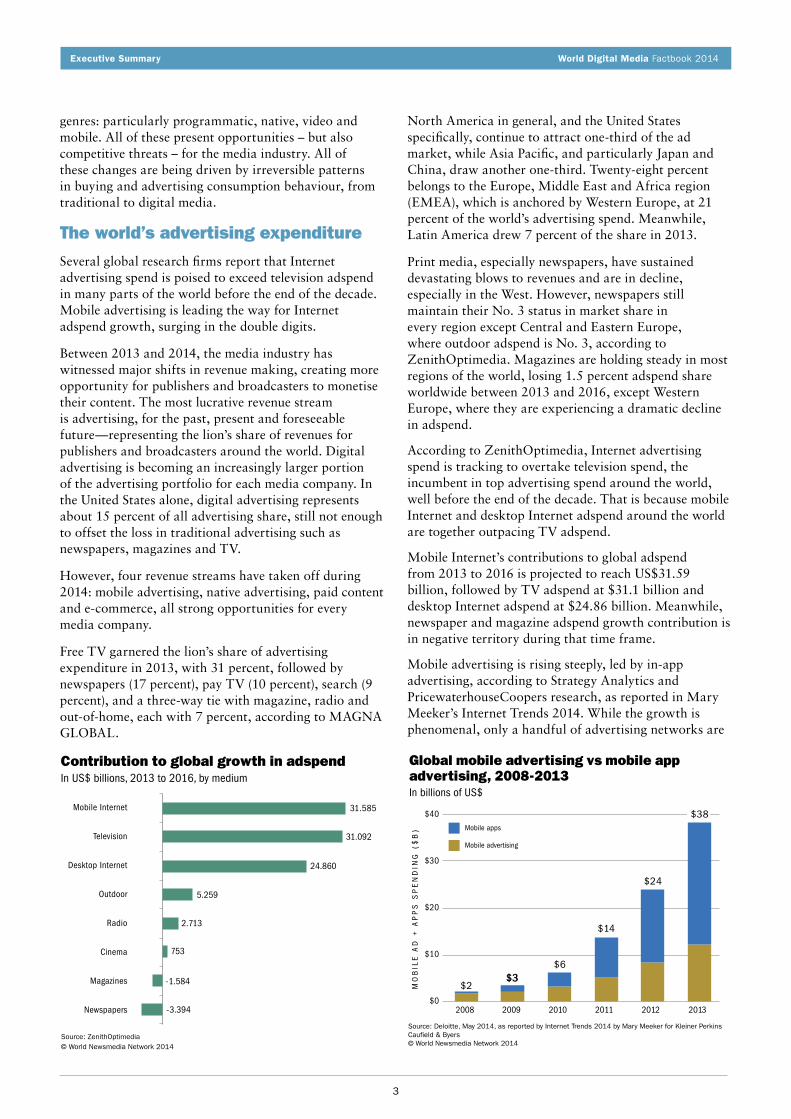
Several global research firms report that Internet advertising spend is poised to exceed television adspend in many parts of the world before the end of the decade. Mobile advertising is leading the way for Internet adspend growth, surging in the double digits.
Between 2013 and 2014, the media industry has witnessed major shifts in revenue making, creating more opportunity for publishers and broadcasters to monetise their content. The most lucrative revenue stream is advertising, for the past, present and foreseeable future—representing the lion’s share of revenues for publishers and broadcasters around the world. Digital advertising is becoming an increasingly larger portion of the advertising portfolio for each media company. In the United States alone, digital advertising represents about 15 percent of all advertising share, still not enough to offset the loss in traditional advertising such as newspapers, magazines and TV.
However, four revenue streams have taken off during 2014: mobile advertising, native advertising, paid content and e-commerce, all strong opportunities for every media company.
Free TV garnered the lion’s share of advertising expenditure in 2013, with 31 percent, followed by newspapers (17 percent), pay TV (10 percent), search (9 percent), and a three-way tie with magazine, radio and out-of-home, each with 7 percent, according to MAGNA GLOBAL.
North America in general, and the United States specifically, continue to attract one-third of the ad market, while Asia Pacific, and particularly Japan and China, draw another one-third. Twenty-eight percent belongs to the Europe, Middle East and Africa region (EMEA), which is anchored by Western Europe, at 21 percent of the world’s advertising spend. Meanwhile, Latin America drew 7 percent of the share in 2013.
Print media, especially newspapers, have sustained devastating blows to revenues and are in decline, especially in the West. However, newspapers still maintain their No. 3 status in market share in every region except Central and Eastern Europe, where outdoor adspend is No. 3, according to ZenithOptimedia. Magazines are holding steady in most regions of the world, losing 1.5 percent adspend share worldwide between 2013 and 2016, except Western Europe, where they are experiencing a dramatic decline in adspend.
According to ZenithOptimedia, Internet advertising spend is tracking to overtake television spend, the incumbent in top advertising spend around the world, well before the end of the decade. That is because mobile Internet and desktop Internet adspend around the world are together outpacing TV adspend.
Mobile Internet’s contributions to global adspend from 2013 to 2016 is projected to reach US$31.59 billion, followed by TV adspend at $31.1 billion and desktop Internet adspend at $24.86 billion. Meanwhile, newspaper and magazine adspend growth contribution is in negative territory during that time frame.
Mobile advertising is rising steeply, led by in-app advertising, according to Strategy Analytics and PricewaterhouseCoopers research, as reported in Mary Meeker’s Internet Trends 2014. While the growth is phenomenal, only a handful of advertising networks are
Mobile Internet
Television
Desktop Internet
Outdoor
Radio
Cinema
Magazines
Newspapers
Source: ZenithOptimedia© World Newsmedia Network 2014
1.Zenith.global.contributiontoadspendgrowth
Contribution to global growth in adspendIn US$ billions, 2013 to 2016, by medium
31.585
31.092
24.860
5.259
2.713
753
-1.584
-3.394
2+4.global.meeker.mobilevsappadvertising
Global mobile advertising vs mobile app advertising, 2008-2013In billions of US$
Source: Deloitte, May 2014, as reported by Internet Trends 2014 by Mary Meeker for Kleiner Perkins Caufield & Byers© World Newsmedia Network 2014
MO
BIL
E A
D +
AP
PS
SP
EN
DIN
G (
$B
)
2008 2009 2010 2011 20132012
Mobile apps
Mobile advertising
$2$3$3
$6
$14
$24
$38$40
$30
$20
$10
$0

4
Executive Summary World Digital Media Factbook 2014
Econsultancy’s 2014 Media Growth StudyMedia companies are planning their business strategies to take advantage of the opportunities emerging from the expanding digital media landscape.
New product development and expansion of market share are the top two growth drivers for 2014, according to Econsultancy’s 2014 Media Growth Study, conducted by the Jordan, Edmiston Group. This corroborates previous years’ survey results since 2009.
“There are signs throughout the study and interviews that companies are continuing to develop new products at a feverish pace, but that there is a high priority being placed on evaluation and upgrading of existing products as well,” the study states.
However, acquisition and geographic expansion also have proven to be key areas of growth for 2014, compared to 2013. The largest change is the investment in new IP/software/technologies, a move that has been driven by a variety of industry developments, such as a new emphasis on programmatic advertising buying and selling, and Big Data strategies, according to the study. In 2013, only 11 percent of respondents said IP/software/technologies was a driver for growth, while in 2014, 27 percent of the respondents said so.
Meanwhile, the top two issues that are standing in the way of growth are the entry of new competitors and the competition from free and low-cost alternatives to media companies’ products (such as offshoring). These two issues tied for the top spot as the top barriers to growth, with 43 percent each, according to the study.
Innovation from traditional competitors and the move
making the majority of the mobile advertising revenue, led by Google with the overwhelming share.
Internet and mobile advertising spend is going up in the United States, and becoming commensurate with time spent on the media, according to the Interactive Advertising Bureau. Meanwhile, print has had a long history of garnering significantly more adspend compared to the shrinking time spent with the media. Television also gets a disproportionate share of adspend (45 percent) compared to its audiences’ time spent (38 percent).
According to Meeker’s Internet Trends 2014, the huge opportunity for U.S. advertisers is to take advantage of the massive mobile audience, which garners only 4 percent adspend share, despite commanding 20 percent of time spent on media. The more developed Internet advertising market commands 22 percent of the adspend, with 25 percent of time spent, according to the report.
Internet usage trendsTop global websites have remained the same over the years. However, the difference is the expanding global audiences for these sites. The most popular destinations globally are Google, Microsoft, Facebook and Yahoo!, all of which have between four-fifths and five-sixths of their audiences accessing their sites from outside the United States. Along with the audience, these top sites also command the majority of adspend, compared to their smaller media company brethren. In 2013, eMarketer estimated that Google, Facebook, Microsoft and Yahoo! earned 59 percent of all of the digital advertising revenue in the United States, and together are projected to earn 61.7 percent of the U.S. advertising pie in 2015.
Note: Advertising spend based on IAB data for full year 2013. Print includes newspaper and magazine. $30B+ opportunity calculated assuming internet and mobile ad spend share equal their respective time spent share. Time spent share data based on eMarketer 7/13 (adjusted to exclude outdoors/classified media spend). Arrows denote Y/Y shift in percent share.
Source: Deloitte, May 2014, as reported by Internet Trends 2014 by Mary Meeker for Kleiner Perkins Caufield & Byers
© World Newsmedia Network 2014
1.US.meeker.mediatimespentvsadspend
U.S. media time spent vs. adspend% of media time spent vs. adspend 2013
% O
F TO
TAL
MED
IA C
ON
SU
MPT
ION
TIM
E O
R A
DVE
RTI
SIN
G S
PEN
DIN
G
50%
40%
30%
20%
10%
0%5%
19%
Radio
10%12%
38%
TV
45%
25%
Internet
22%20%
Mobile
Internet ad = $43BMobile ad = $7.1B
~$30B+Opportunity
in USA
4%
Time spent Ad spend
Microsoft
Yahoo!
Wikipedia
Alibaba
Baidu
Tencent
Sohu
Amazon.com
Source: Deloitte, May 2014, as reported by Internet Trends 2014 by Mary Meeker for Kleiner Perkins Caufield & Byers© World Newsmedia Network 2014
1.global.meeker.Top10InternetsitesUSandnonUS
Top 10 global websitesIn number of monthly unique visitors in March 2014
200 400 600 800 1,000 1,200 1,400
M O N T H L Y U N I Q U E V I S I T O R S ( M I L L I O N S )
0
US users
International users

5
Executive Summary World Digital Media Factbook 2014
from offline to online content also have presented key challenges for media companies in 2014.
World Newsmedia Network’s annual World Newsmedia Innovation Study 2013-14, corroborates many of the findings of the 2014 Media Growth Study, showing new product development among the leading strategies for efficiency for the fifth year in a rowThe study’s findings are analysed in detail in Chapter 8 of the World Digital Media Factbook 2014.
For the past five years, the World Newsmedia Innovation Study has explored major trends in strategic innovations and revenue making in newsmedia companies around the world.
The annual study chronicles trends in revenue-making projections, strategies in the investment of new products and services, cost-cutting practices, the appetite for change, and training employees to engage in these new corporate environments.
The 2013-14 study was presented in 11 languages and drew responses from the widest range of countries yet: senior newsmedia executives in editorial, commercial and operations from 49 developed and developing econonomies on all continents participated. In each of the previous four annual studies when asked to identify priorities for greater efficiency and cost savings over the next 12 months, new product development was No 1. Not this year. Though their operating contexts varywidely, they all recognised that the key digital challenge confronting companies is no longer the inclination to innovate. Instead, their top priority is accessing the ICT required to be truly competitive in what is
Launching new products/services
Expansion of market share within existing markets
Making an acquisition
Expansion into new geographic markets
Entering new vertical markets
Hiring new key management/employees
Investing in new IP/software/technologies
71%
61%
64%
58%
38%
37%
32%
29%
27%
22%
33%
21%
27%
11%
Source: 2014 Media Growth Study, The Jordan, Edmiston Group, EConsultancy, based on a survey of 340 media executives globally© World Newsmedia Network 2014
Number of respondents: 313
1.EconsultancyJordanEdmiston.global.growthdrivers
Top growth drivers for media companies in next 12 to 24 months % of media executive respondents in global survey, 2013 to 2014, top three choices
0 20 40 60 80
2014
2013
Lack of talent in emerging areas (technology,
Internet, etc.)Lack of talent in
senior management
Lack of capital/credit
Conflicting internal agendas
Lack of innovation
Company culture that hinders growth
Lack of data management tools
Lack of technology/software
49%40%
22%
34%
30%
26%
21%
23%
21%
22%
16%
19%
13%
21%21%
25%
Source: 2014 Media Growth Study, The Jordan, Edmiston Group, EConsultancy, based on a survey of 340 media executives globally© World Newsmedia Network 2014
Number of respondents: 273
1.EconsultancyJordanEdmiston.global.internalbarrierstogrowth1314
Top internal barriers to growth in media companies, 2013 to 2014% of media executive respondents in global survey
0 10 20 30 40 50 60
2014
2013
2013-14 laSt yEar
invest in technologies 1 3___________________________________________reorganise internal operations 2 4___________________________________________rapid implementation of changes 3 5___________________________________________Develop new products within the media sector 4 1___________________________________________collaborate with other companies for content generation 5 6___________________________________________cooperate with other companies/entrepreneurs/agencies for product development 6 10___________________________________________Develop new products outside the media sector 7 8___________________________________________Streamline workflow and processes 8 2___________________________________________Stable and reliable distribution 9 7 ___________________________________________reduce the number of employees 10 9 ___________________________________________Outsource processes to other companies 11 13 ___________________________________________co-productions 12 14 ___________________________________________cooperate on content syndication 13 15 ___________________________________________Syndication 14 11 ___________________________________________Share resources with outside companies 15 12
Priorities for efficiency showing drop of new products and rise of investment in technology
WNiS 2013-14: For the first time since the study started in 2009, newsmedia executives worldwide identified investment in new technology, rather than product development, as their top priority for achieving greater efficiency and cost savings over the next 12 months.
rank

6
Executive Summary World Digital Media Factbook 2014
Once the groundwork has been laid for research into the target audience and a highly focused product, the real work begins with the development of the
innovation strategy. The minute details of the
strategy are developed, and the analysis of
all competitors in the marketplace and the size of the opportunity are tackled. For example, when a media company wishes to launch an entertainment listings app for its
city, the company would study all
existing apps, the content, functionality,
market share, price points and audience focus before
deciding on the position of its own entertainment app. Once the
focus of the app has been determined, a market analysis to project audience and
potential revenue must be undertaken.
Once the size of the opportunity and competitive analysis are completed, the pricing strategy is determined. Using the entertainment app as an example, the pricing for the app, or more likely, the pricing for advertising on the app, would be set. Next, the fine details of the app, including the user experience, the content, the frequency of updates, the staffing, the budget and beyond, are all factored in to the innovation strategy. The solution is constantly evaluated, positioned and re-positioned in the marketplace to ensure success with the product or service.
The New York Times Innovation report
The New York Times produced its 91-page Innovation report in 2014 in response to the company’s objectives to:
• Leverageitswell-regardedcontentinordertoexpand its reach.
• Monetisealargeraudience.
• Createadigital-firststrategyforthenewspaperand digital operation.
• Actmorelikeanimblestart-upmediaorganisation,
fast becoming a ‘winner-takes-all’, mobile-dominated marketplace.
The process of innovationInnovation is a broad term regarding the newsmedia industry. Innovation can run the gamut from product development, to technology implementation, process re-engineering, trainings and management restructuring, among other strategies. For example, The New York Times is in the beginning stages of implementing sweeping editorial and commercial changes outlined in its Innovation report; and a growing number of media companies have implemented native advertising strategies, including Forbes, Vice, Politico, The Huffington Post, News Corp, Hearst and The Economist.
The process of innovation is a slow, deliberate and scientific process of developing products or services with specific customers in mind. The process starts by defining the target customer for the innovative product or service. Once defined by demographic and behavioural characteristics, the media company must then define the jobs to be done in order to reach that customer and satisfy that customer with the bespoke product or service. One of the key attributes to a game-changing innovation is to identify customer needs, and to address unmet needs with the proposed product. For example, the tablet provides millions of people with a device that is lightweight, portable, easy-to-use and store, Internet accessible, with a high-resolution screen and capable of multiple tasks, such as email, entertainment and work.
Innovating products and services also requires finding niches of opportunity within that marketplace. Using the tablet example, there are a multitude of tablet devices on the market. Some have more bells and whistles and cost more than their competitors. Some are simpler and less expensive, but still functional. Some are smaller and more portable, while others are larger and more utilitarian. Each has segments of opportunity for a variety of customers with different wish lists for tablet features.
1.WNMN.innovationcycle
Source: World Newsmedia Network, industry reports© World Newsmedia Network 2014
The Cycle of Innovation
Definethe project
Launchproduct
Define and evaluate
customer solution
Create pricing scheme
Estimatesize of
opportunities
Conduct competitive analysis
Identify unmet needs
Find areas of opportunity
Create innovation strategy
Define the jobs to be
done
Identifycustomer
needs
Define the
customer(s)
The cycle of innovation1.WNMN.innovationcycle
Source: World Newsmedia Network, industry reports© World Newsmedia Network 2014
The Cycle of Innovation
Definethe project
Launchproduct
Define and evaluate
customer solution
Create pricing scheme
Estimate size of
opportunities
Conduct competitive analysis
Identify unmet needs
Find areas of opportunity
Create innovation strategy
Define the jobs to be
done
Identifycustomer
needs
Define the
customer(s)

7
“We are making investment in data analytics – this not only drives our consumer-focused efforts, but is some- thing we can also sell to advertisers. Our interactive tools allow us to know the consumer better – I think this is going to be hugely valuable to advertisers, this is where we will get a premium. Our total ad sales have grown 30 percent in the last few years even as print declined; we have not had an issue with trading print dollars for digital dimes.”
— Joshua Macht, EVP & group publisher, Harvard Business Review Group
“We have more data on our consumer demographics that we can share with advertisers. We can show that this is a more valuable audience – more affluent, more digitally oriented. Moreover, we can also offer advertisers more information about what content consumers are interested in.”
— Saira Stahl, VP, Corporate Strategy, Gannett Co, Inc.
In 2014, media companies around the world are morphing the Big Data hype of 2013 into strategies and actions. The opportunity for employing Big Data strategies are many: to better understand cross-platform audiences, create powerful data journalism stories, streamline business processes and identify new products and services to offer customers.
able to make sound decisions and develop new products more quickly.
The report’s lead author, Arthur Gregg Sulzberger, son of Times publisher Arthur Sulzberger Jr., has been named senior editor of innovation, tasked with leading the sweeping changes outlined in the report.
Among the strategies outlined in the report are a strategy of tagging and structuring data to make content more more discoverable, promoting journalism on social media through reporters and editors, and encouraging two-way relationships with readers, including inviting user-generated content. The report also recommends developing a companywide start-up mentality, particularly focusing on experimenting, testing, and quick decision-making about new product development.
Big Data for mediaBig Data has been a buzzword for media companies in the past few years, particularly in the realm of audience analytics, as it has a direct correlation to audience reader insights and monetisation through advertising targeting.
World Newsmedia Network has organised two Big Data for Media conferences in London in 2013 and 2014 in an effort to illuminate the most successful Big Data strategies and practices around the world, including those at the Huffington Post, BuzzFeed, Financial Times, Guardian, BBC, CNN and more. The in-depth study about Big Data for Media is in Chapter 9 of the World Digital Media Factbook 2014.
According to the the Online Publishers Association’s (OPA) “Digital Subscription Strategies Pay Off” report, several OPA members are augmenting their subscription strategy revenue with targeted advertising revenue, often at a higher cost per thousand ad impressions.
“We have grown advertising business every single year since we’ve introduced subscription. Because of the deep relationship we have with the audience and the data we have on our subscribers we can guarantee that advertisers reach very specific scarce audiences. We consistently achieve a premium above market CPM.”
— Rob Grimshaw, managing director, FT.com
Executive Summary World Digital Media Factbook 2014
About World digitAl MediA FActbook 2014-15this is the third annual edition of the FiPP WorldDigital media Factbook.
Published by World Newsmedia Network since 2006 as the Global Digital media trendbook, the report provides a broad and deep survey of the digital media landscape with 500+ data sets, and an in-depth analysis of digital media revenue and usership trends worldwide.
the report is a compendium of the most compellingtrends from the most reliable digital media researchstudies each year.
World Newsmedia and FiPP wants to thank the 60contributing research companies for theirongoing support of this resource for publishers,researchers, academics and media industrystakeholders.
For more information, go to www.fipp.com/insight, contact Helen Bland at FiPP ([email protected]) or GDmt publisher martha Stone ([email protected])

8
and the emergence of data-driven technologies. This perfect storm makes possible the creation of infinite new business and consumer-facing tools that enable automation, insights, information and efficiencies.
2014 State of Marketing studyHow are marketers planning to spend on advertising this year? Turns out, data analytics is also on the top of their list. Salesforce.com and exacttarget.com conducted a global 2014 State of Marketing study in 2013 with 2,500 survey respondents, and created a snapshot of marketers’ views of marketing return on investment and priorities for 2014.
The respondents’ priorities for 2014 are driving increased advertising conversion rates (47 percent); increasing and improving brand awareness (46 percent); and collecting, measuring and using behaviour-based data (29 percent).
The conclusions of the study for marketers were:
• Focusoncustomerengagementbymappingyourcustomer journey to understand where customerswant to engage with your products.
• Developaclearstrategybasedonyourdataaboutcustomers.
• Considerchanneloptions,includingmobile,socialmedia, video, email and beyond.
Executive Summary World Digital Media Factbook 2014
The media industry can think of Big Data as the Four Vs, including volume of data; velocity of data, meaning it needs to be analysed quickly (especially news); in a variety of structured and increasingly unstructured data formats; which all have potential value in terms of high quality journalism and business insights and revenue.
There are a variety of definitions for Big Data, including being a catch-all for the opportunities presented by the exponential growth of data in the media sector, including structured, internal data available through media companies’ own databases, as well as unstructured data on a multitude of digital channels, including video, audio, photos and reams of social media text.
Why are media companies launching Big Data strategies? As connectivity and data storage prices drop precipitously, and millions of digital devices flood the marketplace, and as the amount of high-bandwidth content consumed skyrockets, media companies are searching for ways to understand their customers, how they are consuming content, and how they can monetise the users’ consumption through paywalls and advertising.
These steep decreases have given rise to the virtuous cycle of Big Data content: more affordable connectivity for consumers, a proliferation of devices enabling cheap access to multimedia news and information, Source: World Newsmedia Network 2014
© World Newsmedia Network 2014
9.global.BigData virtuous cycle
Connectivity,data storageprices drop
Number of digital devices
soars
Amount of high-bandwidth
content skyrockets
High-bandwidth content
audience grows
Advertisers target Big Data
content audiences
Virtuous cycle of Big Data
content
Source: World Newsmedia Network 2014© World Newsmedia Network 2014
9.global.BigData virtuous cycle
Connectivity,data storageprices drop
Number of digital devices
soars
Amount of high-bandwidth
content skyrockets
High-bandwidth content
audience grows
Advertisers target Big Data
content audiences
Virtuous cycleof Big Data
content
VVVVBig Data: The four VsVolume, Velocity, Variety and Value
© World Newsmedia Network 2014
VoluME
Large amounts of data
VElocity
Need to be analysed
quickly
VariEty
Different types of unstructured and structured
data
ValuE
Extracting business insights
and revenue from data
Big Data opportunities

9
Executive Summary World Digital Media Factbook 2014
Top priorities for marketers: Adobe study
Content marketing/native advertising is the top priority for marketers, according to Digital Trends for 2013, a study conducted by Adobe and Econsultancy.
Content marketing and conversion rate optimisation were tied for the top digital marketing priorities for 2013, followed closely by social media engagement, according to the study. Content marketing, or native advertising, allows advertisers to publish in special advertising sections or otherwise promote their products and services by advertising in non-traditional ways. Frequently this approach resembles the “advertorial” packages of decades ago, but with a twist: frequently the content is not directly about their products and services. Sometimes the content is on a topic that the advertiser wishes to be associated with, such as recycling or the arts. Content marketing can be published on a variety of formats, including websites, video, white papers, e-books, case studies, how-to guides, information graphics and photos. Publishers see working with advertisers on content marketing as an opportunity to monetise their audiences.
Content marketing is on the ascendancy, as corroborated by multiple reports in 2013 and 2014, with 39 percent of the marketers from around the world saying it’s a top priority in 2013, compared to 29 percent saying so in 2012.
Conversion rate optimisation also garnered 39 percent of the respondents’ favour in 2013, compared to 34 percent in 2012.
“More companies have come to realise that even small uplifts in conversion rates brought about by
improvements in processes and technology can translate into significant financial gains,” according to the study. Social media engagement continues to be a key priority, with 38 percent of those surveyed saying so in 2013, compared to 39 percent in 2012.
Meanwhile, marketers also reckon that content marketing is also the most important marketing priority for its advertising clients, with 38 percent of the respondents saying so in 2013, compared to 21 percent in 2012. Content marketing was followed by mobile optimisation, also with 38 percent of the respondents saying so in 2013, compared to 37 percent in 2012.
Programmatic advertising: Threat or opportunity?The audience data analytics movement has given rise to a variety of trends, including content and advertising targeting and automated advertising serving. Publishers collect data about their users’ demographics and content consumption habits using analytics software. When publishers partner with advertising networks, they have the ability to build campaigns and target consumers based on users’ demographics and reading patterns.
Among these emerging trends is programmatic buying, that is, automated digital display advertising buying, which is growing exponentially around the world. Programmatic digital display advertising
Data & analytics
Marketing automation
Email marketing
Social media marketing
Content management
Source: Salesforce, 2014 State of Marketing study, 2013© World Newsmedia Network 2014
61%
61%
58%
57%
57%
2.global.salesforce.planstoincreasemarketingbudgets
Plans to increase digital marketing budgets in 2014In percentage of global marketing respondents
0 20 40 60 80
0% 10% 20% 30% 40%
Content marketing
Conversion rate optimisation
Social media engagement
Targeting and personalisation
Content optimisation
Mobile optimisation
Brand building / viral marketing
Joining up online and offline data
Marketing automation
Video marketing
Social media analytics
Connected TV
29%39%
34%39%
39%38%
29%30%
32%26%
24%24%
15%11%
21%9%
19%9%
0%
37%
39%31%
Source: Adobe and Econsultancy, Digital Trends for 2013© World Newsmedia Network 2014
2.Adobe.global.topprioritiesfor2013
Top marketing priorities for global businesses in 2013Respondents chose three digital-related priorities
2012
2013
10
Executive Summary World Digital Media Factbook 2014
buying represents another clear threat, yet a possible opportunity, for publishers and broadcasters.
Programmatic buying is a threat to media companies because billions of display ads are being bought and sold as commodities on automatic ad exchanges each day, ostensibly driving down CPM (cost per thousand) prices. The advertising is served to thousands of websites, frequently without regard to quality of publishing site or value of audience. Media owners argue the value of their advertising inventory, and indeed, their brands, are being diminished in this scenario.
The opportunity is for publishers and broadcasters to create advertising consortiums in order to create high-value ad networks. The networks, then, become a more
valuable and more popular programmatic buy together than they were as separate publisher/broadcaster sites. In theory, these high-quality networks fetch higher CPMs for their higher-value, engaged audience members on these exchanges. That said, the programmatic buy for premium publisher sites is so new, there are no historic data to show revenue trends. Even the definitions and the potential values of programmatic buying are still being debated.
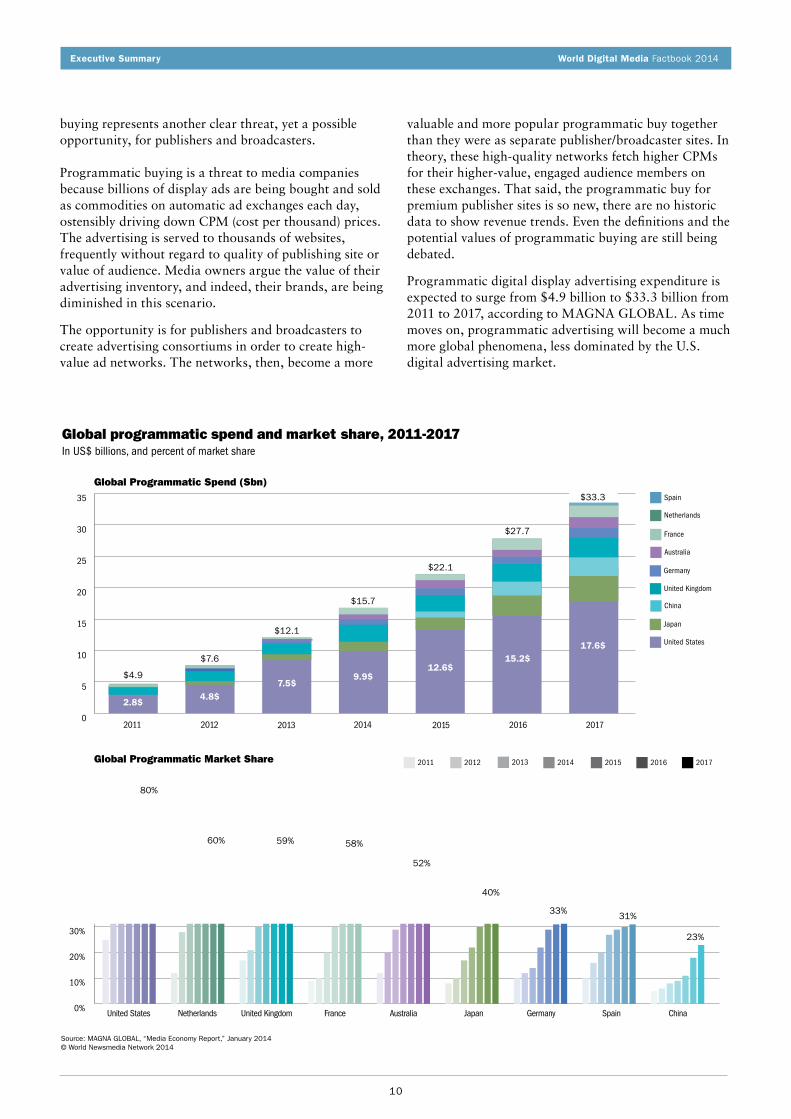
Programmatic digital display advertising expenditure is expected to surge from $4.9 billion to $33.3 billion from 2011 to 2017, according to MAGNA GLOBAL. As time moves on, programmatic advertising will become a much more global phenomena, less dominated by the U.S. digital advertising market.
0%
10%
20%
30%
40%
50%
60%
70%
80%
90%
United States Netherlands United Kingdom France Australia Japan Germany Spain China
2017201620152014201320122011
Global Programmatic Spend (Sbn)
Global Programmatic Market Share
2.global.globalprogrammaticspendandmarketshare
Global programmatic spend and market share, 2011-2017In US$ billions, and percent of market share
Source: MAGNA GLOBAL, “Media Economy Report,” January 2014© World Newsmedia Network 2014
Germany
United Kingdom
France
Australia
Japan
United States
China
Spain
Netherlands
2011 2012 2016 20172013 201520140
5
10
15
20
25
30
35
2.8$
$4.9
80%
60% 59% 58%
52%
40%
33% 31%
23%
4.8$
$7.6
7.5$
$12.1
9.9$
$15.7
12.6$
$22.1
15.2$
$27.7
17.6$
$33.3

11
Digital media usage landscape
The use of mobile to access the Internet around the world has nearly doubled in one year, with steeper growth happening in the developing world, such as Africa and Asia, where the proliferation of smartphone sales and usage is staggering. The implications for this trend include opportunities for publishers to produce content for mobile Internet and mobile apps in order to reach a growing audience of users on mobile devices.
Meanwhile, market share for programmatic buying in the digital display advertising market will swell in each country, from comparatively miniscule amounts in 2011, to 80 percent in the United States, 60 percent in the Netherlands, 59 percent in the United Kingdom, 58 percent in France, 52 percent in Australia, 40 percent in Japan, 33 percent in Germany, 31 percent in Spain and 23 percent in China, all by 2017.
E-commerce surging
Dramatic growth in e-commerce among mobile and tablet users has been studied in depth by Global WebIndex. From the end of 2012 to the end of 2013, those mobile phone users who indicated they had “ever” engaged in e-commerce online grew 24.4 percent, from 610 million to 759 million. Mobile phone users who engaged in e-commerce “last month” grew 23 percent, from 434 million to 534 million between the fourth quarter of 2012 and the fourth quarter of 2013.
For tablet users, the trajectory is more dramatic. Tablet users who said they had “ever” engaged in e-commerce grew 63.2 percent from Q4 2012 to Q4 2013, from 211 million to 346 million. Meanwhile, those who bought goods and services “last month” grew 61.3 percent, from 150 million to 242 million, according to GWI.
The most impressive implementations of e-commerce lie in fashion magazines around the world. E-commerce revenues are growing in the double digits for Elle Shop in Japan, Glamour Shop in the United States and for Elle and Harper’s Bazaar across 17 Burda International countries. See Chapter 5, Magazines, for detailed case studies.
Among PC users globally, e-commerce adoption is growing rapidly, from 616 million at the beginning of 2011 who said they had shopped online “last month,” to 902 million by the end of 2013 who said so, a 46.4 percent change.
Executive Summary World Digital Media Factbook 2014
2.global.gwi.PCusersecommerce
Global online e-commerce growthNumber of PC users engaging in e-commerce last month or ever
Source: GlobalWebIndex, 2014© World Newsmedia Network 2014
Last month Ever
1500m
1200m
900m
600m
Q1 2011 Q2 2011 Q4 2011 Q2 2012 Q4 2012 Q1 2013 Q2 2013 Q3 2013 Q4 2013
616m654m
691m
773m
851m 845m914m 916m
952m915m984m
1,027m
1,125m1,201m 1,224m
1,277m1,304m
1,332m
2.global.gwi.PCusersecommerce
Global mobile and tablet m-commerce growthNumber of mobile and tablet users engaging in m-commerce last month or ever
Last month EverMOBILE
Source: GlobalWebIndex, 2014© World Newsmedia Network 2014
347m
Last month EverTABLET
610m 623m
703m729m
759m
534m495m489m
434m434m
800m
700m
600m
500m
400m
Q4 2012 Q1 2013 Q2 2013 Q3 2013 Q4 2013
350m
300m
250m
200m
150m
211m227m
328m346m
150m 159m
246m225m
242m
Q4 2012 Q1 2013 Q2 2013 Q3 2013 Q4 2013
50%
40%
30%
20%
10%
0%
Source: Deloitte, May 2014, as reported by Internet Trends 2014 by Mary Meeker for Kleiner Perkins Caufield & Byers© World Newsmedia Network 2014
1+4.global.meeker.mobileandwebusage
Mobile Internet usage as a % of Web usageMay 2013 vs. May 2014, by region
% O
F PA
GE
VIEW
S C
OM
ING
FRO
M M
OB
ILE
DEV
ICES
11%
NorthAmerica
19%
6%
SouthAmerica
17%
8%
Europe
16%
23%
Asia
37%
18%
Africa
38%
12%
Oceania
17%14%
Global
25%
May 2013 May 2014

12
Executive Summary World Digital Media Factbook 2014
Mobile Internet usage as a percent of all Internet usage is on the ascendancy, particularly in Africa and Asia, according to StatCounter 2014, as reported in Mary Meeker’s Internet Trends 2014. Steep increases are seen between May 2013 and May 2014, underscoring how Internet users are changing their browsing behaviour from PCs to mobile, and how developing world users are now able to purchase smartphones at lower price points so they can browse the Internet and download apps.
Smartphone market share will soar among global connected device shipments, according to IDC’s “Worldwide Quarterly Smart Connected Device Tracker” research in 2013. IDC projects smartphone
4.global.IDC.connecteddeviceshipments, marketshare
Global connected device shipments, market share, 2013 and 2017Projected 2013 to 2017 market shares, in millions of units and percent of market share
Source: IDC Worldwide Quarterly Smart Connected Device Tracker, Sept. 11, 2013© World Newsmedia Network 2014
Desktop PC
Portable PC
Tablet
Smartphone
TOTAL
134.4
180.9
227.3
1,013.2
1,556
8.6%
11.6%
14.6%
65.1%
100%
123.11
196.6
406.8
1,733.9
2,460.5
5%
8%
16.5%
70.5%
100%
-8.4%
8.7%
78.9%
71.1%
58.1%
2013 Unit Shipments
Product Category
2013 Market Share
2017 Unit Shipments
2017 Market Share
2013-2017 Growth
Source: GlobalWebIndex, 2014© World Newsmedia Network 2014
4.global.GWI.mobileInternetuserprofile
Global demographics for mobile Internet users% of mobile users 16 to 64
GENDERFemaleMale
Mobile phone Personal PC/laptop
58% 42% 57% 43%
AGE16 to 2425 to 3435 to 4445 to 5455 to 64
21%
9%
35%
31%
21%
13% 28%
30%
INCOME
Bottom 25%Mid 50%Top 25%
Prefer not to say24%
23% 17%
36%
8%4%
26%
35%20%
18%
market share will grow from 65.1 percent in 2013 to 70.5 percent in 2017, while tablets will see growth from 14.6 percent to 16.5 percent during the same time period. Meanwhile, desktop computers will see an 8.4 percent decline from 2013 to 2017, from 134.4 million unit shipments in 2013 to 123.11 million unit shipments in 2017, according to the study.
Mobile Internet users tend to be male, young and middle-income, according to GlobalWebIndex’s Device Report 2014. More specifically, 58 percent of the mobile Internet using population and 57 percent of the PC/laptop Internet-using population are male.
Meanwhile almost one third of the mobile Internet (31 percent) and 28 percent of PC/laptop Internet users are ages 16 to 24, while 35 percent of mobile Internet and 30 percent of the PC/laptop Internet users are 25 to 34. More than one third of mobile and PC/laptop Internet users are in the mid-50 percentile of income earners, while one-fourth of those are in the highest income brackets.
Tablet users tend to be male, under 34-years-old, and those with high income. Of tablet Internet users, 59 percent are male, while 57 percent of PC/laptop Internet users are male, according to the GWI study. Almost two-thirds of tablet Internet users are under 34-years-old (62 percent), while 58 percent of PC/laptop Internet users are.
Source: GlobalWebIndex, 2014© World Newsmedia Network 2014
4.global.GWI.devicesharing
Global demographics for tablet users% of mobile users 16 to 64
GENDERFemaleMale
Tablet device Personal PC/laptop
59% 41% 57% 43%
AGE16 to 2425 to 3435 to 4445 to 5455 to 64
24%
10%
38%
24%
21%
13% 28%
30%
INCOME
Bottom 25%Mid 50%Top 25%
Prefer not to say33%
17% 18%
35%
8%4%
26%
35%20%
18%

13
Executive Summary World Digital Media Factbook 2014
Source: 2014 World Factbook, Central Intelligence Agency, Internet World Stats 2014
© World Newsmedia Network 2014
3.global.CIA.DigitalHotSpots2014
Digital Hot Spots 2014
HOTTEST mobile > 75% Internet > 50%
HOT IN MOBILE mobile > 75%Internet ≤ 50%
HOT IN INTERNET mobile < 75%Internet > 50%
COOLEST mobile < 75%Internet >< 50%
World Newsmedia Network has constructed the Digital Hot Spots map each year since 2006. The map shows the nations with the highest penetrations of Internet and mobile users in red, the highest concentrations of mobile but not Internet in purple, and the countries with a high penetration of Internet but not mobile in green. Those nations shaded in blue continue to underperform in both mobile and Internet penetrations, according to global Central Intelligence Agency and Internet World Stats data.
Since 2006, the world has seen dramatic growth in mobile and Internet penetrations. An important change started in 2011 is the shift toward mobile-focused access of the Internet, particularly in Africa, Latin America and parts of Asia. The main drivers of this shift are inexpensive smartphones and connectivity that are making it possible for people of limited means to access the Internet.
From 2013 to 2014, a variety of countries are graduating from the ranks of unconnected to connected via PC and mobile. The most notable changes are China, India and a host of Latin American and African countries, all which have moved to mobile hotspots, with more than 75 percent mobile penetrations.
The mobile Internet could bring billions of people into the connected world, thus levelling the playing field for the access to essential news and information, according to the McKinsey Institute’s Disruptive Technologies report, released in May 2013.
The questions are, will the smartphone handset makers
be able to mass produce affordable phones for these populations, and will telecoms in these African, Latin American and Asian countries budge on providing deeply discounted subscription plans for these new, but cash-strapped customers? At the moment, the fastest increasing mobile subscription charges are happening in developing countries, according to a McKinsey study.
These surging mobile Internet and smartphone trends create game-changing scenarios for media consumers and media companies for a number of reasons:
• Leveltheplayingfieldfortheaccessofnewsandinformation for everyone, regardless of socio-
economic status, in the developing world, and to improve digital literacy for all
• Improvetransparencyofgovernmentthroughawiderdissemination of information across societies
• Enableservicesnecessaryfordailyexistence,suchas banking and weather information, which arecurrently either out of reach or difficult to access formany
• Betterunderstandtheuniqueneedsforfeaturephone and smartphone users in the developing worldthrough the analysis of Big Data
• Enablecheapcommunicationsthroughpopularchatapps, such as WeChat and WhatsApp
Apps
The most popular apps downloaded and used by global app users ages 16 to 64 are by far game apps,

14
set, and most used on tablets by the 45-to 54-year-old age group, according to the Reuters Institute’s Digital News Report 2014.
Magazines bouncing backMagazines continue to hold steady to their stable performance since recovering from the economic crisis of 2008-2009. Magazine adspend continues its flat performance in its No. 1 stronghold, the United States, while in other parts of the world, magazines are losing slivers of share, according to ZenithOptimedia.
PricewaterhouseCoopers corroborates Zenith’s
followed by a variety of entertainment, music and social networking apps, according to GWI’s Device Report 2014. Respondents were asked which apps they downloaded and used in the last month.
The most popular downloaded apps were games, music, entertainment, utilities, social networks, books and news. The most popular apps actually used were games, social networks, music, entertainment, utilities and news.
In the United Kingdom, the percentage of weekly news app usage on smartphones and tablets depends on age. News apps are most used on smartphones by the younger
Executive Summary World Digital Media Factbook 2014
APPS DOWNLOADED
Source: GlobalWebIndex, 2014© World Newsmedia Network 2014
4.global.GWI.appsdownloadedandused
Apps downloaded and used in the past month, 2013% of global app users 16 to 64
Q4 2013Q3 2013Q2 2013Q1 2013
Games
Music
Entertainment
Utilities
Social networks
Books
News
Banking/Financial services
Travel
Health and fitness
VOIP (i.e.Skype or Viber)
Location-based services
TV application
Lifestyle
Sports
Work related service
Business
Live event
Augmented reality
None of the above
0% 80%60%40%20%
APPS USED
Q4 2013Q3 2013Q2 2013Q1 2013
Games
Social networks
Music
Entertainment
Utilities
News
Banking/Financial services
Books
Travel
Lifestyle
Health and fitness
Sports
VOIP (i.e.Skype or Viber)
Location-based services
TV application
Business
Live event
Augmented reality
Work related service
None of the above
0% 80%60%40%20%

15
Executive Summary World Digital Media Factbook 2014
predictions by saying magazines’ global revenues will hold steady until 2018, as noted in its Global Entertainment and Media Outlook 2014-2018.
Magazines garnered 7.9 percent of the world’s adspend in 2013, which is expected to drop 19 percent to 6.4 percent by 2016, according to Zenith. The decline in magazine and newspaper adspend is largely caused by the adspend shift to digital. The majority of adspend gains are in desktop Internet and particularly mobile Internet adspend for the foreseeable future.
The bright spot in the magazine industry’s revenue picture is consumer magazine digital advertising revenue around the world. In the United States alone, consumer magazine digital ad revenue is projected to grow 22.4 percent to $3.9 billion in 2014, and almost double to $7.6 billion by 2018, according to PwC. For digital consumer magazine circulation, global revenues are expected to surge 42 percent from 2013, and would
reach $743 million in 2014. Digital circulation revenue is expected to reach $1.5 billion by 2018, according to PwC. Meanwhile, print circulation revenue is expected to fall to $7.1 billion in 2014, and further drop to $6.2 billion by 2018, PwC reported.
Newspapers lose market shareThe newspaper industry worldwide is suffering the loss of market share, the rate of which is expected to accelerate between 2014 and 2018, according to PricewaterhouseCoopers.
According to ZenithOptimedia, in 2013 the global newspaper industry held a 16.9 percent adspend share, which is expected to drop to 13.7 percent by 2016.
Meanwhile, mobile Internet adspend is expected to see the most dramatic growth, a 181.5 percent surge from 2.7 percent share in 2013 to a projected 7.6 percent share in 2016. The more established desktop Internet adspend share is expected to increase a more modest 7.7 percent, from 18.1 percent to 19.5 percent during that period.
Newspapers in the biggest markets around in the world, North America and Western Europe, began seeing dramatic slides in advertising expenditure beginning in 2002. These declines are expected to continue through 2016, ZenithOptimedia reports.
However, the iconic saying, “Newspaper revenues are rising in the east and setting in the west,” continues to be true. The newspaper industry in Asia/Pacific region continues to recover from the global economic crisis of 2008-2009, and is growing its adspend steadily, thanks in large part to growth in India and China. Meanwhile, Latin America is seeing a dramatic rise in adspend since the economic crisis, from about US$4 billion in 2008 to almost $10 billion projected for 2016.
Paid digital newspaper subscriptions riseThe bright spot for newspapers around the world is the growth of digital news subscriptions, according to the Reuters Institute and PwC. Digital subscriptions are growing in the double digits, driven by smart subscription pricing schemes and paywall technologies that allow readers to “test drive” the newspaper before committing to a subscription.
The percentage of news site users who are paying for content in a variety of countries has risen in the double digits from 2013 to 2014, according to the Reuters Institute Digital News Report 2014. Denmark and the United States, the most mature news subscription countries, have the lowest percentages of growth, 12 percent and 8 percent, respectively, suggesting a slowdown and perhaps an eventual levelling off of willingness to subscribe.
4.global.reuters.newsappsonsmartphonestabletsbyage
News apps usage on smartphones and tablets, by agePercentage of weekly news apps accessed on smartphones and tablets in the UK
Source: Reuters Institute Digital News Report 2014© World Newsmedia Network 2014
45-54 GROUP USE MOST NEWS APPS ON TABLET
18-24
25-34
45-54
55+
35-44
SMARTPHONE TABLET
20%
15%
10%
5%
0%
18%
16%
18%
13%
7%
3%
5%
7%
10%
8%
Source: Global entertainment and media outlook, 2014-2018, PwC, www.pwc.com/outlook; Informa Telecoms & Media
© World Newsmedia Network 2014
5.global.PWC.magazinegrowth
Driven by digital, total magazine revenue will return to growth in 2015 Total global magazine revenue, in billions of US$, split by digital and print; and % year-on-year growth, 2009-2018
120
100
80
60
40
20
0
2%
0%
-2%
-4%
-6%
-8%
-10%
-12%
RE
VE
NU
E
YEAR
-ON
-YEAR
GR
OW
TH
2009 2010 2011 2012 2013 2014 2015 2016 2017 2018
Digital magazine publishing revenue
Year-on-year growth
Print magazine publishing revenue

16
Source: ZenithOptimedia 2014© World Newsmedia Network 2014
6.zenith.global.adspend.Newspapers
Newspaper advertising expenditure, 2002-2016In billions of US$ at current prices
North America Asia/PacificWestern Europe Central & Eastern Europe Latin America Middle East & North Africa
0
10
20
30
40
50
60
2002 2003 2004 2005 2006 2007 2008 2009 2010 2011 2012 2013 2014 2015 2016
Executive Summary World Digital Media Factbook 2014
Meanwhile, the year starting in mid-2013 has marked perhaps the turning point of users willing to pay for online news subscriptions. The most dramatic growth in online news subscribership was in Brazil, which reported a 25 percent surge in subscribers, from 40 percent to 65
percent of users paying for digital news subscriptions. The United Kingdom was not far behind, with 21 percent growth, from 42 percent to 63 percent of users; followed by France with 19 percent growth, from 28 percent to 47 percent; and Germany with 17 percent growth, from 37 percent to 54 percent.
For those non-subscribers, many responding to the online survey said they are very or somewhat likely to subscribe in the future for the brands they like. The most willing to consider paying for subscriptions in the future are those from Brazil, 61 percent; Italy, 23 percent; Spain, 21 percent and Germany, 15 percent. Denmark, Finland and the United States were all tied at 11 percent, followed by France, 10 percent; Japan, 8 percent and the United Kingdom, 7 percent.
Online Publishers Association subscription report2013 and 2014 have marked the years of mindset changes for publishers regarding subscriptions. Many
2.global.reuters.ongoingdigitalsubscriptions
Ongoing digital news subscriptions, 2013 to 2014 Percentage of users paying for digital news via subscriptions, by country
*Those saying they were very or somewhat likely to pay in the future for brands they likedSource: Reuters Institute Digital News Report 2014© World Newsmedia Network 2014
Percentage of non-subscribers saying they may pay for news subscriptions in the future, by country
Likely* 11%
US
7%
UK
15%
GER
10%
FR
11%
DEN
11%
FIN
21%
SPA
23%
ITA
61%
BRA
8%
JAP
2013
2014
Change
60%
68%
+8%
US
42%
63%
+21%
UK
37%
54%
+17%
GER
28%
47%
+19%
FRA
63%
75%
+12%
DEN
40%
65%
+25%
BRA

17
Executive Summary World Digital Media Factbook 2014
media companies are pushing hard to drive success with their paid content strategies.
According to an Online Publishers Association study in 2013, “Digital Subscription Strategies Pay Off,” media company executives responsible for subscription strategies emphasised that it is not just charging for content, but also retaining customers by engaging them, that is key. This can be accomplished by applying data-driven audience analytics to the subscription strategy.
“Retention and churn are huge issues for a digital subscription business. This has been a world of revelation – it’s not something the publishing industry had to deal with before. There are thresholds in usage (engagement) that show when people are likely to cancel subscription; this is what drives our product management – measure of success is how much new features drive the engagement on the site.”
— Rob Grimshaw, managing director, FT.com
“Engagement is very important to success – we need to convince people to spend more time with the New York Times and thus value their subscription more. Our recommendation engine is one such effort.”
— Denise Warren, EVP, Digital Products & Services, The New York Times
“We take inspiration from companies like Amazon, which spend a lot of time acquiring a customer and then spend an equal amount of time programmatically [i.e. applying data science] keeping the consumer engaged.”
— Michael Rolnick, head of digital/chief digital officer, The Wall Street Journal
The connection between subscriptions and the ability to sell higher-value advertising units is ramping up.
“When consumers login on the website we know who they are...we can marry the behaviour to demographic and subscription data. This allows us to not only target the consumer as we pitch our internal products and content, but also allows advertisers to target better.”
— Kim Miller, VP, Digital & Traditional Consumer Marketing, PEOPLE brand, Time Inc.
Daily newspapers dominate the subscription revenue landscape in the United States, garnering 69 percent of the subscription revenue, or US$10.4 billion. Cable news follows, with 18.5 percent or $2.8 billion, and weekly newspapers take 6 percent, or $850 million. For-profit, digital-native newsmedia draws less than 1 percent of
2.US.Pew.subscriptionrevenue
U.S. subscription revenue across sectorsAnnual subscription estimates, 2012-2013
Note: Figures represent the most recently available data (2012-2013). Numbers may not equal 100% due to rounding.
Source: “State of the News Media 2014,” Pew Research Center© World Newsmedia Network 2014
69%
6%
1.5%
2%
1%
18.5%
3%
<1%
100%
$10.4 billion
$850 million
$200 to $600 million
$300 million
$150 million
$2.8 billion
$400 million
$4 to $5 million
$15 billion
Daily newspapers
Weekly newspapers
News magazines
Local TV news
Network TV news
Cable news
Non-commerical news
For-profit digital native
Total
Sector Annual audiencerevenue
% of industry-wide audience revenue
Source: ZenithOptimedia© World Newsmedia Network 2014
1.Zenith.global.regionalgrowthadspend2
Global share of adspend, by medium% share, by medium, 2013 and 2016
2013
Television 40.1%
Desktop Internet 18.1%
Mobile Internet 2.7%
Newspapers 16.9%
Magazines 7.9%
Outdoor 7.0%
Radio 6.9%
Cinema 0.5%
2016
Television 39.2%
Desktop Internet 19.5%
Mobile Internet 7.6%
Newspapers 13.7%
Magazines 6.4%
Outdoor 6.8%
Radio 6.3%
Cinema 0.6%

18
Executive Summary World Digital Media Factbook 2014
subscription/circulation revenue, according to Pew.
Television maintains strongholdTelevision continues to be the most powerful advertising medium in the world, in every region, usually by a sizeable lead, compared to other media. Television adspend continues its strong lead compared to other media, according to a 2014 report by ZenithOptimedia. Comparing TV adspend in 2013 and projections for 2016, TV loses 0.9 percentage points of global adspend share at the hands of surging desktop Internet and mobile Internet adspend, and is buffered by sharply falling newspaper adspend.
Zenith projects TV adspend will dip from 40.1 percent to 39.2 percent from 2013 to 2016, compared to newspaper adspend, which is estimated to drop from 16.9 percent to 13.7 percent, and magazine adspend from 7.9 percent to 6.4 percent. Meanwhile, mobile Internet adspend is expected to see the most dramatic growth, a 181.5 percent surge from a 2.7 percent share in 2013
to a projected 7.6 percent share in 2016. The more established desktop Internet adspend share is expected to increase a more modest 7.7 percent, from 18.1 percent to 19.5 percent during that period.
TV adspend share is particularly strong in the developing world in Latin America, the Middle East and North Africa and Central and Eastern Europe, where TV garners more than half of the advertising pie, while the developed world in North America, Western Europe and Asia draw one-third to 41 percent of the pie, even though these three regions together represent almost 85 percent of all of the TV adspend in the world.
Television advertising expenditure continues to expand in most regions of the world. Zenith projects a steep upward trajectory for North America, the Asia/Pacific and Latin America and a moderate climb for Central & Eastern Europe. Meanwhile, Zenith projects Western Europe and the Middle East & North Africa will remain relatively flat for TV ad expenditure.
Not only are there marked differences between the way
Source: ZenithOptimedia 2014© World Newsmedia Network 2014
7.zenith.global.adspend.TV
TV advertising expenditure, 2002-2016In US$ millions at current prices
North America Asia/PacificWestern Europe Central & Eastern Europe Latin America Middle East & North Africa
0
10
20
30
40
50
60
70
80
2002 2003 2004 2005 2006 2007 2008 2009 2010 2011 2012 2013 2014 2015 2016

19
Executive Summary World Digital Media Factbook 2014
people from various countries consume content on TV and other screens, but a variety of age groups also consume TV dramatically differently. Millennials, those ages 19 to 35, consume considerably more video online and don’t consume live TV, compared with their older counterparts.
Thirty-four percent of Millennials’ video time spent is online, and 41 percent on live TV, while non-Millennnials spend an average of 12 percent on online video and 59 percent on live TV in the United States, according to the Verizon Digital Media Study 2014.
Targeting the Millennials generation is the next big opportunity for media companies. As targeting audiences becomes more ubiquitous across digital media channels, media companies are identifying targeting strategies in order to build audiences now and for the future. One such target is the largest and most economically powerful generational group: Millennials.
In 2014, Millennials, otherwise known as Generation Y or echo boomers, are ages 19 to 35.
The most powerful ways to reach Millennials are through social media, and through digital media with strong social media components. However, it is imperative that publishers speak to the Millennial audience in a profoundly different way than older generational groups.
“Young people want to read about serious topics, but they want to hear authentic voices. They’ve been lied to one too many times by politicians, they’ve been misled one too many times by news outlets,” said Jake Horowitz, co-founder and editor-in-chief of PolicyMic.com, a news website targeted to Millennials.
“Young people are not going to news sites. They’re going to Facebook, Twitter, Instagram, Pinterest, Vine. You have to reach young people where they’re having conversations. And stories have to look different on each of those different social platforms. We’re shaping stories so that they are appropriate for each of those platforms,” Horowitz said at a conference at the University of Texas in Austin in April 2014.
Indeed, Millennials have a much different view on the credibility of news coverage compared to older generations. According to a 2013 study by Telefonica and the Financial Times, Millennials are three or four times more likely to identify the Internet and social media news sources as more credible than printed newspapers and magazines, depending on the region of the world where they live. Further, Millennials were two or three times more likely to identify Internet and social media news sources as more credible than television news sources, according to the study.
For an in-depth study about Millennials and the opportunity they present to media companies, see Chapter 3 of the World Digital Media Factbook.
100%
80%
60%
40%
20%
0%
Source: Deloitte, May 2014, as reported by Internet Trends 2014 by Mary Meeker for Kleiner Perkins Caufield & Byers© World Newsmedia Network 2014
3+7.USA.meeker.TVtimespentMillennials
TV time spent by device, Millennials vs. non-MillennialsIn % of time spent
Non-Millennials Millennials
Live TV
DVR viewing
On-Demand
Online
59%
17%
12%
12%
41%
15%
10%
34%
Source: Telefonica, Financial Times, 2013© World Newsmedia Network 2014
3.global.telefonica.millennialscrediblenews
Credible news choices for Millennials worldwideIn share of respondents from each region
Printed newspapers/magazinesInternet, including social media Television
0%
10%
20%
30%
40%
50%
North America
44%
39%
14%
Latin America
45%
18%
33%
Central & Eastern Euriope
12%
49%
Asia
33%
45%
Western Europe
38%
14%
Middle East & Africa
40%
32%
Global
21%
43%
34%
18%
45%
36%
15%
A roadmap for successful creative magazine media strategiesINNOVATIONS IN MAGAZINE MEDIA 2014 WORLD REPORT
“Explores the four major changesexploding on the magazine media front...”JOHN WILPERS, INNOVATIONS EDITOR
Publications Resources Communications♦ Innovations in Magazine Media World Report ♦ Toolkits ♦Magazine World - six times a year
♦World Magazine Trends ♦ Slides ♦Update -fortnightly industry news
♦Digital Media Factbook ♦Webcasts ♦ Insight - monthly research news
♦ Proof of Performance: Making the case for magazine media ♦ Videos ♦www.fipp.com/subscribe
♦WMM: Licensing & syndication explained
WHERE TO FIND MORE FIPP INSIGHT:
THE LATESTSTUNNING
INNOVATIONS
GET YOURS TODAY:
www.fipp.com/insight
print digital app
[Enter the world ofFipp Insight by
scanning this pagewith the blippar app]
innovations ad 2014.indd 1 30/07/2014 16:43

A roadmap for successful creative magazine media strategiesINNOVATIONS IN MAGAZINE MEDIA 2014 WORLD REPORT
“Explores the four major changes exploding on the magazine media front...” JOHN WILPERS, INNOVATIONS EDITOR
Publications Resources Communications♦ Innovations in Magazine Media World Report ♦ Toolkits ♦ Magazine World - six times a year
♦ World Magazine Trends ♦ Slides ♦ Update -fortnightly industry news
♦ Digital Media Factbook ♦ Webcasts ♦ Insight - monthly research news
♦ Proof of Performance: Making the case for magazine media ♦ Videos ♦ www.fi pp.com/subscribe
♦ WMM: Licensing & syndication explained
WHERE TO FIND MORE FIPP INSIGHT:
THE LATEST STUNNING
INNOVATIONS
GET YOURS TODAY:
www.fi pp.com/insight
print digital app
[Enter the world of Fipp Insight by
scanning this page with the blippar app]
innovations ad 2014.indd 1 30/07/2014 16:43