Embed Size (px)
Citation preview

© 2017 Cengage Learning. All Rights Reserved. May not be scanned, copied or duplicated, or posted to a publicly accessible website, in whole or in part.
C H A P T E R 1 Functions, Graphs, and Limits
Section 1.1 The Cartesian Plane and the Distance Formula .................................... 2
Section 1.2 Graphs of Equations ............................................................................... 9
Section 1.3 Lines in the Plane and Slope ................................................................ 18
Quiz Yourself ............................................................................................................... 29
Section 1.4 Functions ............................................................................................... 32
Section 1.5 Limits .................................................................................................... 42
Section 1.6 Continuity ............................................................................................. 50
Review Exercises .......................................................................................................... 55
Test Yourself ............................................................................................................... 68

2 © 2017 Cengage Learning. All Rights Reserved. May not be scanned, copied or duplicated, or posted to a publicly accessible website, in whole or in part.
C H A P T E R 1 Functions, Graphs, and Limits
Section 1.1 The Cartesian Plane and the Distance Formula
1.
2.
Skills Warm Up
1. ( ) ( ) ( )22 2 23 6 1 5 3 6
9 36
45
3 5
− + − − = − +
= +
=
=
2. ( ) ( ) ( ) ( )22 2 22 0 7 3 2 4
4 16
20
2 5
− − + − − − = − + −
= +
=
=
3. ( )5 4 1
2 2
+ −=
4. ( )3 1 4
22 2
− + − −= = −
5. 27 12 3 3 2 3 5 3+ = + =
6. 8 18 2 2 3 2 2− = − = −
7. ( )
( )
57
2
5 14
19
x
x
x
+ −=
+ − =
=
8. 7
32
7 6
1
y
y
y
− + = −
− + = −=
9.
( ) ( )
( ) ( ) ( )( ) ( )
( )( )
( )
2 2
2 22 2
2 2
2 2
2
2
3 7 4 45
3 7 4 45
3 7 4 45
3 3 45
3 9 45
3 36
3 6
3 6
3 6
3, 9
x
x
x
x
x
x
x
x
x
x
− + − =
− + − =
− + − =
− + =
− + =
− =
− = ±− = − ±
== −
10.
( ) ( )
( ) ( ) ( )( ) ( )
( )( )( )
2 2
2 22 2
2 2
22
2
2
6 2 2 52
6 2 2 52
6 2 2 52
4 2 52
16 2 52
2 36
2 6
6 2
6 2
8, 4
y
y
y
y
y
y
y
y
y
y
− + − − =
− + − − =
− + − − =
+ − − =
+ − − =
− − =
− − = ±− = ± +
= −= −
x
y
−2−4 2 4 6−2
−4
−6
2
4
6(−3, 5)
(−6, −1)
(5, 1)
(2, −2)
(0, −4)
x
y
−1−2−3−4−5 2 3
−2
−3
−4
−5
1
2
3
4 (1, 4)
(−2, −4)
(1, −1)
(2, 0)
(−5, 3)

Section 1.1 The Cartesian Plane and the Distance Formula 3
© 2017 Cengage Learning. All Rights Reserved. May not be scanned, copied or duplicated, or posted to a publicly accessible website, in whole or in part.
3. (a)
(b) ( ) ( )2 25 3 5 1 4 16 2 5d = − + − = + =
(c) Midpoint ( )3 5 1 5, 4, 3
2 2
+ + = =
4. (a)
(b) ( ) ( )2 23 3 2 2 36 16 2 13d = − − + + = + =
(c) Midpoint ( ) ( )2 23 3
, 0, 02 2
+ − − += =
5. (a)
(b) ( ) ( )2 23 1 7 1 16 64 4 5d = − − + + = + =
(c) Midpoint ( )3 1 7 1, 1, 3
2 2
− + − = = −
6. (a)
(b) ( ) ( )2 24 2 14 2
4 144
2 37
d = − + −
= +
=
(c) Midpoint ( )2 4 2 14, 3, 8
2 2
+ + = =
7. (a)
(b) ( ) ( )( )2 2
2 2
8 2 4 12
6 8
36 64
100 10
= − + − − −
= +
= +
= =
d
(c) ( ) ( )
( )
12 42 8Midpoint ,
2 2
10 16,
2 2
5, 8
− + − +=
− =
= −
8. (a)
(b) ( )( ) ( )( )2 2
2 2
7 5 3 2
12 5
144 25
169 13
= − − + − −
= +
= +
= =
d
(c) ( ) ( )7 5 3 2
Midpoint , 2 2
2 1,
2 2
11,
2
+ − + − =
=
=
5
4
3
2
1
54321x
(5, 5)
(4, 3)
(3, 1)
y
14
10
6
2
8642x
(4, 14)
(3, 8)
(2, 2)
y
−2 2 4 6 8 10 12−2
−4
−6
−8
−10
−12
2
x
(2, −12)
(5, −8)
(8, −4)
y
−4−6−8 2 4 6 8−1
−2
−3
−4
1
2
3
4
x
(−5, −2)
(7, 3)
12(1, )
y
x
( 3, 7)−
(1, 1)−
( 1, 3)−
−6 −4 −2 2 4−2
8
6
4
y
x
(−3, 2)
(0, 0)
(3, −2)
−3 −2 −2 2 3
3
2
1
−1
−2
−3
y

4 Chapter 1 Functions, Graphs, and Limits
© 2017 Cengage Learning. All Rights Reserved. May not be scanned, copied or duplicated, or posted to a publicly accessible website, in whole or in part.
9. (a)
(b) ( ) ( ) ( )2 23 2 1 2 5 1
4 36
2 10
d = − + −
= +
=
(c) Midpoint ( ) ( ) ( )1 2 3 2 1 5 1
, , 22 2 2
+ − + − = = − −
10. (a)
(b) 2 2
5 2 1 1 16 651
6 3 3 36 9 6d
= − + + = + =
(c) Midpoint ( ) ( ) ( )5 6 2 3 1 1 3 3 1
, ,2 2 4 3
+ − = =
11. (a)
(b) ( ) ( )( )220.5 0 6 4.8
0.25 116.64
116.89
d = − + − −
= +
=
(c) Midpoint ( )0 0.5 4.8 6, 0.25, 0.6
2 2
+ − + = =
12. (a)
(b) ( ) ( )2 22.7 5.2 1.8 6.4
62.41 21.16
83.57
d = − − + −
= +
=
(c) Midpoint ( )
( )
5.2 2.7 6.4 1.8,
2 2
1.25, 4.1
+ − +=
=
13. (a) 4a =
3b =
( ) ( )2 24 0 3 0 16 9 5c = − + − = + =
(b) 2 2 216 9 25a b c+ = + = =
14. (a) ( ) ( )2 213 1 1 1 144 0 12a = − + − = + =
( ) ( )2 213 13 6 1 0 25 5b = − + − = + =
( ) ( )2 213 1 6 1 144 25 13c = − + − = + =
(b) 2 2 2144 25 169a b c+ = + = =
15. (a) 10a =
3b =
( ) ( )2 27 3 4 1 100 9 109c = + + − = + =
(b) 2 2 2100 9 109a b c+ = + = =
16. (a) ( ) ( )2 26 2 2 2 16 0 4a = − + − + = + =
( ) ( )2 22 2 5 2 0 49 7b = − + + = + =
( ) ( )2 22 6 5 2 16 49 65c = − + + = + =
(b) 2 2 216 49 65a b c+ = + = =
( )
( )
2
−6
−4
42x
1 , 12
y
( )−2−4
− , −2 12
− , −532
x
y
6
6
4
2
−2
−4
−6
−2−4−6 42
(0, −4.8)
(0.25, 0.6)
(0.5, 6)
x
y
−2 2 4 6
2
4
6
8
(−2.7, 1.8)
(1.25, 4.1)
(5.2, 6.4)
−2
x1
1
y
( ) , 1 56
( ) , 34
13
( ) , −23
13

Section 1.1 The Cartesian Plane and the Distance Formula 5
© 2017 Cengage Learning. All Rights Reserved. May not be scanned, copied or duplicated, or posted to a publicly accessible website, in whole or in part.
17. ( ) ( )2 21 3 0 7 1
9 36
45
3 5
d = − + −
= +
=
=
( ) ( )2 22 4 0 1 1
16 4
20
2 5
d = − + − −
= +
=
=
( ) ( ) 223 3 4 7 1
1 64
65
d = − + − −
= +
=
Because 2 2 21 2 3 ,d d d+ = the figure is a right triangle.
18. ( ) ( )
( ) ( )
( ) ( )
2 2
2 2
2 2
2 3 4 2 25 4 29
3 1 2 3 4 25 29
2 1 4 3 9 49 58
a
b
c
= − − + − = + =
= − + + = + =
= − − + + = + =
Because a b= the figure is an isosceles triangle.
[Note: It is also a right triangle since 2 2 2.a b c+ = ]
19. ( ) ( )
( ) ( )
( ) ( )
( ) ( )
2 21
2 22
2 23
2 24
1 0 2 0 1 4 5
3 1 3 2 4 1 5
2 3 1 3 1 4 5
0 2 0 1 4 1 5
d
d
d
d
= − + − = + =
= − + − = + =
= − + − = + =
= − + − = + =
Because 1 2 3 4,d d d d= = = the figure is a
parallelogram.
20. ( ) ( )
( ) ( )
( ) ( )
( ) ( )
2 2
2 2
2 2
2 2
3 0 7 1 9 36 3 5
3 4 7 4 1 9 10
4 1 4 2 9 36 3 5
1 0 2 1 1 9 10
a
b
c
d
= − + − = + =
= − + − = + =
= − + + = + =
= − + − − = + =
Because a c= and ,b d= the figure is a
parallelogram.
21. d = ( ) ( )
( )( )
2 2
2
2
2
1 4 0 5
2 17 5
2 17 25
2 8 0
4 2 0
4, 2
x
x x
x x
x x
x x
x
− + − − =
− + =
− + =
− − =
− + =
= −
22. d = ( ) ( )
( )( )
2 2
2
2
2
2 2 1 5
4 13 5
4 13 25
4 12 0
2 6 0
2, 6
x
x x
x x
x x
x x
x
− + + =
− + =
− + =
− − =
+ − =
= −
6
4
2
62x
d2
d1
3d
(4, −1)
(3, 7)
(0, 1)
y
x
( 2, 4)−
−3 −2 −1 3 41
4
3
2
−2
−3
(3, 2)
d1
d3
d2
(1, 3)−
y
3
2
1
321x
d4
d2
d3
d1
(3, 3)
(2, 1)
(1, 2)
(0, 0)
y
x
(3, 7)
d2d1
d3d4(0, 1)
(4, 4)
(1, 2)−
8
6
4
−2−2 4 6 8
y

6 Chapter 1 Functions, Graphs, and Limits
© 2017 Cengage Learning. All Rights Reserved. May not be scanned, copied or duplicated, or posted to a publicly accessible website, in whole or in part.
23. d = ( )( ) ( )2 2
2
2
2
3 5 0 8
4 8
4 64
60
60
2 15
y
y
y
y
y
y
− − − + − =
+ =
+ =
=
= ±
= ±
24. d = ( ) ( )( )( )( )
22
2
2
4 4 6 8
6 8
6 64
6 8
6 8
14, 2
y
y
y
y
y
y
− + − − =
+ =
+ =
+ = ±= − ±= −
25. ( ) ( )2 2
2 2
50 12 42 18
38 24
2020
2 505 44.9 yd
d = − + −
= +
=
= ≈
26. ( ) ( )2 2
2 2
33 12 37 18
21 19
441 361
802 28.3 yd
d = − + −
= +
= +
= ≈
27.
The numbers of individuals using the Internet increased each year from 2006 through 2013.
28.
The numbers of cellular telephone subscribers increased each year from 2006 through 2013.
29. (a) March 2013: 14,500
July 2013: 15,500
July 2014: 16,500
(b) December 2013: 16,600
January 2014: 15,750
Decrease: 16,600 15,750 850− =
Percent decrease: 850
0.051 5.1%16,600
≈ =
30. (a) 2007: $218,000
2009: $172,000
2012: $178,000
(b) 2011: $168,000
2012: $178,000
Increase: 178,000 168,000 10,000− =
Percent increase: 10,000
0.0595168,000
6.0%
≈
≈
20060
3
2014
20060
3
2014
20060
3
2014
2006200
350
2014
20060
3
2014
20060
3
2014

Section 1.1 The Cartesian Plane and the Distance Formula 7
© 2017 Cengage Learning. All Rights Reserved. May not be scanned, copied or duplicated, or posted to a publicly accessible website, in whole or in part.
31. (a) Revenue
( )
2011 2013 784.5 1266.7,
2 2
2012, 1025.6
+ + =
=
Revenue estimate for 2012: $1025.6 million
Profit
( )
2011 2013 50.4 71.6,
2 2
2012, 61.0
+ + =
=
Profit estimate for 2012: $61.0 million
(b) Actual 2012 revenue: $1040.5 million
Actual 2012 profit: $57.3 million
(c) Yes, the revenue and profit increased in a linear pattern from 2011 to 2013.
(d) 2011 expense: 784.5 50.4 $734.1 million− =
2012 expense: 1040.5 57.3 $983.2 million− =
2013 expense: 1266.7 71.6 $1195.1 million− =
(e) Answers will vary.
32. (a) Revenue
( )
2011 2013 40.9 45.0,
2 2
2012, 42.95
+ + =
=
Revenue estimate for 2012: $42.95 billion
Profit
( )
2011 2013 4.8 6.1,
2 2
2012, 5.45
+ + =
=
Profit estimate for 2012: $5.45 billion
(b) Actual 2012 revenue: $42.3 billion
Actual 2012 profit: $5.7 billion
(c) Yes, the revenue and profit increased in a linear pattern from 2011 to 2013.
(d) 2011 expense: 40.9 4.8 $36.1 billion− =
2012 expense: 42.3 5.7 $36.6 billion− =
2013 expense: 45.0 6.1 $38.9 billion− =
(e) Answers will vary.
33. (a)
(b) The larger the clinic, the more patients a doctor can treat.
34. (a) 500 pickups were sold in 2011.
(b) About 400 pickups were sold in 2013.
(c) The number of pickups sold each year is decreasing.
35. The vertex ( )3, 1− − is translated to ( )6, 6 .− −
The vertex ( )0, 0 is translated to ( )3, 5 .− −
The vertex ( )1, 2− − is translated to ( )4, 7 .− −
36. The vertex ( )0, 2 is translated to ( )2, 6 .
The vertex ( )1, 3 is translated to ( )3, 7 .
The vertex ( )3, 1 is translated to ( )5, 5 .
The vertex ( )2, 0 is translated to ( )4, 4 .
37. Midpoint 1 2 1 2,2 2
x x y y+ + =
The point one-fourth of the way between ( )1 1,x y and
( )2 2,x y is the midpoint of the line segment from
( )1 1,x y to 1 2 1 2, ,2 2
x x y y+ +
which is
1 2 1 21 1
1 2 1 23 32 2, , .2 2 4 4
x x y yx y x x y y
+ + + + + + =
The point three-fourths of the way between ( )1 1,x y and
( )2 2,x y is the midpoint of the line segment from
1 2 1 2,2 2
x x y y+ +
to ( )2 2, ,x y which is
1 2 1 22 2
1 2 1 23 32 2, , .2 2 4 4
x x y yx y x x y y
+ + + + + + =
Thus,
1 2 1 2 1 2 1 23 3, , , ,
4 4 2 2
x x y y x x y y+ + + +
and
1 2 1 23 3,
4 4
x x y y+ +
are the three points that divide the line segment joining
( )1 1,x y and ( )2 2,x y into four equal parts.
Small clinic
Large clinic
Num
ber
of e
ar in
fect
ions
20
30
40
50
60
70
10
Number of doctors1 2 3 4
Medium clinic

8 Chapter 1 Functions, Graphs, and Limits
© 2017 Cengage Learning. All Rights Reserved. May not be scanned, copied or duplicated, or posted to a publicly accessible website, in whole or in part.
38. (a) ( ) ( )
( ) ( )
3 1 4 3 2 1 7 7, ,
4 4 4 4
1 4 2 1 5 3, ,
2 2 2 2
1 3 4 2 3 1 13 5, ,
4 4 4 4
+ − − = −
+ − − = −
+ − + − = −
(b) ( ) ( )
( ) ( )
3 2 0 3 3 0 3 9, ,
4 4 2 4
2 0 3 0 3, 1,
2 2 2
2 3 0 3 3 0 1 3, ,
4 4 2 4
− + − + = − −
− + − + = − −
− + − + = − −
39. To show 1 2 1 22 2,
3 3
x x y y+ +
is a point of trisection of the line segment joining ( )1 1,x y and ( )2 2, ,x y we must show that
1 212
d d= and 1 2 3.d d d+ =
( ) ( )
2 21 2 1 2
1 1 1
2 22 1 2 1
2 22 1 2 1
2 2
3 3
3 3
1
3
x x y yd x y
x x y y
x x y y
+ + = − + −
− − = +
= − + −
( ) ( )
2 21 2 1 2
2 2 2
2 22 1 2 1
2 22 1 2 1
2 2
3 3
2 2 2 2
3 3
2
3
x x y yd x y
x x y y
x x y y
+ + = − + −
− − = +
= − + −
( ) ( )2 23 2 1 2 1d x x y y= − + −
Therefore, 1 21
2d d= and 1 2 3.d d d+ = The midpoint of the line segment joining 1 2 1 22 2
,3 3
x x y y+ +
and ( )2 2,x y is
Midpoint
1 2 1 22 2
1 2 1 2
2 2
3 3,2 2
2 2, .
3 3
x x y yx y
x x y y
+ + + + =
+ + =
40. (a) ( ) ( ) ( )
( ) ( ) ( )
2 1 4 2 2 1, 2, 1
3 3
1 2 4 2 2 1, 3, 0
3 3
+ − + = −
+ − + =
(b) ( ) ( )
( ) ( )
2 2 0 2 3 0 4, , 2
3 3 3
2 2 0 3 2 0 2, , 1
3 3 3
− + − + = − −
− + − + = − −
x
d3
d1
d2
( , )x y1 1
( , )x y2 2
2 +x x1 2 2 +y y1 23 3
,( (
y

Section 1.2 Graphs of Equations 9
© 2017 Cengage Learning. All Rights Reserved. May not be scanned, copied or duplicated, or posted to a publicly accessible website, in whole or in part.
Section 1.2 Graphs of Equations
1. The graph of 2y x= − is a straight line with
-intercepty at ( )0, 2 .− So, it matches (e).
2. The graph of 12
2y x= − + is a straight line with
-intercepty at ( )0, 2 . So, it matches (b).
3. The graph of 2 2y x x= + is a parabola opening up
with vertex at ( )1, 1 .− − So, it matches (c).
4. The graph of 29y x= − is a semicircle with
intercepts ( ) ( )0, 3 , 3, 0 , and ( )3, 0 .− So, it matches (f).
Skills Warm Up
1. 5 12
5 12
12
5
y x
y x
xy
− == +
+=
2. 15
15
y x
y x
− = −= −
3.
( )3
3
3
2 1
2 1
1
2
x y y
y x
yx
+ =
+ =
=+
4. 2 2
2 2
2 2
2
6 0
6
6
6
x x y
y x x
y x x
y x x
+ − − =
− = − −
= + −
= + −
5. ( ) ( )( ) ( )
( )
( )
( )
2 2
2 2
2
2
2
2
2 1 9
1 9 2
1 9 2
9 2 1
9 4 4 1
5 4 1
x y
y x
y x
y x
x x
x x
− + + =
+ = − −
+ = − −
= − − −
= − − + −
= + − −
6. ( ) ( )( ) ( )
( )
( )
( )
2 2
2 2
2
2
2
2
6 5 81
5 81 6
5 81 6
5 81 6
5 81 12 36
5 45 12
x y
y x
y x
y x
x x
x x
+ + − =
− = − +
− = − +
= + − +
= + − + +
= + − −
7. ( )5 2 10= − = −y
8. ( )3 3 4 5= − =y
9. ( )( )
24 0.5 7
4 0.25 7
1 7
6
y = −
= −
= −= −
10. ( ) ( )( ) ( )
21 13 3
1 19 3
9 9 5
9 9 5
1 3 5 1
y = + −
= + −
= + − = −
11.
( )( )
2 3 2
1 2
x x
x x
− +
− −
12.
( )( )
2 5 6
2 3
x x
x x
+ +
+ +
13.
( )
2
2
94
32
3y y
y
− +
−
14.
( )
2
2
494
72
7y y
y
− +
−

10 Chapter 1 Functions, Graphs, and Limits
© 2017 Cengage Learning. All Rights Reserved. May not be scanned, copied or duplicated, or posted to a publicly accessible website, in whole or in part.
5. The graph of 2y x= − has a y-intercept at ( )0, 2−
and has x-intercepts at ( )2, 0− and ( )2, 0 .
So, it matches (a).
6. The graph of 3y x x= − has intercepts at ( ) ( )0, 0 , 1, 0 ,
and ( )1, 0 .− So, it matches (d).
7. 2 3y x= +
8. 1 4y x= −
9. 2 3y x= −
10. 2 6y x= +
11. ( )21y x= −
12. ( )25y x= +
13. 3 2y x= +
x −2 32
− −1 0 1 2
y −1 0 1 3 5 7
x −1 0 14
1 2
y 5 1 0 −3 −7
x −2 −1 0 1 2 3
y 1 −2 −3 −2 1 6
x −2 −1 0 1 2
y 10 7 6 7 10
x −2 −1 0 1 2
y 9 4 1 0 1
x −6 −5 −4 −3 −2
y 1 0 1 2 9
x −2 −1 0 1 2
y −6 1 2 3 10
( )−4 −3 −1 21 3 4
4
3
1
−2
−3
−4
y
x
(0, 3)
, 032
−
( )
y
x
(0, 1) , 014
−1−2−3−4 1 2 3 4
−2
−3
−4
1
2
y
x
3, 0− )( 3, 0)(
(0, −3)
−4 −3−1
1
2
3
4
−4
1 3 4
x
(0, 6)
−6 −3 63
12
9
3
y
(0, 1)(1, 0)
1 2 3 4 5−1−1
4
5
6
−2
−2−3
y
x
y
x
(0, 25)
(−5, 0)
−2−4−6−8−10 2−5
5
20
25
30
321−3 −2
5
4
3
1
−1
x
(0, 2)),, 0( 2− 3
y

Section 1.2 Graphs of Equations 11
© 2017 Cengage Learning. All Rights Reserved. May not be scanned, copied or duplicated, or posted to a publicly accessible website, in whole or in part.
14. 31y x= −
15. 1y x= − −
16. 4y x= +
17. 1y x= +
18. 2y x= − −
19. 1
3y
x=
−
20. 1
2y
x=
+
21. 2 4x y= −
x 0 1 −1 2
y 1 0 2 −7
x 1 2 3 4 5
y 0 −1 −1.41 −1.73 −2
x −4 −3 −2 −1 0
y 0 1 2 3 2
x −3 −2 −1 0 1
y 2 1 0 1 2
x 2 0 1 3 4
y 0 −2 −1 −1 −2
x −1 0 1 2 2.5 3.5 4 5 6
y 14
− 13
− 12
− −1 −2 2 1 12
13
x −4 −3 −1 0 1 2
y 12
− 1− 1 12
13
14
x 5 0 −3 −4
y ±3 ±2 ±1 0
x
(0, 1)
(1, 0)−1
2
y
x
y
5
3
2
1
−1
−2
−3
−1 432
(1, 0)
y
x
(0, 2)(−4, 0)
−1−2−3−4−5−6 1 2
−2
−3
1
3
4
5
−4 −3 −2 −1−1
1
2
3
4
5
6
−2
1 2 3 4
y
x(0, 1)
(−1, 0)
x(2, 0)
(0, 2)−
1 2 3 4
1
−1
−2
−3
y
−3
−2
−1
3
2
1
654x
y
(0, − )13
y
x
10, 2( )−1−2−5−6 1 2
−2
−3
−4
2
3
4
1−1−2−3
−3
−1
3
1
x
(0, 2)
(−4, 0)
y
(0, −2)

12 Chapter 1 Functions, Graphs, and Limits
© 2017 Cengage Learning. All Rights Reserved. May not be scanned, copied or duplicated, or posted to a publicly accessible website, in whole or in part.
22. 24x y= −
23. Let 0.y = Then,
( )32
2 0 3 0
.
x
x
− − =
=
Let 0.x = Then,
( )2 0 3 0
3.
y
y
− − =
= −
-intercept:x ( )32, 0
-intercept:y ( )0, 3−
24. Let 0.y = Then,
( )
32
4 3 0 6 0
4 6
x
x
x
− − =
=
=
Let 0.x = Then,
( )4 0 3 6 0
3 6
2
y
y
y
− − =
− == −
x-intercept: ( )32, 0
y-intercept: ( )0, 2−
25. Let 0.y = Then,
20 2x x= + −
( )( )0 2 1x x= + −
2, 1.x = −
Let 0.x = Then,
( ) ( )20 0 2
2
y
y
= + −
= −
x-intercepts: ( ) ( )2, 0 , 1, 0−
y-intercept: ( )0, 2−
26. Let 0.y = Then,
( )( )
20 4 3
0 3 1
1, 3.
x x
x x
x
= − +
= − −
=
Let 0.x = Then,
( ) ( )20 4 0 3
3.
y
y
= − +
=
x-intercepts: ( ) ( )1, 0 , 3, 0
y-intercept: ( )0, 3
27. Let 0.y = Then,
( )
3 2
2
2
0 7
0 7
0 0
7 0 7
x x
x x
x x
x x
= +
= +
= → =+ = → = −
Let 0.x = Then,
( ) ( )3 20 7 0
0
y
y
= +
=
x-intercepts: ( ) ( )0, 0 , 7, 0−
y-intercept: ( )0, 0
28. Let 0.=y Then,
( )
3 2
2
2
0 9
0 9
0 0
9 0 9
x x
x x
x x
x x
= −
= −
= → =− = → =
Let 0.=x Then,
( ) ( )3 20 9 0
0
y
y
= −
=
x-intercept: ( ) ( )0, 0 , 9, 0
y-intercept: ( )0, 0
x 0 3 4
y ±2 ±1 0
x
(0, 2)
(0, 2)−
1 2 3
1
−1
(4, 0)
y
Section 1.2 Graphs of Equations 13
© 2017 Cengage Learning. All Rights Reserved. May not be scanned, copied or duplicated, or posted to a publicly accessible website, in whole or in part.
29. Let 0.y = Then,
( )( )
2 40
2
0 2 2
2.
x
x
x x
x
−=−
= − +
= ±
Let 0.x = Then,
( )( )
20 4
0 2
2.
y
y
−=
−
=
x-intercept: Because the equation is undefined
when 2,x = the only x-intercept is ( )2, 0 .−
y-intercept: ( )0, 2
30. Let 0.y = Then,
( )
2 30
2
0 3
3, 0.
x x
x
x x
x
+=
= +
= −
Let 0.x = Then,
( ) ( )
( )
20 3 0
2 0
undefined.
y
y
+=
=
x-intercept: Because the equation is undefined
when 0,x = the only x-intercept is ( )3, 0 .−
y-intercept: Because the equation is undefined when 0,y = there is no -intercept.y
31. Let 0.y = Then,
( ) ( )2 2
2
0 4 0 0
0
0.
x x
x
x
− + =
==
Let 0.x = Then,
( ) ( )2 20 0 4 0
0.
y y
y
− + =
=
x-intercept: ( )0, 0
y-intercept: ( )0, 0
32. Let 0.y = Then,
( ) ( )2 2
2
2 0 8 0 1
1
1.
x x
x
x
+ − =
= −
= ± −
Let 0.x = Then,
( ) ( )2 2
18
2 0 8 0 1
.
y y
y
+ − =
=
-intercept:x Because the equation has no real roots when
0,y = there is no -intercept.x
y-intercept: ( )18
0,
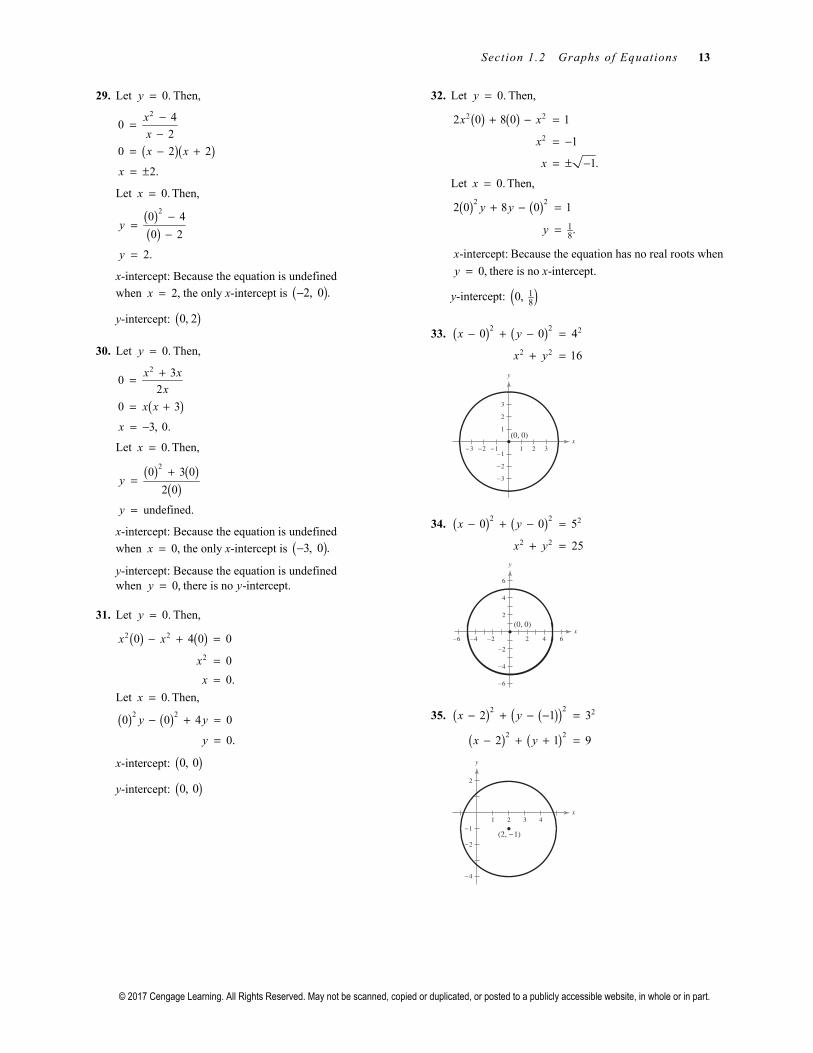
33. ( ) ( )2 2 2
2 2
0 0 4
16
− + − =
+ =
x y
x y
34. ( ) ( )2 2 2
2 2
0 0 5
25
− + − =
+ =
x y
x y
35. ( ) ( )( )( ) ( )
22 2
2 2
2 1 3
2 1 9
− + − − =
− + + =
x y
x y
−1−2−3 1 2 3−1
−2
−3
1
2
3
x(0, 0)
y
x
y
−2−4−6 2 4 6
−2
−4
−6
2
4
6
(0, 0)
1 2 3 4−1
−2
−4
2
x
(2, −1)
y

14 Chapter 1 Functions, Graphs, and Limits
© 2017 Cengage Learning. All Rights Reserved. May not be scanned, copied or duplicated, or posted to a publicly accessible website, in whole or in part.
36. ( )( ) ( )( ) ( )
2 2 2
2 2
4 3 2
4 3 4
− − + − =
+ + − =
x y
x y
37. The radius is the distance between ( )1, 5− and ( )1, 1 .−
( )( ) ( )2 2
2 2
1 1 5 1
0 4
16 4
= − − − + −
= +
= =
r
Using the center ( )1, 1− and the radius 4:=r
( )( ) ( )( ) ( )
2 2 2
2 2
1 1 4
1 1 16
− − + − =
+ + − =
x y
x y
38. The radius is the distance between ( )2, 3− and ( )5, 7 .−
( )( ) ( )
( )
2 2
22
5 2 7 3
7 10
49 100
149
r = − − + − −
= + −
= +
=
Using the center ( )2, 3− and the radius 149:r =
( )( ) ( ) ( )( ) ( )
22 2
2 2
2 3 149
2 3 149
x y
x y
− − + − =
+ + − =
39. The diameter is the distance between ( )6, 8− − and
( )6, 8 .
( )( ) ( )( )2 2
2 2
6 6 8 8
12 16
144 256
400
20
d = − − + − −
= +
= +
==
The radius is one-half the diameter: 20
10.2
= =r
The center is the midpoint of the diameter:
( )6 6 8 8, 0, 0 .
2 2
− + − + =
( ) ( )2 2 2
2 2
0 0 10
100
− + − =
+ =
x y
x y
40. The diameter is the distance between ( )0, 4− and ( )6, 4 .
( ) ( )( )22
2 2
6 0 4 4
6 8
36 64
100
10
d = − + − −
= +
= +
==
The radius is one-half the diameter: 10
5.2
= =r
The center is the midpoint of the diameter:
( )0 6 4 4, 3, 0
2 2
+ + =
( ) ( )( )
2 2 2
2 2
3 0 5
3 25
− + − =
− + =
x y
x y
x
y
(−4, 3)
−1−2−3−4−5−6−7−8 1
1
2
3
4
5
6
7
8
−1−2−3−4−5 1 2 3−1
−2
1
2
3
4
x
(−1, 5)
(−1, 1)
y
y
x−4−8−16 4 12−4
−12
8
12
(−2, 3)
−2−4−6−8 2 4 6 8
−4
−6
−8
2
4
6
8
x(0, 0)
(−6, −8)
(6, 8)
y
x
y
(3, 0)
−3 1 2 3 4 5 6 7 9−1
−4−5−6
12
456

Section 1.2 Graphs of Equations 15
© 2017 Cengage Learning. All Rights Reserved. May not be scanned, copied or duplicated, or posted to a publicly accessible website, in whole or in part.
41. Set the two equations equal to each other.
2 2 1
3 3
1
− + = −− = −
=
x x
x
x
Substitute 1=x into one of the equations.
( )1 2 1= − + =y
The point of intersection is ( )1, 1 .
42. Set the two equations equal to each other.
32
7 8
2 14 3 16
5 30
6
− + = −
− + = −− = −
=
x x
x x
x
x
Substitute 6=x into one of the equations.
( )6 7 1= − + =y
The point of intersection is ( )6, 1 .
43. Set the two equations equal to each other.
( )( )
2
2
2
15 3 11
3 4 0
3 4 0
4 1 0
− + = +
− − + =
+ − =
+ − =
x x
x x
x x
x x
4 0 1 0
4 1
x x
x x
+ = − == − =
Substitute 4:= −x Substitute 1:=x
( )24 15
16 15
1
= − − +
= − += −
y
y
y
( )21 15
1 15
14
y
y
y
= − +
= − +=
The points of intersection are ( )4, 1− − and ( )1, 14 .
44. Set the two equations equal to each other.
( )( )
2
2
5 1
6 0
3 2 0
x x
x x
x x
− = +
− − =
− + =
3 0 2 0
3 2
x x
x x
− = + == = −
Substitute 3:x = Substitute 2:x = −
( )23 5
4
y
y
= −
=
( )22 5
1
y
y
= − −
= −
The points of intersection are ( )3, 4 and ( )2, 1 .− −
45. Set the two equations equal to each other.
( )
3
3
2
2
2 0
2 0
0, 2
x x
x x
x x
x
=
− =
− =
= ±
Substitute 0:x = Substitute 2:x =
( )2 0
0
y
y
=
=
( )2 2
2 2
y
y
=
=
Substitute 2:x = −
( )2 2
2 2
y
y
= −
= −
The points of intersection are ( )0, 0 , ( )2, 2 2 ,− −
and ( )2, 2 2 .
46. Set the two equations equal to each other.
( )
2
0 1
0, 1
x x
x x
x x
x
=
=
= −
=
Substitute 0:x = Substitute 1:x =
0y = 1y =
The points of intersection are (0, 0) and (1, 1).
47. Set the two equations equal to each other.
( )( )
4 2 2
4 2
2
2 1 1
0
1 1 0
0, 1
x x x
x x
x x x
x
− + = −
− =
+ − =
= ±
Substitute 0:x = Substitute 1:x =
( )21 0
1
y
y
= −
=
( )21 1
0
y
y
= −
=
Substitute 1:x = −
( )21 1
1 1
0
y
y
y
= − −
= −=
The points of intersection are ( )1, 0 ,− ( )0, 1 , and ( )1, 0 .

16 Chapter 1 Functions, Graphs, and Limits
© 2017 Cengage Learning. All Rights Reserved. May not be scanned, copied or duplicated, or posted to a publicly accessible website, in whole or in part.
48. Set the two equations equal to each other.
( )( )
3 2 2
3 2
2 1 3 1
2 0
1 2 0
0, 1, 2
x x x x x
x x x
x x x
x
− + − = − + −
− − =
+ − =
= −
Substitute 0:x = Substitute 1:x = −
( ) ( )20 3 0 1
0 0 1
1
y
y
y
= − + −
= + −= −
( ) ( )21 3 1 1
1 3 1
5
y
y
y
= − − + − −
= − − −= −
Substitute 2:x =
( ) ( )22 3 2 1
4 6 1
1
y
y
y
= − + −
= − + −=
The points of intersection are ( )0, 1 ,− ( )1, 5 ,− −
and ( )2, 1 .
49. To find the break-even point, set .R C=
1.55 0.85 35,000
0.7 35,000
35,00050,000 units
0.7
= +=
= =
x x
x
x
50. To find the break-even point, set .R C=
35 6 500,000
29 500,000
500,00017,242 units
29
= +=
= ≈
x x
x
x
51. To find the break-even point, set .=R C
9950 8650 250,000
1300 250,000
250,000193 units
1300
= +=
= ≈
x x
x
x
52. To find the break-even point, set .=R C
4.9 2.5 10,000
2.4 10,000
10,0004167 units
2.4
= +=
= ≈
x x
x
x
53. To find the break-even point, set .R C=
10 6 5000
4 5000
50001250 units
4
= +=
= ≈
x x
x
x
54. To find the break-even point, set .R C=
200 130 12,600
70 12,600
12,600180 units
70
= +=
= ≈
x x
x
x
55. (a) 11.5 21,000
19.90
C x
R x
= +=
(b)
11.5 21,000 19.90
21,000 8.4
2500 units
C R
x x
x
x
=+ =
==
(c)
( )1000 19.9 11.5 21,000
22,000 8.4
2619 units
P R C
x x
x
x
= −
= − +
=≈
So, 2619 units would yield a profit of $1000.
56. (a) The cost gC to drive x miles is the cost of the car
itself plus the cost of gasoline per mile, which is the cost of gasoline per gallon divided by the number of gallons per mile.
2.759
33,50031
gC x= +
Similarly, the cost hC to drive x miles is the cost of
the car itself plus the cost of gasoline per mile.
2.759
36,77539
hC x= +
(b) To find the break-even point, set the cost equations equal to each other.
2.759 2.759
33,500 36,77531 39
xx+ = +
Multiply both sides of the equation by ( )( )31 39 .
40,501,000 107.601 44,460,975 85.529
22.072 3,959,975
3,959,975179,412 mi
22.072
x x
x
x
+ = +=
= ≈
57. 205 4 135 3
70 7
10
x x
x
x
− = +==
Equilibrium point ( ) ( ), 10, 165x p =
58. 190 15 75 8
115 23
5
x x
x
x
− = +==
Equilibrium point ( ) ( ), 5, 115x p =

Section 1.2 Graphs of Equations 17
© 2017 Cengage Learning. All Rights Reserved. May not be scanned, copied or duplicated, or posted to a publicly accessible website, in whole or in part.
59. (a)
The model fits the data well.
(b) Let ( )18 2018 .t =
( ) ( ) ( )3 20.00333 18 0.0250 18 0.252 18 1.85 $14.0 billiony = − + − ≈
60. (a) If 10,000 units are sold, the company breaks even.
(b) If less than 10,000 units are sold, the company loses money.
(c) If more than 10,000 units are sold, the company makes a profit.
61. (a)
(b) Answers will vary.
(c) Let ( )20 2020 .t =
( ) ( )27.79 20 86.6 20 941
2325 degrees
y = − +
=
The prediction is valid because the number of associate’s degrees should keep increasing over time.
62. (a) and (b)
(c) For 2019, let 19.t =
( ) ( ) ( )3 219.000 19 617.71 19 6696.7 19 21,873 12,692y = − + − ≈
The prediction seems high. Answers will vary.
Year 2009 2010 2011 2012 2013
Revenue 0.82 1.52 2.31 3.35 4.52
Model 0.82 1.50 2.33 3.33 4.52
Year 2009 2010 2011 2012 2013
Transplants (model) 2213.79 2323.0 2336.79 2369.16 2534.11
Transplants (actual) 2211 2332 2322 2378 2531
Year 2008 2009 2010 2011 2012 2016
Degrees 747 793 854 931 1024 1550
t
y
9 10 11 12
Year (9 ↔ 2009)
Rev
enue
(in
billi
ons
of d
olla
rs)
13
1
2
3
4
5

18 Chapter 1 Functions, Graphs, and Limits
© 2017 Cengage Learning. All Rights Reserved. May not be scanned, copied or duplicated, or posted to a publicly accessible website, in whole or in part.
63.
The greater the value of ,c the steeper the line.
64. If C and R represent the cost and revenue for a business, the break-even point is that value of x for which
.C R= For example, if 100,000 10C x= + and
20 ,R x= then the break-even point is 10,000x =units.
65.
Intercepts: ( ) ( )2.75, 0 , 0,1.815−
66.
Intercepts: ( )0, 6.25 , ( )1.0539, 0 , ( )10.5896, 0−
67.
Intercepts: ( )1.4780, 0 , ( )12.8553, 0 , ( )0, 2.3875
68.
Intercepts: ( )3.3256, 0 , ( )1.3917, 0 ,− ( )0, 2.3664
69.
Intercept: ( ) ( )512
0, 0, 0.4167≈
70.
Intercepts: ( ) ( )0, 1 , 13.25, 0−
71. Answers will vary.
Section 1.3 Lines in the Plane and Slope
Skills Warm Up
1. ( )5 2 7
13 4 7
− −= = −
− − −
2. ( )4 10 6
37 5 2
− − −= =
−
3. 1
, 3
1 1
3 3
mm
− = −
− =−
4.
67
1 6,
71 7
6
mm
− =
− = −
5. 4 7
4 7
x y
y x
− + == +
6. 3 7
7 3
3 7
x y
y x
y x
− =− = −
= −
−4.7 4.7
3.1
−3.1
−12
−2
10
6
−24 12
−4
20
−10
30−15
20
−4
−2
5
4
−6
−4
6
4
−5
−1.5
15
0.5
Section 1.3 Lines in the Plane and Slope 19
© 2017 Cengage Learning. All Rights Reserved. May not be scanned, copied or duplicated, or posted to a publicly accessible website, in whole or in part.
1. The slope is 1m = because the line rises one unit vertically for each unit the line moves to the right.
2. The slope is 2 because the line rises two units vertically for each unit the line moves to the right.
3. The slope is 0m = because the line is horizontal.
4. The slope is 1− because the line falls one unit vertically for each unit the line moves to the right.
5. 7y x= +
So, the slope is 1,m = and the y-intercept is ( )0, 7 .
6. 4 3y x= +
So, the slope is 4,m = and the y-intercept is ( )0, 3 .
7. 5 20
5 20
x y
y x
+ == − +
So, the slope is 5,m = − and the y-intercept is ( )0, 20 .
8. 2 40
2 40
x y
y x
+ == − +
So, the slope is 2,m = − and the y-intercept is ( )0, 40 .
9. 76
7 6 30
5
x y
y x
+ =
= − +
So, the slope is 76,m = − and the y-intercept is ( )0, 5 .
10.
83
8 3 12
3 8 12
4
x y
y x
y x
+ == − +
= − +
So, the slope is 83,m = − and the y-intercept is ( )0, 4 .
11. 3 15
3 15
x y
y x
− == −
So, the slope is 3,m = and the y-intercept is ( )0, 15 .−
12.
23
2 3 24
8
x y
y x
− =
= −
So, the slope is 23,m = and the y-intercept is ( )0, 8 .−
13. 4x = Because the line is vertical, the slope is undefined. There
is no y-intercept.
14. 5 0
5
x
x
+ == −
Because the line is vertical, the slope is undefined. There is no y-intercept.
15. 9 0
9
y
y
− ==
So, the slope is 0,m = and the y-intercept is ( )0, 9 .
Skills Warm Up —continued—
7. ( )( )
2 3 4
3 4 2
3 12 2
3 10
y x
y x
y x
y x
− = −
= − +
= − += −
8. ( ) ( )5 1 2
5 2
7
y x
y x
y x
− − = − − − + = − −
= − −
9. ( ) ( )( )
( )
( )
4 23 12
11 36
3 1283
3 1243
3 943
124
y x
y x
y x
y x
y x
− −− − = −
−
+ = −
+ = −
+ = −
= −
10.
( ) ( )
( )
( )
3 11 1
7 1
41 1
62
1 132 2
13 32 5
3 3
y x
y x
y x
y x
y x
− −− = − − − − −
−− = +−
− = +
− = +
= +

20 Chapter 1 Functions, Graphs, and Limits
© 2017 Cengage Learning. All Rights Reserved. May not be scanned, copied or duplicated, or posted to a publicly accessible website, in whole or in part.
16. 1 0
1
y
y
+ == −
So, the slope is 0,m = and the y-intercept is ( )0, 1 .−
17. 2y = −
18. 4y = −
19. 2 1y x= − +
20. 3 2= −y x
21.
32
3 2 4
2 3 4
2
x y
y x
y x
+ == − +
= − +
22.
45
4 5 20
5 4 20
4
x y
y x
y x
+ == − +
= − +
23. 2 3 0
2 3
2 3
x y
y x
y x
− − =− = − +
= −
x −2 −1 0 1
y −2 −2 −2 −2
x −4 −2 0 2
y −4 −4 −4 −4
x −1 0 1 2
y 3 1 −1 −3
x −1 0 1 2
y −5 −2 1 4
x −4 −2 0 2 4
y 8 5 2 −1 −4
x 0 2 4 5
y 4 125
45
0
x −1 0 1 2
y −5 −3 −1 1
−3
−1
1
2−1 1−2x
y
−2−4 2 4
−2
−6
2
y
x
3
2
1
−1
21−1−2x
y
−1−2−3 1 2 3
−1
−2
1
2
3
x
y
x
y
−1−2−3 1 3 4−1
−2
−3
1
2
4
x1 2 3 4 5
5
4
3
2
1
y
−2
−1
1
−3
21−1−2 3x
y
Section 1.3 Lines in the Plane and Slope 21
© 2017 Cengage Learning. All Rights Reserved. May not be scanned, copied or duplicated, or posted to a publicly accessible website, in whole or in part.
24.
12
2 10 0
2 10
5
x y
y x
y x
+ + == − +
= − +
25.
35
3 5 30 0
5 3 30
6
x y
y x
y x
+ + == − −
= − −
26.
52
5 2 20 0
2 5 20
10
x y
y x
y x
− + − == +
= +
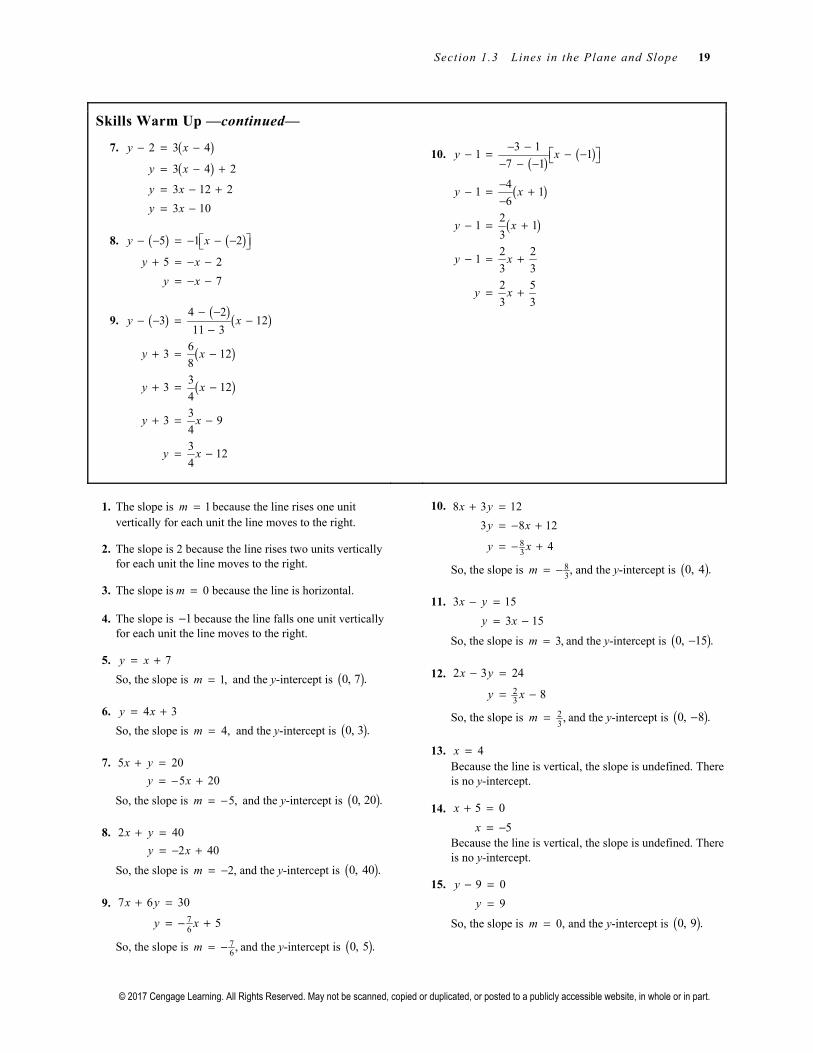
27.
The slope is ( )0 2 2 1
.8 0 8 4
m− −
= = =−
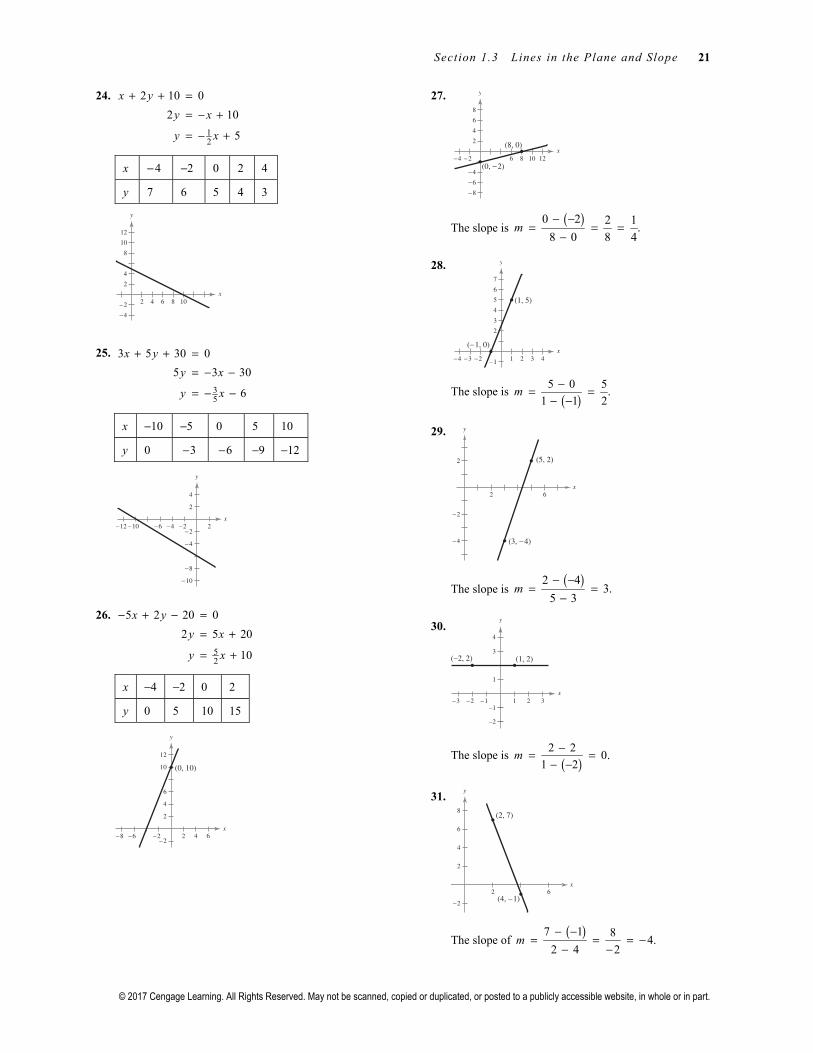
28.
The slope is ( )5 0 5
.1 1 2
m−= =
− −
29.
The slope is ( )2 4
3.5 3
m− −
= =−
30.
The slope is ( )2 2
0.1 2
m−= =
− −
31.
The slope of ( )7 1 8
4.2 4 2
− −= = = −
− −m
x −4 −2 0 2 4
y 7 6 5 4 3
x −10 −5 0 5 10
y 0 3− 6− −9 −12
x −4 −2 0 2
y 0 5 10 15
y
x2 4 6 8 10−2
−4
2
4
8
10
12
x
y
−2−4−6−10−12 2−2
−4
−8
−10
2
4
x
y
(0, 10)
−2−6−8 2 4 6−2
2
4
6
10
12
y
x−2−4 6 8 10 12
−4
−6
−8
2
4
6
8
(0, −2)
(8, 0)
y
x(−1, 0)
(1, 5)
−2−3−4 1 2 3 4−1
2
3
4
5
6
7
62
2
−4
−2
x
(3, −4)
y
(5, 2)
x
(−2, 2) (1, 2)
−3 −2 −1 321
4
3
1
−1
−2
y
2 6
−2
2
4
6
8
x
y
(4, −1)
(2, 7)

22 Chapter 1 Functions, Graphs, and Limits
© 2017 Cengage Learning. All Rights Reserved. May not be scanned, copied or duplicated, or posted to a publicly accessible website, in whole or in part.
32.
The slope is ( )10 2 8
,11 11 03 3
m− − − −= =
−
which is undefined.
So, the line is vertical.
33.
The slope is undefined because ( )( )
5 3
8 8m
− − −=
− − −and
division by zero is undefined. So, the line is vertical.
34.
The slope is ( )
( )1 5 4
1.2 2 4
m− − −
= = =− −
35.
The slope is ( )
6 6 00.
1 2 3m
−= = =− −
So, the line is horizontal.
36.
The slope is ( )3 13 10
2.2 3 5
m− − −
= = = −− − −
37.
The slope is ( )
3 518 4 8
1 2 3 24.
5m
− −= = = −
− − −
38.
The slope is ( ) ( )
4 5 27.
5 6 3 2 7m
+= =+
39.
The slope is( )5 5 10
2 6 352 1
3 4 12
10 128.
3 5m
− −= = = ⋅ =
−
40.
The slope is ( ) ( )( ) ( )
1 4 3 4 8.
5 4 7 8 3m
− −= = −
−
x3 4 521
2
−2
−4
−6
−8
−10
−12
y
( )113 , −2
( )113 , −10
x
y
−2−4−6 2
−2
−4
−6
−8
2
(−8, −3)
(−8, −5)
x
(−2, −5)
(2, −1)
−3 −2 −1 321
−5
−6
−3
−4
−1
−2
y
y
x
(−2, 6) (1, 6)
−2−4−6 2 4 6−2
2
4
8
10
y
x
(−2, −3)
(3, −13)
−4−6−8 2 4 6 8
−8
−10
−12
−14
2
−1 1−2 2 3 4
−2
4
−3
−4
−3−4
y
x
14
, −2( )
38
, 1( )−
x−6 −4 −2 2 4 6
6
4
2
y
( ) , 456
( ) , −532
−
−1 1−2 2 3 4
−2
3
2
1
4
−3
−4
−3−4
y
x
14
56
,( )−
23
52
,( )
x− 11 3
2
1
−1
−2
y
54
14
,( )−
78
34
,( )

Section 1.3 Lines in the Plane and Slope 23
© 2017 Cengage Learning. All Rights Reserved. May not be scanned, copied or duplicated, or posted to a publicly accessible website, in whole or in part.
41. The equation of this horizontal line is 1.y = So, three
additional points are ( ) ( )0, 1 , 1, 1 , and ( )3, 1 .
42. The equation of this horizontal line is 3.y = − So, three
additional points are ( ) ( )0, 3 , 1, 3 ,− − and ( )2, 3 .−
43. The equation of the line is
( )7 3 1
3 10.
y x
y x
− = − −
= − +
So, three additional points are ( ) ( )0, 10 , 2, 4 , and ( )3, 1 .
44. The equation of this line is
( )2 2 7
2 16.
y x
y x
+ = −
= −
So, three additional points are ( ) ( )0, 16 , 1, 14 ,− − and
( )2, 12 .−
45. The equation of this line is
( )24 6
32
8.3
y x
y x
+ = −
= −
So, three additional points are ( ) ( )3, 6 , 9, 2 ,− − and
( )12, 0 .
46. The equation of this line is
( )12
1312 2
6 1
.
y x
y x
+ = − +
= − −
So, three additional points are ( ) ( )1, 7 , 3, 8 ,− − and
( )5, 9 .−
47. The equation of this vertical line is 8.x = − So, three
additional points are ( ) ( )8, 0 , 8, 2 ,− − and ( )8, 3 .−
48. The equation of this vertical line is 3.x = − So, three
additional points are ( ) ( )3, 0 , 3, 1 ,− − and ( )3, 2 .−
49. The slope of the line joining ( )2, 1− and ( )1, 0− is
( )
1 0 11.
2 1 1
− = = −− − − −
The slope of the line joining ( )1, 0− and ( )2, 2− is
( )0 2 2 2
.1 2 3 3
− −= = −
− − −
Because the slopes are different, the points are not collinear.
50. The slope of the line joining ( )5, 11− and ( )0, 4 is
11 4 7 7.
5 0 5 5
− = = −− − −
The slope of the line joining ( )0, 4 and ( )7, 6− is
( )4 6 10.
0 7 7
− −= −
−
Because the slopes are different, the points are not collinear.
51. The slope of the line joining ( )2, 7 and ( )2, 1− − is
1 72.
2 2
− − =− −
The slope of the line joining ( )0, 3 and ( )2, 1− − is
1 32.
2 0
− − =− −
Because the slopes are equal and both lines pass through
( )2, 1 ,− − the three points are collinear.
52. The slope of the line joining ( )4, 1 and ( )2, 2− − is
2 1 1.
2 4 2
− − =− −
The slope of the line joining ( )8, 3 and ( )2, 2− − is
2 3 1.
2 8 2
− − =− −
Because the slopes are equal and both lines pass through
( )2, 2 ,− − the three points are collinear.
53. Using the slope-intercept form, we have 34
3.y x= +
54. Using the slope-intercept form, we have
23
0
2 3 0.
y x
x y
= +
− =
−1−2−3−4−6 1 2−1
−2
1
2
3
4
5
6
x
y
(0, 3)
x
y
(0, 0)
−2 1 2 3 4−1
−2
1
2
3
4

24 Chapter 1 Functions, Graphs, and Limits
© 2017 Cengage Learning. All Rights Reserved. May not be scanned, copied or duplicated, or posted to a publicly accessible website, in whole or in part.
55. Because the slope is 0, the line is horizontal and its equation is 7.y =
56. Because the slope is 0, the line is horizontal and its equation is 4.y =
57. Using the point-slope form, you have
( ) ( )( )( )
2 4 1
2 4 1
2 4 4
4 6
4 6 0.
y x
y x
y x
y x
x y
− − = − − −
+ = − +
+ = − −= − −
+ + =
58. Using the point-slope form, you have
( )4 2 1
2 6
2 6 0.
y x
y x
x y
+ = − +
= − −+ + =
59. Using the point-slope form, you have
( )814 3
1 24 3
0
3 12 8 0.
y x
y x
x y
− = −
= −
− − =
60. Using the point-slope form, you have
( )316 2
1 16 4
0
2 12 3 0.
y x
y x
x y
− = − −
= − +
+ − =
61. The slope of the line is
( )3 52.
4 0m
− −= =
−
Using the point-slope form, you have
( )5 2 0
2 5
0 2 5.
y x
y x
x y
+ = −
= −= − −
62. The slope of the line is ( )( )
5 4 93.
1 2 3m
− −= = =
− −
Using the point-slope form, you have
( )5 3 1
5 3 3
0 3 2.
y x
y x
x y
− = −
− = −= − +
−2−4−6 2 4 6
2
4
6
8
x
y
(−2, 7)
x
y
(−2, 4)
−1−2−3−4−5−6 1 2−1
−2
1
2
3
5
6
x
y
−2−4−6 2 4 6
−4
2
−6
−8
−10
(−1, −2)
x
y
−4−6−8 2 4 6 8
−6
−8
2
4
6
8
x
y
−1 2 3
, 0
4 5
−2
−3
1
2
3
( )83
y
x−2−3−4 1 2 3−1
−2
−3
−4
1
2
3
4
( ) , 032
−4
−2
−2
2
4 6x
y
(0, −5)
(4, 3)
y
x
(1, 5)
(−2, −4)
−2−4−6 2 4 6
−6
2
4
6

Section 1.3 Lines in the Plane and Slope 25
© 2017 Cengage Learning. All Rights Reserved. May not be scanned, copied or duplicated, or posted to a publicly accessible website, in whole or in part.
63. The slope of the line is 2 3
2 2m
− −= =−
undefined.
So, the line is vertical, and its equation is
2
2 0.
x
x
=− =
64. The slope of the line is 1 1
0.10 6
m−= =−
So, the line is
horizontal, and its equation is
1
1 0.
y
y
=− =
65. The slope of the line is ( )1 1
0.2 3
m− − −
= =− −
So, the line
is horizontal, and its equation is
1
1 0.
y
y
= −+ =
66. The slope of the line is 10 5
2 2m
− −= =−
undefined.
So, the line is vertical, and its equation is
2
2 0.
x
x
=− =
67. The slope of the line is 8 4
4.1 2 1 2
m−= =+
Using the point-slope form, you have
1
8 42
4 6
0 4 6.
y x
y x
x y
− = −
= += − +
68. The slope is ( ) 11 124 4
5 1 48.m
−= = =− −
Using the point-slope form, you have
1
1 84
1 8 2
8 3
8 3 0.
y x
y x
y x
x y
− = − −
− = += +
− + =
69. The slope of the line is ( )
1 5 6 1.
1 3 2 3 2m
−= =− +
Using the point-slope form, you have
1 1
12 3
1 7
2 63 6 7 0.
y x
y x
x y
− = +
= +
− + =
5431−1
4
3
2
1
−2
−3
−1
x
y
(2, 3)
(2, −2)
x
(6, 1) (10, 1)
6
4
2
−2
−4
2 4 6 8 10
y
−1 1−2 2 3 4
−2
3
2
1
4
−3
−4
−3−4
y
x
(−2, −1) (3, −1)
x−3 −2 −1 31
4
3
2
1
−1
−2
y
x−3 −2 −1 31
4
3
2
1
−1
−2
y
y
x
(− , 1)−1−2−3−4 1 2 3 4
3
4
5
6
7
14
( , 5)14
−1 1 2−2
−2
−1
2
y
x
23
56
,( )−
13
, 1( )−

26 Chapter 1 Functions, Graphs, and Limits
© 2017 Cengage Learning. All Rights Reserved. May not be scanned, copied or duplicated, or posted to a publicly accessible website, in whole or in part.
70. The slope of the line is ( ) ( )( ) ( )
1 4 3 4 8.
5 4 7 8 3m
− −= = −
−
Using the point-slope form, you have
3 8 7
4 3 8
3 8 7
4 3 312 9 32 28
32 12 37 0.
y x
y x
y x
x y
− = − −
− = − +
− = − ++ − =
71. Because the line is vertical, it has an undefined slope, and its equation is
3
3 0.
x
x
=− =
72. Because the line is horizontal, it has a slope of 0,m =and its equation is
( )0 5
5.
y x
y
= + −
= −
73. Because the line is parallel to all horizontal lines, it has a slope of 0,m = and its equation is
10.y = −
74. Because the line is parallel to all vertical lines, it has an undefined slope, and its equation is
5.x = −
75. Given line: 7, 1y x m= − + = −
(a) Parallel: 1 1m = −
( )2 1 3
1 0
y x
x y
− = − +
+ + =
(b) Perpendicular: 2 1m =
( )2 1 3
5 0
y x
x y
− = +
− + =
76. Given line: 32
2 , 2y x m= − =
(a) Parallel: 1 2m =
( )1 2 2
0 2 3
y x
x y
− = −
= − −
(b) Perpendicular: 212
m = −
( )12
1 2
2 2 2
2 4 0
y x
y x
x y
− = − −
− = − ++ − =
77. Given line: 3 7 34 4 4
,y x m= − + = −
(a) Parallel: 134
m = −
( )7 3 32 18 4 3 4 2
8 7 6 4
6 8 3 0
y x x
y x
x y
− = − + = − −
− = − −+ − =
(b) Perpendicular: 243
m =
( )7 84 2 48 3 3 3 9
72 63 96 64
96 72 127 0
y x x
y x
x y
− = + = +
− = +− + =
x− 11 3
2
1
−1
−2
y
54
14
,( )−
78
34
,( )
9
−2
−9
10
(−3, 2)
x + y = 7
−2
−2
7
4
(2, 1)
4 2 = 3x y−
−6
−4
6
4
23
78
,( )−3x + 4y = 7

Section 1.3 Lines in the Plane and Slope 27
© 2017 Cengage Learning. All Rights Reserved. May not be scanned, copied or duplicated, or posted to a publicly accessible website, in whole or in part.
78. Given line: 5 53 3
,y x m= − = −
(a) Parallel: 153
m = −
( )3 5 74 3 8
3 5 354 3 24
24 18 40 35
40 24 53 0
y x
y x
y x
x y
− = − −
− = − +
− = − ++ − =
(b) Perpendicular: 235
m =
( )3 3 74 5 8
3 3 214 5 40
40 30 24 21
0 24 40 9
y x
y x
y x
x y
− = −
− = −
− = −= − +
79. Given line: 3y = − is horizontal, 0m =
(a) Parallel: 1 0m =
( )0 0 1
0
y x
y
− = +
=
(b) Perpendicular: 2m is undefined
1x = −
80. Given line: 4 0y + = is horizontal, 0m =
(a) Parallel: ( )1 0, 5 0 2 , 5m y x y= − = − =
(b) Perpendicular: 2m is undefined, 2x =
81. Given line: 2 0x − = is vertical, m is undefined
(a) Parallel: 1m is undefined, 1x =
(b) Perpendicular: ( )2 0, 1 0 1 , 1m y x y= − = − =
82. Given line: 5 0x − = is vertical, m is undefined.
(a) Parallel: 1m is undefined, 12.x =
(b) Perpendicular:
( )2 0, 3 0 12 , 3m y x y= + = − = −
83. (a) The average salary increased the most from 2008 to 2009 and increased the least from 2010 to 2011.
(b) ( )2008: 8, 92,920 and ( )2013: 13, 100,600
100,600 92,920 7680
$1536 yr13 8 5
m−= = =−
(c) The average salary increased $1536 per year over the 5 years between 2008 and 2013.
84. (a) The revenue increased the greatest from 2010 to 2011 and increased the least from 2011 to 2012.
(b) ( )2009: 9, 123.0 and ( )2013: 13, 128.8
128.8 123.0 5.8
$1.45 billion yr13 9 4
m−= = =−
(c) From 2009 to 2013, the revenue for AT&T increased $1.45 billion per year.
85. 6
100 20012
x
x
=
=
Since the grade of the road is 6
,100
if you drive 200 feet,
the vertical rise in the road will be 12 feet.
−4
−3
5
5 + 3 = 0x y
3
78
34
,( )
−4
−4
2(−1, 0)
y + 3 = 0
1
8
−6
−10
6
(2, 5)
6
−2
−3
4
(1, 1)x − 2 = 0
−8
−12
6
16
(12, −3)

28 Chapter 1 Functions, Graphs, and Limits
© 2017 Cengage Learning. All Rights Reserved. May not be scanned, copied or duplicated, or posted to a publicly accessible website, in whole or in part.
86. (a) ( ) ( )0, 32 , 100, 212
( )212 3232 0
100 09
1.8 32 325
F C
F C C
−− = −−
= + = +
or
( )532
9C F= −
(b) Use ( )532 .
9C F= − If 102.2 F,F = ° then
( )5102.2 32 39 C.
9C = − = °
(c) Use ( )532 .
9C F= − If 76 F,F = ° then
( )576 32 24.4 C.
9C = − = °
87. (a) ( )2009: 9, 5655 and ( )2013: 13, 5743
5743 5655 88
2213 9 4
m−= = =−
( )( )
1 1
5655 22 9
5655 22 198
22 5457
y y m t t
y t
y t
y t
− = −
− = −
− = −= +
The slope is 22.0 and indicates that the population increases 22 thousand per year from 2009 to 2013.
(b) Let 11.t =
( )22 11 5457
5699
y
y
= +
=
The population was 5699 thousand or 5,699,000 in 2011.
(c) The actual population in 2011 was 5,709,000.
The model’s estimate was very close to the actual population.
(d) The model could possibly be used to predict the population in 2018 if the population continues to grow at the same linear rate.
88. (a) ( )2008: 8, 12,430 and ( )2013: 13, 14,167
14,167 12,430 1737
347.413 8 5
m−= = =−
( )( )
1 1
12,430 347.4 8
12,430 347.4 2779.2
347.4 9650.8
y y m t t
y t
y t
y t
− = −
− = −
− = −= +
The slope is 347.4 and indicates that the personal income increases $347.3 billion per year from 2008 to 2013.
(b) Let 11.t =
( )347.4 11 9650.8
13,472.2
y
y
= +
=
The personal income was $13,472.2 billion in 2011.
Let 14.t =
( )347.4 14 9650.8
14,514.4
y
y
= +
=
The personal income was $14,514.4 billion in 2014.
(c) The actual personal income was $13,202.0 billion in 2011 and $14,728.6 billion in 2014.
The model’s estimates were very close to the actual personal incomes in 2011 and 2014.
89. (a) The equipment depreciates 10255
$205= per year,
so the value is 1025 205 ,y t= − where 0 5.t≤ ≤
(b)
(c) When 3,t = the value is $410.00.
(d) The value is $600 when 2.07t = years.
00
6
1200

Chapter 1 Quiz Yourself 29
© 2017 Cengage Learning. All Rights Reserved. May not be scanned, copied or duplicated, or posted to a publicly accessible website, in whole or in part.
90. (a) The slope is
77,000 500,000 423,000
47,000.9 9
− −= = −
The equipment depreciates $47,000 per year, so the value is 500,000 47,000 ,y t= − where
0 9.t≤ ≤
(b)
(c) When 5,t = the value is
( )500,000 47,000 5 $265,000.y = − =
(d) The value is $160,000 when
160,000 500,000 47,000
47,000 340,000
7.2 years.
t
t
t
= −=≈
91. (a) Current wage: 0.07 2000cW s= +
New offer wage: 0.05 2300NW s= +
(b)
The lines intersect at ( )15,000, 3050 . If you sell
$15,000, then both jobs would yield wages of $3050.
(c) No. Your current job would yield wages of $3400 as compared to the new job, which would yield wages of $3300 if your sales are $20,000.
92. (a) Matches (ii); 10 100.y x= − +
(b) Matches (iii); 1.50 12.50.y x= +
(c) Matches (i); 0.51 30.y x= +
(d) Matches (iv); 100 600.y x= − +
Chapter 1 Quiz Yourself
1. (a)
(b) ( ) ( )( )223 3 1 2
36 9
3 5
d = − − + − −
= +
=
(c) 3 3 1 2 1
Midpoint , 0,2 2 2
− + − = = −
2. (a)
(b) 22
1 1 32
2 4 2
1 49
16 4
197
16
1197
4
d = − + − −
= +
=
=
(c) 31 1
2 4 22 3 1
Midpoint , ,2 2 8 4
+ − = =
00
500,000
9
0 30,0000
5,000
x
y
3
2
1
−1
−2
−3
−1−2−3 321
(−3, 1)
(3, −2)
, − 12( (0
x
y
2
1
−1
−2
−1−2 21
, 2 12( (
, − 14
32( (
,38
14( (

30 Chapter 1 Functions, Graphs, and Limits
© 2017 Cengage Learning. All Rights Reserved. May not be scanned, copied or duplicated, or posted to a publicly accessible website, in whole or in part.
3. (a)
(b) ( )( ) ( )
( )
2 2
22
6 12 2 4
18 6
324 36
360
6 10
18.97
d = − − + − −
= + −
= +
=
=≈
(c) Midpoint ( ) ( )4 212 6
, 3, 12 2
+ − − += = −
4.
( ) ( )
( )( ) ( )( )( ) ( )
2 2
2 2
2 2
2 4 1 0 5
2 1 1 5 3 5
1 4 5 0 5 2
a
b
c
= − + − =
= − − + − − =
= − − + − − =
( ) ( ) ( )2 2 22 2 25 3 5 5 2a b c+ = + = =
5. ( )2011, 9810 and ( )2013, 9992
Midpoint
( )
2011 2013 9810 9992,
2 2
2012, 9901
+ + =
=
The population in 2012 was approximately 9901 thousand or 9,901,000.
6. 5 2y x= +
7. 2 6y x x= + −
8. 3y x= −
9. ( ) ( )2 2 2
2 2
0 0 9
81
x y
x y
− + − =
+ =
10. ( )( ) ( )( )
2 2 2
2 2
1 0 6
1 36
x y
x y
− − + − =
+ + =
x 25
− 0 15
1
y 0 2 3 7
x −3 −2 −1 −0.5 0 1 2
y 0 −4 −6 −6.25 −6 −4 0
x 0 1 2 3 4 5 6
y 3 2 1 0 1 2 3
−4−8−12 4 8
−2
−4
2
4
6
x
y
(−12, 4)
(6, −2)
x
y
−1−2 1 2 3 4−1
−2
−3
1
(−1, −5)
(4, 0)
(2, 1)d1
d3
d2
x
y
(0, 2)
−1−2−3−4 1 2 3 4
1
2
3
4
5
6
7
, 0 25( (−
x
y
−1−2−4 1 3−1
−2
−3
−4
−5
−7
x
y
−1 1 2 3 4 5 6
1
2
3
4
5
6
−2−4−6 2 4 6 8 10
−4
−6
−8
−10
2
4
6
8
10
x
y
(0, 0)
−2−4−8 2 4 6−2
−4
2
4
8
x
y
(−1, 0)