Embed Size (px)
Citation preview

Copyright © Houghton Mifflin Company. All rights reserved.
C H A P T E R 1 Functions, Graphs, and Limits
Section 1.1 The Cartesian Plane and the Distance Formula ..................................14
Section 1.2 Graphs of Equations .............................................................................18
Section 1.3 Lines in the Plane and Slope ................................................................24
Mid-Chapter Quiz Solutions ......................................................................................30
Section 1.4 Functions...............................................................................................33
Section 1.5 Limits ....................................................................................................38
Section 1.6 Continuity .............................................................................................42
Review Exercises ..........................................................................................................45
Chapter Test Solutions ................................................................................................51
Practice Test ...............................................................................................................54
14 Copyright © Houghton Mifflin Company. All rights reserved.
C H A P T E R 1 Functions, Graphs, and Limits
Section 1.1 The Cartesian Plane and the Distance Formula
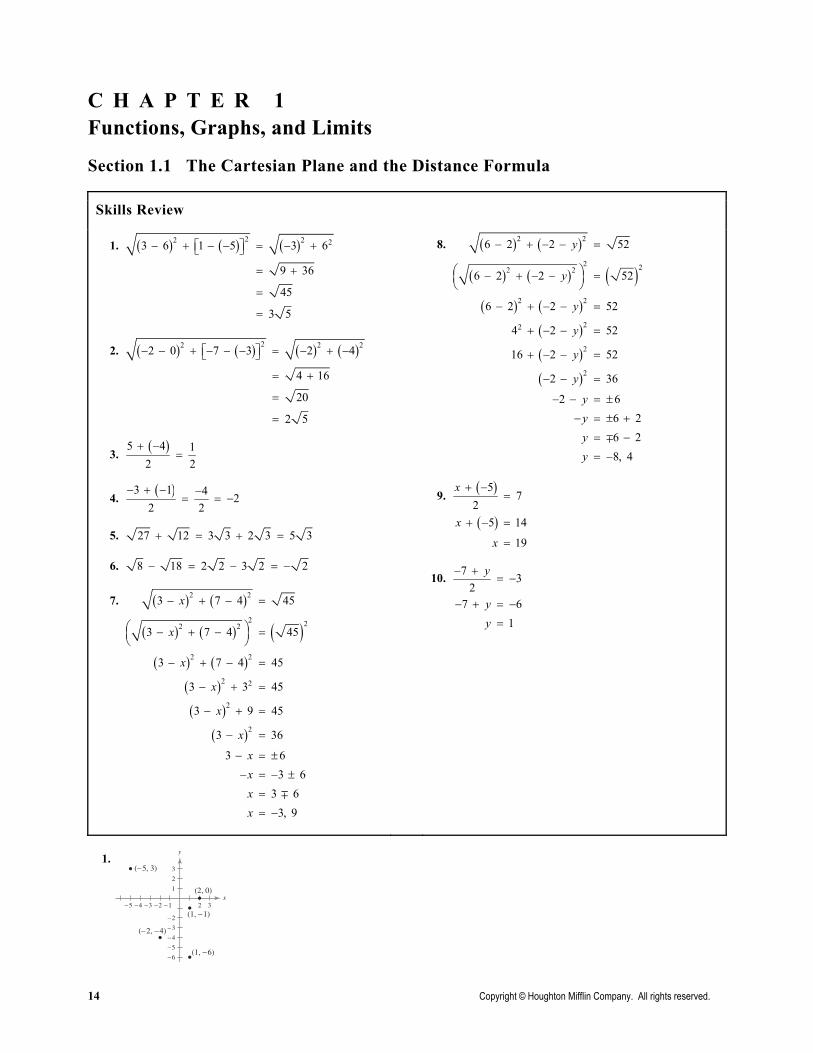
1.
Skills Review
1. ( ) ( ) ( )22 2 23 6 1 5 3 6
9 36
45
3 5
− + ⎡ − − ⎤ = − +⎣ ⎦
= +
=
=
2. ( ) ( ) ( ) ( )22 2 22 0 7 3 2 4
4 16
20
2 5
− − + ⎡− − − ⎤ = − + −⎣ ⎦
= +
=
=
3. ( )5 4 12 2
+ −=
4. ( )3 1 4 22 2
− + − −= = −
5. 27 12 3 3 2 3 5 3+ = + =
6. 8 18 2 2 3 2 2− = − = −
7.
( ) ( )
( ) ( ) ( )( ) ( )
( )
( )
( )
2 2
2 22 2
2 2
2 2
2
2
3 7 4 45
3 7 4 45
3 7 4 45
3 3 45
3 9 45
3 36
3 63 6
3 63, 9
x
x
x
x
x
x
xxxx
− + − =
⎛ ⎞− + − =⎜ ⎟⎝ ⎠
− + − =
− + =
− + =
− =
− = ±
− = − ±
=
= −
∓
8.
( ) ( )
( ) ( ) ( )( ) ( )
( )
( )
( )
2 2
2 22 2
2 2
22
2
2
6 2 2 52
6 2 2 52
6 2 2 52
4 2 52
16 2 52
2 36
2 66 26 28, 4
y
y
y
y
y
y
yyyy
− + − − =
⎛ ⎞− + − − =⎜ ⎟⎝ ⎠
− + − − =
+ − − =
+ − − =
− − =
− − = ±
− = ± +
= −
= −
∓
9. ( )
( )
57
25 14
19
x
x
x
+ −=
+ − =
=
10. 7 32
7 61
y
yy
− += −
− + = −
=
x
y
−1−2−3−4−5 2 3
−2
−3
−4
−5
−6
1
2
3
(1, −6)
(−2, −4)
(1, −1)
(2, 0)
(−5, 3)

Section 1.1 The Cartesian Plane and the Distance Formula 15
Copyright © Houghton Mifflin Company. All rights reserved.
3. (a)
(b) ( ) ( )2 25 3 5 1 4 16 2 5d = − + − = + =
(c) Midpoint ( )3 5 1 5, 4, 32 2+ +⎛ ⎞= =⎜ ⎟
⎝ ⎠
5. (a)
(b) ( ) ( ) ( )2 23 2 1 2 5 1
4 36
2 10
d = ⎡ − ⎤ + −⎣ ⎦
= +
=
(c) Midpoint ( ) ( ) ( )1 2 3 2 1 5,
2 2
1, 22
⎛ + − + − ⎞= ⎜ ⎟⎝ ⎠
⎛ ⎞= − −⎜ ⎟⎝ ⎠
7. (a)
(b) ( ) ( )2 24 2 14 2
4 144
2 37
d = − + −
= +
=
(c) Midpoint ( )2 4 2 14, 3, 82 2+ +⎛ ⎞= =⎜ ⎟
⎝ ⎠
9. (a)
(b) ( ) ( )221 1 1 3
4 1 2 3 3
8 2 3
d = − − + −
= + − +
= −
(c) Midpoint ( )1 1 3 1 3 1, 0,2 2 2
⎛ ⎞ ⎛ ⎞+ − + += =⎜ ⎟ ⎜ ⎟⎜ ⎟ ⎜ ⎟⎝ ⎠ ⎝ ⎠
11. (a)
(b) ( ) ( )( )220.5 0 6 4.8
0.25 116.64
116.89
d = − + − −
= +
=
(c) Midpoint ( )0 0.5 4.8 6, 0.25, 0.62 2+ − +⎛ ⎞= =⎜ ⎟
⎝ ⎠
13. (a) 4a =
3b =
( ) ( )2 24 0 3 0
16 95
c = − + −
= +
=
(b) 2 2 216 9 25a b c+ = + = =
15. (a) 10a =
3b =
( ) ( )2 27 3 4 1
100 9
109
c = + + −
= +
=
(b) 2 2 2100 9 109a b c+ = + = =
5
4
3
2
1
54321x
(5, 5)
(4, 3)
(3, 1)
y
2
−6
−4
42x
1 , 12
y
( )
−2−4
− , −2 12( )
− , −532( )
14
10
6
2
8642x
(4, 14)
(3, 8)
(2, 2)
y
x
y
6
6
4
2
−2
−4
−6
−2−4−6 42
(0, −4.8)
(0.25, 0.6)
(0.5, 6)
2
−1
2−2 1−1x
20,1 +
(1, )
(−1, 1)
y
3
3

16 Chapter 1 Functions, Graphs, and Limits
Copyright © Houghton Mifflin Company. All rights reserved.
17. ( ) ( )2 21 3 0 7 1
9 36
45
3 5
d = − + −
= +
=
=
( ) ( )2 22 4 0 1 1
16 4
20
2 5
d = − + − −
= +
=
=
( ) ( ) 223 3 4 7 1
1 64
65
d = − + ⎡ − − ⎤⎣ ⎦
= +
=
Because 2 2 21 2 3 ,d d d+ = the figure is a right triangle.
19.
( ) ( )
( ) ( )
( ) ( )
( ) ( )
2 21
2 22
2 23
2 24
1 0 2 0
1 4
5
3 1 3 2
4 1
5
2 3 1 3
1 4
5
0 2 0 1
4 1
5
d
d
d
d
= − + −
= +
=
= − + −
= +
=
= − + −
= +
=
= − + −
= +
=
Because 1 2 3 4,d d d d= = = the figure is a parallelogram.
21. d = ( ) ( )
( )( )
2 2
2
2
2
1 4 0 5
2 17 5
2 17 25
2 8 0
4 2 0
4, 2
x
x x
x x
x x
x x
x
− + − − =
− + =
− + =
− − =
− + =
= −
23. d = ( ) ( )2 2
2
2
2
3 0 0 8
9 8
9 64
55
55
y
y
y
y
y
− + − =
+ =
+ =
=
= ±
25. (a) 2 2 2
2
16 5 , 0
281
281 16.76 feet
d d
d
d
= + >
=
= ≈
(b) ( )( )2 40 281
80 2811341.04 square feet
A =
=
≈
27.
Answers will vary. Let 6x = correspond to 1996. The number of subscribers steadily increased from 1996 to 2001 and then steadily decreased from 2001 to 2005.
29. From the graph you can estimate the values to be: (a) March 2005: 10,700 (b) December 2005: 10,900 (c) May 2006: 11,400 (d) January 2007: 12,500
31. (a) 1990: $92,000 (b) 1992: $100,000 (c) 1997: $122,000 (d) 2005: $208,000
6
4
2
62x
d2
d1
3d
(4, −1)
(3, 7)
(0, 1)
y
3
2
1
321x
d4
d2
d3
d1
(3, 3)
(2, 1)
(1, 2)
(0, 0)
y
560
16
70

Section 1.1 The Cartesian Plane and the Distance Formula 17
Copyright © Houghton Mifflin Company. All rights reserved.
33. (a) Revenue midpoint
( )
2001 2005 25,269 31,944,2 2
2003, 28,606.5
+ +⎛ ⎞= ⎜ ⎟⎝ ⎠
=
Revenue estimate for 2003: $28,606.5 million
Profit midpoint
( )
2001 2005 2058.0 2729.0,2 2
2003, 2393.5
+ +⎛ ⎞= ⎜ ⎟⎝ ⎠
=
Profit estimate for 2003: $2393.5 million (b) Actual 2003 revenue: $27,061 million Actual 2003 profit: $1354 million (c) No, the increase in revenue from 2003 to 2005 is
greater than the increase in revenue from 2001 to 2003.
No, the profit decreased from 2001 to 2003 and then increased from 2003 to 2005.
(d) 2001 expenses: 25,269 2058.0 $23,211 million− =
2003 expenses: 27,061 1354 $25,707 million− =
2005 expenses: 31,944 2729.0 $29,215 million− =
(e) Answers will vary.
35. (a)
(b) The larger the clinic, the more patients a doctor can treat.
37. (a) (0, 0) is translated to ( ) ( )0 2, 0 3 2, 3 .+ + =
( )3, 1− − is translated to
( ) ( )3 2, 1 3 1, 2 .− + − + = −
( )1, 2− − is translated to ( ) ( )1 2, 2 3 1, 1 .− + − + =
(b)
39. Midpoint 1 2 1 2,2 2
x x y y+ +⎛ ⎞= ⎜ ⎟⎝ ⎠
The point one-fourth of the way between ( )1 1,x y and
( )2 2,x y is the midpoint of the line segment from
( )1 1,x y to 1 2 1 2, ,2 2
x x y y+ +⎛ ⎞⎜ ⎟⎝ ⎠
which is
1 2 1 21 1
1 2 1 23 32 2, , .2 2 4 4
x x y yx y x x y y+ +⎛ ⎞+ +⎜ ⎟ + +⎛ ⎞=⎜ ⎟ ⎜ ⎟⎝ ⎠ ⎝ ⎠
The point three-fourths of the way between ( )1 1,x y and
( )2 2,x y is the midpoint of the line segment from
1 2 1 2,2 2
x x y y+ +⎛ ⎞⎜ ⎟⎝ ⎠
to ( )2 2, ,x y which is
1 2 1 22 2
1 2 1 23 32 2, , .2 2 4 4
x x y yx y x x y y+ +⎛ ⎞+ +⎜ ⎟ + +⎛ ⎞=⎜ ⎟ ⎜ ⎟⎝ ⎠ ⎝ ⎠
Thus,
1 2 1 2 1 2 1 23 3, , , ,4 4 2 2
x x y y x x y y+ + + +⎛ ⎞ ⎛ ⎞⎜ ⎟ ⎜ ⎟⎝ ⎠ ⎝ ⎠
and
1 2 1 23 3,4 4
x x y y+ +⎛ ⎞⎜ ⎟⎝ ⎠
are the three points that divide the line segment joining ( )1 1,x y and ( )2 2,x y into four equal parts.
41. (a) ( ) ( )
( ) ( )
3 1 4 3 2 1 7 7, ,4 4 4 4
1 4 2 1 5 3, ,2 2 2 2
1 3 4 2 3 1 13 5, ,4 4 4 4
⎛ + − − ⎞ ⎛ ⎞= −⎜ ⎟ ⎜ ⎟⎝ ⎠⎝ ⎠
+ − −⎛ ⎞ ⎛ ⎞= −⎜ ⎟ ⎜ ⎟⎝ ⎠ ⎝ ⎠
⎛ + − + − ⎞ ⎛ ⎞= −⎜ ⎟ ⎜ ⎟⎝ ⎠⎝ ⎠
(b) ( ) ( )
( ) ( )
3 2 0 3 3 0 3 9, ,4 4 2 4
2 0 3 0 3, 1,2 2 2
2 3 0 3 3 0 1 3, ,4 4 2 4
⎛ − + − + ⎞ ⎛ ⎞= − −⎜ ⎟ ⎜ ⎟⎝ ⎠⎝ ⎠
− + − +⎛ ⎞ ⎛ ⎞= − −⎜ ⎟ ⎜ ⎟⎝ ⎠ ⎝ ⎠
⎛ − + − + ⎞ ⎛ ⎞= − −⎜ ⎟ ⎜ ⎟⎝ ⎠⎝ ⎠
Small clinic
Large clinic
Num
ber
of e
ar in
fect
ions
20
30
40
50
60
70
10
Number of doctors1 2 3 4
Medium clinic
4
66
4

18 Chapter 1 Functions, Graphs, and Limits
Copyright © Houghton Mifflin Company. All rights reserved.
Section 1.2 Graphs of Equations
1. (a) This is not a solution point because
( )2 1 2 3 3 0.− − = − ≠
(b) This is a solution point because
( ) ( )2 1 1 3 0.− − − =
(c) This is a solution point because
( )2 4 5 3 0.− − =
3. (a) This is a solution point because
( ) ( )221 3 4.+ − =
(b) This is not a solution point because
( ) ( )2 2 51
2 41 4.+ − = ≠
(c) This is not a solution point because
( ) ( )2 23 7 292 2 2 4.+ = ≠
Skills Review
1. 5 125 12
125
y xy x
xy
− =
= +
+=
2. 1515
y xy x
− = −
= −
3.
( )3
3
3
2 1
2 1
12
x y y
y x
yx
+ =
+ =
=+
4. 2 2
2 2
2 2
2
6 0
6
6
6
x x y
y x x
y x x
y x x
+ − − =
− = − −
= + −
= + −
5. ( ) ( )
( ) ( )
( )
( )
( )
2 2
2 2
2
2
2
2
2 1 9
1 9 2
1 9 2
9 2 1
9 4 4 1
5 4 1
x y
y x
y x
y x
x x
x x
− + + =
+ = − −
+ = − −
⎛ ⎞= − − −⎜ ⎟⎝ ⎠
= − − + −
= + − −
6. ( ) ( )
( ) ( )
( )
( )
( )
2 2
2 2
2
2
2
2
6 5 81
5 81 6
5 81 6
5 81 6
5 81 12 36
5 45 12
x y
y x
y x
y x
x x
x x
+ + − =
− = − +
− = − +
= + − +
= + − + +
= + − −
7.
( )
22
22
2
442
4 2
4 4
x x
x x
x x
−⎛ ⎞− + ⎜ ⎟⎝ ⎠
− + −
− +
8. ( )22
2 2
2
626
6 3
6 9
x x
x x
x x
+ +
+ +
+ +
9. 2
2
2
552
2554
x x
x x
−⎛ ⎞− + ⎜ ⎟⎝ ⎠
− +
10. ( )22
2
32
94
3
3
x x
x x
+ +
+ +
11.
( )( )
2 3 2
1 2
x x
x x
− +
− −
12.
( )( )
2 5 6
2 3
x x
x x
+ +
+ +
13.
( )
2
2
94
32
3y y
y
− +
−
14.
( )
2
2
494
72
7y y
y
− +
−

Section 1.2 Graphs of Equations 19
Copyright © Houghton Mifflin Company. All rights reserved.
5. The graph of 2y x= − is a straight line with -intercepty at ( )0, 2 .− So, it matches (e).
7. The graph of 2 2y x x= + is a parabola opening up with vertex at ( )1, 1 .− − So, it matches (c).
9. The graph of 2y x= − has a y-intercept at
( )0, 2− and has x-intercepts at ( )2, 0− and ( )2, 0 .
So, it matches (a).
11. Let 0.y = Then,
( )32
2 0 3 0
.
x
x
− − =
=
Let 0.x = Then,
( )2 0 3 0
3.
y
y
− − =
= −
-intercept:x ( )32, 0
-intercept:y ( )0, 3−
13. Let 0.y = Then,
20 2x x= + −
( )( )0 2 1x x= + −
2, 1.x = −
Let 0.x = Then,
( ) ( )20 0 2
2
y
y
= + −
= −
x-intercepts: ( ) ( )2, 0 , 1, 0−
y-intercept: ( )0, 2−
15. Let 0.y = Then,
2
2
0 4
44.
x
xx
= −
=
= ±
Let 0.x = Then,
( )24 0y = −
2.y =
x-intercepts: ( ) ( )4, 0 , 4, 0−
y-intercept: ( )0, 2
17. Let 0.y = Then,
( )( )
2 402
0 2 2
2.
xxx x
x
−=
−= − +
= ±
Let 0.x = Then,
( )( )
20 40 2
2.
y
y
−=
−
=
x-intercept: Because the equation is undefined when 2,x = the only x-intercept is ( )2, 0 .−
y-intercept: ( )0, 2
19. Let 0.y = Then,
( ) ( )2 2
2
0 4 0 0
00.
x x
xx
− + =
=
=
Let 0.x = Then,
( ) ( )2 20 0 4 0
0.
y y
y
− + =
=
x-intercept: ( )0, 0
y-intercept: ( )0, 0
21. 2 3y x= +
−4 −3 −1 21 3 4
4
3
1
−2
−3
−4
y
x
(0, 3)
, 032( )−
23. 2 3y x= −
y
x
3, 0− )( 3, 0)(
(0, −3)
−4 −3−1
1
2
3
4
−4
1 3 4
x −2 32− −1 0 1 2
y −1 0 1 3 5 7
x −2 −1 0 1 2 3
y 1 −2 −3 −2 1 6

20 Chapter 1 Functions, Graphs, and Limits
Copyright © Houghton Mifflin Company. All rights reserved.
25. ( )21y x= −
(0, 1)(1, 0)
1 2 3 4 5−1−1
4
5
6
−2
−2−3
y
x
27. 3 2y x= +
321−3 −2
5
4
3
1
−1
x
(0, 2)),, 0( 2− 3
y
29. 1y x= − −
x
y
5
3
2
1
−1
−2
−3
−1 432
(1, 0)
31. 1y x= +
−4 −3 −2 −1
−1
1
2
3
4
5
6
−2
1 2 3 4
y
x
(0, 1)
(−1, 0)
33. 13
yx
=−
−3
−2
−1
3
2
1
654x
y
0, − 13
35. 2 4x y= −
1−1−2−3
−3
−1
3
1
x
(0, 2)
(−4, 0)
y
(0, −2)
37. ( ) ( )2 2 2
2 2
2 2
0 0 4
16
16 0
x y
x y
x y
− + − =
+ =
+ − =
39. ( ) ( )2 2 2
2 2
2 2
2 1 3
4 4 2 1 9
4 2 4 0
x y
x x y y
x y x y
− + + =
− + + + + =
+ − + − =
41. Since the point ( )0, 0 lies on the circle, the radius must
be the distance between ( )0, 0 and ( )1, 2 .−
r = ( ) ( )2 20 1 0 2 5+ + − =
( ) ( )2 2
2 2
1 2 5
2 4 0
x y
x y x y
+ + − =
+ + − =
x −2 −1 0 1 2
y 9 4 1 0 1
x −2 −1 0 1 2
y −6 1 2 3 10
x 1 2 3 4 5
y 0 −1 −1.41 −1.73 −2
x −3 −2 −1 0 1
y 2 1 0 1 2
x −1 0 1 2 2.5 3.5 4 5 6
y 14− 1
3− 12− −1 −2 2 1 1
2 13
x 5 0 −3 −4
y ±3 ±2 ±1 0
Section 1.2 Graphs of Equations 21
Copyright © Houghton Mifflin Company. All rights reserved.
43. ( )0 6 0 8Center Midpoint , 3, 42 2+ +⎛ ⎞= = =⎜ ⎟
⎝ ⎠
( ) ( )2 2
distance from center to an endpoint
0 3 0 4 5
r =
= − + − =
( ) ( )2 2 2
2 2
2 2
3 4 5
6 9 8 16 25
6 8 0
x y
x x y y
x y x y
− + − =
− + + − + =
+ − − =
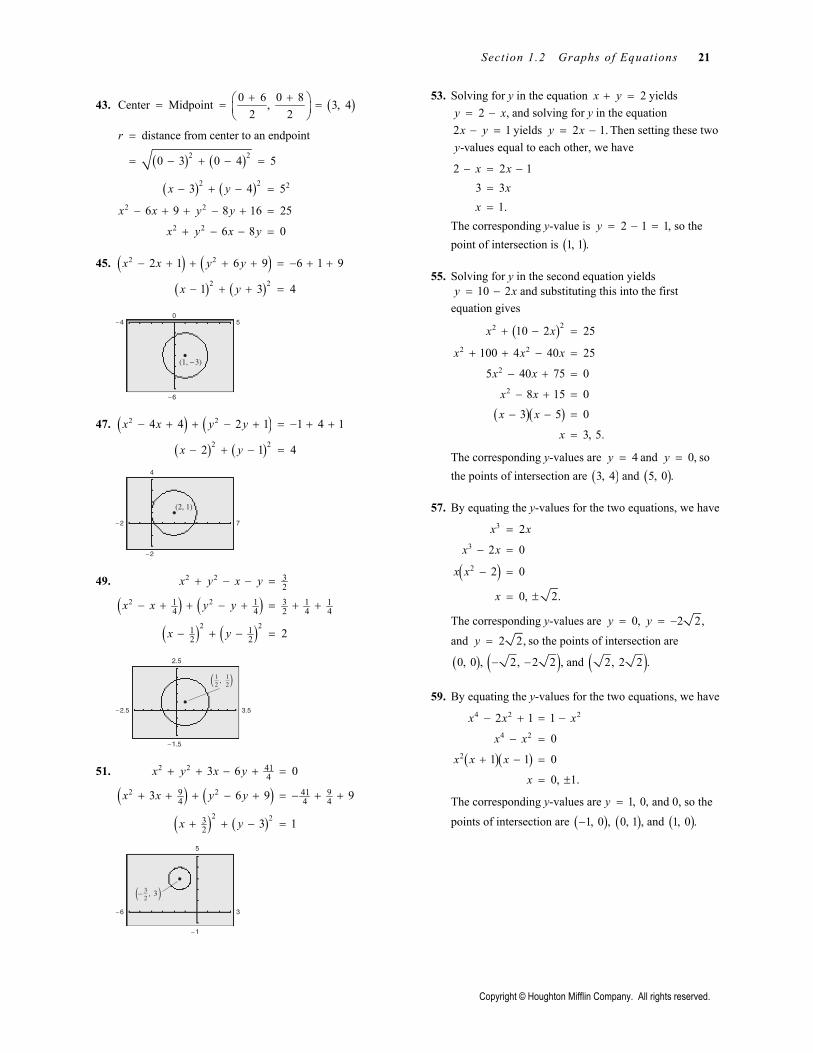
45. ( ) ( )( ) ( )
2 2
2 2
2 1 6 9 6 1 9
1 3 4
x x y y
x y
− + + + + = − + +
− + + =
−6
5−40
(1, −3)
47. ( ) ( )( ) ( )
2 2
2 2
4 4 2 1 1 4 1
2 1 4
x x y y
x y
− + + − + = − + +
− + − =
−2
7−2
4
(2, 1)
49.
( ) ( )( ) ( )
2 2
2 2
2 2
32
31 1 1 14 4 2 4 4
1 12 2 2
x y x y
x x y y
x y
+ − − =
− + + − + = + +
− + − =
, 12
12
3.5−2.5
2.5
−1.5
( (
51.
( ) ( )( ) ( )
2 2
2 2
2 2
414
9 9414 4 4
32
3 6 0
3 6 9 9
3 1
x y x y
x x y y
x y
+ + − + =
+ + + − + = − + +
+ + − =
53. Solving for y in the equation 2x y+ = yields 2 ,y x= − and solving for y in the equation
2 1x y− = yields 2 1.y x= − Then setting these two -valuesy equal to each other, we have
2 2 13 3
1.
x xx
x
− = −
=
=
The corresponding y-value is 2 1 1,y = − = so the point of intersection is ( )1, 1 .
55. Solving for y in the second equation yields 10 2y x= − and substituting this into the first
equation gives
( )
( )( )
22
2 2
2
2
10 2 25
100 4 40 25
5 40 75 0
8 15 0
3 5 0
3, 5.
x x
x x x
x x
x x
x x
x
+ − =
+ + − =
− + =
− + =
− − =
=
The corresponding y-values are 4y = and 0,y = so the points of intersection are ( )3, 4 and ( )5, 0 .
57. By equating the y-values for the two equations, we have
( )
3
3
2
2
2 0
2 0
0, 2.
x x
x x
x x
x
=
− =
− =
= ±
The corresponding y-values are 0,y = 2 2,y = −
and 2 2,y = so the points of intersection are
( )0, 0 , ( )2, 2 2 ,− − and ( )2, 2 2 .
59. By equating the y-values for the two equations, we have
( )( )
4 2 2
4 2
2
2 1 1
0
1 1 0
0, 1.
x x x
x x
x x x
x
− + = −
− =
+ − =
= ±
The corresponding y-values are 1, 0,y = and 0, so the
points of intersection are ( )1, 0 ,− ( )0, 1 , and ( )1, 0 .
3−6
−1
5
3− , 32( (

22 Chapter 1 Functions, Graphs, and Limits
Copyright © Houghton Mifflin Company. All rights reserved.
61. (a) 11.8 15,00019.30
C xR x
= +
=
(b) 11.8 15,000 19.30
15,000 7.52000 units
C Rx x
xx
=
+ =
=
=
(c)
( )1000 19.3 11.8 15,000
16,000 7.52133.3
P R C
x x
xx
= −
= − +
=
≈
So, 2134 units would yield a profit of $1000.
63. 1.55 0.85 35,0000.7 35,000
35,000 50,000 units0.7
R Cx xx
x
=
= +
=
= =
00 100,000
150,000
65. 9950 8650 250,0001300 250,000
250,000 193 units1300
R Cx xx
x
=
= +
=
= ≈
00 300
3,000,000
67. 180 4 75 3105 7
15
x xx
x
− = +
=
=
Equilibrium point ( ) ( ), 15, 120x p =
69. (a) Model: 3 20.796 8.65 312.9 4268y t t t= − + +
The model is a good fit. Answers will vary. (b) When 13:t = $8623y ≈ million
71. (a) Model: 20.77 27.3 587y t t= − + +
(b) Answers will vary. (c) When t = 9: $770.33y =
Yes, this prediction seems reasonable.
73.
The greater the value of ,c the steeper the line.
75.
Intercept: ( )0, 5.36
77.
Intercepts: ( )1.4780, 0 , ( )12.8553, 0 , ( )0, 2.3875
79.
Intercept: ( ) ( )5120, 0, 0.4167≈
t 2000 2001 2002 2003 2004 2005
Model 4268 4573 4866 5150 5432 5716
Actual 4265 4571 4899 5086 5479 5703
Year 2000 2001 2002 2003 2004 2007
Salary 587.00 613.53 638.52 661.97 683.88 740.37
−4.7
−3.1
4.7
3.1
8
−2
−12
18
−10
30−15
20
−6
−4
6
4
Section 1.2 Graphs of Equations 23
Copyright © Houghton Mifflin Company. All rights reserved.
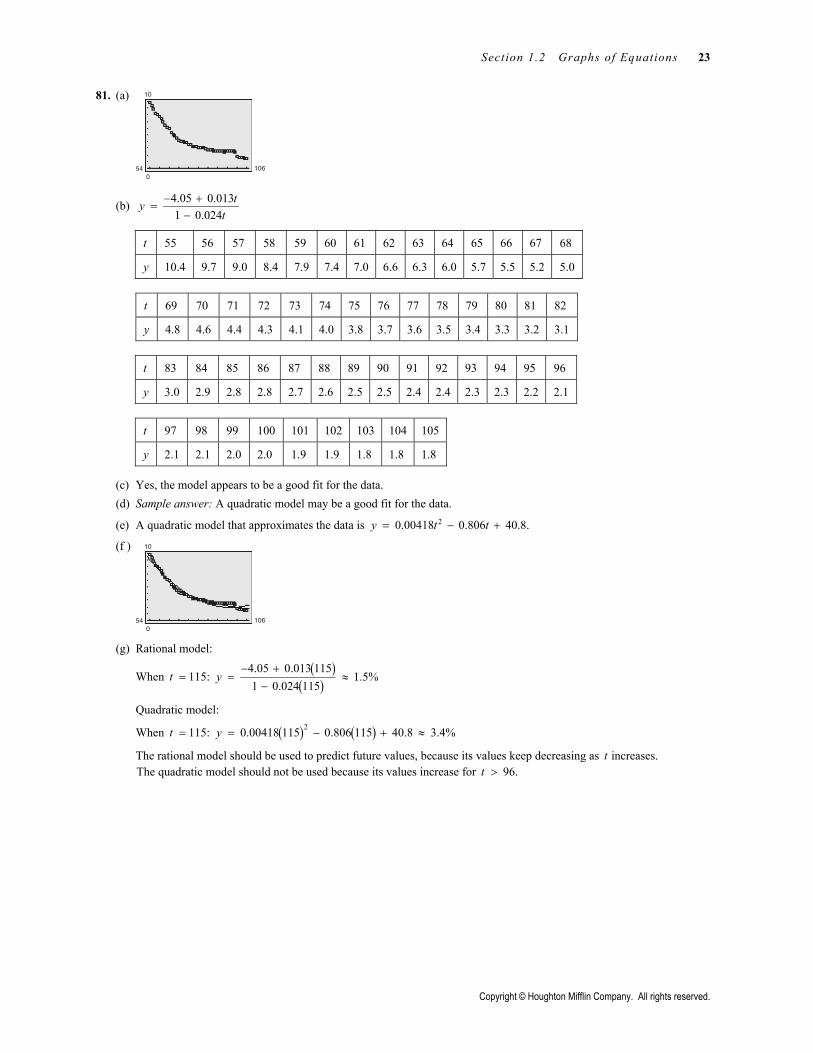
81. (a)
(b) 4.05 0.0131 0.024
tyt
− +=
−
(c) Yes, the model appears to be a good fit for the data. (d) Sample answer: A quadratic model may be a good fit for the data.
(e) A quadratic model that approximates the data is 20.00418 0.806 40.8.y t t= − +
(f )
(g) Rational model:
When t = 115: ( )( )
4.05 0.013 1151.5%
1 0.024 115y
− += ≈
−
Quadratic model:
When t = 115: ( ) ( )20.00418 115 0.806 115 40.8 3.4%y = − + ≈
The rational model should be used to predict future values, because its values keep decreasing as t increases. The quadratic model should not be used because its values increase for 96.t >
t 55 56 57 58 59 60 61 62 63 64 65 66 67 68
y 10.4 9.7 9.0 8.4 7.9 7.4 7.0 6.6 6.3 6.0 5.7 5.5 5.2 5.0
t 69 70 71 72 73 74 75 76 77 78 79 80 81 82
y 4.8 4.6 4.4 4.3 4.1 4.0 3.8 3.7 3.6 3.5 3.4 3.3 3.2 3.1
t 83 84 85 86 87 88 89 90 91 92 93 94 95 96
y 3.0 2.9 2.8 2.8 2.7 2.6 2.5 2.5 2.4 2.4 2.3 2.3 2.2 2.1
054 106
10
054 106
10
t 97 98 99 100 101 102 103 104 105
y 2.1 2.1 2.0 2.0 1.9 1.9 1.8 1.8 1.8

24 Chapter 1 Functions, Graphs, and Limits
Copyright © Houghton Mifflin Company. All rights reserved.
Section 1.3 Lines in the Plane and Slope
1. The slope is 1m = because the line rises one unit
vertically for each unit the line moves to the right.
3. The slope is 0m = because the line is horizontal.
5.
The slope is ( )0 3 1.9 0 3
m− −
= =−
7.
The slope is ( )2 43.
5 3m
− −= =
−
Skills Review
1. ( )5 2 7 13 4 7− −
= = −− − −
2. ( )7 0 74 1 3
− − −= −
−
3. 1 , 3
1 13 3
mm
− = −
− =−
4.
67
1 6,7
1 76
mm
− =
− = −
5. 4 74 7
x yy x
− + =
= +
6. 3 77 33 7
x yy xy x
− =
− = −
= −
7. ( )( )
2 3 4
3 4 2
3 12 23 10
y x
y x
y xy x
− = −
= − +
= − +
= −
8. ( ) ( )5 1 2
5 27
y x
y xy x
− − = − ⎡ − − ⎤⎣ ⎦+ = − −
= − −
9. ( ) ( )( )
( )
4 33 2
2 173 21
3 7 147 17
y x
y x
y xy x
− −− − = −
−
+ = −
+ = −
= −
10. ( ) ( )
( )
( )
3 11 17 1
41 16
21 132 213 32 53 3
y x
y x
y x
y x
y x
− −− = ⎡ − − ⎤⎣ ⎦− − −
−− = +
−
− = +
− = +
= +
x
y
10
6
4
2
−2
−4
−6
−2 842
(0, −3)
(9, 0)
62
2
−4
−2
x
(3, −4)
y
(5, 2)

Section 1.3 Lines in the Plane and Slope 25
Copyright © Houghton Mifflin Company. All rights reserved.
9.
The slope is ( )
2 2 0.6 1 2
m −= =
−
So, the line is horizontal.
11.
The slope is undefined because ( )( )
5 38 8
m− − −
=− − −
and
division by zero is undefined. So, the line is vertical.
13.
The slope is ( )
3 1 4 2.4 2 6 3
m − − −= = = −
− −
15.
The slope is ( )3 518 4 8
1 2 3 24.5
m− −
= = = −− − −
17.
The slope is( )5 5 10
2 6 352 1
3 4 12
10 12 8.3 5
m− −
= = = ⋅ =−
19. The equation of this horizontal line is 1.y = So, three additional points are ( ) ( )0, 1 , 1, 1 , and ( )3, 1 .
21. The equation of this line is
( )24 632 8.3
y x
y x
+ = −
= −
So, three additional points are ( ) ( )3, 6 , 9, 2 ,− − and
( )12, 0 .
23. The equation of the line is
( )7 3 1
3 10.
y x
y x
− = − −
= − +
So, three additional points are ( ) ( )0, 10 , 2, 4 , and ( )3, 1 .
25. The equation of this vertical line is 8.x = − So, three additional points are ( ) ( )8, 0 , 8, 2 ,− − and ( )8, 3 .−
27. 15
5 20
4
x y
y x
+ =
= − +
So, the slope is 15,m = − and the y-intercept is ( )0, 4 .
29. 76
7 6 30
5
x y
y x
+ =
= − +
So, the slope is 76,m = − and the y-intercept is ( )0, 5 .
31. 3 153 15
x yy x
− =
= −
So, the slope is 3,m = and the y-intercept is ( )0, 15 .−
33. 4x =
Because the line is vertical, the slope is undefined. There is no y-intercept.
35. 4 04
yy
− =
=
So, the slope is 0,m = and the y-intercept is ( )0, 4 .
6
4
−2
642x
(6, 2)
y
( )12
, 2
−1−2 2 3 4
−2
1
2
3
4
−3
−4
−3−4
y
x(−2, 1)
(4, −3)
−1 1−2 2 3 4
−2
4
−3
−4
−3−4
y
x
14
, −2( )
38
, 1( )−
−1 1−2 2 3 4
−2
3
2
1
4
−3
−4
−3−4
y
x
14
56
,( )−
23
52
,( )
x
y
−2−4−6 2
−2
−4
−6
−8
2
(−8, −3)
(−8, −5)

26 Chapter 1 Functions, Graphs, and Limits
Copyright © Houghton Mifflin Company. All rights reserved.
37. The slope of the line is ( )3 52.
4 0m
− −= =
−
Using the point-slope form, we have
( )5 2 0
2 50 2 5.
y x
y xx y
+ = −
= −
= − −
39. The slope of the line is 3 0 3.1 0
m −= = −
− −
Using the point-slope form, we have 3
3 0.y x
x y= −
+ =
3
2
−1
1−1−2−3x
y
(−1, 3)
(0, 0)
41. The slope of the line is 2 32 2
m − −= =
−undefined.
So, the line is vertical, and its equation is 2
2 0.x
x=
− =
5431−1
4
3
2
1
−2
−3
−1
x
y
(2, 3)
(2, −2)
43. The slope of the line is ( )1 10.
2 3m
− − −= =
− −So, the line
is horizontal, and its equation is 1
1 0.y
y= −
+ =
−1 1−2 2 3 4
−2
3
2
1
4
−3
−4
−3−4
y
x
(−2, −1) (3, −1)
45. The slope of the line is ( )
1 5 6 1.1 3 2 3 2
m −= =
− +
Using the point-slope form, we have
1 112 31 72 6
3 6 7 0.
y x
y x
x y
⎛ ⎞− = +⎜ ⎟⎝ ⎠
= +
− + =
−1 1 2−2
−2
−1
2
y
x
23
56
,( )−
13
, 1( )−
47. The slope of the line is 8 4 4.1 2 1 2
m −= =
+
Using the point-slope form, we have
18 42
4 60 4 6.
y x
y xx y
⎛ ⎞− = −⎜ ⎟⎝ ⎠
= +
= − +
−4
−4
6
8
−6
−8
2 4 6 8−6−8
y
x
12
, 4( )−
12
, 8( )
−4
−2
−2
2
4 6x
y
(0, −5)
(4, 3)

Section 1.3 Lines in the Plane and Slope 27
Copyright © Houghton Mifflin Company. All rights reserved.
49. Using the slope-intercept form, we have
34 3
4 3 123 4 12 0.
y x
y xx y
= +
= +
− + =
−6
−2
2
(0, 3)
6
51. Because the slope is undefined, the line is vertical and its equation is 1.x = −
1
−1
−3
3
(−1, 2)
53. Because the slope is 0, the line is horizontal and its equation is 7.y =
6
0−6
8
(−2, 7)
55. Using the point-slope form, we have
( )2 4 0
4 24 2 0.
y x
y xx y
+ = − −
= − −
+ + =
(0, −2)
4
−4
−5
2
57. Using the slope-intercept form, we have
3 24 3
12 9 89 12 8 0.
y x
y xx y
= +
= +
− + =
−4 2
−2
0,( )23
4
59. The slope of the line joining ( )2, 1− and ( )1, 0− is
( )
1 0 1 1.2 1 1−
= = −− − − −
The slope of the line joining ( )1, 0− and ( )2, 2− is
( )0 2 2 2.1 2 3 3− −
= = −− − −
Because the slopes are different, the points are not collinear.
61. The slope of the line joining ( )2, 7 and ( )2, 1− − is
1 7 2.2 2− −
=− −
The slope of the line joining ( )0, 3 and ( )2, 1− − is
1 3 2.2 0− −
=− −
Because the slopes are equal and both lines pass through ( )2, 1 ,− − the three points are collinear.
63. Because the line is vertical, it has an undefined slope, and its equation is
33 0.x
x=
− =
65. Because the line is parallel to a horizontal line, it has a slope of 0,m = and its equation is
10.y = −
67. Given line: 7, 1y x m= − + = −
(a) Parallel: 1 1m = −
( )2 1 3
1 0
y x
x y
− = − +
+ + =
(b) Perpendicular: 2 1m =
( )2 1 3
5 0
y x
x y
− = +
− + =
9
−2
−9
10
(−3, 2)
x + y = 7

28 Chapter 1 Functions, Graphs, and Limits
Copyright © Houghton Mifflin Company. All rights reserved.
69. Given line: 3 7 34 4 4,y x m= − + = −
(a) Parallel: 134m = −
( )7 3 32 18 4 3 4 2
8 7 6 46 8 3 0
y x x
y xx y
− = − + = − −
− = − −
+ − =
(b) Perpendicular: 243m =
( )7 84 2 48 3 3 3 9
72 63 96 6496 72 127 0
y x x
y xx y
− = + = +
− = +
− + =
−6
−4
6
4
23
78
,( )−3x + 4y = 7
71. Given line: 3y = − is horizontal, 0m =
(a) Parallel: 1 0m =
( )0 0 1
0
y x
y
− = +
=
(b) Perpendicular: 2m is undefined
1x = −
−4
−4
2(−1, 0)
y + 3 = 0
1
73. Given line: 2 0x − = is vertical, m is undefined
(a) Parallel: 1m is undefined, 1x =
(b) Perpendicular: ( )2 0, 1 0 1 , 1m y x y= − = − =
6
−2
−3
4
(1, 1)x − 2 = 0
75. 2y = −
−3
−1
1
2−1 1−2x
y
77. 2 3y x= −
−2
−1
1
−3
21−1−2 3x
y
79. 2 1y x= − +
3
2
1
−1
21−1−2x
y
81. 35 3y x= − −
x
y
(0, −3)
−1 1 2 3 4 5−1
−2
−4
−5
−6
x −2 −1 0 1
y −2 −2 −2 −2
x −1 0 1 2
y −5 −3 −1 1
x −1 0 1 2
y 3 1 −1 −3
x 0 2 4 5
y −3 215− 27
5− −6

Section 1.3 Lines in the Plane and Slope 29
Copyright © Houghton Mifflin Company. All rights reserved.
83. 4 6y x= − −
−6
−2
−11−2−3−4 2
x
y
85. ( )0, 32 , ( )100, 212
( )212 3232 0100 0
91.8 32 325
F C
F C C
−− = −
−
= + = +
or
( )5 329
C F= −
87. (a) ( )0, 4024 , ( )5, 4255
4255 4024 231 46.25 0 5
m −= = =
−
( )4024 46.2 0
46.2 4024
y t
y t
− = −
= +
The slope 46.2m = tells you that the population is increasing by 46.2 thousand per year.
(b) When 2:t = 4116.4y =
In 2002, the population was about 4,116,400. (c) When 4:t = 4208.8y =
In 2004, the population was about 4,208,800. (d) 2002: 4,024,000 2004: 4,198,000 The estimates were close to the exact values. (e) The model could possibly be used to predict the
population in 2009 if the population continues to grow at the same linear rate.
89. (a) The equipment depreciates 10255 $205= per year,
so the value is 1025 205 ,y t= − where 0 5.t≤ ≤
(b)
(c) When 3,t = the value is $410.00.
(d) The value is $600 when 2.07t = years.
91. (a) Using the points ( )9, 7802 and ( )15, 10,239 ,
10,239 7802 2437.15 9 6
m −= =
−
So,
( )7802 406 9
2437 8293.6 2
y t
y t
− = −
= +
(b) When 11:t = 8614y =
In 2001, the personal income was about $8614 billion.
(c) When 17:t = 11,051y =
In 2007, the personal income was about $11,051 billion.
(d) 2001: $8724 billion 2007: $11,595 billion The estimates were relatively close to the actual
values.
93. (a) 50 350,000C x= +
(b) 120R x=
(c)
( )120 50 350,000
70 350,000
P R C
x x
x
= −
= − +
= −
(d) When 13,000:x = 560,000P =
If the company sells 13,000 units, the profit is $560,000.
(e) 120 50 350,00070 350,000
5000
R Cx xxx
=
= +
=
=
The company must sell 5000 units to break even.
95. (a) 2000 0.07W S= +
(b) 2300 0.05W S= +
(c)
The lines intersect at ( )15,000, 3050 . If you sell
$15,000, then both jobs would yield wages of $3050. (d) No. You will make more money (if sales are $20,000)
at your current job ( )$3400w = than in the offered
job ( )$3300 .w =
x 32− −1 0 1
y 0 −2 −6 −10
00
6
120000
30,000
5000

30 Chapter 1 Functions, Graphs, and Limits
Copyright © Houghton Mifflin Company. All rights reserved.
97. 23,500 3100 100,0003100 76,500
24.677
xxx
+ ≤
≤
≤
So, 24 units.x ≤
0300
120,000
99. C = 18,375 1150 100,0001150 81,625
70.978
xxx
+ ≤
≤
≤
So, 70 units.x ≤
0800
120,000
101. C = 75,500 89 100,00089 24,500
275.28
xxx
+ ≤
≤
≤
So, 275 units.x ≤
03000
120,000
103. C = 32,000 650 100,000650 68,000
104.62
xxx
+ ≤
≤
≤
So, 104 units.x ≤
0
0110
120,000
105. C = 50,000 0.25 100,0000.25 50,000
x+ ≤
≤
So, 200,000 units.x ≤
100,0000
0
100,000
Mid-Chapter Quiz Solutions 1. (a)
(b) ( ) ( )( )223 3 1 2
36 9
3 5
d = − − + − −
= +
=
(c) 3 3 1 2 1Midpoint , 0,2 2 2
− + −⎛ ⎞ ⎛ ⎞= = −⎜ ⎟ ⎜ ⎟⎝ ⎠ ⎝ ⎠
2. (a)
(b) 221 1 3 1 492
2 4 2 16 4
197 1 19716 4
d ⎛ ⎞⎛ ⎞ ⎛ ⎞= − + − − = +⎜ ⎟⎜ ⎟ ⎜ ⎟⎝ ⎠ ⎝ ⎠⎝ ⎠
= =
(c) 31 1
2 4 22 3 1Midpoint , ,2 2 8 4
⎛ ⎞+ − ⎛ ⎞⎜ ⎟= = ⎜ ⎟⎜ ⎟ ⎝ ⎠⎝ ⎠
x
y
3
2
1
−1
−2
−3
−1−2−3 321
(−3, 1)
(3, −2)
, − 12( (0
x
y
2
1
−1
−2
−1−2 21
, 2 12( (
, − 14
32( (
,38
14( (

Mid-Chapter Quiz Solutions for Chapter 1 31
Copyright © Houghton Mifflin Company. All rights reserved.
3. (a)
(b) ( ) ( )2 20 3 4 0
3 16
19
d = − + − −
= +
=
(c) 0 3 4 0 3Midpoint , , 22 2 2
⎛ ⎞ ⎛ ⎞+ − −= = −⎜ ⎟ ⎜ ⎟⎜ ⎟ ⎜ ⎟⎝ ⎠ ⎝ ⎠
4.
( ) ( )
( )( ) ( )( )
( ) ( )
2 2
2 2
2 2
2 4 1 0 5
2 1 1 5 3 5
1 4 5 0 5 2
a
b
c
= − + − =
= − − + − − =
= − − + − − =
( ) ( ) ( )2 2 22 2 25 3 5 5 2a b c+ = + = =
5. Use the points ( )2003, 5719 and ( )2005, 5800 .
( )
2003 2005 5719 5800Midpoint ,2 2
2004, 5759.5
+ +⎛ ⎞= ⎜ ⎟⎝ ⎠
=
The population in 2004 was about 5,759,500 people.
6. 5 2y x= +
x
y
(0, 2)
−1−2−3−4 1 2 3 4
1
2
3
4
5
6
7
, 0 25( (−
7. 2 6y x x= + −
x
y
−1−2−4 1 3−1
−2
−3
−4
−5
−7
8. 3y x= −
x
y
−1 1 2 3 4 5 6
1
2
3
4
5
6
9. ( ) ( )2 2
2 2
2 2
1 0 37
2 1 37
2 36 0
x y
x x y
x y x
+ + − =
+ + + =
+ + − =
10. Because the point ( )1, 2− lies on the circle, the radius
must be the distance between ( )1, 2− and ( )2, 2 .−
( ) ( )2 21 2 2 2 5r = − − + + =
( ) ( )2 2
2 2
2 2
2 2 25
4 4 4 4 25
4 4 17 0
x y
x x y y
x y x y
− + + =
− + + + + =
+ − + − =
11.
( ) ( )( ) ( )
2 2
2 2
2 2
8 6 16 0
8 16 6 9 16 16 9
4 3 9
x y x y
x x y y
x y
+ + − + =
+ + + − + = − + +
+ + − =
3−9
−1
7
(−4, 3)
x 25− 0 1
5 1
y 0 2 3 7
x −3 −2 −1 −0.5 0 1 2
y 0 −4 −6 −6.25 −6 −4 0
x 0 1 2 3 4 5 6
y 3 2 1 0 1 2 3
x
y
−1−2 1 2 3 4−1
−2
−3
−4
−5
1), 0
(0, −4)
( 3
, −2 23
x
y
−1−2 1 2 3 4−1
−2
−3
1
(−1, −5)
(4, 0)
(2, 1)a
c
b

32 Chapter 1 Functions, Graphs, and Limits
Copyright © Houghton Mifflin Company. All rights reserved.
x
y
(−4, 5)
−1−2−3−4 32−1
−2
2
3
4
5
(1, −1)
x
y
1
−3
−1
−2
−1−3 −2 321
, 2 52( ((0, 2)
x
y
(−2, 3)
(−2, 2)
−1−3−4−5 1−1
−2
−3
1
2
3
12.
( ) ( )( ) ( )
2 2
2 2
2 2
22
114
1 11 14 4 4
12
4 4 8 4 11 0
2 0
2 1 1
1 4
x y x y
x y x y
x x y y
x y
+ − + − =
+ − + − =
− + + + + = + +
− + + =
5−4
−4
2
12
1, − ( (
13. 4.55 12,5007.19
C xR x
= +
=
7.19 4.55 12,5002.64 12,500
4734.8
R Cx xxx
=
= +
=
≈
The company must sell 4735 units to break even.
14. ( ) ( )1, 1 , 4, 5
5 1 64 1 5
m
− −
+= = −
− −
( )61 156 15 5
y x
y x
+ = − −
= − +
15. ( ) ( )2, 3 , 2, 2
2 3 undefined2 2
m
− −
−= =
− +
Because the slope is undefined, the line is vertical and its equation is 2.x = −
16. ( )
52
5, 2 , 0, 22
2 2 00
m
⎛ ⎞⎜ ⎟⎝ ⎠
−= =
−
Because the slope is 0, the line is horizontal and its equation is 2.y =
17. Given line: 1 1 14 2 4,y x m= − − = −
(a) Parallel: 114m = −
( )14
1714 4
5 3y x
y x
+ = − −
= − −
(b) Perpendicular: 2 4m =
( )5 4 3
4 17
y x
y x
+ = −
= −
18. Let 5x = represent 2005, and y represent the sales, in thousands of dollars.
( ) ( )5, 1330 , 7, 1800
1800 1330 2357 5
m −= =
−
( )1330 235 5
235 155
y x
y x
− = −
= +
When 6: 1565t y= =
When 9: 2270t y= =
You can predict the sales to be $1,565,000 in 2006 and $2,270,000 in 2009.
19. An equation for the daily cost C in terms of x, the number of miles driven, is 0.42 175.C x= +
20. (a) ( ) ( )4, 28,300 , 6, 31,700
31,700 28,300 17006 4
m −= =
−
( )28,300 1700 4
1700 21,500
y t
y t
− = −
= +
(b) When 10: 38,500t y= =
In 2010, your salary will be about $38,500.

Section 1.4 Functions 33
Copyright © Houghton Mifflin Company. All rights reserved.
Section 1.4 Functions
1. 24y x= ± − y is not a function of x since there are two values of y for
some x.
3. 12
1 112 2
6 3x y
y x
− = −
= +
y is a function of x since there is only one value of y for each x.
5. 24y x= − y is a function of x since there is only one value of y for
each x.
7. 2y x= +
y is a function of x since there is only one value of y for each x.
9. Domain: ( ),−∞ ∞
Range: [ 2.125, )− ∞
11. Domain: ( ) ( ), 0 0,−∞ ∪ ∞
Range: { 1, 1}−
Skills Review
1. ( ) ( ) ( )25 1 6 1 9 5 1 6 9 20− − − + = + + =
2. ( ) ( ) ( )3 22 7 2 10 8 7 4 10 18 28 10− + − − = − + − = − + =
3. ( )2 2 22 5 10 4 4 5 10 6x x x x x x x− + − = − + + − = + −
4. ( ) ( ) ( ) ( )( )( )
3 2
3 2 2
3 2
3 3 3 3 6 9
3 3 6 18 9 27
9 26 30
x x x x x x
x x x x x x
x x x
− + + = − + + + +
= − + + + + + +
= + + +
5. ( )1 1 1
1 1 1 1x x x= =
− − − +
6. 1 1 1 2 11 x x x x x xx x x x x− − + − −
+ = + = =
7. 2 6 112 17
x yy x
+ − =
= − +
8. 2
2
2
2
5 6 1 0
5 6 1
6 15
6 15 5
y x
y x
xy
x
− − =
= +
+=
= +
9. ( ) ( )
( )
2 2
2
2
2
3 5 1
3 5 1
3 5 2 1
2 6 3
y x
y x
y x x
y x x
− = + +
− = + +
− = + + +
= + + +
10. 2 2
2 2
2
4 2
2 4
2 4
y x
y x
y x
− =
= +
= +
11. 2 14
4 2 14 1 24 1
2122
yx
x yx yx y
x y
−=
= −
+ =
+=
+ =
12. 3
3
3
31 12 2
2 1
2 1
2 1
x y
x y
y x
y x
= −
= −
− = − −
= +
7
−3
−5
5
3
−2
−3
2

34 Chapter 1 Functions, Graphs, and Limits
Copyright © Houghton Mifflin Company. All rights reserved.
13. Domain: ( )4, ∞
Range: [4, )∞
15.
Domain: ( ) ( ), 4 4,−∞ − ∪ − ∞
Range: ( ) ( ), 1 1,−∞ ∪ ∞
17. Domain: ( ),−∞ ∞
Range: ( ),−∞ ∞
19. Domain: ( ),−∞ ∞
Range: ( ], 4−∞
21. (a) ( ) ( )0 3 0 2 0 2 2f = − = − = −
(b) ( ) ( )1 3 1 2
3 3 23 5
f x x
xx
− = − −
= − −
= −
(c) ( ) ( )3 2
3 3 2
f x x x x
x x
+ ∆ = + ∆ −
= + ∆ −
23. (a) 1 1 44 1 4
g⎛ ⎞ = =⎜ ⎟⎝ ⎠
(b) ( ) 144
g xx
+ =+
(c) ( ) ( )
( )( )
( )
1 1g x x g xx x xx x x
x x x
xx x x
+ ∆ − = −+ ∆− + ∆
=+ ∆
−∆=
+ ∆
25.
( ) ( )
( ) ( ) ( )
( )
( )
2 2
22 2
2
5 2 5 2
[ 2 5 5 2] [ 5 2]
2 52 5, 0
f x x f xx
x x x x x x
x
x x x x x x x xx
x x x xx x x
x
+ ∆ −∆
+ ∆ − + ∆ + − − +=
∆
+ ∆ + ∆ − + ∆ + − − +=
∆
∆ + ∆ + ∆= = + ∆ + ∆ ≠
∆
27. ( ) ( )
( ) ( )
1 1 1 11 1
1 11 1
1 , 01 1
g x x g xx
x x x x x xx x x x
x x xx x x x
xx x x
+ ∆ −∆
+ ∆ + − + + ∆ + + += ⋅
∆ + ∆ + + +
+ ∆ + − +=
⎡ ⎤∆ + ∆ + + +⎣ ⎦
= ∆ ≠+ ∆ + + +
29. ( ) ( )
( ) ( )( )( )
( )( )
1 12 2
2 22 2
1 , 02 2
f x x f x x x xx x
x x xx x x x
xx x x
−+ ∆ − + ∆ − −=∆ ∆
− − + ∆ −=
+ ∆ − − ∆
−= ∆ ≠
+ ∆ − −
31. y is not a function of x.
33. y is a function of x.
35. (a) ( ) ( ) ( )2 5 5 2f x g x x x+ = − + =
(b) ( ) ( ) ( )( )2 5 5 10 25f x g x x x⋅ = − = −
(c) ( )( )
2 55
f x xg x
−=
(d) ( )( ) ( ) ( )5 2 5 5 5f g x f= = − =
(e) ( )( ) ( )2 5 5g f x g x= − =
37. (a) ( ) ( ) ( ) ( )2 21 1f x g x x x x x+ = + + − = +
(b) ( ) ( ) ( )( )2 3 21 1 1f x g x x x x x x⋅ = + − = − + −
(c) ( )( )
2 1, 11
f x x xg x x
+= ≠
−
(d) ( )( ) ( ) ( )2
2
1 1 1
2 2
f g x f x x
x x
= − = − +
= − +
(e) ( )( ) ( ) ( )2 2 21 1 1g f x g x x x= + = + − =
39. ( ) ,f x x= ( ) 2 1g x x= −
(a) ( )( ) ( ) ( )21 1 1 0 0f g f f= − = =
(b) ( )( ) ( ) ( )1 1 1 0g f g g= = =
(c) ( )( ) ( )0 0 1g f g= = −
(d) ( )( ) ( )4 15 15f g f− = =
(e) ( )( ) ( )2 21 1f g x f x x= − = −
(f) ( )( ) ( ) 1,g f x g x x= = − 0x ≥
−20 10
−10
10
300
0
20

Section 1.4 Functions 35
Copyright © Houghton Mifflin Company. All rights reserved.
8−4
−2
6
f
f −1
3−3
−2
2
f
f −1
6−3
−2
4
f = f −1
00
6
4
f −1
f
41. ( )( ) 1 15 15 5
x xf g x f x− −⎛ ⎞ ⎛ ⎞= = + =⎜ ⎟ ⎜ ⎟⎝ ⎠ ⎝ ⎠
( )( ) ( ) ( )5 1 15 1
5x
g f x g x x+ −
= + = =
2 31
2
3
1
x
f
g
y
43. ( )( ) ( ) ( )( )( ) ( ) ( )
2
2 2
2
9 9 9
9 9 9
, 0
f g x f x x x
g f x g x x
x x x
= − = − − =
= − = − −
= = ≥
x
6
6 9
9f
g
y
45. ( )
( )1
2 3
2 33
23
2
f x x y
y xxy
xf x−
= − =
− =
+=
+=
47. ( )
( )
5
5
5
1 5
f x x y
y x
y x
f x x−
= =
=
=
=
49. ( ) 29 ,f x x y= − = 0 3x≤ ≤
( )
2
2 2
2 2
2
1 2
9
9
9
9
9 , 0 3
y x
y x
y x
y x
f x x x−
− =
− =
= −
= −
= − ≤ ≤
51. ( )
( )
2 3
2 3
3 2
1 3 2
, 0f x x y x
y x
y x
f x x−
= = ≥
=
=
=
53.
( ) 3 7
3 73 73
7
f x x
y xx y
xy
= −
= −
= −
−=
is one-to-one.
55.
( ) 2f x x=
f is not one-to-one because ( ) ( )1 1 1 .f f= = −
57. ( ) 3f x x= +
2−7
−1
5
f is not one-to-one because ( ) ( )5 2 1 .f f− = = −
−3
−1
3
4
−3
−2
3
5

36 Chapter 1 Functions, Graphs, and Limits
Copyright © Houghton Mifflin Company. All rights reserved.
59. (a) 2y x= +
1 2 3 4
3
2
1
4
x
y
(b) y x= −
(c) 2y x= −
2 3 41
2
3
4
1
x
y
(d) 3y x= +
(e) 4y x= −
4 6 82
2
4
6
8
x
y
(f ) 2y x=
3 421
3
4
2
1
x
y
61. (a) Shifted three units to the left: ( )23y x= +
(b) Shifted six units to the left, three units downward, and reflected: ( )26 3y x= − + −
63. (a)
(b) ( ) ( ) ( )( ) ( )( ) ( )
27 0.68 7 0.3 7 45 76.22
10 16.7 10 45 122
14 16.7 14 45 188.8
d
d
d
= − + =
= − =
= − =
The amounts spent in 1997, 2000, and 2004 were $76.22 billion, $122 billion, and $188.8 billion, respectively.
65.
( ) ( )1 2
2
2
Total Sales
690 8 0.8 458 0.78
1148 7.22 0.8 , 1, 2, 3, 4, 5, 6, 7
R R R
t t t
t t t
= = +
= − − + +
= − − =
67. (a)
( )
( )
14.751 0.01
14.75 10.01
14.750.01
100 14.75
1475 100
xp
px
pp
pp
p
+ =
−=
−=
−=
= −
(b) ( )100 14.75 1047.5 48 units
10x
−= = ≈
1600
210
80800
1500
21 3
−2
−1
−3
x
y
3
2
1
−2 −1−3x
y

Section 1.4 Functions 37
Copyright © Houghton Mifflin Company. All rights reserved.
69. ( )( )( )( ) ( )
70 375
40
40 2800 375
C x x
x t t
C x t C t t
= +
=
= = +
C is the weekly cost per t hours of production.
71. (a) If 0 100,x≤ ≤ then 90.p = If 100 1600,x< ≤ then ( )90 0.01 100 91 0.01 .p x x= − − = −
If 1600,x > then 75.p =
Thus,
90, 0 10091 0.01 , 100 1600.75, 1600
xp x x
x
≤ ≤⎧⎪= − < ≤⎨⎪ >⎩
(b) 60P px x= −
( ) 2
90 60 , 0 100 30 , 0 10091 0.01 60 , 100 1600 31 0.01 , 100 1600
75 60 , 1600 15 , 1600
x x x x xP x x x x x x x
x x x x x
− ≤ ≤ ≤ ≤⎧ ⎧⎪ ⎪= − − < ≤ = − < ≤⎨ ⎨⎪ ⎪− > >⎩ ⎩
73. (a) Revenue R rn= = ( ) 215 0.05 80 19 0.05n n n n= ⎡ − − ⎤ = −⎣ ⎦
(b)
(c) The revenue increases and then decreases as n gets larger, so it is not a good formula for the bus company to use.
75. ( ) 29 4f x x x= −
6
−4
−4
6
Zeros: ( ) 9
49 4 0 0,x x x− = ⇒ =
The function is not one-to-one.
77. ( ) 31tg t
t+
=−
−6
9−9
6
Zero: 3t = −
The function is one-to-one.
79. ( ) 2 2 4g x x x= −
6
0−6
8
Domain: 2x ≥
Zeros: 2x = ±
The function is not one-to-one.
n 100 125 150 175 200 225 250
R 1400 1593.75 1725 1793.75 1800 1743.75 1625

38 Chapter 1 Functions, Graphs, and Limits
Copyright © Houghton Mifflin Company. All rights reserved.
x
y
−1−2−3−4−5 1 2 3 4
−2−3−4−5
1234
y
−2
12345678
x−1−2−3−4−5 1 2 3 4 5
x
y
−1 1 2 3 4 5 6
1
2
3
4
5
6
x
y(0, 1)
−1−3 −2 1 2 3
−2
−3
1
2
3
Section 1.5 Limits
Skills Review
1. ( ) 2 3 3f x x x= − +
(a) ( ) ( ) ( )21 1 3 1 3
1 3 37
f − = − − − +
= + +
=
(b) ( ) 2 3 3f c c c= − +
(c) ( ) ( ) ( )2
2 2
3 3
2 3 3 3
f x h x h x h
x xh h x h
+ = + − + +
= + + − − +
2. ( )2 2, 13 1, 1
x xf x
x x− <⎧
= ⎨+ ≥⎩
(a) ( ) ( )1 2 1 2
2 24
f − = − −
= − −
= −
(b) ( ) ( )3 3 3 1
9 110
f = +
= +
=
(c) ( ) ( )2 2
2
2
1 3 1 1
3 3 1
3 4
f t t
t
t
+ = + +
= + +
= +
3. ( ) 2 2 2f x x x= − +
( ) ( )
( ) ( ) ( )( )2 2
2
2
1 1
1 2 1 2 1 2 1 2
1 2 2 2 2 1 2 2
f h fh
h h
hh h h
hhh
h
+ −
+ − + + − − +=
+ + − − + − + −=
=
=
4. ( ) 4f x x=
( ) ( ) ( ) ( )2 2 4 2 4 2
8 4 8
4
4
f h f hh h
hh
hh
+ − + −=
+ −=
=
=
5. ( ) 5h x
x= −
Domain: ( ) ( ), 0 0,−∞ ∪ ∞
Range: ( ) ( ), 0 0,−∞ ∪ ∞
6. ( ) 225g x x= −
Domain: [ ]5, 5−
Range: [ ]0, 5
7. ( ) 3f x x= −
Domain: ( ),−∞ ∞
Range: [ )0, ∞
8. ( ) xf x
x=
Domain: ( ) ( ), 0 0,−∞ ∪ ∞
Range: 1, 1y y= − =
9. 2 2
2 2
22
2
9 4 49
4 49 9
49 94
49 92
x y
y x
xy
xy
+ =
= −
−=
± −=
Not a function of x (fails the vertical line test).
10.
( )
2
2
2
2
2 8 7
2 7 8
2 7 8
82 7
x y x y
x y y x
y x x
xyx
+ =
− = −
− = −
= −−
Yes, y is a function of x.
Section 1.5 Limits 39
Copyright © Houghton Mifflin Company. All rights reserved.
1.
( )2
lim 2 5 9x
x→
+ =
3.
22
2 1lim 0.254 4x
xx→
−= =
−
5.
0
1 1lim 0.5x
xx→
+ −=
7.
0
1 114 4lim 0.0625
16x
xx−→
⎛ ⎞ ⎛ ⎞−⎜ ⎟ ⎜ ⎟+⎝ ⎠ ⎝ ⎠ = − = −
9. (a) ( )0
lim 1x
f x→
=
(b) ( )1
lim 3x
f x→−
=
11. (a) ( )0
lim 1x
g x→
=
(b) ( )1
lim 3x
g x→−
=
13. (a) ( ) ( ) ( ) ( )lim lim lim
3 912
x c x c x cf x g x f x g x
→ → →⎡ + ⎤ = +⎣ ⎦
= +
=
(b) ( ) ( ) ( ) ( )lim lim lim
3 927
x c x c x cf x g x f x g x
→ → →⎡ ⎤⎡ ⎤⎡ ⎤ =⎣ ⎦ ⎢ ⎥⎢ ⎥⎣ ⎦⎣ ⎦
= ⋅
=
(c) ( )( )
( )( )
lim 3 1limlim 9 3x c
x cx c
f xf xg x g x
→
→→
= = =
15. (a) ( )lim 16 4x c
f x→
= =
(b) ( ) ( )lim 3 3 16 48x c
f x→
⎡ ⎤ = =⎣ ⎦
(c) ( ) 2 2lim 16 256x c
f x→
⎡ ⎤ = =⎣ ⎦
17. (a) ( )3
lim 1x
f x+→
=
(b) ( )3
lim 1x
f x−→
=
(c) ( )3
lim 1x
f x→
=
19. (a) ( )3
lim 0x
f x+→
=
(b) ( )3
lim 0x
f x−→
=
(c) ( )3
lim 0x
f x→
=
21. (a) ( )3
lim 3x
f x+→
=
(b) ( )3
lim 3x
f x−→
= −
(c) ( )3
limx
f x→
does not exist.
23. 2 22
lim 2 4x
x→
= =
25. ( ) ( )3 3 3
lim 2 5 lim 2 lim 5 2 3 5 1x x x
x x→− →− →−
+ = + = − + = −
27. ( )2 2 21 1 1
lim 1 lim 1 lim 1 1 0x x x
x x→ → →
− = − = − =
29. 3
lim 6 3 6 3x
x→
+ = + =
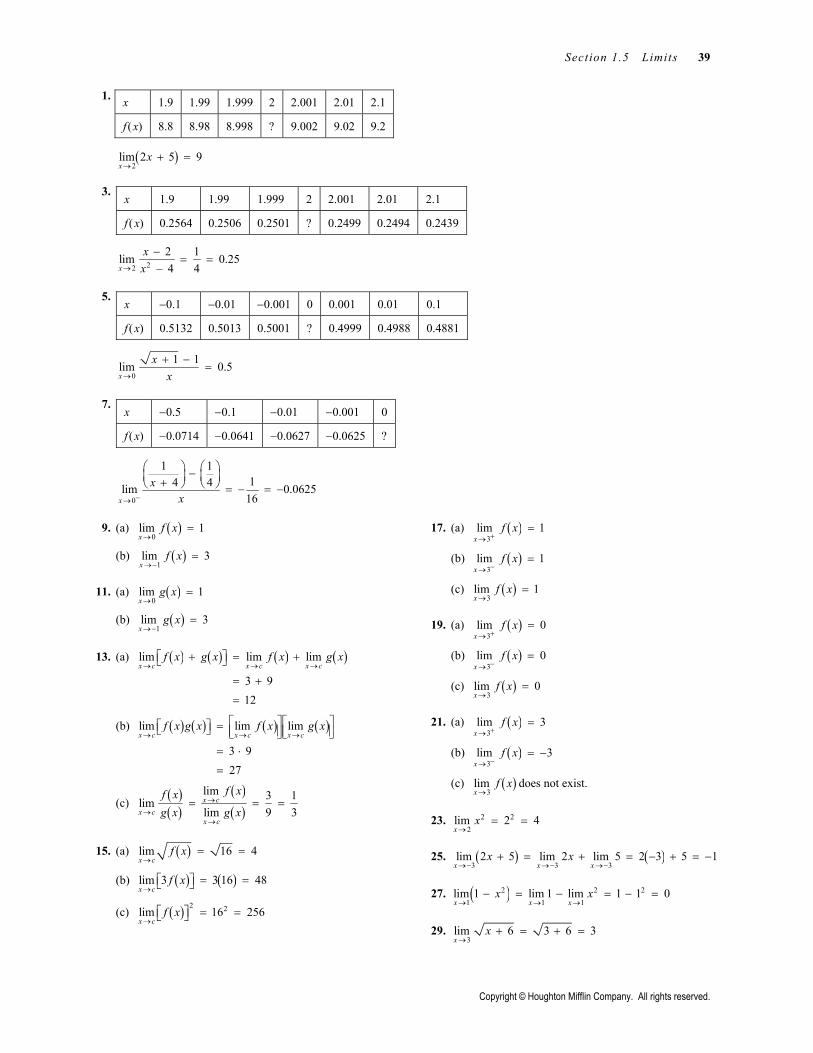
x 1.9 1.99 1.999 2 2.001 2.01 2.1
f (x) 0.2564 0.2506 0.2501 ? 0.2499 0.2494 0.2439
x −0.1 −0.01 −0.001 0 0.001 0.01 0.1
f (x) 0.5132 0.5013 0.5001 ? 0.4999 0.4988 0.4881
x −0.5 −0.1 −0.01 −0.001 0
f (x) −0.0714 −0.0641 −0.0627 −0.0625 ?
x 1.9 1.99 1.999 2 2.001 2.01 2.1
f (x) 8.8 8.98 8.998 ? 9.002 9.02 9.2

40 Chapter 1 Functions, Graphs, and Limits
Copyright © Houghton Mifflin Company. All rights reserved.
31. 3
2 2lim 22 3 2x x→−= = −
+ − +
33. ( )( )
22
2
2 11 3 3lim2 2 2 4 4x
xx→−
− −−= = = −
− −
35. ( )7
5 75 35lim2 7 2 9x
xx→
= =+ +
37. 3
1 1 3 1 1 1lim3 3x
xx→
+ − + −= =
39. 1
1 1 1 11 14 4 5 4lim
1 20 20xx
x→
− − −+ = = = −
41. ( )( )
( )
2
1 1
1
1 11lim lim1 1
lim 1 2x x
x
x xxx x
x→− →−
→−
+ −−=
+ += − = −
43. ( )( )22 2
2
2 2lim lim4 4 2 2
1lim does not exist.2
x x
x
x xx x x x
x
→ →
→
− −=
− + − −
=−
45. ( )( )24 4
4
4 4lim lim16 4 4
1lim does not exist.4
t t
t
t tt t t
t
→ →
→
+ +=
− + −
=−
47. ( )( )
( )
23
2 2
22
2 2 48lim lim2 2
lim 2 4 12
x x
x
x x xxx x
x x
→− →−
→−
+ − ++=
+ +
= − + =
49. ( )2
2 2lim 1
2 2t
x xx x−→−
+ − += = −
+ +
( )2
2 2lim 1
2 2t
x xx x+→−
+ += =
+ +
So, 2
2lim
2t
xx→−
++
does not exist.
51. ( )2
lim 4 2x
x−→
− =
( )2
lim 4 2x
x+→
− =
So, ( )2
lim 2x
f x→
=
53. ( )3 3
1lim lim 2 13x x
f x x− −→ →
⎛ ⎞= − = −⎜ ⎟⎝ ⎠
( ) ( )3 3
lim lim 2 5 1x x
f x x+ +→ →
= − + = −
So, ( )3
lim 1.x
f x→
= −
55. ( )0 0
0
2 2 2 2 2lim lim
lim 2 2x x
x
x x x x x xx x∆ → ∆ →
∆ →
+ ∆ − + ∆ −=
∆ ∆= =
57.
( ) ( )
0 0
0
0
2 2 2 2 2 2lim lim2 2
2 2lim
2 2
1lim2 2
12 2
x x
x
x
x x x x x x x x xx x x x x
x x xx x x x
x x x
x
∆ → ∆ →
∆ →
∆ →
⎛ ⎞+ + ∆ − + + + ∆ − + + + ∆ + += ⎜ ⎟⎜ ⎟∆ ∆ + + ∆ + +⎝ ⎠
+ + ∆ − +=
⎡ ⎤∆ + + ∆ + +⎣ ⎦
=+ + ∆ + +
=+
59. ( ) ( ) ( ) ( ) ( ) ( )
( ) ( ) ( )
( )
2 22 2 2
0 0
2
0
0
5 5 2 5 5 5lim lim
2 5lim
lim 2 5
2 5
t t
t
t
t t t t t t t t t t t t t tt t
t t t tt
t t
t
∆ → ∆ →
∆ →
∆ →
+ ∆ − + ∆ − − + ∆ + ∆ − − ∆ − +=
∆ ∆
∆ + ∆ − ∆=
∆= + ∆ −
= −
Section 1.5 Limits 41
Copyright © Houghton Mifflin Company. All rights reserved.
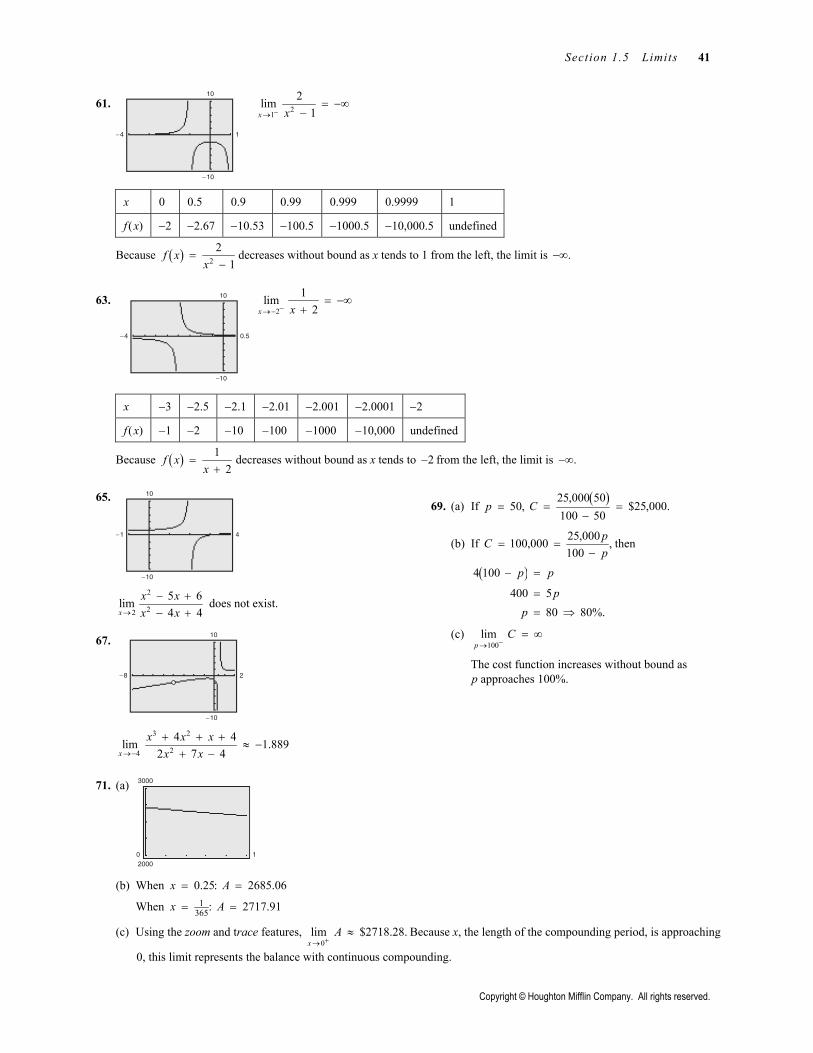
61. 21
2lim1x x−→= −∞
−
Because ( ) 22
1f x
x=
−decreases without bound as x tends to 1 from the left, the limit is .−∞
63. 2
1lim2x x−→−= −∞
+
Because ( ) 12
f xx
=+
decreases without bound as x tends to 2− from the left, the limit is .−∞
65.
2
22
5 6lim4 4x
x xx x→
− +− +
does not exist.
67.
3 2
24
4 4lim 1.8892 7 4x
x x xx x→−
+ + +≈ −
+ −
69. (a) If 50,p =( )25,000 50
$25,000.100 50
C = =−
(b) If 25,000100,000 ,100
pCp
= =−
then
( )4 100
400 580 80%.
p p
pp
− =
=
= ⇒
(c) 100
limp
C−→
= ∞
The cost function increases without bound as p approaches 100%.
71. (a)
(b) When 0.25:x = 2685.06A =
When 1365:x = 2717.91A =
(c) Using the zoom and trace features, 0
lim $2718.28.x
A+→
≈ Because x, the length of the compounding period, is approaching
0, this limit represents the balance with continuous compounding.
x 0 0.5 0.9 0.99 0.999 0.9999 1
f (x) −2 −2.67 −10.53 −100.5 −1000.5 −10,000.5 undefined
x −3 −2.5 −2.1 −2.01 −2.001 −2.0001 −2
f (x) −1 −2 −10 −100 −1000 −10,000 undefined
−4
−10
1
10
−4
−10
0.5
10
−1
−10
4
10
−8
−10
2
10
102000
3000

42 Chapter 1 Functions, Graphs, and Limits
Copyright © Houghton Mifflin Company. All rights reserved.
73. (a)
( )10
lim 1 2.718x
xx
→+ ≈
(b) (c) Domain: ( ) ( )1, 0 0,− ∪ ∞
Range: ( ) ( )1, ,e e∪ ∞
( )10
lim 1 2.718x
xx
→+ ≈
Section 1.6 Continuity
Skills Review
1. ( )( )( )( )
2
2
4 26 86 16 8 2
48
x xx xx x x x
xx
+ ++ +=
− − − +
+=
−
2. ( )( )( )( )
2
2
6 15 69 18 6 3
13
x xx xx x x x
xx
− +− −=
− + − −
+=
−
3. ( )( )( )( )( )( )
( )
22
2 2
2 62 2 124 24 36 4 6 9
2 3 24 3 3
22 3
x xx xx x x x
x xx x
xx
− −− −=
− + − +
− +=
− −
+=
−
4. ( )
( )( )
( )( )( )( )( )( )
23
3 2 2
2
16162 8 2 8
16
4 2
4 44 2
42
x xx xx x x x x x
x x
x x x
x x xx x x
xx
−−=
+ − + −
−=
+ −
+ −=
+ −
−=
−
5.
( )
2 7 0
7 0
07 0 7
x x
x x
xx x
+ =
+ =
=
+ = ⇒ = −
6.
( )( )
2 4 5 0
5 1 0
5 0 51 0 1
x x
x x
x xx x
+ − =
+ − =
+ = ⇒ = −
− = ⇒ =
7.
( )( )
2
23
3 8 4 0
3 2 2 0
3 2 0
2 0 2
x x
x x
x x
x x
+ + =
+ + =
+ = ⇒ = −
+ = ⇒ = −
8.
( )( )( )
3 2
2
5 24 0
5 24 0
3 8 0
03 0 38 0 8
x x x
x x x
x x x
xx xx x
+ − =
+ − =
− + =
=
− = ⇒ =
+ = ⇒ = −
9. ( ) ( ) ( )
( )
2 23
lim 2 3 4 2 3 3 3 4
2 9 9 4
13
xx x
→− + = − +
= − +
=
10. ( ) ( ) ( )
( )
332
lim 3 8 7 3 2 8 2 7
3 8 16 7
24 231
xx x
→−− + = − − − +
= − + +
= − +
= −
x −0.01 −0.001 −0.0001 0 0.0001 0.001 0.01
f (x) 2.732 2.720 2.718 undefined 2.718 2.717 2.705
−2
−2
10
10

Section 1.6 Continuity 43
Copyright © Houghton Mifflin Company. All rights reserved.
1. Continuous; The function is a polynomial.
3. Not continuous; The rational function is not defined at 2.x = ±
5. Continuous; The rational function's domain is the entire real line.
7. Not continuous; The rational function is not defined at 3x = or 5.x =
9. Not continuous; The rational function is not defined at 2.x = ±
11. ( )2 1xf x
x−
= is continuous on ( ), 0−∞ and
( )0, ∞ because the domain of f consists of all real
numbers except 0.x = There is a discontinuity at 0x = because ( )0f is not defined and ( )
0limx
f x→
does not exist.
13. ( )2 1
1xf xx
−=
+is continuous on ( ), 1−∞ − and
( )1,− ∞ because the domain of f consists of all real
numbers except 1.x = − There is a discontinuity at
1x = − because ( )1f − is not defined and
( ) ( )1
lim 1 .x
f x f→−
≠ −
15. ( ) 2 2 1f x x x= − + is continuous on ( ),−∞ ∞ because
the domain of f consists of all real numbers.
17. ( ) ( )( )2 1 1 1x xf x
x x x= =
− + −is continuous on
( ), 1 ,−∞ − ( )1, 1 ,− and ( )1, ∞ because the domain of f
consists of all real numbers except 1.x = ± There are discontinuities at 1x = ± because ( )1f and ( )1f − are
not defined and ( )1
limx
f x→
and ( )1
limx
f x→−
do not exist.
19. ( ) 21
1f x
x=
+is continuous on ( ),−∞ ∞ because the
domain of f consists of all real numbers.
21. ( ) ( )( )25 5
9 20 5 4x xf x
x x x x− −
= =− + − −
is continuous
on ( ), 4 ,−∞ ( )4, 5 , and ( )5, ∞ because the domain of
f consists of all real numbers except 4x = and 5.x = There is a discontinuity at 4x = and 5x = because ( )4f and ( )5f are not defined and
( )4
limx
f x→
does not exist and ( ) ( )5
lim 5 .x
f x f→
≠
23. ( ) 2 1f x x= + is continuous on all intervals of the
form ( )1 1 12 2 2, ,c c + where c is an integer. That is, f is
continuous on ( )12, , 0 ,−… ( )1
20, , ( )12, 1 , .… f is not
continuous at all points 12 ,c where c is an integer. There
are discontinuities at ,2cx = where c is an integer,
because ( )2
limx c
f x→
does not exist.
25. ( ) 2
2 3, 1, 1x x
f xx x− + <⎧
= ⎨≥⎩
is continuous on ( ),−∞ ∞ because the domain of f
consists of all real numbers, ( )1f is defined,
( )1
limx
f x→
exists, and ( ) ( )1
lim 1 .x
f x f→
=
27. ( )12 1, 23 , 2
x xf x
x x
⎧ + ≤⎪= ⎨− >⎪⎩
is continuous on ( ], 2−∞ and ( )2, .∞ There is a
discontinuity at 2x = because ( )2
limx
f x→
does not exist.
29. ( ) 11
xf x
x+
=+
is continuous on ( ), 1−∞ − and
( )1,− ∞ because the domain of f consists of all real
numbers except 1.x = − There is a discontinuity at 1x = − because ( )1f − is not defined, and
( )1
limx
f x→−
does not exist.
31. ( ) 1f x x= − is continuous on all intervals
( ), 1 .c c + There are discontinuities at ,x c= where c is
an integer, because ( )limx c
f x→
does not exist.
33. ( ) ( )( ) ( ) 11 ,1
h x f g x f xx
= = − =−
1x >
h is continuous on its entire domain ( )1, .∞
35. Continuous on [ ]1, 5− because ( ) 2 4 5f x x x= − − is a
polynomial.
37. Continuous on [ )1, 2 and ( ]2, 4 because
( ) 12
f xx
=−
has a nonremovable discontinuity at
2.x =

44 Chapter 1 Functions, Graphs, and Limits
Copyright © Houghton Mifflin Company. All rights reserved.
39. ( ) ( )( )2 4 416 4,4 4
x xxf x xx x
+ −−= = = +
− − 4x ≠
f has a removable discontinuity at 4;x = Continuous on ( ), 4−∞ and ( )4, .∞
4 62−2−6
8
6
2
10
x
y
41. ( ) ( )232
11,
x xx xf x xx x
++= = = + 0x ≠
f has a removable discontinuity at 0;x = Continuous on ( ), 0−∞ and ( )0, .∞
21−1−2
4
3
2
x
y
43. ( )2 1, 0
1, 0x x
f xx x
⎧ + <⎪= ⎨− ≥⎪⎩
f has a nonremovable discontinuity at 0;x = Continuous on ( ), 0−∞ and ( )0, .∞
−1
−3
−2
3
2
21−1 3−2−3x
y
45. ( ) 3
2 2lim lim 8
x xf x x
− −→ →= =
( ) 2
2 2lim lim 4
x xf x ax a
+ +→ →= =
So, 8 4a= and 2.a =
47.
From the graph, you can see that ( )2h and ( )1h − are not
defined, so h is not continuous at 2x = and 1.x = −
49.
From the graph, you can see that ( )3
limx
f x→
does not
exist, so f is not continuous at 3.x =
51.
From the graph, you can see that ( )lim 2 ,x c
x x→
− where
c is an integer, does not exist. So f is not continuous at all integers c.
53. ( ) 2 1xf x
x=
+is continuous on ( ), .−∞ ∞
55. ( ) 1 22
f x x= is continuous on all intervals of the form
1, ,2 2c c +⎛ ⎞
⎜ ⎟⎝ ⎠
where c is an integer.
57.
( ) ( )2 1x xx xf xx x
++= = appears to be continuous
on [ ]4, 4 .− But it is not continuous at 0x = (removable
discontinuity). Examining a function analytically can reveal removable discontinuities that are difficult to find just from analyzing its graph.
59. (a) ( ) 47500 1.015 ,tA = 0t ≥
t
A
Years
Am
ount
(in
dol
lars
)
1 2 3
7500
7750
8000
8250
8500
8750
9000
9250
The graph has nonremovable discontinuities at
3 51 14 2 4 4, , , 1, ,t = … (every 3 months).
(b) For 7,t = ( ) 4 77500 1.015 $11,379.17.A ⋅= =
After 7 years your balance is $11,379.17.
−2
3−3
2
−1
−4
7
12
3
−1
−3
3
−4
−3
4
3

Review Exercises for Chapter 1 45
Copyright © Houghton Mifflin Company. All rights reserved.
61. 12.80 2.50 , 0, not an integer
12.80 2.50 112.80 2.50 1 , 0, an integer
x x xC x
x x x⎧ + >⎪= − − = ⎨
+ − >⎪⎩
0 5
0
25
C is not continuous at 1, 2, 3, .x = …
63. (a)
Nonremovable discontinuities at 1, 2, 3, 4, 5;t = s is not continuous at 1, 2, 3, 4,t = or 5.
(b) For 5,t = $43,850,78.S =
The salary during the fifth year is $43,850.78.
65. Yes, a linear model is a continuous function. No, actual revenue would probably not be continuous because revenue is usually recorded over larger units of time (hourly, daily, or monthly). In these cases, the revenue may jump between different units of time.
67. 2
30 , 0 10031 0.01 , 100 160015 , 1600
x xP x x x
x x
≤ ≤⎧⎪= − < ≤⎨⎪ >⎩
( )100 100
lim lim 30 3000x x
P x x− −→ →
= =
( ) ( )2
100 100lim lim 31 0.01 3000
x xP x x x
+ +→ →= − =
So, ( )100
lim 3000.x
P x→
=
Because ( )100P is defined, ( )100
limx
P x→
exists, and
( ) ( )100
lim 3000 100 ,x
P x P→
= = the function is
continuous at 100.x =
Review Exercises for Chapter 1
1.
3.
5. Matches (a)
7. Matches (b)
9. ( ) ( )2 2Distance 0 5 0 2
25 4
29
= − + −
= +
=
11. ( ) ( )2 2Distance 1 4 3 6
9 9
3 2
= ⎡− − − ⎤ + −⎣ ⎦
= +
=
13. ( )5 9 6 2Midpoint , 7, 42 2+ +⎛ ⎞= =⎜ ⎟
⎝ ⎠
15. ( )10 6 4 8Midpoint , 8, 62 2
− − +⎛ ⎞= = −⎜ ⎟⎝ ⎠
17. .P R C= − The tallest bars represent revenues. The middle bars represent costs. The bars on the left of each group represent profits because .P R C= −
19. The translated vertices are:
( ) ( )( ) ( )( ) ( )
1 3, 3 4 4, 7
2 3, 4 4 5, 8
5 3, 6 4 8, 10
+ + =
+ + =
+ + =
0
0 6
50,00
x
y
(0.5, −4)
(−1, −2)
−1−2−3 1 2 3−1
−3
−4
−5
1
x
y
(0, 6)
(2, 3)
−2−4 2 4 6−2
2
4
6
8

46 Chapter 1 Functions, Graphs, and Limits
Copyright © Houghton Mifflin Company. All rights reserved.
21. Bar graph for data: Mytilus 105 Gammarus 75 Littorina 66 Arbacia 7 Nassarius 113 Mya 19
23. 4 3y x= −
x
4
3
2
1
−14321−1
y
25. 21y x= −
x−2
−3
−2
2
−1
y
27. 2 3y x= −
x
3
2
1
−14321−1
y
29. 32 1y x= −
x
y
−1−2−3 1 2 3
−3
−4
1
2
31. 2y x=
x
3 421
2
3
4
1
y
33. Let 0.y = Then,
( ) ( )
( ) ( )
3 2
2
0 1 2 1
0 1 1
1.
x x
x x
x
= − + −
= − +
= ±
Let 0.x = Then,
( ) ( )3 20 1 2 0 1
1.
y
y
= − + −
=
x-intercepts: ( ) ( )1, 0 , 1, 0−
y-intercept: ( )0, 1
35. ( ) ( )
( ) ( )
( ) ( )
2 2 2
2 2 2
2
2
2 2
2 1
1 2 7 1
9 64
73
2 1 73
x y r
r
r
r
x y
− + + =
− − + + =
+ =
=
− + + =
37.
( ) ( )( ) ( )
2 2
2 2
2 2
10 4 7 0
10 25 4 4 7 25 4
5 2 36
x y x y
x x y y
x y
+ + + − =
+ + + + + = + +
+ + + =
Center: ( )5, 2− −
r: 6
−2−2
4
−4
−8
2−4−6−8
y
x
(−5, −2)
39. Solving for y in the second equation yields 1,y x= − and substituting this into the first
equation gives
( )
( )( )
22
2 2
2
1 5
2 1 5
2 2 4 0
2 2 1 0
1, 2.
x x
x x x
x x
x x
x
+ − =
+ − + =
− − =
− + =
= −
The corresponding y-values are 2y = and 1y = so the points of intersection are ( )1, 2− and ( )2, 1 .
0 60
120

Review Exercises for Chapter 1 47
Copyright © Houghton Mifflin Company. All rights reserved.
41. Solving for y in the second equation yields 2 1,y x= − and substituting this into the first equation gives
2
2
2 1 4
2 5 0
x x
x x
+ − =
+ − =
( )2 4 4 5
22 2 6
21 6.
x− ± − −
=
− ±=
= − ±
The corresponding y-values are 3 2 6y = − +
and 3 2 6,− − so the points of intersection are
( )1 6, 3 2 6− + − + and ( )1 6, 3 2 6 .− − − −
43. (a) 6000 6.5013.90
C xR x
= +
=
(b) 6000 6.5 13.9
6000 7.4810.81, or 811 units
C Rx x
xx
=
+ =
=
≈
45. 3 23 2
x yy x
+ = −
= − −
Slope: 3m = −
y-intercept: ( )0, 2−
−4
−3
−2
2
1
2 31−1−2−3x
y
47. 53y = −
Slope: 0m = (horizontal line)
y-intercept: ( )530, −
−2
−1
2
1
21−1−2x
y
49.
25
2 5 5 05 2 5
1
x yy x
y x
− − − =
= − −
= − −
Slope: 25m = −
y-intercept: ( )0, 1−
−4
−2
4
2
2−4 4x
y
51. 6 0 6Slope7 0 7−
= =−
53. ( )( )
17 3 20Slope10 11 21
− −= =
− −
55. ( ) ( )1 2 3
2 5
y x
y x
− − = − −
= − +
−1
−10
5
10
57. ( ) ( )4 0 1.5
4
y x
y
− − = −
= −
6−6
−6
2

48 Chapter 1 Functions, Graphs, and Limits
Copyright © Houghton Mifflin Company. All rights reserved.
59. (a) ( )76 387 698 8
7 8 69 0
y x
y x
x y
− = ⎡ − − ⎤⎣ ⎦
= +
− + =
(b) 74 2 7 2 ;2
x y y x+ = ⇒ = − + slope 2= −
( )6 2 3
22 0
y x
y xx y
− = − ⎡ − − ⎤⎣ ⎦= −
+ =
(c) The line through ( )0, 0 and ( )3, 6− has slope
6 23
22 0
y xx y
= −−
= −
+ =
(d) 33 2 2 12
x y y x− = ⇒ = −
Slope of perpendicular is 2.3
−
( )26 332 43
2 3 12 0
y x
y x
x y
− = − ⎡ − − ⎤⎣ ⎦
= − +
+ − =
61. ( ) ( )32, 750 , 37, 700
750 700 50 1032 37 5
m −= = = −
− −
(a) ( )750 10 32
10 1070
x p
x p
− = − −
= − +
(b) If 34.50,p = ( )10 34.50 1070 725x = − + = units
(c) If 42.00,p = ( )10 42.00 1070 650x = − + = units
63. Yes, 2 2y x= − + is a function of x.
65. No, 2 214 4y x− = is not a function of x.
67. (a) ( ) ( )1 3 1 4 7f = + =
(b) ( ) ( )1 3 1 4 3 7f x x x+ = + + = +
(c) ( ) ( )2 3 2 4 10 3f x x x+ ∆ = + ∆ + = + ∆
69. Domain: ( ),−∞ ∞
Range: ( ),−∞ ∞
71.
Domain: [ )1,− ∞
Range: [ )0, ∞
73.
Domain: ( ),−∞ ∞
Range: ( ], 3−∞
75. (a) ( ) ( ) ( ) ( )2
2
1 2 1
2
f x g x x x
x x
+ = + + −
= +
(b) ( ) ( ) ( ) ( )2
2
1 2 1
2 2
f x g x x x
x x
− = + − −
= − +
(c) ( ) ( ) ( )( )2
3 2
1 2 1
2 2 1
f x g x x x
x x x
= + −
= − + −
(d) ( )( )
212 1
f x xg x x
+=
−
(e) ( )( ) ( )
( )2
2
2 1
1 2 1
4 4 2
f g x f x
x
x x
= −
= + −
= − +
(f ) ( )( ) ( )( )
2
2
2
1
2 1 1
2 1
g f x g x
x
x
= +
= + −
= +
77. ( ) 32f x x= has an inverse by the horizontal line test.
( )1
32322323
y x
x y
y x
f x x−
=
=
=
=
79. ( ) 2 12f x x= − + does not have an inverse by the
horizontal line test.
81. ( ) ( )2
lim 5 3 5 2 3 7x
x→
− = − = 6−6
−1
7
−1
4−2
3
−3
−6 6
5

Review Exercises for Chapter 1 49
Copyright © Houghton Mifflin Company. All rights reserved.
83. ( )( ) ( ) ( )2
lim 5 3 2 3 5 2 3 2 2 3 49x
x x→
− + = ⎡ − ⎤⎡ + ⎤ =⎣ ⎦⎣ ⎦
85. ( )22
3
3 11 10lim3 3t
tt→
++= =
87. 1
1 1 1lim 22 1 2t
tt→
+ += = −
− −
89. ( )( )22 2
2
2 2lim lim4 2 2
1lim2
14
x x
x
x xx x x
x
→− →−
→−
+ +=
− + −
=−
= −
91. 2
0 0
1 1lim limx x
xxx x+ +→ →
−⎛ ⎞− = = −∞⎜ ⎟⎝ ⎠
93. ( ) ( )
( )
( )
0 0
0
1 2 1 1 2lim lim
2
3lim does not exist.2
x x
x
x xx x x
xx x
→ →
→
⎡ − ⎤ − − −⎣ ⎦ =−
−=
−
95.
( )
( )
[ ]
0 0
0
0
1 1 1 1 1 12 24 4 4 4lim lim1 1 1 1
24 244 4
lim1 1 4 4
241lim
1 1 4 1624
116
t t
t
t
t t tt t
t tt
t tt
tt
→ →
→
→
⎛ ⎞− + −⎜ ⎟+ + +⎜ ⎟⋅ =⎡ ⎤⎜ ⎟+ +⎜ ⎟ ⎢ ⎥+⎝ ⎠ +⎣ ⎦
− +=
⎡ ⎤+ ⎡ + ⎤⎣ ⎦⎢ ⎥+⎣ ⎦−
=⎡ ⎤
+ +⎢ ⎥+⎣ ⎦
= −
97. ( ) ( ) ( ) ( ) ( )
( ) ( )
( )
3 2 33 3 2 3
0 0
2 32
0
220
2
3 3lim lim
3 3lim
lim 3 3 1
3 1
x x
x
x
x x x x x x x x x x x x x x x xx x
x x x x x xx
x x x x
x
∆ → ∆ →
∆ →
∆ →
+ ∆ − + ∆ − − + ∆ + ∆ + ∆ − − ∆ − +=
∆ ∆
∆ + ∆ + ∆ − ∆=
∆
⎡ ⎤= + ∆ + ∆ −⎣ ⎦
= −
99.
1
2 1 3 1lim 0.57741 3x
xx+→
+ −= ≈
−
101. The statement is false since 0
lim 1.x
xx−→
= −
103. The statement is false since 0
limx
x−→
is undefined.
105. The statement is false since ( )2 2
lim lim 0 0.x x
f x+ +→ →
= =
107. ( )( )2
14
f xx
=+
is continuous on the intervals
( ), 4−∞ − and ( )4,− ∞ because the domain of f consists
of all real numbers except 4.x = − There is a
discontinuity at 4x = − because ( )4f is not defined.
109. ( ) 31
f xx
=+
is continuous on the intervals
( ), 1−∞ − and ( )1,− ∞ because the domain of f consists
of all real numbers except 1.x = − There is a discontinuity at 1x = − because ( )1f − is not defined.
x 1.1 1.01 1.001 1.0001
f(x) 0.5680 0.5764 0.5773 0.5773

50 Chapter 1 Functions, Graphs, and Limits
Copyright © Houghton Mifflin Company. All rights reserved.
111. ( ) 3f x x= + is continuous on all intervals of the
form ( ), 1 ,c c + where c is an integer. There are
discontinuities at all integer values c because ( )lim
x cf x
→does not exist.
113. ( ), 0
1, 0x x
f xx x
≤⎧= ⎨
+ >⎩ is continuous on the intervals
( ), 0−∞ and ( )0, .∞ There is a discontinuity at
0x = because ( )0
limx
f x→
does not exist.
115. ( ) ( )3 3
lim lim 1 2x x
f x x− −→ →
= − + = −
( ) ( )3 3
lim lim 8 3 8x x
f x ax a+ +→ →
= − = −
So, 2 3 8a− = − and 2.a =
117. (a)
The function is continuous for all 0x > except 25,x = 100,x = and 500.x = There are discontinuities at these values because ( )
25lim ,
xC x
→( )
100lim ,
xC x
→and ( )
500lim
xC x
→do not exist.
(b) ( ) ( )100 0.10 100 10C = =
The cost of making 100 copies is $10.
119. ( )1 0.1 , 0, not an integer
1 0.1 11 0.1 1 , 0, an integer
t t tC t t
t t t⎧ + >⎪= − − = ⎨
+ − >⎪⎩
0 10
0
2
The function is continuous for all noninteger values of 0.t >
121. (a)
(b)
(c) When 20,t = 15,007.9.D =
In 2010, the national debt will be about $15,007.9 billion.
2 150
9000
t 2 3 4 5 6 7 8
D (actual) 4001.8 4351.0 4643.3 4920.6 5181.5 5369.2 5478.2
D (model) 3937.0 4391.3 4727.4 4971.0 5147.8 5283.6 5404.0
t 9 10 11 12 13 14 15
D (actual) 5605.5 5628.7 5769.9 6198.4 6760.0 7354.7 7905.3
D (model) 5534.7 5701.5 5930.1 6246.1 6675.3 7243.3 7976.0
0 8000
40

Chapter Test Solutions for Chapter 1 51
Copyright © Houghton Mifflin Company. All rights reserved.
Chapter Test Solutions
1. (a) ( ) ( )2 21 4 1 4
25 25
5 2
d = + + − −
= +
=
(b) 1 4 1 4 3 3Midpoint , ,2 2 2 2− − +⎛ ⎞ ⎛ ⎞= = −⎜ ⎟ ⎜ ⎟
⎝ ⎠ ⎝ ⎠
(c) 4 1 14 1
m += = −
− −
2. (a) ( )2
25 0 2 22
25 04
52
d ⎛ ⎞= − + −⎜ ⎟⎝ ⎠
= +
=
(b) 52 0 2 2 5Midpoint , , 2
2 2 4
⎛ ⎞+ + ⎛ ⎞⎜ ⎟= = ⎜ ⎟⎜ ⎟ ⎝ ⎠⎝ ⎠
(c) 52
2 2 00
m −= =
−
3. (a) ( ) ( )2 23 2 2 2 1
8 13
d = − + −
= +
=
(b) 3 2 2 2 1 3Midpoint , 2 2,2 2 2
⎛ ⎞+ + ⎛ ⎞= =⎜ ⎟ ⎜ ⎟⎜ ⎟ ⎝ ⎠⎝ ⎠
(c) 1 22 3 2
1 22 2 2
24
m −=
−
−= ⋅
−
=
4.
( ) ( )( ) ( )
2 2
2 2
2 2
4 2 4 0
4 4 2 1 4 4 1
2 1 9
x y x y
x x y y
x y
+ − − − =
− + + − + = + +
− + − =
5. 65 2.1 43 1.94 22
5.5
x xxx
− = +
− = −
=
Equilibrium point ( ) ( ), 5.5, 5500x p =
The equilibrium point occurs when the demand and supply are each 5500 units.
6. 15m =
When ( )150: 0 2 2x y= = − = −
y-intercept: ( )0, 2−
x
y
−1−2−3 1 2 3
−3
−1
−4
1
2
(0, −2)
7. The line is vertical, so its slope is undefined, and it has no y-intercept.
x
y
3
2
1
−3
−2
−1−1−2−3 321
8. 2.5 6.252.5
y xm= − +
= −
When ( )0: 2.5 0 6.25 6.25x y= = − + =
y-intercept: ( )0, 6.25
x
y
−2−4−6−8 2 4 6 8
−4
−6
2
4
6(0, 6.25)
x
y
−2 2 4 6
−2
4
6
(2, 1)
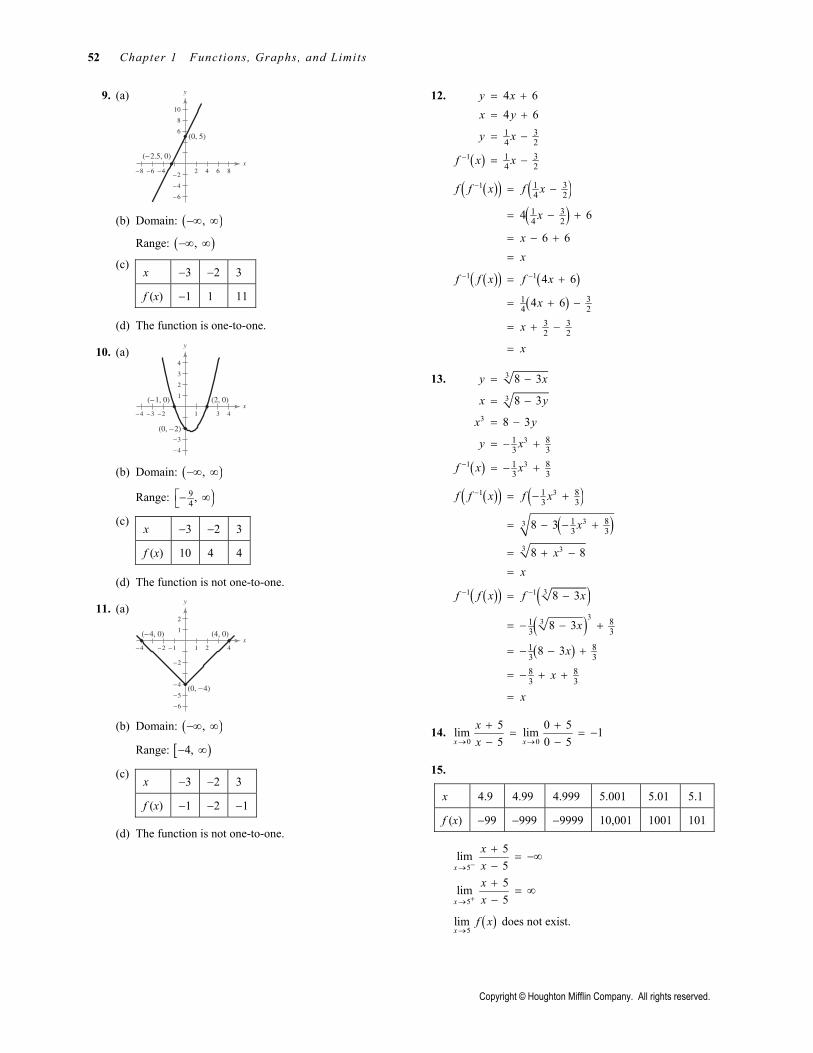
52 Chapter 1 Functions, Graphs, and Limits
Copyright © Houghton Mifflin Company. All rights reserved.
9. (a)
(b) Domain: ( ),−∞ ∞
Range: ( ),−∞ ∞
(c)
(d) The function is one-to-one.
10. (a)
(b) Domain: ( ),−∞ ∞
Range: )94,⎡− ∞⎣
(c)
(d) The function is not one-to-one.
11. (a)
(b) Domain: ( ),−∞ ∞
Range: [ )4,− ∞
(c)
(d) The function is not one-to-one.
12.
( )1
314 2
314 2
4 64 6
y xx y
y x
f x x−
= +
= +
= −
= −
( )( ) ( )( )
1 314 2
314 24 6
6 6
f f x f x
x
xx
− = −
= − +
= − +
=
( )( ) ( )( )
1 1
314 2
3 32 2
4 6
4 6
f f x f x
x
x
x
− −= +
= + −
= + −
=
13.
( )
3
3
3
3
1 3
813 3
813 3
8 3
8 3
8 3
y x
x y
x y
y x
f x x−
= −
= −
= −
= − +
= − +
( )( ) ( )( )
1 3
33
3 3
813 3
813 38 3
8 8
f f x f x
x
xx
− = − +
= − − +
= + −
=
( )( ) ( )( )( )
31 1
33 813 3
813 38 83 3
8 3
8 3
8 3
f f x f x
x
x
x
x
− −= −
= − − +
= − − +
= − + +
=
14. 0 0
5 0 5lim lim 15 0 5x x
xx→ →
+ += = −
− −
15.
5
5
5lim55lim5
x
x
xxxx
−→
+→
+= −∞
−+
= ∞−
( )5
limx
f x→
does not exist.
x −3 −2 3
f (x) −1 1 11
x −3 −2 3
f (x) 10 4 4
x −3 −2 3
f (x) −1 −2 −1 x 4.9 4.99 4.999 5.001 5.01 5.1
f (x) −99 −999 −9999 10,001 1001 101
x
y
−4−6−8 2 4 6 8
−4
−2
−6
6
8
10
(0, 5)
(−2.5, 0)
x
y
4
3
1
2
−4
−3
−2−3−4 431
(−1, 0) (2, 0)
(0, −2)
x
y
1
2
−4
−5
−6
−2
−2 −1−4 421
(−4, 0) (4, 0)
(0, −4)

Chapter Test Solutions for Chapter 1 53
Copyright © Houghton Mifflin Company. All rights reserved.
16. ( )( )( )( )
2
23 3
3
1 32 3lim lim4 3 1 3
1lim1
2
x x
x
x xx xx x x x
xx
→− →−
→−
− ++ −=
+ + + +
−=
+=
17.
0
9 3lim 0.16667x
xx→
+ −≈
18. ( )2 16
4xf xx−
=−
is continuous on the intervals ( ), 4−∞
and ( )4, ∞ because the domain of f consists of all real
numbers except 4.x = There is a discontinuity at 4x = because ( )4f is not defined.
19. ( ) 5f x x= − is continuous on the interval
( )5, ∞ because the domain of f consists of all 5.x >
20. ( ) ( )
( ) ( )1 1
2
1 1
lim lim 1 0
lim lim 0x x
x x
f x x
f x x x
− −→ →
+ +→ →
= − =
= − =
So, ( )1
lim 0.x
f x→
=
Because ( )1f is defined, ( )1
limx
f x→
exists, and
( ) ( )1
lim 1 ,x
f x f→
= the function is continuous on the
interval ( ), .−∞ ∞
21. (a)
The model fits the actual data very well. (b) When 9: 2071.14t y= =
In 2009, the number of farms will be about 2,071,140.
x −0.01 −0.001 −0.0001
f (x) 0.16671 0.16667 0.16667
x 0.0001 0.001 0.01
f (x) 0.16667 0.16666 0.16662 t 0 1 2
y (actual) 2167 2149 2135
y (model) 2166 2151 2137
t 3 4 5
y (actual) 2127 2113 2101
y (model) 2124 2113 2103
54 Chapter 1 Functions, Graphs, and Limits
Copyright © Houghton Mifflin Company. All rights reserved.
Practice Test for Chapter 1
1. Find the distance between ( )3, 7 and ( )4, 2 .−
2. Find the midpoint of the line segment joining ( )0, 5 and ( )2, 1 .
3. Determine whether the points ( )0, 3 ,− ( )2, 5 , and ( )3, 15− − are collinear.
4. Find x so that the distance between ( )0, 3 and ( ), 5x is 7.
5. Sketch the graph of 24 .y x= −
6. Sketch the graph of 2.y x= −
7. Sketch the graph of 3 .y x= −
8. Write the equation of the circle in standard form and sketch its graph.
2 2 8 2 8 0x y x y+ − + + =
9. Find the points of intersection of the graphs of 2 2 25x y+ = and 2 10.x y− =
10. Find the general equation of the line passing through the points ( )7, 4 and ( )6, 2 .−
11. Find the general equation of the line passing through the point ( )2, 1− − with a slope of 23.m =
12. Find the general equation of the line passing through the point ( )6, 8− with undefined slope.
13. Find the general equation of the line passing through the point ( )0, 3 and perpendicular to the line given by 2 5 7.x y− =
14. Given ( ) 2 5,f x x= − find the following.
(a) ( )3f
(b) ( )6f −
(c) ( )5f x −
(d) ( )f x x+ ∆
15. Find the domain and range of ( ) 3 .f x x= −
16. Given ( ) 2 3f x x= + and ( ) 2 1,g x x= − find the following.
(a) ( )( )f g x
(b) ( )( )g f x
17. Given ( ) 3 6,f x x= + find ( )1 .f x−
18. Find ( )4
lim 2 5 .x
x→−
−
19. Find 2
6
36lim .6x
xx→
−−

Practice Test for Chapter 1 55
Copyright © Houghton Mifflin Company. All rights reserved.
20. Find 1
1lim .
1x
xx→−
++
21. Find 0
5 5lim .x
xx→
+ −
22. Find ( )1
lim ,x
f x→
where ( ) 2
2 3, 1.
4, 1x x
f xx x
+ ≤⎧= ⎨
+ >⎩
23. Find the discontinuities of ( ) 28 .64
xf xx
−=
−Which are removable?
24. Find the discontinuities of ( ) 3.
3x
f xx−
=−
Which are removable?
25. Sketch the graph of ( )2 5 6.
3x xf x
x− +
=−
Graphing Calculator Required
26. Solve the equation for y and graph the resulting two equations on the same set of coordinate axes.
2 2 6 5 0x y x+ + + =
27. Use a graphing calculator to graph ( )2 9
3xf xx−
=−
and find ( )3
lim .x
f x→
Is the graph displayed correctly at 3?x =