Embed Size (px)
Citation preview

download instant at www.easysemester.comChapter 2 Exam A
Name___________________________________
MULTIPLE CHOICE. Choose the one alternative that best completes the statement or answers the question.
The heights (in inches) of 30 adult males are listed below. A frequency distribution show the frequency and relativefrequency using five classes.
70 72 71 70 69 73 69 68 70 7167 71 70 74 69 68 71 71 71 7269 71 68 67 73 74 70 71 69 68
Height (in inches) Frequency Relative Frequency67.0-68.4 6 0.2068.5-69.9 5 0.16770.0-71.4 13 0.43371.5-72.9 2 0.06773.0-74.4 4 0.133
1) Which category of heights represents the mode?A) 67.0-68.4 B) 71.5-72.9 C) 73.0-74.4 D) 70.0-71.4 E) 68.5-69.9
1)
2) What proportion of the 30 adult males had heights less than 70 inches?A) 0.367 B) 0.167 C) 36.7 D) 16.7% E) 0.433
2)
SHORT ANSWER. Write the word or phrase that best completes each statement or answers the question.
Provide an appropriate response.3) A recent survey investigated exposure to tobacco and alcohol use in a series of G-rated
animated films. Data on the total tobacco exposure time (in seconds) is below.
223 176 548 37 158 51 299 37 11165 74 9 2 6 23 206 9
Find the Five-Number Summary of Positions.
3)
MULTIPLE CHOICE. Choose the one alternative that best completes the statement or answers the question.
4) SAT verbal scores are normally distributed with a mean of 433 and a standard deviation of 90. Usethe Empirical Rule to determine what percent of the scores lie between 433 and 523.
A) 68% B) 47.5% C) 34% D) 49.9% E) 51%
4)
ScholarStock
11

download instant at www.easysemester.comSHORT ANSWER. Write the word or phrase that best completes each statement or answers the question.
5) The following data represent the number of grams of fat in various breakfast foods.
Breakfast Food Fat (in grams)Muffin and egg sandwich 12Muffin, egg, and ham sandwich 22Muffin, egg, and bacon sandwich 27Muffin and sausage sandwich 22Bagel, egg, and ham sandwich 25Bagel, egg, and bacon sandwich 30Bagel, egg, and sausage sandwich 32Bagel, egg, sausage, and cheese sandwich 37Bagel, egg, ham, and cheese sandwich 27Bagel, egg, bacon, and cheese sandwich 31Bagel 11Pancakes platter 16Pancakes and eggs platter 21Pancakes, eggs, and bacon platter 32Yogurt 2
Construct a dot plot for these data.
5)
MULTIPLE CHOICE. Choose the one alternative that best completes the statement or answers the question.
6) Parking at a large university has become a major issue. University administrators would like todetermine the average time it takes a student to find a parking spot in a university lot. Studentswho are willing to participate in the study were asked to record the time between entering campusand pulling into a parking spot. Which of the following would not be appropriate for displayingthe parking time data?
A) Box plotB) Stem-and-leaf plotC) None of these should be used.D) Pie chartE) Histogram
6)
ScholarStock
12

download instant at www.easysemester.com7) Twenty-four workers were surveyed and asked how long it takes them to travel to work each day.
The data below are given in minutes.
20 35 42 52 65 20 60 49 24 37 23 24 22 20 41 25 28 27 50 47 58 30 32 48
Which of the following shows the data in a stem-and-leaf plot?A)
23456
0 0 0 0 2 3 4 4 5 7 8 0 2 5 7 1 2 7 8 9 0 2 8 0 5
B)
23456
0 0 0 2 3 4 4 5 7 8 0 2 5 7 1 2 7 8 9 0 2 8 0 5
C)
23456
0 0 0 2 3 4 4 5 7 0 2 5 7 8 1 2 7 8 9 0 2 8 0 5
D)
23456
0 0 2 3 4 4 5 7 8 0 2 5 7 1 2 7 8 9 0 2 8 0 5
E)
23456
0 0 0 2 3 4 4 5 7 8 0 2 5 7 1 2 7 8 9 0 2 8 0
7)
ScholarStock
13

download instant at www.easysemester.comSHORT ANSWER. Write the word or phrase that best completes each statement or answers the question.
8) The following frequency histogram provides average SO2 (sulfur dioxide) emission ratesfrom utility and industrial boilers (lb/million Btu) for 47 states (data for Idaho, Alaska, andHawaii omitted).
a. Identify the intervals of emission rates used for the plot.b. Describe the shape of the distribution.c. What information can you get from the dot plot or stem-and-leaf plot of these datathat you
cannot get from this plot?d. This histogram shows frequencies. If you were to construct a histogram using thepercentages
for each interval, how (if at all) would the shape of this histogram change?
8)
9) The table below summarizes total enrollment and female enrollment at a pilot trainingcollege for the years 2005 through 2012. The table has been used to construct two differentgraphs displayed below the table. Summarize the information that is available from eachof the graphs and discuss the advantages and disadvantages of each graph.
Enrollment at Pilot Training College Year Total Number
of Students Number of Female Students
2005 283 202006 275 222007 265 222008 258 242009 252 252010 248 252011
245
27
2012
242
28
9)
ScholarStock
14

download instant at www.easysemester.com Enrollment at Pilot Training College
1 2 3 4 5 6 7 8
300
250
200
150
100
50
Years Since 2004
Num
ber o
f Stu
dent
s
1 2 3 4 5 6 7 8
300
250
200
150
100
50
Years Since 2004
Num
ber o
f Stu
dent
s- - - - Total enrollment
Female enrollment
Female Enrollment as Percentage of Total Enrollment at Pilot Training College
1 2 3 4 5 6 7 8
12
10
8
6
4
2
Years Since 2004
Perc
enta
ge F
emal
e En
rollm
ent
1 2 3 4 5 6 7 8
12
10
8
6
4
2
Years Since 2004
Perc
enta
ge F
emal
e En
rollm
ent
10) A sample of 324 randomly selected doctors was asked to indicate the category that bestdescribed how often they used the Internet. The results follow.
Internet Usage Pattern CountNever 31Rarely (about 3 times per year) 15Occasionally (about once a month) 52Often (about once a week) 109Daily 117
a. Construct a pie chart for these data.b. In creating a bar graph of these data, would it be more useful to list the patterns asgiven in the table above or in the order of a Pareto chart?
10)
ScholarStock
15
download instant at www.easysemester.comMULTIPLE CHOICE. Choose the one alternative that best completes the statement or answers the question.
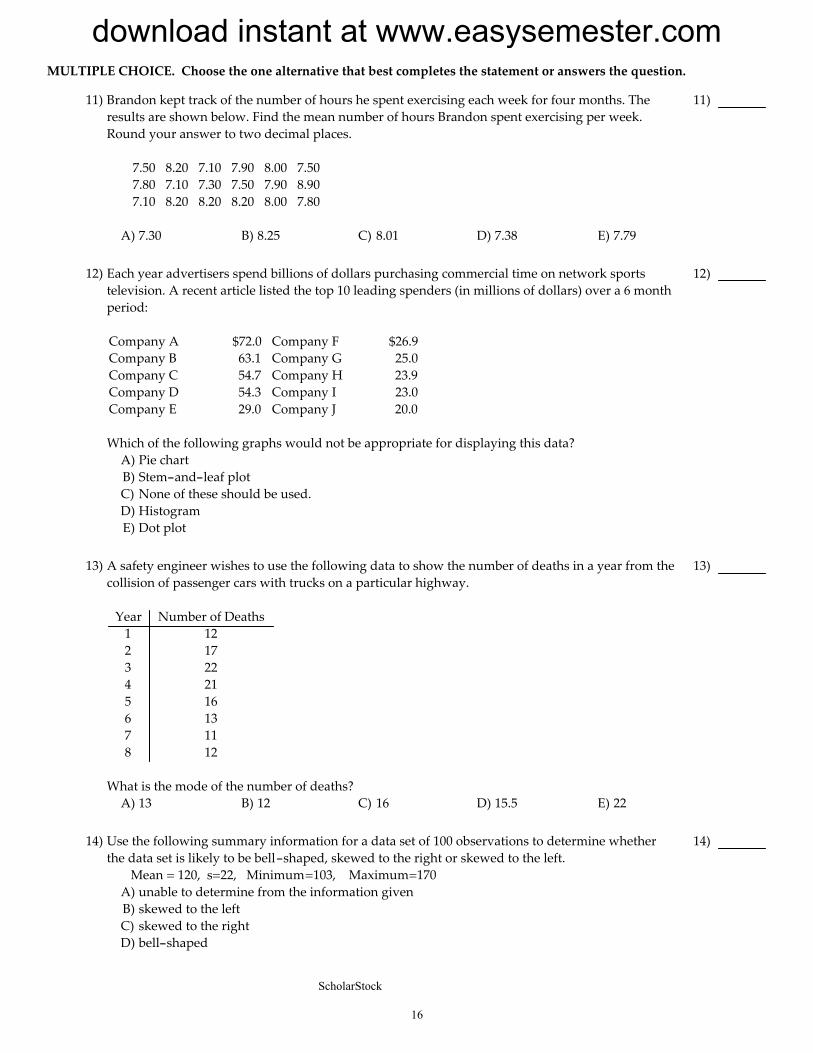
11) Brandon kept track of the number of hours he spent exercising each week for four months. Theresults are shown below. Find the mean number of hours Brandon spent exercising per week.Round your answer to two decimal places.
7.50 8.20 7.10 7.90 8.00 7.507.80 7.10 7.30 7.50 7.90 8.907.10 8.20 8.20 8.20 8.00 7.80
A) 7.30 B) 8.25 C) 8.01 D) 7.38 E) 7.79
11)
12) Each year advertisers spend billions of dollars purchasing commercial time on network sportstelevision. A recent article listed the top 10 leading spenders (in millions of dollars) over a 6 monthperiod:
Company A $72.0 Company F $26.9Company B 63.1 Company G 25.0Company C 54.7 Company H 23.9Company D 54.3 Company I 23.0Company E 29.0 Company J 20.0
Which of the following graphs would not be appropriate for displaying this data?A) Pie chartB) Stem-and-leaf plotC) None of these should be used.D) HistogramE) Dot plot
12)
13) A safety engineer wishes to use the following data to show the number of deaths in a year from thecollision of passenger cars with trucks on a particular highway.
Year Number of Deaths1 122 173 224 215 166 137 118 12
What is the mode of the number of deaths?A) 13 B) 12 C) 16 D) 15.5 E) 22
13)
14) Use the following summary information for a data set of 100 observations to determine whetherthe data set is likely to be bell-shaped, skewed to the right or skewed to the left.
Mean = 120, s=22, Minimum=103, Maximum=170A) unable to determine from the information givenB) skewed to the leftC) skewed to the rightD) bell-shaped
14)
ScholarStock
16

download instant at www.easysemester.comSHORT ANSWER. Write the word or phrase that best completes each statement or answers the question.
15) The table below shows the unemployment rate in one city from 2003 to 2012.
Year 2003 2004 2005 2006 2007 2008 2009 2010 2011 2012UnemploymentRate (Percent) 5.90 5.78 5.45 5.28 5.06 4.88 4.80 4.63 4.44 4.24
a. Construct a time plot for these data.b. Is there a trend? If so, what kind?c. Would a histogram more clearly describe the above dataset? Explain.
15)
MULTIPLE CHOICE. Choose the one alternative that best completes the statement or answers the question.
16) Use the following summary information for a data set of 100 observations to determine whetherthe data set is likely to be bell-shaped, skewed to the right or skewed to the left.
Mean = 120, s=22, Minimum=37, Maximum=136A) skewed to the rightB) skewed to the leftC) bell-shapedD) unable to determine from the information given
16)
17) The following is a time plot of wine exports (in millions of gallons) in a certain country for the past15 years. Is there a trend evident in the data?
A) no trend evident B) yes, decreasing trend C) yes, increasing trend
17)
ScholarStock
17

download instant at www.easysemester.comA sample of fifty motorists was taken on a Federal highway where the speed limit was 60 miles per hour. A dot plot oftheir speeds is shown below.
18) What is the mode for speed?A) 55B) 70C) 60D) none of theseE) 7
18)
19) What proportion of the motorists were speeding?A) 2 B) 0.72 C) 0.18 D) 0.22 E) 0.04
19)
Select the most appropriate answer.20) Which of the following is a discrete variable?
A) weight of a newborn babyB) number of phones per householdC) time it takes to drive to workD) amount of coffee in an 8-ounce cupE) none of these
20)
Answer true or false.21) Bar graphs and pie charts are graphical methods that are often used in summarizing quantitative
data.A) True B) False
21)
SHORT ANSWER. Write the word or phrase that best completes each statement or answers the question.
Fill in the blank.22) A variable is called ____________________ if each observation belongs to one of a set of
categories.22)
23) The ____________________ is the balance point of the data values; while, the_____________________ is the midpoint of the ordered data values.
23)
ScholarStock
18

download instant at www.easysemester.comMULTIPLE CHOICE. Choose the one alternative that best completes the statement or answers the question.
A sporting goods retailer conducted a customer survey to determine its customers primary reason for shopping at theirstore. The results are shown in the graph below.
24) Is the variable ʺreason for shopping at our storeʺ categorical or quantitative?A) Categorical B) Quantitative
24)
The following data show the number of laps run by each participant in a timed running race:
46 65 55 43 51 48 57 30 43 49 32 56
25) If the stems are 3, 4, 5 and 6, how many leaves are on the ʺ4 stemʺ?A) 1 B) 0 C) 5 D) 4
25)
ScholarStock
19

download instant at www.easysemester.comAnswer KeyTestname: CHAPTER_2_EXAM_A
1) D2) A3) minimum = 2 seconds, Q1 = 10 seconds, median = 51 seconds, Q3 = 191 seconds, and maximum = 548 seconds4) C5)
6) D7) B8) a. 0 to 0.49, 0.5 to 0.99, 1.0 to 1.49, 1.5 to 1.99, 2.0 to 2.49, 2.5 to 2.99, 3.0 to 3.49, 3.5 to 3.99, 4.0 to 4.49, 4.5 to 4.99; b. The
distribution is skewed to the right. c. You can get the actual data values from a dot plot or stem-and-leaf plot. d. Theshape would not change.
9) The first graph shows the total numbers of students for each year as well as the number of female students. We cansee the downward trend in overall enrollment, the slight upward trend in female enrollment and that femaleenrollment is small relative to total enrollment. However, with both total enrollment and female enrollment on the same graph, since female enrollment is smallrelative to total enrollment, the scale is not suitable for female enrollment and the upward trend in female enrollmentis not very clear.
Since both total enrollment and female enrollment are varying with time, the second graph which shows femaleenrollment as a percentage of total enrollment may be more useful. It is clear from this graph that as a percentage oftotal enrollment, female enrollment is increasing significantly. However, this graph gives no indication of the absolutenumber of students (overall or female) and without reference to the first graph, we cannot know whether thepercentage female enrollment is increasing because female enrollment is increasing, because male enrollment isdecreasing, or both.
ScholarStock
20

download instant at www.easysemester.comAnswer KeyTestname: CHAPTER_2_EXAM_A
10) a.
b. Since the categories of Internet usage pattern have a natural order from never to daily, it makes more sense to leave the categories in this natural order ratherthan ordering them from the tallest bar to the shortest bar.
11) E12) A13) B14) C15) a. Unemployment Rate 2003-2012
UnemploymentRate (Percent)
2003 2004 2005 2006 2007 2008 2009 2010 2011 2012Year
b. There
is a clear
decreasing
trend
over
time;
c. No,
a histogram
would
not depict
the trend
in this
dataset.
ScholarStock
21

download instant at www.easysemester.comAnswer KeyTestname: CHAPTER_2_EXAM_A
16) B17) C18) A19) C20) B21) B22) categorical23) mean; median24) A25) C
ScholarStock
22

download instant at www.easysemester.comChapter 2 Exam B
Name___________________________________
SHORT ANSWER. Write the word or phrase that best completes each statement or answers the question.
Provide an appropriate response.1) The following frequency histogram provides average SO2 (sulfur dioxide) emission rates
from utility and industrial boilers (lb/million Btu) for 47 states (data for Idaho, Alaska, andHawaii omitted).
a. Identify the intervals of emission rates used for the plot.b. Describe the shape of the distribution.c. What information can you get from the dot plot or stem-and-leaf plot of these datathat you
cannot get from this plot?d. This histogram shows frequencies. If you were to construct a histogram using thepercentages
for each interval, how (if at all) would the shape of this histogram change?
1)
ScholarStock
23

download instant at www.easysemester.com2) A sample of 324 randomly selected doctors was asked to indicate the category that best
described how often they used the Internet. The results follow.
Internet Usage Pattern CountNever 31Rarely (about 3 times per year) 15Occasionally (about once a month) 52Often (about once a week) 109Daily 117
a. Construct a pie chart for these data.b. In creating a bar graph of these data, would it be more useful to list the patterns asgiven in the table above or in the order of a Pareto chart?
2)
MULTIPLE CHOICE. Choose the one alternative that best completes the statement or answers the question.
3) Parking at a large university has become a major issue. University administrators would like todetermine the average time it takes a student to find a parking spot in a university lot. Studentswho are willing to participate in the study were asked to record the time between entering campusand pulling into a parking spot. Which of the following would not be appropriate for displayingthe parking time data?
A) Box plotB) Stem-and-leaf plotC) HistogramD) Pie chartE) None of these should be used.
3)
SHORT ANSWER. Write the word or phrase that best completes each statement or answers the question.
4) The table below shows the unemployment rate in one city from 2003 to 2012.
Year 2003 2004 2005 2006 2007 2008 2009 2010 2011 2012UnemploymentRate (Percent) 5.90 5.78 5.45 5.28 5.06 4.88 4.80 4.63 4.44 4.24
a. Construct a time plot for these data.b. Is there a trend? If so, what kind?c. Would a histogram more clearly describe the above dataset? Explain.
4)
MULTIPLE CHOICE. Choose the one alternative that best completes the statement or answers the question.
5) Use the following summary information for a data set of 100 observations to determine whetherthe data set is likely to be bell-shaped, skewed to the right or skewed to the left.
Mean = 120, s=22, Minimum=103, Maximum=170A) bell-shapedB) unable to determine from the information givenC) skewed to the leftD) skewed to the right
5)
ScholarStock
24

download instant at www.easysemester.com6) Brandon kept track of the number of hours he spent exercising each week for four months. The
results are shown below. Find the mean number of hours Brandon spent exercising per week.Round your answer to two decimal places.
7.50 8.20 7.10 7.90 8.00 7.507.80 7.10 7.30 7.50 7.90 8.907.10 8.20 8.20 8.20 8.00 7.80
A) 8.25 B) 8.01 C) 7.30 D) 7.79 E) 7.38
6)
7) Use the following summary information for a data set of 100 observations to determine whetherthe data set is likely to be bell-shaped, skewed to the right or skewed to the left.
Mean = 120, s=22, Minimum=37, Maximum=136A) unable to determine from the information givenB) skewed to the rightC) bell-shapedD) skewed to the left
7)
SHORT ANSWER. Write the word or phrase that best completes each statement or answers the question.
8) The following data represent the number of grams of fat in various breakfast foods.
Breakfast Food Fat (in grams)Muffin and egg sandwich 12Muffin, egg, and ham sandwich 22Muffin, egg, and bacon sandwich 27Muffin and sausage sandwich 22Bagel, egg, and ham sandwich 25Bagel, egg, and bacon sandwich 30Bagel, egg, and sausage sandwich 32Bagel, egg, sausage, and cheese sandwich 37Bagel, egg, ham, and cheese sandwich 27Bagel, egg, bacon, and cheese sandwich 31Bagel 11Pancakes platter 16Pancakes and eggs platter 21Pancakes, eggs, and bacon platter 32Yogurt 2
Construct a dot plot for these data.
8)
MULTIPLE CHOICE. Choose the one alternative that best completes the statement or answers the question.
9) SAT verbal scores are normally distributed with a mean of 433 and a standard deviation of 90. Usethe Empirical Rule to determine what percent of the scores lie between 433 and 523.
A) 51% B) 34% C) 47.5% D) 68% E) 49.9%
9)
SHORT ANSWER. Write the word or phrase that best completes each statement or answers the question.
ScholarStock
25

download instant at www.easysemester.com10) The table below summarizes total enrollment and female enrollment at a pilot training
college for the years 2005 through 2012. The table has been used to construct two differentgraphs displayed below the table. Summarize the information that is available from eachof the graphs and discuss the advantages and disadvantages of each graph.
Enrollment at Pilot Training College Year Total Number
of Students Number of Female Students
2005 283 202006 275 222007 265 222008 258 242009 252 252010 248 252011 245 272012 242 28
Enrollment at Pilot Training College
1 2 3 4 5 6 7 8
300
250
200
150
100
50
Years Since 2004
Num
ber o
f Stu
dent
s
1 2 3 4 5 6 7 8
300
250
200
150
100
50
Years Since 2004
Num
ber o
f Stu
dent
s
- - - - Total enrollment
Female enrollment
Female Enrollment as Percentage of Total Enrollment at Pilot Training College
1 2 3 4 5 6 7 8
12
10
8
6
4
2
Years Since 2004
Perc
enta
ge F
emal
e En
rollm
ent
1 2 3 4 5 6 7 8
12
10
8
6
4
2
Years Since 2004
Perc
enta
ge F
emal
e En
rollm
ent
10)
ScholarStock
26

download instant at www.easysemester.comMULTIPLE CHOICE. Choose the one alternative that best completes the statement or answers the question.
11) Each year advertisers spend billions of dollars purchasing commercial time on network sportstelevision. A recent article listed the top 10 leading spenders (in millions of dollars) over a 6 monthperiod:
Company A $72.0 Company F $26.9Company B 63.1 Company G 25.0Company C 54.7 Company H 23.9Company D 54.3 Company I 23.0Company E 29.0 Company J 20.0
Which of the following graphs would not be appropriate for displaying this data?A) Stem-and-leaf plotB) HistogramC) Pie chartD) Dot plotE) None of these should be used.
11)
ScholarStock
27

download instant at www.easysemester.com12) Twenty-four workers were surveyed and asked how long it takes them to travel to work each day.
The data below are given in minutes.
20 35 42 52 65 20 60 49 24 37 23 24 22 20 41 25 28 27 50 47 58 30 32 48
Which of the following shows the data in a stem-and-leaf plot?A)
23456
0 0 0 2 3 4 4 5 7 8 0 2 5 7 1 2 7 8 9 0 2 8 0
B)
23456
0 0 0 2 3 4 4 5 7 8 0 2 5 7 1 2 7 8 9 0 2 8 0 5
C)
23456
0 0 0 0 2 3 4 4 5 7 8 0 2 5 7 1 2 7 8 9 0 2 8 0 5
D)
23456
0 0 0 2 3 4 4 5 7 0 2 5 7 8 1 2 7 8 9 0 2 8 0 5
E)
23456
0 0 2 3 4 4 5 7 8 0 2 5 7 1 2 7 8 9 0 2 8 0 5
12)
SHORT ANSWER. Write the word or phrase that best completes each statement or answers the question.
13) A recent survey investigated exposure to tobacco and alcohol use in a series of G-ratedanimated films. Data on the total tobacco exposure time (in seconds) is below.
223 176 548 37 158 51 299 37 11165 74 9 2 6 23 206 9
Find the Five-Number Summary of Positions.
13)
ScholarStock
28

download instant at www.easysemester.comMULTIPLE CHOICE. Choose the one alternative that best completes the statement or answers the question.
14) A safety engineer wishes to use the following data to show the number of deaths in a year from thecollision of passenger cars with trucks on a particular highway.
Year Number of Deaths1 122 173 224 215 166 137 118 12
What is the mode of the number of deaths?A) 15.5 B) 12 C) 13 D) 16 E) 22
14)
15) The following is a time plot of wine exports (in millions of gallons) in a certain country for the past15 years. Is there a trend evident in the data?
A) yes, increasing trend B) no trend evident C) yes, decreasing trend
15)
The following data show the number of laps run by each participant in a timed running race:
46 65 55 43 51 48 57 30 43 49 32 56
16) If the stems are 3, 4, 5 and 6, how many leaves are on the ʺ4 stemʺ?A) 1 B) 4 C) 0 D) 5
16)
ScholarStock
29

download instant at www.easysemester.comSelect the most appropriate answer.
17) Which of the following is a discrete variable?A) amount of coffee in an 8-ounce cupB) none of theseC) weight of a newborn babyD) number of phones per householdE) time it takes to drive to work
17)
A sample of fifty motorists was taken on a Federal highway where the speed limit was 60 miles per hour. A dot plot oftheir speeds is shown below.
18) What proportion of the motorists were speeding?A) 0.18 B) 0.04 C) 2 D) 0.72 E) 0.22
18)
19) What is the mode for speed?A) none of theseB) 70C) 55D) 60E) 7
19)
Answer true or false.20) Bar graphs and pie charts are graphical methods that are often used in summarizing quantitative
data.A) True B) False
20)
SHORT ANSWER. Write the word or phrase that best completes each statement or answers the question.
Fill in the blank.21) A variable is called ____________________ if each observation belongs to one of a set of
categories.21)
22) The ____________________ is the balance point of the data values; while, the_____________________ is the midpoint of the ordered data values.
22)
ScholarStock
30

download instant at www.easysemester.comMULTIPLE CHOICE. Choose the one alternative that best completes the statement or answers the question.
A sporting goods retailer conducted a customer survey to determine its customers primary reason for shopping at theirstore. The results are shown in the graph below.
23) Is the variable ʺreason for shopping at our storeʺ categorical or quantitative?A) Quantitative B) Categorical
23)
The heights (in inches) of 30 adult males are listed below. A frequency distribution show the frequency and relativefrequency using five classes.
70 72 71 70 69 73 69 68 70 7167 71 70 74 69 68 71 71 71 7269 71 68 67 73 74 70 71 69 68
Height (in inches) Frequency Relative Frequency67.0-68.4 6 0.2068.5-69.9 5 0.16770.0-71.4 13 0.43371.5-72.9 2 0.06773.0-74.4 4 0.133
24) What proportion of the 30 adult males had heights less than 70 inches?A) 0.433 B) 16.7% C) 0.367 D) 36.7 E) 0.167
24)
25) Which category of heights represents the mode?A) 71.5-72.9 B) 68.5-69.9 C) 67.0-68.4 D) 73.0-74.4 E) 70.0-71.4
25)
ScholarStock
31

download instant at www.easysemester.comAnswer KeyTestname: CHAPTER_2_EXAM_B
1) a. 0 to 0.49, 0.5 to 0.99, 1.0 to 1.49, 1.5 to 1.99, 2.0 to 2.49, 2.5 to 2.99, 3.0 to 3.49, 3.5 to 3.99, 4.0 to 4.49, 4.5 to 4.99; b. Thedistribution is skewed to the right. c. You can get the actual data values from a dot plot or stem-and-leaf plot. d. Theshape would not change.
2) a.
b. Since the categories of Internet usage pattern have a natural order from never to daily, it makes more sense to leave the categories in this natural order ratherthan ordering them from the tallest bar to the shortest bar.
3) D4) a. Unemployment Rate 2003-2012
UnemploymentRate (Percent)
2003 2004 2005 2006 2007 2008 2009 2010 2011 2012Year
b. There
is a clear
decreasing
trend
over
time;
c. No,
a histogram
would
not depict
the trend
in this
dataset.
ScholarStock
32

download instant at www.easysemester.comAnswer KeyTestname: CHAPTER_2_EXAM_B
5) D6) D7) D8)
9) B10) The first graph shows the total numbers of students for each year as well as the number of female students. We can
see the downward trend in overall enrollment, the slight upward trend in female enrollment and that femaleenrollment is small relative to total enrollment. However, with both total enrollment and female enrollment on the same graph, since female enrollment is smallrelative to total enrollment, the scale is not suitable for female enrollment and the upward trend in female enrollmentis not very clear.
Since both total enrollment and female enrollment are varying with time, the second graph which shows femaleenrollment as a percentage of total enrollment may be more useful. It is clear from this graph that as a percentage oftotal enrollment, female enrollment is increasing significantly. However, this graph gives no indication of the absolutenumber of students (overall or female) and without reference to the first graph, we cannot know whether thepercentage female enrollment is increasing because female enrollment is increasing, because male enrollment isdecreasing, or both.
11) C12) B13) minimum = 2 seconds, Q1 = 10 seconds, median = 51 seconds, Q3 = 191 seconds, and maximum = 548 seconds14) B15) A16) D17) D18) A19) C20) B21) categorical22) mean; median23) B24) C25) E
ScholarStock
33


![Histogram [Www.nikonians.org]](https://img.pdfslide.us/doc/110x75/577cd8911a28ab9e78a17d60/histogram-wwwnikoniansorg.jpg)

