Embed Size (px)
Citation preview

Introduction We use data to measure the world and to makesense of it, but measuring development is acomplex business. Statistics help us to summariseand present information, which can then be usedto describe, compare, analyse and explaindevelopment patterns and processes. A wealth ofstatistics is available to help frame ourunderstanding of global issues in developmentand underdevelopment: some of the mainsources are listed at the end of this chapter.
However, statistics need to be treated with somecaution. Like other sorts of information they canbe subject to inaccuracy, incompleteness andbias, for example between men and women,urban and rural people, rich and poor. Almost asnotable as what statistics can tell us is what theycannot tell - about the unmeasured orimmeasurable. Moreover, the statistics we collectand the way they are selected, presented andinterpreted say something about our view ofdevelopment and our view of the world.
This chapter introduces a range of data - thefacts and figures of development andunderdevelopment - and uses them to framesome of the key development issues that will beaddressed in depth in subsequent chapters. Itintroduces a world of progress and development,but also of growing inequality between andwithin nations, and sets out the meaning,strengths and weaknesses of key measures ofdevelopment.
An unequal world
The world is like a table. Twenty percent live onthe table and eighty percent survive underneathit. Our work cannot be to move a few from underthe table onto the table, or vice versa. Our task isto move the table, to change its position ifnecessary, and all to sit together around the table.
- Father Jean-Bertrand Aristide, Haiti
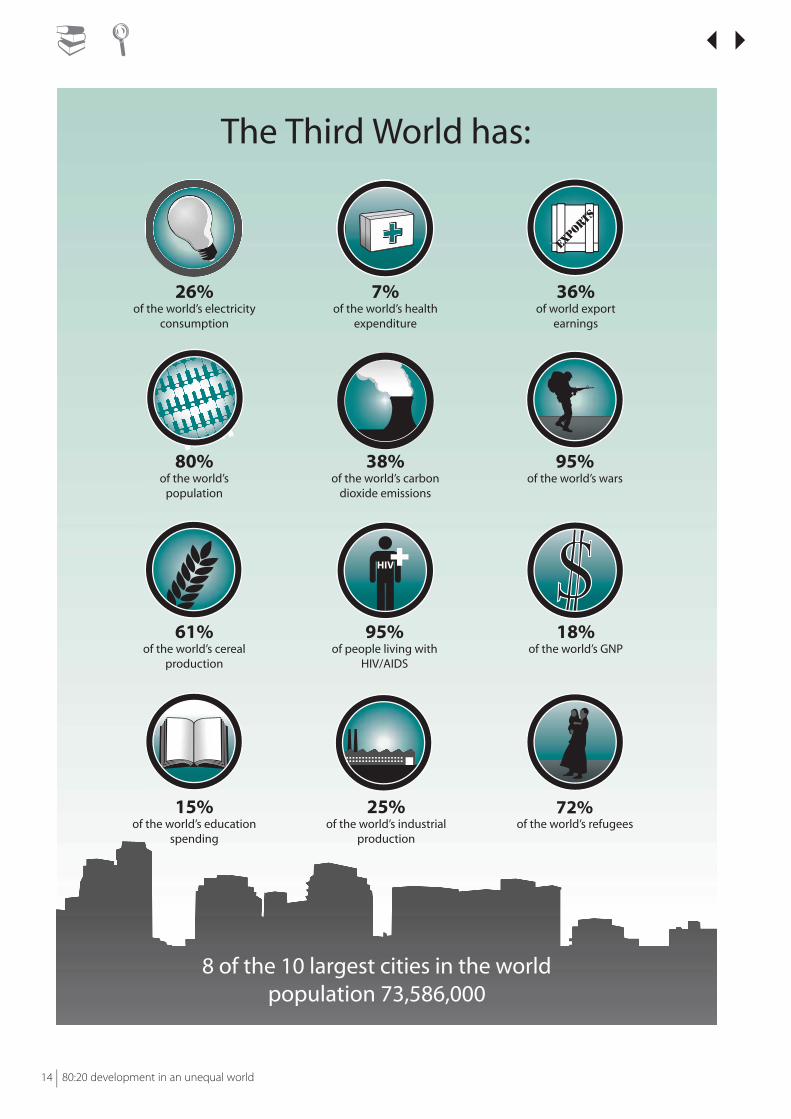
Today, approximately 80% of the world’speople live in the Third World; for thatreason it is sometimes referred to as the‘Majority World’. In most parts of the worldpopulation growth rates are slowing, butrates are still significantly higher in manyThird World countries, so that proportion isincreasing: from 70% in 1950, 75% in1980 to a projected 84% in 2025.However, this huge majority population hasaccess to an unequal share of the world’sresources and human welfare.
Massive poverty and obscene inequality are such terrible scourges of our times… that they have to rank alongside slavery and apartheid as social evils.
- UN Development Report, 2006
80:20 development in an unequal world | 13
1 Development – the basicsmaking sense of the worldJohn Hopkin
����
80:20 development in an unequal world14 |
����
The Third World has:
8 of the 10 largest cities in the worldpopulation 73,586,000

80:20 development in an unequal world | 15
����
The
dis
trib
uti
on
of w
orl
d G
NP
(Th
e ar
ea o
f eac
h c
ou
ntr
y is
pro
po
rtio
nat
e to
its
shar
e o
f th
e w
ealt
h, 2
003)
Malt
a
Lux
Icelan
d
Belg
ium
Fran
ce
Switz
erlan
d
Neth
.
Form
erCz
ech.
Germ
any
Aust
ria
Hung
ary
Denm
ark
Norw
ay
Swed
en
Polan
d
Spain
Conf
eder
atio
n of
Inde
pend
ent
Stat
es(F
orm
er U
SSR)
Finlan
d
Chin
aRo
man
ia
Bulg
aria
Form
erYu
gosla
via
Gree
ceTu
rkey
Afgh
anist
an
Pakis
tan
Nepa
lBa
nglad
esh
Burm
a
Italy
Alba
nia
Mid
dle
East
Indi
aTh
ailan
dVi
etna
m
Hong
Ko
ng
Sri L
anka
Mala
ysia
Cypr
us
Sout
hKo
rea
Taiw
an
North
Kore
a
Japa
n
New
Zea
land Fij
iAu
stra
lia
Papu
a New
Gui
nea
Sing
apor
e
Brun
ei
Philip
ines
Portu
gal
Afric
a
Indo
nesia
Irelan
d
Unite
dKi
ngdo
mCa
nada
Unite
d St
ates
Cent
ral
Amer
ica
Sout
hAm
erica
Carib
bean

16 |
Although the number of people living in extremepoverty has declined rapidly, 1 billion, (or 16% of theworld’s population) still have access to an income ofless than $1 a day, the World Bank’s definition ofabsolute poverty. 2.6 billion people (40% of theworld’s population) live on less than $2 a day. Bycontrast, in 2005 the world’s richest 100 individualshad a combined wealth of $1042 billion, equivalentto the combined GNP of 45 of the world’s poorestcountries , which together make up some 2,000million people or 30% of the world’s population.
In 2006 the three wealthiest people in the worldwere:
• Bill Gates (USA), wealth $50 billion • Warren Buffet (USA), wealth $42 billion• Carlos Slim Helu (Mexico), wealth $30 billion
Their combined wealth of $122 billion compares withthe GDP of Argentina ($130 billion), population 38million. Carlos Helu’s fortune, $30 billion, would beenough to provide basic education and healthcare,adequate food, safe water and sanitation for all theworld’s people.
Five largest corporations 2006(by market value)
Company Country/Market Value $billion)
ExxonMobil (Oil & Gas) USA / 362.45
General Electric (Conglomerates) USA / 348.45
Citigroup (Banking) USA / 230.93
BP (Oil & Gas) UK / 225.93
Royal Dutch /Shell Group(Oil & Gas) Netherlands / 203.52
- Source: http://www.forbes.com
80:20 development in an unequal world
����
One of the engines of the world’s economicgrowth in the early twenty-first century isglobalisation, a process linked with increasingwealth as well as growing inequality, and a growthin the power of large corporations. For supportersof globalisation, this is a sign of successful wealthcreation within free markets; for critics, ascorporate power has grown, states’ own power todetermine their own development policies hasdeclined. Some corporations are wealthier thansmall and medium-sized states.
Wealth, poverty and inequality
Ours is a world of extremes. The poorest 40 percent ofthe world population account for five percent ofglobal income, while the richest ten percent accountfor 54 percent. Never before has the goal ofabolishing global poverty been within our reach:there are no longer any insurmountable technical,resource or logistical obstacles to achieving it. Yet,more than 800 million people suffer from hunger andmalnutrition, 1.1 billion people do not have access toclean drinking water and, every hour, 1,200 childrendie from preventable diseases.
- UN Development Report, 2006
One of the defining characteristics of the worldof the early twenty-first century is inequalitybetween nations. In spite of widespreadprogress in development, and growing wealthin the world economy, inequality has grownrather than diminished in the last fifty years.Overall, the income of people in the wealthiestthird of countries has increased much morerapidly than in the middle or lower thirds.
In 1960, the richest 20% of people shared 70% of theentire wealth of the planet between them, but by theyear 2000, this figure had increased to over 88%.
80:20 development in an unequal world | 17
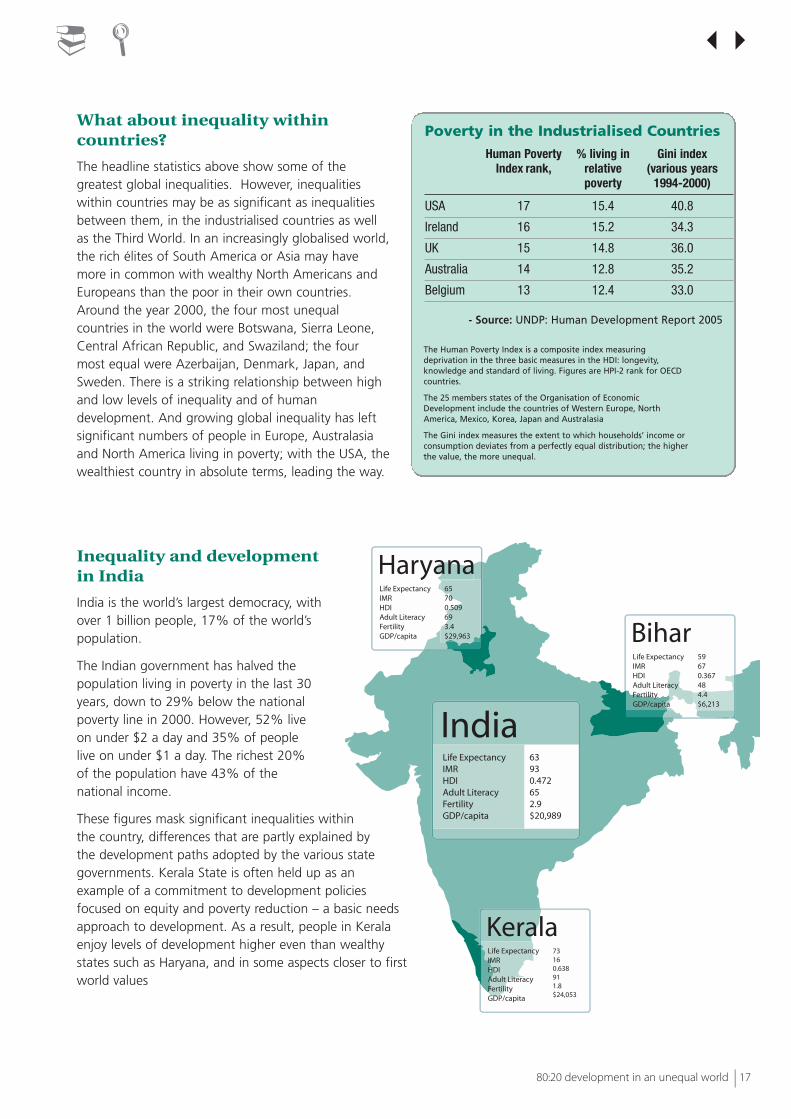
What about inequality withincountries?
The headline statistics above show some of thegreatest global inequalities. However, inequalitieswithin countries may be as significant as inequalitiesbetween them, in the industrialised countries as wellas the Third World. In an increasingly globalised world,the rich élites of South America or Asia may havemore in common with wealthy North Americans andEuropeans than the poor in their own countries.Around the year 2000, the four most unequalcountries in the world were Botswana, Sierra Leone,Central African Republic, and Swaziland; the fourmost equal were Azerbaijan, Denmark, Japan, andSweden. There is a striking relationship between highand low levels of inequality and of humandevelopment. And growing global inequality has leftsignificant numbers of people in Europe, Australasiaand North America living in poverty; with the USA, thewealthiest country in absolute terms, leading the way.
Inequality and developmentin India
India is the world’s largest democracy, withover 1 billion people, 17% of the world’spopulation.
The Indian government has halved thepopulation living in poverty in the last 30years, down to 29% below the nationalpoverty line in 2000. However, 52% liveon under $2 a day and 35% of peoplelive on under $1 a day. The richest 20%of the population have 43% of thenational income.
These figures mask significant inequalities withinthe country, differences that are partly explained bythe development paths adopted by the various stategovernments. Kerala State is often held up as anexample of a commitment to development policiesfocused on equity and poverty reduction – a basic needsapproach to development. As a result, people in Keralaenjoy levels of development higher even than wealthystates such as Haryana, and in some aspects closer to firstworld values
����
Poverty in the Industrialised Countries
Human Poverty % living in Gini indexIndex rank, relative (various years
poverty 1994-2000)
USA 17 15.4 40.8
Ireland 16 15.2 34.3
UK 15 14.8 36.0
Australia 14 12.8 35.2
Belgium 13 12.4 33.0
- Source: UNDP: Human Development Report 2005
The Human Poverty Index is a composite index measuringdeprivation in the three basic measures in the HDI: longevity,knowledge and standard of living. Figures are HPI-2 rank for OECDcountries.
The 25 members states of the Organisation of EconomicDevelopment include the countries of Western Europe, NorthAmerica, Mexico, Korea, Japan and Australasia
The Gini index measures the extent to which households’ income orconsumption deviates from a perfectly equal distribution; the higherthe value, the more unequal.
IndiaLife ExpectancyIMRHDIAdult LiteracyFertilityGDP/capita
63930.472652.9$20,989
KeralaLife ExpectancyIMRHDIAdult LiteracyFertilityGDP/capita
73160.638911.8$24,053
BiharLife ExpectancyIMRHDIAdult LiteracyFertilityGDP/capita
59670.367484.4$6,213
HaryanaLife ExpectancyIMRHDIAdult LiteracyFertilityGDP/capita
65700.509693.4$29,963

80:20 development in an unequal world18 |
����
Some Key Indicators of Progress
Life Expectancy Infant mortality Real GDP (years at birth) Per 1000 live births per capita PPP$
1960 2003 1960 2003 1960 2003
All developing countries 46 65 149 59 925 4,359
Least developed countries 39 52 170 97 592 1,328
Sub-Saharan Africa 40 46 165 104 934 1,856
Industrialised Countries Na 78 na 11 na 25,915
- Source: UNDP Human Development Reports 2001, 2005
The Third World’s Progress in the Basics
Life Expectancy: Under-five mortality: Average number of Net primary schoolyears from birth deaths per of children: births enrolment: percentage
1000 live births per woman of 6-11 year-olds
1960 46 1960 216 1960 6 1960 48
1970 53 1970 168 1970 5.7 1970 58
1980 58 1980 138 1980 4.4 1980 69
1990 62 1990 107 1990 3.8 1990 77
2000 65 2000 78 2000 2.9 2000 89
- Sources: World Bank, World Development Indicators 2006, UNDP Human Development Report 2005
But it’s also a world of progressand development
We are so accustomed to hearing the badnews about the Third World that we seldomhear – or listen to - the good news, news thatis important because it tells us what is alreadybeing achieved and what more could beachieved. For example, income poverty hasfallen faster in the past 50 years than in theprevious 50 decades; at the start of the 21st
century, the number of people deprived inother aspects of life declined to 1-2 billionfrom 2-3 billion 30 years ago.
The developing world has made such progress overthe last thirty years that the UN now classifies moreof the world as developed than undeveloped
The United Nations Development Programme in itsannual Human Development Report tries to redressthe balance. There are many signs of progress in thelast thirty years:
• a child born today in the developing worldcan expect to live twelve years longer thanone born in 1970
• eight in ten people have access to safe water,a five-fold increase
• average incomes have more than tripled, from$1,300 to $4,300.
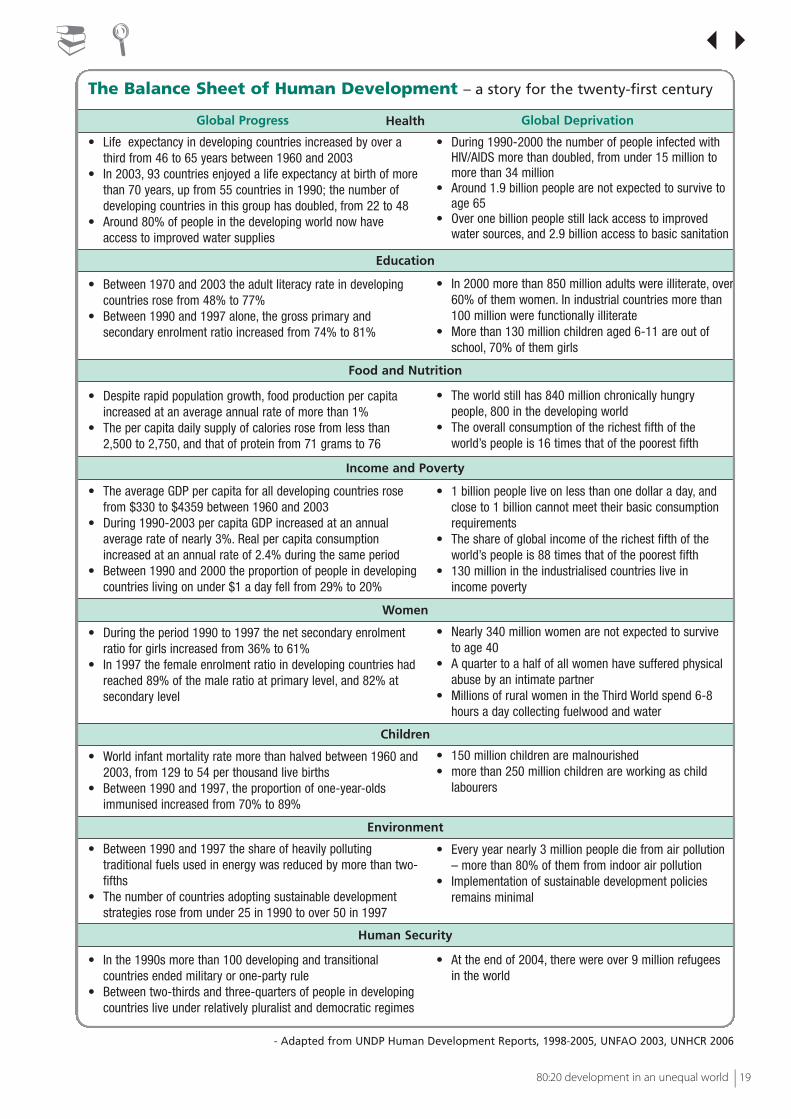
The Human Development Reports over the past fewyears have tried to summarise the situation throughBalance Sheets of Human Development. Below wehave summarised some of the information from avariety of reports; it includes much of the goodnews, while at the same time highlighting the issuesthat still need to be tackled.
80:20 development in an unequal world | 19
����
- Adapted from UNDP Human Development Reports, 1998-2005, UNFAO 2003, UNHCR 2006
The Balance Sheet of Human Development – a story for the twenty-first century
• During 1990-2000 the number of people infected withHIV/AIDS more than doubled, from under 15 million tomore than 34 million
• Around 1.9 billion people are not expected to survive toage 65
• Over one billion people still lack access to improvedwater sources, and 2.9 billion access to basic sanitation
• In 2000 more than 850 million adults were illiterate, over60% of them women. In industrial countries more than100 million were functionally illiterate
• More than 130 million children aged 6-11 are out ofschool, 70% of them girls
• The world still has 840 million chronically hungrypeople, 800 in the developing world
• The overall consumption of the richest fifth of theworld’s people is 16 times that of the poorest fifth
• 1 billion people live on less than one dollar a day, andclose to 1 billion cannot meet their basic consumptionrequirements
• The share of global income of the richest fifth of theworld’s people is 88 times that of the poorest fifth
• 130 million in the industrialised countries live inincome poverty
• Nearly 340 million women are not expected to surviveto age 40
• A quarter to a half of all women have suffered physicalabuse by an intimate partner
• Millions of rural women in the Third World spend 6-8hours a day collecting fuelwood and water
• 150 million children are malnourished• more than 250 million children are working as child
labourers
• Every year nearly 3 million people die from air pollution– more than 80% of them from indoor air pollution
• Implementation of sustainable development policiesremains minimal
• At the end of 2004, there were over 9 million refugeesin the world
Food and Nutrition
Health
Income and Poverty
Women
Children
Environment
Human Security
• Life expectancy in developing countries increased by over athird from 46 to 65 years between 1960 and 2003
• In 2003, 93 countries enjoyed a life expectancy at birth of morethan 70 years, up from 55 countries in 1990; the number ofdeveloping countries in this group has doubled, from 22 to 48
• Around 80% of people in the developing world now haveaccess to improved water supplies
• Between 1970 and 2003 the adult literacy rate in developingcountries rose from 48% to 77%
• Between 1990 and 1997 alone, the gross primary andsecondary enrolment ratio increased from 74% to 81%
• Despite rapid population growth, food production per capitaincreased at an average annual rate of more than 1%
• The per capita daily supply of calories rose from less than2,500 to 2,750, and that of protein from 71 grams to 76
• The average GDP per capita for all developing countries rosefrom $330 to $4359 between 1960 and 2003
• During 1990-2003 per capita GDP increased at an annualaverage rate of nearly 3%. Real per capita consumptionincreased at an annual rate of 2.4% during the same period
• Between 1990 and 2000 the proportion of people in developingcountries living on under $1 a day fell from 29% to 20%
• During the period 1990 to 1997 the net secondary enrolmentratio for girls increased from 36% to 61%
• In 1997 the female enrolment ratio in developing countries hadreached 89% of the male ratio at primary level, and 82% atsecondary level
• World infant mortality rate more than halved between 1960 and2003, from 129 to 54 per thousand live births
• Between 1990 and 1997, the proportion of one-year-oldsimmunised increased from 70% to 89%
• Between 1990 and 1997 the share of heavily pollutingtraditional fuels used in energy was reduced by more than two-fifths
• The number of countries adopting sustainable developmentstrategies rose from under 25 in 1990 to over 50 in 1997
• In the 1990s more than 100 developing and transitionalcountries ended military or one-party rule
• Between two-thirds and three-quarters of people in developingcountries live under relatively pluralist and democratic regimes
Global Progress Global Deprivation
Education

����
Progress in the sevendevelopment goals
The United Nations has set seven developmentgoals to reduce world poverty (see Chapter 14)
They are:
• Halve the proportion of people living inextreme poverty
• Enrol all children in primary school
• Make progress in gender equality andempowering women
• Reduce infant and child mortality by two-thirds
• Reduce maternal mortality ratios by three-quarters
• Provide access for all who need reproductivehealth services
• Implement national strategies for sustainabledevelopment to reverse the loss ofenvironmental resources.
Of special concern are the 1.1 billion people livingon less than $1 a day, and the additional 1.7billion people living on less than $2 a day (2005).The goals aim to commit the internationalcommunity to improve the quality of life for theworld’s most vulnerable people.
Uneven progress aroundthe world
However, in spite of significant advancesin development, progress is unevenaround the world. Progress has beenrapid in East Asia, as well as LatinAmerica and parts of the Middle East,but slower in parts of South Asia andsub-Saharan Africa. Since 1990, somecountries have actually experiencedreversals in human development. Theyare in parts of the former USSR, as aresult of economic stagnation followingthe collapse of communism, and incentral and southern Africa, due topolitical instability, the burden of debtand especially the HIV/AIDS pandemic.
-20
-15
-10
-5
0
5
10
15
20
Oman
Bolivia
Indonesia
Yemen
Honduras
UgandaBangladesh
Russian Federa
tion
Kazakhsta
n
Rwanda
Zambia
Zimbabwe
Percentage change in life expectancy, 1980-2004
Progress has been rapid in East Asia, aswell as Latin America and parts of theMiddle East, but slower in parts of SouthAsia and sub-Saharan Africa.
80:20 development in an unequal world | 21
����
19902003
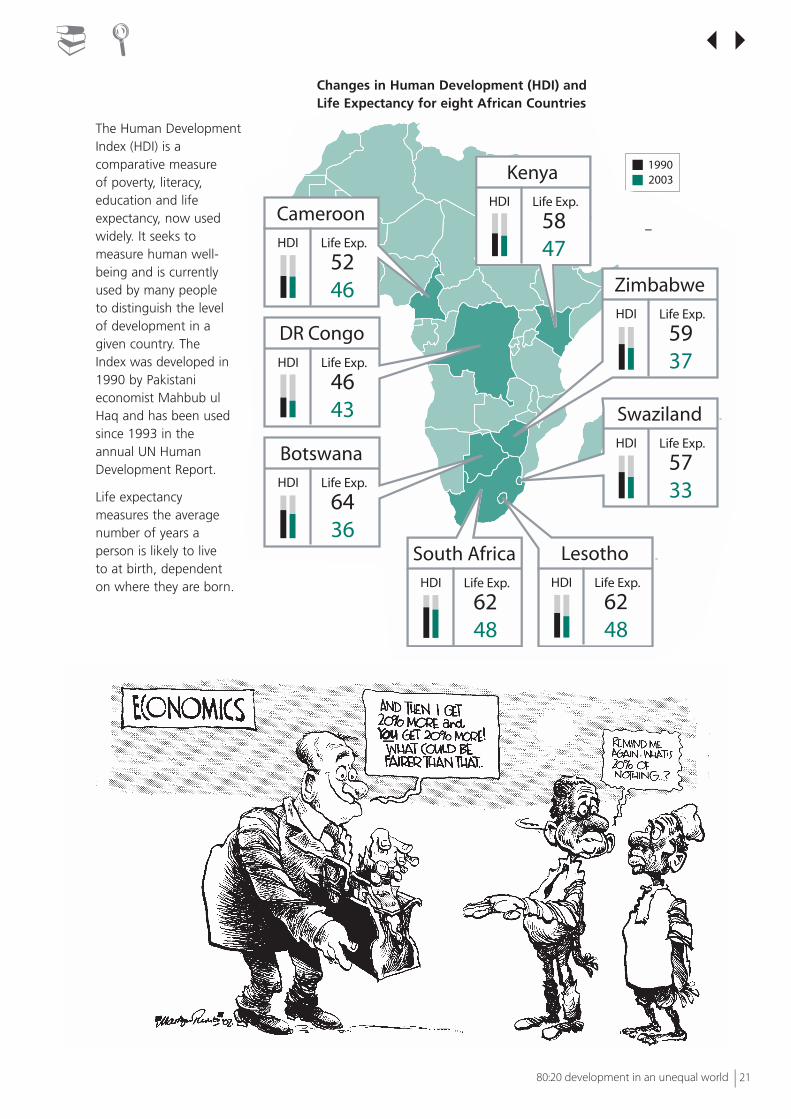
The Human DevelopmentIndex (HDI) is acomparative measureof poverty, literacy,education and lifeexpectancy, now usedwidely. It seeks tomeasure human well-being and is currentlyused by many peopleto distinguish the levelof development in agiven country. TheIndex was developed in1990 by Pakistanieconomist Mahbub ulHaq and has been usedsince 1993 in theannual UN HumanDevelopment Report.
Life expectancymeasures the averagenumber of years aperson is likely to liveto at birth, dependenton where they are born.
19902003
HDI Life Exp.
46 43
DR Congo
HDI Life Exp.
5246
Cameroon
HDI Life Exp.
6436
Botswana
HDI Life Exp.
5847
Kenya
HDI Life Exp.
6248
South AfricaHDI Life Exp.
6248
Lesotho
HDI Life Exp.
5937
Zimbabwe
HDI Life Exp.
5733
Swaziland
Changes in Human Development (HDI) and Life Expectancy for eight African Countries
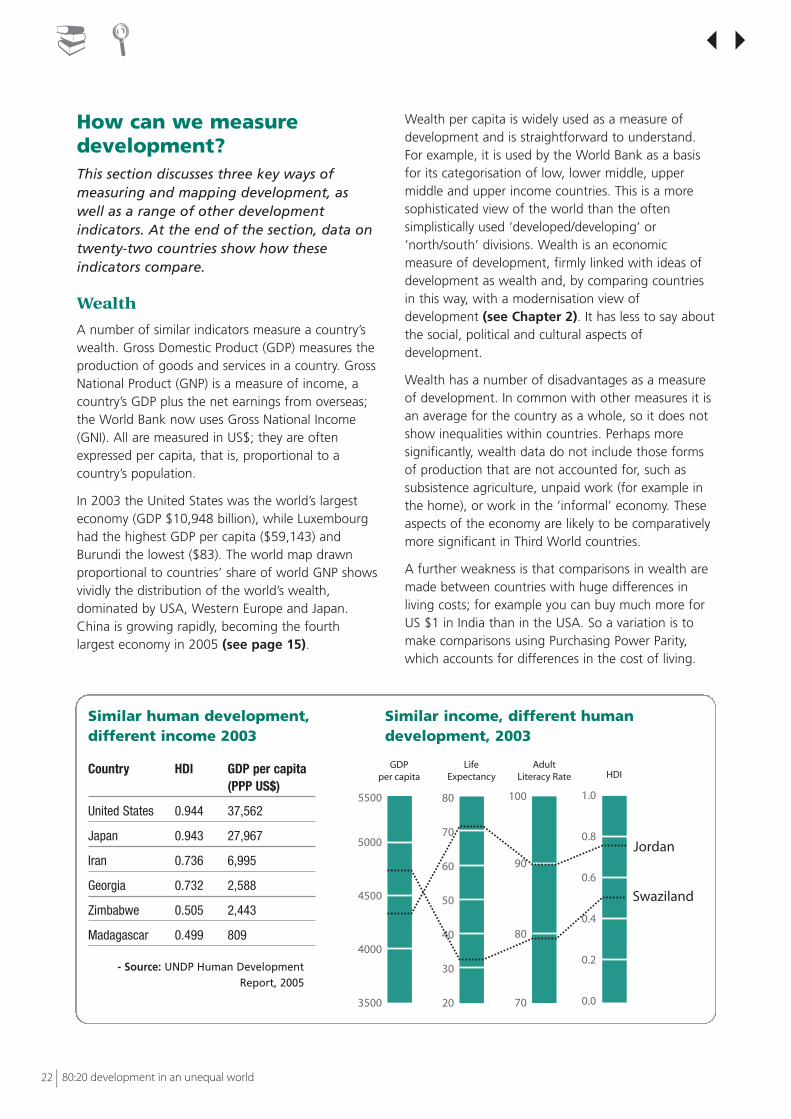
How can we measuredevelopment?This section discusses three key ways ofmeasuring and mapping development, aswell as a range of other developmentindicators. At the end of the section, data ontwenty-two countries show how theseindicators compare.
Wealth
A number of similar indicators measure a country’swealth. Gross Domestic Product (GDP) measures theproduction of goods and services in a country. GrossNational Product (GNP) is a measure of income, acountry’s GDP plus the net earnings from overseas;the World Bank now uses Gross National Income(GNI). All are measured in US$; they are oftenexpressed per capita, that is, proportional to acountry’s population.
In 2003 the United States was the world’s largesteconomy (GDP $10,948 billion), while Luxembourghad the highest GDP per capita ($59,143) andBurundi the lowest ($83). The world map drawnproportional to countries’ share of world GNP showsvividly the distribution of the world’s wealth,dominated by USA, Western Europe and Japan.China is growing rapidly, becoming the fourthlargest economy in 2005 (see page 15).
Wealth per capita is widely used as a measure ofdevelopment and is straightforward to understand.For example, it is used by the World Bank as a basisfor its categorisation of low, lower middle, uppermiddle and upper income countries. This is a moresophisticated view of the world than the oftensimplistically used ‘developed/developing’ or‘north/south’ divisions. Wealth is an economicmeasure of development, firmly linked with ideas ofdevelopment as wealth and, by comparing countriesin this way, with a modernisation view ofdevelopment (see Chapter 2). It has less to say aboutthe social, political and cultural aspects ofdevelopment.
Wealth has a number of disadvantages as a measureof development. In common with other measures it isan average for the country as a whole, so it does notshow inequalities within countries. Perhaps moresignificantly, wealth data do not include those formsof production that are not accounted for, such assubsistence agriculture, unpaid work (for example inthe home), or work in the ‘informal’ economy. Theseaspects of the economy are likely to be comparativelymore significant in Third World countries.
A further weakness is that comparisons in wealth aremade between countries with huge differences inliving costs; for example you can buy much more forUS $1 in India than in the USA. So a variation is tomake comparisons using Purchasing Power Parity,which accounts for differences in the cost of living.
80:20 development in an unequal world22 |
����
Similar human development,different income 2003
Country HDI GDP per capita (PPP US$)
United States 0.944 37,562
Japan 0.943 27,967
Iran 0.736 6,995
Georgia 0.732 2,588
Zimbabwe 0.505 2,443
Madagascar 0.499 809
- Source: UNDP Human DevelopmentReport, 2005
3500
4000
4500
5000
5500
20
30
40
50
60
70
80
70
80
90
100
0.0
0.2
0.4
0.6
0.8
1.0
Jordan
Swaziland
GDPper capita
LifeExpectancy
AdultLiteracy Rate HDI
Similar income, different humandevelopment, 2003

80:20 development in an unequal world | 23
Human Development
The Human Development Index (HDI) wasdevised by the United Nations DevelopmentProgramme and is now widely used as anindicator of human progress and quality oflife. It is based on a score derived from threemeasures: life expectancy, education (literacyand years of schooling) and income(purchasing power in parity dollars). As HDIincludes both social and economic aspects, itis considered by many to embrace a broaderview of development than measures based onwealth: HDI is focused on people and theirneeds, and so is linked with views ofdevelopment focused on social justice. UNDPuses HDI to categorise the world into high,medium and low human development.
A world map of HDI (page 24) shows,unsurprisingly, high HDI values in WesternEurope, North America and Australasia, andlow human development in much of Africa.However, parts of Central and South America,the Caribbean, the Middle East, and East andSouth-East Asia also have high HDI scores. In2003 Norway had the highest HDI score(0.963), and Niger the lowest (0.281).
As with other measures, a high HDI score fora country as a whole may conceal greatinternal inequalities in welfare. HDI is alsouseful when it is tracked over time to showprogress in development, or in some cases,reversals.
Although in general the wealthiest countrieshave the highest levels of human development,there is not always a straightforward linkbetween wealth and high HDI. Some countrieshave a relatively high HDI but lower GDP, forexample some republics of the former USSR,suggesting a priority for social developmentthere. Others, especially in Southern Africa andthe Middle East, have a high GNP but relativelylower HDI. In 2003 Cuba and Tajikistan had thegreatest positive difference between HDI andGDP per capita whilst Botswana and EquatorialGuinea the greatest negative differences.
����
Comparison of world rankings for HDIand GDP (PPP US$) 2003
HDI better HDI worsethan expected than expected
(>30 ranks) (>30 ranks) Difference
Cuba 40 Oman -30
Tajikistan 36 Saudi Arabia -33
Kyrgyzstan 33 Angola -34
Moldova 33 Gabon -43
Uzbekistan 32 Namibia -44
Albania 30 Swaziland -47
Ecuador 30 South Africa -68
Botswana -70
Equatorial Guinea -93
Progress in HDI
1960 1970 1980 2003 Absolute increaseHDI value
in 1960-2003
All developing countries 0.260 0.347 0.428 0.694 0.434
Least developed countries 0.165 0.209 0.251 0.518 0.353
Industrialised countries/OECD 0.799 0.859 0.889 0.892 0.093
World 0.392 0.460 0.519 0.741 0.349

Under-Five Mortality
This measures the number of children perthousand born who die before their fifthbirthday; it is similar to the Infant MortalityRate (IMR) which measures the proportion ofchildren who die before their first birthday.UNICEF argues that Under-Five (or child)Mortality (U5M) is a key measure because itindicates the end result of the developmentprocess, as it affects the welfare of children. It is a useful indicator of a population’s healthand nutritional status, and of social progress
through health-care and educationalprogrammes; high infant and under-fivemortality also correlate closely with high adultmortality and low life-expectancy. It is ameasure founded in a basic needs approachto development. In 2004, Singapore had thelowest under-five mortality rates (3 per 1000)and Sierra Leone the highest (283 per 1000).
80:20 development in an unequal world24 |
����
KEY
Percentage shares of world population
1960 1975 2003 2015 est.
High human development 16.4 22.4 19.2 17.9
Medium human development 11.0 67.0 66.6 65.8
Low human development 72.6 10.6 12.5 14.4
Human Development Index World Map 2003
80:20 development in an unequal world | 25
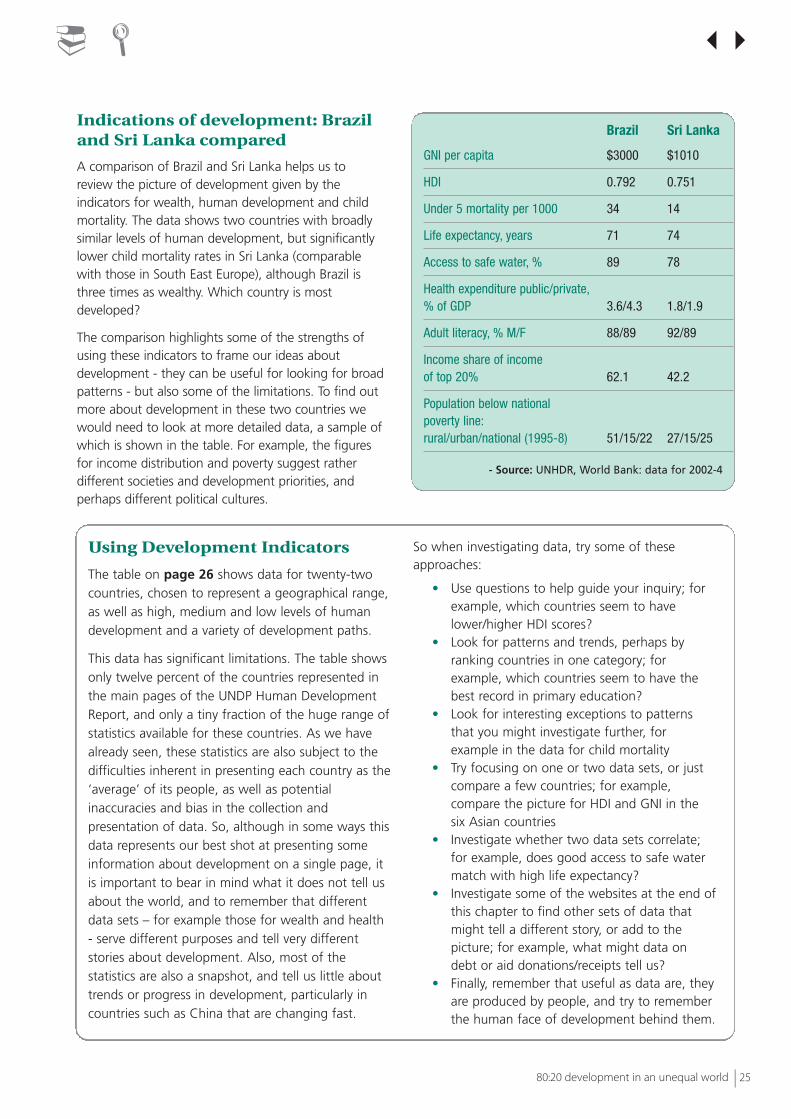
Indications of development: Braziland Sri Lanka compared
A comparison of Brazil and Sri Lanka helps us toreview the picture of development given by theindicators for wealth, human development and childmortality. The data shows two countries with broadlysimilar levels of human development, but significantlylower child mortality rates in Sri Lanka (comparablewith those in South East Europe), although Brazil isthree times as wealthy. Which country is mostdeveloped?
The comparison highlights some of the strengths ofusing these indicators to frame our ideas aboutdevelopment - they can be useful for looking for broadpatterns - but also some of the limitations. To find outmore about development in these two countries wewould need to look at more detailed data, a sample ofwhich is shown in the table. For example, the figuresfor income distribution and poverty suggest ratherdifferent societies and development priorities, andperhaps different political cultures.
Using Development Indicators
The table on page 26 shows data for twenty-twocountries, chosen to represent a geographical range,as well as high, medium and low levels of humandevelopment and a variety of development paths.
This data has significant limitations. The table showsonly twelve percent of the countries represented inthe main pages of the UNDP Human DevelopmentReport, and only a tiny fraction of the huge range ofstatistics available for these countries. As we havealready seen, these statistics are also subject to thedifficulties inherent in presenting each country as the‘average’ of its people, as well as potentialinaccuracies and bias in the collection andpresentation of data. So, although in some ways thisdata represents our best shot at presenting someinformation about development on a single page, itis important to bear in mind what it does not tell usabout the world, and to remember that differentdata sets – for example those for wealth and health- serve different purposes and tell very differentstories about development. Also, most of thestatistics are also a snapshot, and tell us little abouttrends or progress in development, particularly incountries such as China that are changing fast.
����
Brazil Sri Lanka
GNI per capita $3000 $1010
HDI 0.792 0.751
Under 5 mortality per 1000 34 14
Life expectancy, years 71 74
Access to safe water, % 89 78
Health expenditure public/private,% of GDP 3.6/4.3 1.8/1.9
Adult literacy, % M/F 88/89 92/89
Income share of income of top 20% 62.1 42.2
Population below nationalpoverty line:rural/urban/national (1995-8) 51/15/22 27/15/25
- Source: UNHDR, World Bank: data for 2002-4
So when investigating data, try some of theseapproaches:
• Use questions to help guide your inquiry; forexample, which countries seem to havelower/higher HDI scores?
• Look for patterns and trends, perhaps byranking countries in one category; forexample, which countries seem to have thebest record in primary education?
• Look for interesting exceptions to patternsthat you might investigate further, forexample in the data for child mortality
• Try focusing on one or two data sets, or justcompare a few countries; for example,compare the picture for HDI and GNI in thesix Asian countries
• Investigate whether two data sets correlate;for example, does good access to safe watermatch with high life expectancy?
• Investigate some of the websites at the end ofthis chapter to find other sets of data thatmight tell a different story, or add to thepicture; for example, what might data ondebt or aid donations/receipts tell us?
• Finally, remember that useful as data are, theyare produced by people, and try to rememberthe human face of development behind them.

80:20 development in an unequal world26 |
����
USA
0.94
412
,169
41,4
4077
0.9
8-
9710
020
.2
Cu
ba
0.81
7-
-77
0.1
793
/92
8891
2.1
Jam
aica
0.73
89
3,30
071
0.3
2084
/89
8893
4.1
Bra
zil
0.79
255
23,
000
711.
134
110/
111
9689
1.8
Ch
ile0.
854
845,
220
780.
98
98/9
756
953.
6
Egyp
t0.
659
911,
250
701.
736
95/9
130
982.
1
Sier
ra L
eon
e0.
298
121
041
2.3
283
-54
570.
1
Gh
ana
0.52
08
380
571.
811
265
/67
7479
0.4
Ken
ya0.
474
1648
048
2.5
120
90/8
982
620.
2
Sou
th A
fric
a0.
658
165
3,63
045
0.3
6794
/98
-87
7.6
No
rway
0.96
323
851
,810
800.
54
102/
103
-10
013
.9
UK
0.93
92,
013
33,6
3079
0.3
6-
--
9.2
Irel
and
0.94
614
034
,310
781.
26
101/
100
--
11.0
Spai
n0.
928
919
21,5
3080
0.2
5-
99-
7.4
Ru
ssia
n F
eder
atio
n0.
795
489
3,40
065
0.5
21-
6196
9.8
Ind
ia0.
602
673
620
631.
385
88/7
941
861.
2
Ban
gla
des
h0.
520
6144
063
1.6
149
70/7
592
750.
3
Thai
lan
d0.
778
158
2,49
071
0.7
21-
9085
3.7
Vie
tnam
0.70
445
540
701.
523
104/
9891
730.
8
Ch
ina
0.75
51,
938
1,50
071
0.6
3199
/100
-77
2.7
Jap
an0.
943
4,73
437
,050
82-0
.14
--
100
9.4
Au
stra
lia0.
955
544
37,0
7080
0.9
610
0/10
0-
100
18.1
Wo
rld
0.74
140
,282
6,32
967
1.1
79-
6782
3.9
- So
urce
s:U
ND
P H
uman
Dev
elop
men
t Re
port
200
5, W
orld
Ban
k W
orld
Dev
elop
men
t In
dica
tors
200
6
Carb
on
diox
ide
prod
uctio
npe
r ca
pita
(tonn
es)
2002
Hum
anDe
velo
pmen
tIn
dex
(HDI
) val
ue,
2003
Coun
try
GNI
billi
on
($US
) 200
4
GNI p
erca
pita
,($
US)
2004
Life
expe
ctan
cy
at b
irth
(yea
rs) 2
004
Unde
r 5
mor
talit
y (p
er 1
000
live
birt
hs)
2004
Prim
ary
scho
olco
mpl
etio
nra
te (%
)M
ale/
Fem
ale,
2004
Adul
t lit
erac
y %
2003
Acce
ss to
an
impr
oved
wat
er s
uppl
y(%
) 200
2
Popu
latio
ngr
owth
rat
e(%
) 20
04-2
020
Qu
alit
y o
flif
eW
ealt
hPo
pu
lati
on
Edu
cati
on
Envi
ron
men
t

80:20 development in an unequal world | 27
Caution with data
The word ‘data’ must be treated with caution.Literally translated, it means ‘things that are given’.Classical scholarship must, however, be rejected: thenumbers that present themselves to us are not givennaturally in that form. Any particular batch ofnumbers has been fashioned by the human hand; itdid not drop from the sky ready made … Data, inshort, is produced, not given.
- Catherine Marsh, Exploring data
Throughout this chapter – and this book – youwill find measures of various things: poverty,literacy rates, infant mortality rates, etc. For eachyou should ask, not just ‘how many?’, but also‘how is it being measured?’. In each case youwill find that the figures provided are the resultof a decision someone has made as to how tomeasure something. Not only are there differentways of measuring things, there are differentways of presenting data, selected by people totell a particular story. This does not mean thatstatistics lie, just that statistics never speak forthemselves.
For example, the data in the table on page 10has been selected to tell some of the story ofprogress in development, as well as some ofthose aspects of development where much workremains to be done. The data was included as itunderpinned one of the key messages of thispublication, to show that there is much goodnews about development; it was sourced(selectively) from UNDP an organisation withsimilar aims.
Compare too the optimistic message givenabout improvements in peoples’ wealth fromthis source (‘the average GDP per capita for alldeveloping countries rose from $330 to $4359between 1960 and 2003’) with the messagefrom the graph on page 281. Although themeasure is the same and the timescale similar,the agencies collecting the data are different;crucially, comparative data for GDP growth inwealthy countries is included in the World Bank’sgraph, so the extended scale makes GDP growthfor the middle and lower third of countriesappear relatively insignificant.
Think about what life might be like in thesecountries, then work out which they are:
Country X• People in country X live about as long as
they do in Ireland• The population is growing more slowly than
in Ireland• Child mortality is slightly higher than in
Ireland• People’s income is less than a sixth of the
average in Ireland• On average, people produce about a third
the carbon-dioxide as in Ireland.
Country Y• People in country Y live about as long as
they do in Ireland• Child mortality is slightly higher than in
Ireland• On average, people’s income in this country
is about a quarter as much again as inIreland
• The population is growing more slowly thanin Ireland
• People in this country produce more carbondioxide than in Ireland.
• Find the two most similar high incomecountries in terms of development
• Find the two most similar medium or lowincome countries in terms of development.
����
Modern day consumer based development,Beijing, China.
80:20 development in an unequal world28 |
����
Statistical Sources All are available annually.
■ Food and Agriculture Organisation of the United Nations, UN FAO Yearbook
■ Instituto del Tercer Mundo, Montevideo, Third World Guide
■ New Internationalist, The World Guide: an alternative reference to the countries of ourplanet, New Internationalist Publications, Oxford
■ UNESCO Statistical Yearbook
■ UNICEF, The State of the World’s Children, Oxford University Press, Oxford
■ United Nations Development Programme, Human Development Report, Oxford UniversityPress, Oxford
■ United Nations, United Nations Statistical Year Book
■ World Bank, World Development Report
■ World Health Organisation, World Health Statistics Annual
See:
■ Development Gateway: http://developmentgateway.org/
■ Forbes Magazine richlist: http://www.forbes.com/
■ OECD site (summary of progress in development): www.oecd.org/dac/indicators
■ Social Watch (based in Uruguay): www.socwatch.org.uy/
■ The World Gazetteer (country data): www.world-gazetteer.com/home.htm
■ UN FAO: www.fao.org/
■ UNDP: http://hdr.undp.org/
■ UNESCO: http://unescostat.unesco.org/
■ UNICEF: http://www.unicef.org/statis/
■ United Nations Cyber School Bus: http://www.un.org/Pubs/cyberschoolbus/
■ United Nations Environment Programme http://www.grid.unep.ch/
■ UN Statistics Division - Milleninium Indicators:http://millenniumindicators.un.org/unsd/mdg/default.aspx
■ World Bank: http://www.worldbank.org
■ World Health Organisation: http://www.who.int
■ Worldmapper (thematic world maps) http://www.sasi.group.shef.ac.uk/worldmapper/
■ World Resources Institute (environmental information) http://earthtrends.wri.org
Reading
■ Allen, T. and Thomas, A (2000) Poverty and Development: into the 21st Century, Oxford,Oxford University Press with the Open University
■ Smith, D. (1999) The State of the World Atlas, Harmondsworth, Penguin Books Ltd.
■ Thomas, A. and Crow, B. (1994) The Third World Atlas, Oxford, Oxford University Press
■ J. Seabrook (2003), The No-Nonsense Guide to World Poverty, London, New Internationalistand Verso
■ Maggie Black (2002) The No-Nonsense Guide to International Development, London, NewInternationalist and Verso
■ Amartya Sen (1999) Development as Freedom, Oxford University Press