Embed Size (px)
Citation preview
1
CHAPTER 1
FERTILITY AND PARTNERSHIP IN EUROPE: THE ROLE OF COUNTRY-SPECIFIC INSTITUTIONS AND POLICIES
Erik Klijzing* and Martine Corijn**
* University of Bielefeld, Bielefeld (Germany) ** Populations Activities Unit, UNECE, Geneva (Switzerland)
A. INTRODUCTION The last four decades have witnessed profound changes in reproductive and partnership behaviour in Europe and North America. Following the post-war baby boom, period fertility rates have descended to sub-replacement levels in all but a few of these countries. In western, northern and southern Europe and in North America the decline occurred after the middle of the 1960s. In central and eastern Europe, it was by and large confined to the period after the late 1980s. The fertility rates are currently scattered across a wide spectrum. At one end, they are at levels, which, if maintained, could nearly ensure replacement of generations. At the other, they are at unprecedentedly low levels – if they persist, barely one half of generations will be replaced. The lowest rates currently prevail in southern, central and eastern Europe.
There were other manifestations of
the rapidly changing reproductive behaviour. These, however, did not spread across the entire region. Extramarital childbearing rose in a number of west and north European countries and in North America to levels that by contemporary standards are deemed intermediate to high. In southern Europe, out-of-wedlock childbearing, however, still remains very
rare. In central and eastern Europe similar developments occurred, but only after a time lag. Another noted trend was the postponement of the onset of entry into parenthood. This was led by the countries that were forerunners in the movement towards sub-replacement fertility. At present, in a number of them, the age at first birth among women is in the late twenties. The easternmost countries of the region are lagging far behind the trend. Some of them have seen a shift towards later entry into motherhood, but only in the last few years. The spread of voluntary childlessness, another salient development, took on major proportions only in a minority of European and North American societies. In those that have emerged as trendsetters, about one in five women who have recently completed childbearing have no children.
Attendant shifts in partnership
behaviour have been equally momentous. In western countries, the post-war pattern of relatively early and almost universal marriage began to wane by the middle of the 1960s. A decline in period first marriage rates ensued, and this typically occurred in tandem with the drop in fertility rates. Similar developments took place in eastern countries, however, only after a 25-year lag. The marriage rates happen to be among the lowest in some of these
2 FERTILITY AND PARTNERSHIP IN EUROPE
countries. If they were to persist, the result would be that only about one half of women would ever get married. An equally noted development has been a trend towards an increasingly later entry into marriage. In the countries that set this new trend, the mean age of women at first marriage recently approached 30. As with the later entry into motherhood, some of the easternmost European countries saw a postponement of marriage only recently. At the same time, divorce and remarriage have increased, however, earlier in the eastern countries than elsewhere.
As the attraction of relatively early,
universal and stable marriage waned, non-marital cohabitation spread, but this has not occurred everywhere. In northern Europe, parts of western Europe and in North America, non-marital cohabitation increasingly became popular. It often fully replaced marriage, resulting in no perceptible decline in the prevalence of younger people living together, no matter whether in marital or consensual unions. In contrast to this, in southern Europe the decline in marriage was not accompanied by a rise in non-marital cohabitation, which remains rare. In these countries, young people postponing or foregoing marriage typically continue to co-reside with parents. Elsewhere in Europe, especially after around 1990, non-marital cohabitation began to spread. Its prevalence grew very rapidly in some of these societies. However, it remains rare in parts of eastern Europe. Consensual unions are more prone than marriages to dissolve. This may be in large part due to the fact that the former require a lesser degree of commitment than the latter.
The shifts to new forms of
reproductive and partnership behaviour have been interacting, however, in different ways. For example, in northern Europe and parts of western Europe, the spread of non-marital cohabitation and non-marital childbearing were part and parcel of the same process. Younger people increasingly found it preferable to cohabit rather than to marry and have children, particularly the first child, in consensual unions rather than
after marrying. In southern Europe, neither non-marital cohabitation nor non-marital childbearing is an option for a vast majority. In parts of western Europe, where it is relatively widespread, non-marital cohabitation for many is still not a family environment within which to have a child. Central Europe and the Baltic area of eastern Europe mirror this variety of ways in which non-marital cohabitation and non-marital childbearing are combined. For the rest of the eastern European countries, the knowledge on the relationship between the two is lacking.
The behavioural changes in
question have left and continue to leave a lasting mark on populations and families. Largely as a result of the historical and recent declines in fertility, the populations of today are older than they have ever been. Multigenerational families are typically smaller and consist by and large of four generations of kin. Each subsequent generation has fewer members than the preceding one. As a consequence, the structure of this family by age or generation is increasingly top-heavy. Due to the recent spread of the new forms of partnership and reproductive behaviour, relationships among family members are growing complex. In a number of instances, these developments are closely watched by governments with the view to modify policies and programmes in order to better respond to the population and family changes in question. Rarely, however, governments nowadays design programmes and policies in order to influence partnership and reproductive behaviour and, by implications, the resultant population and family changes.
As the new developments in the reproductive and partnership behaviour were unfolding in western countries, demographers and scholars in other social sciences fields took up the challenge of documenting and explaining them. Among others, Becker (1981) and his followers formulated and tested the “new home economics” theory in an effort to explain evolving patterns of childbearing and marriage, particularly in the USA. Easterlin
THE ROLE OF COUNTRY-SPECIFIC INSTITUTIONS AND POLICIES 3
and Crimmins (1991) hypothesised that it was the growing relative economic deprivation that occasioned the American post-baby boom fertility decline. Lesthaeghe and van de Kaa (1986) and van de Kaa (1987) attributed complex shifts in the reproductive and partnership behaviour under way in western Europe to ideational changes. Many of these and related works sought empirical support for the hypotheses that they advanced in aggregate-level data. Individual-level survey data required for testing the new theories and hypotheses were by and large non-existent. The starting point of the originators of the Fertility and Family Surveys was the premise that documenting and explaining partnership and reproductive behaviour of individuals and couples ought to be grounded in specially tailored surveys. Their view was that the partnership and reproductive careers of individuals are interrelated, as well as that they are intertwined with educational, work and other life-course careers.i Therefore, they further reasoned, the surveys ought to provide rich data on key event histories, in particular those pertaining to childbearing, partnership, education and work. This became the rationale for placing the focus in the FFS on the collection of retrospective data for these four event histories. The gathering of these data was, therefore, strongly recommended by the FFS project. Other event histories, in particular the migration and contraception histories were deemed of secondary importance and collecting data for the two was made optional.
Other data, the collection of which also was strongly recommended in the FFS included, inter alia, information on the respondent’s household and parental home, pregnancies that did not result in live births, contraceptive use, views on having children and data on partner’s characteristics. These data were a mixture of retrospective and current-status information, combined with very limited information on expectations regarding future events, births in particular. Optional was the collection of data on other
relevant views as well as selected values and beliefs.ii
One of the key FFS objectives was
the collection of comparable data for a large group of countries. Although this aim could not be fully attained, the FFS provided a basis for comparative research without a precedent in survey-based demographic analyses in Europe and North America. The research to which the FFS data gave rise moved along two tracks. On the one hand it led to 22 country reports prepared in accordance with an agreed-upon template (United Nations, 1996-2002). These reports provide a wealth of comparative data and analyses. On the other the research resulted in numerous cross-country comparative papers, which stemmed from some 100 comparative research projects proposed in response to a call for requests for use of FFS individual-level data. A number of these comparative studies have been prepared as solicited or spontaneous contributions for the FFS Flagship Conference.
This volume, along with its
companion volume, includes papers presented at the FFS Flagship Conference (see Annex for the Final Programme). In particular, this volume provides a selection of the spontaneous contributions to the Conference. The chapters based on those contributions are initially overviewed in the second section of this chapter. Then, implications and lessons stemming from the research presented in these contributions for future data collection and research are considered in the third and last section.
B. STRUCTURE OF THIS VOLUME
The papers contributed to the different sessions of the FFS Flagship Conference and selected for this volume provide a wide range of insights in the dynamics of fertility and partnership behaviour, mainly based on comparative research. They can be arranged around four main themes. Part 1 contains five chapters dealing with the determinants of events from the partnership and fertility career, and similarly takes into
4 FERTILITY AND PARTNERSHIP IN EUROPE
account that partnership and fertility behaviour are interdependent processes. This last issue was developed extensively also in Volume I by Pinnelli et al. Part 2 contains two chapters that explore in a prospective and cross-sectional way the link between fertility expectations and fertility behaviour. Part 3 deals with specific issues of comparability and quality of FFS data, a topic that was dealt with in detail in the contribution of Festy and Prioux in Volume I. One chapter in part 3 deals with data quality at the level of item non-response; the other examines the validity of a particular variable. Part 4 of this volume brings together three chapters that focus on living arrangements and on family strategies. Moreover, all these chapters contain several, but quite convergent, lessons to be learned from the FFS project.
In terms of comparative scope,
most of the authors of the substantive chapters in parts 1, 2 and 4 have abstained from sweeping comparisons. The maximum number of countries compared is nine, the minimum is one, whereas the modus is two. This modest scope probably reflects the difficulty of doing good comparative research, which requires - apart from the availability of comparable data for all countries of interest - intimate knowledge not only of all data sets to be compared, but also of the role of institutional characteristics in each country included. That may sometimes require a change of hats, from a demographer’s to a sociologist’s, an economist’s, or a political scientist’s. Although demography likes to consider itself an interdisciplinary branch of social science, this ability to swap hats does not always come naturally and smoothly. Not surprisingly, therefore, comparative studies on substantive issues are often co-authored.
The authors of the substantive
chapters in this volume had to carry the double burden of going through technically complex data manipulations and at the same time of arriving at interpretations of the results that make sense in the light of existing knowledge about institutional
constraints and opportunities. And indeed, if there is one theme that binds their chapters together it is that differences between countries in institutions such as the labour market, the family and welfare state arrangements matter. That insight is relatively new, at least in demography, and as such each of these chapters may be said to add in one way or another to our contemporary understanding of demographic reality.
As said before, part 1 deals with
the determinants of particular events of the partnership and fertility career: leaving the parental home, first birth, third birth, disruption of first parental union and childbearing in stepfamilies. All five chapters in part 1 make use of FFS data.
In chapter 2, Billari et al. focus on
Italy and Spain, two countries that have a “latest late” pattern of leaving home, with a high degree of overlap between departure from the parental home and first union formation, being very often first marriage. The authors analyse leaving home and first union formation as interdependent processes by means of multiple destination event history models. Transitions studied are those towards residential autonomy, a patrilocal union, a neolocal cohabitation and a neolocal marriage. Cohort dynamics by destination are analysed. Educational and working careers are introduced as determinants. Finally, the impact of pre-union conceptions is examined. Results can be interpreted in the light of the institutional context so typical of these two Mediterranean countries. That is, because of great difficulties to enter the labour market for the first time, youth unemployment rates are quite high, thus forcing young adults to remain with their parents and to rely to a large extent on the resources of their parents. This behavioural pattern is also facilitated by the long tradition of strong and pervasive family and kinship ties. Public welfare support for the unemployed is still rather underdeveloped. In spite of these and other institutional similarities between the two countries, the authors still find interesting differences, particularly between men and women.
THE ROLE OF COUNTRY-SPECIFIC INSTITUTIONS AND POLICIES 5
In chapter 3, Billari and Kohler analyse the changing impact of union formation on the transition to parenthood in two countries that are strikingly different in these two respects, namely, formerly West Germany and Italy. They first draw attention to overall cohort patterns in first union formation and childbearing and describe the mutual relationships between first union formation, marriage and childbearing. On the basis of event history models they then evaluate the impact of union formation behaviour on the transition to parenthood. In particular, they test the hypothesis that the impact of union status has been changing across cohorts and investigate whether the spread of non-marital childbearing is gaining momentum, as one would expect from a Second Demographic Transition perspective. The findings from their analyses allow them to make a first assessment of whether there is a convergence or divergence of demographic behaviour across cohorts. Their assessment is that even allowing for important north-south differentials within each of the two countries, there is a clear persistence of highly specific patterns between them. The resulting absence of a clear convergence towards uniform patterns is due in part at least to what they call the path dependence of several institutional features and cultural traits.
In chapter 4, Corman compares
France and Sweden in terms of existing family policies and work arrangements in an attempt to explain how differences in these two institutional features may influence the decision of couples with two children to go for a third child or not. The progression ratio from parity two to three is generally much higher in France than in Sweden, although this may vary with the level of education. The author attributes this differential among other things to the fact that France would have a pronatalist family policy, which systematically focuses on supporting the arrival of a third child. By contrast, Swedish family policies would be characterised by an emphasis on the equal rights of all children rather than by measures aimed at a particular birth order. However, with part-time work for them
being frequently synonymous with job insecurity, many French women work in full-time jobs, which they then quit when having three or more children. The ample supply of part-time jobs in Sweden, on the other hand, allows many working mothers to stay employed. The combination of parenthood and professional life is also facilitated by other features of the institutional setting in Sweden, such as the ability to transform a part-time position into a full-time one or vice versa, restrictions on working overtime among men, better parental leave arrangements and childcare services.
In chapter 5, Oláh studies the
impact of public policies and changing gender relations on union dissolution among families with children (“parental unions”) in Sweden and Hungary, from the mid-1960s to the early 1990s. Because of the many similarities (high female labour force participation, generous state support for families, long history of rather liberal divorce legislation) but also dissimilarities (women working part-time versus full-time, non-marital versus marital cohabitation and childbearing) in the institutional context, these two countries provide an ideal laboratory to study the impact of these factors. The results suggest that changes in divorce legislation in either a liberal or a restrictive direction had little effect on parents’ union disruption risks, although the introduction of joint custody for children in Sweden greatly accelerated family dissolution. Furthermore, gender role equality between the partners tends to promote family stability, at least in Sweden. Finally, there are clear gender differences in the patterns of family dissolution risks. For instance, part-time employed Swedish and Hungarian men face high dissolution risks, whereas part-time employed women face lower ones. Apparently, then, labour market strategies are still to some extent gendered, even in countries such as Sweden where the dual-earner family model is well established.
In chapter 6, Thomson et al.
investigate the effects of step and shared children on subsequent births among
6 FERTILITY AND PARTNERSHIP IN EUROPE
cohabiting and married couples in Austria, Finland, France and (West) Germany. In particular, they test three hypotheses concerning the value of shared children: (i) children are symbols of the partners’ commitment to the relationship; (ii) the first child confers parental status; and, (iii) the second child ensures that each has a sibling. In all four countries they find support for the value of a first shared child to signal the couple’s commitment: birth risks are significantly higher when the couple has no shared children yet - net of their total parity (hers plus his) - than when they have at least one child together already. The authors also find support for the value of a second shared birth providing a full sibling to the first child. That is, stepfamily couples with one shared child have a higher subsequent birth risk than couples whose shared parity equals the stepfamily’s combined parity. Unexpectedly, and contrary to the value of a first birth to establish parental value, couples in which one of the partners was not a parent before the new union have lower birth risks than those in which both partners had children already. There is no direct evidence that countries’ social welfare or gender regimes moderate these effects of step or shared children on subsequent birth risks.
Part 2 deals with how fertility
expectations are realised. One chapter does this by following the behavioural childbearing realisations of women in the years subsequent to their expression of their expectations. The other one does this by analysing discrepancies between expectations and realisations among women at the end of their reproductive career. Both chapters combine FFS data with other data sources, respectively register data and data on family policies.
In chapter 7, Noack and Østby
adopt a novel approach by using data from the Norwegian Central Population Register to follow-up on young women interviewed in 1977 and 1988 about their expected number of children in the future, regarding the number of children actually achieved 5, 11 and 22 years later. In substantive terms they show that women with negative fertility
expectations - no (more) children - are generally quite trustworthy, whereas women with positive fertility expectations – at least one (more) child - mostly tend to get fewer children than expected. Concerning the former outcome, if negative expectations remain constant over the life course, it is of course mostly a matter of using effective contraception. In the case of positive expectations remaining constant, however, the authors suggest that persons may be overestimating their ability to fulfil their choices. The necessity of making rational choices, the authors say, is embedded in a development towards ever greater uncertainty. A more flexible labour market, for instance, and fundamental changes in the gender division of labour may be important parts of this development. But there is of course also the fact that ceasing to use contraception is no guarantee for conception, certainly not in a society where childbearing takes place at ever later ages. Finally, erstwhile positive fertility expectations may change if partner relationships change, another hallmark of contemporary society.
In chapter 8, Van Peer observes
how during the last few decades Western Europe as well many other industrialised regions of the world have experienced a fertility decline, in general to levels well below replacement. This decline is assumed to be partly attributable to a general desire for smaller families. However, some women continue to actually have three or even more children. Also the number of children on average desired continues to be higher than the number of children ultimately attained. In the analysis the author focuses on the discrepancy between desires and their actual fulfilment among women at the end of their reproductive career. What are the obstacles encountered in implementing initial fertility desires? On the basis of retrospective fertility, employment and relationship histories in the FFS data files of nine countries, the relative influence of demographic, socio-economic and other factors on the difference between fertility desires and their actual accomplishment is investigated. The discrepancy is found to be largest in Spain, followed by Belgium, Italy, Austria,
THE ROLE OF COUNTRY-SPECIFIC INSTITUTIONS AND POLICIES 7
France, Sweden, Finland, Hungary and Poland. As the author demonstrates, this particular order is by no means random. It has everything to do with institutional settings and family policies that prevent women from fulfilling their aspirations in both the public and private domain, and those that permit them to do so.
Part 3 deals with two specific
issues of FFS data quality, namely the item non-response and the educational attainment variable. Working on this more technical issue, the authors could incorporate in their analyses FFS data from 16 or 18 countries. The chapters complement results from the work by Festy and Prioux on the evaluation of the FFS project and its database (see Volume I).
In chapter 9, Kveder argues that the
need to assess FFS data quality derives from the accuracy requirements of any sample survey. In order to be able to generalise to the population at large, the necessary accuracy of the estimates must be guaranteed. The analysis of item non-response and especially the identification of non-respondents are thereto extremely important. In this chapter the main analytical emphasis is on the comparison of unit and item non-response rates among 18 participating FFS countries with available data. The unit non-response rates were taken into account as calculated by every country, while item non-response rates for selected key variables or groups of variables (sexual and contraceptive debut, parenthood history, attitudes) were calculated on the basis of the FFS Standard Recode File data. The descriptive comparison of the non-response rates considers the countries themselves as the units of analysis. In addition, some data modelling is done in an attempt to further identify the item non-respondents. This part of the analysis is based on the person-specific item non-response rates and uses mainly socio-demographic variables as possible predictors. Emerging country patterns are compared, similarities and dissimilarities discussed, and recommendations for better data quality control in future research formulated.
In chapter 10, Dourleijn et al. examine the usefulness of FFS data on the level of education according the 1988 International Standard Classification of Education (ISCED) for cross-national comparative research. They explore the validity of this indicator and, on the basis of their findings, propose an alternative indicator that is based on the age at which women leave the educational system. This career indicator is then demonstrated to be superior to the ISCED indicator in several respects. First, differences between countries in the distribution by educational attainment levels are much smaller and better interpretable. Second, models of the impact of educational attainment on the timing of first childbirth fit better and produce smaller standard errors. Third, the impact of educational attainment on the timing of first childbirth is stronger and more consistent across the 16 countries investigated. On the basis of these findings, the authors conclude that their career indicator is much better suited for cross-national comparative research. However, they also admit that more testing is in order. While working with male data is likely to corroborate their results, it remains to be seen whether the career indicator is equally superior in the analysis of other demographic processes such as household formation, union disruption, and childbearing in stepfamilies and/or at higher parities.
In part 4 partnership and fertility
issues are broadened towards families structures, living arrangements and family strategies. Moreover, each chapter introduces an innovative approach. Two out of the three chapters use FFS data.
In chapter 11, Heuveline and
Timberlake contend that cross-national vital and marital statistics are poorly suited to study the impact of family changes on children. There is a need to assess these changes over a child’s life course and, in particular, to account for the increasing prevalence of childrearing within non-marital cohabitation. In this chapter they discuss whether FFS data can be used to develop a child-centred life course
8 FERTILITY AND PARTNERSHIP IN EUROPE
perspective on recent trends in family structure that recognises the most important living arrangements. More specifically, they propose and describe a methodology for constructing childhood biographies of living arrangements from birth and partnership histories in FFS data, a methodology they call Multi-state Early Life Table (MELT) analysis. They then show how this technique can be applied to the FFS biographies to reconstruct the living arrangements of children from birth through late adolescence across various countries. Preliminary results from such analyses on FFS data from Canada, France, Sweden and the United States of America are presented. They allow for a full description of children’s life courses, with indicators such as the average number of years spent in different family structures or the probability to experience a given transition from any age to the end of childhood, separately by sex and parental status at birth.
In chapter 12, Fux and
Baumgartner concentrate on interdependencies between the spread and distribution of selected living arrangements (one-person households, childless couples, mono-parental families and larger households with five or more persons) and population related policies at the regional level of provinces and cantons. Their analyses concentrate on Belgium, the Netherlands and Switzerland, which are all internally highly segmented in terms of religious denominations, languages, urbanisation and/or economic structures. These countries also represent marked differences in ideal-typical welfare regimes and concomitant family policies. According to the authors, Belgium could in this respect be characterised as “conservative”, the Netherlands as originally the same but later more “social-democratic”, and Switzerland as “liberal”. After presenting an innovative approach to the study of the impact of these different welfare regimes and their inherent family policies on the trajectories of changing household structures since 1950, the authors report on the results of their multivariate analyses. These clearly support the hypothesis that
depending on the welfare regime they are embedded in, family policies are either encouraging or discouraging the selection of particular living arrangements.
In chapter 13, Bosveld develops the
notion of family strategies to refer to the complex relationship between individual behaviour and social context in the family domain. The analysis focuses on the differences between Hungary, Italy, Sweden and the Netherlands with respect to the effects of individual and contextual factors on the fertility trajectories of women born between 1952 and 1971. Family strategies in Italy are the result of only a limited set of options that do not include non-marital cohabitation. Within such boundaries the role of having children is very important, almost all of them being born within marriage. People in the Netherlands have more options to construct their family strategies from, including non-marital cohabitation, although most couples will get married when they plan to have a child. Family strategies in Sweden are very diverse because people have many options and seem really free in their choices concerning family matters, including childbirth within a consensual union. In Hungary, on the other hand, one cannot really speak of free choice. The most common family strategy is that of getting married and having children early in life, whereas non-marital cohabitation is more common after a divorce. These country differences are demonstrably connected to differences in opportunity structures, legislation and other contextual factors.
C. A CRITICAL APPRAISAL AND
SUGGESTIONS FOR FUTURE RESEARCH
In the late 1980s, the FFS was launched as a comparative project in the UNECE region (see Cliquet, Volume I). Throughout the 1990s, more and more countries joined the project resulting in a series of 23 UNECE members states (plus New Zealand) covering North and South and West, Central and East Europe as well as the United States and Canada. Unfortunately, the contributions to this volume do not
THE ROLE OF COUNTRY-SPECIFIC INSTITUTIONS AND POLICIES 9
reflect this geographical coverage; Central and East European countries are less well represented or even absent in them. Among the substantive chapters, only Van Peer (chapter 8) and Heuveline and Timberlake (chapter 11) went for a very broad geographical scope. Selections of countries in the chapters of this volume seem to reflect very often professional friendships among the co-authors or professional moves of the author. A similar restriction in terms of numbers of countries and in terms of geographical coverage appears in the about 100 comparative research projects that made use of the FFS datasets and were launched since 1996.
The limited comparative scope may
be partly related to concerns and doubts about data comparability. A detailed and critical analysis of some aspects of the data comparability of the FFS database has been given in the chapter of Festy and Prioux in volume I, which is based on their more extensive report (Festy and Prioux, 2002). In part 3 of this second volume comparative data quality is dealt with also. Kveder (chapter 9) analyses the item non-response and identifies the non-respondents. Dourleijn et al. (chapter 10) examine the validity of the FFS variable used to measure the level of education in the different countries. But also other chapters in this volume express their concerns about the data comparability in the FFS dataset. Van Peer (chapter 8) goes back to the original phrasing in the questionnaire of the question that was used to create part of the dependent variable ‘children wanted’. In her comparison of France and Sweden, Corman (chapter 4) has to use quite different measurements of education, religion and social origin in both countries. Interpretation of results may be difficult if such different proxies are used.
As formulated in the call for
papers, the purpose of the FFS Flagship Conference was to “take stock of what is known from FFS as well as from other data (italics added by the editors) on new partnership and fertility patterns in Europe and North America”. And indeed, quite a few proposed contributions went beyond
the immediate use of FFS data or were not based on them at all. However, although this was never a selection criterion of the chairpersons and discussants of any session, it just so happened that all contributed papers selected for presentation at the conference and thus inclusion in this volume were based on FFS data. Only Fux and Baumgartner (chapter 12) in their study on Belgium, the Netherlands and Switzerland and Noack and Østby (chapter 7) in their study on Norway use additional data sources. This Norwegian combination of survey data with register data is not only innovative, but also very promising. Van Peer (chapter 8) made use of data from the European Observatory on Family Matters and many results from the Population Policy Acceptance (PPA) survey in order to put her FFS results in a policy context. Dourleijn et al. (chapter 10) came across many comparability problems and any further validation with data from Eurostat sources did not reduce their problems. The advantage of 12 chapters using FFS data, of course, is that this provides a good yardstick for measuring the added value of the FFS project as a whole. Has it really generated the “wealth of information” that it was supposed to, not only for the sake of a better description of recent changes in partnership and fertility behaviour in this part of the world but also for the sake of their better explanation?
In their evaluation of the FFS
project, Festy and Prioux (see Volume I) point out that the data collection on partnership and fertility behaviour is too much event-oriented. The chapters in part 1 of this second volume reflect very much this event-orientedness: leaving the parental home, birth of first child, birth of third child, first disruption of the parental union, childbearing in stepfamilies. The process character of these events is not well taken into account in the FFS data collection. However, all chapters dealing with partnership or fertility behavioural events recognize at least that the occurrence and timing of the partnership and fertility events belong very much to interdependent processes. Events in the other process are most of the time considered to be a time-
10 FERTILITY AND PARTNERSHIP IN EUROPE
varying independent variable (see also Pinnelli et al. in Volume I).
Moreover, Festy and Prioux
criticised the FFS analyses to be too much first-time event oriented. The age limits of the FFS samples explain partially this limitation. However, in this volume, this shortcoming is partially overcome by the chapter on disruption of parental unions and the one on the stepfamilies. However, one-parent families e.g. remain an underdeveloped issue in much comparative FFS research.
The FFS data collection was by the
same authors criticised to be too individual-oriented. For instance, with the exception of leaving the parental home and union dissolution perhaps, which can be the unilateral decision of one of the members involved, almost all the other events investigated in this volume may be said to involve the joint decision-making of both couple members. Whatever the outcome of their deliberations and negotiations, it will depend among other things on past experiences, currently shared values, perceived norms, constraints met or – the opposite – opportunity structures offered to each of them individually as well as collectively. Ideally, it is the timing of this decision rather than its behavioural implementation that we are after. Still, even with more refined measurement techniques we are unlikely to get much closer to actual decision moments. The real problem, however, is that if it is true that couple decisions are influenced among other things by the educational and occupational situation of both partners, and hence by the degree of economic and temporal (un)certainty that they together face, it may not suffice to just reconstruct the educational and occupational history of only one of them, as was done in the FFS. We may then also need longitudinal information on the school and job career of the other partner(s)iii. Collecting such information may be hard, even impossible, but we have to spell out our data needs in function of our paradigms, not vice versa.
In order to study partnership and fertility behaviour and its dynamics in a comparative context most chapters in this volume (as well as in Volume I) make use of the notion of the Second Demographic Transition to underpin their research questions. The concept of the Second Demographic Transition is used to question the development of demographic trends in Europe towards convergence and/or divergence. In this context Billari et al. (chapter 2) speak about demographic developments in a Mediterranean fashion. Billari and Kohler (chapter 3), looking at West Germany and Italy, strongly question signs of convergence. In both cases, their conclusion is that convergence can be discarded and may not occur and that diversity is likely to persist. In addition, the historical embeddedness of demographic developments is stressed in several chapters. Billari et al. (chapter 2) sketch in detail the political and social history of Spain and Italy to document better the context of the changes in the timing and ways of household formation. Fux and Baumgartner (chapter 12) take this historical embeddedness towards the regional level and emphasize the role of the social, religious and cultural cleavages. Billari and Kohler (chapter 3) also look at regional differences within Italy and (West) Germany to illustrate the diversity.
Inspired by Becker’s ideas on the
role of increased human capital – particular for women - in partnership and fertility behaviour, most chapters take into account the impact of education and employment. They demonstrate in one way or another the importance of the educational and occupational history of the respondents - as mediated by the institutional package of their country of residence - for the various demographic outcomes studied. Retrospective FFS information on education and activity status has enabled this, but not without limitations.
As far as FFS information on
education is concerned, the available data generally allow separating the effects of the highest level of education attained from those of enrolment at any one point in time.
THE ROLE OF COUNTRY-SPECIFIC INSTITUTIONS AND POLICIES 11
Information on the level of education is provided in the form of the 1988 ISCED scores. Recoded in one way or another, these scores have been used by most authors of the substantive contributions in this volume to measure the effects of educational attainment on their demographic outcomes of interest. However, as indicated above, the main message of the methodological contribution by Dourleijn et al. is that the quality of these ISCED scores may be doubtful at best. The alternative measure of educational attainment that they propose does completely away with the need to use these 1988 ISCED codes. The only thing required, they say, is retrospective information on the age at leaving the educational system. They call their alternative measure the career indicator and convincingly demonstrate its superior performance from various points of view, at least in an analysis of first motherhood. Although much more experimentation would be in order, their finding raises some important questions. First, future analyses using FFS data on educational attainment are perhaps indeed better off with this alternative career indicator. Second, future survey projects like the FFS may wish to consider dropping questions on the level of education altogether from their model questionnaires. Answers to such questions are generally first entered literally by the interviewer and later office coded. Both operations are laborious, time-consuming and error-prone, no matter whether one uses the 1988 or the revised 1997 ISCED codes. Concerning the latter, although they are likely to yield much better comparable measures of educational attainment than their predecessor, there is as yet insufficient experience with their use in cross-nationally comparative research.
As far as FFS information on
occupation is concerned, the editors would argue that the situation is quite different. Also Festy and Prioux (see Volume I) expressed concerns about the use of the limited FFS employment history data in a comparative perspective. They noted that in most empirical analyses employment information was often reduced to a rough
variable, leaving out details that may be very country-specific. Here the need in case of future survey projects is thus not so much for simplification but rather for expansion. Using the 1988 ISCO codes for recording the type of occupation at any one point in time is probably the way to go again, but then without economising on the number of digits, we would say. Meaningful classification schemes can only be derived if all 4 ISCO digits are available, not just the first 2 as in the FFS. The question on employment status will also have to be expanded: in case of employers, we will need to know how many employees they supervised. And because of the tertiarisation of our economies, a question on the sector of employment will also have to be added, with sufficient detail to distinguish between the various sub-groups of the business, distributive, consumer and social service sectors. It becomes also increasingly relevant nowadays to know whether a particular job was held in the private or public sector of employment. And last but not least, per job we will need much more detailed information than just the length of time it was held, or the average number of hours worked per week. What sort of a contract was it? Was it long-term, fixed-term, short-term, or no contract at all? Such data may give us a better handle on the precariousness of various employment situations and their implications for entrapment or social exclusion. As far as a more in-depth explanatory analysis of partnership and fertility behaviour as inter-dependent processes is concerned, we feel that these are some of the extensions that would be required in case of a sequel to the FFS. But much more would then need to be changed, of course. We conclude with a few critical remarks on gender research and multi-level data analysis.
The FFS project was innovative in
the sense that it proposed from the very beginning to ask about partnership and fertility behaviour among both a female and a male sample of respondents. Most countries followed this recommendation. For critical remarks on the respective sizes of both samples we refer to Festy and
12 FERTILITY AND PARTNERSHIP IN EUROPE
Prioux (2002 and Volume I). Seven chapters in this volume indeed deal with FFS data both on male and female respondents. In three other chapters the authors justify why they only work with the female data. In terms of empirical evidence, several chapters (2, 4, 5 and 9) come up with gender-specific behavioural outcomes. At a more conceptual level, chapters 2 and 5 refer to the impact of changing gender relations. The authors illustrate those changing gender relations by the changes in participation in higher education and the labour force. Corman (chapter 4) tries to incorporate a measurement of the changing gender relations in her empirical analysis. Unfortunately she has to use two very different measures for the countries under study. All chapters therewith reflect how poorly developed and explored gender issues still are in demography. By using some of the information collected on the current partner, a small part of the gender context could have been explored by the FFS but this has only rarely been done. Having both partners involved in the FFS was not part of the FFS standard recommendation. Festy and Prioux make some critical remarks on this in their chapter in volume I.
As mentioned above, some aspects
of the meso-level context have been taking into account by looking at the interdependency of partnership and fertility behaviour. Van Peer (chapter 8) mentions the impact of the actual childbearing context on fertility expectations, but the threat of a marital disruption is not a context that is easy to measure. Parts of the socio-economic context were grasped in most chapters mainly by taking education and employment as important factors affecting the timing and/or kind of partnership and fertility behaviour. Macro-level contextual elements are occasionally referred to but only Oláh (chapter 5) tries to actually incorporate a macro-level variable in her analysis of the micro-data. Fux and Baumgartner (chapter 12) focus on macro-level data by including family policy relevant indicators. Most chapters refer to policy issues in order to sketch the context of the partnership and fertility behaviour
under study and/or invoke policy issues in order to explain their results. In a few chapters (chapters 2, 6, 8 and 12) the countries under study are considered as examples of one or the other welfare regime distinguished by Esping-Andersen (1999). Billari et al. (chapter 2) stress the impact of the historical political changes in general and of the role of the family as institution in the South European countries. Corman (chapter 4) distinguishes the labour market and family policies in the two countries under study. Olah (chapter 5) incorporates public policies by distinguishing the policy period. However, her measurement of family policy can be criticised. Van Peer (chapter 8) makes ample use of data from the European Observatory on Family Policy and links up with results from the Population Policy Acceptance Survey. Working on the macro-level, Fux and Baumgartner (chapter 12) grasp determinants of the various living arrangements in the economy, the societal cleavages, the demographic preconditions and the family policies. Bosveld (chapter 13) introduces the notion of strategy to make the link between the micro- and macro-level, but it is clear that this notion needs further elaboration.
In 2000, the PAU at the United
Nations Economic Commission for Europe (UNECE) with the financial backing of the United Nations Population Fund (UNFPA) launched a new international comparative project. The goal of the project, called the Generations and Gender Programme (GGP), is a cross-national, comparative, multidisciplinary, longitudinal study of the dynamics of the family and family relationships in the contemporary industrialised countries, in particular in Europe and North America. The specific aim is to improve the understanding of factors - including public policy and programme interventions - affecting the evolution of two principal family relationships: child-parent relationships and partner-partner relationships.
Lessons from the FFS project, its
achievements and failings, including the ones presented in this volume and in
THE ROLE OF COUNTRY-SPECIFIC INSTITUTIONS AND POLICIES 13
Volume I, will be taken into account. The GGP will also offer continuity with the FFS, ensuring comparability between both data sources, so that investments in the FFS will continue to yield returns in the future.
Major innovations in the GGP are
the following ones: the programme will be prospective, multidisciplinary and context-sensitive.
Unlike the FFS project, the GGP is
primarily concerned with the present as it unfolds, rather than with the past. It breaks with the tradition of the past survey research projects such as FFS that have been built around one-time cross-sectional surveys, which in addition to current-status information had increasingly placed emphasis on retrospective information, specifically event history data. The GGP will necessarily pay due respect to the past: to do otherwise would be wrong - the simple fact that our present and future are rooted in our past must not be ignored. With its prospective approach, the GGP will be able to include as explanatory variables a number of time-dependent variables, such as income data and opinions. Moreover, this approach offers opportunities for policy variables to enter analyses as time-dependent variables and, in the process, contribute to knowledge directly relevant to policy-making.
Population scholars increasingly
share the view that mono-disciplinary approaches to study population and family behaviour are incapable of producing major gains in our understanding. As multidisciplinary perspectives appear much more promising, the GGP has embraced more than in the FFS project a multidisciplinary approach. It takes e.g. the position that both economic forces and ideational changes may be found to have a strong impact and thereby opens the door for empirical testing of competing explanations.
The GGP is at variance with the so-
called atomistic or individualistic
perspective of human behaviour adhered to in certain strands of demographic and other behavioural research of the last few decades – as was the case in FFS. The GGP takes the position that the demographic behaviour of individuals is also affected by the context within which they live, including their families, networks, communities and societies. Central to that context - both at its mezzo and macro levels alike - are intergenerational and gender relationships. Contributions in this volume pointed out the role of institutional factors and policies, without however being able to empirically test or prove this impact. GGP will try to overcome this shortcoming. Therefore, in addition to the data collection through surveys of individuals, the GGP will also draw data from a number of existing national and international sources of aggregate-level quantitative and qualitative information. These data pertain to social and economic conditions, such as the labour and housing markets; to legal provisions, institutions and policies, such as family legislation, benefits and services; and to macro-level gender and intergenerational relationships. These data will relate both to the community level as well as to the national level. Macro-level contextual variables at the sub-national and national levels will be used along with GGP survey data as inputs into contextual analysis and multi-level analyses. It is anticipated that the cross-country comparative studies will shed light on how different welfare regimes influence behaviour, providing indications to policy-makers on how welfare regimes may possibly need to be modified.
The GGP has been - as was the
FFS project - from its inception, a multi-country, joint comparative effort. As illustrated in this volume, it pays for countries to join forces and seek answers together as knowledge emanating from comparative efforts sheds light on how each country’s policies actually do or could respond to population and family changes.
14 FERTILITY AND PARTNERSHIP IN EUROPE
REFERENCES Becker, G. S. (1981). A Treatise on the Family.
Cambridge, MA, London: Harvard University Press.
Easterlin R. and E. Crimmins (1991). Private materialism, personal self-fulfilment, family life and public interest: the nature, effects and causes of recent changes in the values of American youth. Public Opinion Quarterly, 55, 499-533.
Esping-Andersen, G. (1999). Social Foundations of Postindustrial Economies, Oxford: Oxford University Press.
Fertility and family surveys in countries of the ECE region (1996-2002). Standard Country Report. Economic Studies. New York/Geneva: United Nations
Festy P. and F. Prioux (2002). An evaluation of the Fertility and Family Surveys Project. New York/Geneva: United Nations.
Macura M. and G. Beets (in press). Dynamics of fertility and partnership in Europe. Insights and lessons from comparative research. Volume I. New York/Geneva: United Nations.
Lesthaeghe, R. and Van de Kaa, D. (1986), Twee demografische transities? [Two demographic transitions?] In D. van de Kaa and R. Lesthaeghe, Groei en Krimp. [Expansion and contraction]. Deventer: Van Loghum-Slaterus, 9-24.
van de Kaa, D.J. (1987). Europe’s Second Demographic Transition. Population Bulletin, Vol. 42, 1, Washington, DC: Population Reference Bureau.
.
ENDNOTES i See Chapter 1 by Robert Cliquet in Volume I for conceptual underpinnings of the FFS. ii For a detailed discussion on the FFS data, those whose collection has been recommended and those that have actually been gathered, see Chapter 7 by Festy and Prioux in Volume I. iii A few countries participating in the FFS project – notably Italy, the Netherlands, and Poland - did collect some retrospective information on the current partner, but mostly on the basis of an unrepresentative sub-sample.

15
PART ONE
PARTNERSHIP AND FERTILITY BEHAVIOUR
17
CHAPTER 2
HOUSEHOLD AND UNION FORMATION IN A MEDITERRANEAN FASHION: ITALY AND SPAIN
Francesco C. Billari*, Maria Castiglioni**, Teresa Castro Martin***, Francesca Michielin** and Fausta Ongaro**
* Max Planck Institute for Demographic Research, Rostock (Germany) ** Department of Statistics, University of Padova, Padova (Italy) *** C.S.I.C., Instituto de Economia y Geografia, Madrid (Spain)
A. BACKGROUND: THE “LATEST LATE” TRANSITION TO ADULTHOODi The multiplication of the paths of transition to adulthood, with the spread of non-marital cohabitation and prolonged periods of life spent as single, is often mentioned by proponents of the theory of the Second Demographic Transition (van de Kaa, 1987) as well as by other life course scholars (Buchmann, 1989). The prevalent view is that, at least in Western Europe, one should observe a move towards a plurality of behaviours. In most Southern European countries (in particular Italy and Spain), however, such pluralism does not yet seem to have been fully developed. Concerning the departure from the parental home, for instance, it has become increasingly common to speak of a “Mediterranean” or “Southern European” pattern (Jones, 1995; Fernández Cordón, 1997). This pattern is embedded in the whole family formation process. Reher (1998) for example essentially distinguishes “two Europes” west of the famous Trieste-Saint Petersburg line drawn by Hajnal (1965): a northern Europe in which family ties are relatively “weak”, and a southern Europe that is marked by the strength and pervasiveness of family ties. The notion of “familism” in Italy remains indeed the focal point of
many hypotheses on the behaviour in the transition to adulthood, including first parenthood (Dalla Zuanna, 1999). The lower incidence of divorce and non-marital pregnancies and the greater support given by the family to the unemployed and the aged are indicators of this strength in family ties. From another point of view, Esping-Andersen (1999) emphasises the similarity of the Mediterranean welfare systems and institutional settings, defining them as “familialistic”. We therefore take Spain and Italy as prototypical Mediterranean societies.
The key features of the
Mediterranean pattern of the transition to adulthood are twofold. Firstly, the stay at the parental home of the cohorts born around the 1970s is prolonged. The youngest cohorts show something that we might call the “latest late” home-leaving behaviour. Secondly, the interconnection between the departure from the parental home and marriage is strong (Cavalli and Galland, 1996). As Corijn (1999) points out, this interconnection can also be observed in societies like Poland and Belgium. It is precisely on the timing of these two events, and on the relationship between the departure from the parental home and the entry into the first union, that
18 FERTILITY AND PARTNERSHIP IN EUROPE
we shall concentrate our attention in this chapter.
B. MACRO TRENDS AND RESEARCH
HYPOTHESES
Because we use information about life courses that develop in space but also across time and that are shaped by a dynamically evolving historical context (Giele and Elder, 1998), we must consider Italy and Spain as national settings that change over time. In this sense, even present similarities in behaviour may be the outcome of very different paths and/or processes. Ideally similar cultural patterns are also embedded in very different institutional contexts. We therefore use, as our basic units of comparison, birth cohorts: groups of individuals who experienced similar situations at (approximately) similar ages.
To simplify matters, for each
nation we take into consideration three birth cohorts: an oldest cohort (Spain 1945-54, Italy 1946-55); a middle cohort (Spain 1955-64, Italy 1956-65); and a youngest cohort (Spain 1965-74, Italy 1966-75). The slight differences in birth years are imposed by the design of the surveys we have access to. In Italy the context in which these cohorts go through their early adulthood ages has changed in an almost gradual manner, while in Spain the changes have been more clear-cut. (In Billari et al., 2000, the same cohorts are defined as “pre-Franco“, “transition” and “post-Franco”.)
In Spain (see e.g. Casal and Garcia,
1996) the Civil War (1936-39) ended in a complete break-up of the society and in a return to traditionalism. In this way, what is commonly known as “national Catholicism” was born, which was characterised, on the one hand, by the alliance with Fascism and Nazism and, on the other, by the close links between General Franco and the Vatican. Until the end of the 1950s the State strongly intervened in the spheres of private life and morality. It fought freedom of thought, repressed socialist ideology and imposed the Catholic conservative model. The oldest Spanish cohort in our study
grew up in this context, while the middle one experienced it partially. In the following years (1960-76) the period of economic and urban growth began, which was characterised by the emergence of a technocratic ideology in the economic sphere and by the persistence of a reactionary school of thought in the political, social and moral spheres. The youngest cohort is thus the only one that entirely experienced this period of economic development, although those born between 1955 and 1964 were the ones most affected by this situation. (In that period they were about 15 years old, a crucial age for the transition into adulthood.) The educational system in Spain underwent important transformations during this period, which were aimed at promoting both secondary and university studies. These transformations favoured primarily the emergent middle classes. The role of women, however, did not experience major advances, and the prevailing model remained that of passing from the parental control to husband’s tutelage after marriage. Work activities were conceded only if they were judged compatible with the role of wife, mother and housewife. The real changes came about only after the death of General Franco, in the period of the democratic transition during which the Spanish Democratic Constitution was drawn up (1978) and the Socialist Party won the elections (1982). The process of political and cultural modernisation was consolidated in 1986 when Spain was fully integrated, politically and economically, into the European Community. At the same time, however, Spain’s economic crisis further deepened, with unemployment rates increasing and remaining high. Moreover, rents and housing prices shot up, beyond levels compatible with family incomes. Again, the cohort most affected was the 1965-74 one that, on the one hand, experienced the advantages of democracy but, on the other, was forced to face the problems caused by the country’s economic crisis. By the end of the 1980s, Spain managed to consolidate its democracy, isolate the ultraconservative ideology of the Franco regime, promote modern cultural
HOUSEHOLD AND UNION FORMATION IN A MEDITERRANEAN FASHION 19
values and truly integrate itself into the European economic and political context.
After the end of World War II (see
e.g. Ginsborg, 1989), Italy experienced an economic boom slightly earlier than Spain. Despite the fact that the period until the big Oil Crisis was marked by economic growth, until the mid-1950s Italy remained on many accounts an underdeveloped country. Then, industrialisation provoked a general exodus from the countryside, in particular from south, towards centres of urban and industrial development in the north. The 1970s marked the onset of a period of short expansive and recessive economic cycles. Unemployment rates increased in Italy, too, as did the total working population as a result of the massive entry of women into the labour force. The migratory flow then decreased, and the regions of the so-called “third Italy” emerged.
Based on the framework just
outlined, the main research questions are: What are the similarities (as considered by the comparative research literature, which is essentially based on cross-sectional views) and the differences between the two countries when considering both their initial conditions and their evolution over time? Are new forms of behaviour such as leaving home to live as a single or in a consensual union spreading? Are gender differentials narrowing? What is the role of the educational and occupational careers? And what is the impact of early reproductive choices? C. THE DATA AND THE CONNECTION BETWEEN HOUSEHOLD AND UNION
FORMATION
The Spanish “Encuesta de Fecundidad y Familia” (Delgado and Castro Martín, 1999) and the Italian “Seconda Indagine Nazionale sulla Fecondità” (De Sandre et al., 1997, De Sandre et al., 2000) were organised within the framework of an international survey program co-ordinated by the PAU of the UNECE, and were carried out between November 1994 and January 1996. In both surveys, representative samples of men and women
(1 991 men and 4 021 women for the Spanish survey; 1 206 men, 4 824 women and 600 of their male partners for the Italian survey) were interviewed with the objective of gathering detailed information on – among other things – partnership, childbearing, educational and employment careersii. The exact dating of such careers is particularly important when one wishes to apply event history analysis (Blossfeld and Rohwer, 1995).
As mentioned before, one of the
peculiar characteristics of Spain and Italy is that events such as the departure from the parental home and first union formation are experienced relatively late, and that these two are strongly interconnected. If one observes the values of their survivor functions (expressing the percentage of individuals who have not yet experienced an event at a given age) - we do not provide them here for lack of space - this delay for the two countries is evident, although different. For example, the values of the survivor functions for the first departure from the parental home in Italy by 25 years of age grew analogously from the oldest to the youngest cohort for both men and women – from 48 through 60 to 86 per cent for men, and from 28 through 39 to 63 per cent for women. On the other hand, in Spain there was a leap only for the youngest cohort – for men from 54 to 68 per cent while for women from 31 to 48 per cent (Billari and Ongaro, 1999; Billari et al., 2000). The situation is analogous when one observes the timing of the first union.
Looking only at leaving home for
the first time and at forming a first union (by type of union), we can classify the individuals into five groups:
- those who have experienced neither the first departure from the parental home nor first union formation;
- those who have left the parental home before forming a first union (in other words, those who experienced residential autonomy);
- those who have entered into a union while still in the parental home (in other words, those who experienced a patrilocal union)iii;
20 FERTILITY AND PARTNERSHIP IN EUROPE
- those who simultaneously left home and entered into a first consensual union (in other words, those who experienced a neolocal cohabitation); and
- those who simultaneously left home and entered into a first marriage (in other words, those who experienced a neolocal marriage).
In order to define simultaneous
events we use a monthly time scale. This conservative choice was made in order not to overestimate the Southern European kind of transition. A fuzzy time approach (Courgeau and Lelièvre, 1992) would have lead to an even higher share of people experiencing simultaneous events.
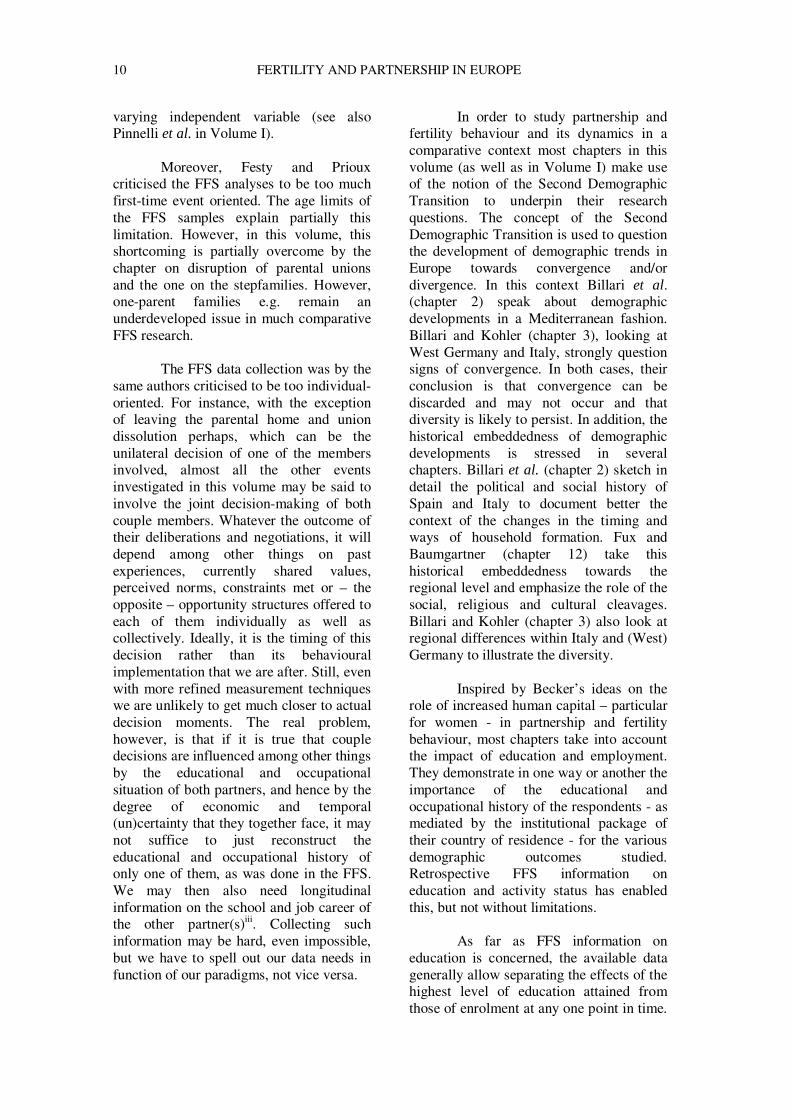
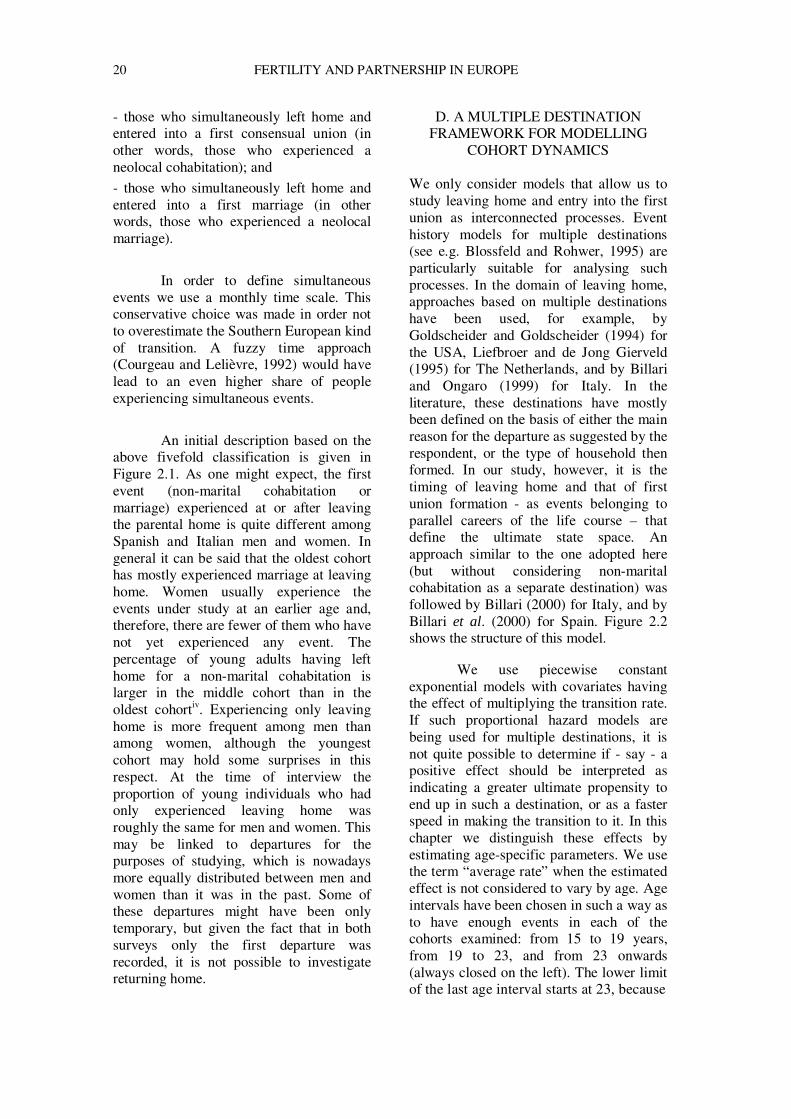
An initial description based on the
above fivefold classification is given in Figure 2.1. As one might expect, the first event (non-marital cohabitation or marriage) experienced at or after leaving the parental home is quite different among Spanish and Italian men and women. In general it can be said that the oldest cohort has mostly experienced marriage at leaving home. Women usually experience the events under study at an earlier age and, therefore, there are fewer of them who have not yet experienced any event. The percentage of young adults having left home for a non-marital cohabitation is larger in the middle cohort than in the oldest cohortiv. Experiencing only leaving home is more frequent among men than among women, although the youngest cohort may hold some surprises in this respect. At the time of interview the proportion of young individuals who had only experienced leaving home was roughly the same for men and women. This may be linked to departures for the purposes of studying, which is nowadays more equally distributed between men and women than it was in the past. Some of these departures might have been only temporary, but given the fact that in both surveys only the first departure was recorded, it is not possible to investigate returning home.
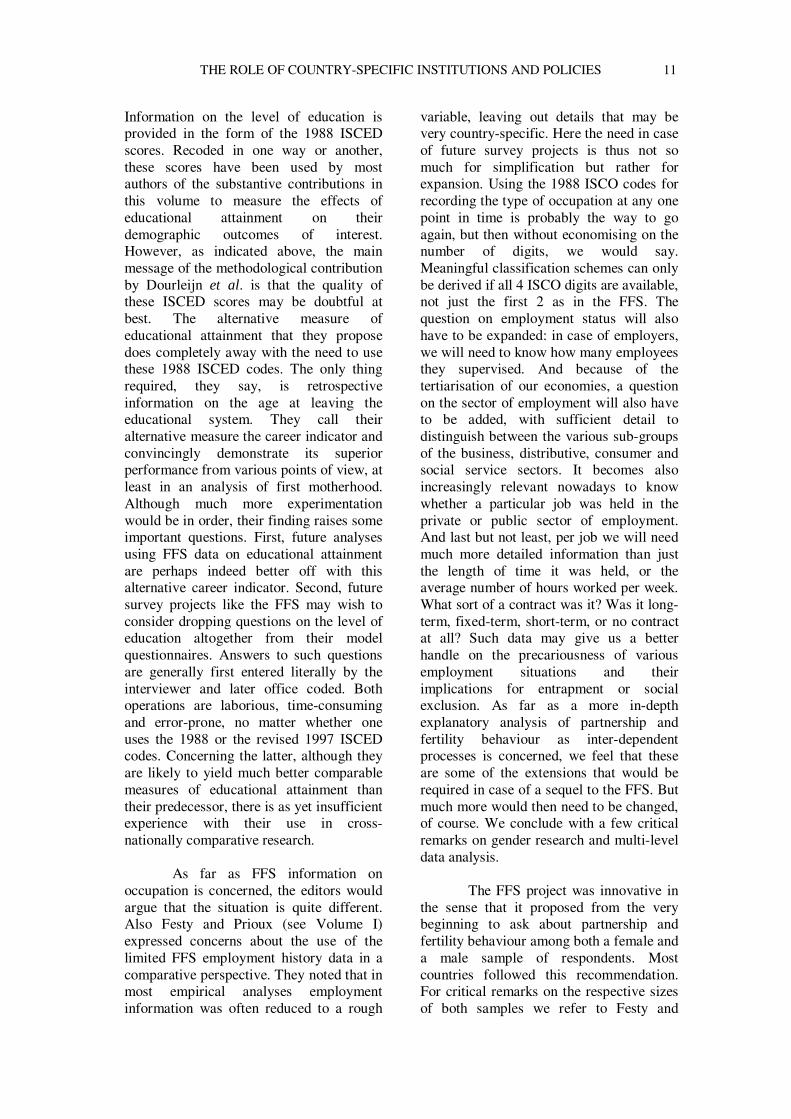
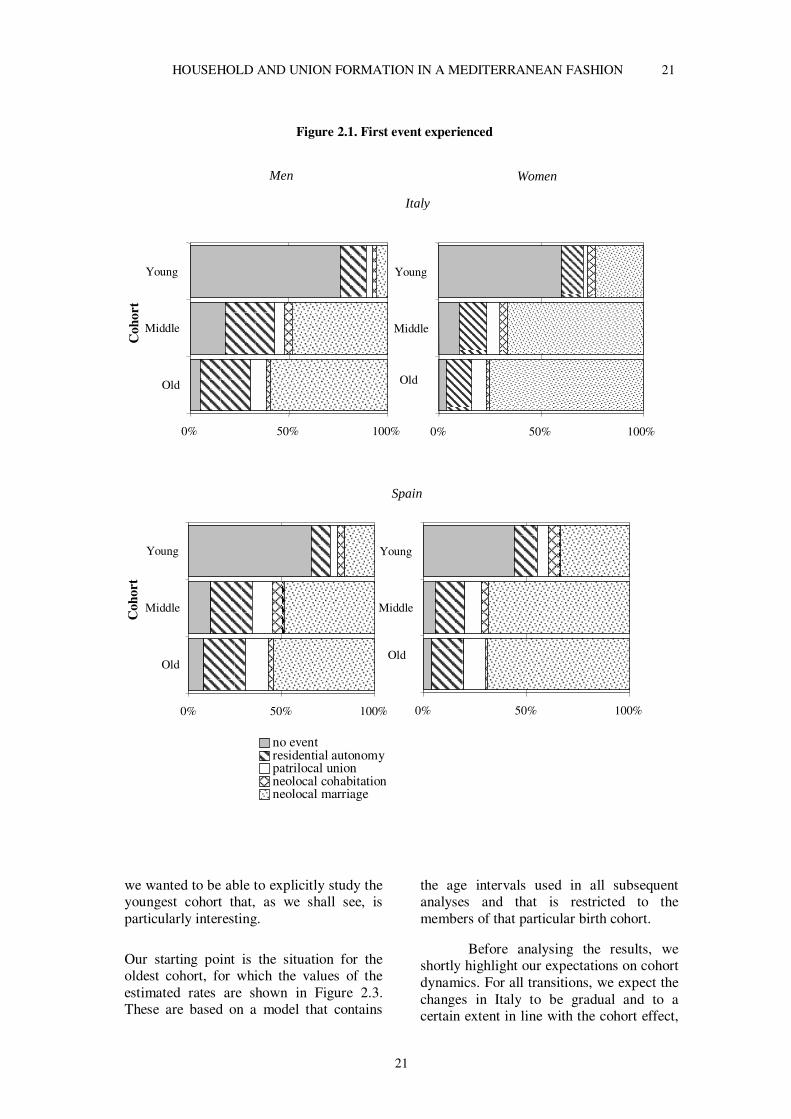
D. A MULTIPLE DESTINATION FRAMEWORK FOR MODELLING
COHORT DYNAMICS We only consider models that allow us to study leaving home and entry into the first union as interconnected processes. Event history models for multiple destinations (see e.g. Blossfeld and Rohwer, 1995) are particularly suitable for analysing such processes. In the domain of leaving home, approaches based on multiple destinations have been used, for example, by Goldscheider and Goldscheider (1994) for the USA, Liefbroer and de Jong Gierveld (1995) for The Netherlands, and by Billari and Ongaro (1999) for Italy. In the literature, these destinations have mostly been defined on the basis of either the main reason for the departure as suggested by the respondent, or the type of household then formed. In our study, however, it is the timing of leaving home and that of first union formation - as events belonging to parallel careers of the life course – that define the ultimate state space. An approach similar to the one adopted here (but without considering non-marital cohabitation as a separate destination) was followed by Billari (2000) for Italy, and by Billari et al. (2000) for Spain. Figure 2.2 shows the structure of this model.
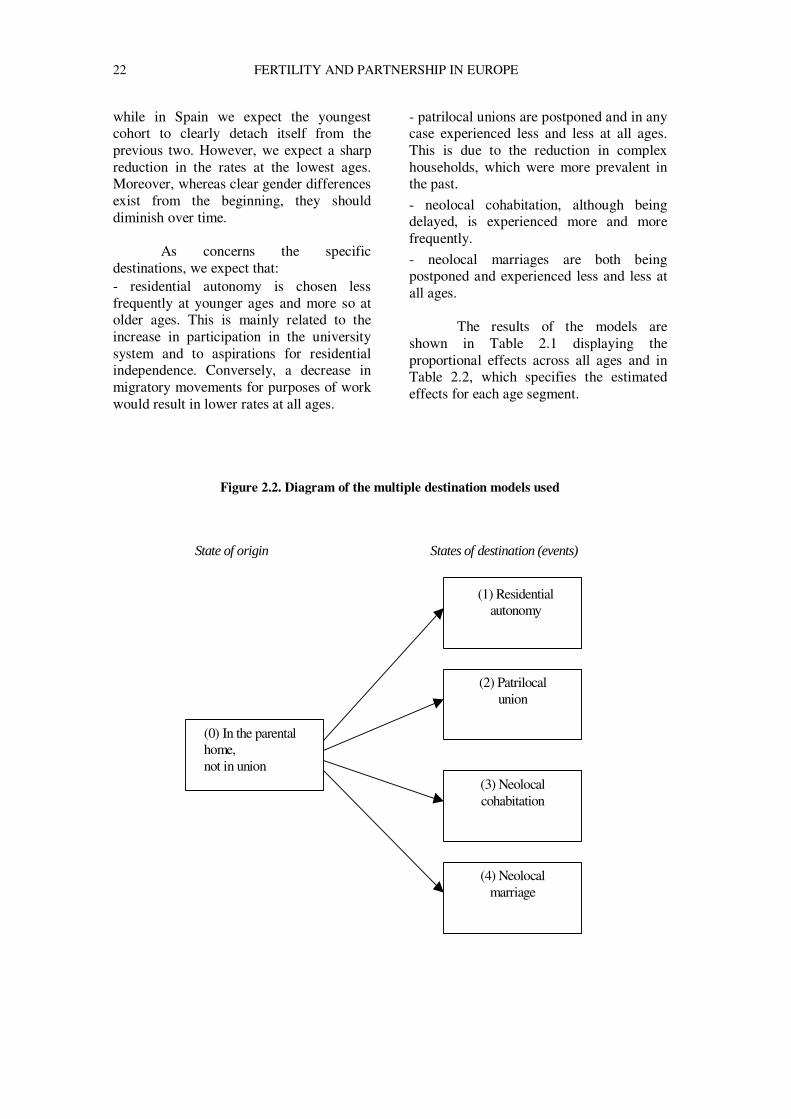
We use piecewise constant
exponential models with covariates having the effect of multiplying the transition rate. If such proportional hazard models are being used for multiple destinations, it is not quite possible to determine if - say - a positive effect should be interpreted as indicating a greater ultimate propensity to end up in such a destination, or as a faster speed in making the transition to it. In this chapter we distinguish these effects by estimating age-specific parameters. We use the term “average rate” when the estimated effect is not considered to vary by age. Age intervals have been chosen in such a way as to have enough events in each of the cohorts examined: from 15 to 19 years, from 19 to 23, and from 23 onwards (always closed on the left). The lower limit of the last age interval starts at 23, because
HOUSEHOLD AND UNION FORMATION IN A MEDITERRANEAN FASHION 21
21
we wanted to be able to explicitly study the youngest cohort that, as we shall see, is particularly interesting.
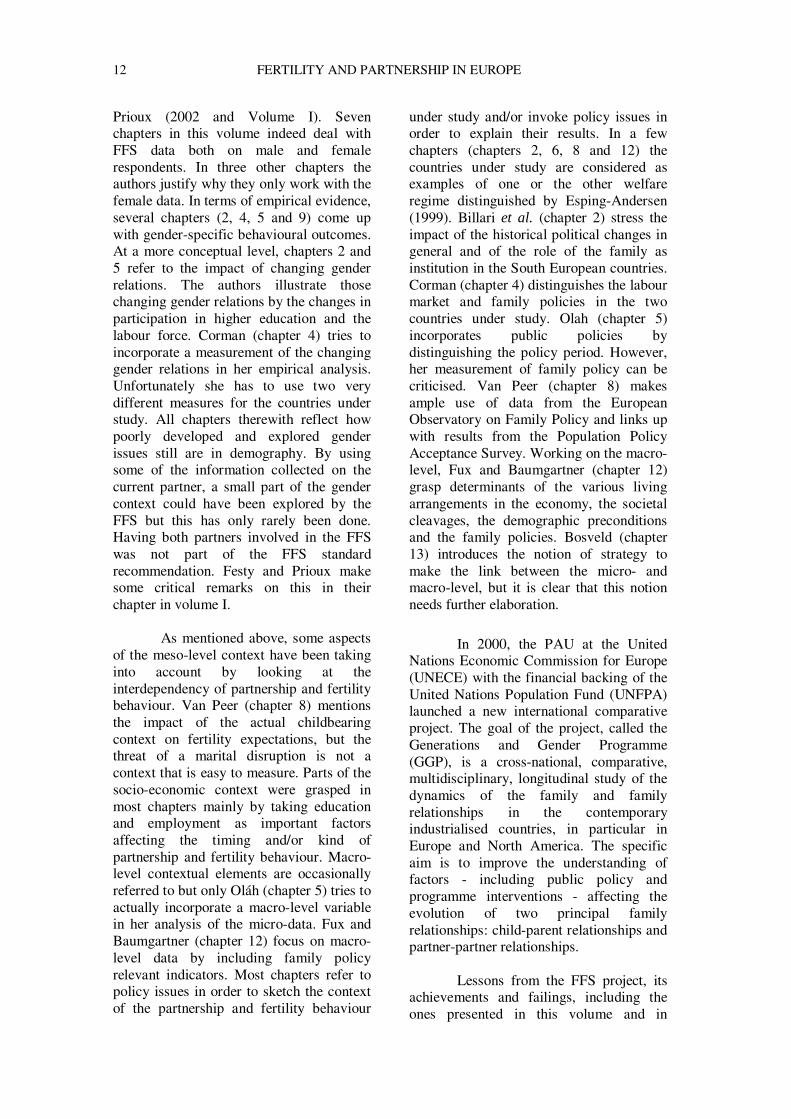
Our starting point is the situation for the oldest cohort, for which the values of the estimated rates are shown in Figure 2.3. These are based on a model that contains
the age intervals used in all subsequent analyses and that is restricted to the members of that particular birth cohort.
Before analysing the results, we shortly highlight our expectations on cohort dynamics. For all transitions, we expect the changes in Italy to be gradual and to a certain extent in line with the cohort effect,
Italy
Old
Middle
Young
Cohort
0% 50% 100%
Old
Middle
Young
Coh
ort
Spain
0% 20% 40% 60% 80% 100%
Old
Middle
Young
Cohort
no event residential autonomy patrilocal union neolocal cohabitation neolocal marriage
0% 50% 100%
Old
Middle
Young
0% 50% 100%
Old
Middle
Young
Men Women
0% 50% 100%
Old
Middle
Young
Coh
ort
Figure 2.1. First event experienced
22 FERTILITY AND PARTNERSHIP IN EUROPE
while in Spain we expect the youngest cohort to clearly detach itself from the previous two. However, we expect a sharp reduction in the rates at the lowest ages. Moreover, whereas clear gender differences exist from the beginning, they should diminish over time.
As concerns the specific
destinations, we expect that: - residential autonomy is chosen less frequently at younger ages and more so at older ages. This is mainly related to the increase in participation in the university system and to aspirations for residential independence. Conversely, a decrease in migratory movements for purposes of work would result in lower rates at all ages.
- patrilocal unions are postponed and in any case experienced less and less at all ages. This is due to the reduction in complex households, which were more prevalent in the past.
- neolocal cohabitation, although being delayed, is experienced more and more frequently.
- neolocal marriages are both being postponed and experienced less and less at all ages.
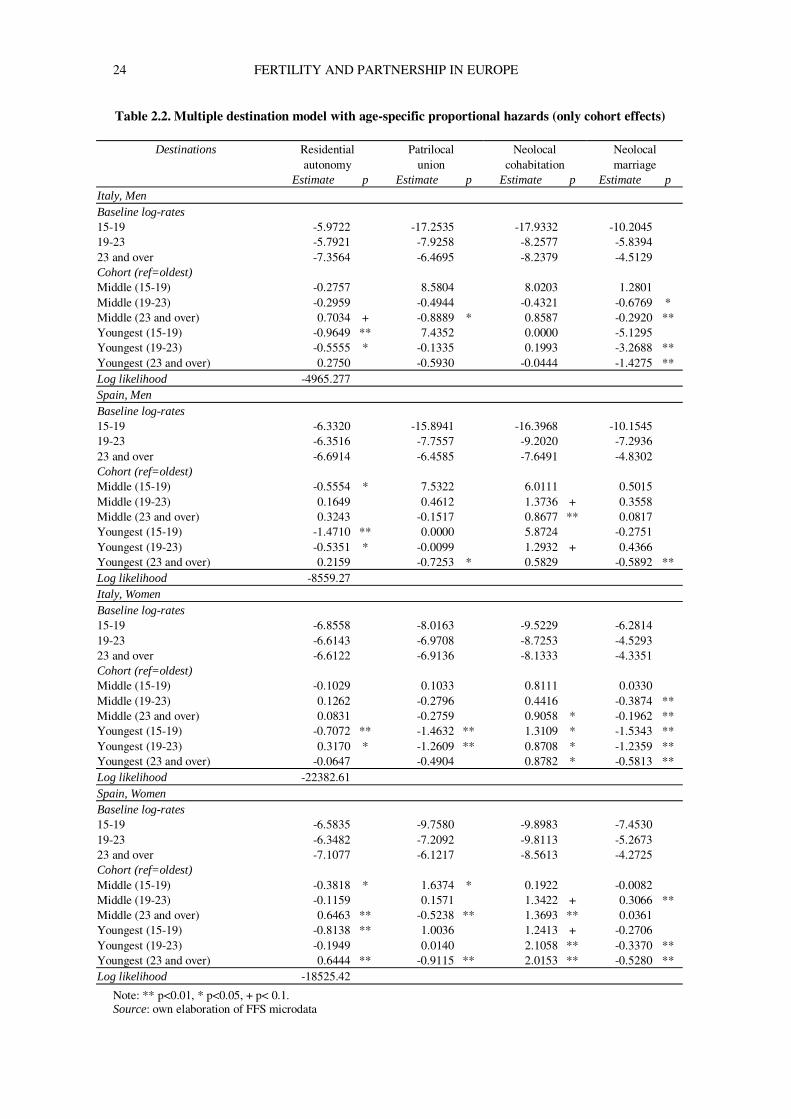
The results of the models are
shown in Table 2.1 displaying the proportional effects across all ages and in Table 2.2, which specifies the estimated effects for each age segment.
Figure 2.2. Diagram of the multiple destination models used
(0) In the parental home, not in union
State of origin States of destination (events)
(1) Residential autonomy
(2) Patrilocal union
(3) Neolocal cohabitation
(4) Neolocal marriage
HOUSEHOLD AND UNION FORMATION IN A MEDITERRANEAN FASHION 23
Table 2.1. Multiple destination model with proportional hazards (only cohort effects)
Destinations Residential autonomy
Patrilocal union
Neolocal Cohabitation
Neolocal marriage
Estimate p Estimate p Estimate p Estimate p Italy, Men Baseline log-rates 15-19 -6.1224 -9.1150 -11.2907 -9.282 19-23 -5.8477 -7.7771 -8.5768 -6.0718 23 and over -6.7763 -6.5793 -8.0727 -4.4722 Cohort (ref=oldest) Middle -0.1095 -0.6369 * 0.5346 -0.3406 ** Youngest -0.5998 ** -0.4333 0.1958 -1.7228 ** Log likelihood -4980.71 Spain, Men Baseline log-rates 15-19 -6.7588 -9.3333 -11.4588 -9.9323 19-23 -6.2961 -7.4257 -8.7770 -6.8671 23 and over -6.4185 -6.5761 -7.7425 -4.8610 Cohort (ref=oldest) Middle 0.0300 0.0765 0.9605 ** 0.0971 Youngest -0.5376 ** -0.5550 * 0.7569 * -0.4294 ** Log likelihood -8583.595 Italy, Women Baseline log-rates 15-19 -7.0896 -7.9471 -9.3508 -6.2419 19-23 -6.4220 -7.0431 -8.9078 -4.6254 23 and over -6.5856 -6.8751 -8.1025 -4.2555 Cohort (ref=oldest) Middle 0.0321 -0.1929 0.7675 ** -0.2499 ** Youngest -0.0784 -1.0528 ** 1.0189 ** -1.0041 ** Log likelihood -22422.72 Spain, Women Baseline log-rates 15-19 -6.9017 -8.4312 -10.5899 -7.4488 19-23 -6.3817 -6.9521 -9.6463 -5.1540 23 and over -6.5734 -6.3578 -8.4471 -4.3238 Cohort (ref=oldest) Middle -0.0208 -0.1353 1.1973 ** 0.1208 * Youngest -0.1916 + -0.4216 ** 1.9178 ** -0.4542 ** Log likelihood -18551.99
Note: ** p<0.01, * p<0.05, + p< 0.1. Source: own elaboration of FFS microdata.
24 FERTILITY AND PARTNERSHIP IN EUROPE
Table 2.2. Multiple destination model with age-specific proportional hazards (only cohort effects)
Destinations Residential autonomy
Patrilocal union
Neolocal cohabitation
Neolocal marriage
Estimate p Estimate p Estimate p Estimate p Italy, Men Baseline log-rates 15-19 -5.9722 -17.2535 -17.9332 -10.2045 19-23 -5.7921 -7.9258 -8.2577 -5.8394 23 and over -7.3564 -6.4695 -8.2379 -4.5129 Cohort (ref=oldest) Middle (15-19) -0.2757 8.5804 8.0203 1.2801 Middle (19-23) -0.2959 -0.4944 -0.4321 -0.6769 * Middle (23 and over) 0.7034 + -0.8889 * 0.8587 -0.2920 ** Youngest (15-19) -0.9649 ** 7.4352 0.0000 -5.1295 Youngest (19-23) -0.5555 * -0.1335 0.1993 -3.2688 ** Youngest (23 and over) 0.2750 -0.5930 -0.0444 -1.4275 ** Log likelihood -4965.277 Spain, Men Baseline log-rates 15-19 -6.3320 -15.8941 -16.3968 -10.1545 19-23 -6.3516 -7.7557 -9.2020 -7.2936 23 and over -6.6914 -6.4585 -7.6491 -4.8302 Cohort (ref=oldest) Middle (15-19) -0.5554 * 7.5322 6.0111 0.5015 Middle (19-23) 0.1649 0.4612 1.3736 + 0.3558 Middle (23 and over) 0.3243 -0.1517 0.8677 ** 0.0817 Youngest (15-19) -1.4710 ** 0.0000 5.8724 -0.2751 Youngest (19-23) -0.5351 * -0.0099 1.2932 + 0.4366 Youngest (23 and over) 0.2159 -0.7253 * 0.5829 -0.5892 ** Log likelihood -8559.27 Italy, Women Baseline log-rates 15-19 -6.8558 -8.0163 -9.5229 -6.2814 19-23 -6.6143 -6.9708 -8.7253 -4.5293 23 and over -6.6122 -6.9136 -8.1333 -4.3351 Cohort (ref=oldest) Middle (15-19) -0.1029 0.1033 0.8111 0.0330 Middle (19-23) 0.1262 -0.2796 0.4416 -0.3874 ** Middle (23 and over) 0.0831 -0.2759 0.9058 * -0.1962 ** Youngest (15-19) -0.7072 ** -1.4632 ** 1.3109 * -1.5343 ** Youngest (19-23) 0.3170 * -1.2609 ** 0.8708 * -1.2359 ** Youngest (23 and over) -0.0647 -0.4904 0.8782 * -0.5813 ** Log likelihood -22382.61 Spain, Women Baseline log-rates 15-19 -6.5835 -9.7580 -9.8983 -7.4530 19-23 -6.3482 -7.2092 -9.8113 -5.2673 23 and over -7.1077 -6.1217 -8.5613 -4.2725 Cohort (ref=oldest) Middle (15-19) -0.3818 * 1.6374 * 0.1922 -0.0082 Middle (19-23) -0.1159 0.1571 1.3422 + 0.3066 ** Middle (23 and over) 0.6463 ** -0.5238 ** 1.3693 ** 0.0361 Youngest (15-19) -0.8138 ** 1.0036 1.2413 + -0.2706 Youngest (19-23) -0.1949 0.0140 2.1058 ** -0.3370 ** Youngest (23 and over) 0.6444 ** -0.9115 ** 2.0153 ** -0.5280 ** Log likelihood -18525.42
Note: ** p<0.01, * p<0.05, + p< 0.1. Source: own elaboration of FFS microdata
HOUSEHOLD AND UNION FORMATION IN A MEDITERRANEAN FASHION 25
25
The oldest cohort experienced residential autonomy by age 23 at higher rates for men than for women, in particular in Italy (Figure 2.3a). The clearest evolution from the estimates presented in Tables 2.1 and 1.2 (first column) is one of a convergence towards lower rates. At the younger ages of 15-23 in which the departures for study and work are mostly concentrated, Italian men leave home without immediate union formation less frequently than in the past. One can see an almost identical evolution among Spanish men. The narrowing gender gap we expected is decidedly present and interesting. Among Italian women in the youngest cohort, a lower rate for the ages up to 19 - a direction of change analogous to that of Italian men – goes hand-in-hand with a higher rate for the university group aged 19-23. The effect according to age is equally non-linear among young Spanish women. This shows that the extended participation in the education system in both countries has primed a dynamism that leads to a reduction in the differences between men and women.
Examining patrilocal unions,
Figure 2.3b shows that in Italy the rates for the oldest cohort were slightly higher for women at the lower ages, and for men over age 23. This might reflect the impact of pre-union pregnancies and/or the patrilocal traditional models that influence certain Italian regions (we shall return to this point). In Spain the pattern is reversed: while Spanish men have rates that are essentially indistinguishable from their Italian counterparts, at higher ages Spanish women have higher rates. Moving to cohort dynamics as presented in Tables 2.1 and 2.2 (second column), we see that for Italian and Spanish men, the rate decreases, although not always in a statistically significant way. Unfortunately, the limited sample size and number of events cannot help us in a finer interpretation. Among Italian women we notice a clear reduction in the youngest cohort. Such an effect appears at all ages, but in particular at the two youngest (15-23). The reduction in rates for Spanish women is much less clear, with a significantly lower average rate for the
youngest cohort, however, at age 23 and over only.
As regards neolocal cohabitation
(Figure 2.3c), the magnitude of the transition rates is clearly lower than for any of the other destinations. For Italian men, although the coefficients are positive, no statistically significant trend is observed across cohorts (Tables 2.1 and 2.2, third column). The propensity to experience this destination is clearly higher among younger Spanish men. Although the cohort effect is not linear, for the youngest among them the average rate is more than double, highlighting a greater divergence between men in the two countries in the experience of this type of destination. Italian women, on the other hand, do show an increasing average rate across cohorts. For the youngest cohort the effect is positive at all ages. This upward trend is even more pronounced among Spanish women. The youngest female cohort has an average rate of experiencing this destination that is about 7 times that of the oldest female cohort. This effect is present at all age groups, but strongest at the two oldest (19+).
Neolocal marriage is the option
with the highest rates (Figure 2.3d). From a cohort perspective (Table 2.1 and 2.2, fourth column), a lower average rate is noted for Italian men of the middle and youngest cohort. It is substantially lower at all age groups (except 15-19, which is statistically insignificant because of very few marriages). The reduction is decidedly less noticeable for Spanish men. In particular, in the youngest cohort the effect is only important at age 23 and over, where most of the events are concentrated. Examining Italian women, we notice, in this case too, a declining average transition rate across cohorts. The propensity decreases for age groups 19+ in the middle cohort, and at all ages in the youngest cohort. For Spanish women, the effect is non-linear. This is particularly due to the greater propensity (+0.31) of those between 19 and 23 years of age in the middle cohort. The youngest women, however, have a lower transition rate at all ages.
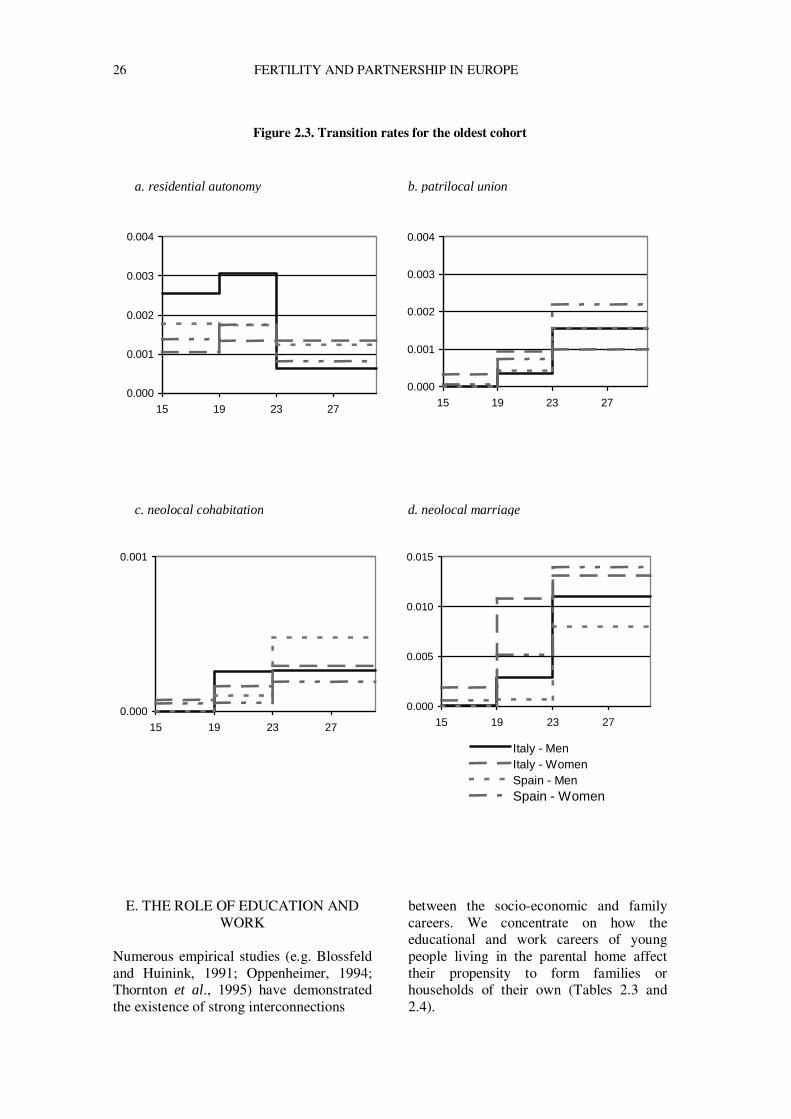
26 FERTILITY AND PARTNERSHIP IN EUROPE
Figure 2.3. Transition rates for the oldest cohort
E. THE ROLE OF EDUCATION AND WORK
Numerous empirical studies (e.g. Blossfeld and Huinink, 1991; Oppenheimer, 1994; Thornton et al., 1995) have demonstrated the existence of strong interconnections
between the socio-economic and family careers. We concentrate on how the educational and work careers of young people living in the parental home affect their propensity to form families or households of their own (Tables 2.3 and 2.4).
0.000
0.001
15 19 23 27
0.000
0.005
0.010
0.015
15 19 23 27
Italy - MenItaly - WomenSpain - MenSpain - Women
a. residential autonomy b. patrilocal union
c. neolocal cohabitation d. neolocal marriage
0.000
0.001
0.002
0.003
0.004
15 19 23 27
0.000
0.001
0.002
0.003
0.004
15 19 23 27
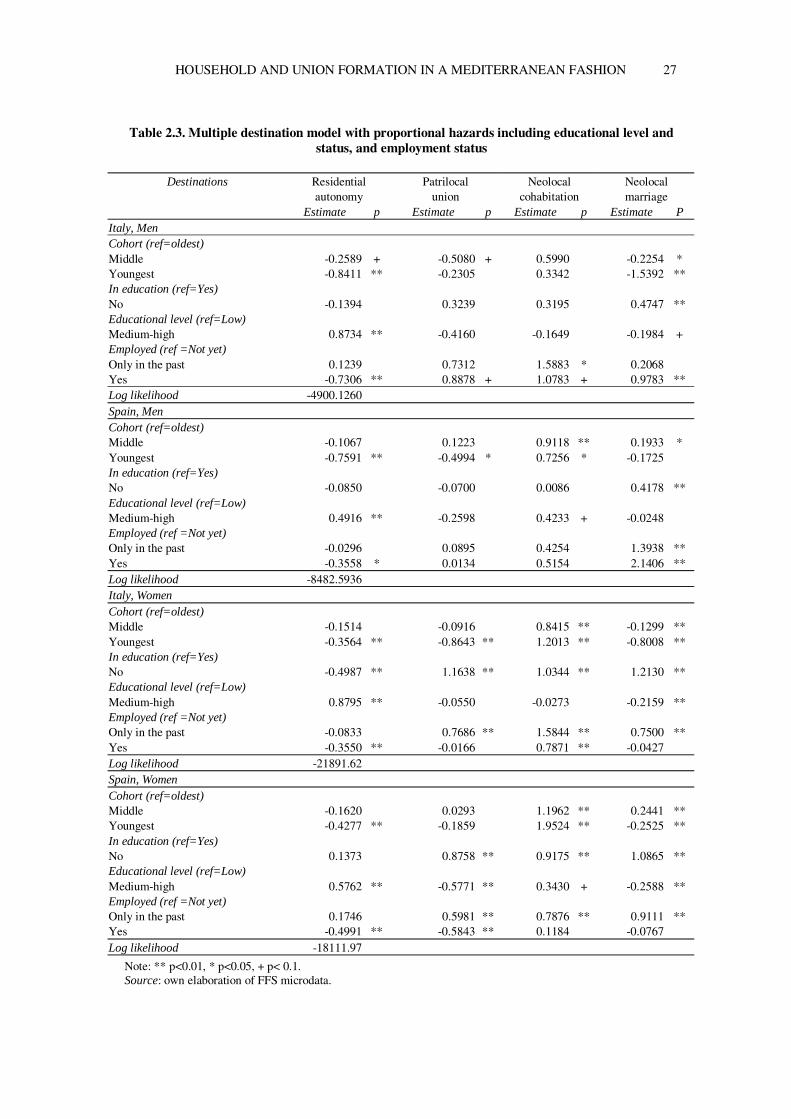
HOUSEHOLD AND UNION FORMATION IN A MEDITERRANEAN FASHION 27
Table 2.3. Multiple destination model with proportional hazards including educational level and
status, and employment status
Destinations
Residential autonomy
Patrilocal union
Neolocal cohabitation
Neolocal marriage
Estimate p Estimate p Estimate p Estimate P Italy, Men Cohort (ref=oldest) Middle -0.2589 + -0.5080 + 0.5990 -0.2254 * Youngest -0.8411 ** -0.2305 0.3342 -1.5392 ** In education (ref=Yes) No -0.1394 0.3239 0.3195 0.4747 ** Educational level (ref=Low) Medium-high 0.8734 ** -0.4160 -0.1649 -0.1984 + Employed (ref =Not yet) Only in the past 0.1239 0.7312 1.5883 * 0.2068 Yes -0.7306 ** 0.8878 + 1.0783 + 0.9783 ** Log likelihood -4900.1260 Spain, Men Cohort (ref=oldest) Middle -0.1067 0.1223 0.9118 ** 0.1933 * Youngest -0.7591 ** -0.4994 * 0.7256 * -0.1725 In education (ref=Yes) No -0.0850 -0.0700 0.0086 0.4178 ** Educational level (ref=Low) Medium-high 0.4916 ** -0.2598 0.4233 + -0.0248 Employed (ref =Not yet) Only in the past -0.0296 0.0895 0.4254 1.3938 ** Yes -0.3558 * 0.0134 0.5154 2.1406 ** Log likelihood -8482.5936 Italy, Women Cohort (ref=oldest) Middle -0.1514 -0.0916 0.8415 ** -0.1299 ** Youngest -0.3564 ** -0.8643 ** 1.2013 ** -0.8008 ** In education (ref=Yes) No -0.4987 ** 1.1638 ** 1.0344 ** 1.2130 ** Educational level (ref=Low) Medium-high 0.8795 ** -0.0550 -0.0273 -0.2159 ** Employed (ref =Not yet) Only in the past -0.0833 0.7686 ** 1.5844 ** 0.7500 ** Yes -0.3550 ** -0.0166 0.7871 ** -0.0427 Log likelihood -21891.62 Spain, Women Cohort (ref=oldest) Middle -0.1620 0.0293 1.1962 ** 0.2441 ** Youngest -0.4277 ** -0.1859 1.9524 ** -0.2525 ** In education (ref=Yes) No 0.1373 0.8758 ** 0.9175 ** 1.0865 ** Educational level (ref=Low) Medium-high 0.5762 ** -0.5771 ** 0.3430 + -0.2588 ** Employed (ref =Not yet) Only in the past 0.1746 0.5981 ** 0.7876 ** 0.9111 ** Yes -0.4991 ** -0.5843 ** 0.1184 -0.0767 Log likelihood -18111.97
Note: ** p<0.01, * p<0.05, + p< 0.1. Source: own elaboration of FFS microdata.
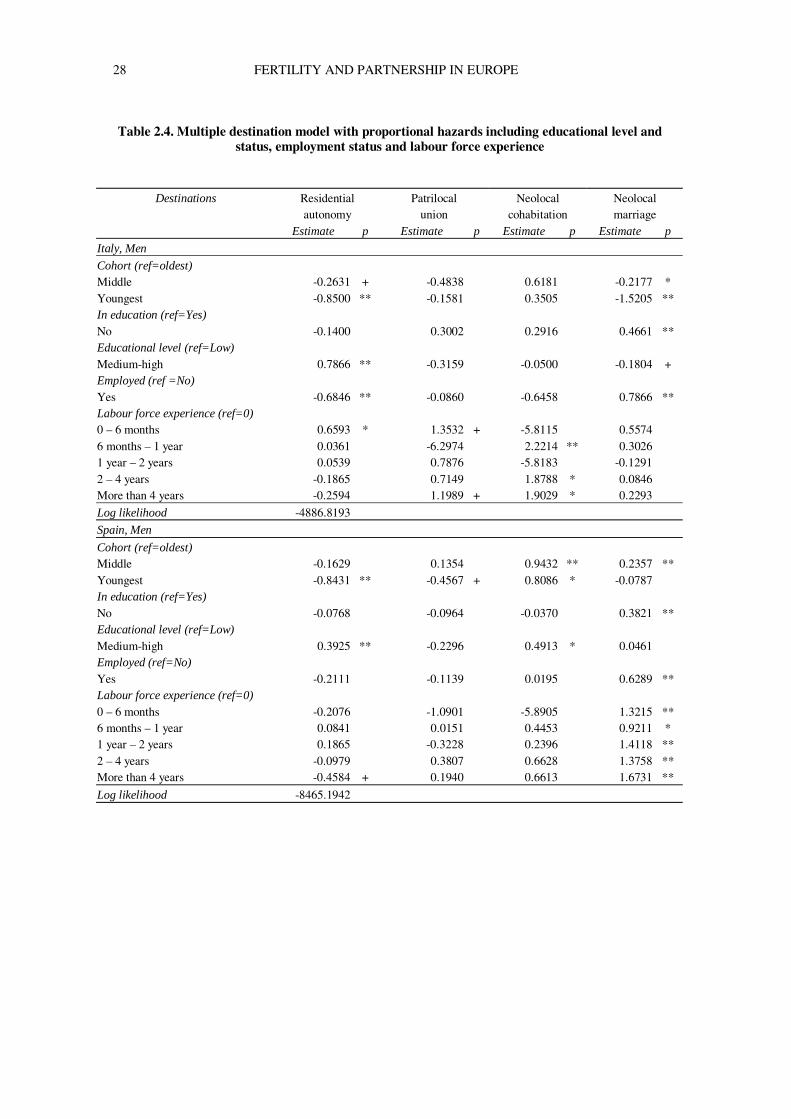
28 FERTILITY AND PARTNERSHIP IN EUROPE
Table 2.4. Multiple destination model with proportional hazards including educational level and
status, employment status and labour force experience
Destinations
Residential autonomy
Patrilocal union
Neolocal cohabitation
Neolocal marriage
Estimate p Estimate p Estimate p Estimate p
Italy, Men
Cohort (ref=oldest) Middle -0.2631 + -0.4838 0.6181 -0.2177 * Youngest -0.8500 ** -0.1581 0.3505 -1.5205 ** In education (ref=Yes) No -0.1400 0.3002 0.2916 0.4661 ** Educational level (ref=Low) Medium-high 0.7866 ** -0.3159 -0.0500 -0.1804 + Employed (ref =No) Yes -0.6846 ** -0.0860 -0.6458 0.7866 ** Labour force experience (ref=0) 0 – 6 months 0.6593 * 1.3532 + -5.8115 0.5574 6 months – 1 year 0.0361 -6.2974 2.2214 ** 0.3026 1 year – 2 years 0.0539 0.7876 -5.8183 -0.1291 2 – 4 years -0.1865 0.7149 1.8788 * 0.0846 More than 4 years -0.2594 1.1989 + 1.9029 * 0.2293
Log likelihood -4886.8193
Spain, Men
Cohort (ref=oldest) Middle -0.1629 0.1354 0.9432 ** 0.2357 ** Youngest -0.8431 ** -0.4567 + 0.8086 * -0.0787 In education (ref=Yes) No -0.0768 -0.0964 -0.0370 0.3821 ** Educational level (ref=Low) Medium-high 0.3925 ** -0.2296 0.4913 * 0.0461 Employed (ref=No) Yes -0.2111 -0.1139 0.0195 0.6289 ** Labour force experience (ref=0) 0 – 6 months -0.2076 -1.0901 -5.8905 1.3215 ** 6 months – 1 year 0.0841 0.0151 0.4453 0.9211 * 1 year – 2 years 0.1865 -0.3228 0.2396 1.4118 ** 2 – 4 years -0.0979 0.3807 0.6628 1.3758 ** More than 4 years -0.4584 + 0.1940 0.6613 1.6731 **
Log likelihood -8465.1942
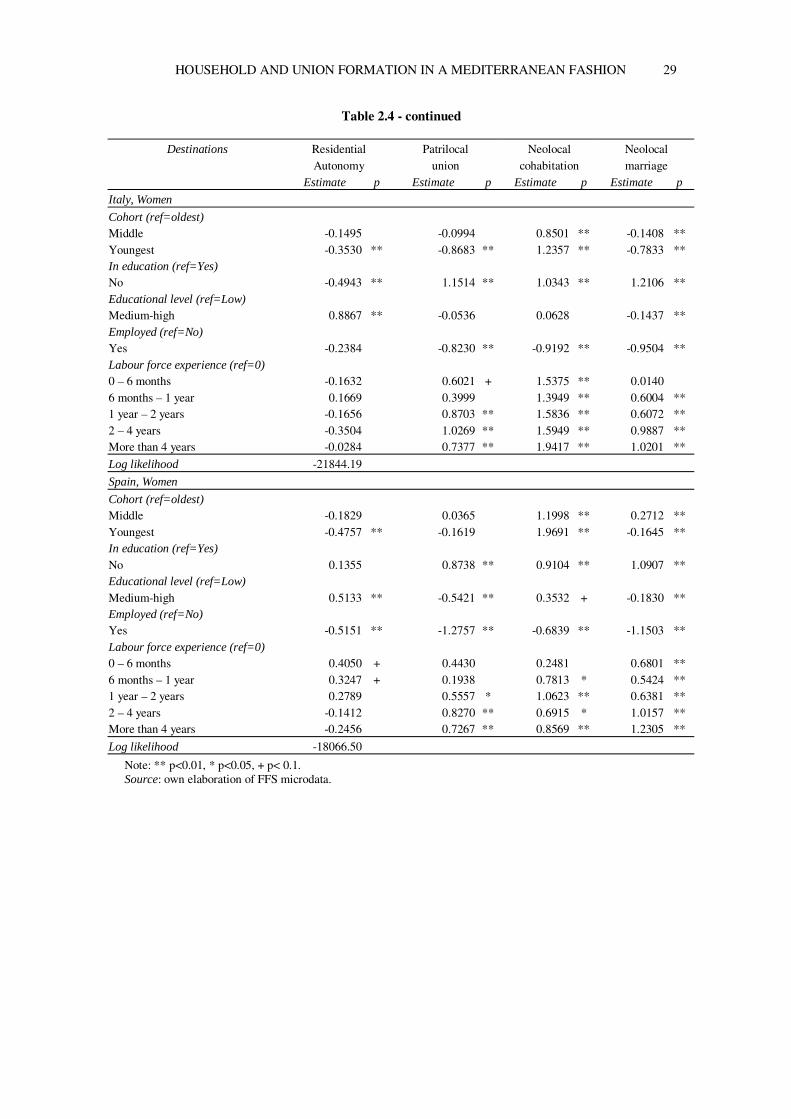
HOUSEHOLD AND UNION FORMATION IN A MEDITERRANEAN FASHION 29
Table 2.4 - continued
Destinations
Residential Autonomy
Patrilocal union
Neolocal cohabitation
Neolocal marriage
Estimate p Estimate p Estimate p Estimate p
Italy, Women
Cohort (ref=oldest) Middle -0.1495 -0.0994 0.8501 ** -0.1408 ** Youngest -0.3530 ** -0.8683 ** 1.2357 ** -0.7833 ** In education (ref=Yes) No -0.4943 ** 1.1514 ** 1.0343 ** 1.2106 ** Educational level (ref=Low) Medium-high 0.8867 ** -0.0536 0.0628 -0.1437 ** Employed (ref=No) Yes -0.2384 -0.8230 ** -0.9192 ** -0.9504 ** Labour force experience (ref=0) 0 – 6 months -0.1632 0.6021 + 1.5375 ** 0.0140 6 months – 1 year 0.1669 0.3999 1.3949 ** 0.6004 ** 1 year – 2 years -0.1656 0.8703 ** 1.5836 ** 0.6072 ** 2 – 4 years -0.3504 1.0269 ** 1.5949 ** 0.9887 ** More than 4 years -0.0284 0.7377 ** 1.9417 ** 1.0201 **
Log likelihood -21844.19
Spain, Women
Cohort (ref=oldest) Middle -0.1829 0.0365 1.1998 ** 0.2712 ** Youngest -0.4757 ** -0.1619 1.9691 ** -0.1645 ** In education (ref=Yes) No 0.1355 0.8738 ** 0.9104 ** 1.0907 ** Educational level (ref=Low) Medium-high 0.5133 ** -0.5421 ** 0.3532 + -0.1830 ** Employed (ref=No) Yes -0.5151 ** -1.2757 ** -0.6839 ** -1.1503 ** Labour force experience (ref=0) 0 – 6 months 0.4050 + 0.4430 0.2481 0.6801 ** 6 months – 1 year 0.3247 + 0.1938 0.7813 * 0.5424 ** 1 year – 2 years 0.2789 0.5557 * 1.0623 ** 0.6381 ** 2 – 4 years -0.1412 0.8270 ** 0.6915 * 1.0157 ** More than 4 years -0.2456 0.7267 ** 0.8569 ** 1.2305 **
Log likelihood -18066.50
Note: ** p<0.01, * p<0.05, + p< 0.1. Source: own elaboration of FFS microdata.
30 FERTILITY AND PARTNERSHIP IN EUROPE
To understand the role of the educational career, the effect of school enrolment is separated from the effect of the educational level attained (Blossfeld and Huinink, 1991; Ongaro, 2001). We thus identify two time-varying components: one linked to being within the educational system or not, and one that expresses the amount of cultural and economic resources (low or medium to high) that a particular educational credential represents. In order to better evaluate the effects of the work career on various destinations, a distinction is made between an individual’s current work status and his or her cumulative labour force experience in the past (Blossfeld and Rohwer, 1995). In the models presented, the work status is therefore represented by two time-varying covariates that tell us: a) the total labour force experience as expressed by a covariate that quantifies the cumulative time spent by the individual in the labour market (as a proxy of his or her economic resources); and, b) whether the individual is currently employed, non-employed but employed in the past, or not yet employed (without reference to labour force experience).
The various covariates may have
different effects depending on the family destination chosen and the country being examined. For instance, it may be true that in contemporary western societies students have generally a considerably lower propensity to form new families. But this can vary with the type of destination chosen, e.g., being a student may very well reduce the speed of entry into marriage but it can also promote various other forms of residential autonomy, whether for purposes of studying or cohabiting. It can also happen that social norms impose age limits that adolescents can not easily afford to surpass. Finally, policies may be in place that tend to render unemployed young people economically independent, or that facilitate combining an educational career with a family career.
The patterns of family formation in
Italy and Spain are still relatively traditional. Moreover, the educational
system in Italy is organised in rather long and rigid cycles. It is expected, therefore, that being an Italian student will slow down all transitions into a union and will favour, if anything, residential autonomy in order to follow university studies. We expect an attenuation of this negative relationship for the entry into those unions (patrilocal as well as non-marital) that require less investment of resources by the two spouses. We also expect an attenuation of this relationship in Spain where there is a more elastic education system. This makes it potentially easier to combine studies with work and/or family formation.
The importance of the education
level reached for the foundation of a new family is not always clear. Indeed, this variable often includes both cultural and economic elements. Moreover, in societies with still a traditional division of roles between men and women the level of education might have quite gender-specific effects (Blossfeld, 1995). Women with a higher level of education could be less prone to entry into a union (at least at younger ages) because of higher perceived opportunity costs of family life. Unmarried cohabitation is perhaps an exception. On the contrary, a higher qualification as an indicator of greater economic capacity could accelerate the entry into a union, and particularly into neolocal marriages. Higher educational attainment should also allow for more residential autonomy among the young, as a result of higher employment mobility but also as a result of greater economic wealth. What is expected therefore for Italy and Spain is that the effect of the educational level attained will be gender- and destination-specific. Higher levels of education among women are expected to slow down the entry into marriage (neolocal as well as patrilocal) but to accelerate the entry into consensual unions. The effect of the level of education on women's residential autonomy is, on the other hand, less certain. Among men, a higher educational attainment is expected to favour the transition to neolocal marriages, non-marital cohabitation and other forms of residential autonomy but to reduce the propensity to form a patrilocal union.
HOUSEHOLD AND UNION FORMATION IN A MEDITERRANEAN FASHION 31
In societies where men are still (although in a decreasing measure) the principal income providers for the family, such as in Italy and Spain, the effect of working status is generally gender-specific. We expect therefore that the condition of being employed will favour the entry into a union for men, and the more so as work experience increases. However, the weight of this status is expected to be weaker in the case of patrilocal marriages and non-marital cohabitation. For women, instead, having a job may have opposing effect on the entry into a union. On the one hand, as a proxy of greater autonomy, it could imply a disincentive to get married, especially if it means staying in the parental home. On the other hand, as a proxy of reaching a goal that has to be obtained before the formation of a family, it could speed up the entry into a union. The effect that having a job could have for men and women on their propensity to form a non-family household is more dubious because it is most likely to be conditioned by the very reasons (job search or the desire for independence) that pushed them out of the parental home to begin with.
1. The transition to residential autonomy
The conditions that lead a young person to leave the parental home in order to form a separate household show some common features in Italy and Spain.
In Italy, being a student promotes
residential autonomy, particularly among women. Female students have a risk of going to live on their own that is 65 per cent higher than those who have completed their studies; among men the same risk is, instead, a non-significant 15 per cent higher (Table 2.3). In Spain, on the other hand, being in education has little (for women) or even no (for men) relevance for young people leaving the parental home. This might be partly explained by the fact that until very recently, unless their field of study was unavailable, students had to enter the university in the district where they lived.
The effect of the work career on residential independence is similar in both countries. What seems to push young people towards housing autonomy is the need to find a (first or new) job by migrating to areas with greater employment opportunities.
Whatever the status occupied in the
two parallel careers (student only, employed only, student and employed), educational attainment has a certain importance in influencing the behaviour of individuals. Those with a higher attainment level show in fact a greater propensity for reaching residential autonomy than those with lower education. This is more evident in Italy than in Spain, but true in both countries and for both sexes. For instance, Italian men with medium to high qualifications have a risk of leaving their family of origin that is more than twice the risk of their fellow countrymen with low levels. This suggests that a higher attainment does not only offer greater economic resources for establishing residential autonomy but may also promote a greater willingness to migrate for purposes of work.
In Italy and Spain, therefore,
attaining residential autonomy seems to be more the result of external structural conditions than of young people’s desire to detach themselves from the family of origin.
2. The transition to neolocal marriages
The completion of education represents both in Italy and Spain an important threshold for entering the marriage market. Once a person is no longer a student, the risk of getting married and establishing a family out of the parental home is in both countries higher for women than for men. Women who have finished their education have a risk of getting married that is about three times that of female students. Men who have finished their education face instead a risk of getting married that is only 50 per cent higher than that of male students.
32 FERTILITY AND PARTNERSHIP IN EUROPE
The existence of gender-specific behaviour models is also confirmed by the examination of the effects of the employment career on the formation of a marital union. Having a job encourages Italian and Spanish men to enter more quickly into married life than those without a job. The opportunity to form a new household is partly conditioned by the economic capacity of the man to sustain it. And indeed, as we move from those who have never worked yet to those who have done so only in the past to those who are currently employed, the transition rate to a neolocal marriage grows. Moreover, as Table 2.4 demonstrates for Spanish men, the risk of getting married seems to have a U-shaped distribution, with the highest values during the first few months of work experience and then again after a relatively long career. It is also possible that considerations related to the nature of the job (more or less stable, for example, or more or less well paid) influence this result. Among women - both Italian and Spanish – we find a higher risk of getting married and forming a new household for those who are currently not employed but who have worked in the past, and this risk grows with the duration of their work experience. Currently working women and those who have never worked display the same (lower) risks of entering marriage. But because this risk augments with the increase in work experience, it so happens that women who keep their job end up passing into marriage more quickly than those who have never entered the labour market. Thus, the negative effect of current employment might reflect a delaying effect, rather than an ultimate lower propensity to marry. Nevertheless, the fact that the highest risk of getting married pertains to women employed in the past but not at the time of exposure is somewhat surprising. It might be the case that they - having already shown a certain working ability in the past - represent relatively more interesting partners than others on a marriage market where the economic contribution of women is still considered subordinate to that of men. Alternatively, it might also be the case that they are more willing to invest in a life as a couple than other women.
A higher level of education generally delays the formation of a neolocal marital union. In Italy this is true for men and women, in Spain only for women. For women this result confirms the hypothesis of the presence of a conflict between investment in one’s self and investment in family life. On the other hand, it is more difficult to interpret the behaviour of Italian men with medium to high attainment who show - as will be seen later - a slower speed of entry into any type of union. If we disregard this last result, the effect of the two parallel socio-economic careers on the formation of neolocal marital unions is similar in Italy and Spain. That is, in both countries the presence of a traditional family model means that the effect of such careers is different for men and women, but essentially homogeneous within each sex.
3. The transition to patrilocal unions
Unions (almost always marriages) in which the partners decide to live with the parents of one of them (patrilocal unions) are widespread above all in some regions of the north-east and centre of Italy; this is connected to the economic context of those areas (Cantisani and Dalla Zuanna, 1996; May, 1990). In Spain coresidence with the parents is more frequent in the northern and north-eastern regions, and has been historically linked to patterns of indivisible inheritance (Reher, 1997). The available data do not actually allow us to understand the phenomenon in its entirety, because they only reveal whether young people entering into a union have maintained residence in their own parental home. If they went to live in the parental home of their partner, then - mistakenly - a neolocal union would be recorded.
In Italy, the factors that accelerate
entry into a patrilocal marriage do not differ so much from those that apply to entry into a neolocal marriage. For men, the conditions that facilitate the formation of this type of union are: a) the completion of education (although the coefficient is not significant); b) having had and, above all, currently having a job (the risks for both groups show a U-shaped effect indicating
HOUSEHOLD AND UNION FORMATION IN A MEDITERRANEAN FASHION 33
that both the initial and the advanced stages of the work career are the most crucial moments); and, c) having attained a low educational level (although the coefficient is again insignificant). Among Italian women, the completion of studies and an occupation in the past accelerate the entry into patrilocal unions but - contrary to that which occurs for neolocal marriages - the level of education does not seem to have any weight whatsoever in the transition towards this destination.
The greatest differences in the
conditions that lead to patrilocal versus neolocal marriages are observed for Spain. For Spanish men, this destination seems to capture above all those with lower qualifications. For Spanish women, the transition rate increases if education has been completed, particularly at lower levels, and if the person has worked in the past but not in the present. Contrary to what happens to brides in neolocal households, having an occupation reduces the risk of entering a union while still in the parental home.
Despite some limitations in
interpretation due to the construction of the model, the results confirm the hypothesis that individuals who tend to have less cultural and economic resources are more at risk of making this type of transition. The phenomenon, however, seems to be more evident in Spain than in Italy. In Spain, the spouses (in particular men) who experience this form of marriage seem to be characterised by a general lack of resources and autonomy. It is suggested that in Italy this type of transition is mainly the result of region-specific cultural models, while in Spain it is more often the result of economic ties or solutions dictated by contingent reasons.
4. The transition to non-marital
cohabitation The entry into non-marital cohabitation that is here observed is the direct transition from the family of origin. The models do not, in fact, consider any other shift into a consensual union, and especially not those
formed after an initial period of residential autonomy, which is perhaps more frequent among students.
In Italy unmarried couple
formation is influenced, for men, by nearly the same factors that regulate their entry into marriage. The hazard of a man entering into a consensual union grows if he has completed his education (although the coefficient is not statistically significant), and if he has a job, or better still, if he has had one in the past. In any case, a high level of education reduces the probability of forming a consensual union. For Italian women, on the other hand, some differences can be observed between the determinants of entry into a neolocal marital and a neolocal nonmarital union. The completion of education is still significant but in this case it is also important to show some current work experience. However, past work experience is even more important.
Contrary to what is observed for
neolocal marriages, a higher qualification does not seem to deter entry into a consensual union. In Spain those who form a consensual union seem to have different characteristics from those who enter into consensual union in Italy. For Spanish men who enter a consensual union, particularly, having finished education or having had some sort of work is less important than for Italian men. Moreover, contrary to what happens in Italy, Spanish men who experience this kind of union tend to have medium to high educational levels. For Spanish women the factors that favour entry into non-marital cohabitation are the same as for Spanish men, except that for women it is important to have finished their education.
The phenomenon of leaving home
for non-marital cohabitation seems to have different connotations in Italy and Spain. In Italy consensual unions involve young people who are relatively independent from an economic point of view, and who do not seem to express new patterns of behaviour that break with tradition. In Spain, on the other hand, the phenomenon seems to be
34 FERTILITY AND PARTNERSHIP IN EUROPE
the experience of selected groups of individuals with a medium to high education who enter into non-marital cohabitation under conditions of greater weakness(es).
F. THE ROLE OF EARLY CHILDBEARING
Premarital conceptions traditionally accelerate the wedding, either because they bring forward weddings already planned, or because the couple decides to legalise their union before the arrival of the child (Vincent, 1961; Muñoz Perez, 1988), or because it is precisely the decision to marry that results in a higher risk of conception (Muñoz Perez, 1991). Naturally, if the pregnancy is unintended, it is more likely that the newly wed will stay - at least initially - with one of their parents, until a solution for autonomous residency is found. The same reasons that link conception with marriage can accelerate the start of non-marital cohabitation. These behaviours are highlighted in numerous studies (Brien et al., 1999; Goldscheider et al., 2001; Bracher and Santow, 1998; Santow and Bracher, 1994; Blom, 1994; Manning, 1993; 1995). The effects of conception on leaving the parental home without forming a union have been studied less.
Muñoz Perez (1991) has examined
the trend of premarital conceptions in Spain since the 1970s - an initial increase followed by a gradual decline - in the context of the spread of behaviours linked to the Second Demographic Transition. Comparable estimates for Italy (Castiglioni and Dalla Zuanna, 1994) suggest a similar trend. If in the end, therefore, shotgun marriages have decreased, we can imagine that they are more and more confined to particular subgroups of the population, which remain more anchored in traditional values. Moreover, if it is true that the decline in premarital pregnancies has been accompanied by the simultaneous spread of some other forms of new behaviour, we can expect, among the youngest women, an increase in living together after a conception. In our analyses we consider only conceptions resulting in a live birth.
The results for the female population in Table 2.5 reveal that a conception is a factor that accelerates neolocal as well as patrilocal marriages, both in Italy and in Spain. Moreover, this effect is stronger for the more recent cohorts, which show a pattern that increasingly opposes that of the general delay observed across the cohorts. With regard to leaving the parental home without forming a union, on the other hand, Italy and Spain show some differences: a pregnancy favours these transitions in the more recent cohorts in Italy, while in Spain this is less obvious (the coefficients are positive but statistically insignificant).
In the light of these results, we can
enrich the comparisons presented in the previous section, where it was concluded that residential autonomy in both countries seemed to depend above all on external structural conditions. Now we find that, in Italy at least, a conception before a union promotes the exit from the family of origin by women in the youngest cohorts, whatever their destination. If confirmed, could this be a sign of emerging new forms of autonomy from the parental family?
Conceptions in the youngest cohort
in Italy accelerate the transition towards all forms of family formation, including nonmarital cohabitation. Like the educational and work careers, this variable thus conditions the formation of all types of unions. In Spain, as we have seen, the social determinants of marriage and cohabitation are different. Also the presence of a conception influences the two transitions in different ways: it has positive effects on marriage, but it is irrelevant for non-marital cohabitation.
These considerations confirm
another result that was already presented in the previous section: non-marital cohabitation seems to have slightly different connotations in the two countries. In Italy, the choice for a consensual union is determined by a pregnancy as much as a choice for marriage is. In Spain, however, contrary to what happens to a marriage, a conception does not alter the probability of forming a consensual union.
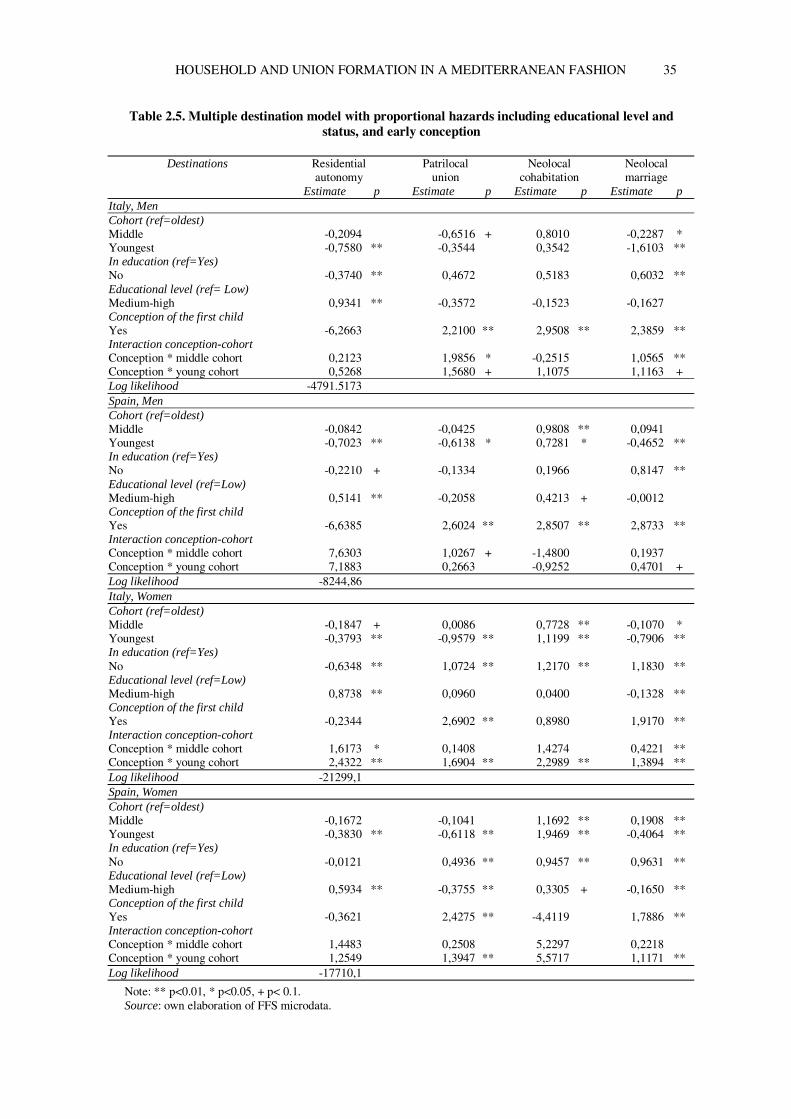
HOUSEHOLD AND UNION FORMATION IN A MEDITERRANEAN FASHION 35
Table 2.5. Multiple destination model with proportional hazards including educational level and status, and early conception
Destinations
Residential autonomy
Patrilocal union
Neolocal cohabitation
Neolocal marriage
Estimate p Estimate p Estimate p Estimate p Italy, Men Cohort (ref=oldest) Middle -0,2094 -0,6516 + 0,8010 -0,2287 * Youngest -0,7580 ** -0,3544 0,3542 -1,6103 ** In education (ref=Yes) No -0,3740 ** 0,4672 0,5183 0,6032 ** Educational level (ref= Low) Medium-high 0,9341 ** -0,3572 -0,1523 -0,1627 Conception of the first child Yes -6,2663 2,2100 ** 2,9508 ** 2,3859 ** Interaction conception-cohort Conception * middle cohort 0,2123 1,9856 * -0,2515 1,0565 ** Conception * young cohort 0,5268 1,5680 + 1,1075 1,1163 + Log likelihood -4791.5173 Spain, Men Cohort (ref=oldest) Middle -0,0842 -0,0425 0,9808 ** 0,0941 Youngest -0,7023 ** -0,6138 * 0,7281 * -0,4652 ** In education (ref=Yes) No -0,2210 + -0,1334 0,1966 0,8147 ** Educational level (ref=Low) Medium-high 0,5141 ** -0,2058 0,4213 + -0,0012 Conception of the first child Yes -6,6385 2,6024 ** 2,8507 ** 2,8733 ** Interaction conception-cohort Conception * middle cohort 7,6303 1,0267 + -1,4800 0,1937 Conception * young cohort 7,1883 0,2663 -0,9252 0,4701 + Log likelihood -8244,86 Italy, Women Cohort (ref=oldest) Middle -0,1847 + 0,0086 0,7728 ** -0,1070 * Youngest -0,3793 ** -0,9579 ** 1,1199 ** -0,7906 ** In education (ref=Yes) No -0,6348 ** 1,0724 ** 1,2170 ** 1,1830 ** Educational level (ref=Low) Medium-high 0,8738 ** 0,0960 0,0400 -0,1328 ** Conception of the first child Yes -0,2344 2,6902 ** 0,8980 1,9170 ** Interaction conception-cohort Conception * middle cohort 1,6173 * 0,1408 1,4274 0,4221 ** Conception * young cohort 2,4322 ** 1,6904 ** 2,2989 ** 1,3894 ** Log likelihood -21299,1 Spain, Women Cohort (ref=oldest) Middle -0,1672 -0,1041 1,1692 ** 0,1908 ** Youngest -0,3830 ** -0,6118 ** 1,9469 ** -0,4064 ** In education (ref=Yes) No -0,0121 0,4936 ** 0,9457 ** 0,9631 ** Educational level (ref=Low) Medium-high 0,5934 ** -0,3755 ** 0,3305 + -0,1650 ** Conception of the first child Yes -0,3621 2,4275 ** -4,4119 1,7886 ** Interaction conception-cohort Conception * middle cohort 1,4483 0,2508 5,2297 0,2218 Conception * young cohort 1,2549 1,3947 ** 5,5717 1,1171 ** Log likelihood -17710,1
Note: ** p<0.01, * p<0.05, + p< 0.1. Source: own elaboration of FFS microdata.
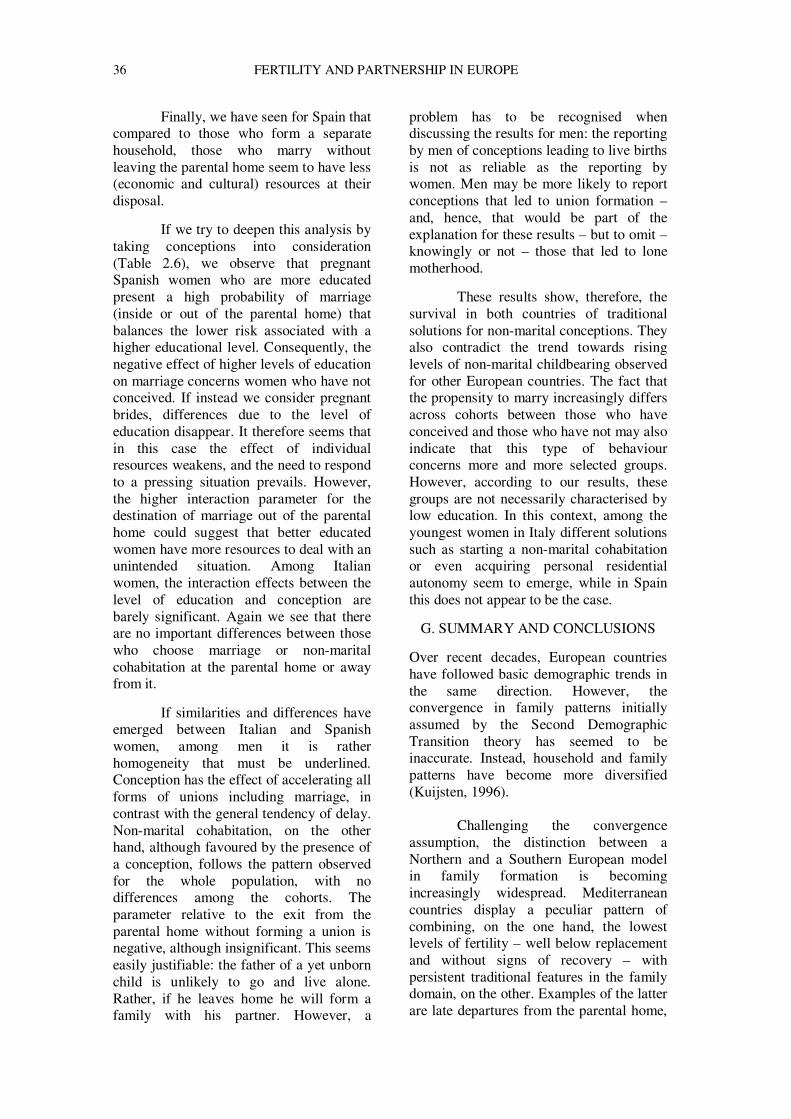
36 FERTILITY AND PARTNERSHIP IN EUROPE
Finally, we have seen for Spain that compared to those who form a separate household, those who marry without leaving the parental home seem to have less (economic and cultural) resources at their disposal.
If we try to deepen this analysis by
taking conceptions into consideration (Table 2.6), we observe that pregnant Spanish women who are more educated present a high probability of marriage (inside or out of the parental home) that balances the lower risk associated with a higher educational level. Consequently, the negative effect of higher levels of education on marriage concerns women who have not conceived. If instead we consider pregnant brides, differences due to the level of education disappear. It therefore seems that in this case the effect of individual resources weakens, and the need to respond to a pressing situation prevails. However, the higher interaction parameter for the destination of marriage out of the parental home could suggest that better educated women have more resources to deal with an unintended situation. Among Italian women, the interaction effects between the level of education and conception are barely significant. Again we see that there are no important differences between those who choose marriage or non-marital cohabitation at the parental home or away from it.
If similarities and differences have
emerged between Italian and Spanish women, among men it is rather homogeneity that must be underlined. Conception has the effect of accelerating all forms of unions including marriage, in contrast with the general tendency of delay. Non-marital cohabitation, on the other hand, although favoured by the presence of a conception, follows the pattern observed for the whole population, with no differences among the cohorts. The parameter relative to the exit from the parental home without forming a union is negative, although insignificant. This seems easily justifiable: the father of a yet unborn child is unlikely to go and live alone. Rather, if he leaves home he will form a family with his partner. However, a
problem has to be recognised when discussing the results for men: the reporting by men of conceptions leading to live births is not as reliable as the reporting by women. Men may be more likely to report conceptions that led to union formation – and, hence, that would be part of the explanation for these results – but to omit – knowingly or not – those that led to lone motherhood.
These results show, therefore, the
survival in both countries of traditional solutions for non-marital conceptions. They also contradict the trend towards rising levels of non-marital childbearing observed for other European countries. The fact that the propensity to marry increasingly differs across cohorts between those who have conceived and those who have not may also indicate that this type of behaviour concerns more and more selected groups. However, according to our results, these groups are not necessarily characterised by low education. In this context, among the youngest women in Italy different solutions such as starting a non-marital cohabitation or even acquiring personal residential autonomy seem to emerge, while in Spain this does not appear to be the case.
G. SUMMARY AND CONCLUSIONS Over recent decades, European countries have followed basic demographic trends in the same direction. However, the convergence in family patterns initially assumed by the Second Demographic Transition theory has seemed to be inaccurate. Instead, household and family patterns have become more diversified (Kuijsten, 1996).
Challenging the convergence assumption, the distinction between a Northern and a Southern European model in family formation is becoming increasingly widespread. Mediterranean countries display a peculiar pattern of combining, on the one hand, the lowest levels of fertility – well below replacement and without signs of recovery – with persistent traditional features in the family domain, on the other. Examples of the latter are late departures from the parental home,
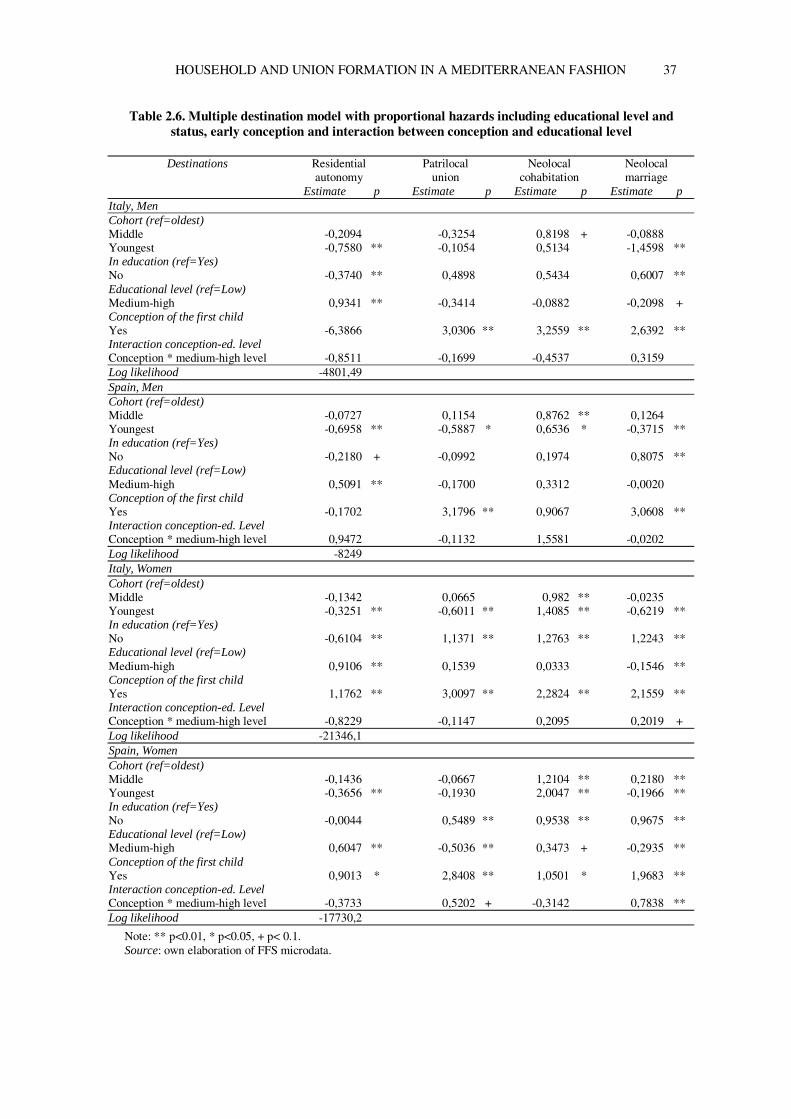
HOUSEHOLD AND UNION FORMATION IN A MEDITERRANEAN FASHION 37
Table 2.6. Multiple destination model with proportional hazards including educational level and status, early conception and interaction between conception and educational level
Destinations
Residential autonomy
Patrilocal union
Neolocal cohabitation
Neolocal marriage
Estimate p Estimate p Estimate p Estimate p Italy, Men Cohort (ref=oldest) Middle -0,2094 -0,3254 0,8198 + -0,0888 Youngest -0,7580 ** -0,1054 0,5134 -1,4598 ** In education (ref=Yes) No -0,3740 ** 0,4898 0,5434 0,6007 ** Educational level (ref=Low) Medium-high 0,9341 ** -0,3414 -0,0882 -0,2098 + Conception of the first child Yes -6,3866 3,0306 ** 3,2559 ** 2,6392 ** Interaction conception-ed. level Conception * medium-high level -0,8511 -0,1699 -0,4537 0,3159 Log likelihood -4801,49 Spain, Men Cohort (ref=oldest) Middle -0,0727 0,1154 0,8762 ** 0,1264 Youngest -0,6958 ** -0,5887 * 0,6536 * -0,3715 ** In education (ref=Yes) No -0,2180 + -0,0992 0,1974 0,8075 ** Educational level (ref=Low) Medium-high 0,5091 ** -0,1700 0,3312 -0,0020 Conception of the first child Yes -0,1702 3,1796 ** 0,9067 3,0608 ** Interaction conception-ed. Level Conception * medium-high level 0,9472 -0,1132 1,5581 -0,0202 Log likelihood -8249 Italy, Women Cohort (ref=oldest) Middle -0,1342 0,0665 0,982 ** -0,0235 Youngest -0,3251 ** -0,6011 ** 1,4085 ** -0,6219 ** In education (ref=Yes) No -0,6104 ** 1,1371 ** 1,2763 ** 1,2243 ** Educational level (ref=Low) Medium-high 0,9106 ** 0,1539 0,0333 -0,1546 ** Conception of the first child Yes 1,1762 ** 3,0097 ** 2,2824 ** 2,1559 ** Interaction conception-ed. Level Conception * medium-high level -0,8229 -0,1147 0,2095 0,2019 + Log likelihood -21346,1 Spain, Women Cohort (ref=oldest) Middle -0,1436 -0,0667 1,2104 ** 0,2180 ** Youngest -0,3656 ** -0,1930 2,0047 ** -0,1966 ** In education (ref=Yes) No -0,0044 0,5489 ** 0,9538 ** 0,9675 ** Educational level (ref=Low) Medium-high 0,6047 ** -0,5036 ** 0,3473 + -0,2935 ** Conception of the first child Yes 0,9013 * 2,8408 ** 1,0501 * 1,9683 ** Interaction conception-ed. Level Conception * medium-high level -0,3733 0,5202 + -0,3142 0,7838 ** Log likelihood -17730,2
Note: ** p<0.01, * p<0.05, + p< 0.1. Source: own elaboration of FFS microdata.
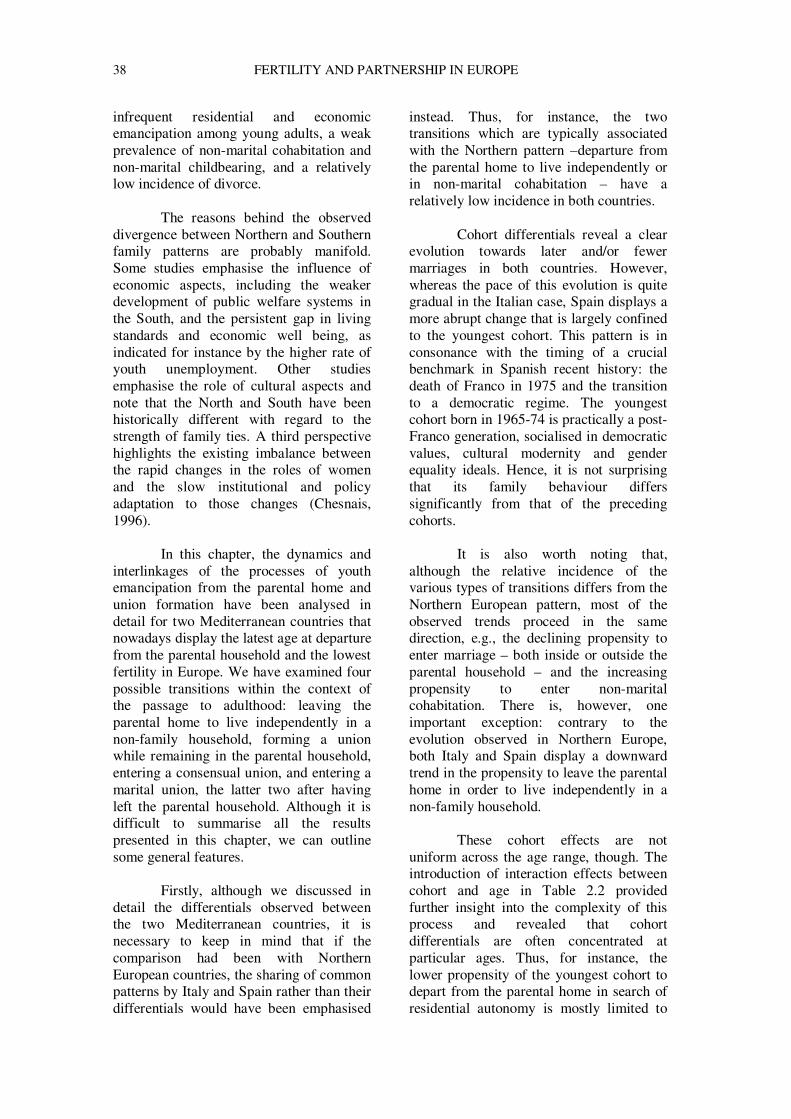
38 FERTILITY AND PARTNERSHIP IN EUROPE
infrequent residential and economic emancipation among young adults, a weak prevalence of non-marital cohabitation and non-marital childbearing, and a relatively low incidence of divorce.
The reasons behind the observed
divergence between Northern and Southern family patterns are probably manifold. Some studies emphasise the influence of economic aspects, including the weaker development of public welfare systems in the South, and the persistent gap in living standards and economic well being, as indicated for instance by the higher rate of youth unemployment. Other studies emphasise the role of cultural aspects and note that the North and South have been historically different with regard to the strength of family ties. A third perspective highlights the existing imbalance between the rapid changes in the roles of women and the slow institutional and policy adaptation to those changes (Chesnais, 1996).
In this chapter, the dynamics and
interlinkages of the processes of youth emancipation from the parental home and union formation have been analysed in detail for two Mediterranean countries that nowadays display the latest age at departure from the parental household and the lowest fertility in Europe. We have examined four possible transitions within the context of the passage to adulthood: leaving the parental home to live independently in a non-family household, forming a union while remaining in the parental household, entering a consensual union, and entering a marital union, the latter two after having left the parental household. Although it is difficult to summarise all the results presented in this chapter, we can outline some general features.
Firstly, although we discussed in
detail the differentials observed between the two Mediterranean countries, it is necessary to keep in mind that if the comparison had been with Northern European countries, the sharing of common patterns by Italy and Spain rather than their differentials would have been emphasised
instead. Thus, for instance, the two transitions which are typically associated with the Northern pattern –departure from the parental home to live independently or in non-marital cohabitation – have a relatively low incidence in both countries.
Cohort differentials reveal a clear
evolution towards later and/or fewer marriages in both countries. However, whereas the pace of this evolution is quite gradual in the Italian case, Spain displays a more abrupt change that is largely confined to the youngest cohort. This pattern is in consonance with the timing of a crucial benchmark in Spanish recent history: the death of Franco in 1975 and the transition to a democratic regime. The youngest cohort born in 1965-74 is practically a post-Franco generation, socialised in democratic values, cultural modernity and gender equality ideals. Hence, it is not surprising that its family behaviour differs significantly from that of the preceding cohorts.
It is also worth noting that,
although the relative incidence of the various types of transitions differs from the Northern European pattern, most of the observed trends proceed in the same direction, e.g., the declining propensity to enter marriage – both inside or outside the parental household – and the increasing propensity to enter non-marital cohabitation. There is, however, one important exception: contrary to the evolution observed in Northern Europe, both Italy and Spain display a downward trend in the propensity to leave the parental home in order to live independently in a non-family household.
These cohort effects are not
uniform across the age range, though. The introduction of interaction effects between cohort and age in Table 2.2 provided further insight into the complexity of this process and revealed that cohort differentials are often concentrated at particular ages. Thus, for instance, the lower propensity of the youngest cohort to depart from the parental home in search of residential autonomy is mostly limited to
HOUSEHOLD AND UNION FORMATION IN A MEDITERRANEAN FASHION 39
the youngest ages, but does not concern those over age 23.
The influence of the educational
and employment careers on the different types of transitions to adulthood has been given special attention in the analysis. Two aspects of education were examined: enrolment status and educational level attained. As expected, being a student deters union formation (whether in the parental home or outside it, and no matter whether it concerns a consensual or a marital union). At the same time it promotes residential autonomy, except among Spanish women. A higher educational level of attainment delays or deters marriage but not non-marital cohabitation, and it encourages residential autonomy. Here it is nevertheless possible to observe some differences between Italy and Spain. In Spain non-marital cohabitation is more common among people with higher levels of education, whereas in Italy it seems to be an experience that is independent of the educational level attained.
Regarding the role played by the
work career, the models that were estimated confirm that being employed is an important factor in the transition to adulthood. But results differ for men and women, suggesting that the traditional gendered division of labour still influences the dynamics of family formation. For men, holding a job increases significantly their chances to get married. For women, however, the observed association is negative, although having had a job in the past increases their probability of getting married, in particular if their labour force experience was a lengthy one. Another observed pattern besides these gender differentials that departs from the northern model is that current employment decreases the chances of residential autonomy, for both men and women. Although this pattern is not easy to explain, it might have to do with rising job instability.
The role of non-marital
conceptions in accelerating the process of union and household formation was also
examined. The results revealed that pregnancies speed up union formation, both within and outside the parental home. This is true for both for men and women, and in Spain as well as in Italy. A difference between the Spanish and Italian women of the youngest cohort is nevertheless observed with respect to non-marital cohabitation and autonomous living. While in Italy a non-marital conception increases the probability of both of these events, in Spain this is not the case.
In sum, prevailing patterns of the
transition to adulthood in the two countries under examination share basic common features: a late departure from the parental home that is closely related to union formation, mostly marriage. In contrast with the patterns observed in Northern Europe, the South displays a downward trend in residential autonomy for young adults as well as a persistence of patrilocal union formation. Although this last type of transition is becoming less prevalent and alternative living arrangements such as consensual unions are on the rise, the pace of change is moderate. Therefore, a convergence with the Northern pattern can be discarded, at least in the short run. Furthermore, observed contrasts seem to be more than just the result of a time lag in demographic trends. Key factors such as the degree of change in gender roles and the centrality of the family are likely to underlie the divergence in patterns of union and household formation.
Less clear, on the other hand, are
the reasons that lie at the basis of some differences in the way in which non-marital cohabitation is experienced in Italy and Spain. These differences led us to believe that non-marital cohabitation in Italy is in a way more similar to marriage than in Spain. It is possible that this depends on the relative lateness with which Spain has moved towards Northern European models of behaviour. In this case it will be interesting to keep a close eye on this phenomenon so as to see if the differentials persist through time or if instead we are moving towards a convergence of scenarios.
40 FERTILITY AND PARTNERSHIP IN EUROPE
One question of interest from a policy point of view is whether these patterns that are so peculiar for the Mediterranean region are the result of choice or constraint. Some indicators point towards a constraint explanation. For example, in Spain particularly, it is low education and unemployment that are most closely associated with union formation in the parental household. However, although the importance of young people’s access to economic resources is undeniable, the role of culturally defined norms must also be recognised. The analysis performed in this chapter revealed, for instance, that - contrary to expectations - employment does not favour residential autonomy in Italy and Spain, and that the effects of educational and employment covariates on the different types of transitions vary by country, gender and cohort. Given this complexity, it is an important task to document the existing diversity in union and household formation patterns. In spite of the tendency towards harmonisation of policies and regulations, also in the family sphere, within the European Union, this diversity is likely to persist in the near future.
REFERENCES
Billari, F.C. (2000). L’analisi delle biografie e la transizione allo stato adulto. Aspetti metodologici e applicazioni ai dati della Seconda Indagine sulla Fecondità in Italia. [The analysis of biographies and the transition to adulthood. Methodological aspects and applications to the Second Investigation on Fertility in Italy.], Padova: Cleup.
Billari, F.C., Castiglioni, M., Castro Martìn, T. and Michielin, F. (2000). Transitions to adulthood in a period of deep societal changes: A study of Spanish post-war cohorts. Mimeo.
Billari, F.C. and Ongaro, F. (1999). Lasciare la famiglia di origine: quando e perché? [To leave the parental home: when and why?] In P. De Sandre, A. Pinnelli and A. Santini (Ed.) Nuzialità e fecondità in trasformazione: percorsi e fattori del cambiamento. [Nuptiality and fertility in transformation: routes and factors of change.] Bologna: il Mulino.
Blom, S. (1994). Marriage and cohabitation in a changing society: experience of Norwegian men and women born in 1945 and 1960. European Journal of Population, 10: 143-173.
Blossfeld H.-P. (Ed.) (1995): The new role of women: Family formation in western society. Boulder: Westview Press.
Blossfeld, H.-P. and Huinink, J. (1991). Human capital investments or norms of role transition?
How women's schooling and career affect the process of family formation, American. Journal of Sociology, 97: 143-168.
Blossfeld, H.-P. and Rohwer, G. (1995). Techniques of Event History Modeling. New Approaches to Causal Analysis. Mahwah, NJ: Lawrence Erlbaum Associates.
Bracher, M. and Santow, G. (1998). Economic independence and union formation in Sweden. Population Studies, 52 (3): 275-294.
Brien, M.J., Lillard, L.A., Waite, L.J. (1999). Interrelated family-building behaviors: cohabitation, marriage and nonmarital conception. Demography, 36 (4): 535-551.
Buchmann, M. (1989). The Script of Life in Modern Society. Entry into Adulthood in a Changing World. Chicago: University of Chicago Press.
Cantisani, G. and Dalla Zuanna, G. (1996): Nuzialità e famiglie complesse in Italia: analisi territoriale di lungo periodo (1881-1981). [Nuptiality and complex families in Italy: long-term territorial analysis (1881-1981).] Statistica, 56: 217-242.
Casal, J. and Garcia, M. (1996). Dalla giovinezza alla vita adulta nella Spagna degli anni ’90: l’evoluzione dei modelli femminili. [From youth to adulthood in Spain in the nineties: the evolution of feminine models.] In A. Cavalli and Galland, O. (Eds) Senza fretta di crescere: l’ingresso difficile nella vita adulta. [Not in a hurry to grow up: the difficult entry into adulthood.] Napoli: Paradigma.
Castiglioni, M. and Dalla Zuanna, G. (1994). Innovation and tradition. Reproductive and marital behaviour in Italy in the 1970s and 1980s. European Journal of Population, 10 (2): 107-142.
Cavalli, A. and Galland, O. (1996). (Ed.) Senza fretta di crescere: l’ingresso difficile nella vita adulta. [Not in a hurry to grow up: the difficult entry into adulthood.] Napoli: Paradigma.
Chesnais, J.-C. (1996). Fertility, family and social policy in contemporary Western Europe. Population and Development Review, 22 (4): 729-39.
Corijn, M. (1999). Transitions to adulthood in Europe for the 1950s and 1950s cohorts. CBGS-Werkdocument, 4, Brussels.
Courgeau, D. and Lelièvre, E. (1992). Interrelations between First Home Ownership, Constitution of the Family, and Professional Occupation in France. In Trussell J., Hankinson, R. and Tilton, J. (Eds.), Demographic Applications of Event History Analysis. Oxford: Clarendon Press, 120-140.
Dalla Zuanna, G. (1999). The banquet of Aeolus. An interpretation of the Italian lowest low fertility. Paper presented at the 2nd Lowest-Low Fertility Workshop, Rostock.
De Sandre, P., Ongaro, F., Rettaroli R. and Salvini, S. (1997). Matrimonio e figli: tra rinvio e rinuncia. [Marriage and children: between postponing and renouncing.] Bologna: il Mulino.
De Sandre, P., Ongaro, F., Rettaroli R. and Salvini S. (2000). Fertility and Family Surveys in Countries of the ECE Region. Standard Country Report. Italy. Economic Studies 10o, New York and Geneva: United Nations.
HOUSEHOLD AND UNION FORMATION IN A MEDITERRANEAN FASHION 41
Delgado, M. and Castro Martín T. (1999). Fertility and Family Surveys in Countries of the ECE Region. Standard Country Report. Spain. Economic Studies 10i, New York and Geneva: United Nations.
Esping-Andersen, G. (1999). Social Foundations of Postindustrial Economies, Oxford: Oxford University Press.
Fernández Cordón, J.A. (1997). Youth residential independence and autonomy: a comparative study. Journal of Family Issues, 16 (6): 567-607.
Giele, J.Z. and Elder, G.H.Jr. (Ed.) (1998). Methods of Life Course Research. Qualitative and Quantitative Approaches. Thousand Oaks: Sage.
Ginsborg, P. (1989) Storia d’Italia dal dopoguerra a oggi. Società e politica 1943-1988. [History of Italy from the post-war period until now. Society and politics 1943-1988.] Torino: Einaudi.
Goldscheider, F.K. and Goldscheider, C. (1994). Composition familiale, soutien parental et départ du foyer des jeunes Américains au XXe siècle [Family composition, parental support and departure from the parental home of young Americans in the 20th century.]. Cahiers québécois de démographie, 23: 75-102.
Goldscheider, F., Turcotte, P. and Kopp, A. (2001). The changing determinants of first union formation in industrialized countries: the United States, Canada, Italy and Sweden. Genus, LVII, 3-4, 107-134.
Hajnal, J. (1965). European marriage patterns in perspective. In Glass, D.V. and Eversley, D.E.C. (Ed.) Population in History. Essays in Historical Demography. London: Edward Arnold.
Jones, G. (1995). Leaving home. Buckingham, Philadelphia: Open University Press.
Kuijsten, A. (1996). Changing family patterns in Europe: a case of divergence? European Journal of Population 12 (2): 115-143.
Liefbroer, A.C. and de Jong Gierveld, J. (1995). Standardization and individualization: the transition from youth to adulthood among cohorts born between 1903 and 1965. In van den Brekel, H. and Deven, F. (Eds.) Population and family in the Low Countries 1994. Dordrecht: Kluwer.
Manning, W.D. (1993). Marriage and cohabitation following premarital conception. Journal of Marriage and the Family, 55 (4): 839-850.
Manning, W.D. (1995). Cohabitation, marriage, and entry into motherhood. Journal of Marriage and the Family, 57 (1): 191-200.
Muñoz Perez, F. (1988). Des nouvelles données sur les naissances conçues hors mariage en Italie. [New data on births conceived out of wedlock in Italy.] Population, (2): 463-473.
Muñoz Perez, F. (1991). Les naissances hors mariage et les conceptions prénuptiales en Espagne depuis 1975. [Births out of wedlock and premarital conceptions in Spain since 1975.] Population, (4): 881-912.
May, M.P. (1990). Il lavoro familiare e la rete parentale [Family work and family networks]. In Balbo, L., May, M.P. and Micheli G. (Ed.) Vincoli e strategie nella vita quotodiana. [Ties and strategies of daily life.]. Milano: F.Angeli.
Ongaro, F. (2001). Transition to adulthood in Italy. In Corijn, M. and E. Klijzing, Transitions to adulthood in Europe. Dordrecht: Kluwer Academic Publishers, 173-207.
Oppenheimer, V.K. (1994). Women's rising employment and the future of the family in industrial societies. Population and Development Review, 20: 293-342.
Reher, D.S. (1997). Perspectives on the family in Spain. Past an Present, Oxford: Clarendon Press.
Reher, D.S. (1998). Family Ties in Western Europe: Persistent Contrasts. Population and Development Review, 24: 203-234.
Santow, G. and Bracher, M. (1994). Change and continuity in the formation of first marital unions in Australia. Population Studies, 48 (3): 475-496.
Thornton A., Axinn W.G. and Teachman J.D. (1995). The influence of school enrolment and accumulation on cohabitation and marriage in early adulthood. American Sociological Review, 60: 762-774.
van de Kaa, D.J. (1987). Europe’s Second Demographic Transition. Population Bulletin, Vol. 42, 1, Washington, DC: Population Reference Bureau.
Vincent, P. (1961). Recherches sur la fécondité biologique. [Studies on biological fertility.] Cahier de Travaux et Documents n°37, Paris : PUF-INED.
ENDNOTES i The views expressed in this paper are attributable to the authors and do not necessarily reflect those of the institutions they belong to. We thank Martine Corijn and Erik Klijzing, as well as two anonymous referees, for their comments and suggestions. ii We have, for each cohort, more than 300 observations for Italian males (346 observations for the oldest cohort, 389 for the middle cohort and 471 for the youngest cohort) and more than 400 for Spanish males (respectively 431, 701 and 736 observations). The number of observations is higher for females (there are in fact 1461, 1 606 and 1 757 observations available for the three Italian cohorts examined and 839, 1 410 and 1 372 for the Spanish cohorts). iii Because of the low prevalence of such behaviour, we shall not distinguish for the type of union. iv The youngest cohort has been observed for too limited a period, but does however show for women an even higher proportion.
43
CHAPTER 3
THE IMPACT OF UNION FORMATION DYNAMICS ON FIRST BIRTHS IN WEST GERMANY AND ITALY: ARE THERE SIGNS OF CONVERGENCE?i
Francesco C. Billari and Hans-Peter Kohler*
* Max Planck Institute for Demographic Research, Rostock (Germany)
A. INTRODUCTION
The issue of whether demographic behaviour in Europe will converge towards a homogeneous pattern is to a large extent an open question. Some authors (e.g. Roussel, 1992) have hypothesised a broad convergence of primary demographic trends in Western Europe, a view that is also implied by the framework of the Second Demographic Transition (van de Kaa, 1987). Others have argued - from a different theoretical viewpoint - that distinct historical and contemporary patterns are likely to persist in the future (Hobcraft and Kiernan, 1995; Reher, 1998; Micheli, 2000). These latter studies propose the existence of a sort of cultural “path dependence” (Arthur, 1990). According to this latter perspective, a convergence of demographic trends across Europe is not to be expected in the near future. In order to disentangle the different hypotheses on the future of demographic behaviour in Europe, comparative studies are necessary that use a dynamic life course perspective. In this chapter we therefore investigate the changing impact of union formation dynamics on the transition to parenthood in two countries, namely Italy and Germany, which exhibit strikingly different patterns with respect to these two processes.
With the noteworthy exception of Great Britain where lone motherhood reaches significant levels, childbearing in western Europe takes place almost
completely within conjugal unions, be they marital or not (Kiernan, 1999b). One central point of divergence in family formation behaviour in different European countries, however, is the pattern of union formation (Kiernan, 1999a), and its relation to entry into parenthood. For instance, some of the “lowest low fertility” countries in Europe, like Italy and Spain, continue to exhibit a common union formation pattern that has changed remarkably little in recent decades. In particular, these countries are characterised by a low prevalence of unmarried cohabitation and out-of-wedlock births, by delayed marriage, and a high synchronisation of leaving the parental home and marriage (Billari et al., this Volume). This pattern is inconsistent with the Second Demographic Transition theory which predicts a decreasing connection of home leaving and marriage, and a declining importance of marital status, especially in relation to first childbirth.
Other “lowest low fertility”
countries in Europe (Germany, Austria and The Netherlands) reach slightly higher fertility levels, but exhibit a remarkably different pattern of union formation. In these countries a high prevalence of unmarried cohabitation combines with delayed marriage, a low share of out-of-wedlock births (with the exception of the area belonging to the former German Democratic Republic), and a low synchronisation between leaving home and marriage. In this sense, these countries
44 FERTILITY AND PARTNERSHIP IN EUROPE
seem to be more in line with the predictions of the Second Demographic Transition theory.
Scandinavian countries and France,
on the other hand, seem to have progressed farthest along the lines of this theory. They exhibit a high prevalence of unmarried cohabitation, a high share of out-of-wedlock births, delayed marriage, and a low synchronisation between leaving home and marriage. Quite surprisingly, this pattern is associated with higher overall fertility levels.
In this chapter we focus our
attention on the transition to parenthood, which constitutes an important determinant of the observed differences in overall fertility levels. In particular, we compare two of the “lowest-low fertility” countries, namely, Germany (excluding the territories of the former German Democratic Republic) and Italy, with respect to their patterns of first union formation and first birth. For the sake of simplicity, in what follows we will use the expression “west Germany” to denote the territories of the Federal Republic of Germany prior to its re-unification with the east.
Let us start with the observation
that a north-south divide is, even if not the only important issue, a crucial distinction in Italian demography (Santini, 1995). This has again been fully supported by findings from the Italian FFS (De Sandre et al., 1997; De Sandre et al., 2000), demonstrating that geographical area is closely connected with both cultural and economic differences.ii This north-south divide has so far been less prominent in German FFS studies, where the focus - understandably - was rather on east-west differentials. Nevertheless, several other studies have found relevant north-south differences in demographic behaviour also within West Germany (Bertram, 1995; Kemper, 1991; Hank, 2001). Although these differences are less pronounced than in the Italian case, these studies nevertheless argue that both regional socio-economic differentials and local cultural and religious patterns constitute relevant
sources of heterogeneity in demographic behaviour across Germany.
In view of the distinct
developments of west Germany and Italy - in terms of their progression along the path of the Second Demographic Transition - and in the light of the marked regional differences in demographic behaviour, we investigate in this chapter both within- and between-country differences in the transition to parenthood.
B. THE DATA We use data from the Italian (De Sandre et al., 1997) and German FFS (Pohl, 1995). Both surveys were conducted within the programme of comparative research on fertility and the family coordinated by the PAU of the UNECE. The Italian survey was held between 1995 and 1996 on a representative sample of 6 030 men and women born between 1946 and 1975. The German survey was carried out in 1992 and consisted of 10 012 interviews with men and women born between 1952 and 1972.
For this study we selected only those individuals who spent the first 15 years of their life in Italy and West Germany, respectively. We consider the area where they spent these years as the reference area. To this end we divide Italy in two parts according to Santini’s (1995) definition of north-centre and south-islandsiii, and we similarly split West Germany into a northern and southern partiv. We simply speak of the “north” and “south” in both countries.
In our study we adopt a cohort
perspective and have, therefore, selected a set of four birth cohorts that are interesting for comparison and which also provide a sufficient number of events for the analyses. For Italy we selected the five-years cohorts 1951-55, 1956-60, 1961-65, 1966-70. Sample sizes across these cohorts varied between 443-521 for women in the north and 278-336 in the south. Corresponding figures for men were 95-160 in the north, 71-82 in the south. The first cohort for West Germany is slightly
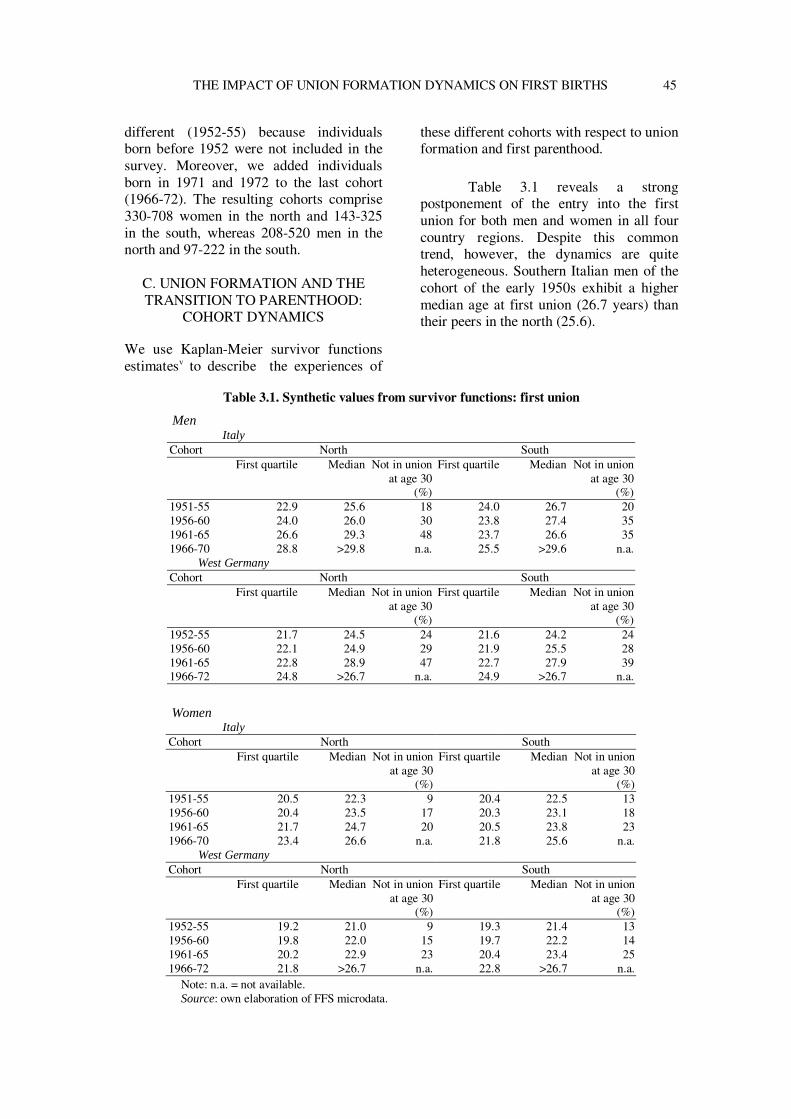
THE IMPACT OF UNION FORMATION DYNAMICS ON FIRST BIRTHS 45
different (1952-55) because individuals born before 1952 were not included in the survey. Moreover, we added individuals born in 1971 and 1972 to the last cohort (1966-72). The resulting cohorts comprise 330-708 women in the north and 143-325 in the south, whereas 208-520 men in the north and 97-222 in the south.
C. UNION FORMATION AND THE TRANSITION TO PARENTHOOD:
COHORT DYNAMICS We use Kaplan-Meier survivor functions estimatesv to describe the experiences of
these different cohorts with respect to union formation and first parenthood.
Table 3.1 reveals a strong
postponement of the entry into the first union for both men and women in all four country regions. Despite this common trend, however, the dynamics are quite heterogeneous. Southern Italian men of the cohort of the early 1950s exhibit a higher median age at first union (26.7 years) than their peers in the north (25.6).
Table 3.1. Synthetic values from survivor functions: first union
Men
Italy Cohort North South
First quartile Median Not in union at age 30
(%)
First quartile Median Not in union at age 30
(%) 1951-55 22.9 25.6 18 24.0 26.7 20 1956-60 24.0 26.0 30 23.8 27.4 35 1961-65 26.6 29.3 48 23.7 26.6 35 1966-70 28.8 >29.8 n.a. 25.5 >29.6 n.a.
West Germany Cohort North South
First quartile Median Not in union at age 30
(%)
First quartile Median Not in union at age 30
(%) 1952-55 21.7 24.5 24 21.6 24.2 24 1956-60 22.1 24.9 29 21.9 25.5 28 1961-65 22.8 28.9 47 22.7 27.9 39 1966-72 24.8 >26.7 n.a. 24.9 >26.7 n.a.
Women
Italy Cohort North South
First quartile Median Not in union at age 30
(%)
First quartile Median Not in union at age 30
(%) 1951-55 20.5 22.3 9 20.4 22.5 13 1956-60 20.4 23.5 17 20.3 23.1 18 1961-65 21.7 24.7 20 20.5 23.8 23 1966-70 23.4 26.6 n.a. 21.8 25.6 n.a.
West Germany Cohort North South
First quartile Median Not in union at age 30
(%)
First quartile Median Not in union at age 30
(%) 1952-55 19.2 21.0 9 19.3 21.4 13 1956-60 19.8 22.0 15 19.7 22.2 14 1961-65 20.2 22.9 23 20.4 23.4 25 1966-72 21.8 >26.7 n.a. 22.8 >26.7 n.a.
Note: n.a. = not available. Source: own elaboration of FFS microdata.
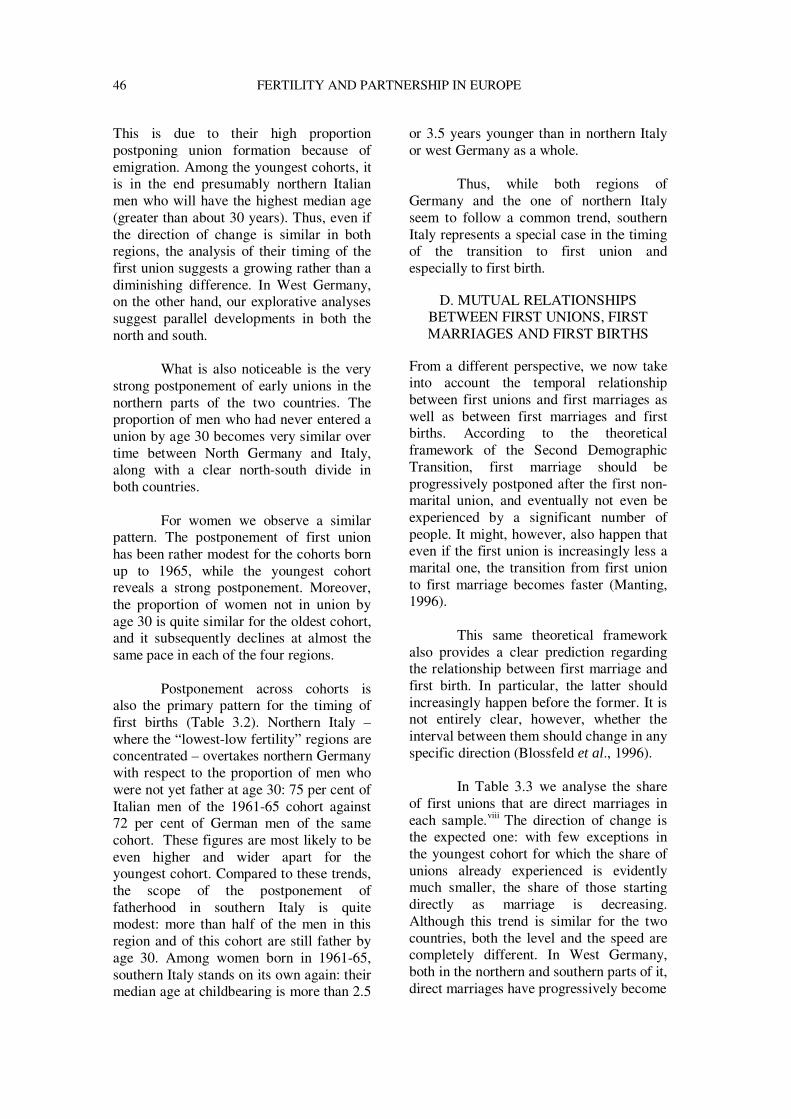
46 FERTILITY AND PARTNERSHIP IN EUROPE
This is due to their high proportion postponing union formation because of emigration. Among the youngest cohorts, it is in the end presumably northern Italian men who will have the highest median age (greater than about 30 years). Thus, even if the direction of change is similar in both regions, the analysis of their timing of the first union suggests a growing rather than a diminishing difference. In West Germany, on the other hand, our explorative analyses suggest parallel developments in both the north and south.
What is also noticeable is the very
strong postponement of early unions in the northern parts of the two countries. The proportion of men who had never entered a union by age 30 becomes very similar over time between North Germany and Italy, along with a clear north-south divide in both countries.
For women we observe a similar
pattern. The postponement of first union has been rather modest for the cohorts born up to 1965, while the youngest cohort reveals a strong postponement. Moreover, the proportion of women not in union by age 30 is quite similar for the oldest cohort, and it subsequently declines at almost the same pace in each of the four regions.
Postponement across cohorts is also the primary pattern for the timing of first births (Table 3.2). Northern Italy – where the “lowest-low fertility” regions are concentrated – overtakes northern Germany with respect to the proportion of men who were not yet father at age 30: 75 per cent of Italian men of the 1961-65 cohort against 72 per cent of German men of the same cohort. These figures are most likely to be even higher and wider apart for the youngest cohort. Compared to these trends, the scope of the postponement of fatherhood in southern Italy is quite modest: more than half of the men in this region and of this cohort are still father by age 30. Among women born in 1961-65, southern Italy stands on its own again: their median age at childbearing is more than 2.5
or 3.5 years younger than in northern Italy or west Germany as a whole.
Thus, while both regions of
Germany and the one of northern Italy seem to follow a common trend, southern Italy represents a special case in the timing of the transition to first union and especially to first birth.
D. MUTUAL RELATIONSHIPS BETWEEN FIRST UNIONS, FIRST MARRIAGES AND FIRST BIRTHS
From a different perspective, we now take into account the temporal relationship between first unions and first marriages as well as between first marriages and first births. According to the theoretical framework of the Second Demographic Transition, first marriage should be progressively postponed after the first non-marital union, and eventually not even be experienced by a significant number of people. It might, however, also happen that even if the first union is increasingly less a marital one, the transition from first union to first marriage becomes faster (Manting, 1996).
This same theoretical framework
also provides a clear prediction regarding the relationship between first marriage and first birth. In particular, the latter should increasingly happen before the former. It is not entirely clear, however, whether the interval between them should change in any specific direction (Blossfeld et al., 1996).
In Table 3.3 we analyse the share
of first unions that are direct marriages in each sample.viii The direction of change is the expected one: with few exceptions in the youngest cohort for which the share of unions already experienced is evidently much smaller, the share of those starting directly as marriage is decreasing. Although this trend is similar for the two countries, both the level and the speed are completely different. In West Germany, both in the northern and southern parts of it, direct marriages have progressively become
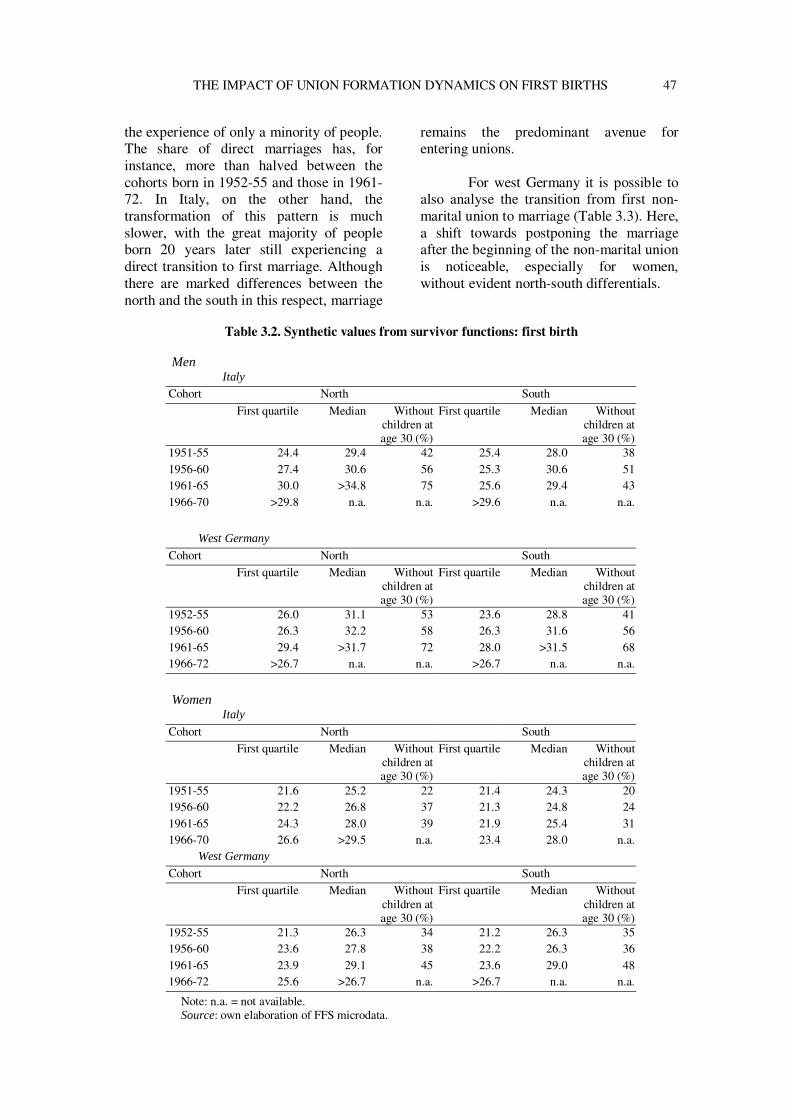
THE IMPACT OF UNION FORMATION DYNAMICS ON FIRST BIRTHS 47
the experience of only a minority of people. The share of direct marriages has, for instance, more than halved between the cohorts born in 1952-55 and those in 1961-72. In Italy, on the other hand, the transformation of this pattern is much slower, with the great majority of people born 20 years later still experiencing a direct transition to first marriage. Although there are marked differences between the north and the south in this respect, marriage
remains the predominant avenue for entering unions.
For west Germany it is possible to also analyse the transition from first non-marital union to marriage (Table 3.3). Here, a shift towards postponing the marriage after the beginning of the non-marital union is noticeable, especially for women, without evident north-south differentials.
Table 3.2. Synthetic values from survivor functions: first birth Men
Italy Cohort North South
First quartile Median Without children at age 30 (%)
First quartile Median Without children at age 30 (%)
1951-55 24.4 29.4 42 25.4 28.0 38 1956-60 27.4 30.6 56 25.3 30.6 51 1961-65 30.0 >34.8 75 25.6 29.4 43 1966-70 >29.8 n.a. n.a. >29.6 n.a. n.a.
West Germany
Cohort North South First quartile Median Without
children at age 30 (%)
First quartile Median Without children at age 30 (%)
1952-55 26.0 31.1 53 23.6 28.8 41 1956-60 26.3 32.2 58 26.3 31.6 56 1961-65 29.4 >31.7 72 28.0 >31.5 68 1966-72 >26.7 n.a. n.a. >26.7 n.a. n.a.
Women
Italy
Cohort North South First quartile Median Without
children at age 30 (%)
First quartile Median Without children at age 30 (%)
1951-55 21.6 25.2 22 21.4 24.3 20 1956-60 22.2 26.8 37 21.3 24.8 24 1961-65 24.3 28.0 39 21.9 25.4 31 1966-70 26.6 >29.5 n.a. 23.4 28.0 n.a.
West Germany
Cohort North South First quartile Median Without
children at age 30 (%)
First quartile Median Without children at age 30 (%)
1952-55 21.3 26.3 34 21.2 26.3 35 1956-60 23.6 27.8 38 22.2 26.3 36 1961-65 23.9 29.1 45 23.6 29.0 48 1966-72 25.6 >26.7 n.a. >26.7 n.a. n.a.
Note: n.a. = not available. Source: own elaboration of FFS microdata.
48 FERTILITY AND PARTNERSHIP IN EUROPE
48
Table 3.3. First unions and first marriages: temporal relationships Men
Italy Cohort North South
Direct marriages (%)
Direct marriages (%)
1952-55 88.5 88.6 1956-60 86.2 93.0 1961-65 84.4 87.1 1966-72 71.0 70.4
West Germany Cohort North South
Direct marriages (%)
Never married after 1 year of
cohabitation (survivor function)
Never married after 5 years of
cohabitation (survivor function)
Direct marriages (%)
Never married after 1 year of
cohabitation (survivor function)
Never married after 5 years of
cohabitation (survivor function)
1952-55 51.5 0.85 0.38 69.0 0.78 0.25 1956-60 26.4 0.83 0.42 46.6 0.82 0.45 1961-65 18.6 0.89 0.64 30.4 0.81 0.52 1966-72 22.3 0.96 0.68 17.1 0.96 Women
Italy Cohort North South
Direct marriages (%)
Direct marriages (%)
1952-55 95.2 95.2 1956-60 89.8 94.8 1961-65 89.1 90.1 1966-72 84.0 94.8
West Germany Cohort North South
Direct marriages (%)
Never married after 1 year of
cohabitation (survivor function)
Never married after 5 years of
cohabitation (survivor function)
Direct marriages (%)
Never married after 1 year of
cohabitation (survivor function)
Never married after 5 years of
cohabitation (survivor function)
1952-55 63.2 0.78 0.39 63.3 0.79 0.37 1956-60 44.9 0.80 0.44 48.1 0.89 0.44 1961-65 28.9 0.84 0.47 36.0 0.76 0.46 1966-72 22.7 0.83 0.43 26.7 0.88 0.35
Source: own elaboration of FFS microdata.
In Figures 3.1-4 we study first
marriage and first childbirth using mirrored survivor functions (Billari, 2000) which explicitly investigate the order and time span between these two events. Among men the major difference between Italy (Figure 3.1) and west Germany (Figure 3.2) is that the share of Italian men who become fathers after marriage - that is, the value of the function at the intersection with the vertical axis after zero years - is almost 100 per cent. First marriage for them can
therefore be considered as the main event marking their exposure to the risk of becoming father. It is also interesting to notice that there is no real difference in this respect between the north and the south. In addition, the cohort dynamics of this pattern are revealing: among the 1956-60 and 1961-65 cohorts, births are increasingly being postponed after first marriage, especially in the north. This is of course consistent with the later age at first birth observed in the aggregate data (Table 3.2).
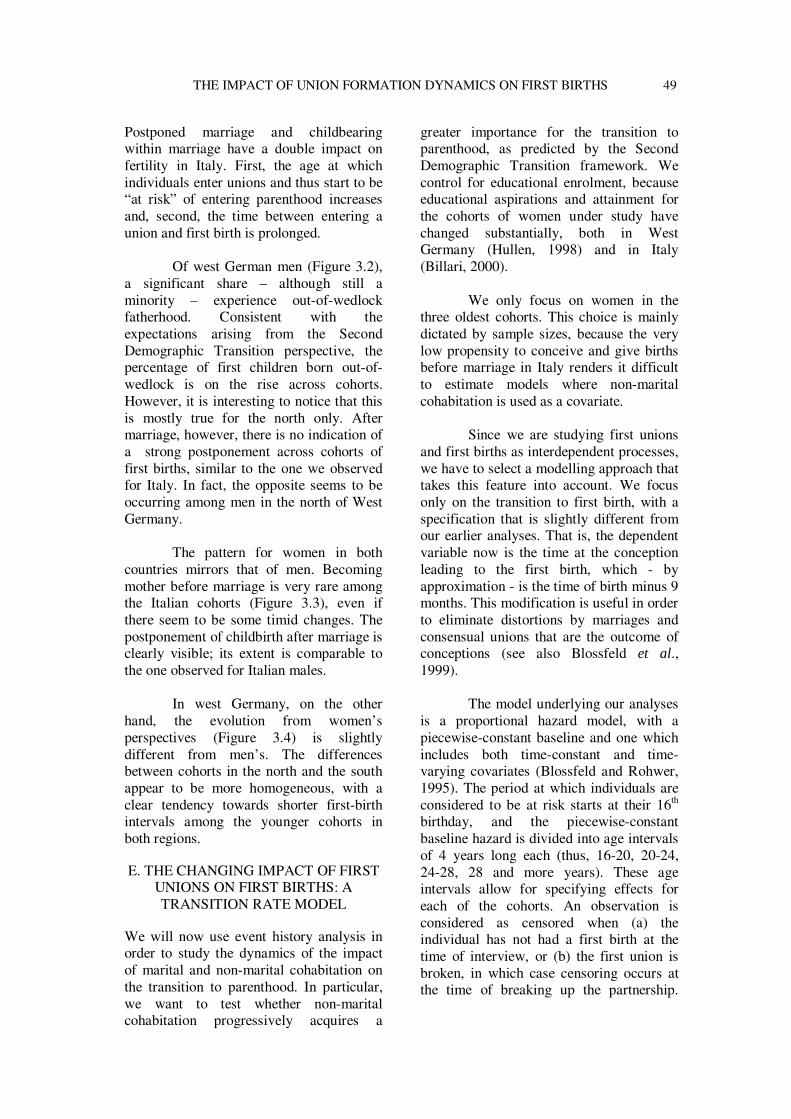
THE IMPACT OF UNION FORMATION DYNAMICS ON FIRST BIRTHS 49
Postponed marriage and childbearing within marriage have a double impact on fertility in Italy. First, the age at which individuals enter unions and thus start to be “at risk” of entering parenthood increases and, second, the time between entering a union and first birth is prolonged.
Of west German men (Figure 3.2),
a significant share – although still a minority – experience out-of-wedlock fatherhood. Consistent with the expectations arising from the Second Demographic Transition perspective, the percentage of first children born out-of-wedlock is on the rise across cohorts. However, it is interesting to notice that this is mostly true for the north only. After marriage, however, there is no indication of a strong postponement across cohorts of first births, similar to the one we observed for Italy. In fact, the opposite seems to be occurring among men in the north of West Germany.
The pattern for women in both
countries mirrors that of men. Becoming mother before marriage is very rare among the Italian cohorts (Figure 3.3), even if there seem to be some timid changes. The postponement of childbirth after marriage is clearly visible; its extent is comparable to the one observed for Italian males.
In west Germany, on the other
hand, the evolution from women’s perspectives (Figure 3.4) is slightly different from men’s. The differences between cohorts in the north and the south appear to be more homogeneous, with a clear tendency towards shorter first-birth intervals among the younger cohorts in both regions. E. THE CHANGING IMPACT OF FIRST
UNIONS ON FIRST BIRTHS: A TRANSITION RATE MODEL
We will now use event history analysis in order to study the dynamics of the impact of marital and non-marital cohabitation on the transition to parenthood. In particular, we want to test whether non-marital cohabitation progressively acquires a
greater importance for the transition to parenthood, as predicted by the Second Demographic Transition framework. We control for educational enrolment, because educational aspirations and attainment for the cohorts of women under study have changed substantially, both in West Germany (Hullen, 1998) and in Italy (Billari, 2000).
We only focus on women in the
three oldest cohorts. This choice is mainly dictated by sample sizes, because the very low propensity to conceive and give births before marriage in Italy renders it difficult to estimate models where non-marital cohabitation is used as a covariate.
Since we are studying first unions
and first births as interdependent processes, we have to select a modelling approach that takes this feature into account. We focus only on the transition to first birth, with a specification that is slightly different from our earlier analyses. That is, the dependent variable now is the time at the conception leading to the first birth, which - by approximation - is the time of birth minus 9 months. This modification is useful in order to eliminate distortions by marriages and consensual unions that are the outcome of conceptions (see also Blossfeld et al., 1999).
The model underlying our analyses
is a proportional hazard model, with a piecewise-constant baseline and one which includes both time-constant and time-varying covariates (Blossfeld and Rohwer, 1995). The period at which individuals are considered to be at risk starts at their 16th birthday, and the piecewise-constant baseline hazard is divided into age intervals of 4 years long each (thus, 16-20, 20-24, 24-28, 28 and more years). These age intervals allow for specifying effects for each of the cohorts. An observation is considered as censored when (a) the individual has not had a first birth at the time of interview, or (b) the first union is broken, in which case censoring occurs at the time of breaking up the partnership.
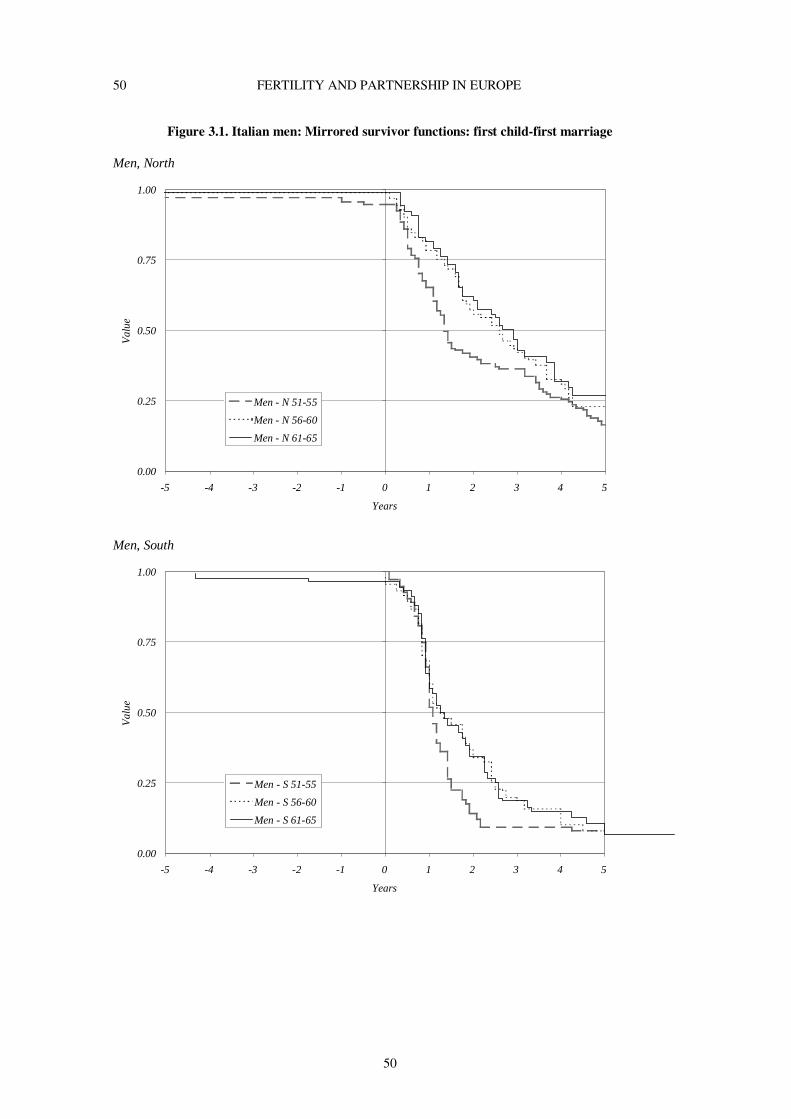
50 FERTILITY AND PARTNERSHIP IN EUROPE
50
Figure 3.1. Italian men: Mirrored survivor functions: first child-first marriage Men, North
Men, South
0.00
0.25
0.50
0.75
1.00
-5 -4 -3 -2 -1 0 1 2 3 4 5
Years
Val
ue
Men - N 51-55
Men - N 56-60
Men - N 61-65
0.00
0.25
0.50
0.75
1.00
-5 -4 -3 -2 -1 0 1 2 3 4 5
Years
Val
ue
Men - S 51-55
Men - S 56-60
Men - S 61-65
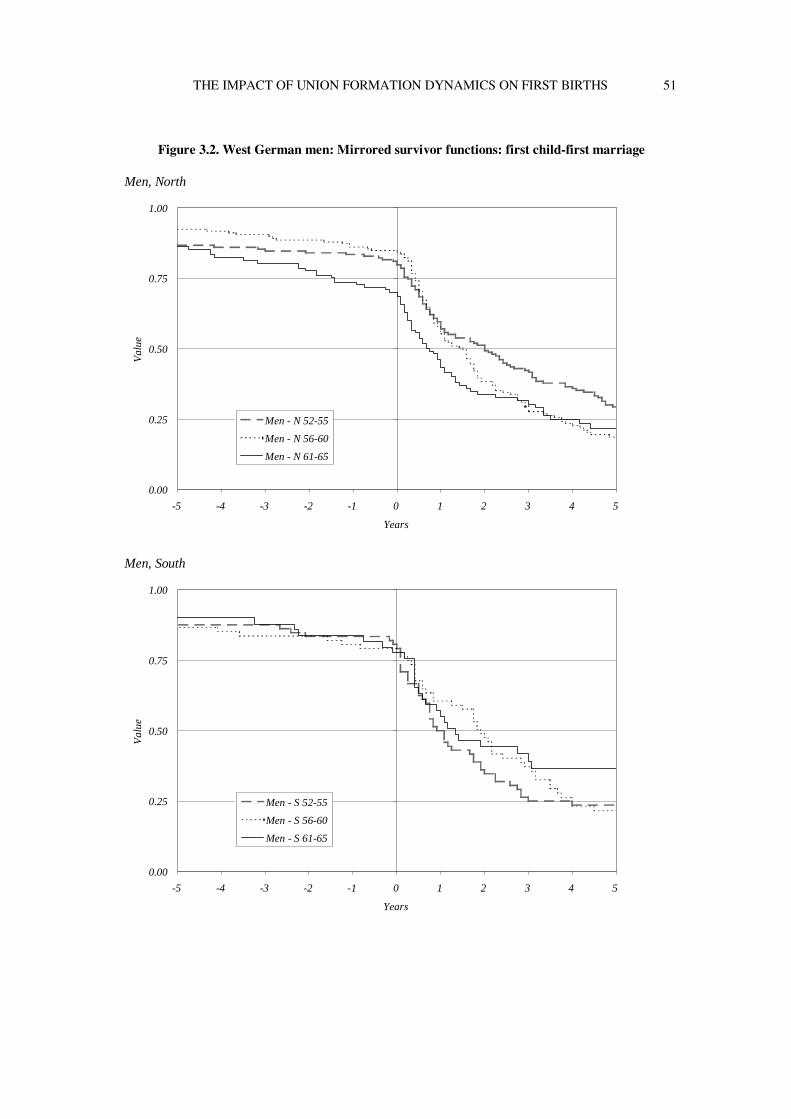
THE IMPACT OF UNION FORMATION DYNAMICS ON FIRST BIRTHS 51
Figure 3.2. West German men: Mirrored survivor functions: first child-first marriage
Men, North
Men, South
0.00
0.25
0.50
0.75
1.00
-5 -4 -3 -2 -1 0 1 2 3 4 5
Years
Val
ue
Men - N 52-55
Men - N 56-60
Men - N 61-65
0.00
0.25
0.50
0.75
1.00
-5 -4 -3 -2 -1 0 1 2 3 4 5
Years
Val
ue
Men - S 52-55
Men - S 56-60
Men - S 61-65
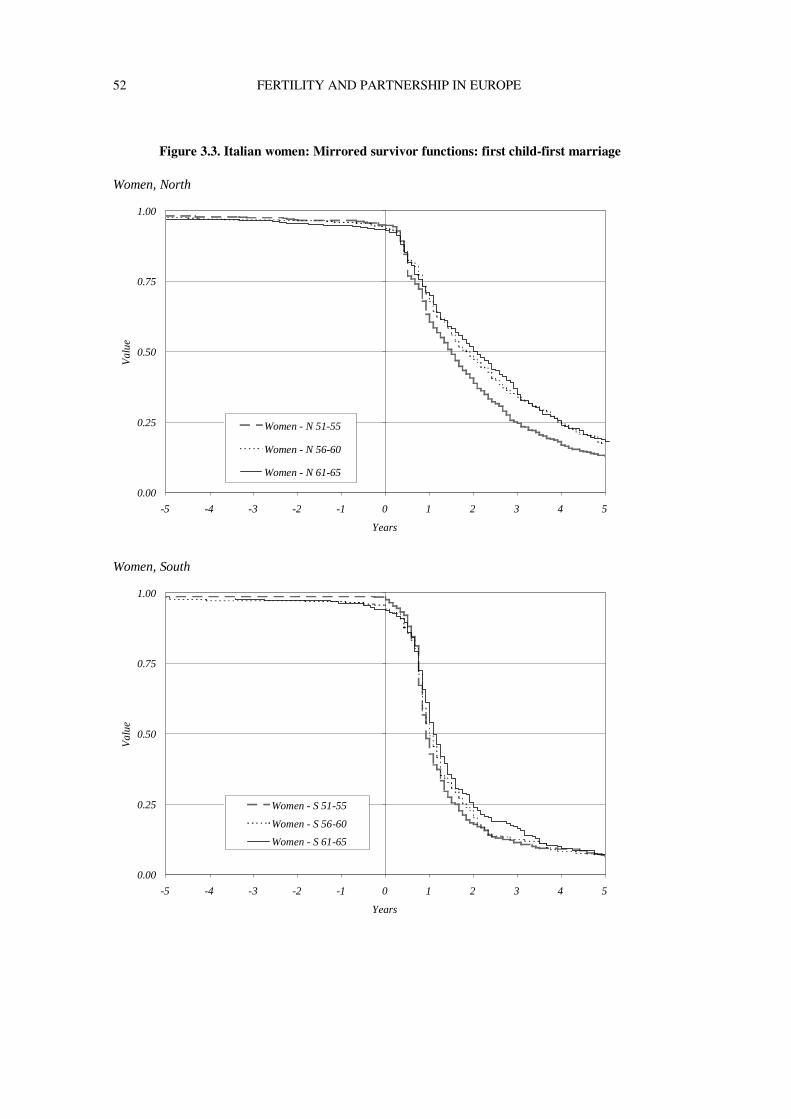
52 FERTILITY AND PARTNERSHIP IN EUROPE
Figure 3.3. Italian women: Mirrored survivor functions: first child-first marriage
Women, North
Women, South
0.00
0.25
0.50
0.75
1.00
-5 -4 -3 -2 -1 0 1 2 3 4 5
Years
Val
ue
Women - N 51-55
Women - N 56-60
Women - N 61-65
0.00
0.25
0.50
0.75
1.00
-5 -4 -3 -2 -1 0 1 2 3 4 5
Years
Val
ue
Women - S 51-55
Women - S 56-60
Women - S 61-65
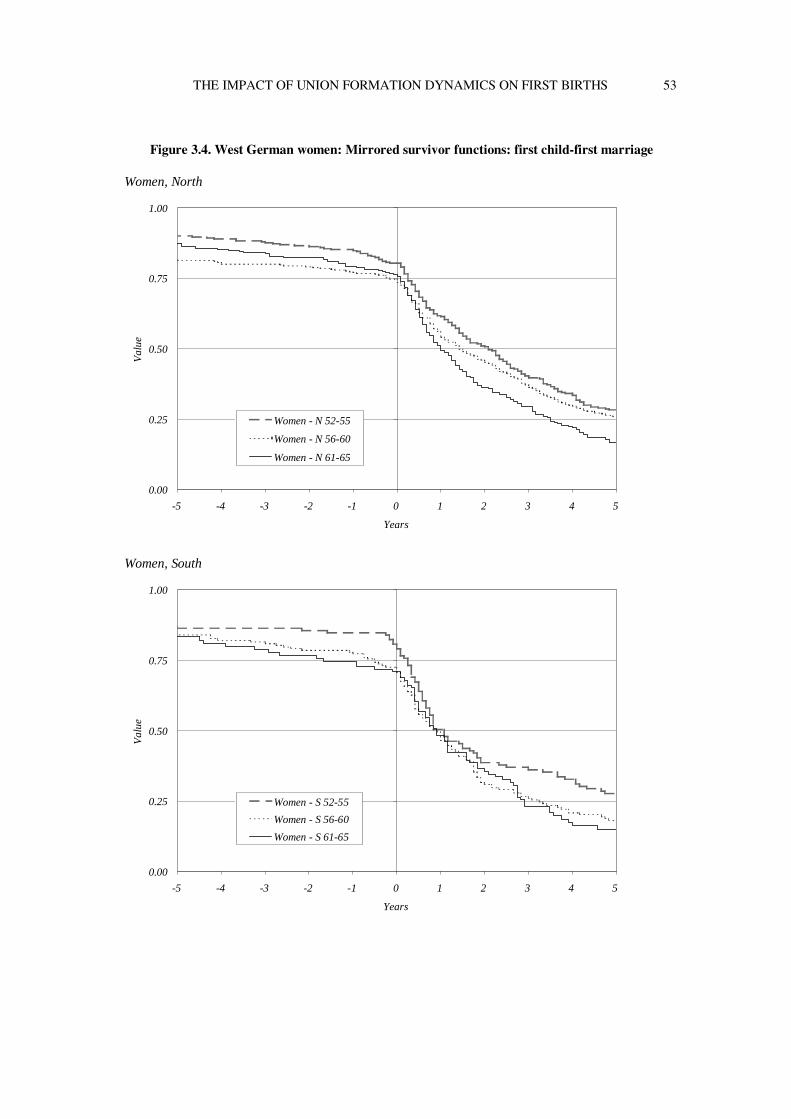
THE IMPACT OF UNION FORMATION DYNAMICS ON FIRST BIRTHS 53
Figure 3.4. West German women: Mirrored survivor functions: first child-first marriage
Women, North
Women, South
0.00
0.25
0.50
0.75
1.00
-5 -4 -3 -2 -1 0 1 2 3 4 5
Years
Val
ue
Women - N 52-55
Women - N 56-60
Women - N 61-65
0.00
0.25
0.50
0.75
1.00
-5 -4 -3 -2 -1 0 1 2 3 4 5
Years
Val
ue
Women - S 52-55
Women - S 56-60
Women - S 61-65
54 FERTILITY AND PARTNERSHIP IN EUROPE
54
Cohort membership is the only time-constant covariate. Educational enrolment is treated as a time-varying covariate, which changes its value irreversibly to zero once full-time education is interruptedix. For marriage and non-marital cohabitation, we first use simple time-varying covariates describing whether the respondent is married (M) or cohabiting (C). This analysis allows us to investigate the transition from non-marital cohabitation to marriage, even if our marriage variable does not distinguish between direct and post-cohabitation marriages.
The results of this first estimation
are reported in Table 3.4. In model 1 we notice that in both countries - even after controlling for educational enrolment - the transition to motherhood has been postponed significantly across cohorts. West Germany has a slightly stronger postponement than Italy. For instance, the 1961-65 west German cohort has a relative risk that is 1 – e–0.3092 = 27 per cent lower than that of the oldest one, while the corresponding differential in Italy is only about 19 per cent. The prolonged permanence in education thus can not fully account for the lower transition rates to motherhood.
In model 2 we introduce non-
marital cohabitation and marriage as time-varying statuses, and we also consider their interactions with cohort membership. In Italy, as expected, being married has a very strong impact on the transition to motherhood (the relative risk becomes about 14 times higher than that of the reference category), and this impact is sensibly higher than the one of non-marital cohabitation (which is only about 7 times higher). It is, however, more interesting to focus on the changing impact across cohorts. The impact of both non-marital cohabitation and marriage increases for the younger cohorts (rows 10-13). This result does not come as entirely unexpected, because pre-union conceptions should diminish across cohorts. What is particularly interesting, however, is that the impact of cohabiting increases faster than that of being married: the relative risk for cohabiting people in the youngest
cohort is about 225 per cent higher than in the oldest cohort, while the corresponding figure for married people is only about 150 per cent higher.
The picture is different for west
German women. First of all, the baseline impact of being married versus cohabiting is much less differentiated than in the Italian case. The impact of being in a union rises for younger cohorts, as it was the case in Italy, but the increase is much faster within marriage than within a cohabiting union (rows 10-13). This effect might be explained by looking back at Figure 3.4. There we found that the transition to first childbirth after marriage happens faster for the 1961-65 cohort than for the oldest one, both in the south and in the north. Marriage is being postponed but it seems to become more important for people who decide that they want to settle and have a child. In Italy we thus notice the increasing impact of non-marital cohabitation across cohorts that we expected as a sign of convergence towards countries with higher scores on the Second Demographic Transition scale, while in West Germany the meaning of being married becomes more important.
In order to see whether the timing
of motherhood within first unions accounts for this difference, we introduce various timing variables (Table 3.5, model 3). These additional variables capture the impact of the duration of non-marital cohabitation and marriage, that is, their so-called “effect shape” (Blossfeld et al., 1996). For this purpose we have built one additional time-varying covariate that reveals whether a marriage or cohabitation is in its first 3 years (which we call M3 and C3). In order to also control for the possible effects of a short union duration, we include similar time-varying covariates for the first year of marriage or cohabitation (M1 and C1).
For Italy one observes that the
baseline impact of entering a union (both marital and non-marital) is decreasing with union duration: the transition rate reaches its highest level in the first year (rows 10 and 12). Even when we account for such
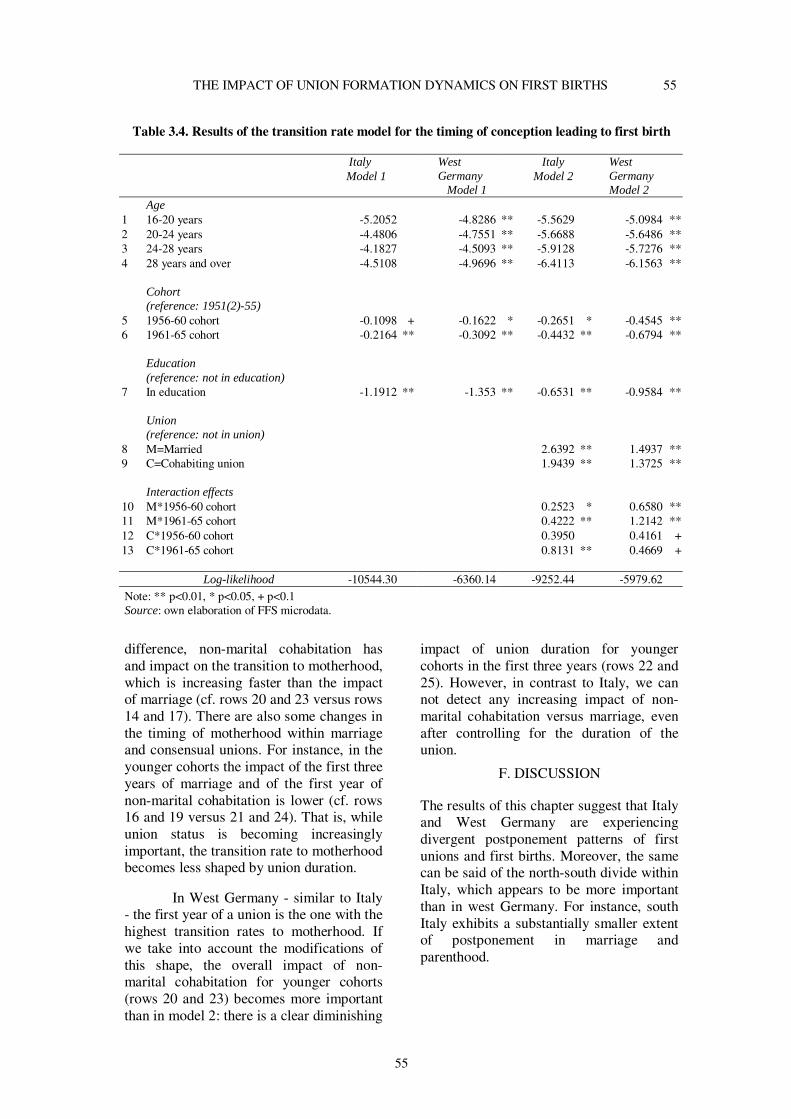
THE IMPACT OF UNION FORMATION DYNAMICS ON FIRST BIRTHS 55
55
Table 3.4. Results of the transition rate model for the timing of conception leading to first birth Italy
Model 1 West Germany
Model 1
Italy Model 2
West Germany Model 2
Age 1 16-20 years -5.2052 -4.8286 ** -5.5629 -5.0984 **2 20-24 years -4.4806 -4.7551 ** -5.6688 -5.6486 **3 24-28 years -4.1827 -4.5093 ** -5.9128 -5.7276 **4 28 years and over -4.5108 -4.9696 ** -6.4113 -6.1563 **
Cohort
(reference: 1951(2)-55)
5 1956-60 cohort -0.1098 + -0.1622 * -0.2651 * -0.4545 **6 1961-65 cohort -0.2164 ** -0.3092 ** -0.4432 ** -0.6794 ** Education
(reference: not in education)
7 In education -1.1912 ** -1.353 ** -0.6531 ** -0.9584 ** Union
(reference: not in union)
8 M=Married 2.6392 ** 1.4937 **9 C=Cohabiting union 1.9439 ** 1.3725 **
Interaction effects
10 M*1956-60 cohort 0.2523 * 0.6580 **11 M*1961-65 cohort 0.4222 ** 1.2142 **12 C*1956-60 cohort 0.3950 0.4161 +13 C*1961-65 cohort 0.8131 ** 0.4669 +
Log-likelihood -10544.30 -6360.14 -9252.44 -5979.62
Note: ** p<0.01, * p<0.05, + p<0.1 Source: own elaboration of FFS microdata. difference, non-marital cohabitation has and impact on the transition to motherhood, which is increasing faster than the impact of marriage (cf. rows 20 and 23 versus rows 14 and 17). There are also some changes in the timing of motherhood within marriage and consensual unions. For instance, in the younger cohorts the impact of the first three years of marriage and of the first year of non-marital cohabitation is lower (cf. rows 16 and 19 versus 21 and 24). That is, while union status is becoming increasingly important, the transition rate to motherhood becomes less shaped by union duration.
In West Germany - similar to Italy
- the first year of a union is the one with the highest transition rates to motherhood. If we take into account the modifications of this shape, the overall impact of non-marital cohabitation for younger cohorts (rows 20 and 23) becomes more important than in model 2: there is a clear diminishing
impact of union duration for younger cohorts in the first three years (rows 22 and 25). However, in contrast to Italy, we can not detect any increasing impact of non-marital cohabitation versus marriage, even after controlling for the duration of the union.
F. DISCUSSION
The results of this chapter suggest that Italy and West Germany are experiencing divergent postponement patterns of first unions and first births. Moreover, the same can be said of the north-south divide within Italy, which appears to be more important than in west Germany. For instance, south Italy exhibits a substantially smaller extent of postponement in marriage and parenthood.
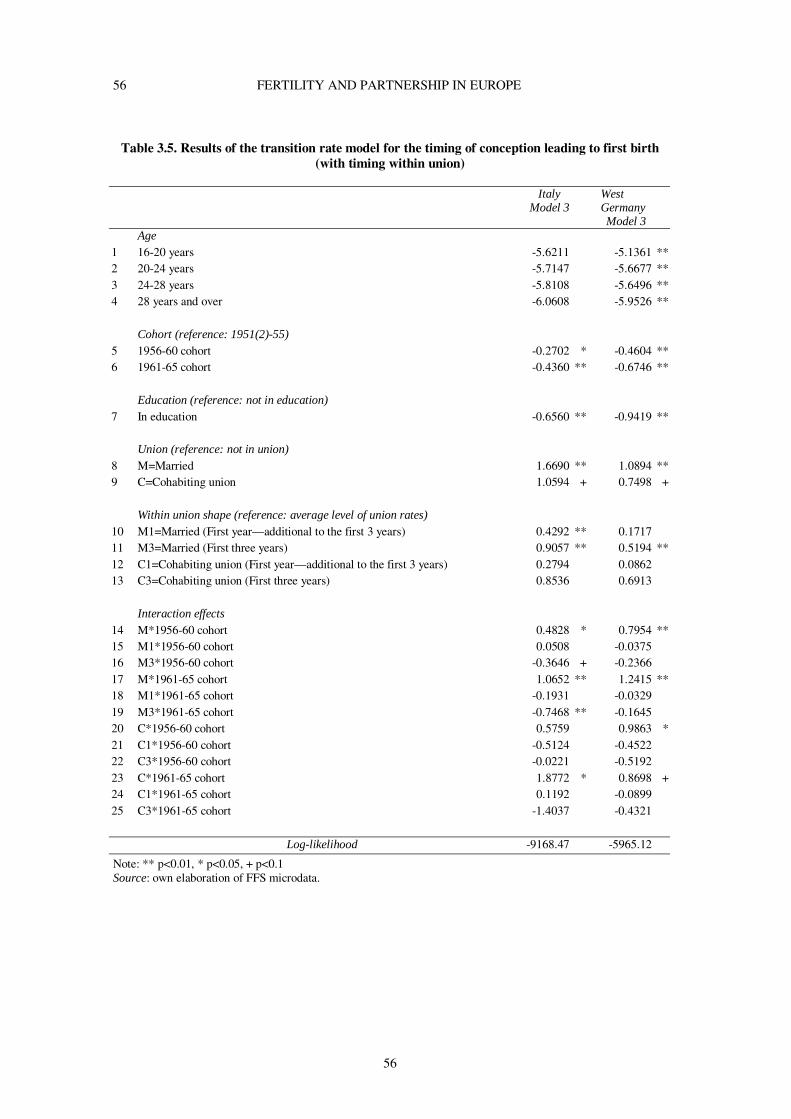
56 FERTILITY AND PARTNERSHIP IN EUROPE
56
Table 3.5. Results of the transition rate model for the timing of conception leading to first birth
(with timing within union) Italy
Model 3 West Germany Model 3
Age 1 16-20 years -5.6211 -5.1361 ** 2 20-24 years -5.7147 -5.6677 ** 3 24-28 years -5.8108 -5.6496 ** 4 28 years and over -6.0608 -5.9526 **
Cohort (reference: 1951(2)-55)
5 1956-60 cohort -0.2702 * -0.4604 ** 6 1961-65 cohort -0.4360 ** -0.6746 ** Education (reference: not in education) 7 In education -0.6560 ** -0.9419 ** Union (reference: not in union) 8 M=Married 1.6690 ** 1.0894 ** 9 C=Cohabiting union 1.0594 + 0.7498 + Within union shape (reference: average level of union rates) 10 M1=Married (First year—additional to the first 3 years) 0.4292 ** 0.1717 11 M3=Married (First three years) 0.9057 ** 0.5194 ** 12 C1=Cohabiting union (First year—additional to the first 3 years) 0.2794 0.0862 13 C3=Cohabiting union (First three years) 0.8536 0.6913
Interaction effects
14 M*1956-60 cohort 0.4828 * 0.7954 ** 15 M1*1956-60 cohort 0.0508 -0.0375 16 M3*1956-60 cohort -0.3646 + -0.2366 17 M*1961-65 cohort 1.0652 ** 1.2415 ** 18 M1*1961-65 cohort -0.1931 -0.0329 19 M3*1961-65 cohort -0.7468 ** -0.1645 20 C*1956-60 cohort 0.5759 0.9863 * 21 C1*1956-60 cohort -0.5124 -0.4522 22 C3*1956-60 cohort -0.0221 -0.5192 23 C*1961-65 cohort 1.8772 * 0.8698 + 24 C1*1961-65 cohort 0.1192 -0.0899 25 C3*1961-65 cohort -1.4037 -0.4321
Log-likelihood -9168.47 -5965.12
Note: ** p<0.01, * p<0.05, + p<0.1 Source: own elaboration of FFS microdata.
THE IMPACT OF UNION FORMATION DYNAMICS ON FIRST BIRTHS 57
57
The major features of the behaviour leading to the first birth in both countries are: (1) a persistent centrality of marriage, which is only partially reduced in west Germany; and (2) a postponement of first births. In Italy this development leads to a double impact, because of the delays in entering unions and in the transition to first parenthood within unions. The convergence to a higher “Second Demographic Transition” score is therefore faster for West Germany, and mainly due to the decreasing share of direct marriages. Italy, on the other hand, seems to keep its own pattern, with only very slight signals of convergence.
The findings presented in this
chapter are relevant from several perspectives. First, our study provides further evidence that a general convergence in patterns of union formation and first births may not occur, and that Europe is likely to be characterised by distinct national and regional patterns in the near and intermediate future. Although union formation and first birth behaviour are clearly transformed and changing in both countries, our study does not indicate a convergence across the regions investigated.
The second important finding of
our study pertains to the implications of childbearing occurring almost exclusively within marriage, as for instance in Italy. In this situation, the postponement of entering marriage and that of fertility within marriage have an additive effect. Whereas in Germany and - most strikingly, of course - in the Scandinavian countries the delay in marriage and marital childbearing is in part offset by an increase in pre-marital cohabitation and childbearing, this counter-mechanism is absent in Italy. One reason for the very low Italian fertility level, therefore, is the strong connection of leaving the parental home, entering marriage and childbearing. In countries where these links are looser, marriage postponement has a smaller effect on fertility, since it is in part offset by increases in out-of-wedlock childbearing.
A third implication of our findings concerns the understanding of persistent divergence in the evolution of social and cultural institutions, such as marriage and the family, during the Second Demographic Transition. The investigation of this path-dependent process requires detailed formal theoretical models, as for instance provided by Kohler (2000a, 2000b) for changes in fertility levels during the first demographic transition, or for periods of the baby boom and bust. For the study of marriage and the family, however, such formal models are still missing in the demographic literature, and - unfortunately - their development is beyond the scope of this chapter. However, we see the findings of the present study as an important empirical input that could be reflected in such theoretical models and, maybe, our empirical analyses can therefore guide such future developments.
REFERENCES
Arthur, W. B. (1990). Positive Feedbacks in the
Economy. Scientific American, Vol. 262, No. 2, 92-98.
Bertram, H. (1995). Regionale Vielfalt und Lebensformen [Pluriformity and living arrangements]. In B. Nauck and C. Onnen-Ismann C. (Eds), Familie im Brennpunkt [Family in focus], Neuwied, 123-147.
Billari, F.C. (2000). L’analisi delle biografie e la transizione allo stato adulto. Aspetti metodologici e applicazioni ai dati della Seconda Indagine sulla Fecondità in Italia [The analysis of biographies and the transition to adulthood. Methodological aspects and applications to the Second Investigation on Fertility in Italy.] Padova: Cleup.
Blossfeld, H.-P. and G. Rohwer (1995). Techniques of Event History Modeling. New Approaches to Causal Analysis. Mahwah, NJ: Lawrence Erlbaum Associates.
Blossfeld, H.-P., E. Klijzing, K. Pohl, and G. Rohwer (1996). Modellierung paralleler und interdependenter Prozesse in der Bevölkerungwissenschaft.[Modelling parallel and interdependnt processes in population studies] Zeitschrift für Bevölkerungwissenschaft, Vol. 21, 29-56.
Blossfeld, H.-P., E. Klijzing, K. Pohl, and G. Rohwer (1999). Why do cohabiting couples marry? An example of a causal event history approach to interdependent systems. Quality & Quantity, Vol. 33, 229-242.
De Sandre, P., Ongaro, F., Rettaroli R. and Salvini, S. (1997). Matrimonio e figli: tra rinvio e rinuncia. [Marriage and children: between postponing and renouncing] Bologna: il Mulino.
58 FERTILITY AND PARTNERSHIP IN EUROPE
De Sandre, P., Ongaro, F., Rettaroli R. and Salvini S. (2000). Fertility and Family Surveys in Countries of the ECE Region. Standard Country Report. Italy. Economic Studies 10o, New York and Geneva: United Nations.
Hank, K. (2001). Regional Social Contexts and Fertility in Western Germany. Paper prepared for the European Population Conference, Helsinki.
Hobcraft, J. and K. Kiernan (1995). Becoming a parent in Europe. In European Population Conference, EAPS-IUSSP Vol. 1. Milano: Franco Angeli.
Hullen, G. (1998). Lebensverläufe in West- und Ostdeustschland. Längschnit-tanalysen des deutschen Family and Fertility Surveys. [Life course analysis in West and East Germany: Life course analyis in the German Family and Fertility Surveys.] Opladen: Leske + Budrich.
Kemper, F.-J. (1991). Recent developments in household and family structure and their impact on regional fertility differences. The example of the FRG. The Geographical Approach to Fertility, J. Bähr and P. Gans, (Eds). Kiel: Kieler Geographische Schriften, Vol. 78, 219-238.
Kiernan, K. (1999a). Cohabitation in Western Europe. Population Trends, Vol. 26, 25-32.
Kiernan, K. (1999b). Childbearing outside marriage in Western Europe. Population Trends, Vol. 98, 11-20.
Kohler, H.-P. (2000a). Fertility Decline as a Coordination Problem. Journal of Development Economics, Vol. 63, No. 2, 231-263.
Kohler, H.-P. (2000b). Social Interaction and Fluctuations in Birth Rates. Population Studies, Vol. 54, No. 2, 223-237.
Manting, D. (1996). The changing meaning of cohabitation and marriage. European Sociological Review, Vol. 12, 53-65.
Micheli, G.A. (2000). Kinship, family and social network. The anthropological embedment of fertility change in Southern Europe. Demographic Research, Vol. 3. Available online at http://www.demographic-research.org/ Volumes/Vol3/13/.
Pohl, K. (1995). Familienbildung und Kinderwunsch in Deutschland [Family formation and desire for children in Germany.] Materialien zur Bevölkerungswissen-schaft, Heft 82a. Wiesbaden: Bundes-institut für Bevölkerungsforschung.
Reher, D.S. (1998). Family Ties in Western Europe: Persistent Contrasts. Population and Development Review, Vol. 24, 203-234.
Rohwer, G. and U. Pötter (2000). TDA User’s manual. Bochum: Ruhr-Universität Bochum.
Roussel, L. (1992). La famille en Europe occidentale: Divergences et convergences. [The family in est Europe: Divergences and convergences.] Population, Vol. 47, 133-152.
Santini, A. (1995). Continuità e discontinuità nel comportamento riproduttivo delle donne italiane nel dopoguerra: tendenze generali della fecondità delle coorti nelle ripartizioni tra il 1952 e il 1991. [Continuity and discontinuity in reproductive behaviour of Italian women after WW-II: general fertility trends among cohorts born between 1952 and 1991.] Working Paper, Department of Statistics. Florence: University of Florence.
van de Kaa, D.J. (1987). Europe’s Second Demographic Transition. Population Bulletin, Vol. 42, No 1, Washington, DC: Population Reference Bureau.
ENDNOTES i The views expressed in this chapter are attributable to the authors and do not necessarily reflect those of the Max Planck Institute for Demographic Research. We wish to thank the Advisory Group of the FFS programme of comparative research for its permission, granted under identification number 75, to use the FFS data on which this study is based. We also thank two anonymous referees for their comments and suggestions. ii In short, southern Italy is more traditional and less economically well off than northern and central Italy. iii The regions in south-islands are Campania, Puglia, Basilicata, Calabria, Sicilia, Sardegna. All others regions belong to the north-center. iv The “Bundesländer” considered to be in the south of west Germany are Baden-Württenberg and Bavaria. All other regions belong to the north. v For our analyses we used the TDA software (Rohwer and Pötter, 2000). vi For our analyses we used the TDA software (Rohwer and Pötter, 2000). vii Actually, what we consider is the transition from the first union to the first marriage, which might also be with a different person with respect to the first union. viii Actually, what we consider is the transition from the first union to the first marriage, which might also be with a person other than the one of the first union. ix This is necessary because we do not have data on full educational histories. In addition, there may be problems because the West German educational system favours return to education, while this is not the case for the Italian.
59
CHAPTER 4
FAMILY POLICIES, WORK ARRANGEMENTS AND THE THIRD CHILD
IN FRANCE AND SWEDENi
Diana Corman∗
∗ Demography Unit, Stockholm University, Stockholm (Sweden)
A. INTRODUCTION Over the last two decades of the twentieth century, Sweden experienced first a strong increase in fertility followed by a rapid de-cline (Figure 4.1). During the same years, France showed relatively stable fertility lev-els, which were substantially higher than that of its neighbouring countries. Both countries also had high female labour force participation rates and generous family sup-port schemes. This contradicts the New Home Economics theories, according to which the rise in female labour force par-ticipation should have reduced fertility (Becker, 1981; Willis, 1973).
We use individual-level data to ad-
dress anew the relationship between em-ployment and fertility in Sweden and France. Recent studies on Scandinavian fer-tility patterns using such data have demon-strated that labour force participation has only a weak influence on second and third births (Hoem and Hoem, 1989; Kravdal, 1992; Oláh, 1996). For example, women with a high educational attainment and a strong professional orientation have re-markably high second and third birth rates (Hoem and Hoem, 1989; Kravdal, 1992; Rønsen, 1998). We investigate whether this pattern is specific to Scandinavia or can also be found in other countries.
The general purpose of this chapter is to show which impact public policies have on people’s work life and childbearing strategies. To this end we investigate two main questions. First, how do labour market policies and certain family policy measures shape the type of employment that parents of small children have? And second, what consequences does the position in the labour market have for continued childbearing?
Arrangements on the labour market
offering equal gender opportunities have an important impact on the way in which peo-ple mould their lives. A society with only the choice between full-time employment and household work provides working parents with options widely apart from those in a society where work time schedules can be adapted more easily to the stage reached in the family life cycle. In a world where full-time household workers are becoming a mi-nority, childbearing decisions are much more than before influenced by the available work arrangements. Hence, our central at-tention is on the interface between public family policy, labour force participation and childbearing.
Studying the arrival of the third
child from a comparative perspective is in-teresting because the two countries selected differ substantially in the field of family pol-icy. France has a family policy
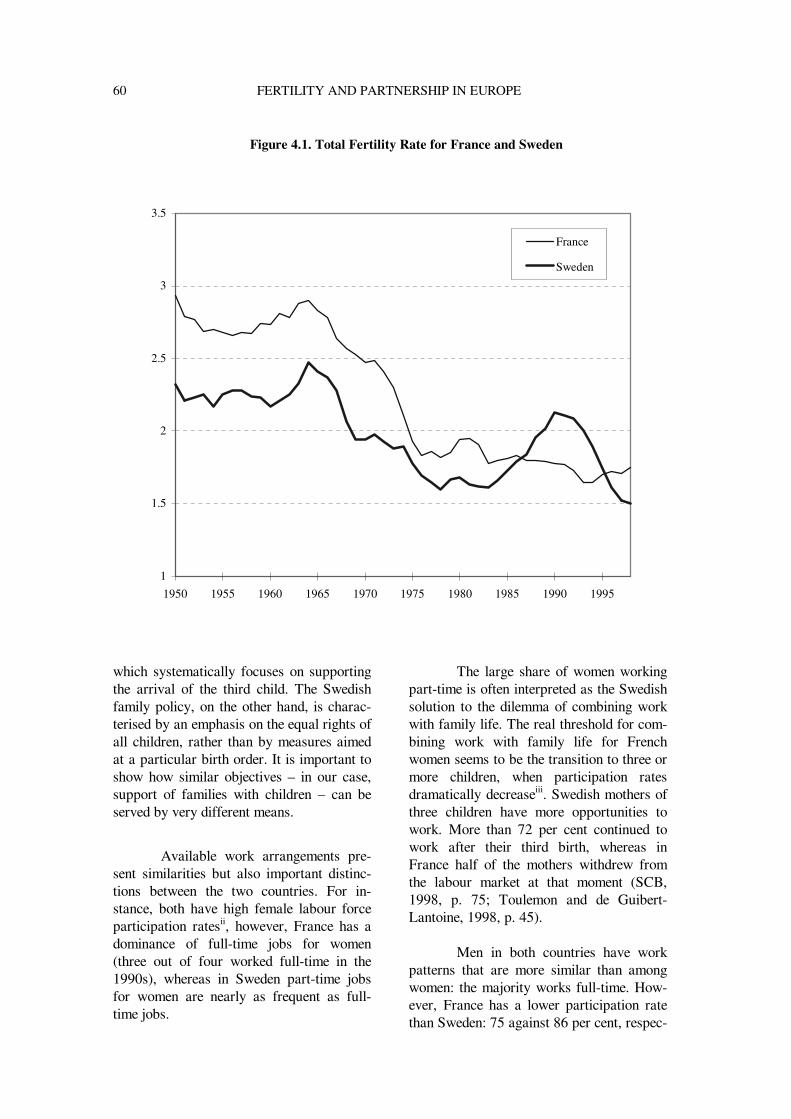
60 FERTILITY AND PARTNERSHIP IN EUROPE
which systematically focuses on supporting the arrival of the third child. The Swedish family policy, on the other hand, is charac-terised by an emphasis on the equal rights of all children, rather than by measures aimed at a particular birth order. It is important to show how similar objectives – in our case, support of families with children – can be served by very different means.
Available work arrangements pre-
sent similarities but also important distinc-tions between the two countries. For in-stance, both have high female labour force participation ratesii, however, France has a dominance of full-time jobs for women (three out of four worked full-time in the 1990s), whereas in Sweden part-time jobs for women are nearly as frequent as full-time jobs.
The large share of women working part-time is often interpreted as the Swedish solution to the dilemma of combining work with family life. The real threshold for com-bining work with family life for French women seems to be the transition to three or more children, when participation rates dramatically decreaseiii. Swedish mothers of three children have more opportunities to work. More than 72 per cent continued to work after their third birth, whereas in France half of the mothers withdrew from the labour market at that moment (SCB, 1998, p. 75; Toulemon and de Guibert-Lantoine, 1998, p. 45).
Men in both countries have work
patterns that are more similar than among women: the majority works full-time. How-ever, France has a lower participation rate than Sweden: 75 against 86 per cent, respec-
Figure 4.1. Total Fertility Rate for France and Sweden
1
1.5
2
2.5
3
3.5
1950 1955 1960 1965 1970 1975 1980 1985 1990 1995
France
Sweden
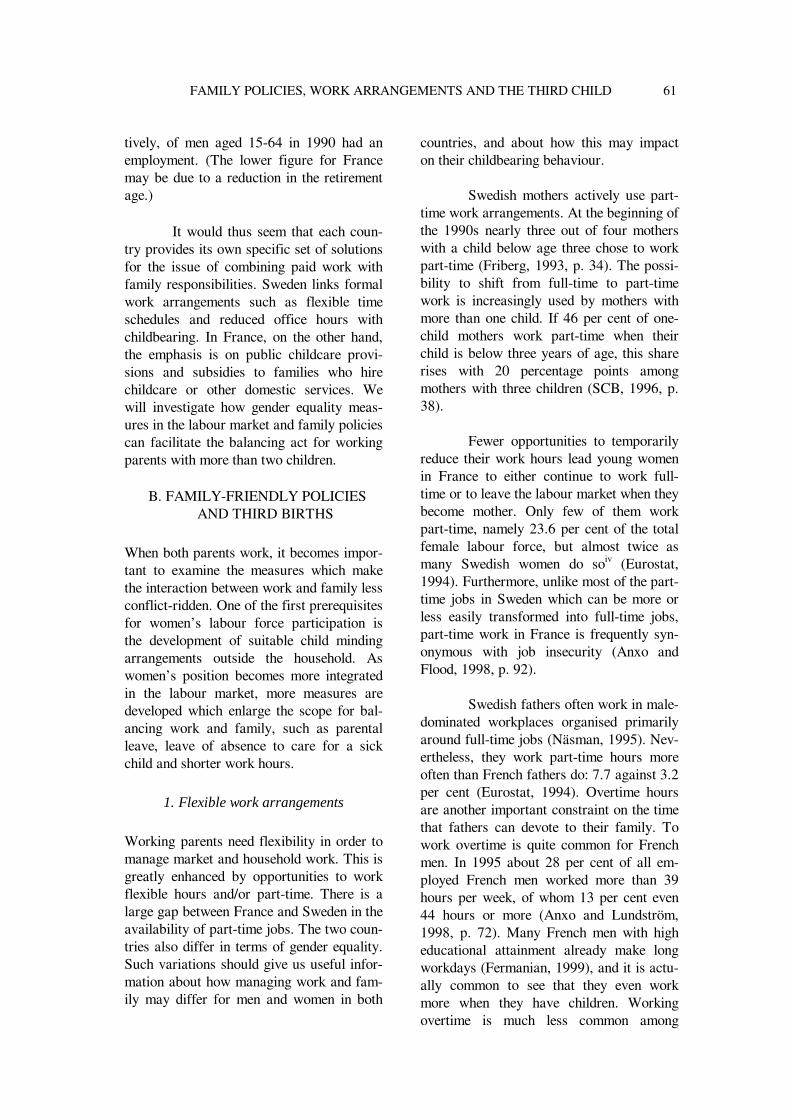
FAMILY POLICIES, WORK ARRANGEMENTS AND THE THIRD CHILD 61
tively, of men aged 15-64 in 1990 had an employment. (The lower figure for France may be due to a reduction in the retirement age.)
It would thus seem that each coun-
try provides its own specific set of solutions for the issue of combining paid work with family responsibilities. Sweden links formal work arrangements such as flexible time schedules and reduced office hours with childbearing. In France, on the other hand, the emphasis is on public childcare provi-sions and subsidies to families who hire childcare or other domestic services. We will investigate how gender equality meas-ures in the labour market and family policies can facilitate the balancing act for working parents with more than two children.
B. FAMILY-FRIENDLY POLICIES
AND THIRD BIRTHS
When both parents work, it becomes impor-tant to examine the measures which make the interaction between work and family less conflict-ridden. One of the first prerequisites for women’s labour force participation is the development of suitable child minding arrangements outside the household. As women’s position becomes more integrated in the labour market, more measures are developed which enlarge the scope for bal-ancing work and family, such as parental leave, leave of absence to care for a sick child and shorter work hours.
1. Flexible work arrangements
Working parents need flexibility in order to manage market and household work. This is greatly enhanced by opportunities to work flexible hours and/or part-time. There is a large gap between France and Sweden in the availability of part-time jobs. The two coun-tries also differ in terms of gender equality. Such variations should give us useful infor-mation about how managing work and fam-ily may differ for men and women in both
countries, and about how this may impact on their childbearing behaviour.
Swedish mothers actively use part-
time work arrangements. At the beginning of the 1990s nearly three out of four mothers with a child below age three chose to work part-time (Friberg, 1993, p. 34). The possi-bility to shift from full-time to part-time work is increasingly used by mothers with more than one child. If 46 per cent of one-child mothers work part-time when their child is below three years of age, this share rises with 20 percentage points among mothers with three children (SCB, 1996, p. 38).
Fewer opportunities to temporarily
reduce their work hours lead young women in France to either continue to work full-time or to leave the labour market when they become mother. Only few of them work part-time, namely 23.6 per cent of the total female labour force, but almost twice as many Swedish women do soiv (Eurostat, 1994). Furthermore, unlike most of the part-time jobs in Sweden which can be more or less easily transformed into full-time jobs, part-time work in France is frequently syn-onymous with job insecurity (Anxo and Flood, 1998, p. 92).
Swedish fathers often work in male-
dominated workplaces organised primarily around full-time jobs (Näsman, 1995). Nev-ertheless, they work part-time hours more often than French fathers do: 7.7 against 3.2 per cent (Eurostat, 1994). Overtime hours are another important constraint on the time that fathers can devote to their family. To work overtime is quite common for French men. In 1995 about 28 per cent of all em-ployed French men worked more than 39 hours per week, of whom 13 per cent even 44 hours or more (Anxo and Lundström, 1998, p. 72). Many French men with high educational attainment already make long workdays (Fermanian, 1999), and it is actu-ally common to see that they even work more when they have children. Working overtime is much less common among
62 FERTILITY AND PARTNERSHIP IN EUROPE Swedish fathers (Anxo and Lundström, 1998, p. 85). Moreover, the refusal to do so for family reasons is much more accepted in the Swedish work culture than in the French (Tyrkkö, 1997). Thus, Swedish fathers should have more opportunities than French, one would say, to be involved in childcare and other household tasks.
Another source of flexibility are
opportunities for informal arrangements at the work place. Examples are agreements with colleagues to arrive late or leave early, or with employers to change work shifts. Qualitative studies of work conditions sug-gest that such informal arrangements can be important for working parents, and espe-cially mothers (Holt and Thaulow, 1996). Informal work arrangements may however be more important in countries with limited formal flexibility (such as France) than in countries with a more advanced formal framework of flexible work arrangements (such as Sweden).
To conclude, part-time work in
Sweden is designed in such a way as to give men and women better possibilities to com-bine work and parenthood. It is also often seen as an arrangement that can later be transformed again into full-time work (Sundström, 1991, 1993; Tyrkkö, 1997). As far as part-time work opportunities are con-cerned, there is no similarly active French policy that would take into account the needs of employees with minor children. The prevalence of full-time work among French men and women reflects a segmentation of people in two sub-groups, namely, the ca-reer-oriented and the family-oriented. Fam-ily life and work life in each of them have little interaction. The large latitude for ad-justments between work and family life pro-vided to Swedish parents implies that they can reconcile the requirements in the two life arenas more easily. In our data this could for instance show up as higher third-birth intensities in Sweden than in France for people with higher education.
2. Parental leave
Parental leave provisions are very generous in Sweden. In the 1980s parents received 90 per cent of their previous wage for a period of 12 months, and at a low flat rate for an-other 3 months (Hoem and Hoem, 1996). Parental leave is granted for all births re-gardless of rank order, whereas in France - until recently at least - only parents of three children or more were eligible. In 1994 they could take leave for a maximum duration of three years at a flat rate of 2 929 French francs per month, which at that time was the equivalent of about 540 US dollars (Fag-nani, 1994, p. 50). This may appear a sub-stantial benefit by international standards, but it is not as abundant as in Sweden. Ei-ther parent in the latter country could in that year receive a parental benefit of up to 22 750 Swedish krona per month (about 3 200 US dollars).
Parents of a new-born child have in Sweden great latitude to combine work with leave for childcare purposes, enjoying full job reinstatement rights after their leave. They can, for example, take parental leave for one half of the week and reduce their work hours by 25 per cent during the other, until the child is eight years old. Such flexi-bility as well as the generous parental bene-fit levels can induce more fathers to share the parental leave with mothers, whereas the low flat-rate benefits in France may act in the opposite direction.
3. Childcare services
Public childcare systems have improved substantially during the last three decades in both countries, although coverage is still insufficient. In 1993, 37 and 23 per cent of all children aged 0-2 years in Sweden and France, respectively, had a place in a day-care centre (Christopherson, 1997). In the first year it is more common for Swedish mothers themselves to take care of their child, as they enjoy a relatively well-paid parental leave. French mothers, on the other
FAMILY POLICIES, WORK ARRANGEMENTS AND THE THIRD CHILD 63
hand, either return to work soon (three or four months) after delivery and hire a regis-tered childminder, or they stay at home for a longer period of time. The latter strategy is especially used by mothers with at least two children. Informal arrangements such as childcare provided by grandparents, friends or neighbours seem to be used to a larger extent by French than by Swedish parentsv.
Three out of four children aged 3-6
years (Landgren-Möller et al., 1994, p. 30) have access to the pre-school system in Sweden and Francei. Swedish parents pay a means-tested fee per child, which neverthe-less covers only about 10 per cent of the total cost of public childcare. Parental fees for care in the public centres of France cover 25 per cent of the total costs for chil-dren below three years, and the pre-school system is free for all children 3-6 years old (Kempeneers and Lelièvre, 1991).
C. ANALYSIS
1. Data
This study uses individual-level data from two FFS surveys, namely, l’Enquête des Situations Familiales et de l’Emploi (ESFE) in France (1994) and the Family and Occu-pation Survey in Sweden (1992-1993).
We analyse the data of French
women and men born between 1944 and 1973, who at the time of the interview were aged 20 to 49. Swedish data refer to men and women born in the years 1949, 1954, 1959, 1964 and 1969, who were respec-tively 43, 38, 33, 28 and 23 years old at interview. Total sample sizes were in both cases about 5 000 persons. Non-response rates were 23 and 22 per cent among Swed-ish men and women (Granström, 1997, p. 43), and 19 and 15 per cent among French men and women (Toulemon and de Guibert-Lantoine, 1998, p. 101).
For Sweden we only analyse people
born in the Nordic countries, for France
only those born within the country. People who never lived in a union, who are child-less or who have only one child or duplets or triplets, or who have adopted a child are also not taken into account.
We concentrate our analysis on re-
spondents in stable unions, leaving out those with children from different unions.
Our resulting sample for Sweden
includes 1 262 women and 587 men. The final sample for France includes 980 women and 561 men.
The clock that measures the elapse
of time (in units of full months) towards parity three starts at the birth date of the second child and stops when one of the fol-lowing occurs (whichever comes first): birth of the third child; separation from the cur-rent partner, to which we add nine months to allow for possible births still conceived with this partner; no third child after fifteen years; or censoring by the interview.
The event of interest is the occur-
rence of a third birth, measured as the re-ported date of birth. The Swedish and French female respondents reported, respec-tively, 398 and 341 such births during our window of observation, whereas the male respondents 170 and 199.
We developed regression models of
the intensity of the progression from the second to a third birth for Swedish and French women and men separately. A per-son’s third-birth intensity is the probability that he/she will experience a third birth next month, given that he/she has not yet done so currently (baseline intensity). We divided the 180 months period (15 years) after the birth of the second child into eight intervals of varying length (see Figure 4.2). Risks are assumed to be constant within each interval (piecewise constant hazard rates), but they may vary across them.
64 FERTILITY AND PARTNERSHIP IN EUROPE
0
5
10
15
20
25
<18
19-2
4
25-3
0
31-3
6
37-7
2
73-8
4
85-1
20
121-
180
abs.
rat
es p
er 1
000
pers
.-m
onth
s
Swedish women
French women
2. Variables To enhance comparability between the two national data sets, we selected a number of covariates derived in similar ways and hav-ing roughly the same meaning. We ran re-gressions in several rounds and report here on only two of them. The first (Table 4.1) mainly contains selected background and demographic control variables, the second in addition educational attainment and policy period variables (Table 4.2).
As a first step we only included the selected background and demographic con-trol variables. Religiosity for Swedish re-spondents is measured by their parents’ level of religiosity as assessed through fre-quency of church attendance. For French respondents, however, the role of religion in their lives at age 18 is being used for this purpose. Social origin is estimated as par-ents’ occupational class for Swedes and as
mother’s labour force experience for French respondents. We have used the respondent’s age at second birth relative to his/her educa-tional attainment at that time to reduce some of the net effect on third-birth rates of the highest level of education attained at inter-view (for more details, see Corman, 2000). Also the length of the second birth interval and the combined civil status were intro-duced at this first step. Results on all these variables are shown in Table 4.1.
Then, in a second step, we added
the respondent’s highest level of education attained at interview. However, the Swedish category of university education includes all those with at least one completed semester at a university or equivalent institution, while the corresponding French category only those with a completed degree.
Figure 4.2. Third-birth risks for French and Swedish women: Standardised for age, civil status, education and policy
Age of second child; months
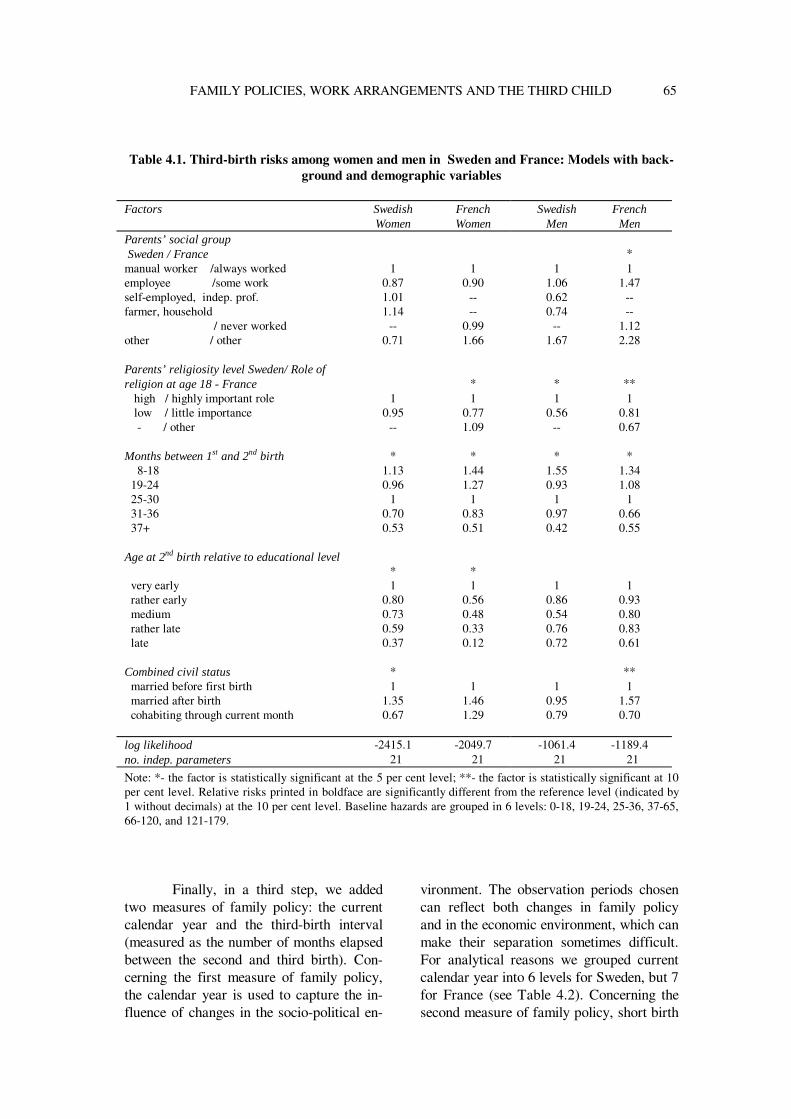
FAMILY POLICIES, WORK ARRANGEMENTS AND THE THIRD CHILD 65
Table 4.1. Third-birth risks among women and men in Sweden and France: Models with back-
ground and demographic variables Factors Swedish
Women French Women
Swedish Men
French Men
Parents’ social group Sweden / France
*
manual worker /always worked 1 1 1 1 employee /some work 0.87 0.90 1.06 1.47 self-employed, indep. prof. 1.01 -- 0.62 -- farmer, household / never worked
1.14 --
-- 0.99
0.74 --
-- 1.12
other / other 0.71 1.66 1.67 2.28 Parents’ religiosity level Sweden/ Role of religion at age 18 - France
*
*
**
high / highly important role 1 1 1 1 low / little importance 0.95 0.77 0.56 0.81 - / other -- 1.09 -- 0.67 Months between 1st and 2nd birth * * * * 8-18 1.13 1.44 1.55 1.34 19-24 0.96 1.27 0.93 1.08 25-30 1 1 1 1 31-36 0.70 0.83 0.97 0.66 37+ 0.53 0.51 0.42 0.55 Age at 2nd birth relative to educational level
* *
very early 1 1 1 1 rather early 0.80 0.56 0.86 0.93 medium 0.73 0.48 0.54 0.80 rather late 0.59 0.33 0.76 0.83 late 0.37 0.12 0.72 0.61 Combined civil status * ** married before first birth 1 1 1 1 married after birth 1.35 1.46 0.95 1.57 cohabiting through current month 0.67 1.29 0.79 0.70 log likelihood -2415.1 -2049.7 -1061.4 -1189.4 no. indep. parameters 21 21 21 21
Note: *- the factor is statistically significant at the 5 per cent level; **- the factor is statistically significant at 10 per cent level. Relative risks printed in boldface are significantly different from the reference level (indicated by 1 without decimals) at the 10 per cent level. Baseline hazards are grouped in 6 levels: 0-18, 19-24, 25-36, 37-65, 66-120, and 121-179.
Finally, in a third step, we added two measures of family policy: the current calendar year and the third-birth interval (measured as the number of months elapsed between the second and third birth). Con-cerning the first measure of family policy, the calendar year is used to capture the in-fluence of changes in the socio-political en-
vironment. The observation periods chosen can reflect both changes in family policy and in the economic environment, which can make their separation sometimes difficult. For analytical reasons we grouped current calendar year into 6 levels for Sweden, but 7 for France (see Table 4.2). Concerning the second measure of family policy, short birth
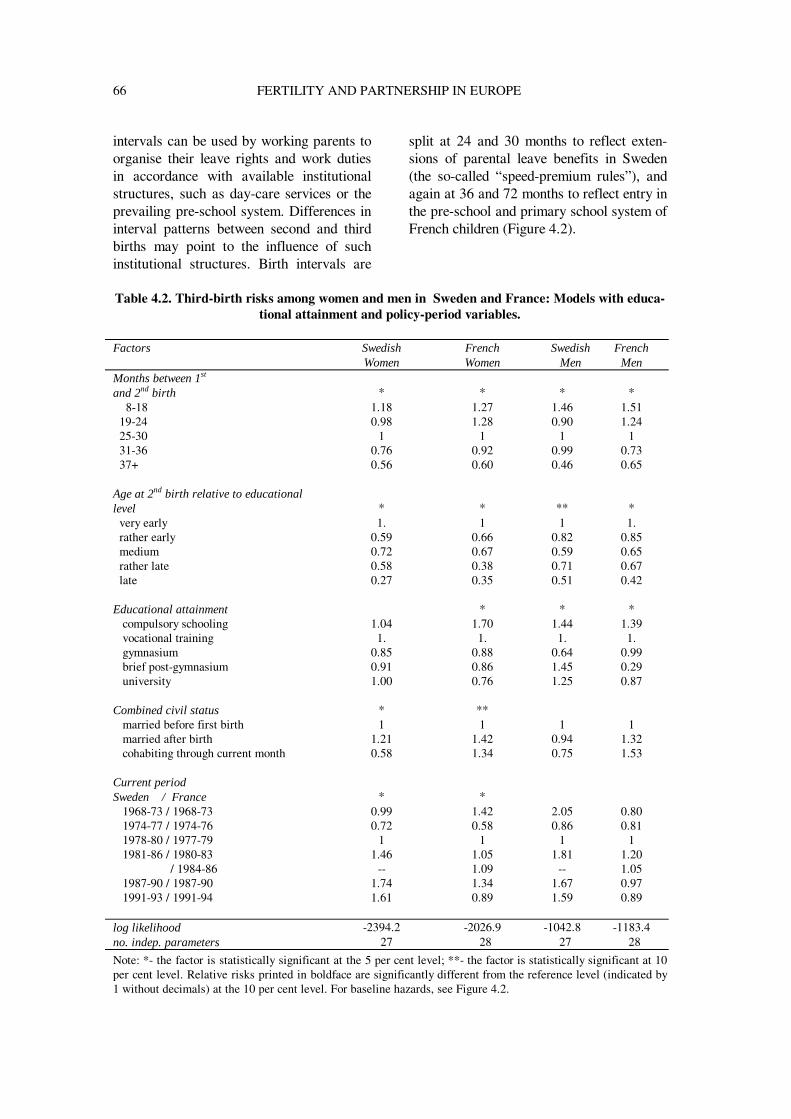
66 FERTILITY AND PARTNERSHIP IN EUROPE intervals can be used by working parents to organise their leave rights and work duties in accordance with available institutional structures, such as day-care services or the prevailing pre-school system. Differences in interval patterns between second and third births may point to the influence of such institutional structures. Birth intervals are
split at 24 and 30 months to reflect exten-sions of parental leave benefits in Sweden (the so-called “speed-premium rules”), and again at 36 and 72 months to reflect entry in the pre-school and primary school system of French children (Figure 4.2).
Table 4.2. Third-birth risks among women and men in Sweden and France: Models with educa-
tional attainment and policy-period variables.
Factors Swedish Women
French Women
Swedish Men
French Men
Months between 1st
and 2nd birth
* *
*
*
8-18 1.18 1.27 1.46 1.51 19-24 0.98 1.28 0.90 1.24 25-30 1 1 1 1 31-36 0.76 0.92 0.99 0.73 37+ 0.56 0.60 0.46 0.65 Age at 2nd birth relative to educational level
*
*
**
*
very early 1. 1 1 1. rather early 0.59 0.66 0.82 0.85 medium 0.72 0.67 0.59 0.65 rather late 0.58 0.38 0.71 0.67 late 0.27 0.35 0.51 0.42 Educational attainment * * * compulsory schooling 1.04 1.70 1.44 1.39 vocational training 1. 1. 1. 1. gymnasium 0.85 0.88 0.64 0.99 brief post-gymnasium 0.91 0.86 1.45 0.29 university 1.00 0.76 1.25 0.87 Combined civil status * ** married before first birth 1 1 1 1 married after birth 1.21 1.42 0.94 1.32 cohabiting through current month 0.58 1.34 0.75 1.53 Current period Sweden / France
*
*
1968-73 / 1968-73 0.99 1.42 2.05 0.80 1974-77 / 1974-76 0.72 0.58 0.86 0.81 1978-80 / 1977-79 1 1 1 1 1981-86 / 1980-83 1.46 1.05 1.81 1.20 / 1984-86 -- 1.09 -- 1.05 1987-90 / 1987-90 1.74 1.34 1.67 0.97 1991-93 / 1991-94 1.61 0.89 1.59 0.89 log likelihood -2394.2 -2026.9 -1042.8 -1183.4 no. indep. parameters 27 28 27 28
Note: *- the factor is statistically significant at the 5 per cent level; **- the factor is statistically significant at 10 per cent level. Relative risks printed in boldface are significantly different from the reference level (indicated by 1 without decimals) at the 10 per cent level. For baseline hazards, see Figure 4.2.
FAMILY POLICIES, WORK ARRANGEMENTS AND THE THIRD CHILD 67
3. Findings Our findings confirm once more the fertility enhancing effects of religiosity and early entry into second-time motherhood (Table 4.1). Also in line with findings reported pre-viously (Corman, 2000) is the fact that a recent marriage (that is, contracted after the birth of one or two children) increases the third-birth risks of French couples.
French mothers with two children
turn out to have on average a lower educa-tional attainment than Swedish mothers with that number of children (figures not shown). For instance, only 16 per cent of French mothers with two children have an educa-tional attainment beyond high school, whereas 28 per cent of Swedish mothers with that number of children have at least some post-gymnasium education (Corman, 2000). Such differences might be explained in part by the more developed system of adult education in Sweden. The distribution by educational level of parents with two children suggests therefore a higher concen-tration of family-oriented parents in the French data set. This might in the end lead to higher third-birth intensities among them, as shown in Figure 4.2.
To investigate this in more detail we
selected respondents with vocational train-ing as the reference group because this is one of the largest, ranging from 40 to 54 per cent across the four subsamples. We start out by noting that respondents with only compulsory schooling seem to form a class on their own: they have the highest third-birth intensities of all educational groups (Table 4.2). French women with a university degree are the least inclined to have a third child: although the difference is not statisti-cally significant, their third-birth risks are reduced by a quarter compared to women with vocational training. Moreover, their risks are about half of what they are for women with compulsory education. In Swe-den, however, higher education does not at all seem to form an obstacle in this respect. All Swedish women with at least some
higher education have third-birth rates that are as high as those with vocational training or compulsory schooling only. Because higher educated women generally have higher incomes and more flexible work hours in Sweden, they have better opportu-nities to combine work and family. They have also been found to negotiate more often with their partner for a more equal division of labour in the household than women with less financial power (Haas, 1992, p. 112).
How could we explain the differ-
ence in fertility behaviour between higher educated women in France and Sweden? The earnings-replacement role of the Swed-ish parental leave arrangements not only compensates mothers with higher incomes to a larger degree than mothers with lower earnings, but it also encourages fathers to share some parental leave with them. Swed-ish families where either parent had a high educational attainment were in a recent sur-vey found to share more of the total parental leave benefits than families with lower pa-rental educational attainment (Edlund et al., 2000). In contrast, the flat rate of the French parental benefits system discourages both parents with higher education to use the pa-rental leave.
At the same time, French women
with less education more often take full ad-vantage of their parental leave benefits, since they risk less in terms of career oppor-tunities. The gap between their parental benefits and regular earnings is much smaller than for women with higher educa-tion (Renaudat, 1993). The higher opportu-nity costs for French women with a univer-sity degree may mean that the time they spend at home caring for children becomes more expensive. This in turn could reduce their willingness to go for a third child.
Men on the other hand present two
distinct patterns of third births. The effect of their educational level displays a U-shape in Sweden, but an inverted J-shape in France. The fact that an increase in education does not uniformly depress men’s third-birth
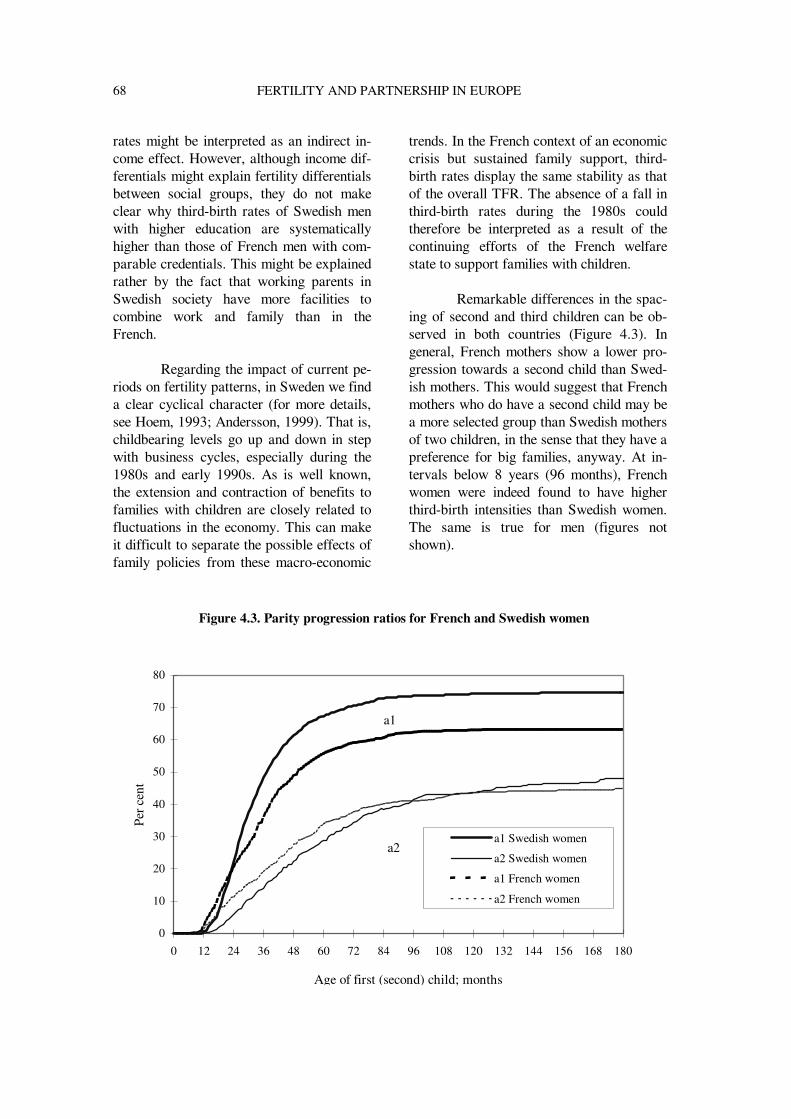
68 FERTILITY AND PARTNERSHIP IN EUROPE rates might be interpreted as an indirect in-come effect. However, although income dif-ferentials might explain fertility differentials between social groups, they do not make clear why third-birth rates of Swedish men with higher education are systematically higher than those of French men with com-parable credentials. This might be explained rather by the fact that working parents in Swedish society have more facilities to combine work and family than in the French.
Regarding the impact of current pe-
riods on fertility patterns, in Sweden we find a clear cyclical character (for more details, see Hoem, 1993; Andersson, 1999). That is, childbearing levels go up and down in step with business cycles, especially during the 1980s and early 1990s. As is well known, the extension and contraction of benefits to families with children are closely related to fluctuations in the economy. This can make it difficult to separate the possible effects of family policies from these macro-economic
trends. In the French context of an economic crisis but sustained family support, third-birth rates display the same stability as that of the overall TFR. The absence of a fall in third-birth rates during the 1980s could therefore be interpreted as a result of the continuing efforts of the French welfare state to support families with children.
Remarkable differences in the spac-
ing of second and third children can be ob-served in both countries (Figure 4.3). In general, French mothers show a lower pro-gression towards a second child than Swed-ish mothers. This would suggest that French mothers who do have a second child may be a more selected group than Swedish mothers of two children, in the sense that they have a preference for big families, anyway. At in-tervals below 8 years (96 months), French women were indeed found to have higher third-birth intensities than Swedish women. The same is true for men (figures not shown).
0
10
20
30
40
50
60
70
80
0 12 24 36 48 60 72 84 96 108 120 132 144 156 168 180
Per
cent
a1 Swedish women
a2 Swedish women
a1 French women
a2 French women
a2
a1
Figure 4.3. Parity progression ratios for French and Swedish women
Age of first (second) child; months
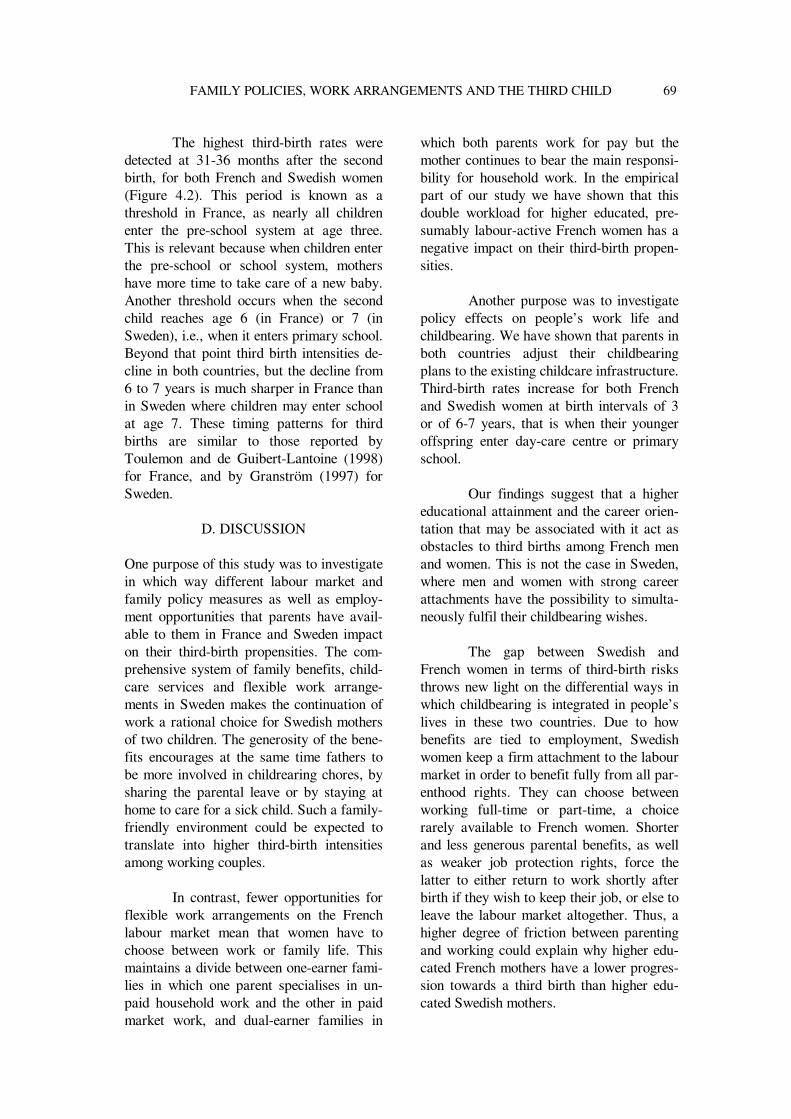
FAMILY POLICIES, WORK ARRANGEMENTS AND THE THIRD CHILD 69
The highest third-birth rates were detected at 31-36 months after the second birth, for both French and Swedish women (Figure 4.2). This period is known as a threshold in France, as nearly all children enter the pre-school system at age three. This is relevant because when children enter the pre-school or school system, mothers have more time to take care of a new baby. Another threshold occurs when the second child reaches age 6 (in France) or 7 (in Sweden), i.e., when it enters primary school. Beyond that point third birth intensities de-cline in both countries, but the decline from 6 to 7 years is much sharper in France than in Sweden where children may enter school at age 7. These timing patterns for third births are similar to those reported by Toulemon and de Guibert-Lantoine (1998) for France, and by Granström (1997) for Sweden.
D. DISCUSSION
One purpose of this study was to investigate in which way different labour market and family policy measures as well as employ-ment opportunities that parents have avail-able to them in France and Sweden impact on their third-birth propensities. The com-prehensive system of family benefits, child-care services and flexible work arrange-ments in Sweden makes the continuation of work a rational choice for Swedish mothers of two children. The generosity of the bene-fits encourages at the same time fathers to be more involved in childrearing chores, by sharing the parental leave or by staying at home to care for a sick child. Such a family-friendly environment could be expected to translate into higher third-birth intensities among working couples.
In contrast, fewer opportunities for
flexible work arrangements on the French labour market mean that women have to choose between work or family life. This maintains a divide between one-earner fami-lies in which one parent specialises in un-paid household work and the other in paid market work, and dual-earner families in
which both parents work for pay but the mother continues to bear the main responsi-bility for household work. In the empirical part of our study we have shown that this double workload for higher educated, pre-sumably labour-active French women has a negative impact on their third-birth propen-sities.
Another purpose was to investigate
policy effects on people’s work life and childbearing. We have shown that parents in both countries adjust their childbearing plans to the existing childcare infrastructure. Third-birth rates increase for both French and Swedish women at birth intervals of 3 or of 6-7 years, that is when their younger offspring enter day-care centre or primary school.
Our findings suggest that a higher
educational attainment and the career orien-tation that may be associated with it act as obstacles to third births among French men and women. This is not the case in Sweden, where men and women with strong career attachments have the possibility to simulta-neously fulfil their childbearing wishes.
The gap between Swedish and
French women in terms of third-birth risks throws new light on the differential ways in which childbearing is integrated in people’s lives in these two countries. Due to how benefits are tied to employment, Swedish women keep a firm attachment to the labour market in order to benefit fully from all par-enthood rights. They can choose between working full-time or part-time, a choice rarely available to French women. Shorter and less generous parental benefits, as well as weaker job protection rights, force the latter to either return to work shortly after birth if they wish to keep their job, or else to leave the labour market altogether. Thus, a higher degree of friction between parenting and working could explain why higher edu-cated French mothers have a lower progres-sion towards a third birth than higher edu-cated Swedish mothers.
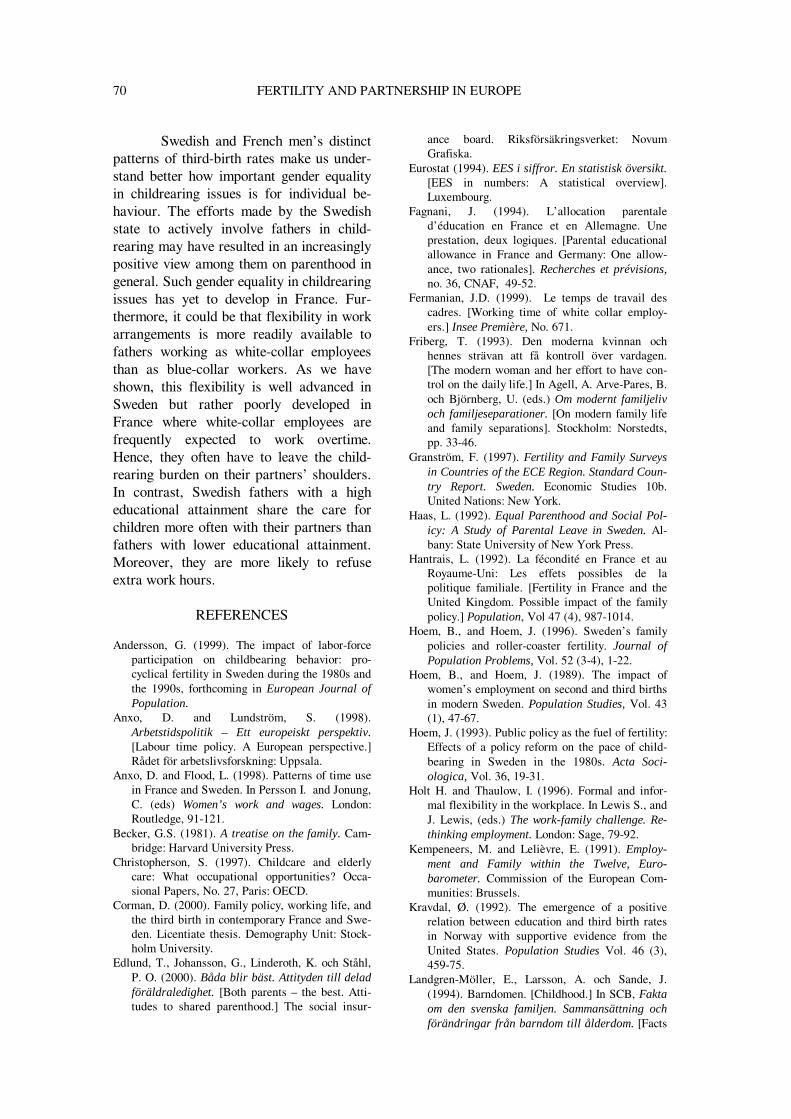
70 FERTILITY AND PARTNERSHIP IN EUROPE
Swedish and French men’s distinct patterns of third-birth rates make us under-stand better how important gender equality in childrearing issues is for individual be-haviour. The efforts made by the Swedish state to actively involve fathers in child- rearing may have resulted in an increasingly positive view among them on parenthood in general. Such gender equality in childrearing issues has yet to develop in France. Fur-thermore, it could be that flexibility in work arrangements is more readily available to fathers working as white-collar employees than as blue-collar workers. As we have shown, this flexibility is well advanced in Sweden but rather poorly developed in France where white-collar employees are frequently expected to work overtime. Hence, they often have to leave the child-rearing burden on their partners’ shoulders. In contrast, Swedish fathers with a high educational attainment share the care for children more often with their partners than fathers with lower educational attainment. Moreover, they are more likely to refuse extra work hours.
REFERENCES Andersson, G. (1999). The impact of labor-force
participation on childbearing behavior: pro-cyclical fertility in Sweden during the 1980s and the 1990s, forthcoming in European Journal of Population.
Anxo, D. and Lundström, S. (1998). Arbetstidspolitik – Ett europeiskt perspektiv. [Labour time policy. A European perspective.] Rådet för arbetslivsforskning: Uppsala.
Anxo, D. and Flood, L. (1998). Patterns of time use in France and Sweden. In Persson I. and Jonung, C. (eds) Women’s work and wages. London: Routledge, 91-121.
Becker, G.S. (1981). A treatise on the family. Cam-bridge: Harvard University Press.
Christopherson, S. (1997). Childcare and elderly care: What occupational opportunities? Occa-sional Papers, No. 27, Paris: OECD.
Corman, D. (2000). Family policy, working life, and the third birth in contemporary France and Swe-den. Licentiate thesis. Demography Unit: Stock-holm University.
Edlund, T., Johansson, G., Linderoth, K. och Ståhl, P. O. (2000). Båda blir bäst. Attityden till delad föräldraledighet. [Both parents – the best. Atti-tudes to shared parenthood.] The social insur-
ance board. Riksförsäkringsverket: Novum Grafiska.
Eurostat (1994). EES i siffror. En statistisk översikt. [EES in numbers: A statistical overview]. Luxembourg.
Fagnani, J. (1994). L’allocation parentale d’éducation en France et en Allemagne. Une prestation, deux logiques. [Parental educational allowance in France and Germany: One allow-ance, two rationales]. Recherches et prévisions, no. 36, CNAF, 49-52.
Fermanian, J.D. (1999). Le temps de travail des cadres. [Working time of white collar employ-ers.] Insee Première, No. 671.
Friberg, T. (1993). Den moderna kvinnan och hennes strävan att få kontroll över vardagen. [The modern woman and her effort to have con-trol on the daily life.] In Agell, A. Arve-Pares, B. och Björnberg, U. (eds.) Om modernt familjeliv och familjeseparationer. [On modern family life and family separations]. Stockholm: Norstedts, pp. 33-46.
Granström, F. (1997). Fertility and Family Surveys in Countries of the ECE Region. Standard Coun-try Report. Sweden. Economic Studies 10b. United Nations: New York.
Haas, L. (1992). Equal Parenthood and Social Pol-icy: A Study of Parental Leave in Sweden. Al-bany: State University of New York Press.
Hantrais, L. (1992). La fécondité en France et au Royaume-Uni: Les effets possibles de la politique familiale. [Fertility in France and the United Kingdom. Possible impact of the family policy.] Population, Vol 47 (4), 987-1014.
Hoem, B., and Hoem, J. (1996). Sweden’s family policies and roller-coaster fertility. Journal of Population Problems, Vol. 52 (3-4), 1-22.
Hoem, B., and Hoem, J. (1989). The impact of women’s employment on second and third births in modern Sweden. Population Studies, Vol. 43 (1), 47-67.
Hoem, J. (1993). Public policy as the fuel of fertility: Effects of a policy reform on the pace of child-bearing in Sweden in the 1980s. Acta Soci-ologica, Vol. 36, 19-31.
Holt H. and Thaulow, I. (1996). Formal and infor-mal flexibility in the workplace. In Lewis S., and J. Lewis, (eds.) The work-family challenge. Re-thinking employment. London: Sage, 79-92.
Kempeneers, M. and Lelièvre, E. (1991). Employ-ment and Family within the Twelve, Euro-barometer. Commission of the European Com-munities: Brussels.
Kravdal, Ø. (1992). The emergence of a positive relation between education and third birth rates in Norway with supportive evidence from the United States. Population Studies Vol. 46 (3), 459-75.
Landgren-Möller, E., Larsson, A. och Sande, J. (1994). Barndomen. [Childhood.] In SCB, Fakta om den svenska familjen. Sammansättning och förändringar från barndom till ålderdom. [Facts
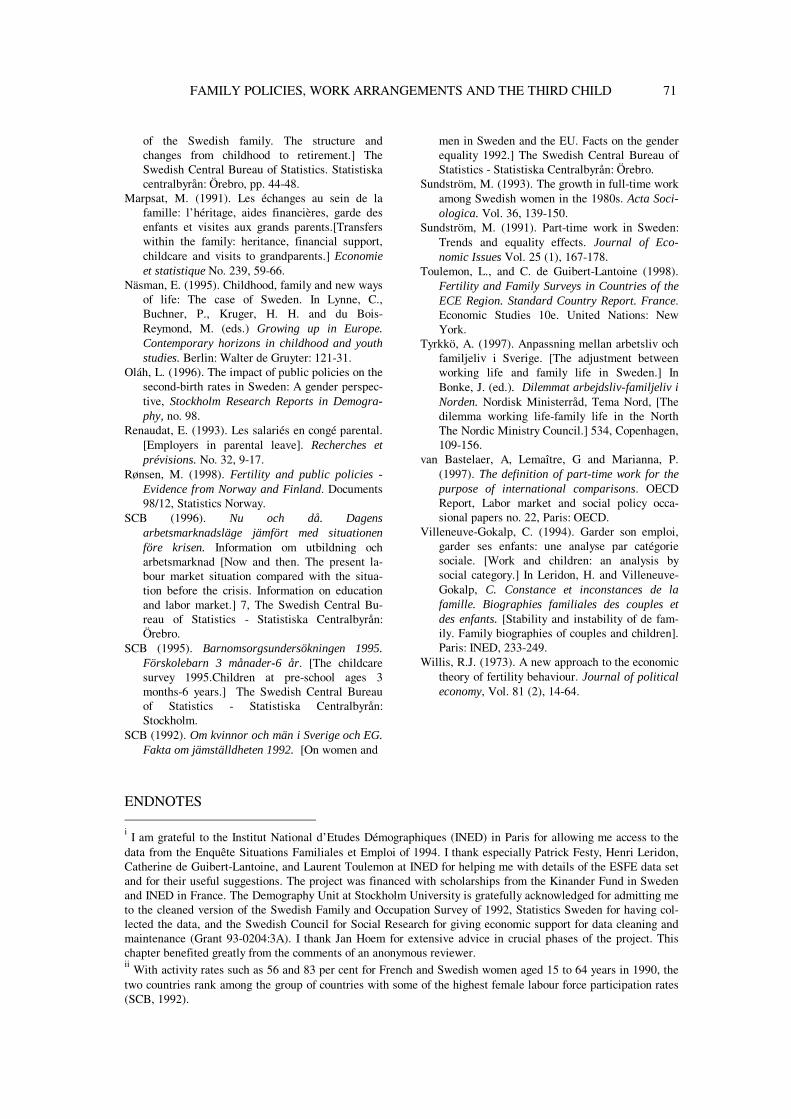
FAMILY POLICIES, WORK ARRANGEMENTS AND THE THIRD CHILD 71
of the Swedish family. The structure and changes from childhood to retirement.] The Swedish Central Bureau of Statistics. Statistiska centralbyrån: Örebro, pp. 44-48.
Marpsat, M. (1991). Les échanges au sein de la famille: l’héritage, aides financières, garde des enfants et visites aux grands parents.[Transfers within the family: heritance, financial support, childcare and visits to grandparents.] Economie et statistique No. 239, 59-66.
Näsman, E. (1995). Childhood, family and new ways of life: The case of Sweden. In Lynne, C., Buchner, P., Kruger, H. H. and du Bois-Reymond, M. (eds.) Growing up in Europe. Contemporary horizons in childhood and youth studies. Berlin: Walter de Gruyter: 121-31.
Oláh, L. (1996). The impact of public policies on the second-birth rates in Sweden: A gender perspec-tive, Stockholm Research Reports in Demogra-phy, no. 98.
Renaudat, E. (1993). Les salariés en congé parental. [Employers in parental leave]. Recherches et prévisions. No. 32, 9-17.
Rønsen, M. (1998). Fertility and public policies - Evidence from Norway and Finland. Documents 98/12, Statistics Norway.
SCB (1996). Nu och då. Dagens arbetsmarknadsläge jämfört med situationen före krisen. Information om utbildning och arbetsmarknad [Now and then. The present la-bour market situation compared with the situa-tion before the crisis. Information on education and labor market.] 7, The Swedish Central Bu-reau of Statistics - Statistiska Centralbyrån: Örebro.
SCB (1995). Barnomsorgsundersökningen 1995. Förskolebarn 3 månader-6 år. [The childcare survey 1995.Children at pre-school ages 3 months-6 years.] The Swedish Central Bureau of Statistics - Statistiska Centralbyrån: Stockholm.
SCB (1992). Om kvinnor och män i Sverige och EG. Fakta om jämställdheten 1992. [On women and
men in Sweden and the EU. Facts on the gender equality 1992.] The Swedish Central Bureau of Statistics - Statistiska Centralbyrån: Örebro.
Sundström, M. (1993). The growth in full-time work among Swedish women in the 1980s. Acta Soci-ologica. Vol. 36, 139-150.
Sundström, M. (1991). Part-time work in Sweden: Trends and equality effects. Journal of Eco-nomic Issues Vol. 25 (1), 167-178.
Toulemon, L., and C. de Guibert-Lantoine (1998). Fertility and Family Surveys in Countries of the ECE Region. Standard Country Report. France. Economic Studies 10e. United Nations: New York.
Tyrkkö, A. (1997). Anpassning mellan arbetsliv och familjeliv i Sverige. [The adjustment between working life and family life in Sweden.] In Bonke, J. (ed.). Dilemmat arbejdsliv-familjeliv i Norden. Nordisk Ministerråd, Tema Nord, [The dilemma working life-family life in the North The Nordic Ministry Council.] 534, Copenhagen, 109-156.
van Bastelaer, A, Lemaître, G and Marianna, P. (1997). The definition of part-time work for the purpose of international comparisons. OECD Report, Labor market and social policy occa-sional papers no. 22, Paris: OECD.
Villeneuve-Gokalp, C. (1994). Garder son emploi, garder ses enfants: une analyse par catégorie sociale. [Work and children: an analysis by social category.] In Leridon, H. and Villeneuve-Gokalp, C. Constance et inconstances de la famille. Biographies familiales des couples et des enfants. [Stability and instability of de fam-ily. Family biographies of couples and children]. Paris: INED, 233-249.
Willis, R.J. (1973). A new approach to the economic theory of fertility behaviour. Journal of political economy, Vol. 81 (2), 14-64.
ENDNOTES i I am grateful to the Institut National d’Etudes Démographiques (INED) in Paris for allowing me access to the data from the Enquête Situations Familiales et Emploi of 1994. I thank especially Patrick Festy, Henri Leridon, Catherine de Guibert-Lantoine, and Laurent Toulemon at INED for helping me with details of the ESFE data set and for their useful suggestions. The project was financed with scholarships from the Kinander Fund in Sweden and INED in France. The Demography Unit at Stockholm University is gratefully acknowledged for admitting me to the cleaned version of the Swedish Family and Occupation Survey of 1992, Statistics Sweden for having col-lected the data, and the Swedish Council for Social Research for giving economic support for data cleaning and maintenance (Grant 93-0204:3A). I thank Jan Hoem for extensive advice in crucial phases of the project. This chapter benefited greatly from the comments of an anonymous reviewer. ii With activity rates such as 56 and 83 per cent for French and Swedish women aged 15 to 64 years in 1990, the two countries rank among the group of countries with some of the highest female labour force participation rates (SCB, 1992).

72 FERTILITY AND PARTNERSHIP IN EUROPE iii In 1994 three out of four French women worked when they had one child, a share which decreased to 70 per cent at the second birth, to 50 per cent at the third, and to 16 per cent at the fourth (Toulemon and de Guibert-Lantoine, 1998, p. 45). iv One should be cautious when attempting to compare part-time work across different countries, because national definitions of part-time work differ substantially. Sweden defines part-time work as jobs of less than 35 usual hours per week, whereas France uses the respondents’ own assessment of the nature of the job. For a good dis-cussion of making international comparisons of part-time work, see van Bastelaer, Lemaître and Marianna, 1997. v In a French study on exchanges of services between adult children and their parents, it was found that 30 per cent of mothers who needed childcare for their children below three years left them with the grandparents when they were working (Marpsat, 1991). Few Swedish parents choose private childcare alternatives. In 1995 only 2 and 4 per cent, respectively, of the children aged 3-6 years had paid and unpaid private childcare arrangements (SCB, 1995, p. 2).
73
CHAPTER 5
DISRUPTION OF THE FIRST ‘PARENTAL UNION’ IN SWEDEN AND
HUNGARY. FOCUSING ON POLICY AND GENDER EFFECTS.i
Livia Sz. Oláh*
* Department of Sociology, Stockholm University, Stockholm (Sweden)
A. BACKGROUND In the last decades of the 20th century, un-ion dissolution became more and more common in most industrialised countries, even among families with children. At the same time, women’s employment rates have greatly risen. This has challenged tra-ditional gender relations that are based on the ”male breadwinner-female homemaker” model. In parallel with this, important pol-icy changes have taken place, such as the introduction of no-fault divorce laws and rules of joint custody for children after a family break-up. Yet we know relatively little about the impact of such policies and changing gender relations on family stabil-ity. Another important question is whether family dissolution behaviour is gender-specific. For instance, some factors may be influential among women only, others more among men.
The purpose of this chapter is to
shed more light on these issues. We study the impact of public policies and changing gender relations on union disruption among parents in Sweden and Hungary from the mid-1960s to the early 1990s. We focus on the first parental union, defined as the un-ion in which the first child was born. Our choice of countries for this analysis has many reasons.
First, women’s participation in
higher education and the labour force have reached high levels in both Sweden and Hungary, as compared to other industrial-ised countries. Yet a large proportion of
Swedish women have been part-time em-ployed, while Hungarian women have worked full-time just like men.
Second, family formation patterns
have been rather different in these two countries. In Hungary before the 1990s, childbearing was essentially constricted to marriage, while in Sweden the proportion of births occurring in non-marital unions has increased rapidly from the 1970s on-wards. By the mid-1980s, the majority of Swedish couples with a first child lived in consensual unions, a trend that has not changed since then.
Third, families have received sub-
stantial state support in both countries, where a wide range of social services have facilitated the combination of employment and parenthood, mainly for women. Gender equality has been on the policy agenda, but in Hungary it was mostly limited to equal labour market participation, while in Swe-den it was aimed at a more general trans-formation of gender roles, with equal par-ticipation by women and men in paid work as well as in family tasks.
Fourth, both Sweden and Hungary
have a long history of rather liberal divorce legislation and high divorce rates, also among couples with children (Goode, 1993). Sweden acknowledged some no-fault grounds as early as in 1915. The di-vorce law reform of 1974 eliminated all fault grounds and simplified the divorce procedure. A waiting period as short as six months has been required only for couples
74 FERTILITY AND PARTNERSHIP IN EUROPE with minor children or for couples disagreeing on divorce. In Hungary, no-fault divorce legislation was introduced in 1952. The 1974 reform permitted divorce by mutual consent. In mid-1987 divorce procedures became more complicated when a compulsory pre-divorce court hearing was introduced that aimed at the reconciliation of couples. Spousal alimony is almost non-existent in both countries and, independ-ently of its source, property is evenly di-vided between the former spouses. A non-resident parent is obliged to pay child sup-port for minor children.
Fifth, legal rules allow divorced or separated parents to continue to have joint custody for their children in both countries. In Sweden, the rule of joint (legal) custody was introduced in mid-1983 and has led to an increased involvement by both parents with their children after a family break-up. However, relatively few parents choose to share also the physical custody of their children when the family dissolves. In Hungary, the law requires parents to coop-erate in important decisions regarding their children, even if one parent has the sole custody after a union disruption. Yet many fathers practically disappear from their children’s life after the partnership ends, as in the vast majority of cases mothers have the sole custody after a divorce. Thus in Sweden family disruption does not neces-sarily mean the loss of parental status for either men or women, while Hungarian fa-thers often risk to loose contact with their children when the union dissolves.
Our main hypotheses in this study are the following. First, public policies and gender relations within the union influence family stability. Their impact should be significant even after controlling for other factors that previous studies have proven to affect union dissolution. Second, disruption risks are gender-specific. We expect to find gender differences especially for factors that reflect the labour market attachments of the parents.
B. DATA AND METHOD The empirical analysis is based on data from the Swedish Family and Working Life Survey of 1992-93 conducted by Statistics Sweden, and from the Hungarian Fertility and Family Survey of 1992-93 conducted by Statistics Hungary. (For details see Granström, 1997; Kamarás, 1999) Both surveys are part of the FFS project and thus the data provided are suitable for cross-country comparisons.
For the purpose of this study, we
have selected respondents who have one or more recorded marital or non-marital un-ions and at least one biological child who was born within a union. In order to avoid problems of cultural differences, which are likely to affect family dissolution risks, we have excluded individuals of non-Nordic origin from the Swedish sample. From the Hungarian sample we have excluded re-spondents who at the time of the interview were under 20 years of age, as well as those whose records of partnership or childbear-ing histories were incomplete. As policy effects on parental union disruption may be difficult to detect, we made the samples as homogenous as possible. Therefore, we also excluded those (i) who had an adopted child in their first parental union; (ii) whose partner had a child from a previous rela-tionship; (iii) whose union ended in the same month in which their first child was born; and, (iv) whose first child from a first parental union died. Censoring occurs 16 years after the first birth, at the end of the union if caused by the death of the respon-dent’s partner, or at interview, whichever comes first. Our working samples include 1 869 women and 861 men for Sweden, and 2 430 women and 1 070 men for Hungary.
We use the method of intensity re-
gression to estimate the impact of various factors on the risk of union disruption in the first parental union. The analysis is based on a piecewise constant proportional hazards model. Exposure is measured in months (but results are presented in years), starting from the birth of the first child of the respondent and continuing until the child turns 16 or censorship for other rea-
DISRUPTION OF THE FIRST ‘PARENTAL UNION’ 75 sons. The Windows-based software ”Ro-caNova” developed at Statistics Sweden is used for model fitting. The maximum likelihood estimates of the effect parame-ters are presented in the form of relative risks.
C. VARIABLES
Our main variables of interest are current policy period and gender relations of the first parental union. Our policy period vari-able represents a partitioning of calendar time. It is defined in consideration of major policy changes in the field of family disso-lution. For Sweden, we distinguish between the following 3 periods: (i) 1964-73 when divorce was possible both on fault and no-fault grounds; (ii) 1974-mid-83 when the divorce law reform eliminated all fault grounds and divorce procedures were short-ened and simplified; and, (iii) mid-1983-93 when joint custody for children after the parents’ separation became the general rule. We distinguish between three policy periods for Hungary too, although the changes were less radical than in Sweden. No-fault divorce was permitted already in the first period, which goes from 1964 to 1973. An even more liberal divorce law characterised the second period from 1974 to mid-87, while in the period from mid-1987 to 1993 a more restrictive law made divorce procedures more complicated.
For a measure of gender relations
within the union we use the information in the Swedish data on whether the father took parental leave for the first child. For Hun-gary we use an index of gender-role atti-tudes based on questions regarding rela-tionship and career. We assume that both father’s use of parental leave and having an egalitarian gender-role attitude signal less traditional gender relations within the un-ion; we study the effects of this factor on family stability.
Human capital variables are the
second group of interest in this study, as they can reveal gender differences in the pattern of union dissolution risks given the differences between men's and women’s
parenting and labour force activities. Current educational attainment is our vari-able referring to the level of schooling the respondent had up to any month, while current employment status shows his or her labour market attachment at any month af-ter the first birth.
Further, we control for factors that
have been found to greatly affect family disruption in previous studies. We divide these variables into the following groups:
Individual characteristics: Some of
these refer to the respondents’ childhood experiences such as the composition of the family of origin and the number of siblings, while others relate to features such as the respondents’ own birth cohort (not dis-cussed in this chapter) and religious activity level.
Maturity at family formation: The
factor age at first birth grouped according to educational level at first birth shows the respondents’ own maturity at the time they become parents. Our variable first-birth interval, on the other hand, reflects the ma-turity of the respondents and their partners as a couple at the birth of their first child. It is based on the interval between the start of the union and the first birth.
Union-specific characteristics: This
group provides us with important additional information on the partnership such as the order of the union in which the respon-dents’ first child was born, the marital status, the number of children in the house-hold, and the current age of the youngest child.
Business-cycle variations: These
are measured with country-specific factors, namely, the current national unemployment rate for Sweden and changes in the con-sumer price index (for food products) for Hungary, because unemployment in this country was not registered until the late 1980s. Both measures inform us in terms of upward and downward business-cycles about the macro-economic situation of the country in question.
76 FERTILITY AND PARTNERSHIP IN EUROPE
We use a stepwise approach for the model fitting. First, we include only the individual characteristics. Next, we add our second group of control variables, which reflect maturity at family formation. Then, we include the rest of the control variables as well as our human capital variables. The stepwise introduction of these factors into the model corresponds to the sequence in which they appear in the respondents’ life. This in turn determines their causal prox-imity to the current life situation of the re-spondents. This procedure also allows us to exclude those control variables that do not have a significant direct impact on the dis-ruption of the first parental union. Thus, in the last step when we add our explanatory variables of real interest, only the important control variables are kept in the model.
D. FINDINGS
1. Sweden
In our discussion of the findings (Table 5.1) we follow the steps of the model fitting de-scribed above. Religious activity level has a stronger impact on union disruption for mothers than for fathers, but the patterns are very similar (Model 1). As usual, those who are religiously active have a much lower risk of family dissolution than other individuals. With the inclusion of marital status in Model 2, the effect of religiosity disappears. This means that religiosity has no direct impact on family stability in the secularised Swedish society, only an indi-rect effect which works through marital status.
The family of one’s childhood is a very important determinant of family stabil-ity in Sweden. The disruption risk patterns are all alike for men and women (Models 1, 2 and 3). That is, individuals whose parents divorced before their 16th birthday have nearly twice as high a risk of seeing their own family dissolved as those whose par-ents stayed together at least that long. Thus, we have evidence of an intergenerational transmission of divorce, also for Sweden (see McLanahan and Bumpass, 1988, and Amato, 1996, for the US; Kiernan and Cherlin, 1999, for the UK; Diefenbach,
1997, for Germany). The risk of disruption is also very high for individuals from other non-intact families.
The number of siblings (results not
presented here) has no influence on family disruption behaviour for either men or women. This suggests that those from small families are not more individualistic, i.e. less capable of compromise in family life, than individuals from larger families.
The age at first birth (conditional on educational level at first birth) is impor-tant for family stability. For both mothers and fathers we find that those who start family formation at younger ages have a much higher risk of union disruption than later starters (Models 1, 2 and 3). This is in line with previous findings reported in the literature regarding an early start of union formation (see Morgan and Rindfuss, 1985, and Castro Martín and Bumpass, 1989, for the US; Berrington and Diamond, 1999, for the UK; Hoem and Hoem, 1992, for Swe-den; Finnäs, 1996, for Finland).
For the first-birth interval variable we find that partners who mature together for at least three years as a couple before they become parents have a longer union duration thereafter (Models 1, 2, and 3).
The rank order of the union in which the first child was born (first-birth union order) has also a significant impact on family stability for both men and women. Individuals who had their first child in their second or higher-order union have more than 1.5 times as high a risk of family dissolution than those who become parents in their first union (Models 2 and 3). This may be a selection effect, in the sense that persons who have already broken with one or more previous partners are more prone to do so again, even if this time they have children.
Marital status, which is a time-
varying covariate along with the rest of the control variables presented below, is an-other factor of great importance for family stability in Sweden. Living in a consensual
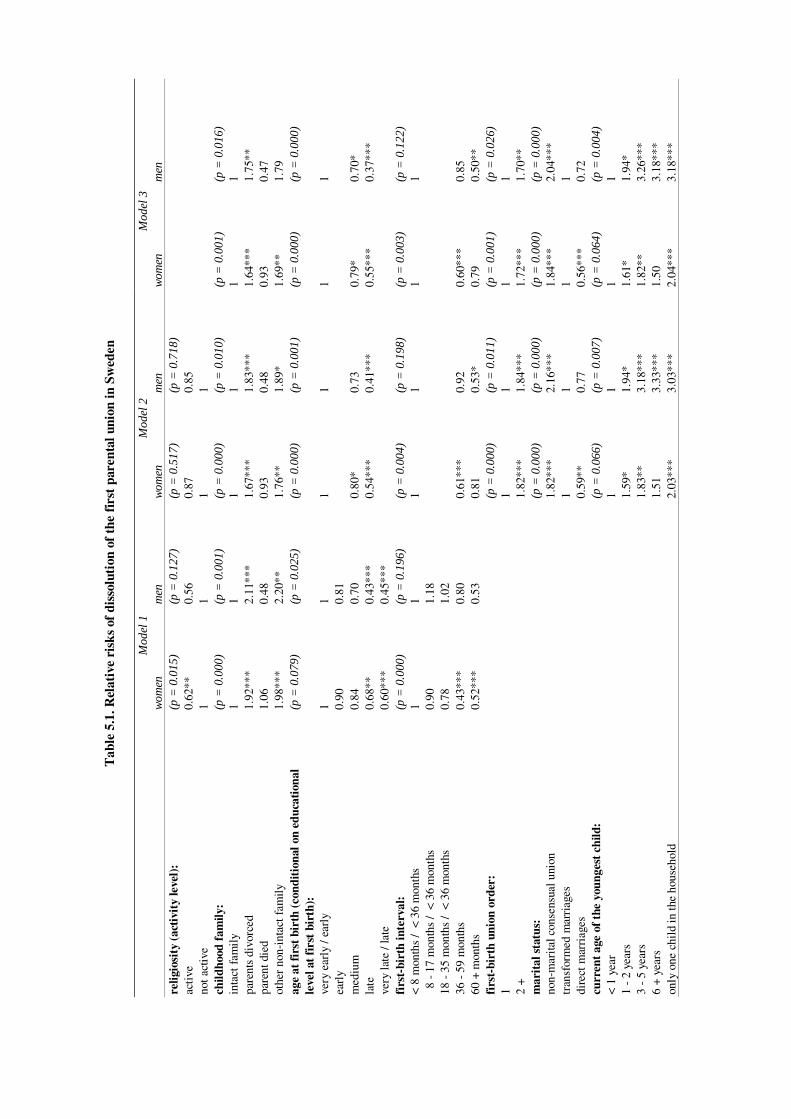
Tab
le 5
.1. R
elat
ive
risk
s of
dis
solu
tion
of
the
firs
t pa
rent
al u
nion
in S
wed
en
Mod
el 1
Mod
el 2
Mod
el 3
wom
en
men
w
omen
m
en
wom
en
men
re
ligio
sity
(ac
tivi
ty le
vel)
: (p
= 0
.015
) (p
= 0
.127
) (p
= 0
.517
) (p
= 0
.718
)
ac
tive
0.
62**
0.
56
0.87
0.
85
not a
ctiv
e 1
1 1
1
ch
ildho
od f
amily
: (p
= 0
.000
) (p
= 0
.001
) (p
= 0
.000
) (p
= 0
.010
) (p
= 0
.001
) (p
= 0
.016
) in
tact
fam
ily
1 1
1 1
1 1
pare
nts
divo
rced
1.
92**
* 2.
11**
* 1.
67**
* 1.
83**
* 1.
64**
* 1.
75**
pa
rent
die
d 1.
06
0.48
0.
93
0.48
0.
93
0.47
ot
her
non-
inta
ct f
amily
1.
98**
* 2.
20**
1.
76**
1.
89*
1.69
**
1.79
ag
e at
fir
st b
irth
(co
ndit
iona
l on
educ
atio
nal
leve
l at
firs
t bi
rth)
: (p
= 0
.079
) (p
= 0
.025
) (p
= 0
.000
) (p
= 0
.001
) (p
= 0
.000
) (p
= 0
.000
)
very
ear
ly /
earl
y 1
1 1
1 1
1 ea
rly
0.
90
0.81
m
ediu
m
0.84
0.
70
0.80
* 0.
73
0.79
* 0.
70*
late
0.
68**
0.
43**
* 0.
54**
* 0.
41**
* 0.
55**
* 0.
37**
* ve
ry la
te /
late
0.
60**
* 0.
45**
*
fi
rst-
birt
h in
terv
al:
(p =
0.0
00)
(p =
0.1
96)
(p =
0.0
04)
(p =
0.1
98)
(p =
0.0
03)
(p =
0.1
22)
< 8
mon
ths
/ <
36 m
onth
s 1
1 1
1 1
1 8
- 1
7 m
onth
s /
< 36
mon
ths
0.90
1.
18
18 -
35
mon
ths
/ <
36 m
onth
s 0.
78
1.02
36
- 5
9 m
onth
s 0.
43**
* 0.
80
0.61
***
0.92
0.
60**
* 0.
85
60 +
mon
ths
0.52
***
0.53
0.
81
0.53
* 0.
79
0.50
**
firs
t-bi
rth
unio
n or
der:
(p
= 0
.000
) (p
= 0
.011
) (p
= 0
.001
) (p
= 0
.026
) 1
1 1
1 1
2 +
1.82
***
1.84
***
1.72
***
1.70
**
mar
ital
sta
tus:
(p
= 0
.000
) (p
= 0
.000
) (p
= 0
.000
) (p
= 0
.000
) no
n-m
arita
l con
sens
ual u
nion
1.
82**
* 2.
16**
* 1.
84**
* 2.
04**
* tr
ansf
orm
ed m
arri
ages
1
1 1
1 di
rect
mar
riag
es
0.59
**
0.77
0.
56**
* 0.
72
curr
ent
age
of t
he y
oung
est
child
:
(p
= 0
.066
) (p
= 0
.007
) (p
= 0
.064
) (p
= 0
.004
) <
1 ye
ar
1 1
1 1
1 -
2 ye
ars
1.59
* 1.
94*
1.61
* 1.
94*
3 -
5 ye
ars
1.83
**
3.18
***
1.82
**
3.26
***
6 +
year
s
1.
51
3.33
***
1.50
3.
18**
* on
ly o
ne c
hild
in th
e ho
useh
old
2.03
***
3.03
***
2.04
***
3.18
***
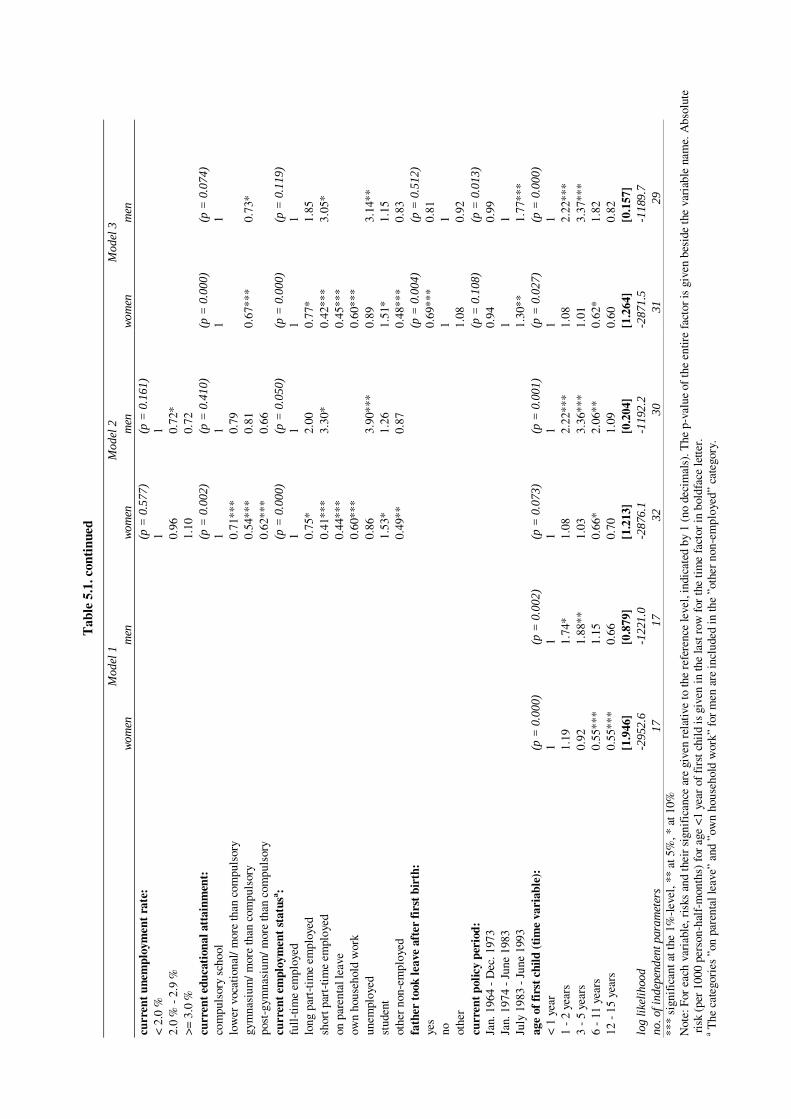
Tab
le 5
.1. c
onti
nued
Mod
el 1
Mod
el 2
Mod
el 3
wom
en
men
w
omen
m
en
wom
en
men
cu
rren
t un
empl
oym
ent
rate
:
(p
= 0
.577
) (p
= 0
.161
)
<
2.0
%
1 1
2.0
% -
2.9
%
0.96
0.
72*
>= 3
.0 %
1.
10
0.72
cu
rren
t ed
ucat
iona
l att
ainm
ent:
(p
= 0
.002
) (p
= 0
.410
) (p
= 0
.000
) (p
= 0
.074
) co
mpu
lsor
y sc
hool
1
1 1
1 lo
wer
voc
atio
nal/
mor
e th
an c
ompu
lsor
y
0.
71**
* 0.
79
gym
nasi
um/ m
ore
than
com
puls
ory
0.54
***
0.81
0.
67**
* 0.
73*
post
-gym
nasi
um/ m
ore
than
com
puls
ory
0.62
***
0.66
cu
rren
t em
ploy
men
t st
atus
a :
(p
= 0
.000
) (p
= 0
.050
) (p
= 0
.000
) (p
= 0
.119
) fu
ll-t
ime
empl
oyed
1
1 1
1 lo
ng p
art-
tim
e em
ploy
ed
0.75
* 2.
00
0.77
* 1.
85
shor
t par
t-tim
e em
ploy
ed
0.41
***
3.30
* 0.
42**
* 3.
05*
on p
aren
tal l
eave
0.
44**
*
0.45
***
ow
n ho
useh
old
wor
k
0.
60**
*
0.60
***
un
empl
oyed
0.
86
3.90
***
0.89
3.
14**
st
uden
t
1.
53*
1.26
1.
51*
1.15
ot
her
non-
empl
oyed
0.
49**
0.
87
0.48
***
0.83
fa
ther
too
k le
ave
afte
r fi
rst
birt
h:
(p =
0.0
04)
(p =
0.5
12)
yes
0.69
***
0.81
no
1
1 ot
her
1.08
0.
92
curr
ent
polic
y pe
riod
:
(p
= 0
.108
) (p
= 0
.013
) Ja
n. 1
964
- D
ec. 1
973
0.94
0.
99
Jan.
197
4 -
June
198
3
1
1 Ju
ly 1
983
- Ju
ne 1
993
1.30
**
1.77
***
age
of f
irst
chi
ld (
tim
e va
riab
le):
(p
= 0
.000
) (p
= 0
.002
) (p
= 0
.073
) (p
= 0
.001
) (p
= 0
.027
) (p
= 0
.000
) <
1 ye
ar
1 1
1 1
1 1
1 -
2 ye
ars
1.19
1.
74*
1.08
2.
22**
* 1.
08
2.22
***
3 -
5 ye
ars
0.92
1.
88**
1.
03
3.36
***
1.01
3.
37**
* 6
- 11
yea
rs
0.55
***
1.15
0.
66*
2.06
**
0.62
* 1.
82
12 -
15
year
s 0.
55**
* 0.
66
0.70
1.
09
0.60
0.
82
[1
.946
] [0
.879
] [1
.213
] [0
.204
] [1
.264
] [0
.157
] lo
g li
keli
hood
-2
952.
6 -1
221.
0 -2
876.
1 -1
192.
2 -2
871.
5 -1
189.
7 no
. of i
ndep
ende
nt p
aram
eter
s
17
17
32
30
31
29
***
sign
ific
ant a
t the
1%
-lev
el, *
* at
5%
, * a
t 10%
N
ote:
For
eac
h va
riab
le, r
isks
and
thei
r si
gnif
ican
ce a
re g
iven
rel
ativ
e to
the
refe
renc
e le
vel,
indi
cate
d by
1 (
no d
ecim
als)
. The
p-v
alue
of
the
entir
e fa
ctor
is g
iven
bes
ide
the
vari
able
nam
e. A
bsol
ute
ris
k (p
er 1
000
pers
on-h
alf-
mon
ths)
for
age
<1
year
of
firs
t chi
ld is
giv
en in
the
last
row
for
the
tim
e fa
ctor
in b
oldf
ace
lette
r.
a The
cat
egor
ies
”on
pare
ntal
leav
e” a
nd ”
own
hous
ehol
d w
ork”
for
men
are
incl
uded
in th
e ”o
ther
non
-em
ploy
ed”
cate
gory
.
DISRUPTION OF THE FIRST ‘PARENTAL UNION’ 79
union strongly increases the risk of family dissolution for both men and women. Di-rect marriages are the most stable relation-ships, while marriages resulting from con-sensual unions occupy an intermediary po-sition (Models 2 and 3). This is also in line with findings of previous studies (see Lil-lard et al., 1995, for the US; Berrington and Diamond, 1999, for the UK; Bennett et al., 1988, for Sweden; Finnäs, 1996, for Fin-land).
Current age of the youngest child is
our variable controlling for the effect of age of the youngest child, if there is more than one child in the family. Otherwise, it in-forms us that there is only one child, with the effect of the age of this child being measured by the time variable: age of first child (see below). We know from previous analysis that having one child only is linked to a much higher dissolution risk than hav-ing two or more children. Here we see for both men and women that the protective effect of having another child in the family works only as long as this child is very young. With children above age three the risk of family dissolution is nearly the same as for one-child families (Models 2 and 3).
The current unemployment rate had
hardly any influence on family break-up, probably because unemployment levels were rather low in Sweden during the pe-riod covered by our data. The macro-economic situation had very little effect on mothers’ family dissolution intensity. For fathers, however, we see that the risk of family disruption is somewhat lower in times of higher unemployment rates (Model 2).
Regarding current educational at-
tainment, the disruption risk patterns are rather similar for men and women. Those who have only compulsory education have the least stable families (Models 2 and 3). There are no significant differences in fam-ily break-up patterns among the other edu-cational levels. What we see here is thus probably a selection effect for those with the least education. Alternatively, it may reflect a weaker labour market and/or lower income position that can create serious con-
flicts in the relationship and in the long run lead to a family break-up.
Our other human capital variable,
current employment status, is also impor-tant for family stability, especially among women. As expected we find clear gender differences in the disruption risk patterns (Models 2 and 3). Mothers who work or study full-time have the highest risk of un-ion dissolution, while fathers who pursue similar strategies have the most stable fami-lies. Short- or part-time employed and un-employed fathers have a very high risk for family break-up, but the disruption intensi-ties of mothers in such positions are rather low. Housewives, mothers on parental leave and other non-employed mothers have the lowest disruption risks. Although these findings seem to support Becker’s (1991) argument, the causality might work in a direction opposite to what he sug-gested. Perhaps women considering to leave their partner increase their labour market activities in order to reduce their economic dependence. Men who do not behave in line with the traditional gender role as main economic providers have ap-parently great difficulties to maintain their unions. Alternatively, this might be a selec-tion effect, in the sense that for some reason these men are less capable of both finding appropriate work and maintaining a good family life.
As for our main variables of inter-
est, we find that gender equality in the un-ion (in Sweden: father took leave after first birth) greatly affects family stability, at least for women (Model 3), although the patterns are similar for men. The risk of union disruption is lower if the father took parental leave for the first child. Thus, a more equal sharing of domestic responsi-bilities seems to strengthen the relation-ship.
Public policies (measured as cur-
rent policy period) also influence disruption behaviour, especially for men (Model 3). The risks of family dissolution are very similar in the first two policy periods. This suggests that the introduction of one of the most liberal divorce laws of the world had
80 FERTILITY AND PARTNERSHIP IN EUROPE relatively little effect on the stability of families. In the third period however, we see a much higher disruption risk for both men and women. It seems that the introduc-tion of joint custody for children after fam-ily dissolution as a main rule has facilitated union disruption for parents, by giving them better chances to remain an active parent even if the children do not live with them permanently after the family break-up.
The age of the first child, i.e. our
time variable, also affects parents’ disrup-tion behaviour (Model 3). While we see hardly any changes in family dissolution risks with children below six years of age in the female sample, the male sample shows steeply increasing disruption intensi-ties from the first child’s infancy to its pre-school years, which thereafter decrease. When the first child becomes teenager, the risk of family break-up is the same again as during its first year of life, or even lower. Apparently, by that time, the remaining unions in the risk set probably consist of those that were quite stable to begin with.
2. Hungary
As we followed the same procedure for model fitting in the case of Hungary (Table 5.2), we again discuss first the risk profile for the individual characteristics. Religious activity level has a strong impact on family disruption for Hungarian women, but less so for men. The patterns are nevertheless similar. Those who are religiously active have much lower dissolution risks than oth-ers. In contrast to the Swedish results, this effect remains statistically significant even after adding all other control variables (Models 1, 2 and 3). Thus, religiously ac-tive individuals seem to represent a distinct group in Hungary with respect to family disruption behaviour.
The family of one’s childhood
seems to influence women more strongly than men, but the patterns are again similar (Model 1). Individuals whose parents di-vorced before their 16th birthday have much higher disruption risk than those coming from intact families. Women who were
brought up in other non-intact families have - as adults - the least stable families of all. However, as we include marital status (Model 2), the influence of childhood fam-ily becomes weaker, remaining statistically significant only for women coming from other non-intact families. This suggests that daughters of divorced parents probably live in consensual unions more often than in other types of unions and thus, when we control for the type of the union, the influ-ence of parental divorce disappears.
The number of siblings has no im-
pact on women’s family stability, but it af-fects that of men. Hungarian fathers who have siblings have about half of the risk to dissolve their unions then men without sib-ling (Models 1, 2 and 3). Men in the latter category seem to have fewer skills of solv-ing problems that arise in a union, or they may be less sensitive to the needs of other family members. Interestingly, we found no such pattern for Sweden. This might be ex-plained by the fact that the Hungarian soci-ety is more traditional than the Swedish, especially with respect to gender roles within the family. Only sons in Hungary are treated differently by their parents than only daughters. For example, daughters are usually required to actively participate in domestic work, whereas sons are not. When there are at least two children in the family of origin, even sons learn to pay attention to others and to co-operate in order to pre-serve harmony in the family.
The age at first birth (conditional
on educational level at first birth) has a strong effect on women’s risks of family disruption but less so on men’s (Models 1, 2 and 3). Yet, the patterns are quite similar and resemble those found for Sweden. That is, those who start family formation at very young ages have a much higher risk of un-ion dissolution than later starters.
Unlike in Sweden, the first-birth in-
terval (Model 1) has little impact on family stability in Hungary, for both man and women. This may be explained by the fact that in Hungary the dating period before marriage or non-marital cohabitation is
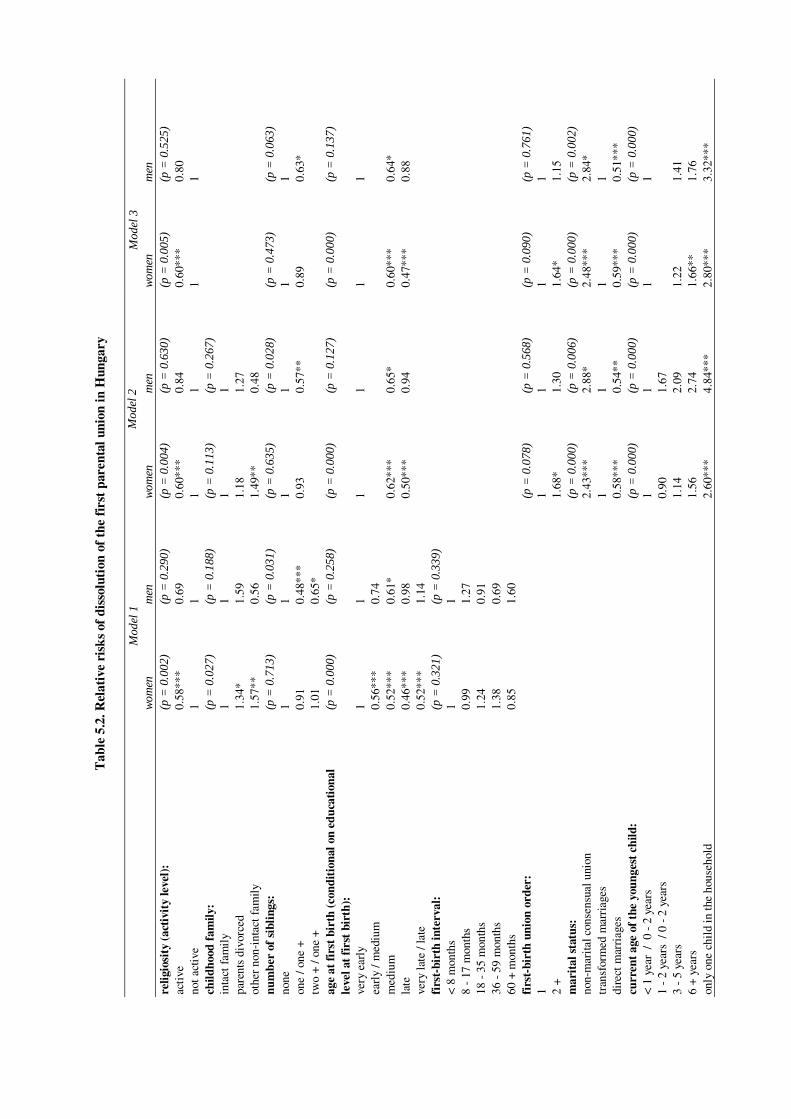
T
able
5.2
. Rel
ativ
e ri
sks
of d
isso
luti
on o
f th
e fi
rst
pare
ntal
uni
on in
Hun
gary
M
odel
1
M
odel
2
M
odel
3
w
omen
m
en
wom
en
men
w
omen
m
en
relig
iosi
ty (
acti
vity
leve
l):
(p =
0.0
02)
(p =
0.2
90)
(p =
0.0
04)
(p =
0.6
30)
(p =
0.0
05)
(p =
0.5
25)
acti
ve
0.58
***
0.69
0.
60**
* 0.
84
0.60
***
0.80
no
t act
ive
1 1
1 1
1 1
child
hood
fam
ily:
(p =
0.0
27)
(p =
0.1
88)
(p =
0.1
13)
(p =
0.2
67)
inta
ct f
amil
y 1
1 1
1
pa
rent
s di
vorc
ed
1.34
* 1.
59
1.18
1.
27
othe
r no
n-in
tact
fam
ily
1.57
**
0.56
1.
49**
0.
48
num
ber
of s
ibli
ngs:
(p
= 0
.713
) (p
= 0
.031
) (p
= 0
.635
) (p
= 0
.028
) (p
= 0
.473
) (p
= 0
.063
) no
ne
1 1
1 1
1 1
one
/ one
+
0.91
0.
48**
* 0.
93
0.57
**
0.89
0.
63*
two
+ / o
ne +
1.
01
0.65
*
ag
e at
fir
st b
irth
(co
ndit
iona
l on
educ
atio
nal
leve
l at
firs
t bi
rth)
: (p
= 0
.000
) (p
= 0
.258
) (p
= 0
.000
) (p
= 0
.127
) (p
= 0
.000
) (p
= 0
.137
)
very
ear
ly
1 1
1 1
1 1
earl
y / m
ediu
m
0.56
***
0.74
m
ediu
m
0.52
***
0.61
* 0.
62**
* 0.
65*
0.60
***
0.64
* la
te
0.46
***
0.98
0.
50**
* 0.
94
0.47
***
0.88
ve
ry la
te /
late
0.
52**
* 1.
14
firs
t-bi
rth
inte
rval
: (p
= 0
.321
) (p
= 0
.339
)
<
8 m
onth
s 1
1
8
- 17
mon
ths
0.99
1.
27
18 -
35
mon
ths
1.24
0.
91
36 -
59
mon
ths
1.38
0.
69
60 +
mon
ths
0.85
1.
60
firs
t-bi
rth
unio
n or
der:
(p
= 0
.078
) (p
= 0
.568
) (p
= 0
.090
) (p
= 0
.761
) 1
1 1
1 1
2 +
1.68
* 1.
30
1.64
* 1.
15
mar
ital
sta
tus:
(p
= 0
.000
) (p
= 0
.006
) (p
= 0
.000
) (p
= 0
.002
) no
n-m
arita
l con
sens
ual u
nion
2.
43**
* 2.
88*
2.48
***
2.84
* tr
ansf
orm
ed m
arri
ages
1
1 1
1 di
rect
mar
riag
es
0.58
***
0.54
**
0.59
***
0.51
***
curr
ent
age
of t
he y
oung
est
child
:
(p
= 0
.000
) (p
= 0
.000
) (p
= 0
.000
) (p
= 0
.000
) <
1 ye
ar /
0 -
2 y
ears
1
1 1
1 1
- 2
year
s /
0 - 2
yea
rs
0.90
1.
67
3 -
5 ye
ars
1.14
2.
09
1.22
1.
41
6 +
year
s
1.
56
2.74
1.
66**
1.
76
only
one
chi
ld in
the
hous
ehol
d
2.
60**
* 4.
84**
* 2.
80**
* 3.
32**
*
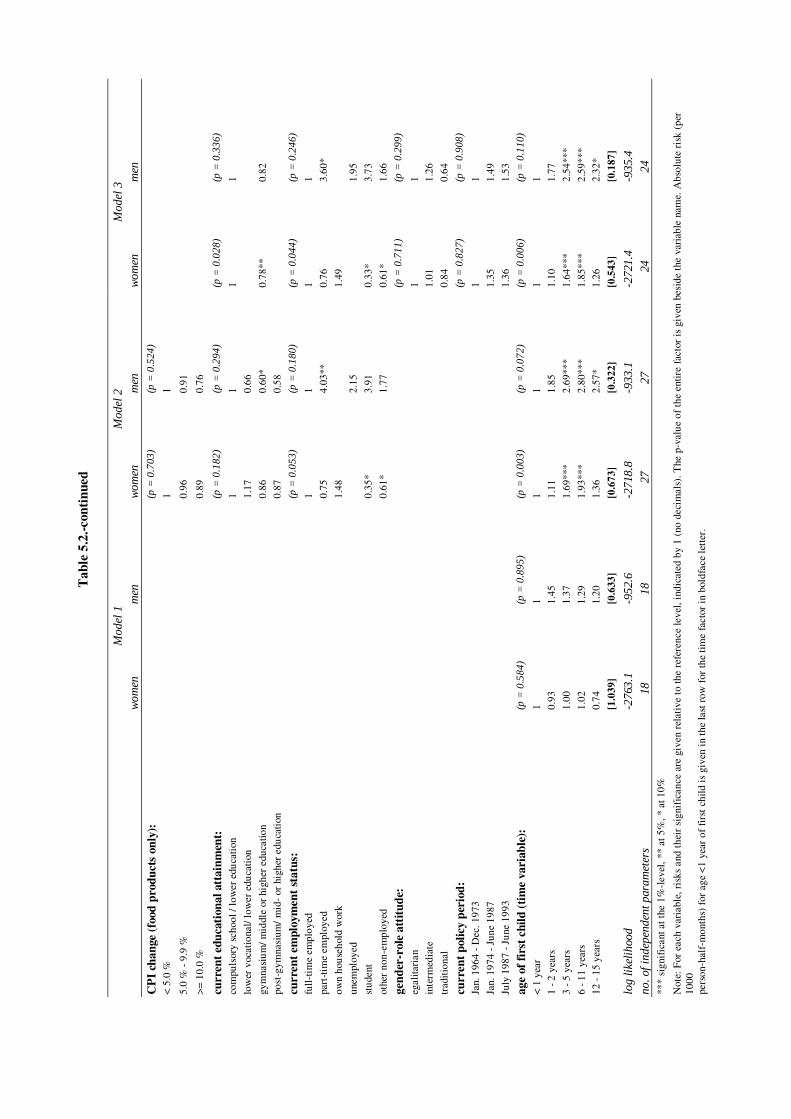
Tab
le 5
.2.-c
onti
nued
Mod
el 1
Mod
el 2
Mod
el 3
wom
en
men
w
omen
m
en
wom
en
men
CP
I ch
ange
(fo
od p
rodu
cts
only
):
(p =
0.7
03)
(p =
0.5
24)
< 5
.0 %
1
1
5.
0 %
- 9
.9 %
0.
96
0.91
>
= 1
0.0
%
0.89
0.
76
curr
ent
educ
atio
nal a
ttai
nmen
t:
(p =
0.1
82)
(p =
0.2
94)
(p =
0.0
28)
(p =
0.3
36)
com
puls
ory
scho
ol /
low
er e
duca
tion
1
1 1
1
low
er v
ocat
iona
l/ lo
wer
edu
cati
on
1.17
0.
66
gym
nasi
um/ m
iddl
e or
hig
her
educ
atio
n
0.86
0.
60*
0.78
**
0.82
po
st-g
ymna
sium
/ m
id-
or h
ighe
r ed
ucat
ion
0.87
0.
58
curr
ent
empl
oym
ent
stat
us:
(p =
0.0
53)
(p =
0.1
80)
(p =
0.0
44)
(p =
0.2
46)
full
-tim
e em
ploy
ed
1 1
1 1
part
-tim
e em
ploy
ed
0.75
4.
03**
0.
76
3.60
*
own
hous
ehol
d w
ork
1.48
1.49
unem
ploy
ed
2.
15
1.
95
stud
ent
0.35
* 3.
91
0.33
* 3.
73
othe
r no
n-em
ploy
ed
0.61
* 1.
77
0.61
* 1.
66
gend
er-r
ole
atti
tude
:
(p
= 0
.711
) (p
= 0
.299
)
egal
itari
an
1 1
inte
rmed
iate
1.
01
1.26
trad
itio
nal
0.84
0.
64
curr
ent
polic
y pe
riod
:
(p
= 0
.827
) (p
= 0
.908
)
Jan.
196
4 -
Dec
. 197
3
1
1
Jan.
197
4 -
June
198
7
1.
35
1.49
July
198
7 - J
une
1993
1.
36
1.53
age
of f
irst
chi
ld (
tim
e va
riab
le):
(p
= 0
.584
) (p
= 0
.895
) (p
= 0
.003
) (p
= 0
.072
) (p
= 0
.006
) (p
= 0
.110
)
< 1
yea
r 1
1 1
1 1
1 1
- 2 y
ears
0.
93
1.45
1.
11
1.85
1.
10
1.77
3 - 5
yea
rs
1.00
1.
37
1.69
***
2.69
***
1.64
***
2.54
***
6 - 1
1 ye
ars
1.02
1.
29
1.93
***
2.80
***
1.85
***
2.59
***
12 -
15 y
ears
0.
74
1.20
1.
36
2.57
* 1.
26
2.32
*
[1
.039
] [0
.633
] [0
.673
] [0
.322
] [0
.543
] [0
.187
]
log
like
liho
od
-276
3.1
-952
.6
-271
8.8
-933
.1
-272
1.4
-935
.4
no. o
f ind
epen
dent
par
amet
ers
1
8
18
2
7
27
2
4
24
***
sign
ific
ant a
t the
1%
-lev
el, *
* at
5%
, * a
t 10%
Not
e: F
or e
ach
vari
able
, ris
ks a
nd t
heir
sig
nifi
canc
e ar
e gi
ven
rela
tive
to
the
refe
renc
e le
vel,
indi
cate
d by
1 (
no d
ecim
als)
. The
p-v
alue
of
the
entir
e fa
ctor
is
give
n be
side
the
var
iabl
e na
me.
Abs
olut
e ri
sk (
per
1000
pe
rson
-hal
f-m
onth
s) f
or a
ge <
1 ye
ar o
f fi
rst
child
is g
iven
in th
e la
st r
ow f
or th
e ti
me
fact
or in
bol
dfac
e le
tter
.
DISRUPTION OF THE FIRST ‘PARENTAL UNION’ 83
longer. Because of the housing shortage, Hungarian couples often had to search for a long time to find a dwelling for themselves. Even among married couples, the majority started their conjugal life in the home of one of their parents (Kamarás, 1999). As parental consent may be a prerequisite for young couples to life together, the partners also had more time to get to know each other before moving in.
The rank order of the union in
which the first child was born (first-birth union order) has little influence on Hungar-ian men’s family disruption behaviour, but it affects that of women. Nevertheless, the patterns are similar for both (Models 2 and 3): those who have their first child in a first co-residential relationship have more stable unions than others. This was also the case in Sweden.
As usual, marital status is a very in-
fluential variable with respect to family stability, for both men and women (Models 2 and 3). The patterns resemble the findings for Sweden. Parents who live in consensual unions have a very high disruption risk, whereas direct marriages are the most sta-ble. Marriages which started as consensual unions occupy an intermediary position.
The current age of the youngest
child is also an important indicator of fam-ily stability in both countries. When there are at least two children in the family, the risk of family disruption increases with the age of the youngest child. Unlike in Swe-den, however, the dissolution risk for such families in Hungary remains well below that of one-child families, even when the children grow older (Models 2 and 3).
Changes in the consumer price in-
dex for food products (CPI change) - as a proxy for macro-economic developments - had no influence on family dissolution in Hungary (Model 2). As our data cover mostly the period of state socialism, we can conclude that the relatively stable macro-economic situation of that time made fam-ily disruption decisions less sensitive to macro-economic changes.
As regards current educational at-tainment we see that those with less than gymnasium have a higher disruption risk (Models 2 and 3), although this effect is stronger for women. This suggests either a selection effect for those with lower educa-tion or it relates, like in Sweden, to their poorer economic situation.
The current employment status is,
again, more important for women’s family disruption risks than for men’s (Models 2 and 3). Like in Sweden, the dissolution risk pattern is strongly gender-specific. Students and other non-employed mothers have the lowest risk to disrupt their unions, whereas there are no significant differences among the other categories. For men, only part-time workers have significantly different dissolution risks, which are three times as high as for those who are employed full-time. The findings for women might indi-cate - in line with Becker’s argument - that those with less resources have more stable families because of their greater economic dependence on their partners. However, the fact that the dissolution risks for house-wives are not significantly different from those for full-time workers suggests that women’s increased economic independence is not really the reason for the decline in family stability in Hungary. The high disso-lution risk of part-time working men is probably a selection effect. It can also re-flect the difficulties that men face who do not live up to the traditional ‘good pro-vider’ role in their relationships.
In contrast to the Swedish findings,
our main variables of interest seem to have relatively little influence on family disrup-tion behaviour of both men and women in Hungary. As most Hungarian families fol-low the traditional gender division of la-bour in the home, we find no significant differences in dissolution risks among par-ents with different gender-role attitudes (Model 3).
Also changes in divorce legislation
- either in a more liberal or in a more re-strictive direction – as measured by the cur-rent policy period variable had very little
84 FERTILITY AND PARTNERSHIP IN EUROPE impact on family dissolution risks of par-ents in Hungary (Model 3).
Finally, we find a somewhat differ-
ent disruption risk profile for the age of the first child (our time variable) than in the Swedish case (Model 3). As the first child grows older, the risks of family dissolution increase for both Hungarian mothers and fathers and they hardly decline, even in the teenage years of the child.
E. DISCUSSION
In this chapter we have examined the rela-tionship between increasing instability of families with children, changing gender relations and policy changes in Sweden and Hungary. Concerning the latter, we found very little impact of changes in divorce leg-islation on first parental union dissolution in both countries. Although changes in di-vorce laws have in principle relevance for married couples only, in the analysis we decided to include also unmarried couples. In times of radically increasing divorce in-dices, like in the 1970s in Sweden (Anders-son, 1997), we would have expected a bandwagon or contagion effect for cohabit-ing couples, which in Sweden is a relatively large group but not so in Hungary. We have seen, however, that parents in any type of unions were hardly affected by divorce law reforms. Yet, as the Swedish results dem-onstrate, child custody rules seem to be im-portant for first parental union dissolution.
As for gender relations within the
union, we found for Sweden that the dis-ruption risk is much lower when the tasks of economic sustenance and active parent-ing are more equally shared between the partners. The lack of effect of this variable for Hungarian parents might be explained through the ambivalence of equally shared economic responsibilities, on the one hand, but unequally shared domestic tasks, on the other. This general pattern results for Hun-garian women in a double burden. Gender-role attitudes are then of secondary impor-tance.
Furthermore, we found as expected
clear gender differences in the patterns of
family dissolution risks for both countries. They emerged for current employment status in both countries, and for the number of siblings in Hungary only. Apparently, labour market strategies are still gendered to some extent, even in countries like Swe-den and Hungary where the dual-earner family model is well established.
Based on our findings in this study,
we conclude that (i) changes in gender rela-tions affect family stability; and (ii) we should study both men and women if we wish to deepen our understanding of family dissolution behaviour. This need arises be-cause patterns of union disruption risks are gender-specific, at least when it comes to labour force strategies.
REFERENCES Amato, P. R. (1996). Explaining the intergenerational
transmission of divorce, Journal of Marriage and the Family, Vol. 58 (3): 628-640.
Andersson, G. (1997). The impact of chil-dren on divorce risks of Swedish women. European Journal of Population, Vol. 13 (2): 109-145.
Becker, G. S. (1991). A Treatise on the Family. Cambridge, Massachusetts: Harvard University Press
Bennett, N. G., Blanc, A. K., and Bloom, D. E. (1988). Commitment and the modern union: as-sessing the link between premarital cohabitation and subsequent marital stability. American Socio-logical Review, Vol. 53 (1): 127-138.
Berrington, A. and Diamond, I. (1999). Marital disso-lution among the 1958 British birth cohort: The role of cohabitation. Population Studies, Vol. 53 (1): 19-38.
Castro Martín, T. and Bumpass, L. L. (1989). Recent trends in marital disruption, Demography, Vol. 26 (1): 37-51.
Diefenbach, H. (1997). Intergenerationale Scheidungstransmission in Deutschland: Rele-vanz und Erklärungsansätze [Intergenerational transfer of divorce in Germany. Relevance and explanations], Zeitschrift für Rechtssoziologie, Vol. 18 (1): 88-105.
Finnäs, F. (1996). Separations among Finnnish women born between 1938-1967, Yearbook of Population Research in Finland, Vol. 33: 21-33.
Goode, W. J. (1993). World Changes in Divorce Patterns, New Haven, London: Yale Univesity Press.
Granström, F. (1997). Fertility and Family Surveys in Countries of the ECE Region. Standard Country Report. Sweden. Economic Studies 10b. New York and Geneva: United Nations.
Hoem, B. and Hoem, J. M. (1992). The disruption of marital and non-marital unions in contemporary Sweden. In: Trussell, J. et al. (Eds.) Demographic
DISRUPTION OF THE FIRST ‘PARENTAL UNION’ 85
Applications of Event History Analysis. Oxford: Clarendon Press, 61-93.
Kamarás, F. (1999). Fertility and Family Surveys in Countries of the ECE Region. Standard Country Report. Hungary. Economic Studies 10j. New York and Geneva: United Nations.
Kiernan, K. E. and Cherlin, A. J. (1999). Parental divorce and partnership dissolution in adulthood: Evidence from a British cohort study. Population Studies, Vol. 53 (1): 39-48.
McLanahan, S. and Bumpass, L. (1988). Intergenera-tional consequences of family disruption. Ameri-can Journal of Sociology, Vol. 94 (1): 130-152.
Lillard, L. A., Brien, M. J. and Waite, L. J. (1995). Premarital cohabitation and subsequent marital dissolution: A matter of self-selection? Demog-raphy, Vol. 32 (3): 437-457.
Morgan, S. P. and Rindfuss, R. R. (1985). Marital disruption: Structural and temporal dimensions, American Journal of Sociology, Vol. 90 (5): 1055-1077.
ENDNOTES i I am indebted to Eva M. Bernhardt and Jan M. Hoem for their valuable suggestions during the work on this paper. Help from András Klinger and Ferenc Kamarás regarding detailed information on the Hungarian Family Survey is also highly appreciated. I thank Statistics Sweden and Statistics Hungary for providing access to their Family Sur-veys, and the Demography Unit at Stockholm University for permission to work with the Swedish data set. The Swedish Council for Social Research provided economic support to the Demography Unit for data management and processing (Grant 93-0204:3A). Financial support from the Demography Unit is gratefully acknowledged.
87
CHAPTER 6
CHILDBEARING IN STEPFAMILIES: HOW PARITY MATTERSi
Elizabeth Thomson 1 Jan M. Hoem, Andres Vikat, Alexia Prskawetz 2
Isabella Buber 3 Laurent Toulemon 4
Ursula Henz 5 Amy L. Godecker 1
Vladimira Kantorova 4
1 Department of Sociology and Center for Demography and Ecology, University of Wisconsin-Madison, Madison
(USA) 2 Max Planck Institute for Demographic Research, Rostock (Germany) 3 Institut für Demographie, Österreichische Akademie der Wissenschaften, Vienna (Austria) 4 Institut national de la statistique et des études économiques, Paris (France) 5 London School of Economics, London (United Kingdom)
A. THEORY AND EVIDENCE ON CHILDBEARING IN STEPFAMILIES
Dramatic changes in marriage, divorce and non-marital cohabitation during the second half of the 20th century have radically altered the context of childbearing decisions. Many, if not most, young adults can expect to form more than one intimate partnership during their lifetime (e.g., Bumpass et al., 1991; Haskey, 1993). The number of children they will have will be increasingly determined by reproductive decisions in a series of non-marital and marital unions. And more and more couples will be making childbearing decisions in the context of the partners’ differing parities.
These changes have implications for demographic models of fertility and for sociological theories of parenthood. Parity progressions are the keystone of fertility analysis (e.g., Feeney and Lutz, 1991). Standard fertility models specify parity progressions entirely in terms of women’s
births, and do not distinguish births with prior partners from those with current ones. If men’s pre-union children or the parenthood of a particular child influence couples’ fertility decisions, parity effects must be respecified. From a sociological point of view, childbearing decisions by couples with stepchildren reflect and may alter ties between stepparents and stepchildren, and between parents and their non-resident children (Seltzer, 1991; Booth and Dunn, 1994).
Three key values of children
underlie potential differences in parity progressions among couples with pre-union children and those without (Griffith et al., 1985): 1) children are symbols of the partners’ commitment to their relationship; 2) the first child confers parental status; and 3) the second child ensures that each has a sibling. These values associated with a first or second child are particularly important for understanding fertility variation and change in low-fertility societies (Fawcett, 1983).
88 FERTILITY AND PARTNERSHIP IN EUROPE
The value of a shared child to signify commitment should be the same for couples who do have pre-union children and those who do not. Parental status value, on the other hand, should be lower in stepfamilies because at least one of the partners is already a parent. Because parenthood has been viewed as more essential to women’s than to men’s adult identities (Fawcett, 1983), the parental status value of a couple’s first shared child might be greater when the woman rather than the man is childless. In stepfamilies, the first shared child may also be viewed as producing sibling value for pre-union children. The value of a full sibling – a second shared child – may be greater, however, due to a larger proportion of shared genetic characteristics or to the typically smaller age difference between full siblings.
Each of the values of a particular child must, of course, be weighed against the economic, social and psychological costs of a couple’s total number of children. When one of the partners has pre-union children, the value of a first shared birth must be weighed against the costs of rearing two or more children, the value of a second shared birth against the costs of rearing three or more children, and so on. The question for our research is whether the costs of larger family sizes associated with childbearing in stepfamilies outweigh the commitment, parental status, or sibling value of one or two shared children.
Until recently, almost all the evidence on childbearing in stepfamilies was based on women’s pre-union children, marital unions, and USA data. Most studies reported that the more children a woman had when she remarried, the lower her risk of childbearing in remarriage (e.g., Bumpass, 1984; Lillard and Waite, 1993). Some analyses included data on men’s previous unions or children as well, with similar or mixed results (e.g., Griffith et al., 1985; Haurin, 1992; O’Keefe, 1988). Two recent studies including non-married cohabiting couples also found effects of pre-union children on their shared childbearing (Loomis and Landale, 1996;
Stewart, 2000). When no effects of pre-union children are found on births to couples, we can infer that some additional value is provided to stepfamily couples, because they are making higher-order parity progressions with higher costs than couples without stepchildren. But we cannot be sure that lower birth rates in stepfamilies are not simply a result of their higher combined parityii.
Several recent studies provide more
specific tests of the extra value provided by shared versus stepchildren. Thomson’s (1997) analyses of panel data from the USA showed that childbearing intentions and risks were elevated when couples had no shared children and/or when the woman had no children. These results are consistent with the commitment and parental status values of first births, at least in terms of motherhood. Thomson’s analyses, however, did not show stronger intentions or higher birth risks for a second shared child if older half siblings were present.
Analyses of French data also
showed that pre-union children lowered childbearing intentions and birth risks (Toulemon and Lapierre-Adamcyk, 1995; Toulemon, 1997), except when the man had pre-union children in which case the risk of a first union birth increased. Neither of these analyses, however, specified the number of pre-union children belonging to the man only, to the woman only, or to the couple together.
Vikat et al. (1999) found that in
Sweden the risk of a first birth in a union did not depend on the number of children that the respondent had before the union. Furthermore, the risk of a higher-order birth was greater if it was the first in a new union. Both findings support the commitment value of a first shared birth. Unfortunately, the Swedish data do not include full information on partners’ children; one only knows if one or more stepchildren lived with the respondent at the time of union formation.
CHILDBEARING IN STEPFAMILIES 89
Buber and Fürnkranz-Prskawetz (2000) found that stepfamily couples in Austria only had lower first-birth rates than other couples if one or the other partner had two or more pre-union children. That is, at low parities the commitment value of a first shared birth may increase birth risks, but the cost of higher total parities eventually overcomes that value. Their analysis is limited to respondents in second unions, i.e., it does not include respondents who had children prior to a first union or who formed their first union with a partner who already had children.
None of these studies specified parity effects in a way to directly test hypotheses about the three values of first and second births - union commitment, parental status, and sibling relationships. Other differences in model specification also limit direct comparisons between them. In this chapter we conduct a more extensive and precise test of stepchildren effects on fertility derived from values of step- and own children. We bring together FFS data from Austria, Finland, France, and West Germany. These countries allow for a comparison of childbearing in societies with varying degrees of social support for childrearing and gender equality that may condition the effects of stepchildren on childbearing in subsequent unions.
B. DATA AND METHODS
All of the countries studied in this analysis have experienced decreases in marriage, increases in non-marital cohabitation, non-marital fertility, and divorce over the period covered by the retrospective union and birth histories (Haskey, 1993), although with some variation in the degree or timing of these changes. They are also broadly representative of variations in systems of social insurance that support parenthood and/or gender equality, in cultural beliefs about gender, and in the extent of the institutionalisation of non-marital cohabitation as an alternative to marriage (Bosveld, 1996; Orloff, 1996).
Finland represents the group of Scandinavian countries with high social provisions for childrearing and support of gender equality (Rönsen and Sundström, 1997). Finland has increasing divorce and non-marital cohabitation rates, but non-union births remain rare (Prinz, 1995; Nikander, 1998).
West Germany, on the other hand,
provides an anchor on the conservative side of the demographic and policy continuum. Although transfers to parents are quite generous, childcare is limited in comparison to other European countries, and the organization of the school day makes it very difficult to combine employment and parenthood (Höhn, 1991). For this reason, West Germany has relatively low female employment rates - especially among mothers of young children - compared to other wealthy countries. Marriage rates are relatively high, while non-marital cohabitation and non-marital births are quite low (Prinz, 1995).iii
In terms of policy and demographic behaviour, France falls generally in the middle of the Nordic countries and Germany. It is sometimes classified with the former, sometimes with the latter, and sometimes in a separate category with, for example, Austria (Bosveld, 1996). The French welfare regime has long been focused on pronatalist concerns, but not on gender equality (as in Finland). Transfers to parents are generous, and childcare is relatively well subsidised for toddlers but not for infants (Toulemon and de Guibert-Lantoine, 1998). Non-marital cohabitation and union dissolution rates are similar to those in Finland, and non-union births are equally quite low.
Finally, Austria provides very generous supports for childrearing and also reasonably good childcare during the first two years prior to children’s school entry (Findl, 1991). Non-marital cohabitation and union dissolution rates are similar to those in Finland and France. What stands out for Austria are its high rates of non-union
90 FERTILITY AND PARTNERSHIP IN EUROPE
births, which are similar to those for the USA (Prinz, 1995).
Each FFS in these countries obtained complete birth and union histories from the respondents. Comparing respondents’ union start and end dates to children’s birth dates can therefore identify pre-union children. Critical for our analysis is that the union histories also include information on the number of children each partner already had at the time of the unioniv.
Our specification for the risk of a birth at time t in the union can be written as:
hb(t) = hb0(t) exp{ƴ ’ p(t)+ψ ’ x(t)}, where hb(t) is the birth risk at time t, p(t) is the couple’s parity specified in ways to provide for tests of hypotheses linked to the three values of first and second births, and x(t) is a vector containing a set of other variables that characterise the woman, the man, or their partnership. As is suggested by their notation, p(t) and x(t) may change over time.
In order to test hypotheses about the value of a first or second shared birth, we compare couples making the same combined parity (hers+his+theirs) progression but who have different numbers of shared children (theirs). We therefore take as our unit of analysis the union-birth interval and exclude the first birth interval for unions that begin without stepchildren. (Because all stepfamilies have combined parity one or more, couples with combined parity zero are irrelevant to the hypotheses to be tested.) To estimate the risk of conception leading to a live birth, we subtract nine months from the date of each child’s birth and assign the child to a union based on its conception date. Thus, a birth interval may begin with a union (for the first birth to stepfamily couples) or with a birth within a union (all other intervals). Observations are censored when a union dissolves or the respondent reaches the age at which childbearing is unlikely (45 for women, 50 for men). We also censor at
nine months prior to the respondent’s interview, ignoring information on pregnancies reported at the interview that may or may not result in live births. We further exclude observations after a multiple birth, reasoning that two or more children born at the same time have a different meaning for parents than the same number born at different times. Finally, we limit the sample to native-born respondents because immigrants may have experienced most or all of their unions and births under different social welfare and gender regimes.
Births occurring outside of unions are not included in the hazard models, but they are included in the time-varying counts of the respondent’s or partner’s children. Children born no more than 12 months prior to union formation are assumed to be of the couple, unless the respondent reported a prior union at the time of conception. In such cases, we treat the couple as having one shared child at union formation, and specify the next birth interval as beginning at union formation. Couples in which the woman was pregnant at the time of union formation (i.e., she had a child less than nine months after union formation) are treated in a similar fashion, with the subsequent birth interval beginning when the child is born (see also Heuveline and Timberlake, this Volume).
C. RESULTS
The FFS differed quite a bit across the four countries in terms of sample design, age range and non-response. In Finland, samples of individuals were drawn from population registers; the other three countries here examined relied on stratified household samples, with 1 respondent per household. In general, larger numbers of females than males were targeted. Age ranges varied also, but they all centred on the reproductive years of women. Response rates were - to varying degrees - well above 70 per cent (see also Festy and Prioux, Volume I).
Table 6.1 shows the number and
age ranges of respondents contributing to our analysis (native-born respondents having
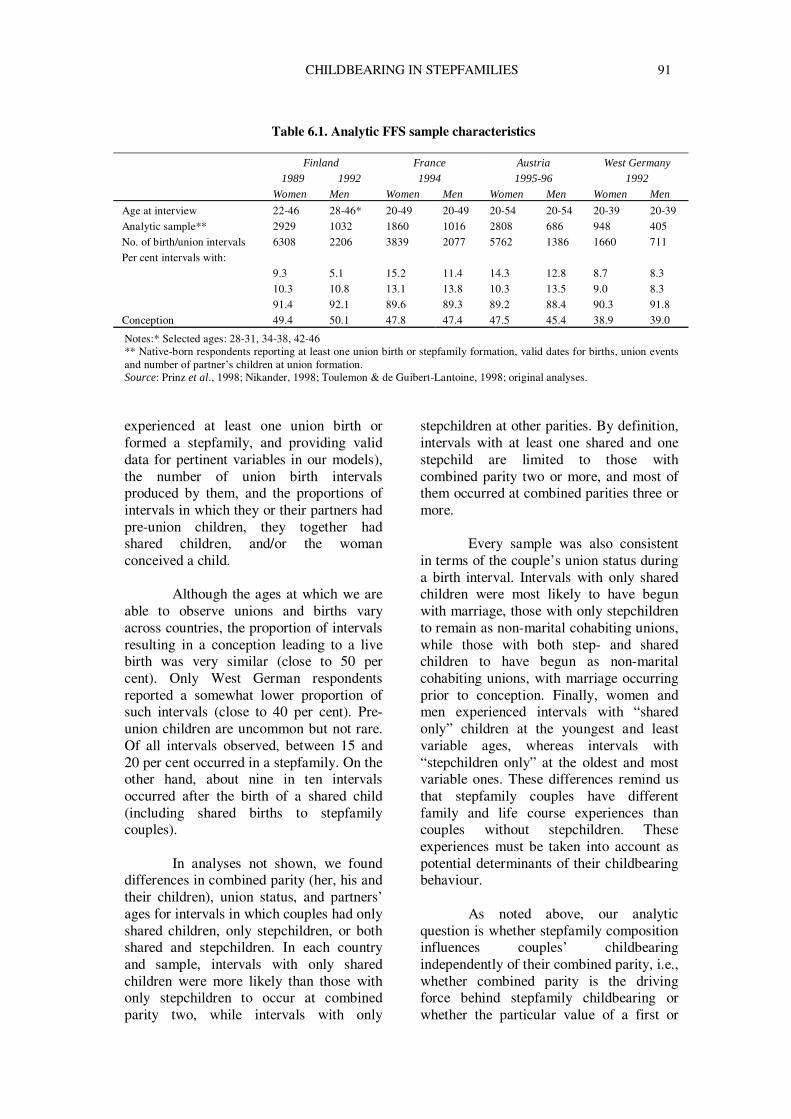
CHILDBEARING IN STEPFAMILIES 91
Table 6.1. Analytic FFS sample characteristics
Finland
1989 1992
France
1994
Austria
1995-96
West Germany
1992
Women Men Women Men Women Men Women Men
Age at interview 22-46 28-46* 20-49 20-49 20-54 20-54 20-39 20-39
Analytic sample** 2929 1032 1860 1016 2808 686 948 405
No. of birth/union intervals 6308 2206 3839 2077 5762 1386 1660 711
Per cent intervals with:
9.3 5.1 15.2 11.4 14.3 12.8 8.7 8.3
10.3 10.8 13.1 13.8 10.3 13.5 9.0 8.3
91.4 92.1 89.6 89.3 89.2 88.4 90.3 91.8
Conception 49.4 50.1 47.8 47.4 47.5 45.4 38.9 39.0
Notes:* Selected ages: 28-31, 34-38, 42-46 ** Native-born respondents reporting at least one union birth or stepfamily formation, valid dates for births, union events and number of partner’s children at union formation. Source: Prinz et al., 1998; Nikander, 1998; Toulemon & de Guibert-Lantoine, 1998; original analyses.
experienced at least one union birth or formed a stepfamily, and providing valid data for pertinent variables in our models), the number of union birth intervals produced by them, and the proportions of intervals in which they or their partners had pre-union children, they together had shared children, and/or the woman conceived a child.
Although the ages at which we are able to observe unions and births vary across countries, the proportion of intervals resulting in a conception leading to a live birth was very similar (close to 50 per cent). Only West German respondents reported a somewhat lower proportion of such intervals (close to 40 per cent). Pre-union children are uncommon but not rare. Of all intervals observed, between 15 and 20 per cent occurred in a stepfamily. On the other hand, about nine in ten intervals occurred after the birth of a shared child (including shared births to stepfamily couples).
In analyses not shown, we found differences in combined parity (her, his and their children), union status, and partners’ ages for intervals in which couples had only shared children, only stepchildren, or both shared and stepchildren. In each country and sample, intervals with only shared children were more likely than those with only stepchildren to occur at combined parity two, while intervals with only
stepchildren at other parities. By definition, intervals with at least one shared and one stepchild are limited to those with combined parity two or more, and most of them occurred at combined parities three or more.
Every sample was also consistent in terms of the couple’s union status during a birth interval. Intervals with only shared children were most likely to have begun with marriage, those with only stepchildren to remain as non-marital cohabiting unions, while those with both step- and shared children to have begun as non-marital cohabiting unions, with marriage occurring prior to conception. Finally, women and men experienced intervals with “shared only” children at the youngest and least variable ages, whereas intervals with “stepchildren only” at the oldest and most variable ones. These differences remind us that stepfamily couples have different family and life course experiences than couples without stepchildren. These experiences must be taken into account as potential determinants of their childbearing behaviour.
As noted above, our analytic question is whether stepfamily composition influences couples’ childbearing independently of their combined parity, i.e., whether combined parity is the driving force behind stepfamily childbearing or whether the particular value of a first or
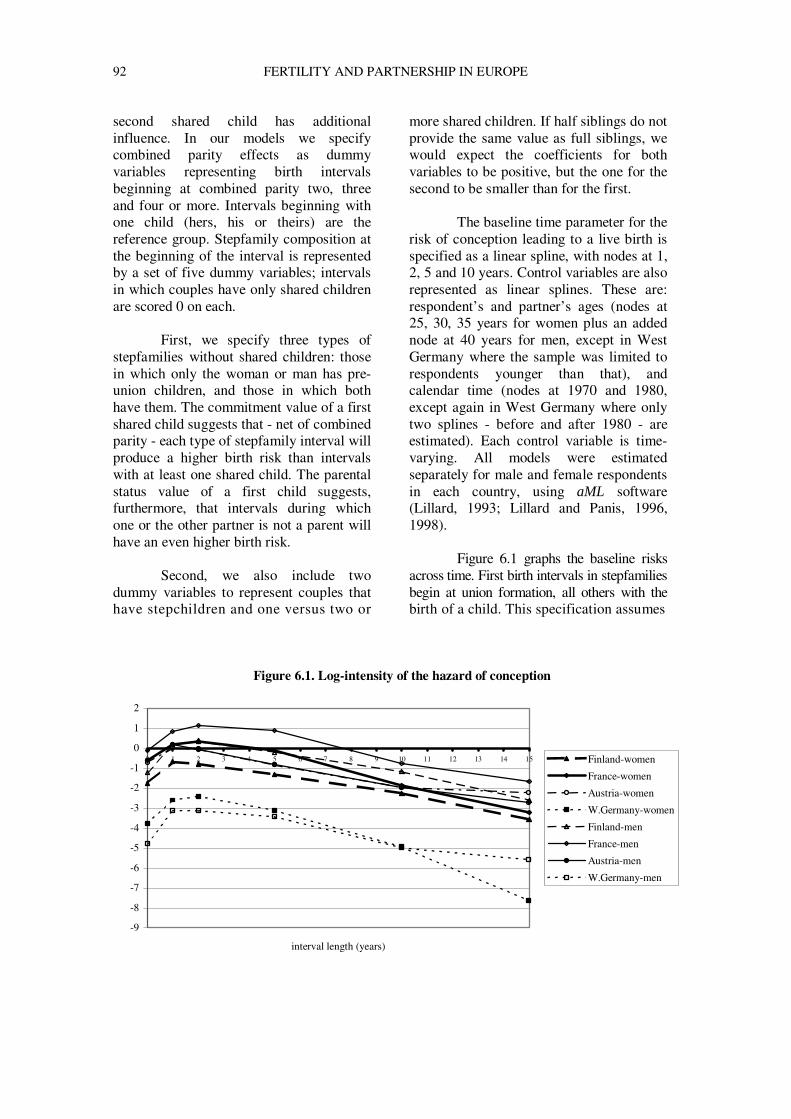
92 FERTILITY AND PARTNERSHIP IN EUROPE
second shared child has additional influence. In our models we specify combined parity effects as dummy variables representing birth intervals beginning at combined parity two, three and four or more. Intervals beginning with one child (hers, his or theirs) are the reference group. Stepfamily composition at the beginning of the interval is represented by a set of five dummy variables; intervals in which couples have only shared children are scored 0 on each.
First, we specify three types of
stepfamilies without shared children: those in which only the woman or man has pre-union children, and those in which both have them. The commitment value of a first shared child suggests that - net of combined parity - each type of stepfamily interval will produce a higher birth risk than intervals with at least one shared child. The parental status value of a first child suggests, furthermore, that intervals during which one or the other partner is not a parent will have an even higher birth risk.
Second, we also include two
dummy variables to represent couples that have stepchildren and one versus two or
more shared children. If half siblings do not provide the same value as full siblings, we would expect the coefficients for both variables to be positive, but the one for the second to be smaller than for the first.
The baseline time parameter for the risk of conception leading to a live birth is specified as a linear spline, with nodes at 1, 2, 5 and 10 years. Control variables are also represented as linear splines. These are: respondent’s and partner’s ages (nodes at 25, 30, 35 years for women plus an added node at 40 years for men, except in West Germany where the sample was limited to respondents younger than that), and calendar time (nodes at 1970 and 1980, except again in West Germany where only two splines - before and after 1980 - are estimated). Each control variable is time-varying. All models were estimated separately for male and female respondents in each country, using aML software (Lillard, 1993; Lillard and Panis, 1996, 1998).
Figure 6.1 graphs the baseline risks across time. First birth intervals in stepfamilies begin at union formation, all others with the birth of a child. This specification assumes
Figure 6.1. Log-intensity of the hazard of conception
-9
-8
-7
-6
-5
-4
-3
-2
-1
0
1
2
0 1 2 3 4 5 6 7 8 9 10 11 12 13 14 15
interval length (years)
Finland-women
France-women
Austria-women
W.Germany-women
Finland-men
France-men
Austria-men
W.Germany-men
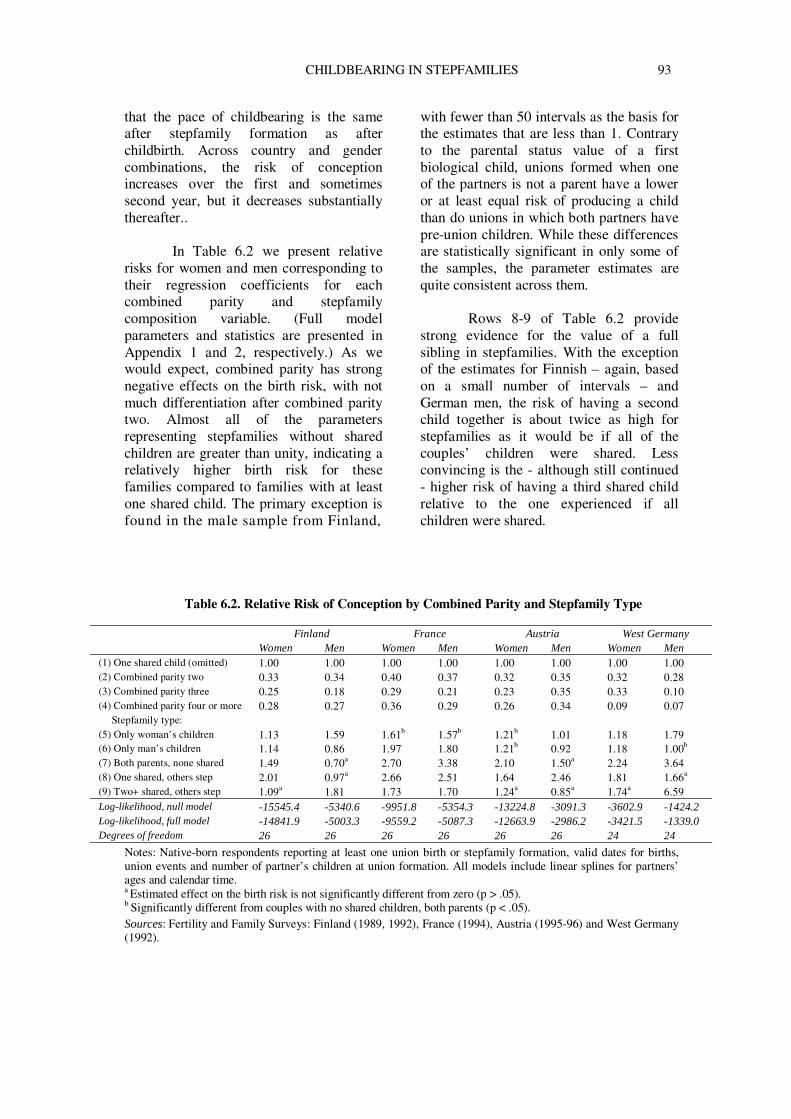
CHILDBEARING IN STEPFAMILIES 93
that the pace of childbearing is the same after stepfamily formation as after childbirth. Across country and gender combinations, the risk of conception increases over the first and sometimes second year, but it decreases substantially thereafter..
In Table 6.2 we present relative risks for women and men corresponding to their regression coefficients for each combined parity and stepfamily composition variable. (Full model parameters and statistics are presented in Appendix 1 and 2, respectively.) As we would expect, combined parity has strong negative effects on the birth risk, with not much differentiation after combined parity two. Almost all of the parameters representing stepfamilies without shared children are greater than unity, indicating a relatively higher birth risk for these families compared to families with at least one shared child. The primary exception is found in the male sample from Finland,
with fewer than 50 intervals as the basis for the estimates that are less than 1. Contrary to the parental status value of a first biological child, unions formed when one of the partners is not a parent have a lower or at least equal risk of producing a child than do unions in which both partners have pre-union children. While these differences are statistically significant in only some of the samples, the parameter estimates are quite consistent across them.
Rows 8-9 of Table 6.2 provide strong evidence for the value of a full sibling in stepfamilies. With the exception of the estimates for Finnish – again, based on a small number of intervals – and German men, the risk of having a second child together is about twice as high for stepfamilies as it would be if all of the couples’ children were shared. Less convincing is the - although still continued - higher risk of having a third shared child relative to the one experienced if all children were shared.
Table 6.2. Relative Risk of Conception by Combined Parity and Stepfamily Type
Finland France Austria West Germany Women Men Women Men Women Men Women Men (1) One shared child (omitted) 1.00 1.00 1.00 1.00 1.00 1.00 1.00 1.00 (2) Combined parity two 0.33 0.34 0.40 0.37 0.32 0.35 0.32 0.28 (3) Combined parity three 0.25 0.18 0.29 0.21 0.23 0.35 0.33 0.10 (4) Combined parity four or more 0.28 0.27 0.36 0.29 0.26 0.34 0.09 0.07 Stepfamily type: (5) Only woman’s children 1.13 1.59 1.61b 1.57b 1.21b 1.01 1.18 1.79 (6) Only man’s children 1.14 0.86 1.97 1.80 1.21b 0.92 1.18 1.00b (7) Both parents, none shared 1.49 0.70a 2.70 3.38 2.10 1.50a 2.24 3.64 (8) One shared, others step 2.01 0.97a 2.66 2.51 1.64 2.46 1.81 1.66a (9) Two+ shared, others step 1.09a 1.81 1.73 1.70 1.24a 0.85a 1.74a 6.59 Log-likelihood, null model -15545.4 -5340.6 -9951.8 -5354.3 -13224.8 -3091.3 -3602.9 -1424.2 Log-likelihood, full model -14841.9 -5003.3 -9559.2 -5087.3 -12663.9 -2986.2 -3421.5 -1339.0 Degrees of freedom 26 26 26 26 26 26 24 24
Notes: Native-born respondents reporting at least one union birth or stepfamily formation, valid dates for births, union events and number of partner’s children at union formation. All models include linear splines for partners’ ages and calendar time. a Estimated effect on the birth risk is not significantly different from zero (p > .05). b Significantly different from couples with no shared children, both parents (p < .05). Sources: Fertility and Family Surveys: Finland (1989, 1992), France (1994), Austria (1995-96) and West Germany (1992).
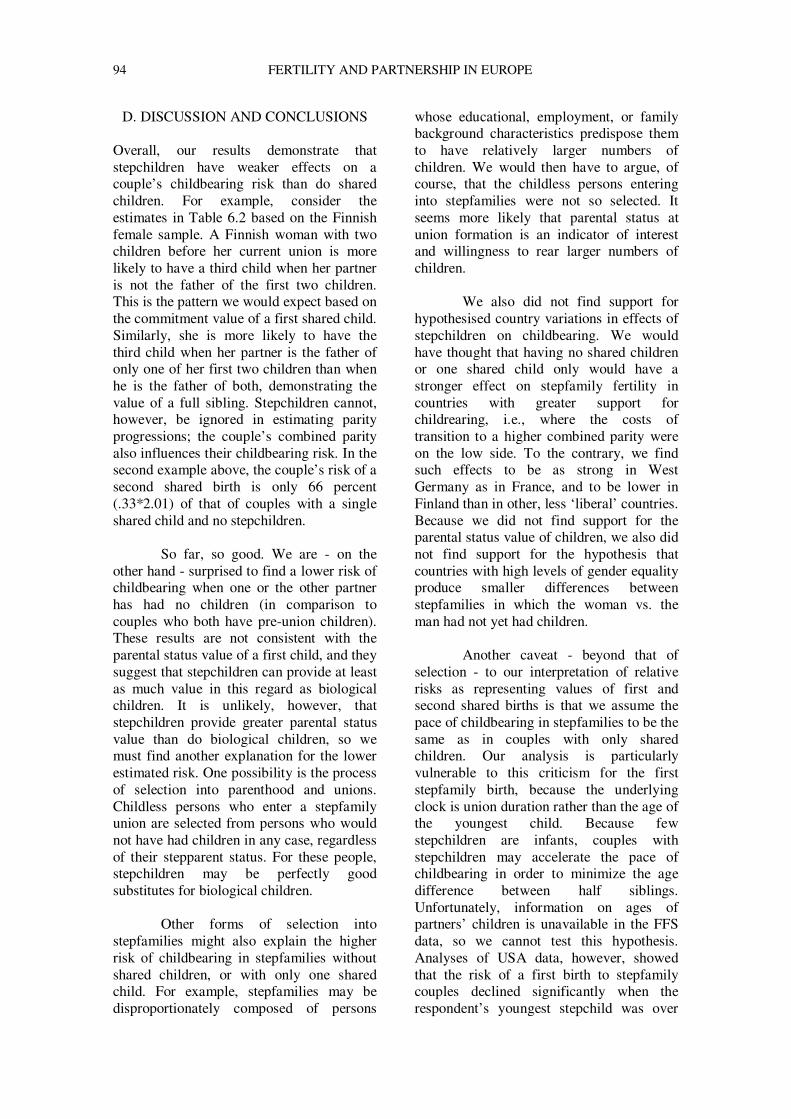
94 FERTILITY AND PARTNERSHIP IN EUROPE
D. DISCUSSION AND CONCLUSIONS Overall, our results demonstrate that stepchildren have weaker effects on a couple’s childbearing risk than do shared children. For example, consider the estimates in Table 6.2 based on the Finnish female sample. A Finnish woman with two children before her current union is more likely to have a third child when her partner is not the father of the first two children. This is the pattern we would expect based on the commitment value of a first shared child. Similarly, she is more likely to have the third child when her partner is the father of only one of her first two children than when he is the father of both, demonstrating the value of a full sibling. Stepchildren cannot, however, be ignored in estimating parity progressions; the couple’s combined parity also influences their childbearing risk. In the second example above, the couple’s risk of a second shared birth is only 66 percent (.33*2.01) of that of couples with a single shared child and no stepchildren.
So far, so good. We are - on the other hand - surprised to find a lower risk of childbearing when one or the other partner has had no children (in comparison to couples who both have pre-union children). These results are not consistent with the parental status value of a first child, and they suggest that stepchildren can provide at least as much value in this regard as biological children. It is unlikely, however, that stepchildren provide greater parental status value than do biological children, so we must find another explanation for the lower estimated risk. One possibility is the process of selection into parenthood and unions. Childless persons who enter a stepfamily union are selected from persons who would not have had children in any case, regardless of their stepparent status. For these people, stepchildren may be perfectly good substitutes for biological children.
Other forms of selection into stepfamilies might also explain the higher risk of childbearing in stepfamilies without shared children, or with only one shared child. For example, stepfamilies may be disproportionately composed of persons
whose educational, employment, or family background characteristics predispose them to have relatively larger numbers of children. We would then have to argue, of course, that the childless persons entering into stepfamilies were not so selected. It seems more likely that parental status at union formation is an indicator of interest and willingness to rear larger numbers of children.
We also did not find support for hypothesised country variations in effects of stepchildren on childbearing. We would have thought that having no shared children or one shared child only would have a stronger effect on stepfamily fertility in countries with greater support for childrearing, i.e., where the costs of transition to a higher combined parity were on the low side. To the contrary, we find such effects to be as strong in West Germany as in France, and to be lower in Finland than in other, less ‘liberal’ countries. Because we did not find support for the parental status value of children, we also did not find support for the hypothesis that countries with high levels of gender equality produce smaller differences between stepfamilies in which the woman vs. the man had not yet had children.
Another caveat - beyond that of selection - to our interpretation of relative risks as representing values of first and second shared births is that we assume the pace of childbearing in stepfamilies to be the same as in couples with only shared children. Our analysis is particularly vulnerable to this criticism for the first stepfamily birth, because the underlying clock is union duration rather than the age of the youngest child. Because few stepchildren are infants, couples with stepchildren may accelerate the pace of childbearing in order to minimize the age difference between half siblings. Unfortunately, information on ages of partners’ children is unavailable in the FFS data, so we cannot test this hypothesis. Analyses of USA data, however, showed that the risk of a first birth to stepfamily couples declined significantly when the respondent’s youngest stepchild was over
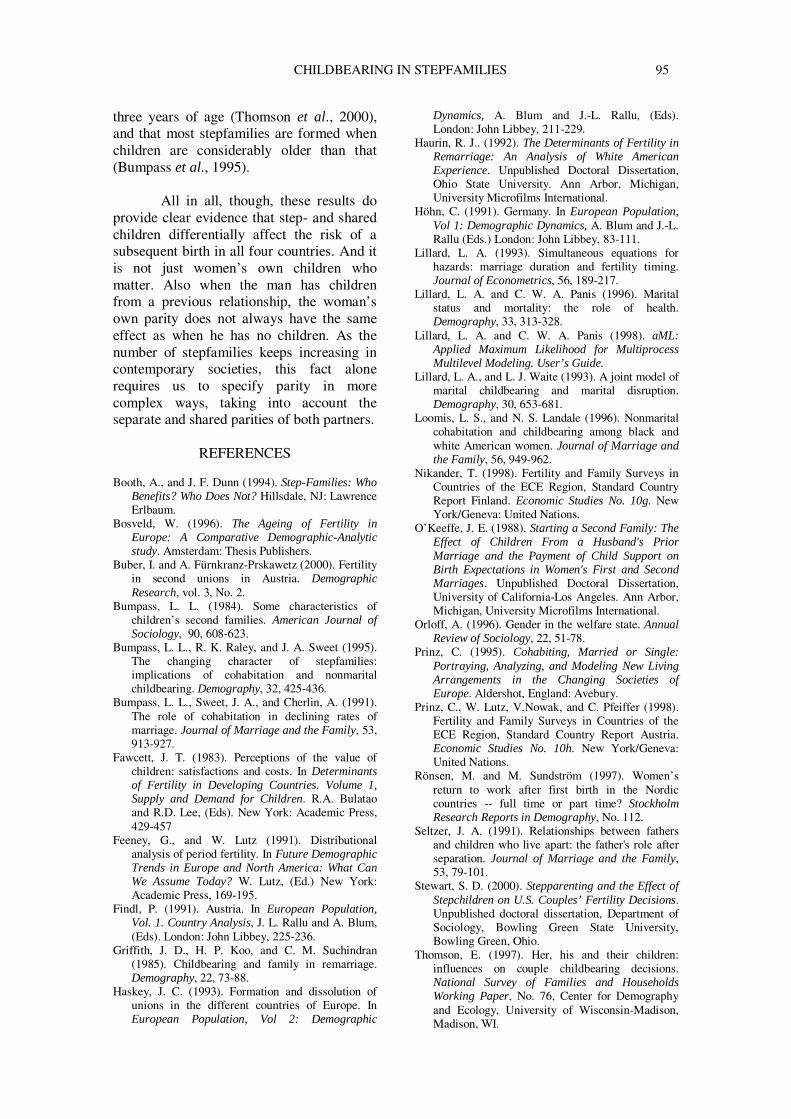
CHILDBEARING IN STEPFAMILIES 95
three years of age (Thomson et al., 2000), and that most stepfamilies are formed when children are considerably older than that (Bumpass et al., 1995).
All in all, though, these results do provide clear evidence that step- and shared children differentially affect the risk of a subsequent birth in all four countries. And it is not just women’s own children who matter. Also when the man has children from a previous relationship, the woman’s own parity does not always have the same effect as when he has no children. As the number of stepfamilies keeps increasing in contemporary societies, this fact alone requires us to specify parity in more complex ways, taking into account the separate and shared parities of both partners.
REFERENCES Booth, A., and J. F. Dunn (1994). Step-Families: Who
Benefits? Who Does Not? Hillsdale, NJ: Lawrence Erlbaum.
Bosveld, W. (1996). The Ageing of Fertility in Europe: A Comparative Demographic-Analytic study. Amsterdam: Thesis Publishers.
Buber, I. and A. Fürnkranz-Prskawetz (2000). Fertility in second unions in Austria. Demographic Research, vol. 3, No. 2.
Bumpass, L. L. (1984). Some characteristics of children’s second families. American Journal of Sociology, 90, 608-623.
Bumpass, L. L., R. K. Raley, and J. A. Sweet (1995). The changing character of stepfamilies: implications of cohabitation and nonmarital childbearing. Demography, 32, 425-436.
Bumpass, L. L., Sweet, J. A., and Cherlin, A. (1991). The role of cohabitation in declining rates of marriage. Journal of Marriage and the Family, 53, 913-927.
Fawcett, J. T. (1983). Perceptions of the value of children: satisfactions and costs. In Determinants of Fertility in Developing Countries. Volume 1, Supply and Demand for Children. R.A. Bulatao and R.D. Lee, (Eds). New York: Academic Press, 429-457
Feeney, G., and W. Lutz (1991). Distributional analysis of period fertility. In Future Demographic Trends in Europe and North America: What Can We Assume Today? W. Lutz, (Ed.) New York: Academic Press, 169-195.
Findl, P. (1991). Austria. In European Population, Vol. 1. Country Analysis, J. L. Rallu and A. Blum, (Eds). London: John Libbey, 225-236.
Griffith, J. D., H. P. Koo, and C. M. Suchindran (1985). Childbearing and family in remarriage. Demography, 22, 73-88.
Haskey, J. C. (1993). Formation and dissolution of unions in the different countries of Europe. In European Population, Vol 2: Demographic
Dynamics, A. Blum and J.-L. Rallu, (Eds). London: John Libbey, 211-229.
Haurin, R. J.. (1992). The Determinants of Fertility in Remarriage: An Analysis of White American Experience. Unpublished Doctoral Dissertation, Ohio State University. Ann Arbor, Michigan, University Microfilms International.
Höhn, C. (1991). Germany. In European Population, Vol 1: Demographic Dynamics, A. Blum and J.-L. Rallu (Eds.) London: John Libbey, 83-111.
Lillard, L. A. (1993). Simultaneous equations for hazards: marriage duration and fertility timing. Journal of Econometrics, 56, 189-217.
Lillard, L. A. and C. W. A. Panis (1996). Marital status and mortality: the role of health. Demography, 33, 313-328.
Lillard, L. A. and C. W. A. Panis (1998). aML: Applied Maximum Likelihood for Multiprocess Multilevel Modeling. User’s Guide.
Lillard, L. A., and L. J. Waite (1993). A joint model of marital childbearing and marital disruption. Demography, 30, 653-681.
Loomis, L. S., and N. S. Landale (1996). Nonmarital cohabitation and childbearing among black and white American women. Journal of Marriage and the Family, 56, 949-962.
Nikander, T. (1998). Fertility and Family Surveys in Countries of the ECE Region, Standard Country Report Finland. Economic Studies No. 10g. New York/Geneva: United Nations.
O’Keeffe, J. E. (1988). Starting a Second Family: The Effect of Children From a Husband's Prior Marriage and the Payment of Child Support on Birth Expectations in Women's First and Second Marriages. Unpublished Doctoral Dissertation, University of California-Los Angeles. Ann Arbor, Michigan, University Microfilms International.
Orloff, A. (1996). Gender in the welfare state. Annual Review of Sociology, 22, 51-78.
Prinz, C. (1995). Cohabiting, Married or Single: Portraying, Analyzing, and Modeling New Living Arrangements in the Changing Societies of Europe. Aldershot, England: Avebury.
Prinz, C., W. Lutz, V.Nowak, and C. Pfeiffer (1998). Fertility and Family Surveys in Countries of the ECE Region, Standard Country Report Austria. Economic Studies No. 10h. New York/Geneva: United Nations.
Rönsen, M. and M. Sundström (1997). Women’s return to work after first birth in the Nordic countries -- full time or part time? Stockholm Research Reports in Demography, No. 112.
Seltzer, J. A. (1991). Relationships between fathers and children who live apart: the father's role after separation. Journal of Marriage and the Family, 53, 79-101.
Stewart, S. D. (2000). Stepparenting and the Effect of Stepchildren on U.S. Couples’ Fertility Decisions. Unpublished doctoral dissertation, Department of Sociology, Bowling Green State University, Bowling Green, Ohio.
Thomson, E. (1997). Her, his and their children: influences on couple childbearing decisions. National Survey of Families and Households Working Paper, No. 76, Center for Demography and Ecology, University of Wisconsin-Madison, Madison, WI.

96 FERTILITY AND PARTNERSHIP IN EUROPE
Thomson, E., J. M. Hoem, and A. L. Godecker (2000). Partnership and parenthood: unobserved heterogeneity in stepfamily fertility. Paper presented at the annual meeting of the American Sociological Association, Washington, D.C. August 12-16.
Toulemon, L. (1997). The fertility of step-families: the impact of childbearing before the current union. Paper presented at the annual meeting of the Population Association of America, Washington, DC.
Toulemon, L., and C. de Guibert-Lantoine (1998). Fertility and Family Surveys in Countries of the
ECE Region, Standard Country Report France. Economic Studies No. 10e. New York/Geneva: United Nations.
Toulemon, L. and É. Lapierre-Adamcyk (1995). Demographic patterns of motherhood and fatherhood in France. Paper presented at the IUSSP Anthropology and Demography Committee Seminar on Fertility and the Male Life Cycle in the Era of Fertility Decline, Zacarecas, November.
Vikat, A., E. Thomson, and J. M. Hoem (1999). Stepfamily fertility in contemporary Sweden: the impact of childbearing before the current union. Population Studies 53, 211-225.
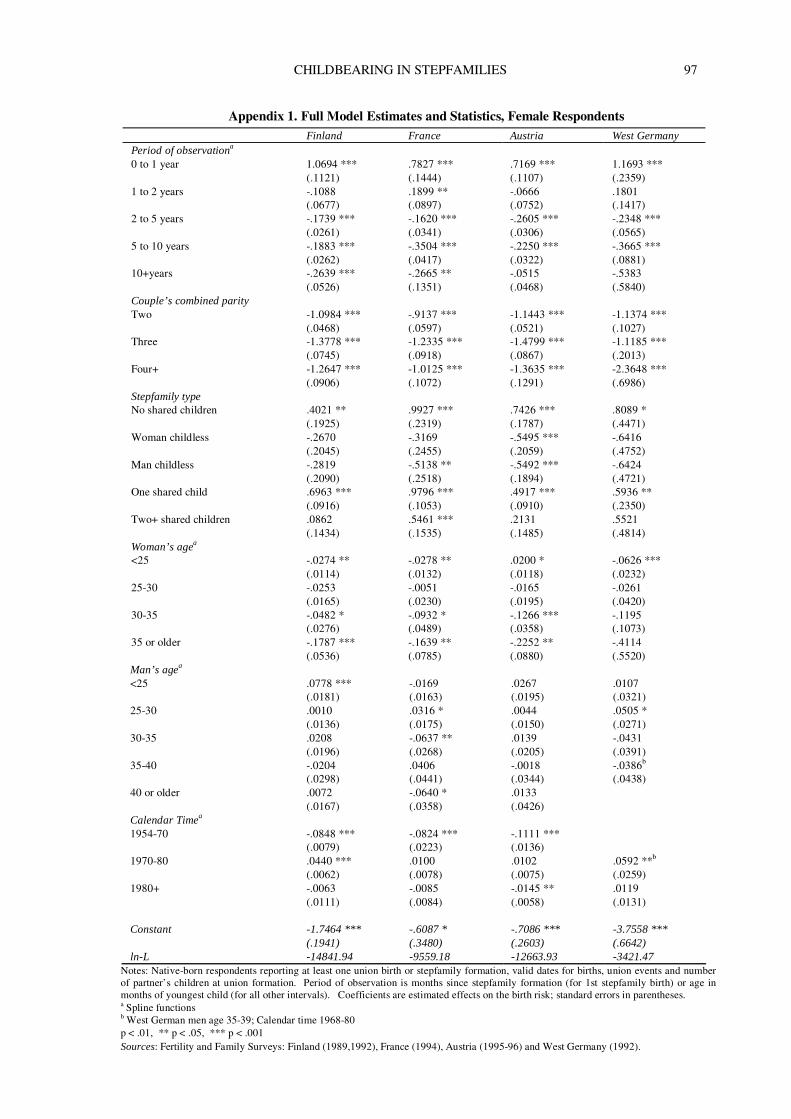
CHILDBEARING IN STEPFAMILIES 97
Appendix 1. Full Model Estimates and Statistics, Female Respondents Finland France Austria West Germany Period of observationa 0 to 1 year 1.0694 *** .7827 *** .7169 *** 1.1693 *** (.1121) (.1444) (.1107) (.2359) 1 to 2 years -.1088 .1899 ** -.0666 .1801 (.0677) (.0897) (.0752) (.1417) 2 to 5 years -.1739 *** -.1620 *** -.2605 *** -.2348 *** (.0261) (.0341) (.0306) (.0565) 5 to 10 years -.1883 *** -.3504 *** -.2250 *** -.3665 *** (.0262) (.0417) (.0322) (.0881) 10+years -.2639 *** -.2665 ** -.0515 -.5383 (.0526) (.1351) (.0468) (.5840) Couple’s combined parity Two -1.0984 *** -.9137 *** -1.1443 *** -1.1374 *** (.0468) (.0597) (.0521) (.1027) Three -1.3778 *** -1.2335 *** -1.4799 *** -1.1185 *** (.0745) (.0918) (.0867) (.2013) Four+ -1.2647 *** -1.0125 *** -1.3635 *** -2.3648 *** (.0906) (.1072) (.1291) (.6986) Stepfamily type No shared children .4021 ** .9927 *** .7426 *** .8089 * (.1925) (.2319) (.1787) (.4471) Woman childless -.2670 -.3169 -.5495 *** -.6416 (.2045) (.2455) (.2059) (.4752) Man childless -.2819 -.5138 ** -.5492 *** -.6424 (.2090) (.2518) (.1894) (.4721) One shared child .6963 *** .9796 *** .4917 *** .5936 ** (.0916) (.1053) (.0910) (.2350) Two+ shared children .0862 .5461 *** .2131 .5521 (.1434) (.1535) (.1485) (.4814) Woman’s agea <25 -.0274 ** -.0278 ** .0200 * -.0626 *** (.0114) (.0132) (.0118) (.0232) 25-30 -.0253 -.0051 -.0165 -.0261 (.0165) (.0230) (.0195) (.0420) 30-35 -.0482 * -.0932 * -.1266 *** -.1195 (.0276) (.0489) (.0358) (.1073) 35 or older -.1787 *** -.1639 ** -.2252 ** -.4114 (.0536) (.0785) (.0880) (.5520) Man’s agea <25 .0778 *** -.0169 .0267 .0107 (.0181) (.0163) (.0195) (.0321) 25-30 .0010 .0316 * .0044 .0505 * (.0136) (.0175) (.0150) (.0271) 30-35 .0208 -.0637 ** .0139 -.0431 (.0196) (.0268) (.0205) (.0391) 35-40 -.0204 .0406 -.0018 -.0386b (.0298) (.0441) (.0344) (.0438) 40 or older .0072 -.0640 * .0133 (.0167) (.0358) (.0426) Calendar Timea 1954-70 -.0848 *** -.0824 *** -.1111 *** (.0079) (.0223) (.0136) 1970-80 .0440 *** .0100 .0102 .0592 **b (.0062) (.0078) (.0075) (.0259) 1980+ -.0063 -.0085 -.0145 ** .0119 (.0111) (.0084) (.0058) (.0131) Constant -1.7464 *** -.6087 * -.7086 *** -3.7558 *** (.1941) (.3480) (.2603) (.6642) ln-L -14841.94 -9559.18 -12663.93 -3421.47
Notes: Native-born respondents reporting at least one union birth or stepfamily formation, valid dates for births, union events and number of partner’s children at union formation. Period of observation is months since stepfamily formation (for 1st stepfamily birth) or age in months of youngest child (for all other intervals). Coefficients are estimated effects on the birth risk; standard errors in parentheses. a Spline functions b West German men age 35-39; Calendar time 1968-80 p < .01, ** p < .05, *** p < .001 Sources: Fertility and Family Surveys: Finland (1989,1992), France (1994), Austria (1995-96) and West Germany (1992).
98 FERTILITY AND PARTNERSHIP IN EUROPE
Appendix 2. Full Model Estimates and Statistics, Male Respondents Finland France Austria West Germany Period of Observationa 0 to 1 year 1.3928 *** .9730 *** .7771 *** 1.6577 *** (.2319) (.2010) (.2544) (.4214) 1 to 2 years .1689 .2833 ** -.2154 .0004 (.1223) (.1213) (.1605) (.2392) 2 to 5 years -.1789 *** -.0762 * -.2548 *** -.1026 (.0436) (.0442) (.0637) (.0930) 5 to 10 years -.1971 *** -.3370 *** -.2342 *** -.3110 ** (.0466) (.0523) (.0676) (.1454) 10+years -.2848 *** -.1818 * -.1465 -.1197 (.0970) (.1057) (.1195) (.3779) Couple’s combined parity Two -1.0934 *** -.9978 *** -1.0376 *** -1.2656 *** (.0774) (.0814) (.1070) (.1748) Three -1.7249 *** -1.5645 *** -1.0433 *** -2.2803 *** (.1430) (.1388) (.1717) (.5028) Four+ -1.3123 *** -1.2379 *** -1.0711 *** -2.6800 ** (.2072) (.1896) (.2871) (1.2949) Stepfamily type No shared children -.3597 1.2167 *** .4051 1.2907 ** (.7949) (.3430) (.3636) (.5152) Woman childless .2138 -.6314 -.4881 -1.2897 * (.7946) (.4126) (.4124) (.7390) Man childless .6770 -.7678 ** -.3933 -.7083 (.8004) (.3653) (.4263) (.5834) One shared child -.0278 .9199 *** .9017 *** .5069 (.2051) (.1575) (.1720) (.4056) Two+ shared children .5933 * .5321 ** -.1587 1.8853 *** (.3201) (.2295) (.3380) (.6990) Woman’s agea <25 -.0280 -.0511 *** .0093 -.0400 (.0221) (.0186) (.0302) (.0431) 25-30 -.0338 -.0458 -.0589 -.0558 (.0265) (.0290) (.0389) (.0606) 30-35 -.0369 .0270 -.1141 -.1105 (.0472) (.0506) (.0715) (.1257) 35 or older -.2371 *** -.2419 *** -.0198 -.0863 (.0904) (.0938) (.0963) (.2084) Man’s agea <25 .0451 -.0470 * .0415 .0404 (.0365) (.0246) (.0350) (.0575) 25-30 .0498 ** -.0225 .0294 -.0692 (.0251) (.0262) (.0349) (.0596) 30-35 -.0742 * -.0012 .0174 .1480 (.0408) (.0441) (.0523) (.1070) 35-40 .0803 -.0137 -.0098 -.0749b (.0737) (.0800) (.1121) (.3589) 40 or older -.2277 -.0559 -.1261 (.1678) (.1805) (.1492) Calendar Timea 1954-70 -.1309 *** -.0844 * -.1179 *** (.0434) (.0498) (.0355) 1970-80 .0497 *** -.0032 -.0098 .0755b (.0112) (.0112) (.0159) (.0562) 1980+ .0231 * -.0030 .0060 -.0275 (.0123) (.0116) (.0116) (.0218) Constant -1.2144 ** -.1150 -.5989 -4.7784 *** (.6082) (.7426) (.5590) (1.3771) ln-L -5003.25 -5087.26 -2986.15 -1338.98
Notes: Native-born respondents reporting at least one union birth or stepfamily formation, valid dates for births, union events and number of partner’s children at union formation. Period of observation is months since stepfamily formation (for 1st stepfamily birth) or age in months of youngest child (for all other intervals). Coefficients are estimated effects on the birth risk; standard errors in parentheses. a Spline functions b West German men age 35-39; Calendar time 1968-80 * p < .01; ** p < .05, *** p < .001 Sources: Fertility and Family Surveys: Finland (1989,1992), France (1994), Austria (1995-96) and West Germany (1992).
CHILDBEARING IN STEPFAMILIES 99
ENDNOTES i This research was supported by Grant HD36275 and Center Grant HD05086 from the U.S. National Institutes of Health, National Institute of Child Health and Human Development and by the respective institutions of the co-authors. Authors are listed according to the timing of their involvement in this collaborative project. ii Stewart (2000) controls for parity with a linear specification, and therefore cannot capture nonlinear parity progression effects. iii The policy and demographic regime in the former East Germany was quite different from that in West Germany during the period we observe, so we do not include data from East German respondents in this analysis. iv Because information on the deaths of partners’ children is available only if the child lived with the respondent and remained in the household until death, and because we want parallel data on respondent’s and partner’s children, we ignore child deaths in computing parity. The proportion of respondents reporting a child who died before the respondent reached the end of her/his childbearing years is exceedingly small.

101
PART TWO
FERTILITY EXPECTATIONS AND BEHAVIOUR
103
CHAPTER 7
FREE TO CHOOSE - BUT UNABLE TO STICK TO IT?
NORWEGIAN FERTILITY EXPECTATIONS AND SUBSEQUENT
BEHAVIOUR IN THE FOLLOWING 20 YEARSi
Turid Noack and Lars Østby*
* Statistics Norway, Oslo (Norway)
A. INTRODUCTION The purpose of survey questions about fertility expectations or preferences is often to use the answers for forecasting population developments. However, before doing so, one should ideally know the predictive power of such stated fertility expectations. Are they as indicators for subsequent behaviour really as unreliable as is frequently supposed? Or is it reasonable to consider the relationship between fertility expectations and fertility behaviour as strong enough to justify their use as a prognostic tool?
The tradition of asking survey questions about future childbearing plans has a solid basis. About 50 years ago, demographers started to ask such questions. Nowadays, one or more questions concerning prospective fertility plans seem to be routine in nearly all fertility surveys. The discussion of the usefulness of asking women how many children they expect to have is, however, as old as the tradition itself. Serious methodological objections have been raised which focus on the validity and reliability of these kinds of measures, and on the many different ways in which fertility intentions can be operationalised (Ryder, 1973; Rasul, 1993; Miller and Pasta, 1995). Some have even maintained that expectation data are nearly worthless. For instance, Simons (1978, p.202) concludes that "Probably most people know, when they reach it, the family
size at which they wish to cease childbearing. But can they usually foresee what size that will be?". His conclusion is that before a woman has decided that she has enough children, her fertility preference represents her perception of an achieved family size that is characteristic of people like herself, and not her personal reproductive target.
The debate about the utility and
policy implications of measuring birth expectations or preferences is also well known (Westoff and Ryder, 1977; Oakley, 1981; Van de Giessen, 1992). Most countriesii do not use fertility expectations in their population projection models, either because they think it does not make sense or because they do not have the appropriate data (Van Hoorn and Keilman, 1997).
Overall, the analytical use of this kind of data seems to be rather modest compared to the long and extensive tradition of collecting them. One reason for this discrepancy is the lack of consensus on the most adequate way to measure fertility preferences (Bongaarts, 1990; see also Van Peer, this Volume). Prospective fertility plans have been measured in many different ways, as desires, as intentions, as ideals, but also as expectations or preferences. Although these various operationalisations may appear quite similar, they are normally not identical. Since, strictly speaking, fertility intentions exclude unwanted births, and since desires
104 FERTILITY AND PARTNERSHIP IN EUROPE
and ideals can be perceived as more hypothetical, we prefer to use the terms expectations or preferences.
As in most other fertility surveys,
the FFS model questionnaire included questions about fertility expectations or preferences. For the twelve European countries which by early 2000 had published their FFS standard country reports, the average number of children ultimately expected varies between 2.0 to 2.4 per female respondent. For young women only, those aged 20-24 years, the range is larger, from 1.7 to 2.5. Young Polish women have the lowest expectations, while young Norwegian women the highest.
The Norwegian FFS was conducted
as early as in 1988. Only minor cohort differences in the number of children ultimately expectediii emerged from this survey (Noack and Østby, 1996). The average total expected varies between 2.2 and 2.5, with the highest figures shown for respondents still in their twenties at the time of the interview. At that point in the life course, the proportion expecting to remain childless is small, while only a modest number expect to be mother of a single child. Comparing women in their thirties in 1988 with women in their twenties eleven years earlier, the proportion expecting to remain childless or to have only one child can be seen to have increased slightly (Noack and Østby, 1996). This change seems reasonable taking into consideration that some may have experienced fertility problems while others may have found that their family situation was not as anticipated, or perhaps they had just acquired more realistic views on having children.
There is still a scarcity of research on fertility expectations and subsequent behaviour. This is particularly true for research at the individual level. Data problems are most likely the main reason for this scarcity. Usually panel data are needed, but such research designs are highly expensive and entail constant drop-out problems. Measuring the prognostic
value only at the aggregate level reduces some of these problems but much of the added value of micro-level analysis then gets lost.
Thanks to a system of unique
personal identification numbers (PIN) for everyone living in Norway, fertility survey data can be linked to individual birth histories from the Central Population Register. In this way the relationship between fertility expectations and subsequent behaviour can be analysed without any re-interviewing. Compared to panel surveys this is a very inexpensive method which minimises the well-known problem of high panel mortality or attrition. This chapter presents the results from such a linkage between two Norwegian fertility surveys conducted in, respectively, 1977 and 1988, and register information about the women interviewed. The register contains information about births which had occurred up to 1999, i.e., during the 22 and 11 years after the respective interviews had taken place. Considering this long observation period, most of the women originally interviewed about their fertility expectations have ended or nearly ended their reproductive career.
In a previous article we have
compared fertility expectations expressed in 1977 with births recorded among the same women for the period 1978-82 (Noack and Østby, 1985). The correspondence between positive fertility expectations and later births seemed to be rather weak. That is, expectations for the short run - up to five years ahead - clearly overestimated future births. Women who expected to have children got considerably fewer children than anticipated. However, women who did not expect children in the following five years were highly reliable in their forecasting. This holds true even for young women and for women who were childless or who had only one child at the time of the interview. Although these results are not completely the same, they are in line with some other studies (Coombs, 1979; Westoff, 1981; Van de Giessen, 1992).
FREE TO CHOOSE – BUT UNABLE TO STICK TO IT? 105
In the first part of our analysis below we repeat the analysis mentioned above in order to compare the predictive capacity of stated fertility expectations for two different five-year periods, namely, 1978-82 and 1989-93. As a working hypothesis we suppose that the relationship between fertility expectations and behaviour may have strengthened in comparison to the results of our first study. This is so because in the first period (1978-82), fertility was levelling off at about 1.7 after a fairly rapid decline which lasted throughout the previous decade. In the second period (1989-93), however, fertility was levelling off at around 1.9, after an initial though modest increase. If - as is often supposed - expectations mainly reflect prevailing norms and trends around the time of the interview, the usual amount of overestimation may be smaller in periods of increasing fertility than in periods of decreasing fertility.
Our data are also suitable for
comparing the fertility expectations women expressed early in life with their achieved family size after 11 and 22 years, which for many of them is towards the end of their reproductive period. We anticipate that a rather large proportion of women will have been too optimistic, meaning that their expected number of children will be explicitly higher than the number of children they actually got. The proportions expecting to stay childless were very modest in the two surveys, between 1 and 3 per cent for women under age 30, which is smaller than the prevalence of primary infecundity among women of that age. We will also look at women who either got exactly the same number of children as expected or who in the end had more children than expected at younger ages.
The oldest group of respondents is
mainly omitted from the analysis. For instance, when women are in their late thirties or in their early forties, only a small portion of them will expect any future childreniv. Furthermore, the analysis comprises only female respondents. Corresponding analyses for men can be done for two male cohorts only of the 1988 survey, but these are not husband-wife data.
Omitting partners' fertility expectations or preferences may obscure the relationship between expectations and subsequent births. Analyses of couple data show significant effects of husbands' desires on couple fertility behaviour (Thomson, McDonald and Bumpass, 1990; Thomson, 1997).
B. DATA
The present analysis is based on a follow-up study of the respondents of two Norwegian family and fertility surveys by using data from the Central Population Register (CPR). Every demographic event (birth, death, marriage, separation, divorce, change of address, etc.) has been recorded in this register. Based on some decades of use for a variety of statistical and analytical purposes, our evaluation of the CPR is that it covers both stock and flow data reasonably well.
The first national Fertility Survey in Norway (FS 77) was conducted in 1977 (Østby, 1981; Noack and Østby, 1981). This study was planned within the framework of the World Fertility Survey, and only women aged 18-44 years (born in 1933-59) were interviewed. Complete interviews were obtained from 4 137 women, which is 82 per cent of the gross sample.
Eleven years after FS 77 the
Family and Occupation Survey of 1988 (F&O 88) was conducted. This survey turned out to be the first one in the 1990s round of comparable European fertility and family surveys co-ordinated by the PAU at UNECE. The Norwegian survey came a little too early to fully benefit from this European co-operation effort, but it could to some extent influence its successors. In any event, it included the majority of key variables from the FFS model questionnaire (Noack and Østby, 1996). Some of the attitudinal questions from FS 77 were repeated, and also childbearing expectations were treated in the same way as before. The female response rate was equal to the one in FS 77, namely, 82 per cent.
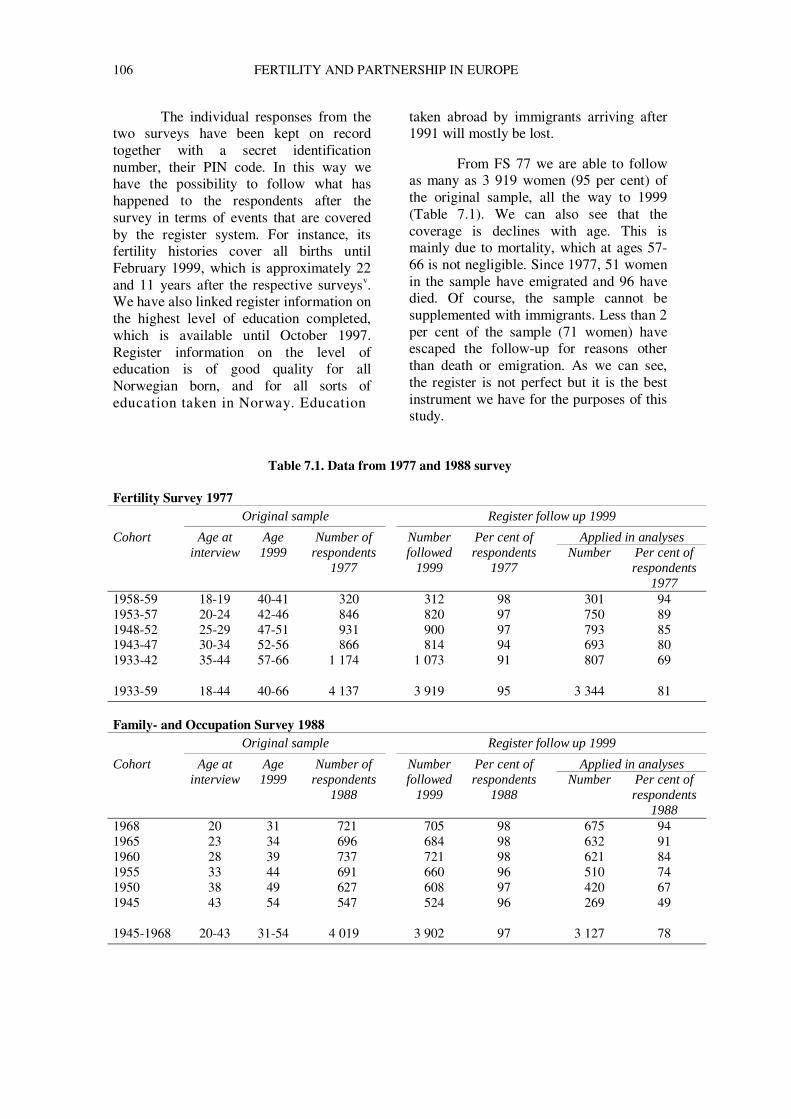
106 FERTILITY AND PARTNERSHIP IN EUROPE
The individual responses from the two surveys have been kept on record together with a secret identification number, their PIN code. In this way we have the possibility to follow what has happened to the respondents after the survey in terms of events that are covered by the register system. For instance, its fertility histories cover all births until February 1999, which is approximately 22 and 11 years after the respective surveysv. We have also linked register information on the highest level of education completed, which is available until October 1997. Register information on the level of education is of good quality for all Norwegian born, and for all sorts of education taken in Norway. Education
taken abroad by immigrants arriving after 1991 will mostly be lost.
From FS 77 we are able to follow
as many as 3 919 women (95 per cent) of the original sample, all the way to 1999 (Table 7.1). We can also see that the coverage is declines with age. This is mainly due to mortality, which at ages 57-66 is not negligible. Since 1977, 51 women in the sample have emigrated and 96 have died. Of course, the sample cannot be supplemented with immigrants. Less than 2 per cent of the sample (71 women) have escaped the follow-up for reasons other than death or emigration. As we can see, the register is not perfect but it is the best instrument we have for the purposes of this study.
Table 7.1. Data from 1977 and 1988 survey Fertility Survey 1977 Original sample Register follow up 1999
Cohort Age at Age Number of Number Per cent of Applied in analyses interview 1999 respondents followed respondents Number Per cent of 1977 1999 1977 respondents 1977 1958-59 18-19 40-41 320 312 98 301 94 1953-57 20-24 42-46 846 820 97 750 89 1948-52 25-29 47-51 931 900 97 793 85 1943-47 30-34 52-56 866 814 94 693 80 1933-42 35-44 57-66 1 174 1 073 91 807 69 1933-59 18-44 40-66 4 137 3 919 95 3 344 81 Family- and Occupation Survey 1988 Original sample Register follow up 1999
Cohort Age at Age Number of Number Per cent of Applied in analyses interview 1999 respondents followed respondents Number Per cent of 1988 1999 1988 respondents 1988 1968 20 31 721 705 98 675 94 1965 23 34 696 684 98 632 91 1960 28 39 737 721 98 621 84 1955 33 44 691 660 96 510 74 1950 38 49 627 608 97 420 67 1945 43 54 547 524 96 269 49 1945-1968 20-43 31-54 4 019 3 902 97 3 127 78
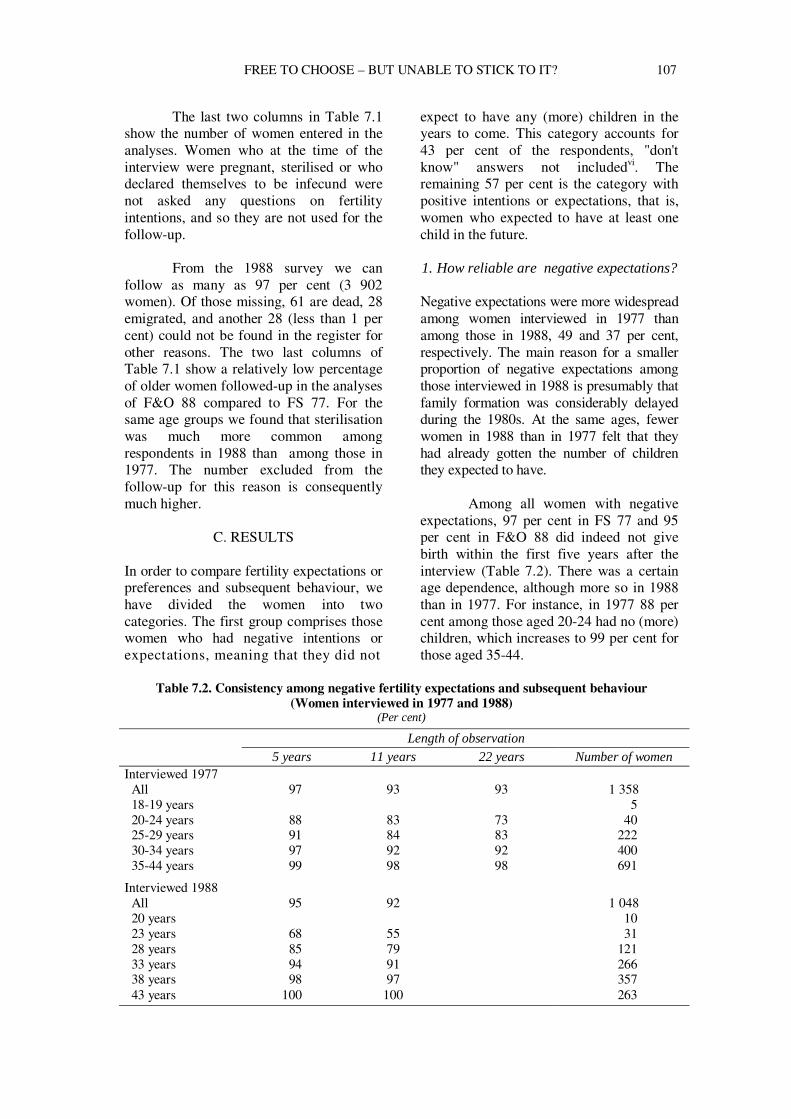
FREE TO CHOOSE – BUT UNABLE TO STICK TO IT? 107
The last two columns in Table 7.1 show the number of women entered in the analyses. Women who at the time of the interview were pregnant, sterilised or who declared themselves to be infecund were not asked any questions on fertility intentions, and so they are not used for the follow-up.
From the 1988 survey we can
follow as many as 97 per cent (3 902 women). Of those missing, 61 are dead, 28 emigrated, and another 28 (less than 1 per cent) could not be found in the register for other reasons. The two last columns of Table 7.1 show a relatively low percentage of older women followed-up in the analyses of F&O 88 compared to FS 77. For the same age groups we found that sterilisation was much more common among respondents in 1988 than among those in 1977. The number excluded from the follow-up for this reason is consequently much higher.
C. RESULTS In order to compare fertility expectations or preferences and subsequent behaviour, we have divided the women into two categories. The first group comprises those women who had negative intentions or expectations, meaning that they did not
expect to have any (more) children in the years to come. This category accounts for 43 per cent of the respondents, "don't know" answers not includedvi. The remaining 57 per cent is the category with positive intentions or expectations, that is, women who expected to have at least one child in the future. 1. How reliable are negative expectations? Negative expectations were more widespread among women interviewed in 1977 than among those in 1988, 49 and 37 per cent, respectively. The main reason for a smaller proportion of negative expectations among those interviewed in 1988 is presumably that family formation was considerably delayed during the 1980s. At the same ages, fewer women in 1988 than in 1977 felt that they had already gotten the number of children they expected to have.
Among all women with negative expectations, 97 per cent in FS 77 and 95 per cent in F&O 88 did indeed not give birth within the first five years after the interview (Table 7.2). There was a certain age dependence, although more so in 1988 than in 1977. For instance, in 1977 88 per cent among those aged 20-24 had no (more) children, which increases to 99 per cent for those aged 35-44.
Table 7.2. Consistency among negative fertility expectations and subsequent behaviour
(Women interviewed in 1977 and 1988) (Per cent)
Length of observation
5 years 11 years 22 years Number of women Interviewed 1977 All 97 93 93 1 358 18-19 years 5 20-24 years 88 83 73 40 25-29 years 91 84 83 222 30-34 years 97 92 92 400 35-44 years 99 98 98 691
Interviewed 1988 All 95 92 1 048 20 years 10 23 years 68 55 31 28 years 85 79 121 33 years 94 91 266 38 years 98 97 357 43 years 100 100 263
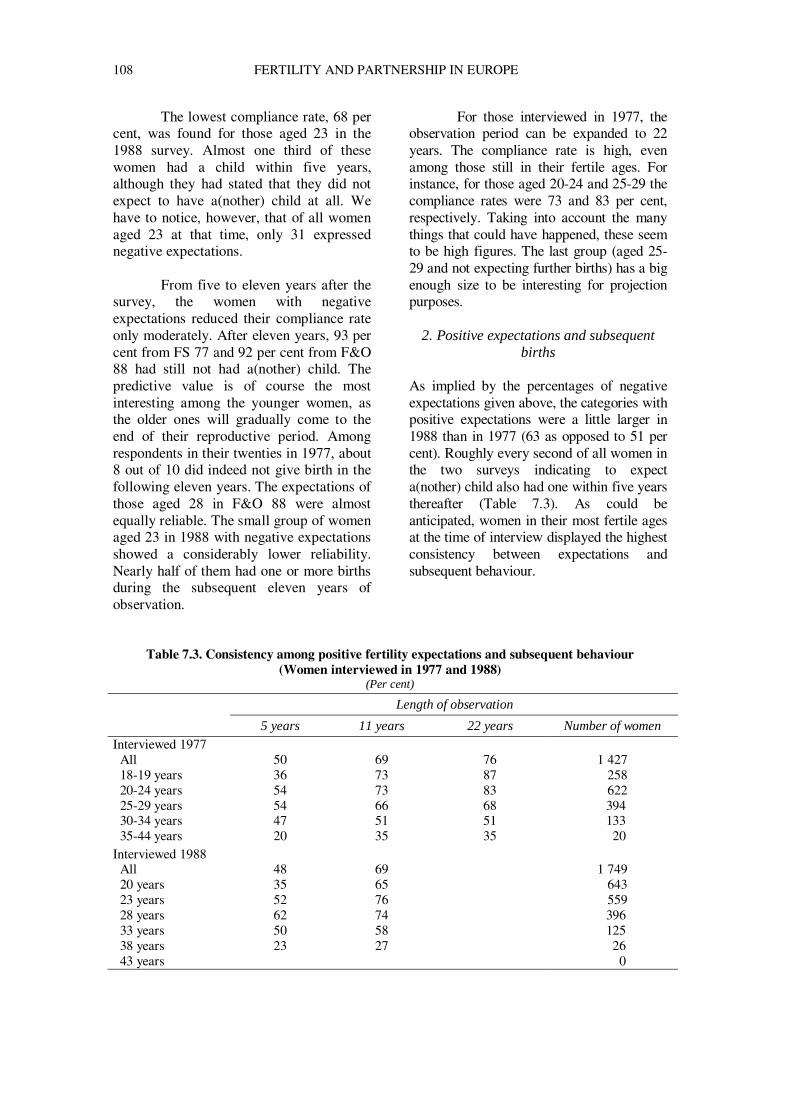
108 FERTILITY AND PARTNERSHIP IN EUROPE
The lowest compliance rate, 68 per cent, was found for those aged 23 in the 1988 survey. Almost one third of these women had a child within five years, although they had stated that they did not expect to have a(nother) child at all. We have to notice, however, that of all women aged 23 at that time, only 31 expressed negative expectations.
From five to eleven years after the
survey, the women with negative expectations reduced their compliance rate only moderately. After eleven years, 93 per cent from FS 77 and 92 per cent from F&O 88 had still not had a(nother) child. The predictive value is of course the most interesting among the younger women, as the older ones will gradually come to the end of their reproductive period. Among respondents in their twenties in 1977, about 8 out of 10 did indeed not give birth in the following eleven years. The expectations of those aged 28 in F&O 88 were almost equally reliable. The small group of women aged 23 in 1988 with negative expectations showed a considerably lower reliability. Nearly half of them had one or more births during the subsequent eleven years of observation.
For those interviewed in 1977, the observation period can be expanded to 22 years. The compliance rate is high, even among those still in their fertile ages. For instance, for those aged 20-24 and 25-29 the compliance rates were 73 and 83 per cent, respectively. Taking into account the many things that could have happened, these seem to be high figures. The last group (aged 25-29 and not expecting further births) has a big enough size to be interesting for projection purposes.
2. Positive expectations and subsequent births
As implied by the percentages of negative expectations given above, the categories with positive expectations were a little larger in 1988 than in 1977 (63 as opposed to 51 per cent). Roughly every second of all women in the two surveys indicating to expect a(nother) child also had one within five years thereafter (Table 7.3). As could be anticipated, women in their most fertile ages at the time of interview displayed the highest consistency between expectations and subsequent behaviour.
Table 7.3. Consistency among positive fertility expectations and subsequent behaviour (Women interviewed in 1977 and 1988)
(Per cent)
Length of observation
5 years 11 years 22 years Number of women
Interviewed 1977 All 50 69 76 1 427 18-19 years 36 73 87 258 20-24 years 54 73 83 622 25-29 years 54 66 68 394 30-34 years 47 51 51 133 35-44 years 20 35 35 20 Interviewed 1988 All 48 69 1 749 20 years 35 65 643 23 years 52 76 559 28 years 62 74 396 33 years 50 58 125 38 years 23 27 26 43 years 0
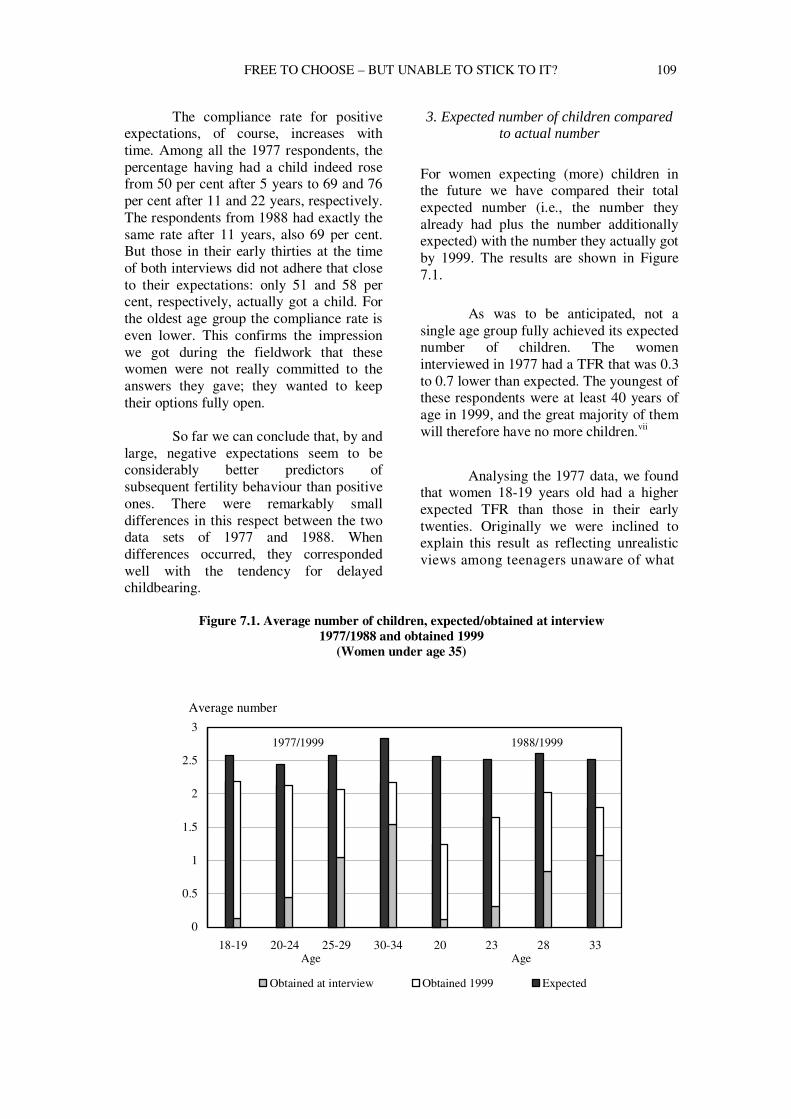
FREE TO CHOOSE – BUT UNABLE TO STICK TO IT? 109
The compliance rate for positive expectations, of course, increases with time. Among all the 1977 respondents, the percentage having had a child indeed rose from 50 per cent after 5 years to 69 and 76 per cent after 11 and 22 years, respectively. The respondents from 1988 had exactly the same rate after 11 years, also 69 per cent. But those in their early thirties at the time of both interviews did not adhere that close to their expectations: only 51 and 58 per cent, respectively, actually got a child. For the oldest age group the compliance rate is even lower. This confirms the impression we got during the fieldwork that these women were not really committed to the answers they gave; they wanted to keep their options fully open.
So far we can conclude that, by and
large, negative expectations seem to be considerably better predictors of subsequent fertility behaviour than positive ones. There were remarkably small differences in this respect between the two data sets of 1977 and 1988. When differences occurred, they corresponded well with the tendency for delayed childbearing.
3. Expected number of children compared to actual number
For women expecting (more) children in the future we have compared their total expected number (i.e., the number they already had plus the number additionally expected) with the number they actually got by 1999. The results are shown in Figure 7.1.
As was to be anticipated, not a single age group fully achieved its expected number of children. The women interviewed in 1977 had a TFR that was 0.3 to 0.7 lower than expected. The youngest of these respondents were at least 40 years of age in 1999, and the great majority of them will therefore have no more children.vii
Analysing the 1977 data, we found that women 18-19 years old had a higher expected TFR than those in their early twenties. Originally we were inclined to explain this result as reflecting unrealistic views among teenagers unaware of what
Figure 7.1. Average number of children, expected/obtained at interview
1977/1988 and obtained 1999 (Women under age 35)
0
0.5
1
1.5
2
2.5
3
18-19 20-24 25-29 30-34 20 23 28 33
Obtained at interview Obtained 1999 Expected
Age Age
1988/19991977/1999
Average number
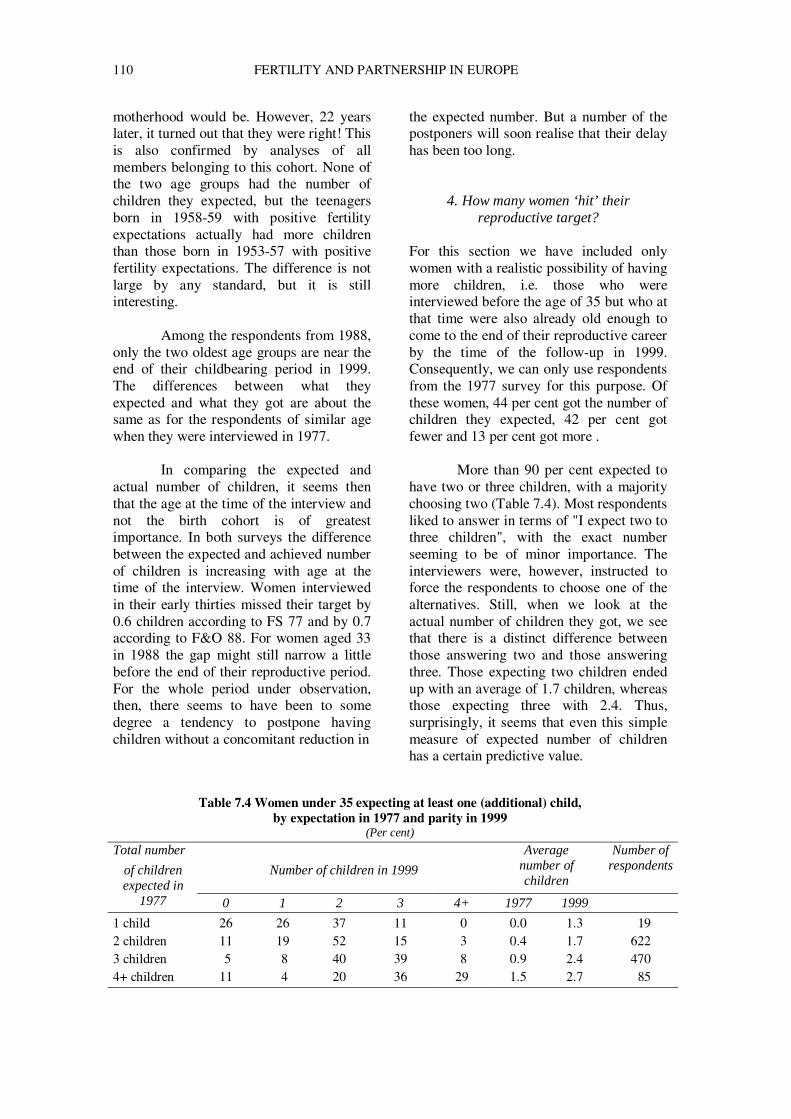
110 FERTILITY AND PARTNERSHIP IN EUROPE
motherhood would be. However, 22 years later, it turned out that they were right! This is also confirmed by analyses of all members belonging to this cohort. None of the two age groups had the number of children they expected, but the teenagers born in 1958-59 with positive fertility expectations actually had more children than those born in 1953-57 with positive fertility expectations. The difference is not large by any standard, but it is still interesting.
Among the respondents from 1988,
only the two oldest age groups are near the end of their childbearing period in 1999. The differences between what they expected and what they got are about the same as for the respondents of similar age when they were interviewed in 1977.
In comparing the expected and
actual number of children, it seems then that the age at the time of the interview and not the birth cohort is of greatest importance. In both surveys the difference between the expected and achieved number of children is increasing with age at the time of the interview. Women interviewed in their early thirties missed their target by 0.6 children according to FS 77 and by 0.7 according to F&O 88. For women aged 33 in 1988 the gap might still narrow a little before the end of their reproductive period. For the whole period under observation, then, there seems to have been to some degree a tendency to postpone having children without a concomitant reduction in
the expected number. But a number of the postponers will soon realise that their delay has been too long.
4. How many women ‘hit’ their reproductive target?
For this section we have included only women with a realistic possibility of having more children, i.e. those who were interviewed before the age of 35 but who at that time were also already old enough to come to the end of their reproductive career by the time of the follow-up in 1999. Consequently, we can only use respondents from the 1977 survey for this purpose. Of these women, 44 per cent got the number of children they expected, 42 per cent got fewer and 13 per cent got more .
More than 90 per cent expected to have two or three children, with a majority choosing two (Table 7.4). Most respondents liked to answer in terms of "I expect two to three children", with the exact number seeming to be of minor importance. The interviewers were, however, instructed to force the respondents to choose one of the alternatives. Still, when we look at the actual number of children they got, we see that there is a distinct difference between those answering two and those answering three. Those expecting two children ended up with an average of 1.7 children, whereas those expecting three with 2.4. Thus, surprisingly, it seems that even this simple measure of expected number of children has a certain predictive value.
Table 7.4 Women under 35 expecting at least one (additional) child, by expectation in 1977 and parity in 1999
(Per cent)
Total number
Number of children in 1999
Average number of children
Number of respondents of children
expected in 1977 0 1 2 3 4+ 1977 1999
1 child 26 26 37 11 0 0.0 1.3 19 2 children 11 19 52 15 3 0.4 1.7 622 3 children 5 8 40 39 8 0.9 2.4 470 4+ children 11 4 20 36 29 1.5 2.7 85
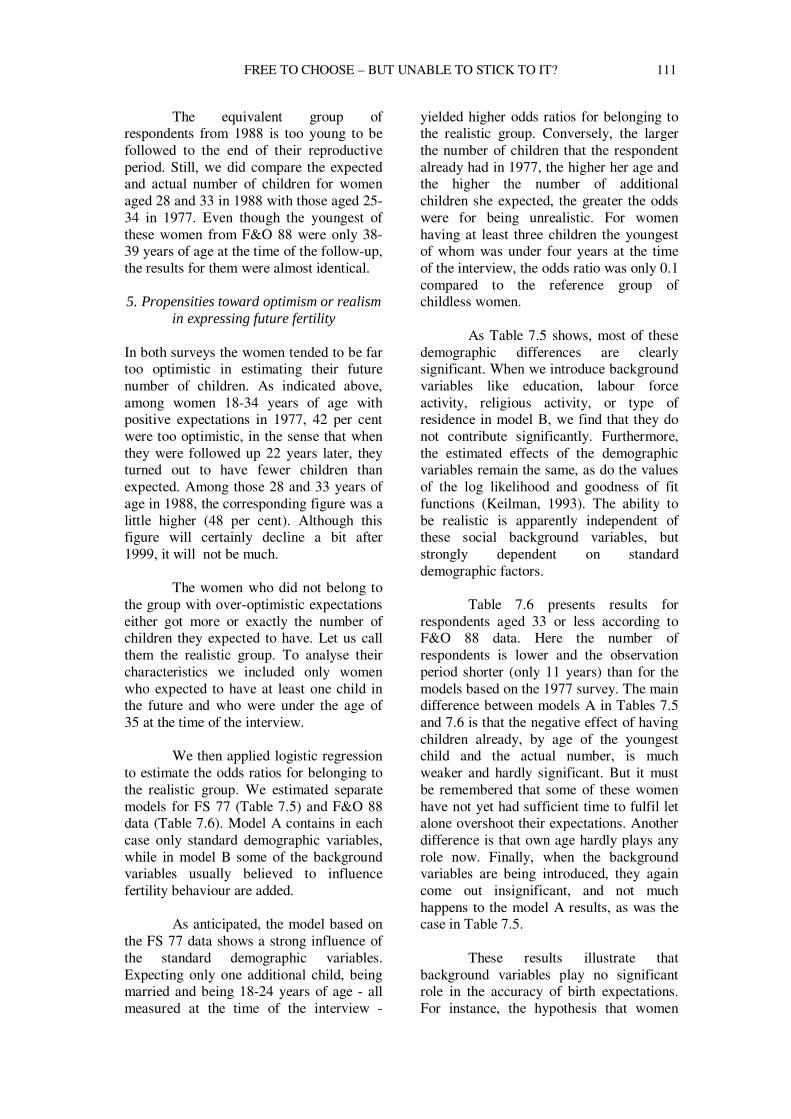
FREE TO CHOOSE – BUT UNABLE TO STICK TO IT? 111
The equivalent group of respondents from 1988 is too young to be followed to the end of their reproductive period. Still, we did compare the expected and actual number of children for women aged 28 and 33 in 1988 with those aged 25-34 in 1977. Even though the youngest of these women from F&O 88 were only 38-39 years of age at the time of the follow-up, the results for them were almost identical. 5. Propensities toward optimism or realism
in expressing future fertility In both surveys the women tended to be far too optimistic in estimating their future number of children. As indicated above, among women 18-34 years of age with positive expectations in 1977, 42 per cent were too optimistic, in the sense that when they were followed up 22 years later, they turned out to have fewer children than expected. Among those 28 and 33 years of age in 1988, the corresponding figure was a little higher (48 per cent). Although this figure will certainly decline a bit after 1999, it will not be much.
The women who did not belong to the group with over-optimistic expectations either got more or exactly the number of children they expected to have. Let us call them the realistic group. To analyse their characteristics we included only women who expected to have at least one child in the future and who were under the age of 35 at the time of the interview.
We then applied logistic regression
to estimate the odds ratios for belonging to the realistic group. We estimated separate models for FS 77 (Table 7.5) and F&O 88 data (Table 7.6). Model A contains in each case only standard demographic variables, while in model B some of the background variables usually believed to influence fertility behaviour are added.
As anticipated, the model based on
the FS 77 data shows a strong influence of the standard demographic variables. Expecting only one additional child, being married and being 18-24 years of age - all measured at the time of the interview -
yielded higher odds ratios for belonging to the realistic group. Conversely, the larger the number of children that the respondent already had in 1977, the higher her age and the higher the number of additional children she expected, the greater the odds were for being unrealistic. For women having at least three children the youngest of whom was under four years at the time of the interview, the odds ratio was only 0.1 compared to the reference group of childless women.
As Table 7.5 shows, most of these
demographic differences are clearly significant. When we introduce background variables like education, labour force activity, religious activity, or type of residence in model B, we find that they do not contribute significantly. Furthermore, the estimated effects of the demographic variables remain the same, as do the values of the log likelihood and goodness of fit functions (Keilman, 1993). The ability to be realistic is apparently independent of these social background variables, but strongly dependent on standard demographic factors.
Table 7.6 presents results for
respondents aged 33 or less according to F&O 88 data. Here the number of respondents is lower and the observation period shorter (only 11 years) than for the models based on the 1977 survey. The main difference between models A in Tables 7.5 and 7.6 is that the negative effect of having children already, by age of the youngest child and the actual number, is much weaker and hardly significant. But it must be remembered that some of these women have not yet had sufficient time to fulfil let alone overshoot their expectations. Another difference is that own age hardly plays any role now. Finally, when the background variables are being introduced, they again come out insignificant, and not much happens to the model A results, as was the case in Table 7.5.
These results illustrate that
background variables play no significant role in the accuracy of birth expectations. For instance, the hypothesis that women
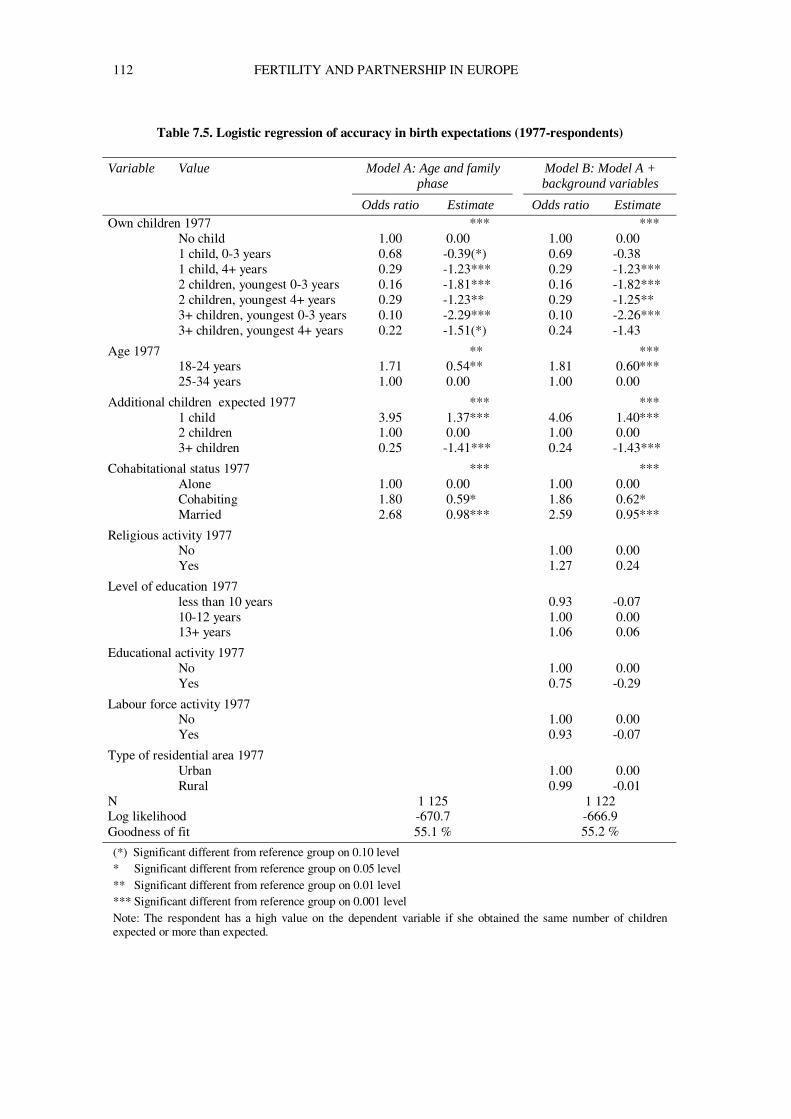
112 FERTILITY AND PARTNERSHIP IN EUROPE
Table 7.5. Logistic regression of accuracy in birth expectations (1977-respondents)
Variable Value Model A: Age and family
phase Model B: Model A +
background variables
Odds ratio Estimate Odds ratio Estimate Own children 1977 *** *** No child 1.00 0.00 1.00 0.00 1 child, 0-3 years 0.68 -0.39(*) 0.69 -0.38 1 child, 4+ years 0.29 -1.23*** 0.29 -1.23*** 2 children, youngest 0-3 years 0.16 -1.81*** 0.16 -1.82*** 2 children, youngest 4+ years 0.29 -1.23** 0.29 -1.25** 3+ children, youngest 0-3 years 0.10 -2.29*** 0.10 -2.26*** 3+ children, youngest 4+ years 0.22 -1.51(*) 0.24 -1.43
Age 1977 ** *** 18-24 years 1.71 0.54** 1.81 0.60*** 25-34 years 1.00 0.00 1.00 0.00
Additional children expected 1977 *** *** 1 child 3.95 1.37*** 4.06 1.40*** 2 children 1.00 0.00 1.00 0.00 3+ children 0.25 -1.41*** 0.24 -1.43***
Cohabitational status 1977 *** *** Alone 1.00 0.00 1.00 0.00 Cohabiting 1.80 0.59* 1.86 0.62* Married 2.68 0.98*** 2.59 0.95***
Religious activity 1977 No 1.00 0.00 Yes 1.27 0.24
Level of education 1977 less than 10 years 0.93 -0.07 10-12 years 1.00 0.00 13+ years 1.06 0.06
Educational activity 1977 No 1.00 0.00 Yes 0.75 -0.29
Labour force activity 1977 No 1.00 0.00 Yes 0.93 -0.07
Type of residential area 1977 Urban 1.00 0.00 Rural 0.99 -0.01 N 1 125 Log likelihood -670.7 Goodness of fit 55.1 %
1 122 -666.9 55.2 %
(*) Significant different from reference group on 0.10 level * Significant different from reference group on 0.05 level ** Significant different from reference group on 0.01 level *** Significant different from reference group on 0.001 level Note: The respondent has a high value on the dependent variable if she obtained the same number of children expected or more than expected.
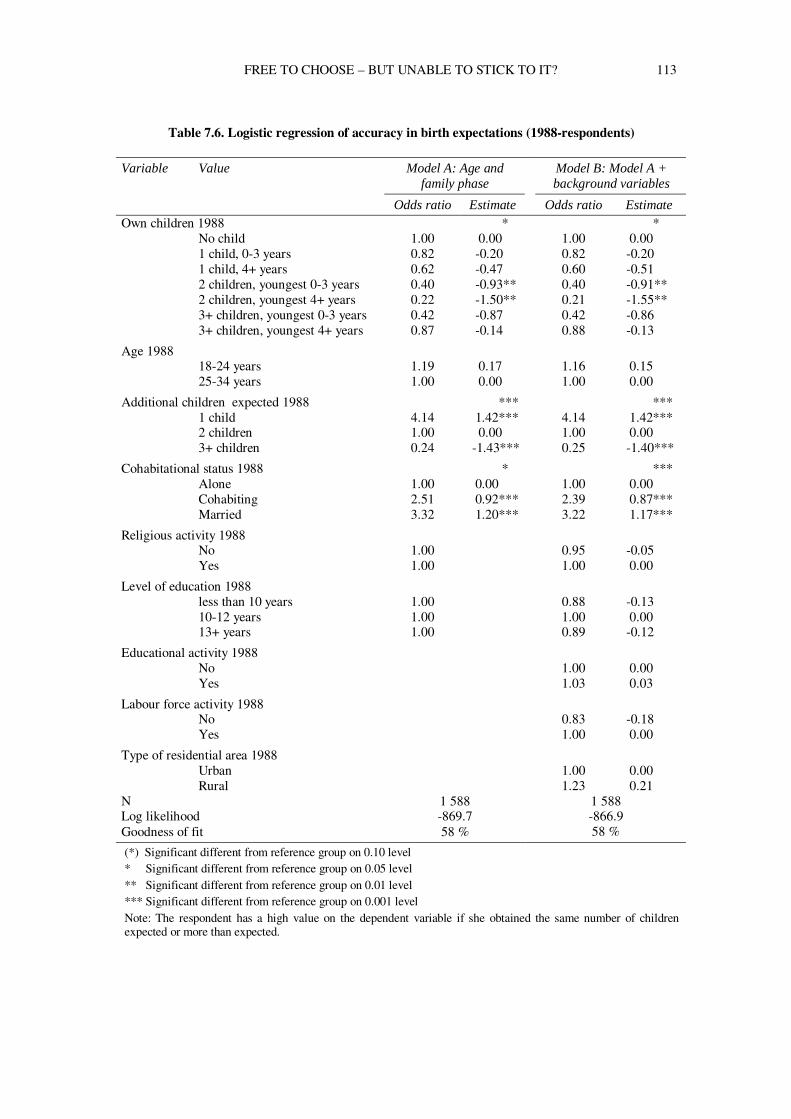
FREE TO CHOOSE – BUT UNABLE TO STICK TO IT? 113
Table 7.6. Logistic regression of accuracy in birth expectations (1988-respondents)
Variable Value Model A: Age and
family phase Model B: Model A +
background variables
Odds ratio Estimate Odds ratio Estimate Own children 1988 * * No child 1.00 0.00 1.00 0.00 1 child, 0-3 years 0.82 -0.20 0.82 -0.20 1 child, 4+ years 0.62 -0.47 0.60 -0.51 2 children, youngest 0-3 years 0.40 -0.93** 0.40 -0.91** 2 children, youngest 4+ years 0.22 -1.50** 0.21 -1.55** 3+ children, youngest 0-3 years 0.42 -0.87 0.42 -0.86 3+ children, youngest 4+ years 0.87 -0.14 0.88 -0.13
Age 1988 18-24 years 1.19 0.17 1.16 0.15 25-34 years 1.00 0.00 1.00 0.00
Additional children expected 1988 *** *** 1 child 4.14 1.42*** 4.14 1.42*** 2 children 1.00 0.00 1.00 0.00 3+ children 0.24 -1.43*** 0.25 -1.40***
Cohabitational status 1988 * *** Alone 1.00 0.00 1.00 0.00 Cohabiting 2.51 0.92*** 2.39 0.87*** Married 3.32 1.20*** 3.22 1.17***
Religious activity 1988 No 1.00 0.95 -0.05 Yes 1.00 1.00 0.00
Level of education 1988 less than 10 years 1.00 0.88 -0.13 10-12 years 1.00 1.00 0.00 13+ years 1.00 0.89 -0.12
Educational activity 1988
No 1.00 0.00 Yes 1.03 0.03
Labour force activity 1988 No 0.83 -0.18 Yes 1.00 0.00
Type of residential area 1988 Urban 1.00 0.00 Rural 1.23 0.21 N 1 588 Log likelihood -869.7 Goodness of fit 58 %
1 588 -866.9 58 %
(*) Significant different from reference group on 0.10 level * Significant different from reference group on 0.05 level ** Significant different from reference group on 0.01 level *** Significant different from reference group on 0.001 level Note: The respondent has a high value on the dependent variable if she obtained the same number of children expected or more than expected.
114 FERTILITY AND PARTNERSHIP IN EUROPE
with higher education are more realistic in this respect is not supported by our analyses. Neither is the idea that religiously active women fulfil their childbearing expectations better than other women do. We also anticipated that women having finished school and started a labour market career would follow their preferences closer than those not yet so established. But we found no evidence for this. The resemblance between the models based on 1977 and 1988 data strengthens the validity of these somewhat surprising conclusions.
D. DISCUSSION
As demonstrated already in several other studies, our analysis confirms a rather weak relationship between stated fertility expectations and subsequent births. Short-term as well as long-term expectations overestimate childbearing in the years to come. There is, however, one very important exception to this overall conclusion. Women who say they do not expect to have a(nother) child are highly trustworthy. This was true for the situation around 1980 and it was verified once more when we followed the respondents to the end of the 1990s.
In predicting future fertility, these
results may help us to exclude the proportion of women who probably will not contribute any further children in the future. Given the dependence on simple demographic factors, it should also be possible to evaluate the answers of specific other population groups and reformulate these into more realistic expectations. Today, only a few countries use birth expectations in their national forecasts. Our analysis shows that data on birth expectations may be more favourable to these ends than is generally supposed, provided that the expectations are not used directly but indirectly. That is, the answers of specific population groups are to be recast into more realistic expectations. Based on studies like ours, it should be possible to develop group-specific “correction factors”.
The hypothesis that fertility expectations may be better indicators in a period of increasing fertility than in a period of decreasing fertility is not confirmed by our results. The proportion of women being too optimistic was about the same around 1980 as around 1990.
When formulating hypotheses
about the expectation-behaviour nexus, one may also refer to theories of ongoing processes in modern societies. The individualisation theory, according to which the influence of normative guidelines is supposedly impairred while that of individual choices is promoted, is one example (Lesthaeghe and Surkyn, 1988; Ester, Halman and de Moor, 1994). Although much more empirical testing is needed, it seems reasonable to believe indeed that conscious and reflexive choices nowadays play a far more important role in actual fertility behaviour than some decades ago. According to the individualisation theory, age-standardised normative guidelines for the appropriate timing and number of births are eroded. At the same time, rational decision-making and individual initiative-taking become more prominent, and it seems more appropriate therefore to talk about choice biography than about standard biography. Liefbroer (1999) has emphasised that in a situation like this, the relationship between individual intentions and subsequent behaviour may grow tighter.
But is it actually true that the
relationship between intentions and behaviour gets closer as the society becomes more individualised? This does not seem to be the case. The proportion of women who did not fulfil their expectations is the same in the 1980s as in the 1990s. In the same direction points also the fact that the ability to be realistic in one’s fertility expectations does not seem to be correlated with social background variables normally thought to be related to individualisation, like education, labour market situation or religious activity. To the contrary, this ability is strongly correlated with plain demographic variables.
FREE TO CHOOSE – BUT UNABLE TO STICK TO IT? 115
The hypothesis anticipating greater compliance between expectation and behaviour in more individualised societies is thus not supported by our results. One explanation for this may be that the significance of making choices and planning one’s family life strategy was already highly important in Norway in 1980, with only minor changes in the next decade. But we do not believe in this: the individualisation of Norwegian society was not that far advanced yet in 1980.
There is a possibility, however, that
we overestimate our ability to fulfil choices, no matter how distinct and thoroughly considered they are. The necessity of making rational choices is embedded in a development towards ever reduced certainties (Beck and Beck-Gernsheim, 1995). A more flexible labour market and fundamental changes in the gender division of labour are important parts of this development. Although individuals decide family life strategies more actively on their own (see also Bosveld, this Volume), the inherent uncertainties mentioned above may be hard to overcome. Underestimating the disposition and/or possibility to alter one’s fertility expectations may also contribute to the results. All things considered then, it may be said that in a society that increasingly presupposes that individuals make choices actively and rationally, the predictive value of fertility norms and age-standardised guidelines for the appropriate timing and number of births may be as good as or, rather, as bad as the accuracy of those individual choices.
Considering long-term expectations
and the number of children at the end of the reproductive period, our analysis has demonstrated that the ability to estimate one’s fertility behaviour realistically corresponds with some demographic variables such as parity status, the age of the youngest child and the cohabitational status. Traditional background variables such as educational level and religiosity, however, have no effect at all.
In discussions on how to measure fertility expectations it has sometimes been put forward that fertility expectations perhaps only mediate the effects of other well-established predictor variables. An analysis by Shoen et al. (1999), however, indicates that preferences have an additional impact on fertility behaviour. Our data are suitable for throwing light upon this question, too. This will be analysed in a next exercise of combining Norwegian register and fertility survey data.
In our opinion, fertility
expectations as measured in our data as well as in most other fertility surveys are too simple indicators. Several years ago, Udry (1982) has pointed out that the demographic concept of norms as used in many fertility studies has very little in common with the sociological concept. Most of the fertility surveys only consider statements, while the most crucial points related to norms - such as questions on sanctions and consensus - are usually omitted. With their three P's (Permission, Proscription and Prescription), Hagestad and Neugarten (1985) have introduced suggestive nuances for role entries and exits, timetables, norms and other kinds of age-appropriate behaviour. Liefbroer (1999, p.15) has concluded that "cultural scripts that transmit guidelines on the appropriate timing and sequencing of family life events are important in determining the actual intentions and behaviour of young adults". To be able to explore these various approaches, we need a vigorous revision of the kind of questionnaires which have been more or less routine now for decades. We sincerely hope that a follow-up to the first FFS round will take this recommendation into due consideration.
REFERENCES Beck, Ulrick and E. Beck-Gernsheim E (1995). The
Normal Chaos of Love. Cambridge: Polity Press. Bongaarts, J. (1990). The Measurement of Wanted
Fertility. Population and Development Review, 16, 3, 487-506.
Coombs, L. C. (1979). Reproductive goals and achieved fertility: a fifteen-year perspective. Demography, 16, 523-534.
116 FERTILITY AND PARTNERSHIP IN EUROPE
Ester, P., L. Halman and R. de Moor (1994). The Individualizing Society. Value Change in Europe and North America. Tilburg: University Press.
Hagestad, G. O. and B. L.Neugarten (1985). Age and the life course. In Handbook of aging and the social sciences, E. Shanas and R. Binstock (Eds) New York: Van Nostrand-Reinhold Company.
Keilman, N. (1993). Book review/recension. In J. Trussel, R. Hankinson and J. Tilton, (Eds) Demographic Applications of Event History Analysis in European Journal of Population, 9, 98-109.
Lesthaeghe, R. and J. Surkyn (1988). Cultural dynamics and economic theories of fertility change. Population and Development Review, 14, 1-45.
Liefbroer, A. C (1999). Life-Planning During Young Adulthood: Do Intentions About the Timing of Family-Life Events Come True? Paper presented at the European Population Conference, The Hague, The Netherlands, 30 August-3 September.
Miller, W. B. and D. J. Pasta (1995). Behavioral Intentions: Which Ones Predict Fertility Behavior in Married Couples? Journal of Applied Social Psychology, 25, 6, 530-555.
Noack, T. and L. Østby (1981). Fertility among Norwegian Women. Results from the Fertility Survey 1977. In Norwegian with English summary. Samfunnsøkonomiske Studier nr. 49. Oslo-Kongsvinger: Statistics Norway.
Noack, T. and L. Østby (1985). Fertility Expectations: A Short Cut or Dead-End in Predicting Fertility? Scandinavian Population Studies (The Scandinavian Demographic Society, Helsinki),.7, 48-59.
Noack, T. and L. Østby (1996). Fertility and Family Surveys in Countries of the ECE Region Standard Country Norway. Economic Studies No.10a, Geneva/New York: United Nations Economic Commission for Europe
Oakley, D. (1981). Reflections on the Development of Measures of Childbearing Expectations. In G.
E. Hendershot and P. J. Placek (Eds) Predicting fertility. Lexington: Lexington Books.
Østby, L. (1981). The Norwegian Fertility Survey 1977. A Summary of Findings. World Fertility Survey, No.29.
Rasul, A. (1993). Fertility preference: A study of some basic concepts and considerations. The Journal of Family Welfare, 39, 1, 24-32.
Ryder, N. B. (1973). A Critique of the National Fertility Study. Demography, 10, 4, 495-506.
Shoen, R., N. M. Astone, Y. J. Kim and C. A. Nathanson (1999). Do Fertility Intentions Affect Fertility Behavior? Journal of Marriage and the Family 61, 790-799.
Simons, J. (1978). Illusions about Attitudes. In Population decline in Europe. Chapter 9. Strasbourg: Council of Europe.
Thomson, E., E. McDonald and L. L. Bumpass (1990). Fertility Desires and Fertility: Hers, His, and Theirs. Demography, 27, 4, 579-588.
Thomson, E. (1997). Couple Childbearing Desires, Intentions, and Births. Demography, 34, 3, 343-354.
Udry, R. J. (1982). The effect of normative pressure on fertility. Population and Environment, 5, 1-18.
Van de Giessen, H. (1992). Using Birth Expectations Information in National Population Forecasts. In N. Keilman and H. Cruijsen. National population forecasting in industrialized countries. Amsterdam/Lisse: Swets & Zeitlinger B.V.
Van Hoorn, W. and N. Keilman (1997). Births Expectations and Their Use in Fertility Forecasting. Population and social conditions, Eurostat working paper E4/1997-4, Eurostat.
Westoff, C. F. and N. B. Ryder (1977). The Predictive Validity of Reproductive Intentions. Demography, 14, 4, 431-453.
Westoff, C. F. (1981). The Validity of Birth Intentions: Evidence from U.S. Longitudinal Studies. In G. E. Hendershot and P. J. Placek (Eds) Predicting fertility. Lexington: Lexington Books.
ENDNOTES i We are grateful to Mr. Torkild Lyngstad for his efforts to link these old data sets, and for his input to the analyses. We also want to thank Research Council of Norway for project support, grant 129807/730. ii Only the USA, the Netherlands, United Kingdom and Australia use birth expectations in their national forecasts (Van Hoorn and Keilman, 1997). iii Contrary to the FFS standard recommendation the Norwegian FFS asked about expected number of children not number of children wanted. It seems reasonable to believe that should there be any noticeable difference between the two variables, expected would turn out to be a little lower since it suggests a more realistic estimate than does the term wanted. iv In 1977, 85 per cent of women aged 35-39 expected no more births. The same percentage was found for women 38 years of age in 1988. Corresponding figures for women aged 40-44 in 1977 and 43 in 1988 were 92 and 98 per cent, respectively. v In our analyses we have for technical reasons used the fertility histories from the CPR, which means that birth data from the periods before the interviews as collected through the retrospective survey questionnaires were replaced by register information. In only a very limited number of cases is there a difference between survey and register data. Births given abroad by women who later returned to Norway with their child(ren) are also covered by the register. vi To the question ”Do you expect to have (more) children?”, 14 per cent in FS 77 and 12 per cent in F&O 88 answered ”Don’t know”. vii Age-specific fertility rates were 6.9 and 0.2 per thousand, respectively for women 40-44 and 45-49 years of age in 1998.
117
CHAPTER 8
DESIRED AND ACHIEVED FERTILITYi
Christine Van Peer *
* Population and Family Study Centre, Brussels (Belgium)
A. INTRODUCTION A substantial fertility decline has been observed in nearly all Western industrialised countries over the last decades. At the same time it has become clear that fertility differentials can no longer be explained by socio-economic characteristics alone. Consequently, more attention has been given lately to individual-level attitudes, values and preferences of women and men with respect to childbearing and rearing. At the same time there is also a growing consensus that attitudes need to be analysed from a life course perspective. Life course theories have gained in popularity over the traditional, mainly economic explanations of fertility behaviour. Besides attitudes, values and preferences, the nature and sequence of events during the individual life course have occupied an ever more prominent place in fertility research.
In several European countries, a
discrepancy can be observed between the average number of children desired in the course of the reproductive cycle and the actual number of children attained by the end of the reproductive years. The FFS data allow for an investigation into the determinants of this discrepancy. However, given the cross-sectional nature of the FFS data on fertility desires, the picture we get is a snapshot at only one point in time. The gap between desires and realisations is assumed to be attributable to both micro- and macro-level characteristics. A comparison of country-specific results must reveal whether countries can be ranked according to this notion of 'discrepancy'.
Comparative research should identify common underlying patterns, if any, and should help in interpreting the exact significance of the differences observed between countries. Differences in individual-level effects may reflect differences in the societal context. For example, what is the family policy climate of a country? Does it or does it not have explicit policies on children, on working women, etc.? Which societies are in this sense more child-friendly? Comparative research across countries is needed in order to empirically verify this macro hypothesis.
The empirical analysis presented in
this chapter, however, will be restricted to individual-level effects. To what extent are women's educational and professional positions, the characteristics of their relationship and their birth experiences, if any, major determinants of their subsequent childbearing decision-making? Which factors come into play in shifting the number of children desired and/or attained? Which ones determine postponement? How, when and why do people make voluntary and rational decisions with regard to fertility? To what extent do rationally uncontrollable elements - such as relational problems or complications related to pregnancy or birth - play a role? Macro hypotheses will only be introduced as an onset for further research.
B. INTENTIONS AND BEHAVIOUR
Fertility intentions have received considerable attention in the demographic literature of recent years.
118 FERTILITY AND PARTNERSHIP IN EUROPE
The tradition of asking about future childbearing plans in fertility surveys is well established, and the same can be said of criticisms of such questions. The discussion has been largely a methodological one, focusing on the validity and reliability of different measures, their comparability across countries, the high non-response rates (see, for example, Kveder, this Volume), etc. But even the utility as such of measuring birth expectations has been debated. Some scholars have expressed doubts about the predictive value of statements of intent and have seriously criticised the usefulness of fertility intentions to predict future fertility levels (see also Noack and Østby, this Volume). Some studies have shown a rather weak correspondence between expected fertility and subsequent birth histories (Coombs, 1979; Noack and Østby, 1985). There can be no doubt indeed that some attitudinal questions traditionally formulated with regard to desired or ideal family size do not yield good predictors of achieved family size, at least not on an individual level. But other questions on fertility preferences, such as the intended or expected number of children, and expectations about the occurrence and timing of a next birth, are obviously more reliable. Results available both at the individual and aggregate level on the association between intentions and behavioural outcomes support the belief that stated intentions are an essential complement to life course data on past and current experiences. At the aggregate level expectations turn out to reveal even a very strong sense of realism. Intra-cohort studies at this level show a striking correspondence between fertility intentions and their subsequent implementation (Cliquet, 1992; Hendershot and Placek, 1981; Monnier, 1987; Westoff, 1990).
Desired fertility is operationalised
in many different ways (Bongaarts, 1990; Ryder, 1973), which is one of the reasons why the analytical use of birth expectations has been rather limited. Questions about fertility preferences are worded in a variety of ways which make either reference to desires, plans, intentions, ideals,
preferences or to expectations. Ideal family size points to the existence of a societal norm regarding family size, while expected size points to a personal norm. Previous research has shown important differences between ideal, desired and completed fertility among respondents. For instance, earlier analyses based on fertility surveys in Belgium and other countries have demonstrated a gradation between the various family size variables. That is, ideal family size generally yields the largest measure while achieved family size the smallest, with desired family size somewhere in-between. While the personal norm is situated well under the population norm, achieved fertility is normally still lower. The fertility histories in the FFS surveys have been complemented with information on the way respondents anticipate their lives in that domain in the near future (United Nations, 1992). Questions were asked about desired or, as in some countries, expected family size, and about ideal family size.
However, answers to such
questions always need to be interpreted carefully. Stated fertility intentions are predictions about the future, and so they may contain a considerable amount of uncertainty. According to Morgan (1981, 1982), uncertainty about parity-specific intentions only arises if a minimally acceptable number of children has already been attained, but an additional child would not necessarily be considered as unacceptable. On the one hand, fertility intentions reflect desires. On the other, they are always expressed in relation to the actual childbearing context. This includes among other things: the presence of a partner, stability of the union, threat of marital disruption, occurrence of sterility problems, incongruity between preferred and actual gender composition of children already born, etc. Besides the vulnerability of relationships and previous fertility experiences, societal circumstances such as the incompatibility between raising children and working outside the home can also play a role. All these factors may be associated with readjustments of fertility intentions.
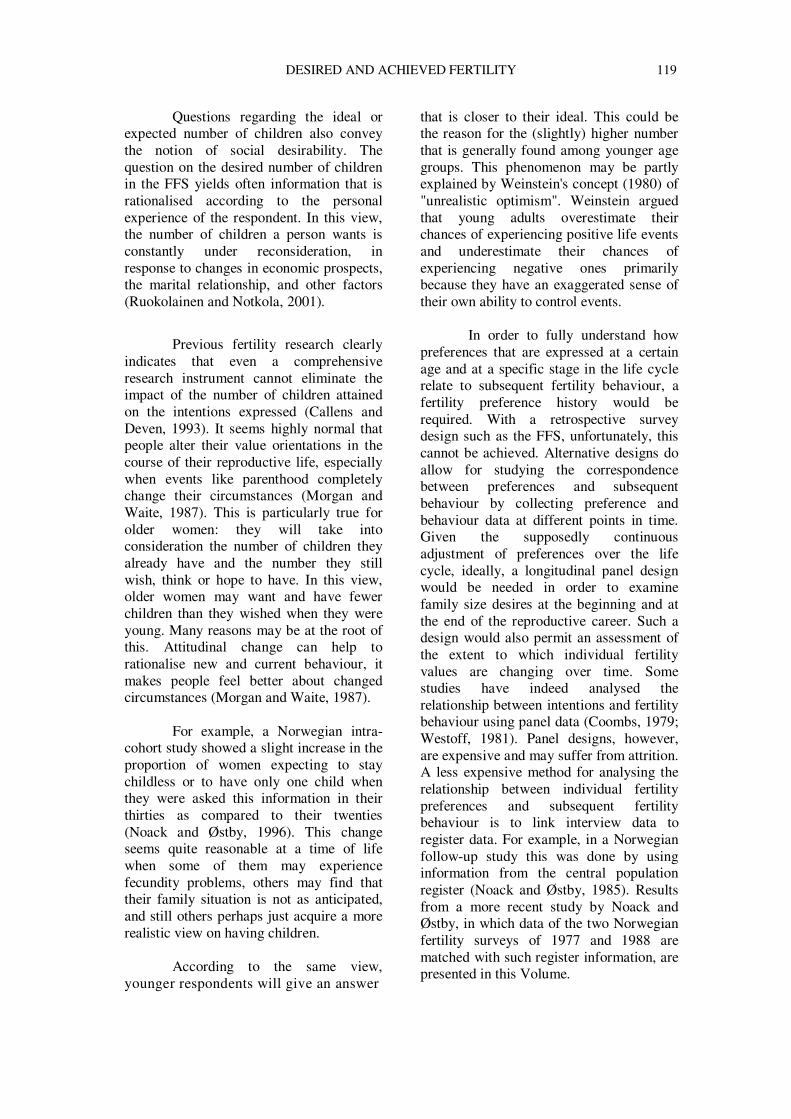
DESIRED AND ACHIEVED FERTILITY 119
Questions regarding the ideal or expected number of children also convey the notion of social desirability. The question on the desired number of children in the FFS yields often information that is rationalised according to the personal experience of the respondent. In this view, the number of children a person wants is constantly under reconsideration, in response to changes in economic prospects, the marital relationship, and other factors (Ruokolainen and Notkola, 2001).
Previous fertility research clearly indicates that even a comprehensive research instrument cannot eliminate the impact of the number of children attained on the intentions expressed (Callens and Deven, 1993). It seems highly normal that people alter their value orientations in the course of their reproductive life, especially when events like parenthood completely change their circumstances (Morgan and Waite, 1987). This is particularly true for older women: they will take into consideration the number of children they already have and the number they still wish, think or hope to have. In this view, older women may want and have fewer children than they wished when they were young. Many reasons may be at the root of this. Attitudinal change can help to rationalise new and current behaviour, it makes people feel better about changed circumstances (Morgan and Waite, 1987).
For example, a Norwegian intra-
cohort study showed a slight increase in the proportion of women expecting to stay childless or to have only one child when they were asked this information in their thirties as compared to their twenties (Noack and Østby, 1996). This change seems quite reasonable at a time of life when some of them may experience fecundity problems, others may find that their family situation is not as anticipated, and still others perhaps just acquire a more realistic view on having children.
According to the same view,
younger respondents will give an answer
that is closer to their ideal. This could be the reason for the (slightly) higher number that is generally found among younger age groups. This phenomenon may be partly explained by Weinstein's concept (1980) of "unrealistic optimism". Weinstein argued that young adults overestimate their chances of experiencing positive life events and underestimate their chances of experiencing negative ones primarily because they have an exaggerated sense of their own ability to control events.
In order to fully understand how
preferences that are expressed at a certain age and at a specific stage in the life cycle relate to subsequent fertility behaviour, a fertility preference history would be required. With a retrospective survey design such as the FFS, unfortunately, this cannot be achieved. Alternative designs do allow for studying the correspondence between preferences and subsequent behaviour by collecting preference and behaviour data at different points in time. Given the supposedly continuous adjustment of preferences over the life cycle, ideally, a longitudinal panel design would be needed in order to examine family size desires at the beginning and at the end of the reproductive career. Such a design would also permit an assessment of the extent to which individual fertility values are changing over time. Some studies have indeed analysed the relationship between intentions and fertility behaviour using panel data (Coombs, 1979; Westoff, 1981). Panel designs, however, are expensive and may suffer from attrition. A less expensive method for analysing the relationship between individual fertility preferences and subsequent fertility behaviour is to link interview data to register data. For example, in a Norwegian follow-up study this was done by using information from the central population register (Noack and Østby, 1985). Results from a more recent study by Noack and Østby, in which data of the two Norwegian fertility surveys of 1977 and 1988 are matched with such register information, are presented in this Volume.
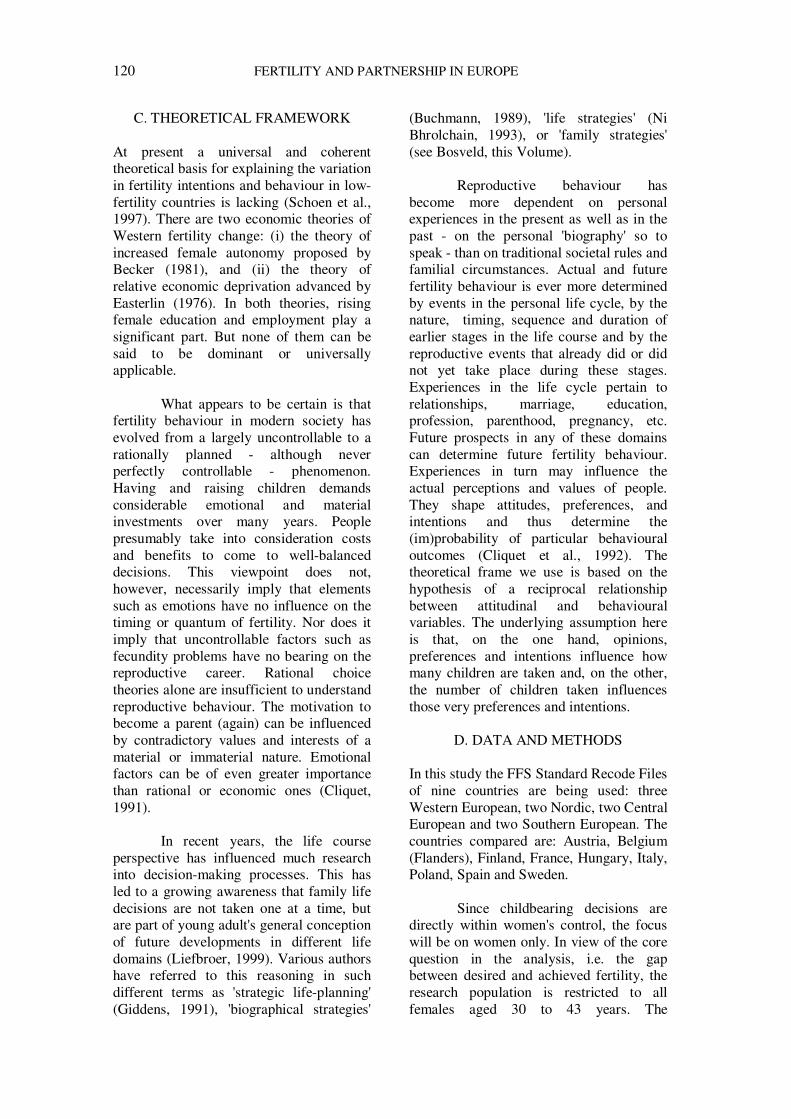
120 FERTILITY AND PARTNERSHIP IN EUROPE
C. THEORETICAL FRAMEWORK
At present a universal and coherent theoretical basis for explaining the variation in fertility intentions and behaviour in low-fertility countries is lacking (Schoen et al., 1997). There are two economic theories of Western fertility change: (i) the theory of increased female autonomy proposed by Becker (1981), and (ii) the theory of relative economic deprivation advanced by Easterlin (1976). In both theories, rising female education and employment play a significant part. But none of them can be said to be dominant or universally applicable.
What appears to be certain is that
fertility behaviour in modern society has evolved from a largely uncontrollable to a rationally planned - although never perfectly controllable - phenomenon. Having and raising children demands considerable emotional and material investments over many years. People presumably take into consideration costs and benefits to come to well-balanced decisions. This viewpoint does not, however, necessarily imply that elements such as emotions have no influence on the timing or quantum of fertility. Nor does it imply that uncontrollable factors such as fecundity problems have no bearing on the reproductive career. Rational choice theories alone are insufficient to understand reproductive behaviour. The motivation to become a parent (again) can be influenced by contradictory values and interests of a material or immaterial nature. Emotional factors can be of even greater importance than rational or economic ones (Cliquet, 1991).
In recent years, the life course
perspective has influenced much research into decision-making processes. This has led to a growing awareness that family life decisions are not taken one at a time, but are part of young adult's general conception of future developments in different life domains (Liefbroer, 1999). Various authors have referred to this reasoning in such different terms as 'strategic life-planning' (Giddens, 1991), 'biographical strategies'
(Buchmann, 1989), 'life strategies' (Ni Bhrolchain, 1993), or 'family strategies' (see Bosveld, this Volume).
Reproductive behaviour has
become more dependent on personal experiences in the present as well as in the past - on the personal 'biography' so to speak - than on traditional societal rules and familial circumstances. Actual and future fertility behaviour is ever more determined by events in the personal life cycle, by the nature, timing, sequence and duration of earlier stages in the life course and by the reproductive events that already did or did not yet take place during these stages. Experiences in the life cycle pertain to relationships, marriage, education, profession, parenthood, pregnancy, etc. Future prospects in any of these domains can determine future fertility behaviour. Experiences in turn may influence the actual perceptions and values of people. They shape attitudes, preferences, and intentions and thus determine the (im)probability of particular behavioural outcomes (Cliquet et al., 1992). The theoretical frame we use is based on the hypothesis of a reciprocal relationship between attitudinal and behavioural variables. The underlying assumption here is that, on the one hand, opinions, preferences and intentions influence how many children are taken and, on the other, the number of children taken influences those very preferences and intentions.
D. DATA AND METHODS
In this study the FFS Standard Recode Files of nine countries are being used: three Western European, two Nordic, two Central European and two Southern European. The countries compared are: Austria, Belgium (Flanders), Finland, France, Hungary, Italy, Poland, Spain and Sweden.
Since childbearing decisions are
directly within women's control, the focus will be on women only. In view of the core question in the analysis, i.e. the gap between desired and achieved fertility, the research population is restricted to all females aged 30 to 43 years. The
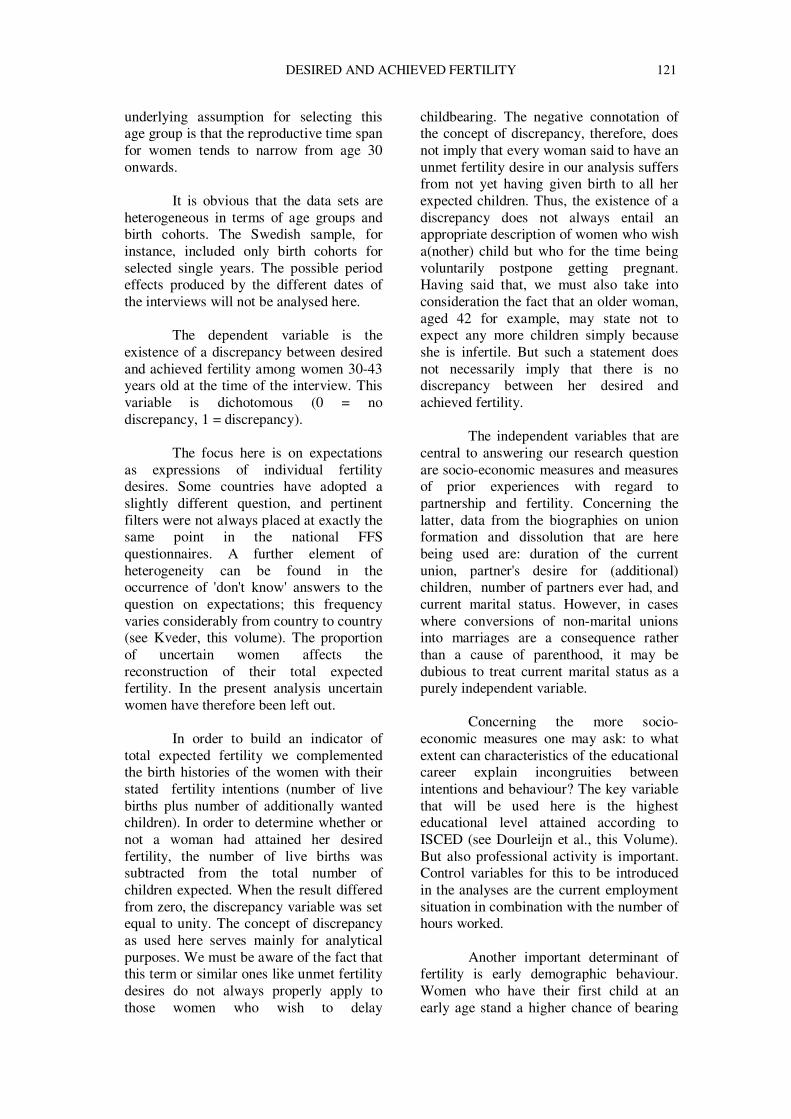
DESIRED AND ACHIEVED FERTILITY 121
underlying assumption for selecting this age group is that the reproductive time span for women tends to narrow from age 30 onwards.
It is obvious that the data sets are
heterogeneous in terms of age groups and birth cohorts. The Swedish sample, for instance, included only birth cohorts for selected single years. The possible period effects produced by the different dates of the interviews will not be analysed here.
The dependent variable is the
existence of a discrepancy between desired and achieved fertility among women 30-43 years old at the time of the interview. This variable is dichotomous (0 = no discrepancy, 1 = discrepancy).
The focus here is on expectations
as expressions of individual fertility desires. Some countries have adopted a slightly different question, and pertinent filters were not always placed at exactly the same point in the national FFS questionnaires. A further element of heterogeneity can be found in the occurrence of 'don't know' answers to the question on expectations; this frequency varies considerably from country to country (see Kveder, this volume). The proportion of uncertain women affects the reconstruction of their total expected fertility. In the present analysis uncertain women have therefore been left out.
In order to build an indicator of
total expected fertility we complemented the birth histories of the women with their stated fertility intentions (number of live births plus number of additionally wanted children). In order to determine whether or not a woman had attained her desired fertility, the number of live births was subtracted from the total number of children expected. When the result differed from zero, the discrepancy variable was set equal to unity. The concept of discrepancy as used here serves mainly for analytical purposes. We must be aware of the fact that this term or similar ones like unmet fertility desires do not always properly apply to those women who wish to delay
childbearing. The negative connotation of the concept of discrepancy, therefore, does not imply that every woman said to have an unmet fertility desire in our analysis suffers from not yet having given birth to all her expected children. Thus, the existence of a discrepancy does not always entail an appropriate description of women who wish a(nother) child but who for the time being voluntarily postpone getting pregnant. Having said that, we must also take into consideration the fact that an older woman, aged 42 for example, may state not to expect any more children simply because she is infertile. But such a statement does not necessarily imply that there is no discrepancy between her desired and achieved fertility.
The independent variables that are
central to answering our research question are socio-economic measures and measures of prior experiences with regard to partnership and fertility. Concerning the latter, data from the biographies on union formation and dissolution that are here being used are: duration of the current union, partner's desire for (additional) children, number of partners ever had, and current marital status. However, in cases where conversions of non-marital unions into marriages are a consequence rather than a cause of parenthood, it may be dubious to treat current marital status as a purely independent variable.
Concerning the more socio-
economic measures one may ask: to what extent can characteristics of the educational career explain incongruities between intentions and behaviour? The key variable that will be used here is the highest educational level attained according to ISCED (see Dourleijn et al., this Volume). But also professional activity is important. Control variables for this to be introduced in the analyses are the current employment situation in combination with the number of hours worked.
Another important determinant of
fertility is early demographic behaviour. Women who have their first child at an early age stand a higher chance of bearing
122 FERTILITY AND PARTNERSHIP IN EUROPE
more. This relationship has been established in numerous empirical studies: the younger a woman is at the first time of becoming a mother, the younger she is likely to be at the birth of any subsequent children. Variables pertaining to prior childbearing (OR/ childbearing experiences) that will be introduced are: age at first birth and whether or not the woman has ever experienced a miscarriage, stillbirth or abortion. The rationale for the latter is of course that many such pregnancies may prevent her from achieving her desired family size.
Finally, a number of other factors
are introduced into the analyses as continuous control variables. These are age of the respondent and her number of live births at the time of the interview.
Ideational factors will not be
included, although their impact on fertility is supposedly strong. For instance, quite a few studies have shown that religiousness exerts a positive effect on fertility. However, the FFS data pertaining to this variable do lack operational standardisation (Callens, 1999) and will, therefore, not be used here.
A single-level logistic regression model is used in order to assess the relationship between the response variable (fertility discrepancy) and women's characteristics in each of the nine countries. In order to evaluate the relative impact of the various factors on the probability of having fewer children than desired, we estimated odds ratios from the main effects models, for each country separately.
E. DISCUSSION
Figure 8.1 shows the observed difference between ideal, desired and actual number of children for all women, by age group, in all nine countries, while Table 8.1 gives a numeric overview of the prevalence and size of the discrepancy between desired and actual number of children.
The number of children can be
assumed to be almost complete for those women who are at the end of their thirties
or in their early forties at the time of the interview. When observed at the end of their childbearing years, the expected number should correspond closely to their final reproduction. However, as Figure 8.1 and Table 8.1 illustrate, in many countries this correspondence is not always that close.
Thus, the hypothesis that women
eventually have fewer children than desired is supported: their desired number of children is in all countries higher than their final number. Furthermore, except for the younger cohorts in Sweden, the average ideal family size is generally a little higher than the total number desired or expected. It is striking how similar ideal family sizes are across countries and age groups. It is only in the Scandinavian countries - Finland in particular - that ideal numbers tend to be somewhat higher.
While ideal family size remains
very constant over the different age groups, desired or expected family size tends to fluctuate much more. The gap between desired and achieved fertility narrows with age, but it is fully closed in only three out of the nine countries, and then only for the oldest birth cohorts under observation: those born in 1941-45 in France, those in 1942-46 in Poland, and those in 1946-55 in Spain. It may be assumed that these older women started their reproductive career before or at the beginning of the contraceptive revolution. They may therefore still have experienced one or more unwanted births due to unmet family planning needs (Klijzing, 2000). Another pattern to be observed is that respondents in Finland, Sweden, Poland and Hungary seem to start closing the gap at an earlier point in their reproductive cycle than respondents in Austria, Belgium, Italy, Spain and France. At least this is the general picture we get from the cross-sectional data in Figure 8.1.
Furthermore, the Nordic region
appears to be the region with the highest desired number of children. At the same time, this is also the region with the highest fertility levels recorded in Europe around
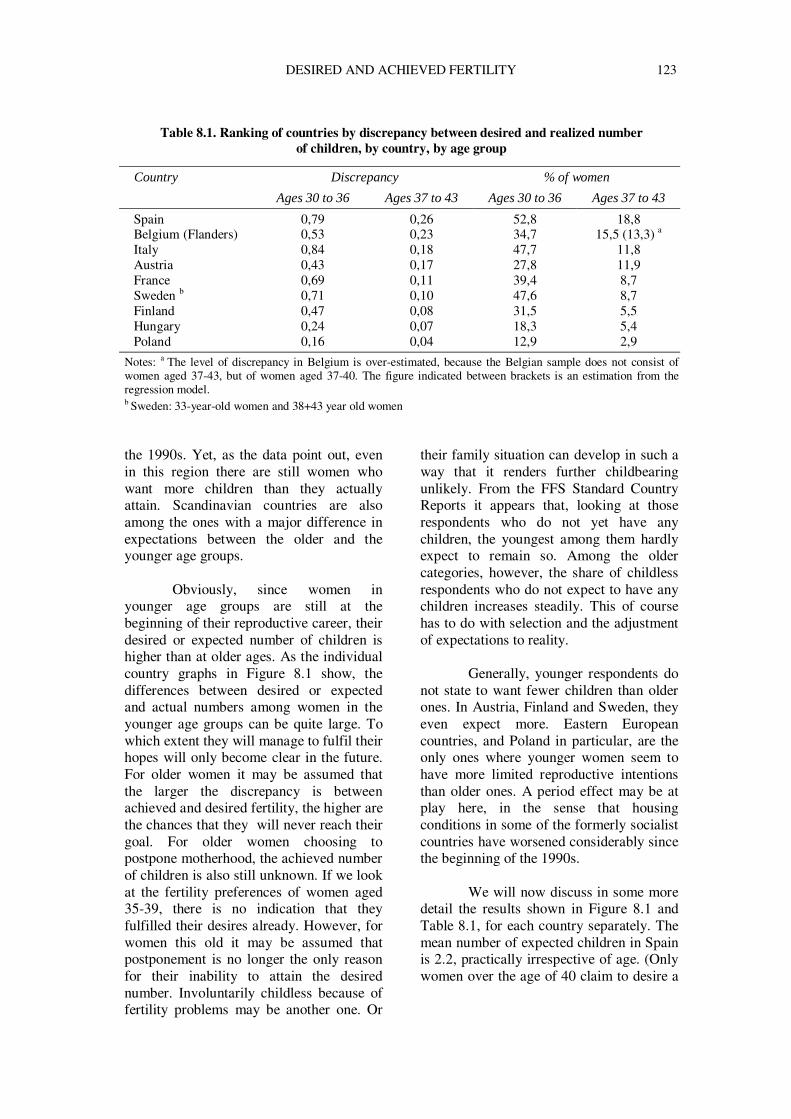
DESIRED AND ACHIEVED FERTILITY 123
Table 8.1. Ranking of countries by discrepancy between desired and realized number
of children, by country, by age group
Country Discrepancy % of women
Ages 30 to 36 Ages 37 to 43 Ages 30 to 36 Ages 37 to 43
Spain 0,79 0,26 52,8 18,8 Belgium (Flanders) 0,53 0,23 34,7 15,5 (13,3) a Italy 0,84 0,18 47,7 11,8 Austria 0,43 0,17 27,8 11,9 France 0,69 0,11 39,4 8,7 Sweden b 0,71 0,10 47,6 8,7 Finland 0,47 0,08 31,5 5,5 Hungary 0,24 0,07 18,3 5,4 Poland 0,16 0,04 12,9 2,9
Notes: a The level of discrepancy in Belgium is over-estimated, because the Belgian sample does not consist of women aged 37-43, but of women aged 37-40. The figure indicated between brackets is an estimation from the regression model. b Sweden: 33-year-old women and 38+43 year old women
the 1990s. Yet, as the data point out, even in this region there are still women who want more children than they actually attain. Scandinavian countries are also among the ones with a major difference in expectations between the older and the younger age groups.
Obviously, since women in
younger age groups are still at the beginning of their reproductive career, their desired or expected number of children is higher than at older ages. As the individual country graphs in Figure 8.1 show, the differences between desired or expected and actual numbers among women in the younger age groups can be quite large. To which extent they will manage to fulfil their hopes will only become clear in the future. For older women it may be assumed that the larger the discrepancy is between achieved and desired fertility, the higher are the chances that they will never reach their goal. For older women choosing to postpone motherhood, the achieved number of children is also still unknown. If we look at the fertility preferences of women aged 35-39, there is no indication that they fulfilled their desires already. However, for women this old it may be assumed that postponement is no longer the only reason for their inability to attain the desired number. Involuntarily childless because of fertility problems may be another one. Or
their family situation can develop in such a way that it renders further childbearing unlikely. From the FFS Standard Country Reports it appears that, looking at those respondents who do not yet have any children, the youngest among them hardly expect to remain so. Among the older categories, however, the share of childless respondents who do not expect to have any children increases steadily. This of course has to do with selection and the adjustment of expectations to reality.
Generally, younger respondents do
not state to want fewer children than older ones. In Austria, Finland and Sweden, they even expect more. Eastern European countries, and Poland in particular, are the only ones where younger women seem to have more limited reproductive intentions than older ones. A period effect may be at play here, in the sense that housing conditions in some of the formerly socialist countries have worsened considerably since the beginning of the 1990s.
We will now discuss in some more
detail the results shown in Figure 8.1 and Table 8.1, for each country separately. The mean number of expected children in Spain is 2.2, practically irrespective of age. (Only women over the age of 40 claim to desire a
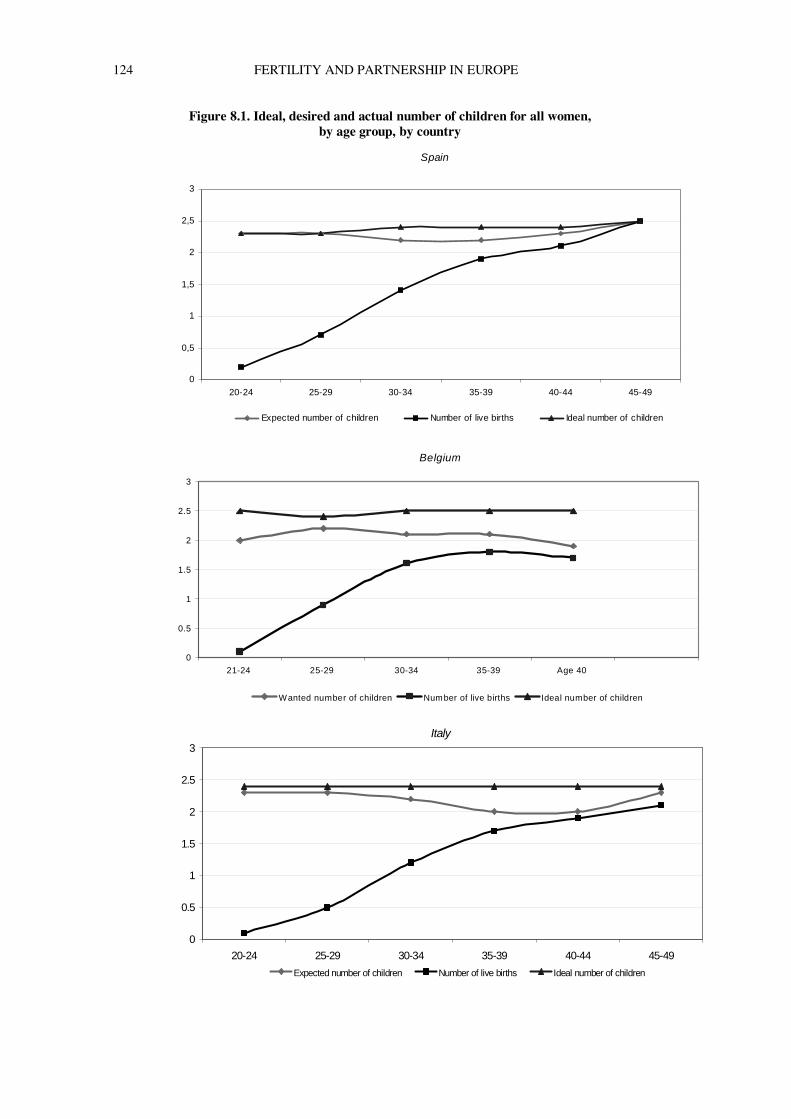
124 FERTILITY AND PARTNERSHIP IN EUROPE
Figure 8.1. Ideal, desired and actual number of children for all women, by age group, by country
Spain
0
0,5
1
1,5
2
2,5
3
20-24 25-29 30-34 35-39 40-44 45-49
Expected number of children Number of live births Ideal number of children
Belgium
0
0.5
1
1.5
2
2.5
3
21-24 25-29 30-34 35-39 Age 40
Wanted number of children Number of live births Ideal number of children
Italy
0
0.5
1
1.5
2
2.5
3
20-24 25-29 30-34 35-39 40-44 45-49
Expected number of children Number of live births Ideal number of children
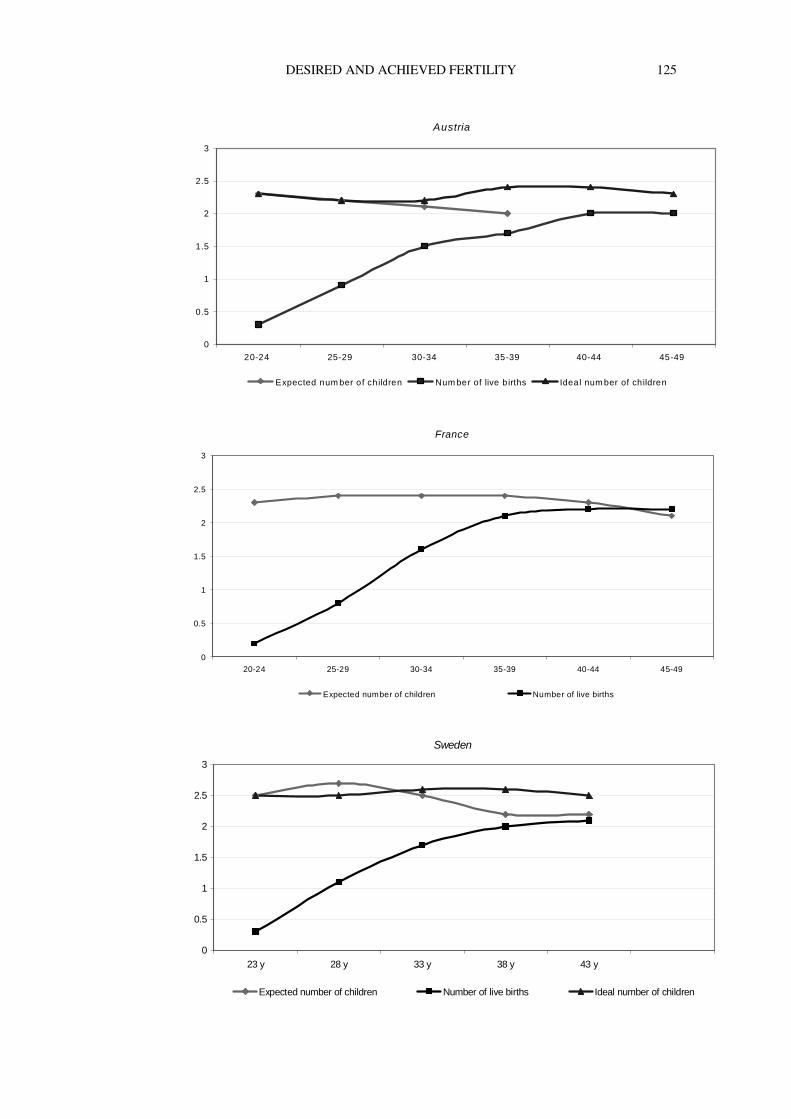
DESIRED AND ACHIEVED FERTILITY 125
Austria
0
0.5
1
1.5
2
2.5
3
20-24 25-29 30-34 35-39 40-44 45-49
Expected num ber of children Num ber of live b irths Ideal num ber of children
France
0
0.5
1
1.5
2
2.5
3
20-24 25-29 30-34 35-39 40-44 45-49
Expected number of children Number of live births
Sweden
0
0.5
1
1.5
2
2.5
3
23 y 28 y 33 y 38 y 43 y
Expected number of children Number of live births Ideal number of children
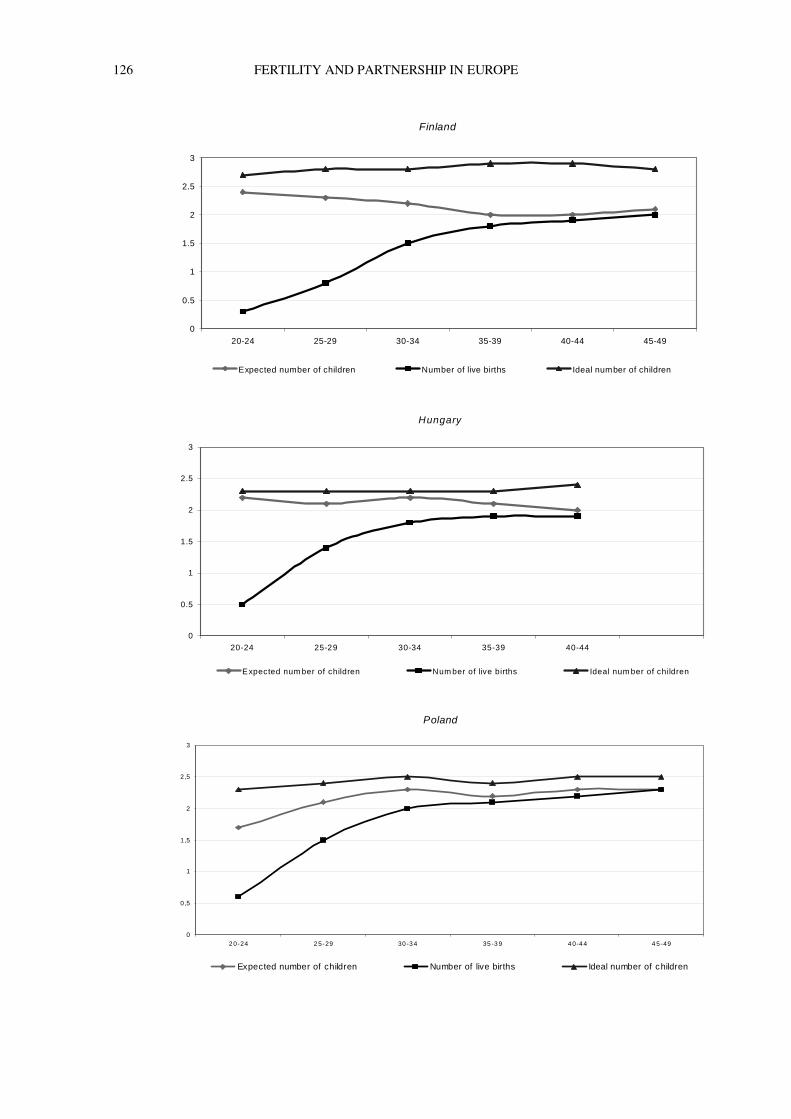
126 FERTILITY AND PARTNERSHIP IN EUROPE
Finland
0
0.5
1
1.5
2
2.5
3
20-24 25-29 30-34 35-39 40-44 45-49
Expected number of children Number of live births Ideal number of children
Hungary
0
0.5
1
1.5
2
2.5
3
20-24 25-29 30-34 35-39 40-44
Expected num ber of children Num ber of live births Ideal num ber of children
Poland
0
0 ,5
1
1 ,5
2
2 ,5
3
2 0-24 2 5-29 30 -3 4 35 -3 9 4 0-4 4 4 5 -49
Expected number of children Number of live births Ideal number of children
DESIRED AND ACHIEVED FERTILITY 127
slightly larger family.) Spain has the highest percentage of women with an unfulfilled fertility desire: 53 per cent among those aged 30-36 and 19 per cent among the 37-43 years old. As we have seen in Figure 8.1, only women in the oldest age group (45-49) have achieved a family size that corresponds to their desires. But the gap widens sharply and fast for younger women.
In Flanders the phrasing of the
question on fertility preferences was: what number of children do you want? It seems reasonable to believe that there should not be any noticeable difference between numbers expected and numbers wanted, although when using the more optimistic term 'want' the result may turn out to be a little higher. The average wanted family size for the whole group of women is 2.0 children. The youngest women score slightly below this overall average, but differences between age groups are not pronounced. There is a discrepancy of 0.23 children for women over the age of 37. Of them, an estimated 13 per cent experience a gap between desired and achieved fertility.
The low average parity in Italy can
be explained by a very late starting pattern in combination with a very long waiting period for a second (third) child after the arrival of a first (second) child (Schoenmaeckers and Lodewijckx, 1999). Consequently, the percentage of childless women is quite high and among women with children it is the one-child family that dominates. Almost half of the women aged 30-36 have an unfulfilled fertility desire. Moreover, 12 per cent of the women aged 37+ state to experience a gap between desire and attainment.
Although the timing pattern of
fertility in Austria is quite young (Schoenmaeckers and Lodewijckx, 1999), still 12 per cent of the women over age 37 experience a difference between desired and achieved fertility.
In France, 9 per cent of the women
this old say that their fertility desires are as yet unfulfilled.
In the Swedish survey the corresponding question was: how many children do you believe that you will have? This alternative phrasing probably gives a more realistic estimate of the ultimately expected number of children. As we have seen before, there are important age differentials in this expected number of children. The highest numbers are found among women 28 years of age at the time of the interview, whereas the lowest among the 43 years old. Although the timing pattern of fertility is not particularly young in Sweden, parities are relatively high. This can be attributed among other things to the short intervals between subsequent births. Despite the relative high average parity, still 9 per cent of the 38 and 43 years old Swedish women together state to have unfulfilled fertility desires.
The question used in the Finnish
questionnaire about the future number of children was phrased as follows: how many children do you hope to have? Younger women clearly hope to have more children: 2.4 compared to 2.0 among older women (Figure 8.1). In Finland only 5 per cent of the women over the age of 37 have an unfulfilled wish for children.
In Hungary, the average number of
children ultimately wanted is 2.1 for the female sample as a whole. A family of two children is the most common preference for both older and younger age groups, and this also is the number achieved most frequently (Kamarás, 1999). Women aged 25-29 state to want slightly fewer children than older women. All in all, only 5 per cent of the women older than 37 have not been able to fulfil their fertility desires.
Finally, in Poland, women
ultimately expect to have an average of 2.2 children overall, but this figure declines sharply among the youngest who expect an average of no more than 1.7 children. Only 3 per cent of the women older than 37 experience an unfulfilled fertility desire.
From the application of logistic
models we will now assess the effect of a set of variables on the probability to
128 FERTILITY AND PARTNERSHIP IN EUROPE
experience a gap between desired and achieved fertility. Assuming that considerations regarding achieving fertility desires come into play as from age 30 onwards, the regression analyses are performed for women aged between 30 and 43 years. Table 8.2 shows the odds ratios estimated separately for each country. An initial comparison shows that the complexity of the models in terms of the number of significant parameters is greatest in countries with the highest discrepancy levels (Spain, Italy, Belgium). On the whole, however, the variables play the same role in all countries considered. Apart from a few exceptions, effects - when significant - point in the same direction. Basically, the country models differ only in the number of significant effects, rather than in their direction. Of course, to begin with, there is a strong age effect. As age rises, so does the probability of closing the gap between desired and achieved fertility. The same is even truer for the number of children already born. But respondent's age and this number were mostly introduced for statistical reasons. We will now turn to the more substantive variables.
1. Education
Educational expansion has brought more people into third-level education. This expansion along with the increase in the compulsory school age has affected young adults in the various countries in different ways. According to OECD (1995) data for the early 1990s, third-level education was reached by 30 per cent of the population in Belgium, 14 in Poland, and 10 in Austria and Italy.
The timing patterns of fertility
differ strongly across countries. As is well documented, these patterns are strongly influenced by the educational level. FFS data show indeed for different countries a substantially later timing among the highest educated women, although there are important inter-country differences within each educational level (Schoenmaeckers and Lodewijckx, 1999). Thus, educational level does have an impact on the timing of fertility. The best-educated women tend to
postpone motherhood, they generally have fewer children at the time of the interview, and, consequently, more catching-up to do thereafter. The general pattern observed is that of a strong negative effect of high education at the youngest ages. At later ages this negative effect either disappears or inverts into a positive one reflecting a catching-up effect. As such one can conclude that a high educational attainment induces a temporary postponement of the family formation process (Corijn, 1999).
In view of the relative homogeneity
in the final number of children desired, the number of additionally wanted children that higher educated women expect to have in the future is considerably larger. This is partly due to the fact that women enrolled in higher education are as a rule concentrated in the younger age groups where reproduction is still incomplete. But it may also indicate that the opportunity costs of having children are greater for women with higher professional qualifications, as they are likely to be better positioned in the labour market. The relatively high number of children additionally desired by the higher educated is also a reflection of their postponement. Hence, education which in most surveys proves to have a substantial effect on fertility seems to carry greater weight in terms of women's actual reproductive behaviour than in terms of their preferences, which appear to be more or less homogeneous.
From our analysis it appears that
the level of education has a significant impact on the probability of non-realized desires in Belgium, Italy, France, Finland and Hungary. In Sweden, Spain, Poland and Austria the effect of the educational level disappears after controlling for a number of other relevant factors (age at interview, age at first birth). It can be assumed that higher educated women adapt their desires over the life cycle more than less educated women do. In particular, they may scale down their initial desires. In Poland, for instance, except among women aged 20-24, the average expected ultimate family size systematically declines with
DESIRED AND ACHIEVED FERTILITY 129
rising education (Holzer and Kowalska, 1997).
2. Labour force participation
Many studies have empirically researched the relationship between female labour force participation and fertility. These studies invariably paint a picture of a negative relationship between the two: working women have fewer children than women who do not undertake paid work (Callens, 1999).
With respect to female labour force participation rates, there still is a wide gap between countries. Countries in the Nordic region have high proportions of working women. Female activity rates in several of them are close to or greater than 90 per cent of male rates. The former socialist countries have always had high shares of paid labour among women, while Southern European countries still have comparably low shares. Western European countries rank somewhere in-between, although in much of this region female rates exceeding 85 per cent of male rates are not that uncommon for the population under age 30 (Lesthaeghe and Willems, 1999).
As Table 8.2 results demonstrate, whether or not a woman is employed and how much she is working has a significant impact on the probability of experiencing a gap between desired and achieved fertility in Spain, Italy, Poland, Austria and Sweden. But these five countries divide into two groups.
In Spain, Italy and Poland, on the one hand, it are part-time working women who face the highest risk of experiencing a gap between their wanted and actual family size. The results for these countries indicate that when women are working up to 34 hours there is a gap, but when they work 35+ hours a week the gap decreases. Part-time work in Italy is not at all connected
with problems of reconciling family responsibilities and paid work, nor is it seen as a tool for redefining the division of work and parental responsibilities between men and women. The political debate rather tends to consider the issue in terms of making working hours more flexible and of reducing them to part-time work as a measure to combat unemployment (Palomba, personal communication). It can be safely assumed that Italian women who work longer hours have better paid and protected jobs. Part-time jobs are often precarious and less qualified. When women have access to more gratifying jobs, they will have a lower propensity to abandon them and a higher propensity to adapt their personal fertility desires to their job situation. Especially the Italian public sector where part-time work is less common than in the private sector is quite generous towards working women (Palomba, 1995). Thus, precarious jobs, insecurity at the labour market, a high risk of unemployment may force Southern European women to try and keep their job at any price.
In Austria and Sweden, on the other hand, female employment has a different effect on unfulfilled fertility. In these countries it are the full-time working women who face the highest risk of unfulfilled fertility desires, although this risk is much more pronounced in Austria. At the same time, however, also non-working women in these two countries face a higher risk than women working part-time. Swedish women have good access to qualified part-time jobs, which may be used by them as an instrument for reconciliating work and family. In other words, if they do not expect to have any more children they may switch to part-time work in order to raise their children already born. If they do expect to have more children, however, they may continue to work full-time without themselves considering this as necessarily detrimental to their long-term fertility plans.
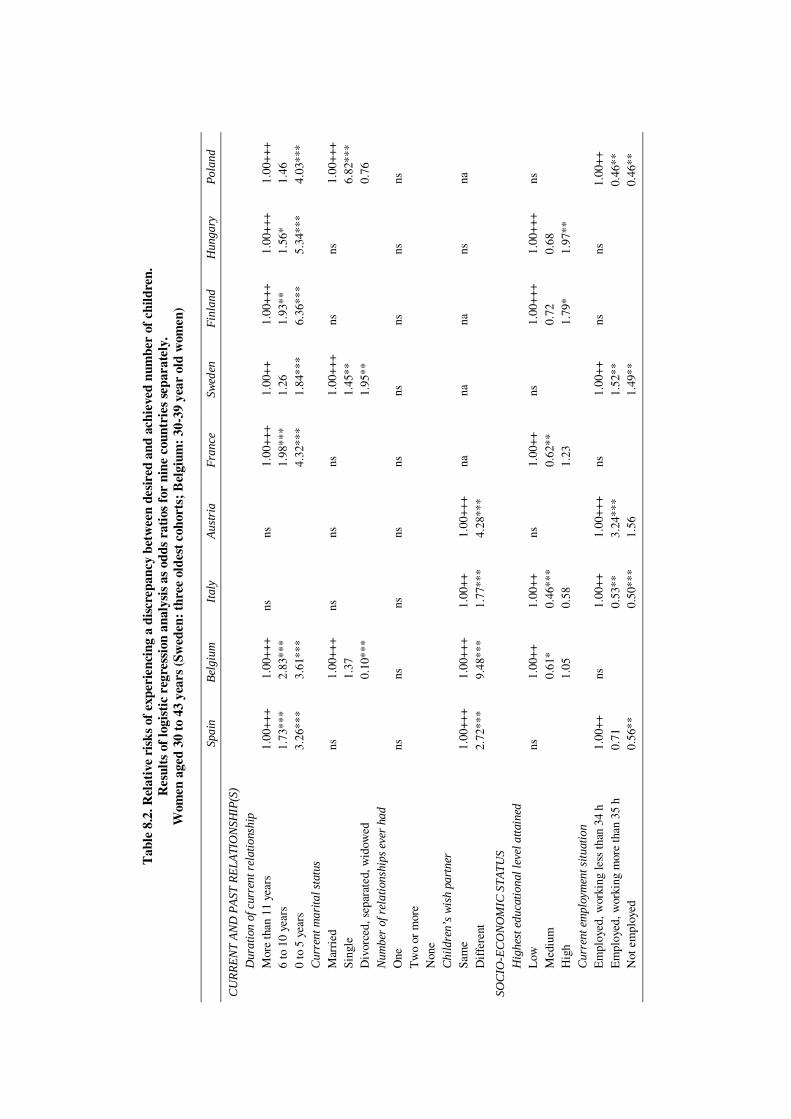
T
able
8.2
. Rel
ativ
e ri
sks
of e
xper
ienc
ing
a di
scre
panc
y be
twee
n de
sire
d an
d ac
hiev
ed n
umbe
r of
chi
ldre
n.
Res
ults
of
logi
stic
reg
ress
ion
anal
ysis
as
odds
rat
ios
for
nine
cou
ntri
es s
epar
atel
y.
Wom
en a
ged
30 t
o 43
yea
rs (S
wed
en: t
hree
old
est c
ohor
ts; B
elgi
um:
30-3
9 ye
ar o
ld w
omen
)
Sp
ain
Bel
gium
It
aly
Aus
tria
F
ranc
e Sw
eden
F
inla
nd
Hun
gary
P
olan
d
CU
RR
EN
T A
ND
PA
ST R
ELA
TIO
NSH
IP(S
)
Dur
atio
n of
cur
rent
rel
atio
nshi
p
M
ore
than
11
year
s 1.
00++
+ 1.
00++
+ ns
ns
1.
00++
+ 1.
00++
1.
00++
+ 1.
00++
+ 1.
00++
+ 6
to 1
0 ye
ars
1.73
***
2.83
***
1.98
***
1.26
1.
93**
1.
56*
1.46
0
to 5
yea
rs
3.26
***
3.61
***
4.32
***
1.84
***
6.36
***
5.34
***
4.03
***
Cur
rent
mar
ital
sta
tus
Mar
ried
ns
1.
00++
+ ns
ns
ns
1.
00++
+ ns
ns
1.
00++
+ Si
ngle
1.37
1.45
**
6.82
***
Div
orce
d, s
epar
ated
, wid
owed
0.10
***
1.
95**
0.
76
Num
ber
of r
elat
ions
hips
eve
r ha
d
One
ns
ns
ns
ns
ns
ns
ns
ns
ns
T
wo
or m
ore
N
one
C
hild
ren’
s w
ish
part
ner
Sa
me
1.
00++
+ 1.
00++
+ 1.
00++
1.
00++
+ na
na
na
ns
na
D
iffe
rent
2.
72**
* 9.
48**
* 1.
77**
* 4.
28**
*
SOC
IO-E
CO
NO
MIC
ST
AT
US
H
ighe
st e
duca
tion
al l
evel
att
aine
d
Low
ns
1.
00++
1.
00++
ns
1.
00++
ns
1.
00++
+ 1.
00++
+ ns
M
ediu
m
0.
61*
0.46
***
0.
62**
0.72
0.
68
H
igh
1.
05
0.58
1.23
1.79
* 1.
97**
Cur
rent
em
ploy
men
t sit
uati
on
E
mpl
oyed
, wor
king
less
than
34
h 1.
00++
ns
1.
00++
1.
00++
+ ns
1.
00++
ns
ns
1.
00++
E
mpl
oyed
, wor
king
mor
e th
an 3
5 h
0.71
0.53
**
3.24
***
1.
52**
0.
46**
N
ot e
mpl
oyed
0.
56**
0.50
***
1.56
1.49
**
0.46
**
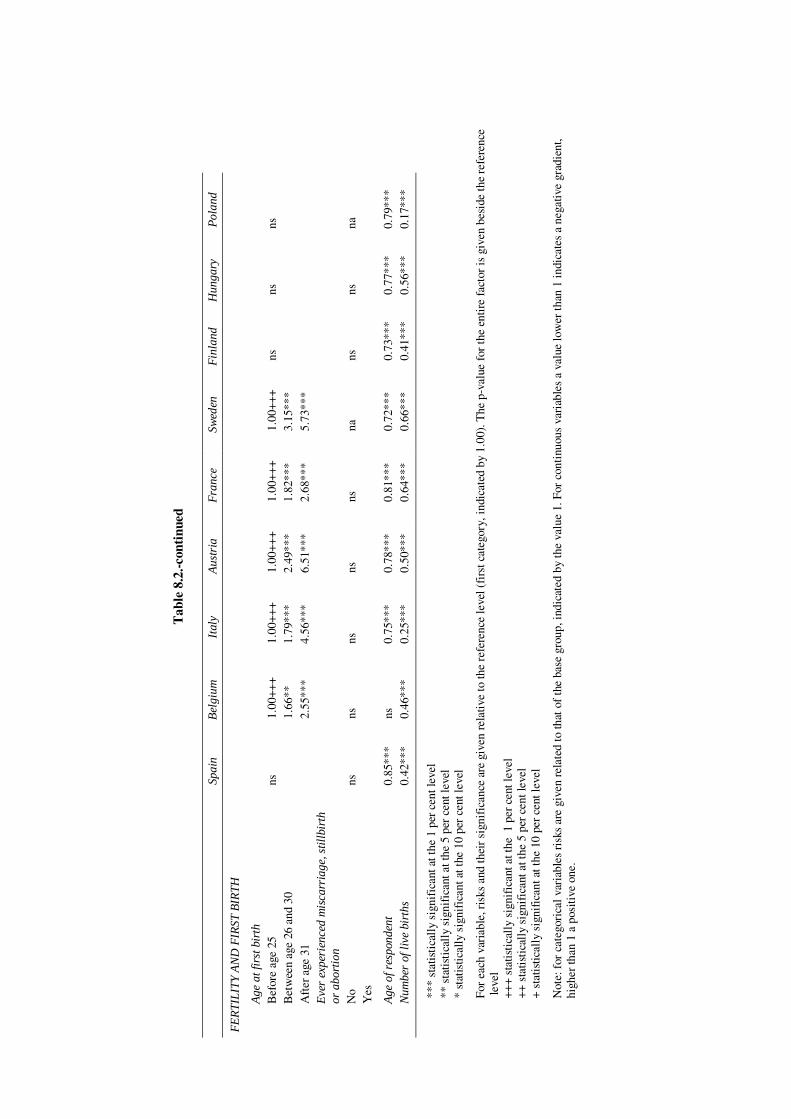
T
able
8.2
.-con
tinu
ed
Sp
ain
Bel
gium
It
aly
Aus
tria
F
ranc
e Sw
eden
F
inla
nd
Hun
gary
P
olan
d
FE
RT
ILIT
Y A
ND
FIR
ST B
IRT
H
Age
at f
irst
bir
th
B
efor
e ag
e 25
ns
1.
00++
+ 1.
00++
+ 1.
00++
+ 1.
00++
+ 1.
00++
+ ns
ns
ns
B
etw
een
age
26 a
nd 3
0
1.66
**
1.79
***
2.49
***
1.82
***
3.15
***
A
fter
age
31
2.
55**
* 4.
56**
* 6.
51**
* 2.
68**
* 5.
73**
*
Eve
r ex
peri
ence
d m
isca
rria
ge, s
tillb
irth
or
abo
rtio
n
No
ns
ns
ns
ns
ns
na
ns
ns
na
Yes
Age
of r
espo
nden
t 0.
85**
* ns
0.
75**
* 0.
78**
* 0.
81**
* 0.
72**
* 0.
73**
* 0.
77**
* 0.
79**
* N
umbe
r of
live
bir
ths
0.42
***
0.46
***
0.25
***
0.50
***
0.64
***
0.66
***
0.41
***
0.56
***
0.17
***
***
stat
isti
call
y si
gnif
ican
t at t
he 1
per
cen
t lev
el
** s
tatis
tica
lly
sign
ific
ant a
t the
5 p
er c
ent l
evel
*
stat
istic
ally
sig
nifi
cant
at t
he 1
0 pe
r ce
nt le
vel
For
each
var
iabl
e, r
isks
and
thei
r si
gnif
ican
ce a
re g
iven
rel
ativ
e to
the
refe
renc
e le
vel (
firs
t cat
egor
y, in
dica
ted
by 1
.00)
. The
p-v
alue
for
the
entir
e fa
ctor
is g
iven
bes
ide
the
refe
renc
e le
vel
+++
stat
isti
call
y si
gnif
ican
t at t
he 1
per
cen
t lev
el
++ s
tatis
tica
lly
sign
ific
ant a
t the
5 p
er c
ent l
evel
+
stat
istic
ally
sig
nifi
cant
at t
he 1
0 pe
r ce
nt le
vel
Not
e: f
or c
ateg
oric
al v
aria
bles
ris
ks a
re g
iven
rel
ated
to th
at o
f th
e ba
se g
roup
, ind
icat
ed b
y th
e va
lue
1. F
or c
onti
nuou
s va
riab
les
a va
lue
low
er th
an 1
indi
cate
s a
nega
tive
grad
ient
, hi
gher
than
1 a
pos
itive
one
.
132 FERTILITY AND PARTNERSHIP IN EUROPE
3. Partnership and fertility
The duration of the current partnership has a negative impact on the risk of experiencing a discrepancy in all countries except Italy and Austria. That is, the longer the partnership has lasted, the less likely it will be that there is a discrepancy. Of course, duration of the partnership is a direct indicator of the time that has been available for having the number of children as desired. This effect remains after controlling for age. Duration of the current partnership may also be an indirect indicator of stability, quality and degree of satisfaction with the current relationship.
The marital status has a significant
effect in Belgium and Sweden, and very distinctly so in Poland. Single women face a higher risk for unmet fertility desires than married women. In Poland this risk is almost seven times higher.
The degree of compatibility of the
number of children desired by the woman with her partner's is significant in all the countries where data on this variable are available, except Hungary. When the partner prefers a different number of children, the respondent's risk of unfulfilled fertility desires increases sharply.
Age at first birth is significant in
five of the nine countries: the older the woman when her first child was born, the higher the risk of unmet desires at the time of the interview. This effect is very strong in Austria, Italy and Sweden, but somewhat less in France and Belgium.
Finally, whether or not a woman
has ever had an abortion, miscarriage or stillbirth does not play any role in any of the countries for which this variable is available. The same is true for the number of relationships ever had.
F. THE MACRO-LEVEL CONTEXT
1. Family policy and fertility
The differences in individual-level effects discussed above suggest that leading a
modern lifestyle and raising children are more compatible in some countries than in others. But it should be kept in mind that these effects can in turn be affected by contextual variables.
Despite a growing convergence
between regions, considerable differences between and within them remain. For instance, countries differ markedly in their overall levels of social protection provided for families. They also differ in legislation with regard to family formation and dissolution: in some countries divorce, for example, is hardly facilitated. Thus, in their attempts to fulfil their fertility desires, people in different countries may encounter different obstacles.
Women in modern society are
nowadays obliged to match their desires to a new societal norm that demands their full integration in the educational system as well as in the labour market. Either women have to adapt their wish for children to such competing activities or other constraints they may find on their way, or societal structures have to become better adapted to women's wish for children. If women do not attain the number of children they desire, the question considered here is to which extent this gap can be ascribed to a shortfall in public policies, more specifically, family and gender equality policies. Policy factors may partly explain why people prefer to postpone having children. A comparative analysis of countries differing in family policy climates should be able to shed light on the extent to which the gap between desire and reality is being reduced or widened by country-specific family policy contexts. Similar policies may, however, not always be in response to the same social contingencies. Nor will similar policies always produce the same effects in different socio-economic and political settings. In some configurations, policy environments may be conducive to family building or to the development of particular family forms, in others they may not (Hantrais, 1997). Also, many of the measures broadly defined as social policy may have unintended or indirect effects on the welfare of families
DESIRED AND ACHIEVED FERTILITY 133
and possibly on the desire of parents to have more children.
Hence, it is clear that the economic
and cultural context of a country needs to be taken into consideration. Regardless of possible emancipation motives, the economic welfare of a country is an indirect determinant of women's necessity for performing professional labour. This economic necessity as observed at the individual level may play a crucial role in fertility. For Spain and Italy, for example, it has been shown that the labour force situation of women has a significant effect on unmet fertility desires (Table 8.2). Women employed in often lower-grade, part-time jobs in these countries may need to work in order to reach a reasonable standard of living. This points to the fact that external, mainly economic, constraints may exist which limit the fertility of women who might otherwise want to have more children (Ruokolainen and Notkola, 2001).
On the other hand, the extent to
which policy commitments actually affect behaviour remains difficult to assess. Evidence for a direct causal impact on demographic behaviour, and for the diffusion of policies between countries, is as yet inconclusive. Nonetheless, at the individual level social policy measures can be decisive in converting uncertain intentions into certain actions. At the aggregate level, sustained uncertainty in childbearing intentions can lead to either a rise, drop or no change in fertility. Which one of these potential outcomes in the end materialises is probably determined by relevant period-specific factors. It seems highly probable that the actual fertility of many uncertain women would be affected by social-political benefits directed to families with small children.
To a limited extent, the FFS
provides data on the perceptions of desirable family policy options which possibly have a fertility enhancing effectii. For example, as Ruokolainen and Notkola (2001) have shown for Finland, women who think that the public aid given to
families with small children is sufficient say to intend to have a third child more than twice as frequently as women who consider the level of family support as totally insufficient. The Finnish results also indicate that women who consider the public aid as insufficient say to stop childbearing at a much lower than desired parity compared to women who consider it sufficient. The impact of family support on the (un)certainty of intentions is even more striking: the more sufficient a woman views the level of family support, the more certain she is about her intentions.
However, perceived governmental
responsibilities need to be interpreted in terms of an evaluation of priorities as well as of failed promises. For example, the Population and Policy Acceptance (PPA) surveys have shown that for providing opportunities for women to combine a job outside the home with raising children, governments are held much more responsible in countries with relatively low maternity benefits and high female unemployment rates, such as in Spain and Italy. On the other hand, respondents in Belgium - a country where the combination of parenthood with work has received full attention by policy makers and where female unemployment rates are lower - ascribe much less responsibility to their government in this field (Van Peer, 1998).
2. Effects of policy measures directly
targeted at families
Child benefits and parental leave arrangements are measures that are directly targeted at families with children. Countries differ greatly in the extent to which these measures are actually provided.
The total amount of child benefits
usually depends on the number of eligible children. In Spain, Italy and Hungary the amount of benefits that households receive to meet the costs of raising children and caring for other members is far below the European average. Clearly above it are family benefits granted in Belgium and Austria. Belgium was the first country to introduce compulsory family allowances,
134 FERTILITY AND PARTNERSHIP IN EUROPE
and it still has one of the highest allowance rates in the world.
Most of the theoretical arguments
concerning family benefits have been derived from the economic theory of fertility, in its New Home Economics version, and are centred on the concept of the costs of children. The argument is: the higher the levels of cash benefits for parenthood are, the higher the demand for children will be, since these benefits reduce the direct and opportunity costs of children. Attempts by demographers to empirically test the assumption of a possible impact of policy on demographic trends and patterns of family formation, by measuring the correlation between paid family benefits and fertility rates, have produced contradictory and inconclusive findings. For example, Gauthier and Hatzius (1997) found that direct cash benefits had significant positive effects on fertility. But others found no such effects.
We assume that parental leave
arrangements are an important means for people to fulfil their fertility desires. However, for a parent who wants to take off for a longer period of time, there is generally only very limited assistance available under current social protection systems (except in Austria and in the Nordic countries).
3. Family policy models
The nine countries under observation were selected to represent the four major regions in Europe: Northern, Southern, Western Europe, and the former socialist countries in the East. These four regions are internally characterised by common economic, cultural and political factors. We assume that in each of them there is a connection between the prevailing family policy model and the level of unmet fertility desires.
Family policies in Finland and
Sweden follow the so-called Scandinavian welfare model, where the state and municipalities have major responsibilities for the well-being of their people. Nordic
welfare states have indeed a long tradition of extensive social policies directed at the family. The share of child benefits in the disposable income ranks these countries among those with active family policies. Parental leave is well established as a measure aimed at young families.
This Nordic emphasis on family
policies which facilitate the combination of childrearing and employment - such as subsidised child care, generous parental leave programs and other forms of economic support to families with children - may help explain why Nordic women have been among the forerunners in keeping in touch with the labour market throughout their childbearing and childrearing years (Rönsen and Sundström, 1995). Female labour force participation rates in the Nordic countries are among the highest in the Western world. In 1990, 83 per cent of the Swedish women aged 16-64 years and 71 per cent of the Finnish women aged 20-64 years were in the labour force. Public policies may play a crucial role in allowing the combination of employment and parenthood. Countries with high female participation rates in the labour force are generally the ones where the discrepancy between desired and realized fertility is the lowest (see Table 8.1). Some authors consider the relatively high fertility levels in the Nordic countries as an indicator of the quality and success of the Scandinavian family and population policies (Hoem, 1993; Pinnelli, 1995).
By 1992, Sweden had for European
standards a high fertility rate. It has often been argued that this was not just because of its family benefits but because from the 1980s onwards it had introduced a whole range of measures including a series of equal opportunities agreements, to make employment and family life more compatible. Sweden has indeed a very generous family policy, and it is also quite far advanced in terms of gender equality (Bernhardt, 1991). Provision of childcare facilities began to be implemented from the beginning of the 1970s. Swedish child allowance is a universal, non-means tested benefit. From the mid-1960s employed
DESIRED AND ACHIEVED FERTILITY 135
mothers were entitled to a paid maternity leave. Parental insurance is another social benefit to which all parents are entitled. This insurance covers among other things the right to a guaranteed job after a parental leave period has been taken, and the right to financial support during the leave. Between 1968 and 1988 there have been several extensions of the period during which these entitlements apply. In the beginning of the 1990s parents were entitled to 360 days with 90 per cent income compensation. These days could be divided between both parents as they wished. For instance, parents could interrupt their leave to go back to work, and then resume leave again (Rönsen, 1999).
The results presented in Table 8.1
showed that only 9 per cent of the Swedish women aged 38 and 43 experience a discrepancy between desired and achieved fertility. But as the results of Table 8.2 have demonstrated, the number of hours actually worked increases significantly the chance of experiencing such a discrepancy. During the 1990s Sweden encountered various financial crises. Municipalities, where social services are administered and financed, had to implement large saving programs. In the beginning of the 1990s, due to budgetary cuts, there were also changes in childcare provisions. Fees for childcare places were increased, which might mean that some parents could no longer afford them, unless they both worked full-time. Although the Swedish survey held in 1992 was probably too early to capture the effects of this deterioration in the socio-economic environment, results on the number of hours worked are in line with what one would then expect to happen.
In Finland, only 5 per cent of all
women over age 37 have unmet fertility desires. Their labour force situation has no effect on the risk of experiencing a discrepancy between the desired and achieved number of children. In Finland, a maternity allowance with a right to maternity leave around the birth was established in 1964. This package was later developed into a maternity-paternity leave and a parental allowance, and the amount
of compensation as well as the length of leave were increased several times. Contrary to many other countries, Finland does not have a separate system for pre-school children, but early education is included in day-care facilities. In 1985 the Child Home Care Allowance Act was introduced. This allowance can be paid to parents of children under three who are not using municipal day-care services. Furthermore, in 1988, the parents of children under compulsory school age were given the right to shorten their working hours. Since 1993, however, the levels of almost all allowances and benefits have been lowered. As in Sweden, municipalities wanted to cut costs by reducing the number of places in day-care centres and increasing their entrance fees (European Observatory on National Family Policies, 1996).
France, Belgium and Austria
belong to the group of Western European countries with a long tradition of economic support for families. France has generous parental leave and childcare provisions. Of all women aged 20-49 in 1994, 63 per cent had a paid job (Toulemon and de Guibert-Lantoine, 1998). Among the older women aged 37-43 we found that 9 per cent experience a gap between fertility desires and achievements. Our results also showed that their labour force situation has no effect on the risk of unmet desires.
Belgium has a comprehensive
family policy which includes a range of direct transfers to families with children. Belgium not only provides a high degree of protection against extreme degradation of living conditions, it also recognises the arrival of a child as a potential risk situation that requires direct financial support. The childbearing context in Belgium, one would say, can therefore be considered as rather family-friendly. However, a considerable part - 13 per cent of the women over age 37 - still has an unmet fertility desire. Why then do we observe such a high discrepancy between desires and attainments? To begin with, family formation is only partially influenced by material well-being, and the minimum standards of welfare guaranteed by the state do not necessarily reflect the
136 FERTILITY AND PARTNERSHIP IN EUROPE
parental expectations of the majority of the population (Avramov et al., 1994). A number of structural features operate in the opposite direction, i.e., as a disincentive for fertility. Firstly, prosperity generally induces higher individual expectations and fears of relative deprivation. This was also shown by the PPA results, according to which better financial rather than work arrangements are welcomed as possible new policy measures (Van Peer and Moors, 1996). Even the total value of both child benefits and tax relieves is often insufficient to cover the minimal cost of children (European Observatory on National Family Policies, 1996). Secondly, structural obstacles to fertility can also be found in the labour domain. Within Western Europe, Belgium is one of the countries with a relatively low share of women with a paid job, which in 1990 for instance still stood at only 55 per cent (Lodewijckx, 1999). Working mothers have to look for childminders already during early infancy of their child(ren). Maternity leave is one of the shortest in Europe. Child-care provisions are far from adequate during a period when more and more young women start to participate in the labour market. State funded day-care is provided for only a minority of small children. Thus, direct financial transfers to families with children may be comparatively generous in Belgium, they alone appear insufficient to bridge the gap between desired and achieved fertility.
Austria is one of the countries with
the longest and most extensive tradition of social protection in Europe. It has, for instance, one of the most developed systems of financial support to families. The period of parental leave is quite long, and the amount granted above average. Mothers are entitled to paid parental leave for two years. Since 1991, mothers can give up all or part of their leave to the father. The family allowance is also more generous than in most other industrialised countries (Nebenführ, 1995). The first substantial cutbacks in family-related transfers were not introduced until 1995. Empirical evidence indicates that the economic support for families in Austria
through transfers in kind and cash payments is still substantial. On the other hand, a considerable portion of families live near or underneath the poverty line (European Observatory on National family Policies, 1996). About 63 per cent of all women aged 20-54 years in early 1996 were employed. Still, their labour force participation depended heavily on the number of children at home (Prinz et al., 1998). As was demonstrated in Table 8.1, a relatively high proportion - 12 per cent - of the women over age 37 declared to have unmet fertility desires. The results of Table 8.2 showed that working 35 hours a week or more implies in Austria a higher risk for unmet fertility desires than working part-time or not working. In the beginning of the 1990s, reconciliation of work and family obligations and gender equality were declared to be official goals of public policy. At the same time also the matter of pre-school childcare entered the political debate on family policy to an increasing degree. However, some scholars state that public policy in actual practice does not give much incentive to change the uneven distribution of unpaid work, or to make it easier for women with children to enter the labour market. They consider the low speed with which improvements in the provision of day-care services are achieved as an example of this. Substantial difficulties to find day-care for children pose a significant problem for mothers who wish to accept paid work (Nebenführ, 1995; European Observatory on National Family Policies, 1996). Thus, like in some other Western countries (e.g. Belgium), there are still important gaps between the economic positions of Austrian women and men. If women are to close this gap, they are likely to further delay childbearing. This may explain the relatively high proportion with an unfulfilled child wish.
Italy and Spain belong to that part
of the Mediterranean region which is traditionally characterised by rather weak public interference with the socio-economic position of families. Over the last fifteen years, however, some improvements have been made in family allowances, which were mainly aimed at alleviating the
DESIRED AND ACHIEVED FERTILITY 137
problems of large families rather than at encouraging people to have more children. On the other hand, there also has been an opposite tendency, namely, to rationalise family benefits and to reduce their scope. Compared to the rest of continental Europe, a system of income maintenance is either completely lacking in Southern Europe or it is utterly inadequate. Still, in Italy, one fact stands out: the predominance of the family unit. Even today the Italian family continues to be the institution to which the primary responsibility for meeting citizens' needs is entrusted. Italy has indeed a strong family-oriented culture, where the family remains an omnipresent point of reference in the life of each individual. Even politics and economics are organised around this point of reference (European Observatory on National Family Policies, 1996). Both from the point of view of demographic behaviour and coverage provided by social security, the situation in Italy and Spain is in many ways similar to that of other Mediterranean countries, and principally different from Central and Northern Europe. Although a process of assimilation is in progress, there is currently still a wide gap between Southern European countries and these other parts of Europe. Southern European countries are characterised by high unemployment, especially among young people, forcing them to stay in the parental home until quite late.
Italy combines one of the lowest
female labour force participation rates with one of the lowest fertility rates in Europe. Only a relatively small percentage - 42 per cent - of mothers with young children are in the labour market (Moors and Palomba, 1995). In the beginning of the 1990s, a period of maternity leave was paid at about 40 per cent of normal salary, which could last until the child was one year of age. Recently the situation has improved: female workers now receive maternity leave benefits totalling 80 per cent of their last wage. For civil servants this is raised to even 100 per cent (Palomba, personal communication). The actual cash amount of family allowances before 1988 was small, although a large percentage of the population received them (Moors and
Palomba, 1995). At that time tax allowances for the cost of children were also one of the lowest in Europe. After 1988, however, the nature of family allowances changed drastically. It was transformed from a universal to a means-tested allowance which was furthermore limited to families of (male) wage earners and pensioners. Certain categories of citizens such as unmarried women with children thus no longer qualified, even if their social and economic means were the same as those families receiving the allowance. But as it was not index-linked, the actual amount lost almost 40 per cent of its purchasing power between 1988 and the mid-1990s. Consequently, the economic burden of procreation fell almost wholly and exclusively on the parents (European Observatory on National Family Policies, 1996). This general lack of family policies in Italy was, however, partially compensated by strong family ties. Families in Italy have always functioned as 'social shock-absorbers'. But problems arose when women started to access professional training and activity. On the one hand, women's emancipation has coincided with rising costs of reproduction and welfare, with increased unemployment, and with the progressive ageing of the population. The latter has complicated the life of women in particular, because they are almost exclusively responsible for the care of the elderly. On the other hand, women's emancipation has occurred without any appreciable change in the support provided for families (European Observatory on National Family Policies, 1996). Not surprisingly then, as our results indicated, 12 per cent of the women aged 37+ and almost half of those between 30 and 36 years have unmet fertility desires.
In 1990, labour force participation
among Spanish women stood at a low 43 per cent, their unemployment at a high 24 per cent (Delgado and Castro Martín, 1999). The traditional family model composed of a working husband and housewife is still dominant in many aspects of everyday life. Participation by men in domestic tasks is very limited. These and other features of the traditional family
138 FERTILITY AND PARTNERSHIP IN EUROPE
model are also reflected in many organizational aspects of public life. Spain is the country with the highest percentage of unmet fertility desires, both among women aged 30 to 36 (53 per cent) and among older women (19 per cent). Some authors believe that low fertility in Spain is now mainly caused by the reduction in first births as a consequence of the postponement of family formation, which in turn is prompted by high youth unemployment and housing shortages (European Observatory on National Family Policies, 1996). A typical problem for working women with children is the insufficiency of the existing network of public child-care centres, whereas in the private sector they are usually expensive (Arango and Delgado, 1995). Birth grants and family benefits for spouses were abolished in 1985. Between 1971 and 1990 the amount of child allowance remained frozen. Then it was increased to about 12 times the previous amount, but this was still insufficient to compensate for the reduction in real terms since 1971. By the end of 1995 child allowances had lost approximately 17 per cent of their purchasing power because of inflation. Hence, an imbalance was introduced to the detriment of low income families. A restrictive means test was also imposed in 1990, although with a broadening of the range of beneficiaries. The 1990 reform is in actual practice limiting entitlement to allowances to families with incomes below the tax threshold. Parental leave is allowed but completely unpaid (at least until 1995), thus representing an important economic sacrifice to those families taking advantage of it.
At the time of its FFS (1992-93),
Hungary no longer belonged to the group of countries with centrally planned economies, where the principles underlying the provision of services and redistribution of resources were purely based on ideological premises. The difficult economic conditions associated with the economic transition that the former communist Eastern European countries have been going through since 1990 have forced governments to call into question various types of social benefits.
Since in previous times these countries tended to provide the highest share of child-related transfers to families with children, a considerable change in their economic position has since then occurred (Holzer, 1991). In order to preserve their standard of living, mothers are nowadays often forced to take up a job. In 1990, 71 per cent of Hungarian women aged 15-54 (72 per cent of Polish women aged 18-59) were in the labour force. Unemployment was very low at that time. The high labour force participation by Hungarian women urged the government to establish early forms of support intended to ease the conflict between female employment and motherhood (Kamarás, 1995). At the time of the survey, working mothers were entitled to maternity leave of 24 fully paid weeks. Given the system of child-care grants they could stay at home until their child reached the age of two, during which period they received about three-quarters of their former earnings. A fixed amount was then paid out until their child turned three. If parents had only one child, family allowances were granted until the age of six of that child and sixteen in case of two or more children, with the monthly amount increasing for each additional child (Kamarás, 1995). All in all, population questions are still considered as a national and social issue of great importance in Hungary, and social policies are aimed at reducing, if not stopping, the rate of population decline. Hungary and also Poland have the lowest proportions of women aged 37+ with an unfulfilled fertility desire: only 5 and 3 per cent, respectively. As our results have shown (Table 5.2), there is hardly any impact of the labour situation in Hungary, and only slightly so in Poland. It may be hypothesised that due to a longer tradition of labour force participation, Eastern European women have developed coping strategies that make it possible for them to achieve their desired fertility in spite of having a paid job.
G. CONCLUSION
The changed gender relations must be acknowledged as one of the important
DESIRED AND ACHIEVED FERTILITY 139
factors mediating reproductive behaviour in modern times. Features such as the increased educational and occupational opportunities along with the spreading of emancipatory ideologies have fundamentally changed women's positions in contemporary society (Cliquet, 1997).
Individual freedom in and control
over fertility have increased drastically. Greater individual autonomy has certainly been an important factor in preventing unwanted pregnancies. It does not, however, necessarily work in the opposite way, i.e., enabling women to reach the number of children they desire. The available evidence demonstrates that this is true for a considerable share of them. In this respect perhaps factors are at work that are largely beyond individual control. The duration of a partnership and age at first birth were shown to be such factors. Current employment was shown to be another significant factor, at least in Austria, Sweden, Spain, and Italy.
Three relevant policy areas can be
identified: first, the incompatibility between work and family life, especially in the Southern European countries; second, the sequence of major events in the life course; and third, the prevailing value system with respect to gender relations.
Later surveys should include more
psychological variables so as to construct a more refined definition of discrepancy. For instance, do women who intentionally postpone childbearing themselves experience this situation as a discrepancy? Will women who would have liked to have (more) children but who for whatever reason are unable to do so admit their regret?
Furthermore, in order to take into
account the social context in a more systematic way, multi-level analysis should be used. Multi-level approaches have proven to be an important tool in recent causal analyses. Finally, micro data should be integrated with aggregate economic, cultural and population-related indicators. This would allow for an in-depth
assessment of how much of the behavioural variability in fertility across countries can be attributed to differences in the contextual environment and family policy climate.
REFERENCES
Arango, J. and M. Delgado (1995). Spain: family policies as social policies. In H. Moors and R. Palomba (Eds). Population, Family and Welfare. A Comparative Survey of European Attitudes. Oxford: Clarendon Press.
Avramov, D., M. Callens and R. Cliquet (1994). Family and Welfare “Climate” in Flanders. Brussels: CBGS. CBGS document, No. 4.
Becker, G. S. (1981). A Treatise on the Family. Cambridge, MA, London: Harvard University Press.
Bernhardt, E. (1991), Working parents in Sweden: an example for Europe. Eurostat Conference on Human Resources at the Dawn of the 21st century. Luxembourg.
Bongaarts, J. (1990). The measurement of wanted fertility. Population and Development Review, 16, 3, 487-506.
Buchmann, M. (1989). The Script of Life in Modern Society: Entry into Adulthood in a Changing World. Chicago: University of Chicago Press.
Callens, M. (1999). The Third Birth in Europe: A Multi-level Approach. Brussels: CBGS. CBGS working document, No. 6.
Callens, M. and F. Deven (1993). Kindertal: ideaal en wens (“Number of children: ideal and expected”). In R. Cliquet and M. Callens (Eds.) Gezinsvorming in Vlaanderen [Family Formation in Flanders] Brussels: CBGS. CBGS monografie, No. 1.
Cliquet, R. (1991). Desirabilities and Possibilities of a Fertility Recovery at Replacement Level in Europe. Lisse: Swets & Zeitlinger.
Cliquet, R., F. Deven, M. Corijn, M. Callens and E. Lodewijckx (1992). The 1991 Fertility and Family Survey in Flanders. Framework and Questionnaire. Brussels: CBGS. CBGS working document, No. 82.
Cliquet, R. (1997). Below-replacement Fertility and Gender Politics. Brussels: CBGS. CBGS document, No. 2.
Coombs, L. C. (1979). Reproductive goals and achieved fertility: a fifteen-year perspective. Demograph , 16, 523-534.
Corijn, M. (1999). Transitions to Adulthood in Europe for the 1950s and 1960s Cohorts. Brussels: CBGS. CBGS working document, No. 4.
Delgado, M. and T. Castro Martín (1999). Fertility and family surveys in countries of the ECE region. Standard Country Report Spain. Economic Studies No. 10i. New York/Geneva: United Nations.
De Sandre, P., Ongaro, F., Rettaroli R. and Salvini S. (2000). Fertility and Family Surveys in Countries of the ECE Region. Standard Country Report.
140 FERTILITY AND PARTNERSHIP IN EUROPE
Italy. Economic Studies 10o, New York and Geneva: United Nations.
Easterlin, R. A. (1976). The conflict between aspirations and resources. Population and Development Review, 2, 3, 417-425.
European Observatory on National Family Policies (1996). Developments in National Family Policies in 1995. European Commission.
Granström, F. (1997). Fertility and Family Surveys in Countries of the ECE Region. Standard Country Report. Sweden. Economic Studies 10b. New York/Geneva: United Nations.
Gauthier, A. H. and J. Hatzius (1997). Family benefits and fertility: an econometric analysis. Population Studies, 51, 295-306.
Giddens, A. (1991). Modernity and Self-Identity: Self and Society in the Late Modern Age. Cambridge: Polity Press.
Hantrais, L. (1997). Exploring relationships between social policy and changing family forms within the European Union. European Journal of Population, 13, 339-379.
Hendershot, G. E. and P. J. Placek (1981). Predicting Fertility: Demographic Studies of Birth Expectations. Lexington, MA: Lexington Books.
Hoem, B. (1993). The compatibility of employment and childbearing in contemporary Sweden. Acta Sociologica, 36, 101-120.
Holzer, J. Z. (1991). Desirabilities and possibilities of keeping fertility at replacement level in Poland. In R. Cliquet (Ed.) Desirabilities and possibilities of a fertility recovery at replacement level in Europe. Lisse: Swets & Zeitlinger.
Holzer, J. Z. and I. Kowalska (1997). Fertility and family surveys in countries of the ECE region. Standard Country Report Poland. Economic Studies No. 10d. New York/Geneva: United Nations.
Kamarás, F. (1995). Hungary: population policy as a national issue. In H. Moors and R. Palomba (Eds). Population, Family and Welfare. A Comparative Survey of European Attitudes, Oxford: Clarendon Press.
Kamarás, F. (1999). Fertility and family surveys in countries of the ECE region. Standard Country Report Hungary. Economic Studies No. 10j. New York/Geneva: United Nations.
Klijzing, E. (2000). Are there unmet family planning needs in Europe? Family Planning Perspectives, 32, 74-81.
Lesthaeghe, R. and P. Willems (1999). Is low fertility a temporary phenomenon in the European Union? Population and Development Review, 25, 211-228.
Liefbroer, A. (1999). From youth to adulthood: understanding changing patterns of family formation from a life course perspective. In L. van Wissen and P. A. Dykstra (Eds). Population Issues. An Interdisciplinary Focus. Dordrecht: Kluwer Academic Publishers.
Lodewijckx, E. (1999). Fertility and family surveys in countries of the ECE region. Standard Country Report Belgium. Economic Studies No. 10k. New York/Geneva: United Nations.
Monnier, A. (1987). Projets de fécondité et fécondité effective: une enquête longitudinale [Fertility
intentions and actual behaviour: a longitudinal study]. Population , 42, 6, 819-842.
Moors, H. and R. Palomba (Eds.) (1995). Population, Family and Welfare. A Comparative Survey of European Attitudes. Oxford: Clarendon Press.
Morgan, S. P. (1981). Intention and uncertainty at later stages of childbearing: the United States, 1970 to 1976. Demography, 18, 267-285.
Morgan, S. P. (1982). Parity-specific fertility intentions and uncertainty: the United States, 1970 to 1976. Demography, 19, 315-334.
Morgan, S. P. and L. J. Waite (1987). Parenthood and the attitudes of young adults. American Sociological Review, 52, 541–547.
Nebenführ, E. (1995). Austria: towards gender equality. In H. Moors and R. Palomba (Eds.) Population, Family and Welfare. A Comparative Survey of European Attitudes. Oxford: Clarendon Press.
Ni Bhrolchain, M. (1993). Women’s and men’s life strategies in developed societies. In Proceedings of the International Population Conference, Montreal, 1993, vol.2, IUSSP, Liège.
Nikander, T. (1998). Fertility and Family Surveys in Countries of the ECE Region. Standard Country Report. Finland. Economic Studies 10g. New York/Geneva: United Nations.
Noack, T. and L. Østby (1985). Fertility expectations: a short-cut or dead-end in predicting fertility? Scandinavian Population Studies, 7, 48-59.
Noack, T. and L. Østby (1996). Fertility and family surveys in countries of the ECE region. Standard Country Report Norway. Economic Studies No. 10a. New York/Geneva: United Nations.
OECD (1995). OECD Education Indicators. Palomba, R. (1995). Italy: the invisible change. In H.
Moors and R. Palomba (Eds.) Population, Family and Welfare. A Comparative Survey of European Attitudes,. Oxford: Clarendon Press.
Pinnelli, A. (1995). Women’s condition, low fertility and emerging union patterns in Europe. In K. Oppenheim-Mason and A.-M. Jensen (Eds.) Gender and Family Change in Industrialized Countries. Oxford: Clarendon Press, 82-101.
Prinz, C., W. Lutz, V. Nowak and C. Pfeiffer (1998). Fertility and family surveys in countries of the ECE region. Standard Country Report Austria. Economic Studies No. 10h. New York/Geneva: United Nations.
Rönsen, M. and M. Sundström (1995). Maternal employment in the Nordic counties. Paper presented at the European Population Conference, Milano, Italy, 4-8 September 1995.
Rönsen, M. (1999). Impacts on fertility and female employment of parental leave programs: evidence from three Nordic countries. Paper presented at the European Population Conference, The Hague, The Netherlands, 31 August-4 September 1999.
Ruokolainen, A. and I.-L. Notkola (2001). Third-child intentions and uncertainty: the effects of family characteristics and attitudinal factors. Journal of Marriage and the Family.
Ryder, N. B. (1973). A critique of the national fertility study. Demography, 10, 4, 495-506.
Schoen, R., Y. J. Kim, C.A. Nathanson, J. Fields, N. M. Astone (1997). Why do Americans want
DESIRED AND ACHIEVED FERTILITY 141
children? Population and Development Review, 23, 2, 333-358.
Schoenmaeckers, R. and E. Lodewijckx (1999). Demographic behaviour in Europe: some results from FFS Country Reports and suggestions for further research. European Journal of Population, 15, 207-240.
Toulemon, L. and C. de Guibert-Lantoine (1998). Fertility and family surveys in countries of the ECE region. Standard Country Report France. Economic Studies No. 10e. New York/Geneva: United Nations.
United Nations (1992). Fertility and Family Surveys in Countries of the ECE region. Questionnaire and Codebook. New York.
Van Peer, C. and H. Moors (1996). Perceived obstacles to fertility: opinions on family policies in Flanders and in the Netherlands. In H.van den Brekel and F. Deven (Eds.) Population and
Family in the Low Countries. Dordrecht: Kluwer Academic Publishers, 41-66.
Van Peer, C. (1998). Welfare and solidarity towards the family. In R. Palomba and H.Moors (Eds.) Population, Family and Welfare. A Comparative Survey of European Attitudes. Oxford: Clarendon Press.
Weinstein, N. D. (1980). Unrealistic optimism about future life events. Journal of Personality and Social Psychology, 39, 806-820.
Westoff, C. F. (1981). The validity of birth intentions: evidence from U.S. longitudinal studies. In G. E. Hendershot and P. J. Placek (Eds) .Predicting Fertility, Lexington, MA: Lexington Books.
Westoff, C. F. (1990). Reproductive intentions and fertility rates. International Family Planning Perspectives, 16, 3, 84-89.
ENDNOTES i The author wishes to thank the Advisory Group of the FFS programme of comparative research for its permission, granted under identification number 62, to use the FFS data on which this study is based. ii This kind of information, together with data on perceptions of the degree of responsibility of the government in specific domains, is available from the PPA surveys.

143
PART THREE
DATA QUALITY ISSUES
145
CHAPTER 9
DATA QUALITY ISSUES IN COMPARATIVE FERTILITY AND FAMILY
SURVEYSi
Andrej Kveder*
* Institute of Medical Sciences, Scientific Research Center at the Slovenian Academy of Sciences and Arts,
Ljubljana (Slovenia)
A. INTRODUCTION
Data quality is an important issue when evaluating comparative survey results because methodologies used in the process of designing a survey, preparing a questionnaire, collecting the data and performing the analysis of the data may differ widely across countries. The best estimator of data quality is the survey error, which refers to the deviation of results obtained from the true values in the population. Following Groves (1991), this survey error can be decomposed into an observation and a measurement error. In the present chapter the primary concern is with the former, and in particular with the respondent as the basic unit of observation or non-observation. The two main questions in this respect are: how many non-respondents are there compared to the original number of respondents in the target sample? And how different are they from the actual respondents? In other words, the bias is a function of both the non-response rate and the difference between the respondents and non-respondents (Groves and Couper, 1998). Non-response can be observed on two levels: inability or unwillingness to cooperate with the survey at large (unit non-response) and inability or unwillingness to answer certain questions from it (item non-response). In this chapter the emphasis will be mostly on the latter.
The need to assess data quality
derives from the accuracy requirements of an inductive study like a survey. In order to draw valid conclusions from the sample surveyed to the population from which it
was drawn, the necessary accuracy of the estimates must be guaranteed. Therefore, the analysis of item non-response and especially the identification of respondents who contribute to it is extremely important.
The process of answering to a
questionnaire is a cognitive effort on the part of the respondent (Knäuper et al., 1997). It has been shown that this cognitive ability deteriorates with age, and thus reporting is supposedly less accurate among older persons. It is also related to the degree of difficulty of the questions. All in all, diminishing cognitive abilities, difficult questions and events that are hard to remember tend to produce higher item non-response.
The majority of research on this topic has concentrated on explaining why incomplete answers occur, and what type of respondents are most likely not to reply to certain questions. Some of the reasons for item non-response can be attributed to the nature of the topic at hand (Kupek, 1998), and thus to its salience (possession of relevant information), recall difficulties and sensitivity issues. All these factors can of course also combine with the characteristics of the questionnaire design (Leigh and Martin, 1987; Feick, 1989), and/or with those of the respondents themselves (Francis and Busch, 1975; Ferligoj et al., 1991; Grønhaug et al., 1988). For instance, while Francis and Busch (1975) found females in general to be more likely than males not to respond, Ferligoj et al. (1991) later showed that although item non-response increases with age for both, it
146 FERTILITY AND PARTNERSHIP IN EUROPE
does so faster among females, thus enlarging the gender differential.
An entirely new dimension to the
discussion of data quality is added when the data concern event history data. The problem of recall bias becomes then of paramount importance (Belli, 1999). The limitations of autobiographical recall produce underreporting of remote events (Klijzing and Cairns, 2000), especially when they are of short duration. Furthermore, data on events that are being reported are often inaccurate or incomplete (Belli, 1999), which has clear implications for their analysis (Holt et al., 1991). From an analytical point of view, the two most important event history data to be reported are the date of becoming at risk of experiencing a particular event and the date of actually experiencing it, or the end of observation (Holt et al., 1991). Therefore, item non-response of this type of data is crucial for valid analytical conclusions.
B. METHODS
1. Surveys The analysis here to be presented is based on the FFS data of 18 countries where a total 116 897 persons were interviewed. These countries are: Austria, Belgium, Canada, Czech Republic, Finland, France, Germany, Hungary, Italy, Latvia, Lithuania, Norway, Poland, Portugal, Slovenia, Spain, Sweden, and Switzerland. It has to be stressed that the whole analytical procedure was carried out under numerous simplifying conditions. This was necessary because different countries had used different sampling and interviewing methods (see Festy and Prioux, Volume I). Moreover, not all questions from the FFS model questionnaire were asked in every single country. The only solid reference for the analytical work was the standard FFS codebook (United Nations, 1993).
2. Coding and topic selection Special emphasis had to be put on the unique coding of each question, since not all FFS Standard Recode Files had been
accurately prepared according to the instructions in the standard FFS codebook. Questions not included in a particular survey were coded as system missing, as were questions that had to be skipped. If an answer was required that was not given, code 99 was entered for that particular question. All “don’t know” answers were coded as 97, whereas refusals as 98. All three codes were in our study considered as instances of item non-response, as none of them contributes towards a better estimation.
For the analysis three topics were selected with factual information on: partnership, childbearing, and sexual and contraceptive debut. Additionally, one event history (childbearing) and one set of attitudinal questions (from core section 7 of the FFS model questionnaire) were selected.
For each respondent, the number of questions that had to be answered and the number of questions that remained unanswered were calculated, for each selected topic (item non-response) as well as for all of them taken together (overall item non-response). The item response rates per topic and overall for each individual were calculated using the following formula:
100questions applicable of no.
responses -non of no.1 ⋅
−
For the modelling of the item non-
response a new indicator was then created. It was coded 1 if the item response rate was under 90 per cent (corresponding approximately to the 30th percentile, see Table 9.1), and 0 otherwise. Respondents thus scoring 1 on this indicator were treated as non-respondents. A limit milder than the standard error margin of 95 per cent was taken since half of the respondents had a response rate of 95 per cent and higher (Table 9.1). An additional reason to choose a 10 rather than a 5 per cent error margin had to do with the simplifications that had to be taken into account due to unreliable information on country-specific designs and questionnaires.
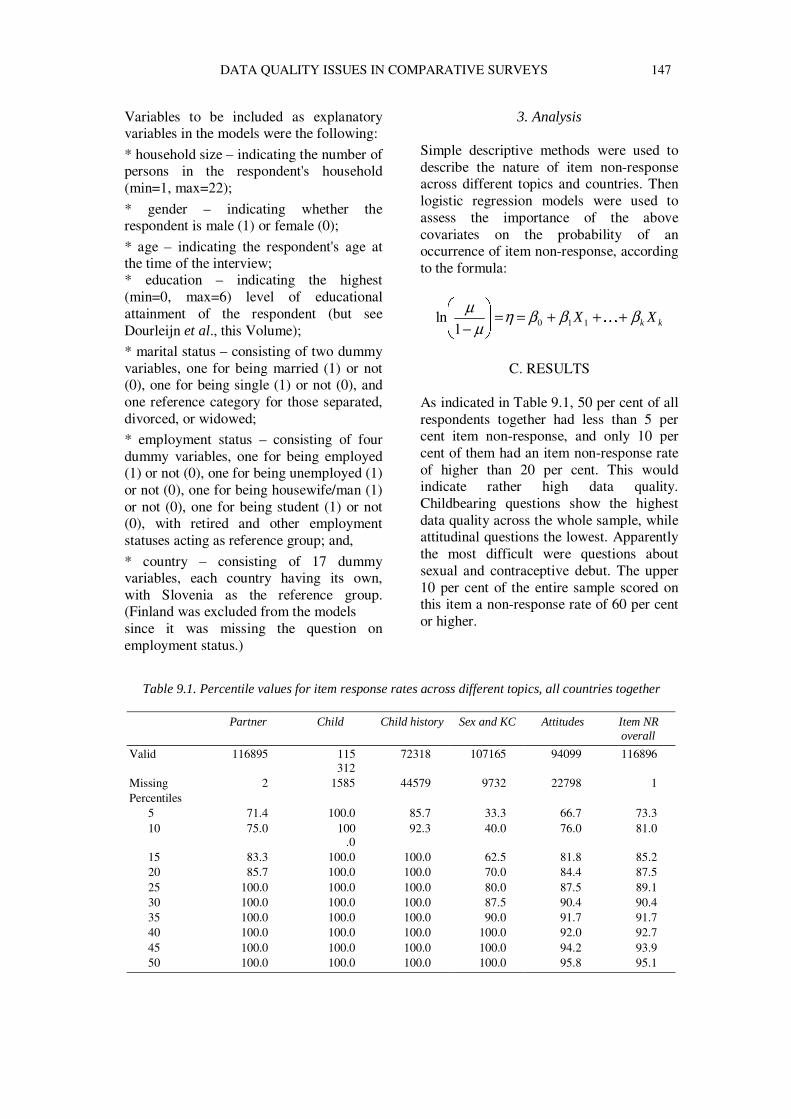
DATA QUALITY ISSUES IN COMPARATIVE SURVEYS 147
Variables to be included as explanatory variables in the models were the following:
* household size – indicating the number of persons in the respondent's household (min=1, max=22);
* gender – indicating whether the respondent is male (1) or female (0);
* age – indicating the respondent's age at the time of the interview; * education – indicating the highest (min=0, max=6) level of educational attainment of the respondent (but see Dourleijn et al., this Volume);
* marital status – consisting of two dummy variables, one for being married (1) or not (0), one for being single (1) or not (0), and one reference category for those separated, divorced, or widowed;
* employment status – consisting of four dummy variables, one for being employed (1) or not (0), one for being unemployed (1) or not (0), one for being housewife/man (1) or not (0), one for being student (1) or not (0), with retired and other employment statuses acting as reference group; and,
* country – consisting of 17 dummy variables, each country having its own, with Slovenia as the reference group. (Finland was excluded from the models since it was missing the question on employment status.)
3. Analysis Simple descriptive methods were used to describe the nature of item non-response across different topics and countries. Then logistic regression models were used to assess the importance of the above covariates on the probability of an occurrence of item non-response, according to the formula:
kk XX βββηµ
µ +++==
−K1101
ln
C. RESULTS
As indicated in Table 9.1, 50 per cent of all respondents together had less than 5 per cent item non-response, and only 10 per cent of them had an item non-response rate of higher than 20 per cent. This would indicate rather high data quality. Childbearing questions show the highest data quality across the whole sample, while attitudinal questions the lowest. Apparently the most difficult were questions about sexual and contraceptive debut. The upper 10 per cent of the entire sample scored on this item a non-response rate of 60 per cent or higher.
Table 9.1. Percentile values for item response rates across different topics, all countries together
Partner Child Child history Sex and KC Attitudes Item NR
overall
Valid 116895 115312
72318 107165 94099 116896
Missing 2 1585 44579 9732 22798 1 Percentiles
5 71.4 100.0 85.7 33.3 66.7 73.3 10 75.0 100
.0 92.3 40.0 76.0 81.0
15 83.3 100.0 100.0 62.5 81.8 85.2 20 85.7 100.0 100.0 70.0 84.4 87.5 25 100.0 100.0 100.0 80.0 87.5 89.1 30 100.0 100.0 100.0 87.5 90.4 90.4 35 100.0 100.0 100.0 90.0 91.7 91.7 40 100.0 100.0 100.0 100.0 92.0 92.7 45 100.0 100.0 100.0 100.0 94.2 93.9 50 100.0 100.0 100.0 100.0 95.8 95.1
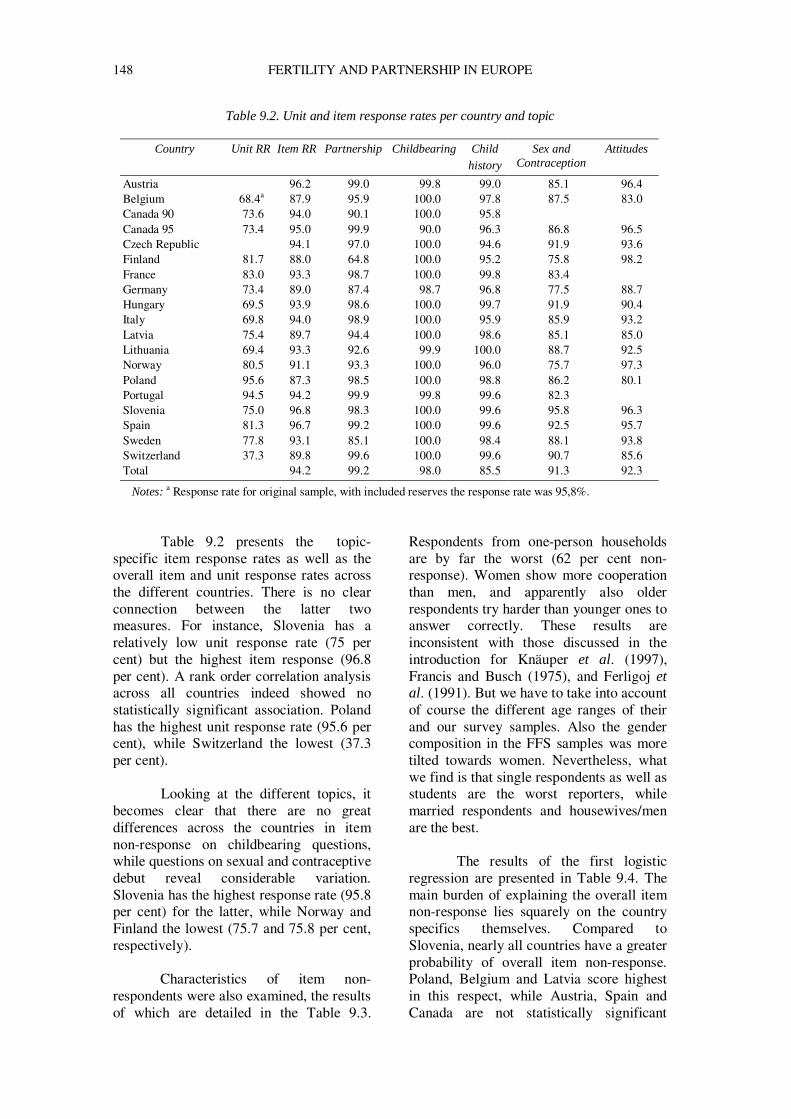
148 FERTILITY AND PARTNERSHIP IN EUROPE
Table 9.2. Unit and item response rates per country and topic
Country Unit RR Item RR Partnership Childbearing Child history
Sex and Contraception
Attitudes
Austria 96.2 99.0 99.8 99.0 85.1 96.4 Belgium 68.4a 87.9 95.9 100.0 97.8 87.5 83.0 Canada 90 73.6 94.0 90.1 100.0 95.8 Canada 95 73.4 95.0 99.9 90.0 96.3 86.8 96.5 Czech Republic 94.1 97.0 100.0 94.6 91.9 93.6 Finland 81.7 88.0 64.8 100.0 95.2 75.8 98.2 France 83.0 93.3 98.7 100.0 99.8 83.4 Germany 73.4 89.0 87.4 98.7 96.8 77.5 88.7 Hungary 69.5 93.9 98.6 100.0 99.7 91.9 90.4 Italy 69.8 94.0 98.9 100.0 95.9 85.9 93.2 Latvia 75.4 89.7 94.4 100.0 98.6 85.1 85.0 Lithuania 69.4 93.3 92.6 99.9 100.0 88.7 92.5 Norway 80.5 91.1 93.3 100.0 96.0 75.7 97.3 Poland 95.6 87.3 98.5 100.0 98.8 86.2 80.1 Portugal 94.5 94.2 99.9 99.8 99.6 82.3 Slovenia 75.0 96.8 98.3 100.0 99.6 95.8 96.3 Spain 81.3 96.7 99.2 100.0 99.6 92.5 95.7 Sweden 77.8 93.1 85.1 100.0 98.4 88.1 93.8 Switzerland 37.3 89.8 99.6 100.0 99.6 90.7 85.6 Total 94.2 99.2 98.0 85.5 91.3 92.3
Notes: a Response rate for original sample, with included reserves the response rate was 95,8%.
Table 9.2 presents the topic-
specific item response rates as well as the overall item and unit response rates across the different countries. There is no clear connection between the latter two measures. For instance, Slovenia has a relatively low unit response rate (75 per cent) but the highest item response (96.8 per cent). A rank order correlation analysis across all countries indeed showed no statistically significant association. Poland has the highest unit response rate (95.6 per cent), while Switzerland the lowest (37.3 per cent).
Looking at the different topics, it becomes clear that there are no great differences across the countries in item non-response on childbearing questions, while questions on sexual and contraceptive debut reveal considerable variation. Slovenia has the highest response rate (95.8 per cent) for the latter, while Norway and Finland the lowest (75.7 and 75.8 per cent, respectively).
Characteristics of item non-
respondents were also examined, the results of which are detailed in the Table 9.3.
Respondents from one-person households are by far the worst (62 per cent non-response). Women show more cooperation than men, and apparently also older respondents try harder than younger ones to answer correctly. These results are inconsistent with those discussed in the introduction for Knäuper et al. (1997), Francis and Busch (1975), and Ferligoj et al. (1991). But we have to take into account of course the different age ranges of their and our survey samples. Also the gender composition in the FFS samples was more tilted towards women. Nevertheless, what we find is that single respondents as well as students are the worst reporters, while married respondents and housewives/men are the best.
The results of the first logistic
regression are presented in Table 9.4. The main burden of explaining the overall item non-response lies squarely on the country specifics themselves. Compared to Slovenia, nearly all countries have a greater probability of overall item non-response. Poland, Belgium and Latvia score highest in this respect, while Austria, Spain and Canada are not statistically significant
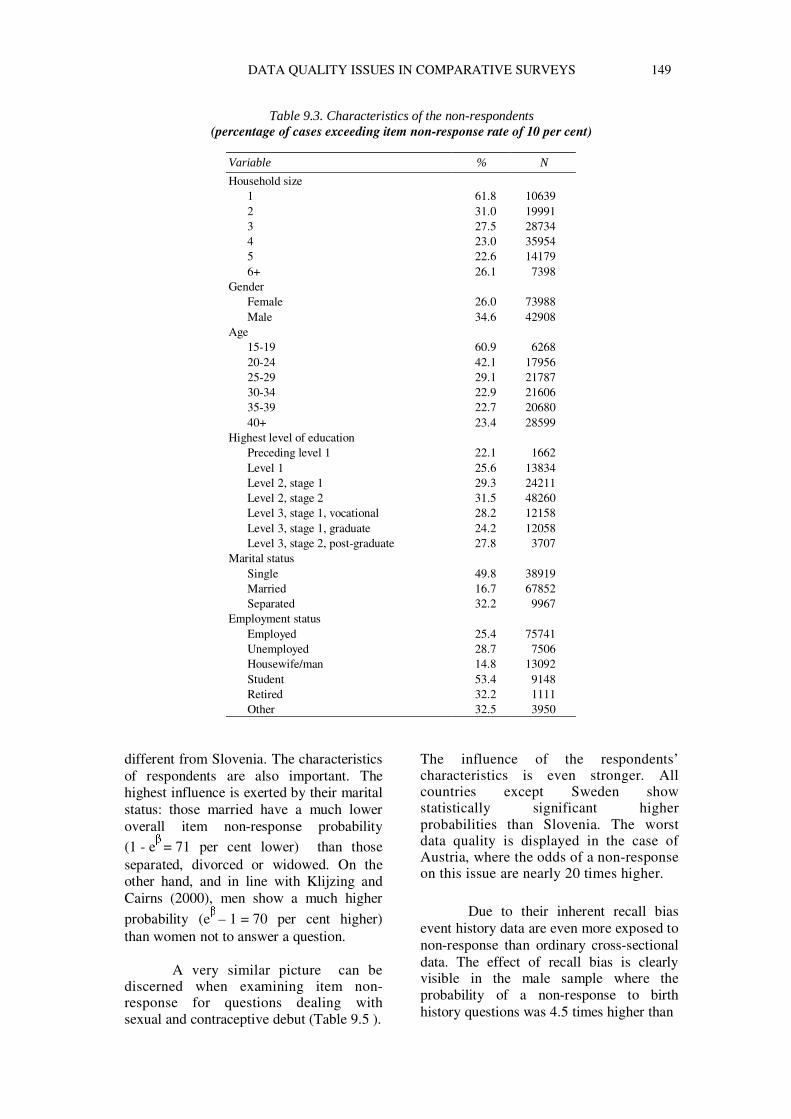
DATA QUALITY ISSUES IN COMPARATIVE SURVEYS 149
Table 9.3. Characteristics of the non-respondents (percentage of cases exceeding item non-response rate of 10 per cent)
Variable % N
Household size 1 61.8 10639 2 31.0 19991 3 27.5 28734 4 23.0 35954 5 22.6 14179 6+ 26.1 7398
Gender Female 26.0 73988 Male 34.6 42908
Age 15-19 60.9 6268 20-24 42.1 17956 25-29 29.1 21787 30-34 22.9 21606 35-39 22.7 20680 40+ 23.4 28599
Highest level of education Preceding level 1 22.1 1662 Level 1 25.6 13834 Level 2, stage 1 29.3 24211 Level 2, stage 2 31.5 48260 Level 3, stage 1, vocational 28.2 12158 Level 3, stage 1, graduate 24.2 12058 Level 3, stage 2, post-graduate 27.8 3707
Marital status Single 49.8 38919 Married 16.7 67852 Separated 32.2 9967
Employment status Employed 25.4 75741 Unemployed 28.7 7506 Housewife/man 14.8 13092 Student 53.4 9148 Retired 32.2 1111 Other 32.5 3950
different from Slovenia. The characteristics of respondents are also important. The highest influence is exerted by their marital status: those married have a much lower overall item non-response probability (1 - e
β = 71 per cent lower) than those separated, divorced or widowed. On the other hand, and in line with Klijzing and Cairns (2000), men show a much higher
probability (eβ – 1 = 70 per cent higher)
than women not to answer a question.
A very similar picture can be discerned when examining item non-response for questions dealing with sexual and contraceptive debut (Table 9.5 ).
The influence of the respondents’ characteristics is even stronger. All countries except Sweden show statistically significant higher probabilities than Slovenia. The worst data quality is displayed in the case of Austria, where the odds of a non-response on this issue are nearly 20 times higher.
Due to their inherent recall bias
event history data are even more exposed to non-response than ordinary cross-sectional data. The effect of recall bias is clearly visible in the male sample where the probability of a non-response to birth history questions was 4.5 times higher than
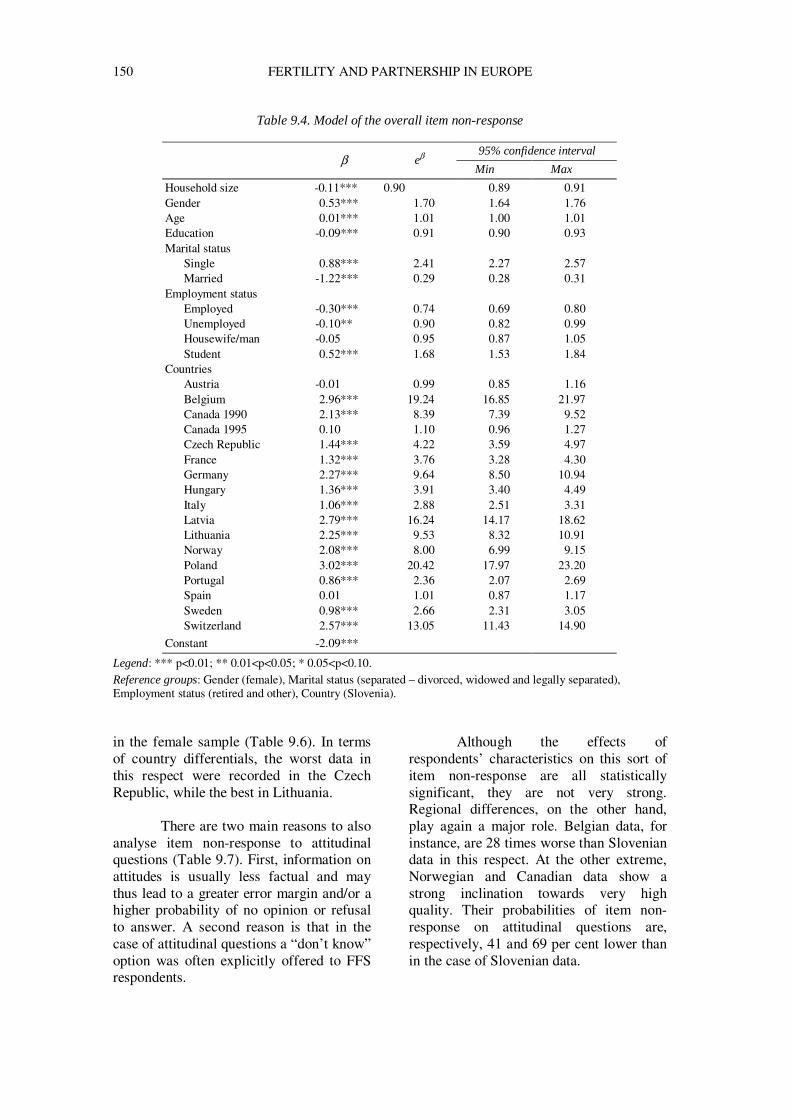
150 FERTILITY AND PARTNERSHIP IN EUROPE
Table 9.4. Model of the overall item non-response
95% confidence interval β eβ
Min Max
Household size -0.11*** 0.90 0.89 0.91 Gender 0.53*** 1.70 1.64 1.76 Age 0.01*** 1.01 1.00 1.01 Education -0.09*** 0.91 0.90 0.93 Marital status
Single 0.88*** 2.41 2.27 2.57 Married -1.22*** 0.29 0.28 0.31
Employment status Employed -0.30*** 0.74 0.69 0.80 Unemployed -0.10** 0.90 0.82 0.99 Housewife/man -0.05 0.95 0.87 1.05 Student 0.52*** 1.68 1.53 1.84
Countries Austria -0.01 0.99 0.85 1.16 Belgium 2.96*** 19.24 16.85 21.97 Canada 1990 2.13*** 8.39 7.39 9.52 Canada 1995 0.10 1.10 0.96 1.27 Czech Republic 1.44*** 4.22 3.59 4.97 France 1.32*** 3.76 3.28 4.30 Germany 2.27*** 9.64 8.50 10.94 Hungary 1.36*** 3.91 3.40 4.49 Italy 1.06*** 2.88 2.51 3.31 Latvia 2.79*** 16.24 14.17 18.62 Lithuania 2.25*** 9.53 8.32 10.91 Norway 2.08*** 8.00 6.99 9.15 Poland 3.02*** 20.42 17.97 23.20 Portugal 0.86*** 2.36 2.07 2.69 Spain 0.01 1.01 0.87 1.17 Sweden 0.98*** 2.66 2.31 3.05 Switzerland 2.57*** 13.05 11.43 14.90
Constant -2.09***
Legend: *** p<0.01; ** 0.01<p<0.05; * 0.05<p<0.10. Reference groups: Gender (female), Marital status (separated – divorced, widowed and legally separated), Employment status (retired and other), Country (Slovenia). in the female sample (Table 9.6). In terms of country differentials, the worst data in this respect were recorded in the Czech Republic, while the best in Lithuania.
There are two main reasons to also analyse item non-response to attitudinal questions (Table 9.7). First, information on attitudes is usually less factual and may thus lead to a greater error margin and/or a higher probability of no opinion or refusal to answer. A second reason is that in the case of attitudinal questions a “don’t know” option was often explicitly offered to FFS respondents.
Although the effects of respondents’ characteristics on this sort of item non-response are all statistically significant, they are not very strong. Regional differences, on the other hand, play again a major role. Belgian data, for instance, are 28 times worse than Slovenian data in this respect. At the other extreme, Norwegian and Canadian data show a strong inclination towards very high quality. Their probabilities of item non-response on attitudinal questions are, respectively, 41 and 69 per cent lower than in the case of Slovenian data.
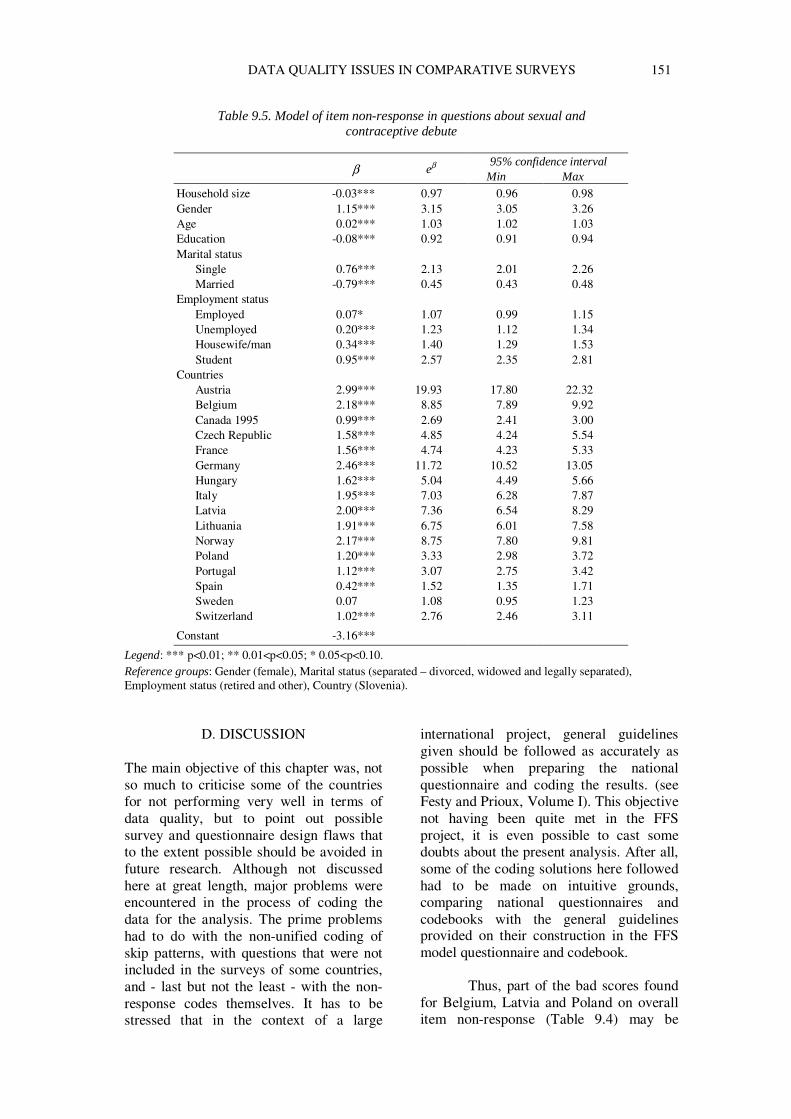
DATA QUALITY ISSUES IN COMPARATIVE SURVEYS 151
Table 9.5. Model of item non-response in questions about sexual and contraceptive debute
95% confidence interval
β eβ Min Max
Household size -0.03*** 0.97 0.96 0.98 Gender 1.15*** 3.15 3.05 3.26 Age 0.02*** 1.03 1.02 1.03 Education -0.08*** 0.92 0.91 0.94 Marital status
Single 0.76*** 2.13 2.01 2.26 Married -0.79*** 0.45 0.43 0.48
Employment status Employed 0.07* 1.07 0.99 1.15 Unemployed 0.20*** 1.23 1.12 1.34 Housewife/man 0.34*** 1.40 1.29 1.53 Student 0.95*** 2.57 2.35 2.81
Countries Austria 2.99*** 19.93 17.80 22.32 Belgium 2.18*** 8.85 7.89 9.92 Canada 1995 0.99*** 2.69 2.41 3.00 Czech Republic 1.58*** 4.85 4.24 5.54 France 1.56*** 4.74 4.23 5.33 Germany 2.46*** 11.72 10.52 13.05 Hungary 1.62*** 5.04 4.49 5.66 Italy 1.95*** 7.03 6.28 7.87 Latvia 2.00*** 7.36 6.54 8.29 Lithuania 1.91*** 6.75 6.01 7.58 Norway 2.17*** 8.75 7.80 9.81 Poland 1.20*** 3.33 2.98 3.72 Portugal 1.12*** 3.07 2.75 3.42 Spain 0.42*** 1.52 1.35 1.71 Sweden 0.07 1.08 0.95 1.23 Switzerland 1.02*** 2.76 2.46 3.11
Constant -3.16***
Legend: *** p<0.01; ** 0.01<p<0.05; * 0.05<p<0.10. Reference groups: Gender (female), Marital status (separated – divorced, widowed and legally separated), Employment status (retired and other), Country (Slovenia).
D. DISCUSSION The main objective of this chapter was, not so much to criticise some of the countries for not performing very well in terms of data quality, but to point out possible survey and questionnaire design flaws that to the extent possible should be avoided in future research. Although not discussed here at great length, major problems were encountered in the process of coding the data for the analysis. The prime problems had to do with the non-unified coding of skip patterns, with questions that were not included in the surveys of some countries, and - last but not the least - with the non-response codes themselves. It has to be stressed that in the context of a large
international project, general guidelines given should be followed as accurately as possible when preparing the national questionnaire and coding the results. (see Festy and Prioux, Volume I). This objective not having been quite met in the FFS project, it is even possible to cast some doubts about the present analysis. After all, some of the coding solutions here followed had to be made on intuitive grounds, comparing national questionnaires and codebooks with the general guidelines provided on their construction in the FFS model questionnaire and codebook.
Thus, part of the bad scores found for Belgium, Latvia and Poland on overall item non-response (Table 9.4) may be
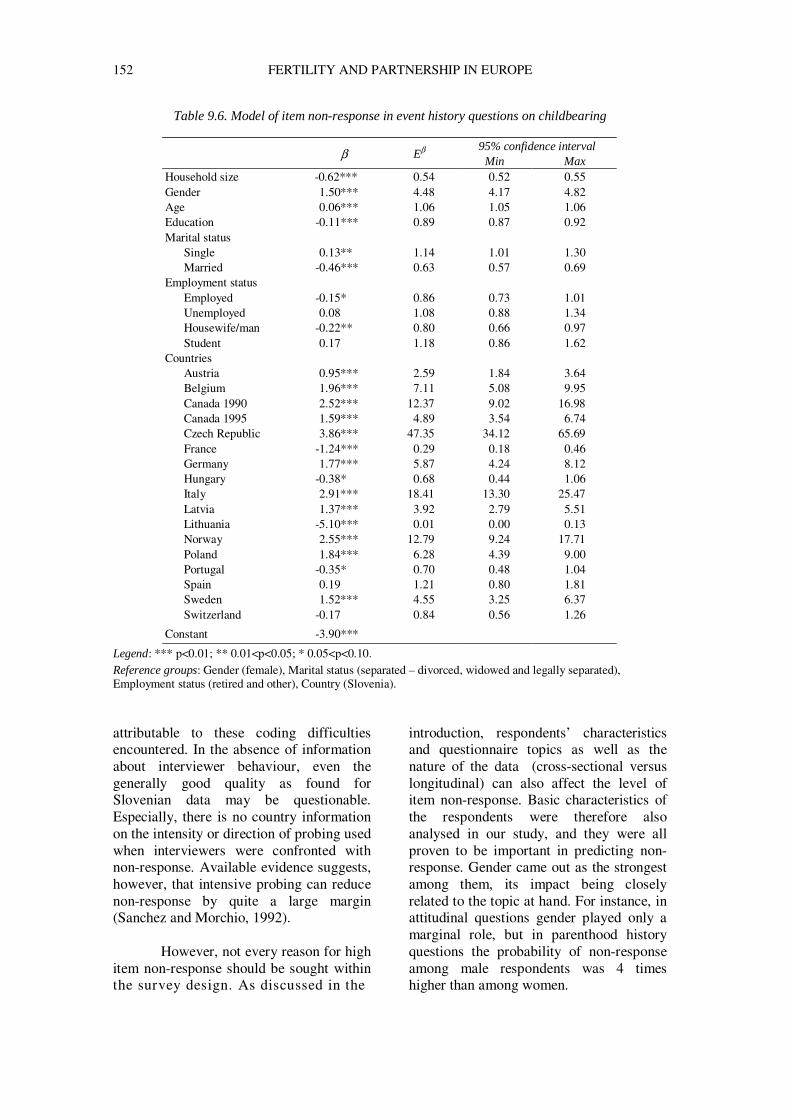
152 FERTILITY AND PARTNERSHIP IN EUROPE
Table 9.6. Model of item non-response in event history questions on childbearing
95% confidence interval
β Eβ Min Max
Household size -0.62*** 0.54 0.52 0.55 Gender 1.50*** 4.48 4.17 4.82 Age 0.06*** 1.06 1.05 1.06 Education -0.11*** 0.89 0.87 0.92 Marital status
Single 0.13** 1.14 1.01 1.30 Married -0.46*** 0.63 0.57 0.69
Employment status Employed -0.15* 0.86 0.73 1.01 Unemployed 0.08 1.08 0.88 1.34 Housewife/man -0.22** 0.80 0.66 0.97 Student 0.17 1.18 0.86 1.62
Countries Austria 0.95*** 2.59 1.84 3.64 Belgium 1.96*** 7.11 5.08 9.95 Canada 1990 2.52*** 12.37 9.02 16.98 Canada 1995 1.59*** 4.89 3.54 6.74 Czech Republic 3.86*** 47.35 34.12 65.69 France -1.24*** 0.29 0.18 0.46 Germany 1.77*** 5.87 4.24 8.12 Hungary -0.38* 0.68 0.44 1.06 Italy 2.91*** 18.41 13.30 25.47 Latvia 1.37*** 3.92 2.79 5.51 Lithuania -5.10*** 0.01 0.00 0.13 Norway 2.55*** 12.79 9.24 17.71 Poland 1.84*** 6.28 4.39 9.00 Portugal -0.35* 0.70 0.48 1.04 Spain 0.19 1.21 0.80 1.81 Sweden 1.52*** 4.55 3.25 6.37 Switzerland -0.17 0.84 0.56 1.26
Constant -3.90***
Legend: *** p<0.01; ** 0.01<p<0.05; * 0.05<p<0.10. Reference groups: Gender (female), Marital status (separated – divorced, widowed and legally separated), Employment status (retired and other), Country (Slovenia). attributable to these coding difficulties encountered. In the absence of information about interviewer behaviour, even the generally good quality as found for Slovenian data may be questionable. Especially, there is no country information on the intensity or direction of probing used when interviewers were confronted with non-response. Available evidence suggests, however, that intensive probing can reduce non-response by quite a large margin (Sanchez and Morchio, 1992).
However, not every reason for high item non-response should be sought within the survey design. As discussed in the
introduction, respondents’ characteristics and questionnaire topics as well as the nature of the data (cross-sectional versus longitudinal) can also affect the level of item non-response. Basic characteristics of the respondents were therefore also analysed in our study, and they were all proven to be important in predicting non-response. Gender came out as the strongest among them, its impact being closely related to the topic at hand. For instance, in attitudinal questions gender played only a marginal role, but in parenthood history questions the probability of non-response among male respondents was 4 times higher than among women.
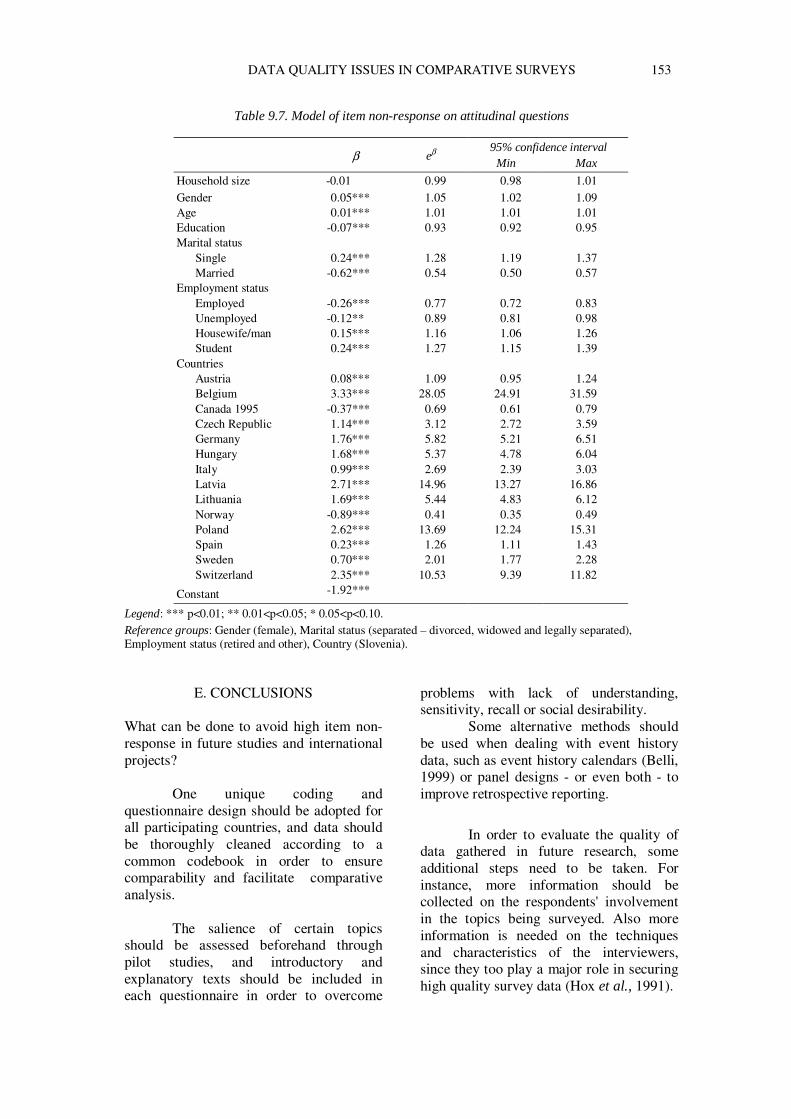
DATA QUALITY ISSUES IN COMPARATIVE SURVEYS 153
Table 9.7. Model of item non-response on attitudinal questions
95% confidence interval
β eβ Min Max
Household size -0.01 0.99 0.98 1.01 Gender 0.05*** 1.05 1.02 1.09 Age 0.01*** 1.01 1.01 1.01 Education -0.07*** 0.93 0.92 0.95 Marital status
Single 0.24*** 1.28 1.19 1.37 Married -0.62*** 0.54 0.50 0.57
Employment status Employed -0.26*** 0.77 0.72 0.83 Unemployed -0.12** 0.89 0.81 0.98 Housewife/man 0.15*** 1.16 1.06 1.26 Student 0.24*** 1.27 1.15 1.39
Countries Austria 0.08*** 1.09 0.95 1.24 Belgium 3.33*** 28.05 24.91 31.59 Canada 1995 -0.37*** 0.69 0.61 0.79 Czech Republic 1.14*** 3.12 2.72 3.59 Germany 1.76*** 5.82 5.21 6.51 Hungary 1.68*** 5.37 4.78 6.04 Italy 0.99*** 2.69 2.39 3.03 Latvia 2.71*** 14.96 13.27 16.86 Lithuania 1.69*** 5.44 4.83 6.12 Norway -0.89*** 0.41 0.35 0.49 Poland 2.62*** 13.69 12.24 15.31 Spain 0.23*** 1.26 1.11 1.43 Sweden 0.70*** 2.01 1.77 2.28 Switzerland 2.35*** 10.53 9.39 11.82
Constant -1.92***
Legend: *** p<0.01; ** 0.01<p<0.05; * 0.05<p<0.10. Reference groups: Gender (female), Marital status (separated – divorced, widowed and legally separated), Employment status (retired and other), Country (Slovenia).
E. CONCLUSIONS What can be done to avoid high item non-response in future studies and international projects?
One unique coding and questionnaire design should be adopted for all participating countries, and data should be thoroughly cleaned according to a common codebook in order to ensure comparability and facilitate comparative analysis.
The salience of certain topics
should be assessed beforehand through pilot studies, and introductory and explanatory texts should be included in each questionnaire in order to overcome
problems with lack of understanding, sensitivity, recall or social desirability.
Some alternative methods should be used when dealing with event history data, such as event history calendars (Belli, 1999) or panel designs - or even both - to improve retrospective reporting.
In order to evaluate the quality of
data gathered in future research, some additional steps need to be taken. For instance, more information should be collected on the respondents' involvement in the topics being surveyed. Also more information is needed on the techniques and characteristics of the interviewers, since they too play a major role in securing high quality survey data (Hox et al., 1991).
154 FERTILITY AND PARTNERSHIP IN EUROPE
In concluding, the majority of findings here reported are in line with those published by others. However, what the present analysis adds is country diversity. In order to better explain the differences observed between them, and with a view to unifying methodology in future surveys, more documentation should be compiled about the different FFS design features in all participating countries (see also Festy and Prioux, Volume I).
REFERENCES Belli, R.F. (1999). The structure of Autobiographical
Memory and the Event History Calendar: Potential Improvements in the Quality of Retrospective Reports in Surveys. The University of Michigan, Institute for Social Research, Survey Research Center. Unpublished.
Carrilho M.J and Magalhães G . (2000). Fertility and Family Surveys in Countries of the ECE Region. Standard Country Report. Portugal. Economic Studies 10p, New York and Geneva: United Nations.
De Sandre, P., Ongaro, F., Rettaroli R. and Salvini S. (2000). Fertility and Family Surveys in Countries of the ECE Region. Standard Country Report. Italy. Economic Studies 10o, New York and Geneva: United Nations.
Delgado, M. and Castro Martín T. (1999). Fertility and Family Surveys in Countries of the ECE Region. Standard Country Report. Spain. Economic Studies 10i, New York and Geneva: United Nations.
Feick, L.F. (1989). Latent class analysis of survey questions that include don’t know responses. Public Opinion Quarterly, 53, 525-547.
Ferligoj, A., Ule, M. and Rener, T. (1991). Sex differences in “don’t know” rate: The case of Slovenia. Wisdom, 4, 1/2.
Francis, J.D. and Busch, L. (1975). What we don’t know about “I don’t knows”. Public Opinion Quarterly, 39, 207-218.
Gabadinho A. and P. Wanner (2000). Fertility and family surveys in countries of the ECE region. Standard Country Report Switzerland. Economic Studies 10m. New York/Geneva: United Nations.
Grønhaug, K., Gilly, M.C. and Enis, B.M. (1988). Exploring income non-response: A logit model analysis. Journal of the Market research society, 30, 3.
Groves, R.M. (1991). Measurement Error Across the Disciplines. In P. Biemer et al. (Eds.). Measurement Errors in Surveys. New York: John Wiley & Sons.
Groves, R.M. and Couper, M.P. (1998). Nonresponse in Household Interview Surveys. New York: John Wiley & Sons.
Holt, D., McDonald, J.W. and Skinner, C.J. (1991). The effect of measurement error on event history analysis. In P. Biemer et al. (Eds.) Measurement Errors in Surveys. New York: John Wiley & Sons.
Granström, F. (1997). Fertility and Family Surveys in Countries of the ECE Region. Standard Country Report. Sweden. Economic Studies 10b. New York/Geneva: United Nations.
Holzer, J. Z. and I. Kowalska (1997). Fertility and family surveys in countries of the ECE region. Standard Country Report Poland. Economic Studies 10d. New York/Geneva: United Nations.
Hox, J.J., de Leeuw, E.D. and Kreft, I.G.G. (1991). The effect of interviewer and respondent characteristics on the quality of survey data: A multilevel model. In P. Biemer et al. (Eds.). Measurement Errors in Surveys. New York: John Wiley & Sons.
Kamarás, F. (1999). Fertility and family surveys in countries of the ECE region. Standard Country Report Hungary. Economic Studies 10j. New York/Geneva: United Nations.
Klijzing, E., and H. Cairns (2000). On the quality of FFS event history data: of critical importance in life course research. GLOBALIFE Working Paper Series, No. 13, Bielefeld: University of Bielefeld, Faculty of Sociology.
Knäuper B., Belli R.F., Hill D.H. and Herzog A.R. (1997). Question Difficulty and Respondents’ Cognitive Ability: The Effect on Data Quality. Journal of Official Statistics, 13, 2.
Kupek, E. (1998). Determinants of item nonresponse in a large national sex survey. Archives of Sexual Behavior, 27, 6.
Leigh, J.H. and Martin Jr., C.R. (1987). “Don’t Know” Item Nonresponse in a Telephone Survey: Effects of Question Form and Respondent Characteristics. Journal of Marketing Research, 24, 418-424.
Lodewijckx, E. (1999). Fertility and family surveys in countries of the ECE region. Standard Country Report Belgium. Economic Studies 10l. New York/Geneva: United Nations.
Nikander, T. (1998). Fertility and Family Surveys in Countries of the ECE Region, Standard Country Report Finland. Economic Studies 10g. New York/Geneva: United Nations.
Noack, T. and L. Østby (1996). Fertility and family surveys in countries of the ECE region. Standard Country Report Norway. Economic Studies 10a. New York/Geneva: United Nations.
Obersnel D., Kozuk Novak M., Cernic M., Sircelj V., Vehovar V. and Rojnick B. (2001). Fertility and Family Surveys in Countries of the ECE Region, Standard Country Report Slovenia. Economic Studies 10r. New York/Geneva:
Prinz, C., W. Lutz, V.Nowak, and C. Pfeiffer (1998). Fertility and Family Surveys in Countries of the ECE Region, Standard Country Report Austria. Economic Studies 10h. New York/Geneva: United Nations.
Rychtarikova J. and K. Jaroslav (2001). Fertility and Family Surveys in Countries of the ECE Region, Standard Country Report Czech Republic. Economic Studies 10v. New York/Geneva: United Nations.
Sanchez, M.E. and Morchio, G. (1992). Probing “don’t know” answers; Effects on survey estimation and variable relationships. Public Opinion Quarterly, 56, 454-474.
DATA QUALITY ISSUES IN COMPARATIVE SURVEYS 155
Stankuniene, V, M. Baublyte, V. Kanopiene and Mikulioniene (2000) Fertility and family surveys in countries of the ECE region. Standard Country Report Lithuania. Economic Studies 10q. New York/Geneva: United Nations.
Toulemon, L., and C. de Guibert-Lantoine (1998). Fertility and Family Surveys in Countries of the ECE Region. Standard Country Report. France. Economic Studies 10e. United Nations: New York/Geneva: United Nations
United Nations (1993). FFS Standard Recode Files
and Standard Country Reports. Geneva: United Nations.
Zheng Wu (1999). Fertility and family surveys in countries of the ECE region. Standard Country Report Canada. Economic Studies 10k. New York/Geneva: United Nations.
Zvidrins P., L. Ezera and A. Greitas (1998) Fertility and family surveys in countries of the ECE region. Standard Country Report. Latvia. Economic Studies 10f. New York/Geneva: United Nations.
ENDNOTES i I wish to thank the Advisory Group of the FFS program of comparative research for its permission, granted under identification number 56, to use the FFS data on which this study is based.
CHAPTER 10 COMPARING THE 1988 INTERNATIONAL STANDARD CLASSIFICATION OF EDUCATION (ISCED) WITH RETROSPECTIVE INFORMATION FROM
EDUCATIONAL HISTORIESi
Edith Dourleijn, Aart C. Liefbroer and Gijs C.N. Beets ∗
∗ Netherlands Interdisciplinary Demographic Institute, The Hague (The Netherlands)
157
A. INTRODUCTION Educational attainment is an important determinant of almost all demographic behaviour. This is true with regard to mortality (Kunst, 1997), migration (Kritz et al., 1992; Massey and Espinosa, 1997), and also family formation. For instance, higher educated persons marry and have their first child later than the lower educated (Blossfeld and Huinink, 1991; Liefbroer and Corijn, 1999).
Although educational attainment seems to delay family formation in all Western European countries (Blossfeld, 1995), it is as yet unclear whether this impact is basically the same in all of them or whether there is substantial differentiation. In addition, it is still unknown whether its impact in Eastern Europe is comparable to that in Western Europe.
The FFS data are in principle
ideally suited to shed light on such issues. The full exploitation of this potential, however, depends on the availability of an indicator on educational attainment that is truly comparable across nations. Differences observed in the effects of educational attainment on family formation can only be safely attributed to substantive differences between the countries - rather than to measurement errors - if educational attainment is measured in an equivalent way in all countries. Given that national educational systems differ widely, the valid
and reliable measurement of educational attainment is by no means self-evident. Measuring educational attainment was in the FFS project accomplished by classifying the highest level of education that people had completed according to the International Standard Classification of Education (ISCED) of 1988. However, it is unclear whether the resulting indicator is entirely reliable. For instance, comparing the distribution of women by educational level for 15 countries, Beets (1997) found considerable differences, and he expressed serious doubts about the reliability of this measure.
In this chapter we study the quality
of the ISCED indicator by comparing its properties with those of an alternative indicator on educational attainment, one that is derived from people’s educational histories. For brevity’s sake we will call this the career indicator. The comparison will be made in two steps. First, we will compare the two indicators with regard to how respondents within and between countries are distributed across different levels of educational attainment. Second, differences in the impact of educational attainment according to these two indicators on the timing of the birth of the first child will be analysed and discussed.
B. MEASUREMENT ISSUES A major issue in comparative research always concerns the cross-national comparability of data. As said before, one
158 FERTILITY AND PARTNERSHIP IN EUROPE
can only safely attribute differences observed between countries to substantive causes if the central concept was measured in an equivalent way in all of them (Welkenhuysen-Gybels and Billiet, 1999). In general, three levels of equivalence can be distinguished in cross-national comparative research, namely, construct equivalence, measurement unit equivalence, and scalar equivalence or full-score comparability (Van de Vijver and Leung, 1997). Construct equivalence presupposes that an indicator measures the same latent concept in all countries. Measurement unit equivalence presupposes furthermore that an indicator measures the concept at the same interval scale in all countries. Finally, scalar equivalence presupposes that the indicator measures the concept at the same ratio scale in all countries. The higher its level of equivalence is, the better a measure serves the purpose of comparative research. As will be clear, constructing such equivalent measures - and in particular indicators with measurement unit or scalar equivalence - is by no means simple.
When studying the impact of educational attainment on family formation, the problem of equivalence is particularly relevant, for two reasons. A first is that educational attainment is a very important determinant of family formation behaviour. This is evident, for instance, in Becker’s (1981) economic theory of fertility. He assumes that having children and pursuing a professional career are hard to combine. This implies that forming a family reduces the time that women can spend in a paid job, thus lowering their earnings. For higher educated women these so-called opportunity costs are larger than for lower educated women. Consequently, the former will postpone childbearing to a larger extent than the latter will. Various studies (cf. Blossfeld, 1995; Liefbroer and Corijn, 1999) have indeed confirmed that higher educated women have their first child later than women with a lower level of education. However, this research has also suggested that these differentials might vary across countries depending on the structural opportunities for, and cultural
ideas about, combining motherhood and a paid job. If this is true, it becomes extremely important that equivalent measures of educational attainment are available. Otherwise, one could falsely attribute differences observed between countries to substantive causes whereas in truth they might be due to the differing ways in which the concept was measured.
A second reason why the problem
of equivalence is particularly important in cross-country analyses of educational attainment is that national educational systems vary widely. It is quite difficult, for instance, to compare curricula from different countries and to attach an educational attainment score to each school type in an unambiguous way. In 1976, in a first attempt to partially overcome such problems, the UNESCO developed ISCED, an international standard classification of education that was revised in 1988 and again in 1997 (OECD, 1999). The 1988 version consists of seven categories, which in the FFS project were recoded from 0 to 6. Categories 0 and 1 are for people who only attained primary education or part thereof. Categories 2 and 3 correspond to the first and second stages of secondary education. Finally, the highest three categories 4, 5 and 6 represent vocational and (post)graduate education. However, the problem with this classification in the FFS project was that every participating country had to decide for itself which ISCED code to give to each national type of education. This procedure can easily lead to differences between countries in the ISCED codes given to particular curricula that are otherwise quite comparable. Or, conversely, identical scores may be assigned to educational curricula that are widely distinct. Eurostat (1996, p. 91) has warned, therefore, that ‘international comparisons are complicated by different national applications of ISCED and numerous variations in national education and training systems’.
Given this situation two questions
can be posed. First, are there any reasons to suspect that the ISCED coding in the FFS datasets contains serious flaws as an
COMPARING ISCED WITH RETROSPECTIVE INFORMATION 159
indicator of educational attainment? And, second, are there any alternative measures available to estimate educational attainment which are better suited for purposes of comparative research?
The first question can only be
answered by examining empirical results. Two strategies seem promising in this respect. First, one can compare the distribution of persons across educational levels in the various FFS countries. Our basic assumption here is that differences in educational level between countries are to be expected but that generally speaking they will not be very large. After all, educational expansion has taken place in almost all Western European countries, and in many Eastern European as well. In particular, we would expect relatively small differences in the distribution of persons by their level of education between countries within the same European region. Should large and unexpected differences still occur, then this could point to flaws in the ways educational level was measured, in which case the validity of the indicator becomes questionable.
A second strategy to assess the
validity of the ISCED indicator is to examine its content validity. Does educational level show the expected statistical relationships with other pertinent variables? In this chapter we will examine the relationship between educational attainment and the timing of first childbirth among women. Higher educated women are expected to postpone childbirth to a larger extent than lower educated women (Blossfeld, 1995). Do the data show this expected relationship? How much variation is there in the strength of this relationship between countries? Is this variation plausible? Liefbroer and Corijn (1999), for instance, have suggested that the impact of educational attainment on the timing of the birth of the first child will be strongest in countries where the combination of motherhood and labour force participation is problematic, no matter whether this is for structural or cultural reasons. On the other hand, the impact of educational attainment
is expected to be weaker in countries where good opportunities exist to combine motherhood and paid labour.
The second question concerns the
availability of alternative measures for educational attainment. We will propose a simple, alternative measure that is easily calculated for most countries and which in our opinion offers better prospects for good comparative research. This measure is based on the age at which people leave the educational system. It can be calculated for all countries for which this information is readily available, which is normally the case. The usefulness of this alternative indicator can be assessed by comparing its univariate and multivariate properties with those of the ISCED indicator. If our career indicator shows better validity, then this would suggest that it is better suited for comparing educational attainment in cross-country analyses.
The basic rationale for using age at
leaving the educational system as an indicator for educational attainment is the assumption that people’s educational attainment increases as they leave school at higher ages. In the same vein, people who leave school at more or less the same age in different countries will as a rule have attained (approximately) equal levels of education. Of course, many reasons may exist why two people who leave school at more or less the same age still differ in their educational attainment. For instance, one of them may have doubled a class, or switched to another type of education, or studied only part-time. However, although not all individuals who leave school at exactly the same age will have attained exactly the same level of education, it seems reasonable to assume that they have attained quite comparable levels of education, and furthermore that these levels will generally be higher than those of people who left school at younger ages. To recall, the main issue here is not that using age at leaving school is the best indicator of educational attainment one can think of, but only that it may be better than the ISCED indicator.
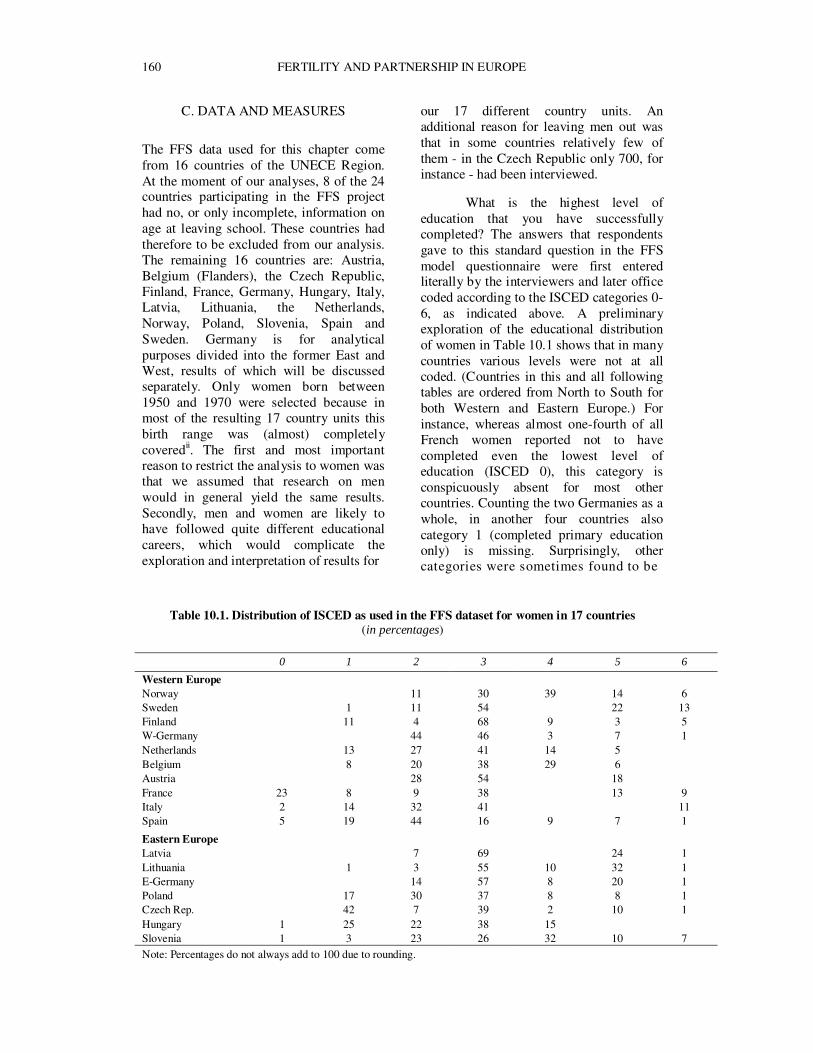
160 FERTILITY AND PARTNERSHIP IN EUROPE
C. DATA AND MEASURES
The FFS data used for this chapter come from 16 countries of the UNECE Region. At the moment of our analyses, 8 of the 24 countries participating in the FFS project had no, or only incomplete, information on age at leaving school. These countries had therefore to be excluded from our analysis. The remaining 16 countries are: Austria, Belgium (Flanders), the Czech Republic, Finland, France, Germany, Hungary, Italy, Latvia, Lithuania, the Netherlands, Norway, Poland, Slovenia, Spain and Sweden. Germany is for analytical purposes divided into the former East and West, results of which will be discussed separately. Only women born between 1950 and 1970 were selected because in most of the resulting 17 country units this birth range was (almost) completely coveredii. The first and most important reason to restrict the analysis to women was that we assumed that research on men would in general yield the same results. Secondly, men and women are likely to have followed quite different educational careers, which would complicate the exploration and interpretation of results for
our 17 different country units. An additional reason for leaving men out was that in some countries relatively few of them - in the Czech Republic only 700, for instance - had been interviewed.
What is the highest level of
education that you have successfully completed? The answers that respondents gave to this standard question in the FFS model questionnaire were first entered literally by the interviewers and later office coded according to the ISCED categories 0-6, as indicated above. A preliminary exploration of the educational distribution of women in Table 10.1 shows that in many countries various levels were not at all coded. (Countries in this and all following tables are ordered from North to South for both Western and Eastern Europe.) For instance, whereas almost one-fourth of all French women reported not to have completed even the lowest level of education (ISCED 0), this category is conspicuously absent for most other countries. Counting the two Germanies as a whole, in another four countries also category 1 (completed primary education only) is missing. Surprisingly, other categories were sometimes found to be
Table 10.1. Distribution of ISCED as used in the FFS dataset for women in 17 countries (in percentages)
0 1 2 3 4 5 6
Western Europe Norway 11 30 39 14 6 Sweden 1 11 54 22 13 Finland 11 4 68 9 3 5 W-Germany 44 46 3 7 1 Netherlands 13 27 41 14 5 Belgium 8 20 38 29 6 Austria 28 54 18 France 23 8 9 38 13 9 Italy 2 14 32 41 11 Spain 5 19 44 16 9 7 1
Eastern Europe Latvia 7 69 24 1 Lithuania 1 3 55 10 32 1 E-Germany 14 57 8 20 1 Poland 17 30 37 8 8 1 Czech Rep. 42 7 39 2 10 1 Hungary 1 25 22 38 15 Slovenia 1 3 23 26 32 10 7
Note: Percentages do not always add to 100 due to rounding.
COMPARING ISCED WITH RETROSPECTIVE INFORMATION 161
empty as well. For example, in Hungary this is the case for the two highest categories of 5 and 6 (graduate and post-graduate education). Another example is Italy where no women were coded in ISCED levels 4 and 5 (the first two stages of tertiary education). Finally, with only ISCED levels 2, 3 and 5 present, Austria may be said to be a very special case.
Given these oddities we decided to
reduce the ISCED codes to three levels representing, respectively, low, medium and high levels of education. Women in ISCED categories 0 to 2 are considered to have attained only a low level of education; they have at most completed the first stage of secondary education. Women at ISCED level 3 have completed the second stage of secondary education and will therefore be considered as medium educated. This level generally qualifies for entry into the next stage of either vocational or (post)graduate education. Higher educated women who have completed studies at this tertiary level have ISCED scores between 4 and 6.
In addition to the standard question
on the highest level of education successfully completed, participants in most of the FFS countries here examined were also asked various questions on their educational career. For instance, the date at which they last left school is known in all countries, whereas the beginning and ending dates of all educational spells completed after age 15 are known in most of them. Using this information an alternative variable for measuring educational attainment was constructed: the final age at which a woman leaves school is considered to indicate the amount of education she has attained. However, sometimes women have interrupted their educational careers. For countries where the complete educational career is known, these interruptions have been taken into account. The general rule is that we look at the age at which women completed their last education. We only deviate from this rule if women have interrupted their educational career for more than eighteen months. In that case it is her age at which she first left school that is being used as an
indicator of her level of educational attainment. Unfortunately, in Belgium (Flanders), East and West Germany and the Netherlands information on the complete educational career is unavailable. In these countries only the final date at which women left school is known and, consequently, this is the date to be used for them in this study. If women are still enrolled in education at the time of the interview, it is their age at interview that is being taken as the indicator for their educational attainmentiii. To facilitate comparison with the ISCED indicator, the information on the age at which women left school has been categorised into three levels. Women who left school before they turned 17 were classified as having attained a low level of education. At this age women have almost certainly completed the first stage of secondary education. Women who left school between the ages of 17 and 20 were classified as being medium educated. Finally, women with more than 5 years of education after age 15 are considered to be higher educated. These women are at least 20 years old when leaving school, and generally they will have completed some type of tertiary educationiv.
D. ANALYSIS STRATEGY To explore the quality of the ISCED and the alternative career indicator we will first compare the distribution of women across the three levels of education in all countries according to both of them. Unfortunately, an objective external criterion with which to judge their relative qualities is not readily available. However, given the fact that most countries have experienced a strong educational expansion in the last decades, one would expect relatively small differences between them, and in particular between countries within the same European region. In addition, one would expect that younger cohorts have attained a higher mean level of education than older cohorts.
To examine the content validity of the two indicators we will estimate the impact of educational attainment on entry into first motherhood by using a relatively
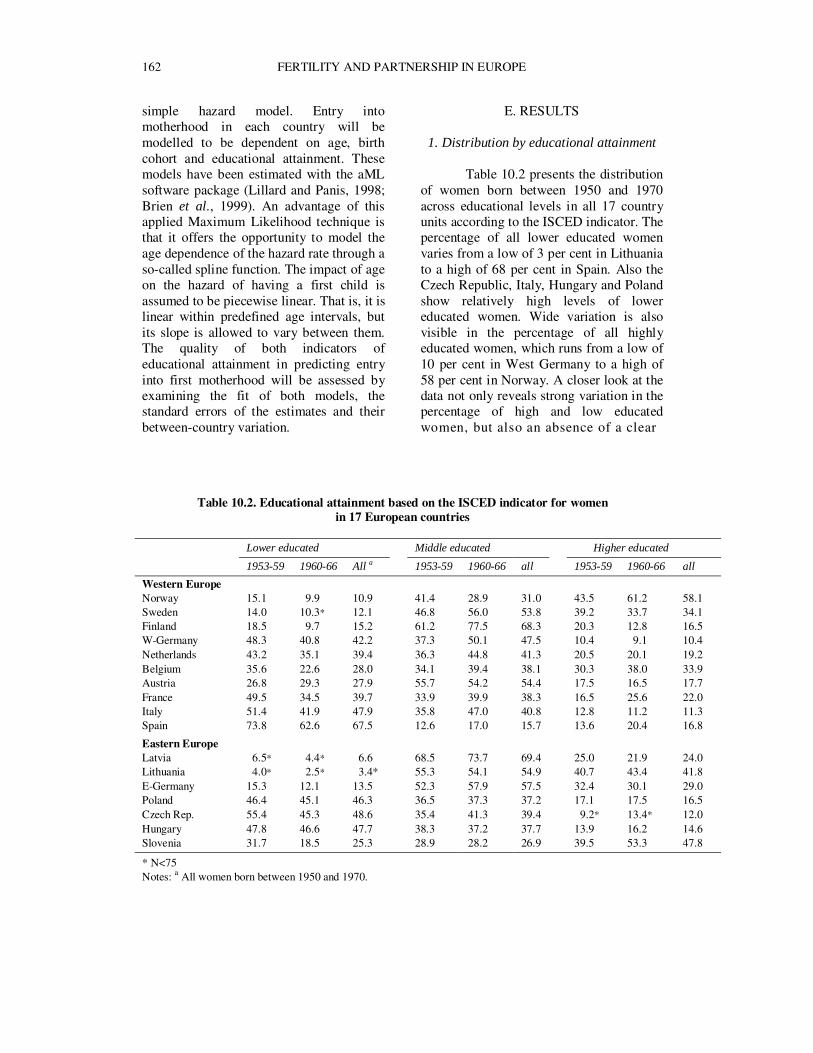
162 FERTILITY AND PARTNERSHIP IN EUROPE
simple hazard model. Entry into motherhood in each country will be modelled to be dependent on age, birth cohort and educational attainment. These models have been estimated with the aML software package (Lillard and Panis, 1998; Brien et al., 1999). An advantage of this applied Maximum Likelihood technique is that it offers the opportunity to model the age dependence of the hazard rate through a so-called spline function. The impact of age on the hazard of having a first child is assumed to be piecewise linear. That is, it is linear within predefined age intervals, but its slope is allowed to vary between them. The quality of both indicators of educational attainment in predicting entry into first motherhood will be assessed by examining the fit of both models, the standard errors of the estimates and their between-country variation.
E. RESULTS
1. Distribution by educational attainment
Table 10.2 presents the distribution of women born between 1950 and 1970 across educational levels in all 17 country units according to the ISCED indicator. The percentage of all lower educated women varies from a low of 3 per cent in Lithuania to a high of 68 per cent in Spain. Also the Czech Republic, Italy, Hungary and Poland show relatively high levels of lower educated women. Wide variation is also visible in the percentage of all highly educated women, which runs from a low of 10 per cent in West Germany to a high of 58 per cent in Norway. A closer look at the data not only reveals strong variation in the percentage of high and low educated women, but also an absence of a clear
Table 10.2. Educational attainment based on the ISCED indicator for women
in 17 European countries Lower educated Middle educated Higher educated
1953-59 1960-66 All a 1953-59 1960-66 all 1953-59 1960-66 all
Western Europe Norway 15.1 9.9 10.9 41.4 28.9 31.0 43.5 61.2 58.1 Sweden 14.0 10.3* 12.1 46.8 56.0 53.8 39.2 33.7 34.1 Finland 18.5 9.7 15.2 61.2 77.5 68.3 20.3 12.8 16.5 W-Germany 48.3 40.8 42.2 37.3 50.1 47.5 10.4 9.1 10.4 Netherlands 43.2 35.1 39.4 36.3 44.8 41.3 20.5 20.1 19.2 Belgium 35.6 22.6 28.0 34.1 39.4 38.1 30.3 38.0 33.9 Austria 26.8 29.3 27.9 55.7 54.2 54.4 17.5 16.5 17.7 France 49.5 34.5 39.7 33.9 39.9 38.3 16.5 25.6 22.0 Italy 51.4 41.9 47.9 35.8 47.0 40.8 12.8 11.2 11.3 Spain 73.8 62.6 67.5 12.6 17.0 15.7 13.6 20.4 16.8
Eastern Europe Latvia 6.5* 4.4* 6.6 68.5 73.7 69.4 25.0 21.9 24.0 Lithuania 4.0* 2.5* 3.4* 55.3 54.1 54.9 40.7 43.4 41.8 E-Germany 15.3 12.1 13.5 52.3 57.9 57.5 32.4 30.1 29.0 Poland 46.4 45.1 46.3 36.5 37.3 37.2 17.1 17.5 16.5 Czech Rep. 55.4 45.3 48.6 35.4 41.3 39.4 9.2* 13.4* 12.0 Hungary 47.8 46.6 47.7 38.3 37.2 37.7 13.9 16.2 14.6 Slovenia 31.7 18.5 25.3 28.9 28.2 26.9 39.5 53.3 47.8
* N<75 Notes: a All women born between 1950 and 1970.
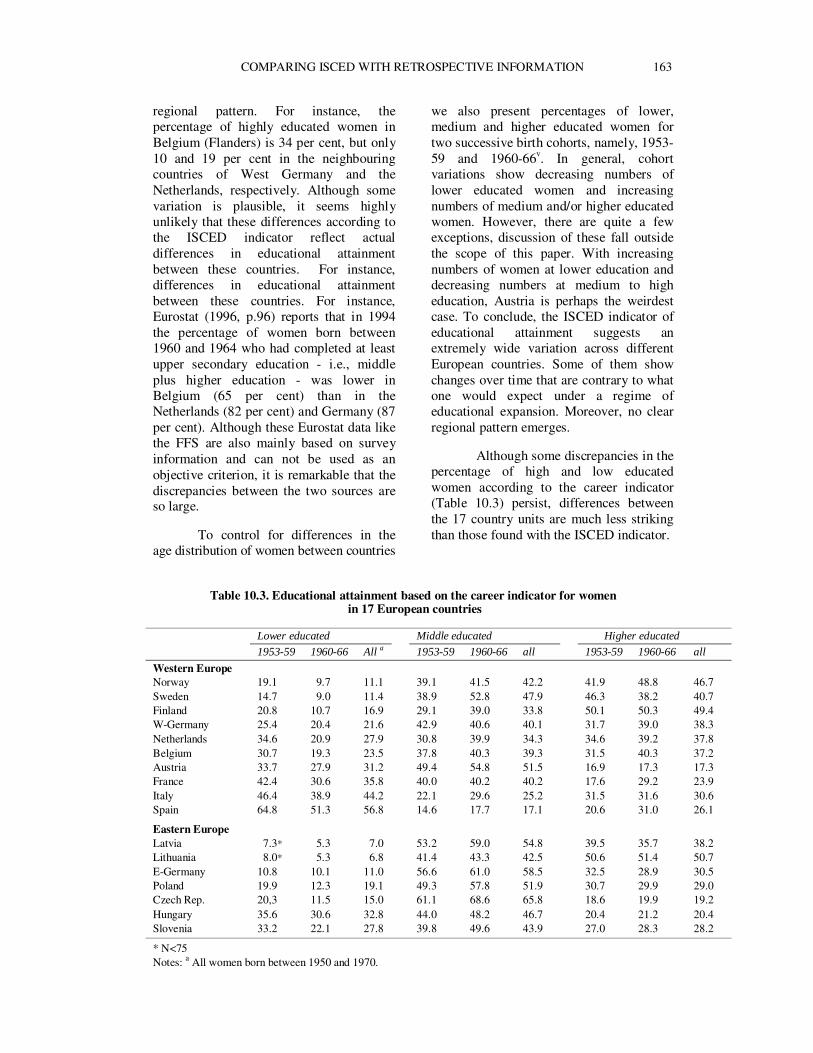
COMPARING ISCED WITH RETROSPECTIVE INFORMATION 163
regional pattern. For instance, the percentage of highly educated women in Belgium (Flanders) is 34 per cent, but only 10 and 19 per cent in the neighbouring countries of West Germany and the Netherlands, respectively. Although some variation is plausible, it seems highly unlikely that these differences according to the ISCED indicator reflect actual differences in educational attainment between these countries. For instance, differences in educational attainment between these countries. For instance, Eurostat (1996, p.96) reports that in 1994 the percentage of women born between 1960 and 1964 who had completed at least upper secondary education - i.e., middle plus higher education - was lower in Belgium (65 per cent) than in the Netherlands (82 per cent) and Germany (87 per cent). Although these Eurostat data like the FFS are also mainly based on survey information and can not be used as an objective criterion, it is remarkable that the discrepancies between the two sources are so large.
To control for differences in the age distribution of women between countries
we also present percentages of lower, medium and higher educated women for two successive birth cohorts, namely, 1953-59 and 1960-66v. In general, cohort variations show decreasing numbers of lower educated women and increasing numbers of medium and/or higher educated women. However, there are quite a few exceptions, discussion of these fall outside the scope of this paper. With increasing numbers of women at lower education and decreasing numbers at medium to high education, Austria is perhaps the weirdest case. To conclude, the ISCED indicator of educational attainment suggests an extremely wide variation across different European countries. Some of them show changes over time that are contrary to what one would expect under a regime of educational expansion. Moreover, no clear regional pattern emerges.
Although some discrepancies in the
percentage of high and low educated women according to the career indicator (Table 10.3) persist, differences between the 17 country units are much less striking than those found with the ISCED indicator.
Table 10.3. Educational attainment based on the career indicator for women
in 17 European countries Lower educated Middle educated Higher educated
1953-59 1960-66 All a 1953-59 1960-66 all 1953-59 1960-66 all
Western Europe Norway 19.1 9.7 11.1 39.1 41.5 42.2 41.9 48.8 46.7 Sweden 14.7 9.0 11.4 38.9 52.8 47.9 46.3 38.2 40.7 Finland 20.8 10.7 16.9 29.1 39.0 33.8 50.1 50.3 49.4 W-Germany 25.4 20.4 21.6 42.9 40.6 40.1 31.7 39.0 38.3 Netherlands 34.6 20.9 27.9 30.8 39.9 34.3 34.6 39.2 37.8 Belgium 30.7 19.3 23.5 37.8 40.3 39.3 31.5 40.3 37.2 Austria 33.7 27.9 31.2 49.4 54.8 51.5 16.9 17.3 17.3 France 42.4 30.6 35.8 40.0 40.2 40.2 17.6 29.2 23.9 Italy 46.4 38.9 44.2 22.1 29.6 25.2 31.5 31.6 30.6 Spain 64.8 51.3 56.8 14.6 17.7 17.1 20.6 31.0 26.1
Eastern Europe Latvia 7.3* 5.3 7.0 53.2 59.0 54.8 39.5 35.7 38.2 Lithuania 8.0* 5.3 6.8 41.4 43.3 42.5 50.6 51.4 50.7 E-Germany 10.8 10.1 11.0 56.6 61.0 58.5 32.5 28.9 30.5 Poland 19.9 12.3 19.1 49.3 57.8 51.9 30.7 29.9 29.0 Czech Rep. 20,3 11.5 15.0 61.1 68.6 65.8 18.6 19.9 19.2 Hungary 35.6 30.6 32.8 44.0 48.2 46.7 20.4 21.2 20.4 Slovenia 33.2 22.1 27.8 39.8 49.6 43.9 27.0 28.3 28.2
* N<75 Notes: a All women born between 1950 and 1970.
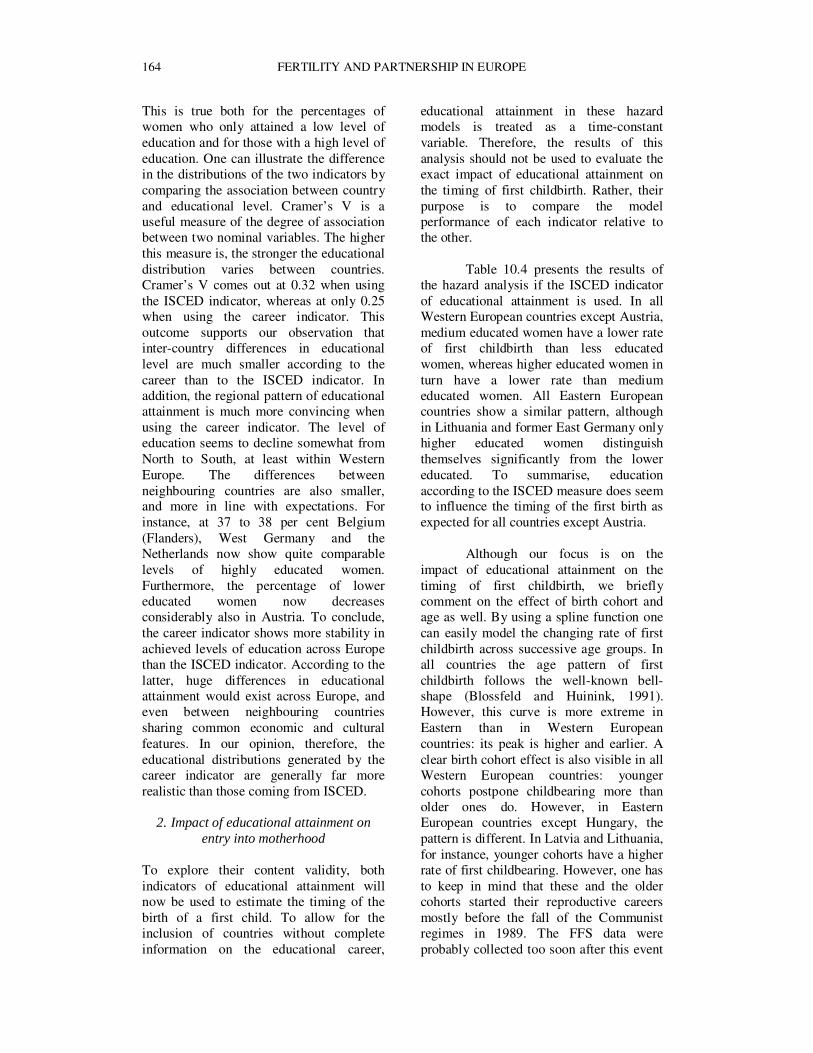
164 FERTILITY AND PARTNERSHIP IN EUROPE
This is true both for the percentages of women who only attained a low level of education and for those with a high level of education. One can illustrate the difference in the distributions of the two indicators by comparing the association between country and educational level. Cramer’s V is a useful measure of the degree of association between two nominal variables. The higher this measure is, the stronger the educational distribution varies between countries. Cramer’s V comes out at 0.32 when using the ISCED indicator, whereas at only 0.25 when using the career indicator. This outcome supports our observation that inter-country differences in educational level are much smaller according to the career than to the ISCED indicator. In addition, the regional pattern of educational attainment is much more convincing when using the career indicator. The level of education seems to decline somewhat from North to South, at least within Western Europe. The differences between neighbouring countries are also smaller, and more in line with expectations. For instance, at 37 to 38 per cent Belgium (Flanders), West Germany and the Netherlands now show quite comparable levels of highly educated women. Furthermore, the percentage of lower educated women now decreases considerably also in Austria. To conclude, the career indicator shows more stability in achieved levels of education across Europe than the ISCED indicator. According to the latter, huge differences in educational attainment would exist across Europe, and even between neighbouring countries sharing common economic and cultural features. In our opinion, therefore, the educational distributions generated by the career indicator are generally far more realistic than those coming from ISCED.
2. Impact of educational attainment on
entry into motherhood
To explore their content validity, both indicators of educational attainment will now be used to estimate the timing of the birth of a first child. To allow for the inclusion of countries without complete information on the educational career,
educational attainment in these hazard models is treated as a time-constant variable. Therefore, the results of this analysis should not be used to evaluate the exact impact of educational attainment on the timing of first childbirth. Rather, their purpose is to compare the model performance of each indicator relative to the other.
Table 10.4 presents the results of
the hazard analysis if the ISCED indicator of educational attainment is used. In all Western European countries except Austria, medium educated women have a lower rate of first childbirth than less educated women, whereas higher educated women in turn have a lower rate than medium educated women. All Eastern European countries show a similar pattern, although in Lithuania and former East Germany only higher educated women distinguish themselves significantly from the lower educated. To summarise, education according to the ISCED measure does seem to influence the timing of the first birth as expected for all countries except Austria.
Although our focus is on the
impact of educational attainment on the timing of first childbirth, we briefly comment on the effect of birth cohort and age as well. By using a spline function one can easily model the changing rate of first childbirth across successive age groups. In all countries the age pattern of first childbirth follows the well-known bell-shape (Blossfeld and Huinink, 1991). However, this curve is more extreme in Eastern than in Western European countries: its peak is higher and earlier. A clear birth cohort effect is also visible in all Western European countries: younger cohorts postpone childbearing more than older ones do. However, in Eastern European countries except Hungary, the pattern is different. In Latvia and Lithuania, for instance, younger cohorts have a higher rate of first childbearing. However, one has to keep in mind that these and the older cohorts started their reproductive careers mostly before the fall of the Communist regimes in 1989. The FFS data were probably collected too soon after this event
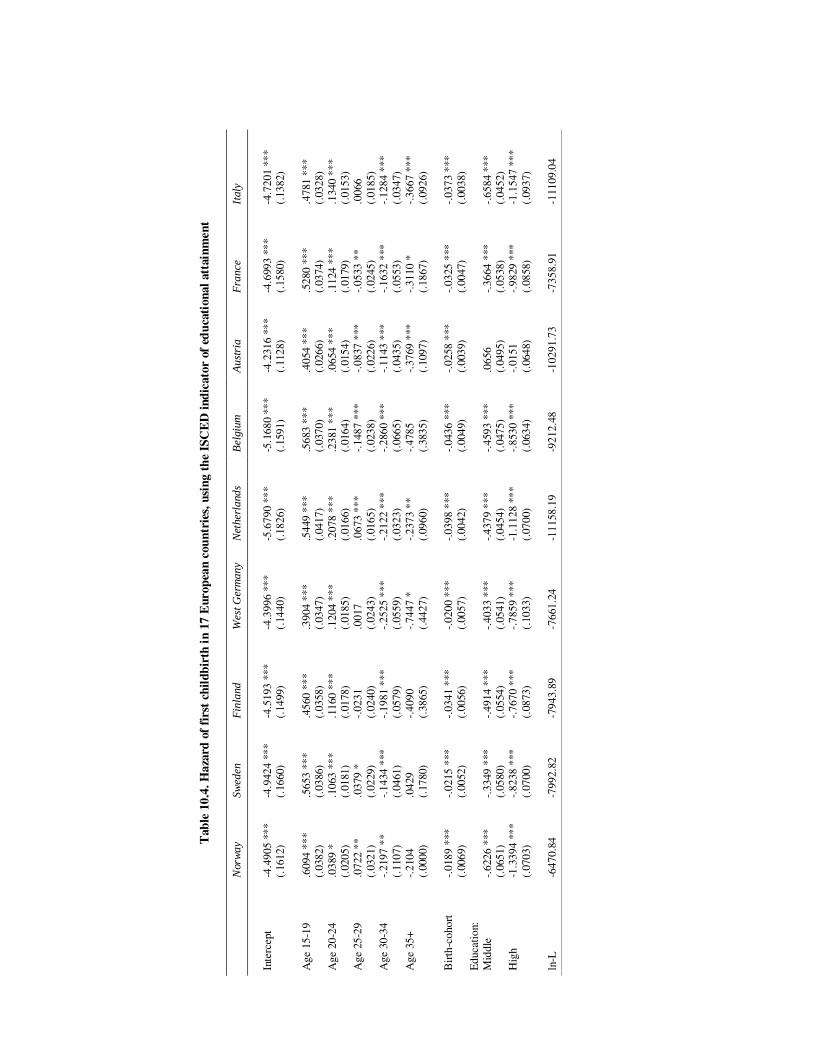
T
able
10.
4. H
azar
d of
fir
st c
hild
birt
h in
17
Eur
opea
n co
untr
ies,
usi
ng t
he I
SCE
D in
dica
tor
of e
duc
atio
nal a
ttai
nmen
t
Nor
way
Sw
eden
F
inla
nd
Wes
t Ger
man
y N
ethe
rlan
ds
Bel
gium
A
ustr
ia
Fra
nce
Ital
y
Inte
rcep
t -4
.490
5 **
* -4
.942
4 **
* -4
.519
3 **
* -4
.399
6 **
* -5
.679
0 **
* -5
.168
0 **
* -4
.231
6 **
* -4
.699
3 **
* -4
.720
1 **
*
(.
1612
) (.
1660
) (.
1499
) (.
1440
) (.
1826
) (.
1591
) (.
1128
) (.
1580
) (.
1382
)
Age
15-
19
.609
4 **
* .5
653
***
.456
0 **
* .3
904
***
.544
9 **
* .5
683
***
.405
4 **
* .5
280
***
.478
1 **
*
(.
0382
) (.
0386
) (.
0358
) (.
0347
) (.
0417
) (.
0370
) (.
0266
) (.
0374
) (.
0328
)
Age
20-
24
.038
9 *
.106
3 **
* .1
160
***
.120
4 **
* .2
078
***
.238
1 **
* .0
654
***
.112
4 **
* .1
340
***
(.02
05)
(.01
81)
(.01
78)
(.01
85)
(.01
66)
(.01
64)
(.01
54)
(.01
79)
(.01
53)
A
ge 2
5-29
.0
722
**
.037
9 *
-.02
31
.001
7 .0
673
***
-.14
87 *
**
-.08
37 *
**
-.05
33 *
* .0
066
(.03
21)
(.02
29)
(.02
40)
(.02
43)
(.01
65)
(.02
38)
(.02
26)
(.02
45)
(.01
85)
A
ge 3
0-34
-.
2197
**
-.14
34 *
**
-.19
81 *
**
-.25
25 *
**
-.21
22 *
**
-.28
60 *
**
-.11
43 *
**
-.16
32 *
**
-.12
84 *
**
(.
1107
) (.
0461
) (.
0579
) (.
0559
) (.
0323
) (.
0665
) (.
0435
) (.
0553
) (.
0347
)
Age
35+
-.
2104
.0
429
-.40
90
-.74
47 *
-.
2373
**
-.47
85
-.37
69 *
**
-.31
10 *
-.
3667
***
(.00
00)
(.17
80)
(.38
65)
(.44
27)
(.09
60)
(.38
35)
(.10
97)
(.18
67)
(.09
26)
Bir
th-c
ohor
t -.
0189
***
-.
0215
***
-.
0341
***
-.
0200
***
-.
0398
***
-.
0436
***
-.
0258
***
-.
0325
***
-.
0373
***
E
duca
tion
: (.
0069
) (.
0052
) (.
0056
) (.
0057
) (.
0042
) (.
0049
) (.
0039
) (.
0047
) (.
0038
)
Mid
dle
-.
6226
***
-.
3349
***
-.
4914
***
-.
4033
***
-.
4379
***
-.
4593
***
.0
656
-.36
64 *
**
-.65
84 *
**
(.
0651
) (.
0580
) (.
0554
) (.
0541
) (.
0454
) (.
0475
) (.
0495
) (.
0538
) (.
0452
)
Hig
h -1
.339
4 **
* -.
8238
***
-.
7670
***
-.
7859
***
-1
.112
8 **
* -.
8530
***
-.
0151
-.
9829
***
-1
.154
7 **
*
(.
0703
) (.
0700
) (.
0873
) (.
1033
) (.
0700
) (.
0634
) (.
0648
) (.
0858
) (.
0937
)
ln-L
-6
470.
84
-799
2.82
-7
943.
89
-766
1.24
-1
1158
.19
-921
2.48
-1
0291
.73
-735
8.91
-1
1109
.04
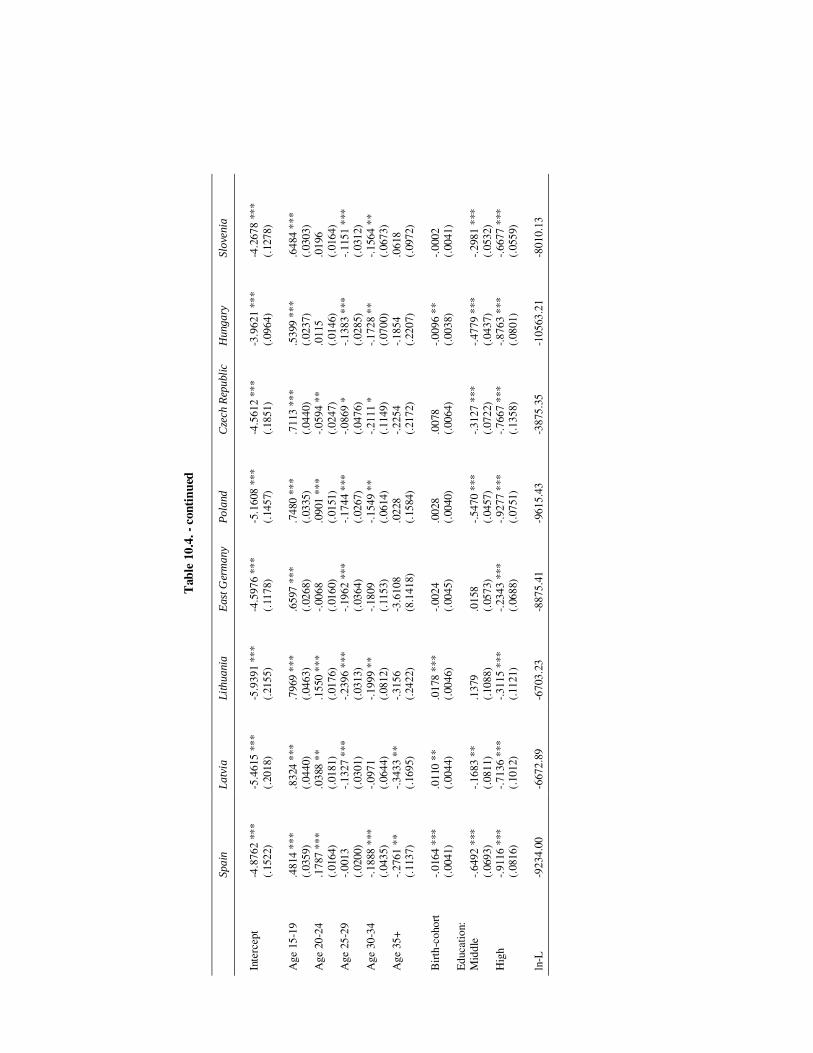
T
able
10.
4. -
cont
inue
d
Spai
n L
atvi
a Li
thua
nia
Eas
t Ger
man
y P
olan
d C
zech
Rep
ublic
H
unga
ry
Slov
enia
In
terc
ept
-4.8
762
***
-5.4
615
***
-5.9
391
***
-4.5
976
***
-5.1
608
***
-4.5
612
***
-3.9
621
***
-4.2
678
***
(.15
22)
(.20
18)
(.21
55)
(.11
78)
(.14
57)
(.18
51)
(.09
64)
(.12
78)
Age
15-
19
.481
4 **
* .8
324
***
.796
9 **
* .6
597
***
.748
0 **
* .7
113
***
.539
9 **
* .6
484
***
(.03
59)
(.04
40)
(.04
63)
(.02
68)
(.03
35)
(.04
40)
(.02
37)
(.03
03)
A
ge 2
0-24
.1
787
***
.038
8 **
.1
550
***
-.00
68
.090
1 **
* -.
0594
**
.011
5 .0
196
(.01
64)
(.01
81)
(.01
76)
(.01
60)
(.01
51)
(.02
47)
(.01
46)
(.01
64)
A
ge 2
5-29
-.
0013
-.
1327
***
-.
2396
***
-.
1962
***
-.
1744
***
-.
0869
*
-.13
83 *
**
-.11
51 *
**
(.
0200
) (.
0301
) (.
0313
) (.
0364
) (.
0267
) (.
0476
) (.
0285
) (.
0312
)
Age
30-
34
-.18
88 *
**
-.09
71
-.19
99 *
* -.
1809
-.
1549
**
-.21
11 *
-.
1728
**
-.15
64 *
*
(.
0435
) (.
0644
) (.
0812
) (.
1153
) (.
0614
) (.
1149
) (.
0700
) (.
0673
)
Age
35+
-.
2761
**
-.34
33 *
* -.
3156
-3
.610
8 .0
228
-.22
54
-.18
54
.061
8
(.
1137
) (.
1695
) (.
2422
) (8
.141
8)
(.15
84)
(.21
72)
(.22
07)
(.09
72)
Bir
th-c
ohor
t -.
0164
***
.0
110
**
.017
8 **
* -.
0024
.0
028
.007
8 -.
0096
**
-.00
02
Edu
cati
on:
(.00
41)
(.00
44)
(.00
46)
(.00
45)
(.00
40)
(.00
64)
(.00
38)
(.00
41)
Mid
dle
-.
6492
***
-.
1683
**
.137
9 .0
158
-.54
70 *
**
-.31
27 *
**
-.47
79 *
**
-.29
81 *
**
(.
0693
) (.
0811
) (.
1088
) (.
0573
) (.
0457
) (.
0722
) (.
0437
) (.
0532
)
Hig
h -.
9116
***
-.
7136
***
-.
3115
***
-.
2343
***
-.
9277
***
-.
7667
***
-.
8763
***
-.
6677
***
(.08
16)
(.10
12)
(.11
21)
(.06
88)
(.07
51)
(.13
58)
(.08
01)
(.05
59)
ln-L
-9
234.
00
-667
2.89
-6
703.
23
-887
5.41
-9
615.
43
-387
5.35
-1
0563
.21
-801
0.13
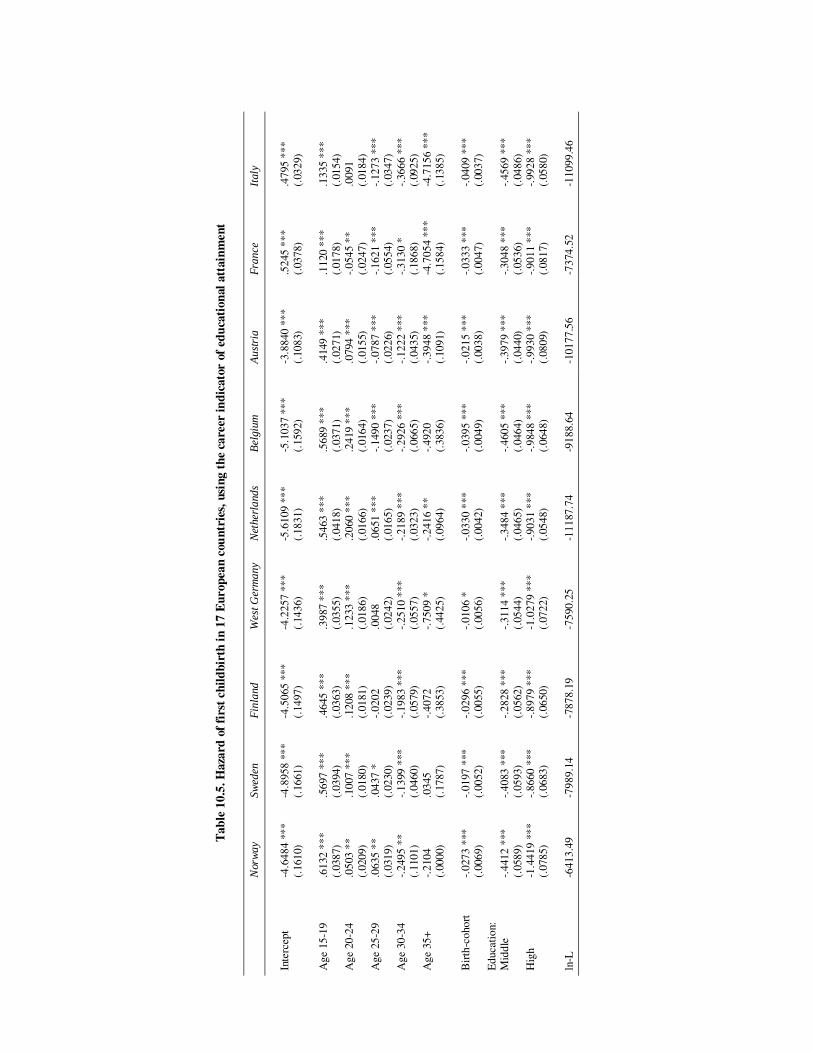
Tab
le 1
0.5.
Haz
ard
of f
irst
chi
ldbi
rth
in 1
7 E
urop
ean
cou
ntri
es, u
sing
the
car
eer
indi
cato
r of
edu
cati
onal
att
ainm
ent
N
orw
ay
Swed
en
Fin
land
W
est G
erm
any
Net
herl
ands
B
elgi
um
Aus
tria
F
ranc
e It
aly
Inte
rcep
t -4
.648
4 **
* -4
.895
8 **
* -4
.506
5 **
* -4
.225
7 **
* -5
.610
9 **
* -5
.103
7 **
* -3
.884
0 **
*
.524
5 **
* .4
795
***
(.
1610
) (.
1661
) (.
1497
) (.
1436
) (.
1831
) (.
1592
) (.
1083
)
(.03
78)
(.03
29)
Age
15-
19
.613
2 **
* .5
697
***
.464
5 **
* .3
987
***
.546
3 **
* .5
689
***
.414
9 **
*
.112
0 **
* .1
335
***
(.
0387
) (.
0394
) (.
0363
) (.
0355
) (.
0418
) (.
0371
) (.
0271
)
(.01
78)
(.01
54)
Age
20-
24
.050
3 **
.1
007
***
.120
8 **
* .1
233
***
.206
0 **
* .2
419
***
.079
4 **
*
-.05
45 *
* .0
091
(.
0209
) (.
0180
) (.
0181
) (.
0186
) (.
0166
) (.
0164
) (.
0155
)
(.02
47)
(.01
84)
Age
25-
29
.063
5 **
.0
437
* -.
0202
.0
048
.065
1 **
* -.
1490
***
-.
0787
***
-.
1621
***
-.
1273
***
(.03
19)
(.02
30)
(.02
39)
(.02
42)
(.01
65)
(.02
37)
(.02
26)
(.
0554
) (.
0347
) A
ge 3
0-34
-.
2495
**
-.13
99 *
**
-.19
83 *
**
-.25
10 *
**
-.21
89 *
**
-.29
26 *
**
-.12
22 *
**
-.31
30 *
-.
3666
***
(.11
01)
(.04
60)
(.05
79)
(.05
57)
(.03
23)
(.06
65)
(.04
35)
(.
1868
) (.
0925
) A
ge 3
5+
-.21
04
.034
5 -.
4072
-.
7509
*
-.24
16 *
* -.
4920
-.
3948
***
-4
.705
4 **
* -4
.715
6 **
*
(.00
00)
(.17
87)
(.38
53)
(.44
25)
(.09
64)
(.38
36)
(.10
91)
(.
1584
) (.
1385
)
Bir
th-c
ohor
t -.
0273
***
-.
0197
***
-.
0296
***
-.
0106
*
-.03
30 *
**
-.03
95 *
**
-.02
15 *
**
-.03
33 *
**
-.04
09 *
**
Edu
cati
on:
(.00
69)
(.00
52)
(.00
55)
(.00
56)
(.00
42)
(.00
49)
(.00
38)
(.
0047
) (.
0037
)
Mid
dle
-.
4412
***
-.
4083
***
-.
2828
***
-.
3114
***
-.
3484
***
-.
4605
***
-.
3979
***
-.
3048
***
-.
4569
***
(.05
89)
(.05
93)
(.05
62)
(.05
44)
(.04
65)
(.04
64)
(.04
40)
(.
0536
) (.
0486
) H
igh
-1.4
419
***
-.86
60 *
**
-.89
79 *
**
-1.0
279
***
-.90
31 *
**
-.98
48 *
**
-.99
30 *
**
-.90
11 *
**
-.99
28 *
**
(.
0785
) (.
0683
) (.
0650
) (.
0722
) (.
0548
) (.
0648
) (.
0809
)
(.08
17)
(.05
80)
ln-L
-6
413.
49
-798
9.14
-7
878.
19
-759
0.25
-1
1187
.74
-918
8.64
-1
0177
.56
-7
374.
52
-110
99.4
6
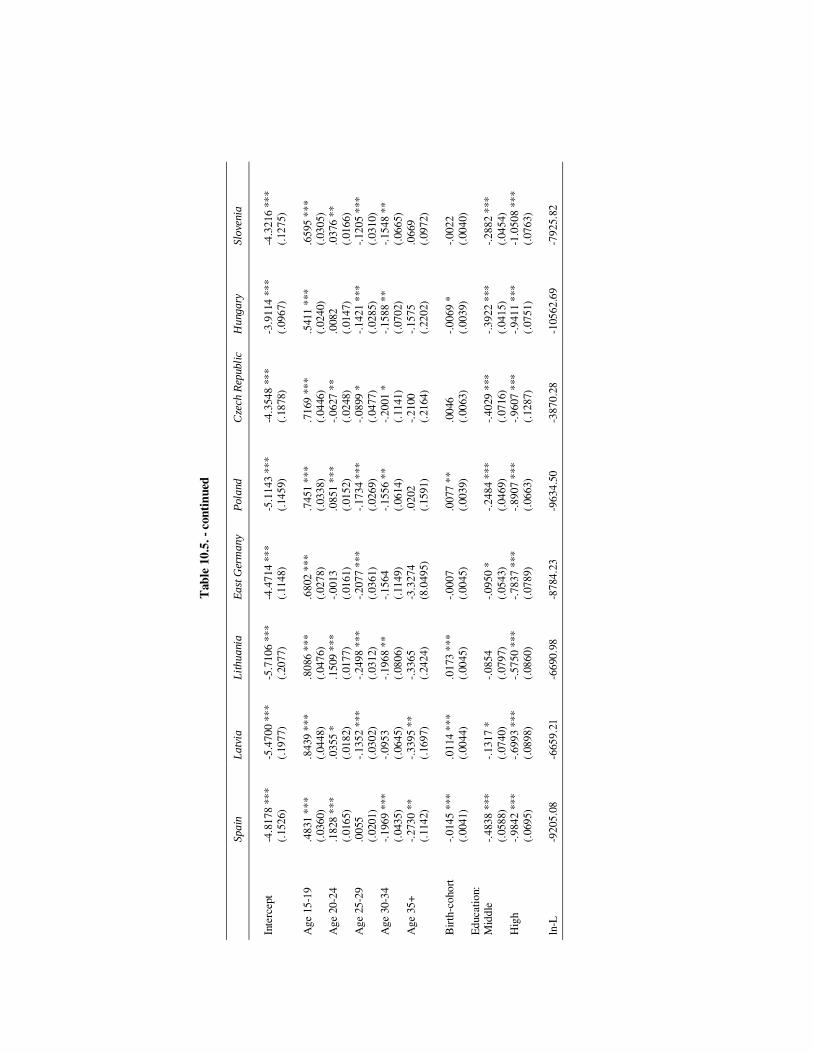
Tab
le 1
0.5.
- co
ntin
ued
Spai
n L
atvi
a L
ithu
ania
E
ast G
erm
any
Pol
and
Cze
ch R
epub
lic
Hun
gary
Sl
oven
ia
In
terc
ept
-4.8
178
***
-5.4
700
***
-5.7
106
***
-4.4
714
***
-5.1
143
***
-4
.354
8 **
* -3
.911
4 **
* -4
.321
6 **
*
(.
1526
) (.
1977
) (.
2077
) (.
1148
) (.
1459
)
(.18
78)
(.09
67)
(.12
75)
Age
15-
19
.483
1 **
* .8
439
***
.808
6 **
* .6
802
***
.745
1 **
*
.716
9 **
* .5
411
***
.659
5 **
*
(.
0360
) (.
0448
) (.
0476
) (.
0278
) (.
0338
)
(.04
46)
(.02
40)
(.03
05)
A
ge 2
0-24
.1
828
***
.035
5 *
.150
9 **
* -.
0013
.0
851
***
-.
0627
**
.008
2 .0
376
**
(.
0165
) (.
0182
) (.
0177
) (.
0161
) (.
0152
)
(.02
48)
(.01
47)
(.01
66)
A
ge 2
5-29
.0
055
-.13
52 *
**
-.24
98 *
**
-.20
77 *
**
-.17
34 *
**
-.08
99 *
-.
1421
***
-.
1205
***
(.02
01)
(.03
02)
(.03
12)
(.03
61)
(.02
69)
(.
0477
) (.
0285
) (.
0310
)
Age
30-
34
-.19
69 *
**
-.09
53
-.19
68 *
* -.
1564
-.
1556
**
-.
2001
*
-.15
88 *
* -.
1548
**
(.04
35)
(.06
45)
(.08
06)
(.11
49)
(.06
14)
(.
1141
) (.
0702
) (.
0665
)
Age
35+
-.
2730
**
-.33
95 *
* -.
3365
-3
.327
4 .0
202
-.
2100
-.
1575
.0
669
(.11
42)
(.16
97)
(.24
24)
(8.0
495)
(.
1591
)
(.21
64)
(.22
02)
(.09
72)
Bir
th-c
ohor
t -.
0145
***
.0
114
***
.017
3 **
* -.
0007
.0
077
**
.004
6 -.
0069
*
-.00
22
Edu
cati
on:
(.00
41)
(.00
44)
(.00
45)
(.00
45)
(.00
39)
(.
0063
) (.
0039
) (.
0040
)
Mid
dle
-.
4838
***
-.
1317
*
-.08
54
-.09
50 *
-.
2484
***
-.
4029
***
-.
3922
***
-.
2882
***
(.05
88)
(.07
40)
(.07
97)
(.05
43)
(.04
69)
(.
0716
) (.
0415
) (.
0454
)
Hig
h -.
9842
***
-.
6993
***
-.
5750
***
-.
7837
***
-.
8907
***
-.
9607
***
-.
9411
***
-1
.050
8 **
*
(.
0695
) (.
0898
) (.
0860
) (.
0789
) (.
0663
)
(.12
87)
(.07
51)
(.07
63)
ln-L
-9
205.
08
-665
9.21
-6
690.
98
-878
4.23
-9
634.
50
-387
0.28
-1
0562
.69
-792
5.82
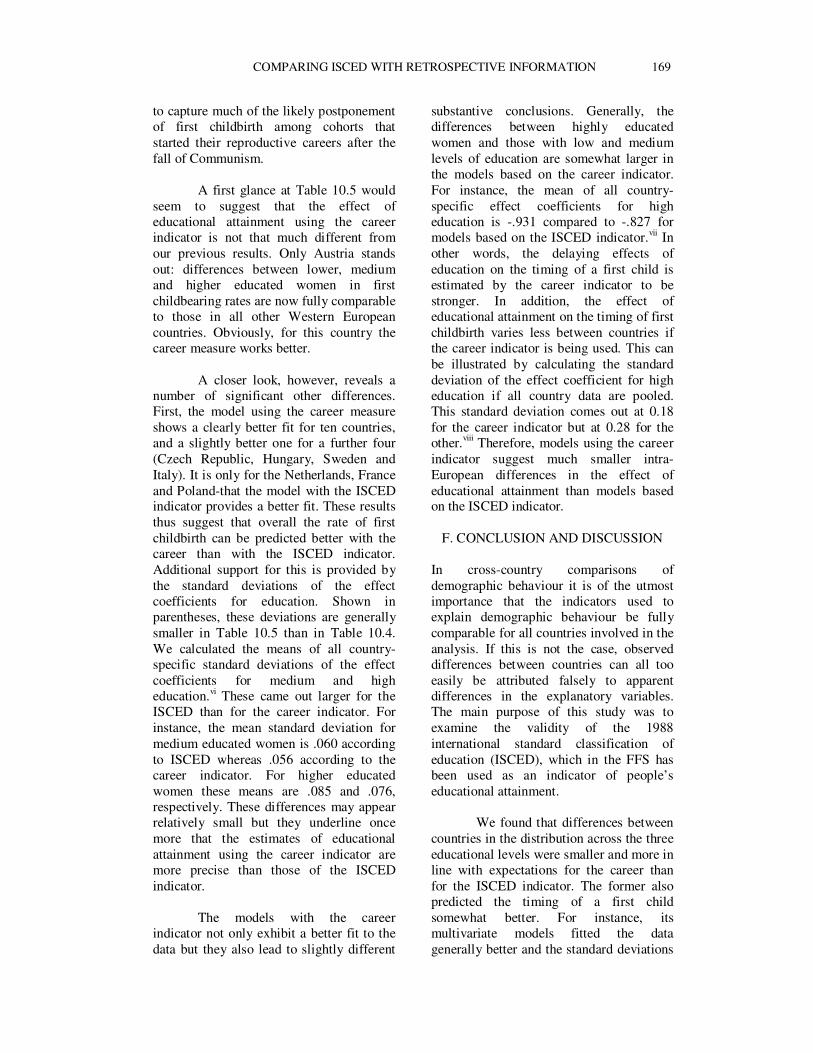
COMPARING ISCED WITH RETROSPECTIVE INFORMATION 169
to capture much of the likely postponement of first childbirth among cohorts that started their reproductive careers after the fall of Communism.
A first glance at Table 10.5 would
seem to suggest that the effect of educational attainment using the career indicator is not that much different from our previous results. Only Austria stands out: differences between lower, medium and higher educated women in first childbearing rates are now fully comparable to those in all other Western European countries. Obviously, for this country the career measure works better.
A closer look, however, reveals a
number of significant other differences. First, the model using the career measure shows a clearly better fit for ten countries, and a slightly better one for a further four (Czech Republic, Hungary, Sweden and Italy). It is only for the Netherlands, France and Poland-that the model with the ISCED indicator provides a better fit. These results thus suggest that overall the rate of first childbirth can be predicted better with the career than with the ISCED indicator. Additional support for this is provided by the standard deviations of the effect coefficients for education. Shown in parentheses, these deviations are generally smaller in Table 10.5 than in Table 10.4. We calculated the means of all country-specific standard deviations of the effect coefficients for medium and high education.vi These came out larger for the ISCED than for the career indicator. For instance, the mean standard deviation for medium educated women is .060 according to ISCED whereas .056 according to the career indicator. For higher educated women these means are .085 and .076, respectively. These differences may appear relatively small but they underline once more that the estimates of educational attainment using the career indicator are more precise than those of the ISCED indicator.
The models with the career
indicator not only exhibit a better fit to the data but they also lead to slightly different
substantive conclusions. Generally, the differences between highly educated women and those with low and medium levels of education are somewhat larger in the models based on the career indicator. For instance, the mean of all country-specific effect coefficients for high education is -.931 compared to -.827 for models based on the ISCED indicator.vii In other words, the delaying effects of education on the timing of a first child is estimated by the career indicator to be stronger. In addition, the effect of educational attainment on the timing of first childbirth varies less between countries if the career indicator is being used. This can be illustrated by calculating the standard deviation of the effect coefficient for high education if all country data are pooled. This standard deviation comes out at 0.18 for the career indicator but at 0.28 for the other.viii Therefore, models using the career indicator suggest much smaller intra-European differences in the effect of educational attainment than models based on the ISCED indicator.
F. CONCLUSION AND DISCUSSION In cross-country comparisons of demographic behaviour it is of the utmost importance that the indicators used to explain demographic behaviour be fully comparable for all countries involved in the analysis. If this is not the case, observed differences between countries can all too easily be attributed falsely to apparent differences in the explanatory variables. The main purpose of this study was to examine the validity of the 1988 international standard classification of education (ISCED), which in the FFS has been used as an indicator of people’s educational attainment.
We found that differences between countries in the distribution across the three educational levels were smaller and more in line with expectations for the career than for the ISCED indicator. The former also predicted the timing of a first child somewhat better. For instance, its multivariate models fitted the data generally better and the standard deviations
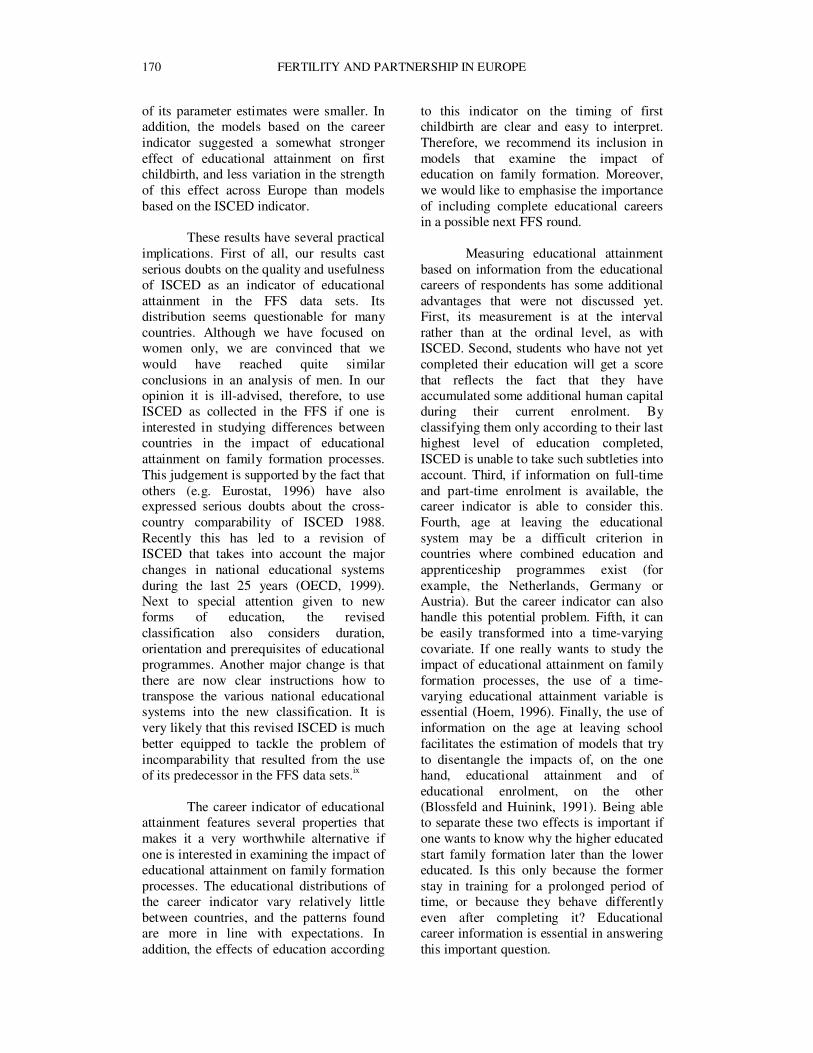
170 FERTILITY AND PARTNERSHIP IN EUROPE
of its parameter estimates were smaller. In addition, the models based on the career indicator suggested a somewhat stronger effect of educational attainment on first childbirth, and less variation in the strength of this effect across Europe than models based on the ISCED indicator.
These results have several practical
implications. First of all, our results cast serious doubts on the quality and usefulness of ISCED as an indicator of educational attainment in the FFS data sets. Its distribution seems questionable for many countries. Although we have focused on women only, we are convinced that we would have reached quite similar conclusions in an analysis of men. In our opinion it is ill-advised, therefore, to use ISCED as collected in the FFS if one is interested in studying differences between countries in the impact of educational attainment on family formation processes. This judgement is supported by the fact that others (e.g. Eurostat, 1996) have also expressed serious doubts about the cross-country comparability of ISCED 1988. Recently this has led to a revision of ISCED that takes into account the major changes in national educational systems during the last 25 years (OECD, 1999). Next to special attention given to new forms of education, the revised classification also considers duration, orientation and prerequisites of educational programmes. Another major change is that there are now clear instructions how to transpose the various national educational systems into the new classification. It is very likely that this revised ISCED is much better equipped to tackle the problem of incomparability that resulted from the use of its predecessor in the FFS data sets.ix
The career indicator of educational
attainment features several properties that makes it a very worthwhile alternative if one is interested in examining the impact of educational attainment on family formation processes. The educational distributions of the career indicator vary relatively little between countries, and the patterns found are more in line with expectations. In addition, the effects of education according
to this indicator on the timing of first childbirth are clear and easy to interpret. Therefore, we recommend its inclusion in models that examine the impact of education on family formation. Moreover, we would like to emphasise the importance of including complete educational careers in a possible next FFS round.
Measuring educational attainment
based on information from the educational careers of respondents has some additional advantages that were not discussed yet. First, its measurement is at the interval rather than at the ordinal level, as with ISCED. Second, students who have not yet completed their education will get a score that reflects the fact that they have accumulated some additional human capital during their current enrolment. By classifying them only according to their last highest level of education completed, ISCED is unable to take such subtleties into account. Third, if information on full-time and part-time enrolment is available, the career indicator is able to consider this. Fourth, age at leaving the educational system may be a difficult criterion in countries where combined education and apprenticeship programmes exist (for example, the Netherlands, Germany or Austria). But the career indicator can also handle this potential problem. Fifth, it can be easily transformed into a time-varying covariate. If one really wants to study the impact of educational attainment on family formation processes, the use of a time-varying educational attainment variable is essential (Hoem, 1996). Finally, the use of information on the age at leaving school facilitates the estimation of models that try to disentangle the impacts of, on the one hand, educational attainment and of educational enrolment, on the other (Blossfeld and Huinink, 1991). Being able to separate these two effects is important if one wants to know why the higher educated start family formation later than the lower educated. Is this only because the former stay in training for a prolonged period of time, or because they behave differently even after completing it? Educational career information is essential in answering this important question.
COMPARING ISCED WITH RETROSPECTIVE INFORMATION 171
REFERENCES Becker, G. (1981). A treatise on the family.
Cambridge, Harvard University Press. Beets, G.C.N. (1997). European variation in
education and in timing of first birth: preliminary FFS-evidence. Paper presented at the XXIIIrd General IUSSP Population Conference, 11-17 October 1997, Beijing, China.
Blossfeld, H.P. (1995). The new role of women: family formation in modern societies. Social Inequality Series, Boulder, CO: Westview Press.
Blossfeld, H.P. and Huinink, J. (1991). Human capital investments or norms of role transition? How women’s schooling and career affect the process of family formation. American Journal of Sociology, 97, 1, 143-168.
Brien, M.J., Lillard, L.A. and Waite, L.J. (1999). Interrelated family-building behaviors: Cohabitation, marriage and nonmarital conception. Demography, 36, 535-551.
De Sandre, P., Ongaro, F., Rettaroli R. and Salvini S. (2000). Fertility and Family Surveys in Countries of the ECE Region. Standard Country Report. Italy. Economic Studies 10o, New York and Geneva: United Nations.
Delgado, M. and Castro Martín T. (1999). Fertility and Family Surveys in Countries of the ECE Region. Standard Country Report. Spain. Economic Studies 10i, New York and Geneva: United Nations.
Eurostat (1996). Eurostat yearbook ’96. A statistical view on Europe 1985-1995. Luxembourg: Eurostat.
Granström, F. (1997). Fertility and Family Surveys in Countries of the ECE Region. Standard Country Report. Sweden. Economic Studies 10b. New York/Geneva: United Nations.
Hoem, J.M. (1996). The harmfulness or harmlessness of using an anticipatory regressor: How dangerous is it to use education achieved as of 1990 in the analysis of divorce risks in earlier years? Yearbook of Population Research in Finland, 33, 34-43.
Holzer, J. Z. and I. Kowalska (1997). Fertility and family surveys in countries of the ECE region. Standard Country Report Poland. Economic Studies 10d. New York/Geneva: United Nations.
Kamarás, F. (1999). Fertility and family surveys in countries of the ECE region. Standard Country Report Hungary. Economic Studies 10j. New York/Geneva: United Nations.
Kritz, M.M., Kim, L.L. and Zlotnik, H. (eds.) (1992). International migration systems. A global approach. Oxford: Clarendon Press.
Kunst, A. (1997). Cross-national comparisons of socio-economic differences in mortality. Rotterdam: Thesis Erasmus University Rotterdam.
Latten J. and A. de Graaf (1997). Fertility and family surveys in countries of the ECE region. Standard Country Report The Netherlands. Economic Studies 10c. New York/Geneva: United Nations.
Liefbroer, A.C. and Corijn, M. (1999). Who, what, where and when? Specifying the impact of
educational attainment and labour force participation on family formation. European Journal of Population, 15, 45-75.
Lillard, L.A. and Panis, C.W.A. (1998). aML Applied maximum likelihood for multiprocess multilevel modeling. User’s guide. Santa Monica: Rand Corporation.
Lodewijckx, E. (1999). Fertility and family surveys in countries of the ECE region. Standard Country Report Belgium. Economic Studies 10l. New York/Geneva: United Nations.
Massey, D.S. and Espinosa, K.E. (1997). What’s driving Mexico-U.S. migration? A theoretical, empirical, and policy analysis. American Journal of Sociology, 102, 939-999.
Nikander, T. (1998). Fertility and Family Surveys in Countries of the ECE Region, Standard Country Report Finland. Economic Studies 10g. New York/Geneva: United Nations.
Noack, T. and L. Østby (1996). Fertility and family surveys in countries of the ECE region. Standard Country Report Norway. Economic Studies 10a. New York/Geneva: United Nations.
OECD (1999). Classifying educational programmes. Manual for ISCED-97 Implementation in OECD countries. Paris: OECD.
Obersnel D., Kozuk Novak M., Cernic M., Sircelj V., Vehovar V. and Rojnick B , (2001). Fertility and Family Surveys in Countries of the ECE Region, Standard Country Report Slovenia. Economic Studies 10r. New York/Geneva:
Prinz, C., W. Lutz, V.Nowak, and C. Pfeiffer (1998). Fertility and Family Surveys in Countries of the ECE Region, Standard Country Report Austria. Economic Studies 10h. New York/Geneva: United Nations.
Rychtarikova J. and K. Jaroslav (2001). Fertility and Family Surveys in Countries of the ECE Region, Standard Country Report Czech Republic. Economic Studies 10v. New York/Geneva: United Nations.
Stankuniene, V, M. Baublyte, V. Kanopiene and Mikulioniene (2000) Fertility and family surveys in countries of the ECE region. Standard Country Report Lithuania. Economic Studies 10q. New York/Geneva: United Nations.
Toulemon, L., and C. de Guibert-Lantoine (1998). Fertility and Family Surveys in Countries of the ECE Region. Standard Country Report. France. Economic Studies 10e. United Nations: New York/Geneva: United Nations
Vijver, F. van de and Leung, K. (1997). Methods and data analysis of cross-cultural research. Thousand Oaks: Sage.
Welkenhuysen-Gybels, J. and Billiet, J. (1999). Een evaluatie van de crossculturele equivalentie van meetschalen rekening houdend met methode-effecten. [An evaluation of the cross-cultural equivalence of scales taking into account method-effects] Mens and Maatschappij, 74, 4, 380-391.
Zvidrins P., L. Ezera and A. Greitas (1998) Fertility and family surveys in countries of the ECE region. Standard Country Report Latvia. Economic Studies 10f. New York/Geneva: United Nations.
172 FERTILITY AND PARTNERSHIP IN EUROPE
ENDNOTES i The authors wish to thank the Advisory Group of the FFS-programme of Comparative Research for its permission (granted under identification 41) to use the FFS-data on which this study is based. The data for the Netherlands are obtained from Statistics Netherlands via the Scientific Statistical Agency. ii In Norway and Sweden, per five-year birth period, only respondents from one specific year were interviewed.
iii In this chapter, we focus on the time-constant measurement of educational attainment. Using a time-constant
measure to predict the timing of demographically relevant events can lead to serious biases (Hoem, 1996). However, an important advantage of our measure is that it can also very easily be applied if one wants to measure educational attainment in a time-varying fashion. We will briefly return to this issue in the discussion. iv An added advantage of our indicator compared to ISCED is that ours is measured at the interval level, whereas the ISCED indicator is only ordinal. Therefore, by categorising our career indicator we do not make full use of its potential. v We have chosen to narrow the cohort range to 1953-66, because these years are completely covered in all
countries. vi
For this calculation we excluded Austria as its ISCED indicator is clearly flawed. vii
Again, Austria was excluded from this calculation. viii
See note 5. ix
Still, the designers are right in stating that “..the ultimate success of the ISCED revision rests on the uniformity of its implementation..” (OECD, 1999, p 7).
173
PART FOUR
INNOVATIVE APPROACHES TO FAMILY RESEARCH

175
CHAPTER 11
TOWARD A CHILD-CENTERED LIFE COURSE PERSPECTIVE ON
FAMILY STRUCTURES: MULTI-STATE EARLY LIFE TABLESi
Patrick Heuveline and Jeffrey M. Timberlake*
* Population Research Center, Chicago (USA)
The dramatic contemporary changes in Western family patterns have generated popular and scholarly concern over their impact on children and their subsequent social consequences. The individual- and family-level effects of divorce or single parenting on children have been studied extensively. Even though the effects are neither universal nor necessarily large when other family characteristics are held constant, there appear to be real consequences of growing up in different family structures (Cherlin, 1999; McLanahan and Sandefur, 1994; Cherlin and Furstenberg, 1994; Amato and Keith, 1991; Furstenberg and Cherlin, 1991).
Meanwhile, the paucity of
international data on living arrangements during childhood limits the potential of comparative research on these issues. We contend, in particular, that cross-national vital and marital statistics are poorly suited to study the impact of family changes on children. Instead we need to assess these changes over a child’s life course, and to account for the increasing prevalence of childrearing within non-marital cohabitation. In this chapter we discuss whether FFS data can be used to develop a child-centered life course perspective on recent trends in family structure that recognizes the most important living arrangements. More specifically, we describe our methodology for constructing childhood biographies of living
arrangements from birth and partnership histories in FFS data. We then show how multi-state life table techniques can be applied to these biographies to reconstruct the living arrangements of children from birth through late adolescence across countries.
A. BACKGROUND
Only a few decades ago the nuclear family - composed of married parents and their biological children - appeared as the characteristic living arrangement of Western societies, and even as the universal "model" of modern family life for the rest of the world (Goode, 1970). Ironically, the Western family was then undergoing profound transformations, and the nuclear family soon lost its centrality to a more complex mix of living arrangements.
Marital disruption is most frequent
in the USA where about two-thirds of first marriages end in separation or divorce (Castro Martín and Bumpass, 1989). At these rates, about two-fifths of children born to married mothers will experience the marital disruption of their parents by age 18 (Bumpass and Rindfuss, 1979; Furstenberg et al., 1983; Bumpass, 1984). As the proportion of children born to unmarried mothers continues to increase (Smith et al., 1996), one-half of recent American birth cohorts are expected to spend some of their childhood in a one-parent family (Bumpass,
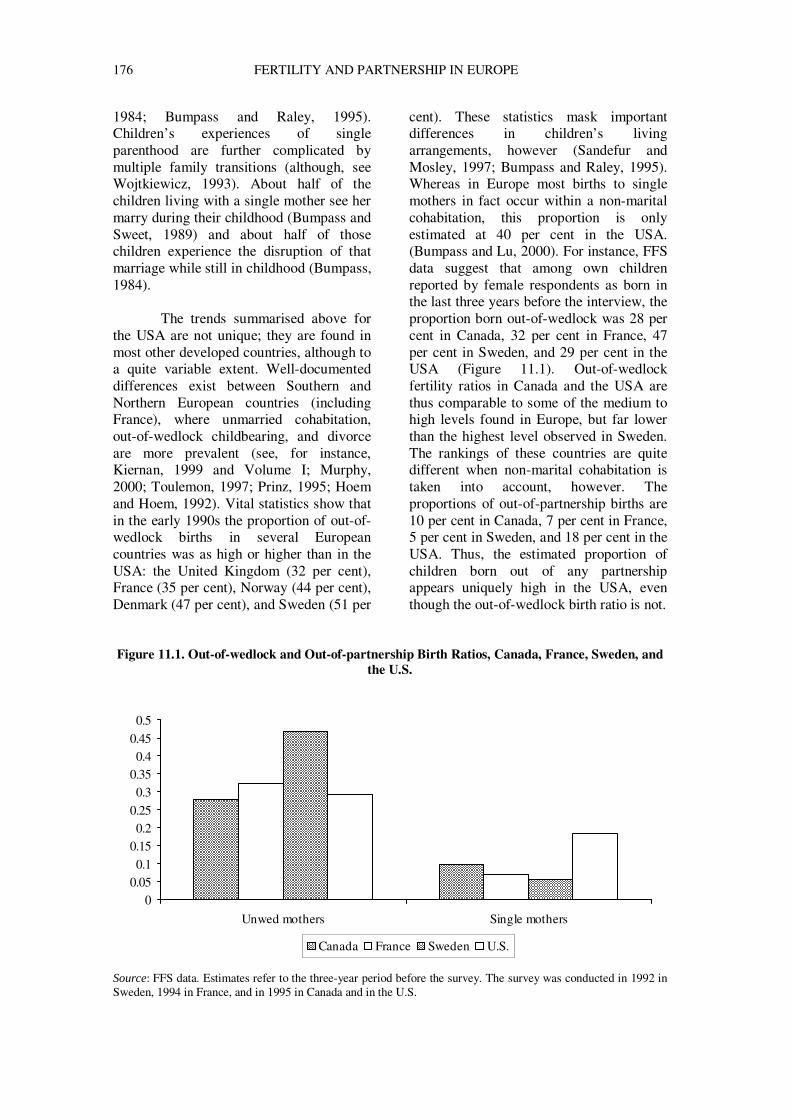
176 FERTILITY AND PARTNERSHIP IN EUROPE
1984; Bumpass and Raley, 1995). Children’s experiences of single parenthood are further complicated by multiple family transitions (although, see Wojtkiewicz, 1993). About half of the children living with a single mother see her marry during their childhood (Bumpass and Sweet, 1989) and about half of those children experience the disruption of that marriage while still in childhood (Bumpass, 1984).
The trends summarised above for
the USA are not unique; they are found in most other developed countries, although to a quite variable extent. Well-documented differences exist between Southern and Northern European countries (including France), where unmarried cohabitation, out-of-wedlock childbearing, and divorce are more prevalent (see, for instance, Kiernan, 1999 and Volume I; Murphy, 2000; Toulemon, 1997; Prinz, 1995; Hoem and Hoem, 1992). Vital statistics show that in the early 1990s the proportion of out-of-wedlock births in several European countries was as high or higher than in the USA: the United Kingdom (32 per cent), France (35 per cent), Norway (44 per cent), Denmark (47 per cent), and Sweden (51 per
cent). These statistics mask important differences in children’s living arrangements, however (Sandefur and Mosley, 1997; Bumpass and Raley, 1995). Whereas in Europe most births to single mothers in fact occur within a non-marital cohabitation, this proportion is only estimated at 40 per cent in the USA. (Bumpass and Lu, 2000). For instance, FFS data suggest that among own children reported by female respondents as born in the last three years before the interview, the proportion born out-of-wedlock was 28 per cent in Canada, 32 per cent in France, 47 per cent in Sweden, and 29 per cent in the USA (Figure 11.1). Out-of-wedlock fertility ratios in Canada and the USA are thus comparable to some of the medium to high levels found in Europe, but far lower than the highest level observed in Sweden. The rankings of these countries are quite different when non-marital cohabitation is taken into account, however. The proportions of out-of-partnership births are 10 per cent in Canada, 7 per cent in France, 5 per cent in Sweden, and 18 per cent in the USA. Thus, the estimated proportion of children born out of any partnership appears uniquely high in the USA, even though the out-of-wedlock birth ratio is not.
Figure 11.1. Out-of-wedlock and Out-of-partnership Birth Ratios, Canada, France, Sweden, and
the U.S.
00.050.1
0.150.2
0.25
0.30.350.4
0.45
0.5
Unwed mothers Single mothers
Canada France Sweden U.S.
Source: FFS data. Estimates refer to the three-year period before the survey. The survey was conducted in 1992 in Sweden, 1994 in France, and in 1995 in Canada and in the U.S.
TOWARD A CHILD-CENTERED LIFE COURSE PERSPECTIVE 177
International comparisons thus appear in a different light depending on whether non-marital cohabitation is accounted for.
While changes in non-marital
cohabitation, marriage, divorce, and childbearing are common to all Western countries, important differences are hidden below the surface of these uniform transformations. Moreover, a cross-sectional perspective does not fully translate the impact of such changes on childhood experience, making the relationship between family structure and child outcomes harder to specify and assess. For example, preliminary analyses of FFS data suggest that European consensual unions may be almost as stable as marriages in the USA. Among a Swedish female birth cohort, only 36 per cent of first partnerships that were consensual unions were dissolved within 15 years (Granström, 1997). This is an underestimate of the proportion of unions actually separated after 15 years, because marriage censors the risk that a consensual union will be dissolved. Consensual unions converted into marriages that end in divorce are not accounted for but the proportion of consensual unions converted into marriages that were dissolved 12 years after marriage for this Swedish female birth cohort is only 17 per cent. These preliminary results suggest that about one-half of all first consensual unions in Sweden have likely ended after 15 years, which appears to be less than the proportion of first marriages that are dissolved within 15 years in the USA (Castro Martín and Bumpass, 1989).
B. DATA AND METHODS
1. States of interest We contend that understanding the impact of these family changes on children requires an extension in several important respects of the life course perspective that has been applied to marital disruption, for instance. First, international differences in the meaning of non-marital cohabitation require that we also study the family life course of children born out-of-wedlock. It
is clearly unsatisfactory to treat out-of-wedlock births as a single category and to assume that these children will grow up with a single parent during their entire childhood and adolescence. Many may live first with cohabiting parents, who may marry and possibly divorce later. International variations in the frequency of these different sequences should be better documented. Second, past life table approaches to family changes from the perspective of children have concentrated on a single transition at a time, most often parental divorce, and occasionally remarriage or an initial non-marital cohabitation after a parental divorce. As changes in family structures have become more frequent, the number of transitions that may be experienced throughout childhood is increasing for recent birth cohorts and the sequences of living arrangements are becoming increasingly varied. In such diverse contexts, the entire family experience during childhood and adolescence cannot be properly accounted for by analysing a few transitions one at a time.
In the interest of reliability, however, the number of transitions to be jointly estimated needs to be kept to a minimum. Our review of the literature on child well-being and family structures suggests a primary distinction between living with only one or two biological parents, and therefore, these should be the two foremost states to be distinguished. Past research is less clear about whether the marital status of the parents affect child well-being directly, but consensual unions are typically less stable than marriages. When a child lives with both biological parents, we should account for their marital status, if only as a determinant of parental separation. When a child lives with one parent only, we should distinguish between whether that parent is the mother or the father. Although mothers typically have custody, limited evidence suggests that the child outcomes - particularly economic status - associated with parental break-up differ for children living with their father after the separation. Finally, research indicates that subsequent partnerships of
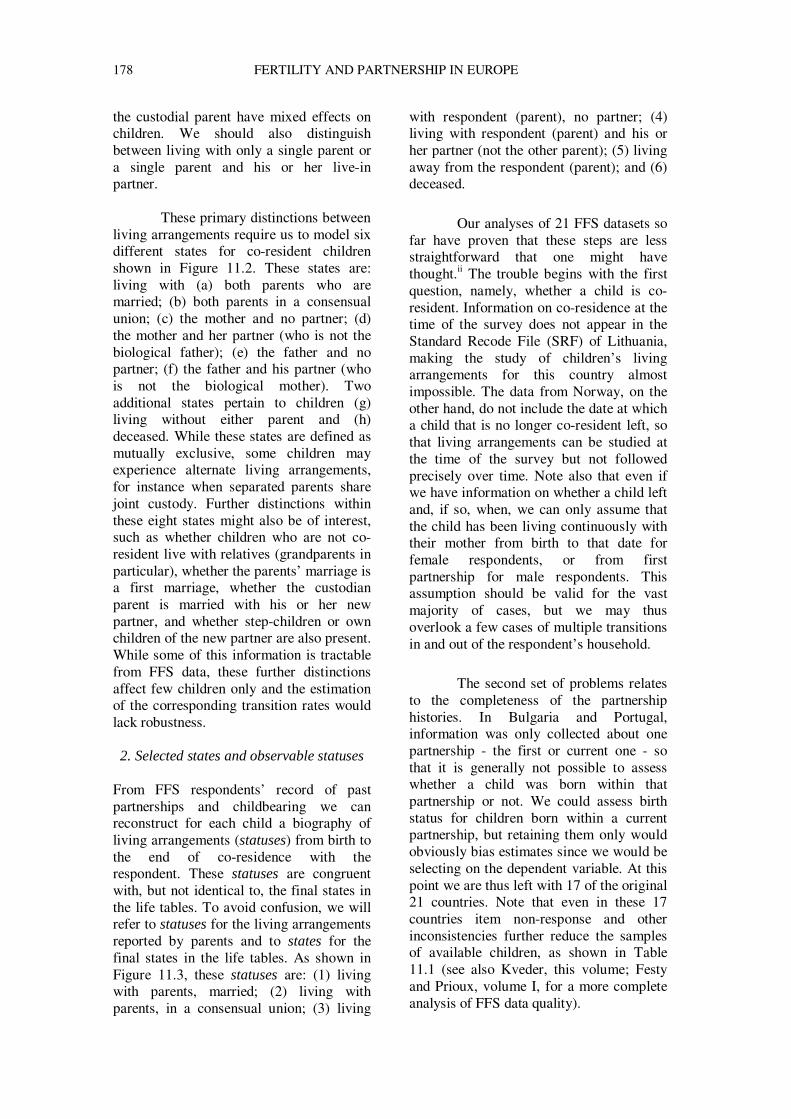
178 FERTILITY AND PARTNERSHIP IN EUROPE
the custodial parent have mixed effects on children. We should also distinguish between living with only a single parent or a single parent and his or her live-in partner.
These primary distinctions between
living arrangements require us to model six different states for co-resident children shown in Figure 11.2. These states are: living with (a) both parents who are married; (b) both parents in a consensual union; (c) the mother and no partner; (d) the mother and her partner (who is not the biological father); (e) the father and no partner; (f) the father and his partner (who is not the biological mother). Two additional states pertain to children (g) living without either parent and (h) deceased. While these states are defined as mutually exclusive, some children may experience alternate living arrangements, for instance when separated parents share joint custody. Further distinctions within these eight states might also be of interest, such as whether children who are not co-resident live with relatives (grandparents in particular), whether the parents’ marriage is a first marriage, whether the custodian parent is married with his or her new partner, and whether step-children or own children of the new partner are also present. While some of this information is tractable from FFS data, these further distinctions affect few children only and the estimation of the corresponding transition rates would lack robustness. 2. Selected states and observable statuses
From FFS respondents’ record of past partnerships and childbearing we can reconstruct for each child a biography of living arrangements (statuses) from birth to the end of co-residence with the respondent. These statuses are congruent with, but not identical to, the final states in the life tables. To avoid confusion, we will refer to statuses for the living arrangements reported by parents and to states for the final states in the life tables. As shown in Figure 11.3, these statuses are: (1) living with parents, married; (2) living with parents, in a consensual union; (3) living
with respondent (parent), no partner; (4) living with respondent (parent) and his or her partner (not the other parent); (5) living away from the respondent (parent); and (6) deceased.
Our analyses of 21 FFS datasets so
far have proven that these steps are less straightforward that one might have thought.ii The trouble begins with the first question, namely, whether a child is co-resident. Information on co-residence at the time of the survey does not appear in the Standard Recode File (SRF) of Lithuania, making the study of children’s living arrangements for this country almost impossible. The data from Norway, on the other hand, do not include the date at which a child that is no longer co-resident left, so that living arrangements can be studied at the time of the survey but not followed precisely over time. Note also that even if we have information on whether a child left and, if so, when, we can only assume that the child has been living continuously with their mother from birth to that date for female respondents, or from first partnership for male respondents. This assumption should be valid for the vast majority of cases, but we may thus overlook a few cases of multiple transitions in and out of the respondent’s household.
The second set of problems relates
to the completeness of the partnership histories. In Bulgaria and Portugal, information was only collected about one partnership - the first or current one - so that it is generally not possible to assess whether a child was born within that partnership or not. We could assess birth status for children born within a current partnership, but retaining them only would obviously bias estimates since we would be selecting on the dependent variable. At this point we are thus left with 17 of the original 21 countries. Note that even in these 17 countries item non-response and other inconsistencies further reduce the samples of available children, as shown in Table 11.1 (see also Kveder, this volume; Festy and Prioux, volume I, for a more complete analysis of FFS data quality).
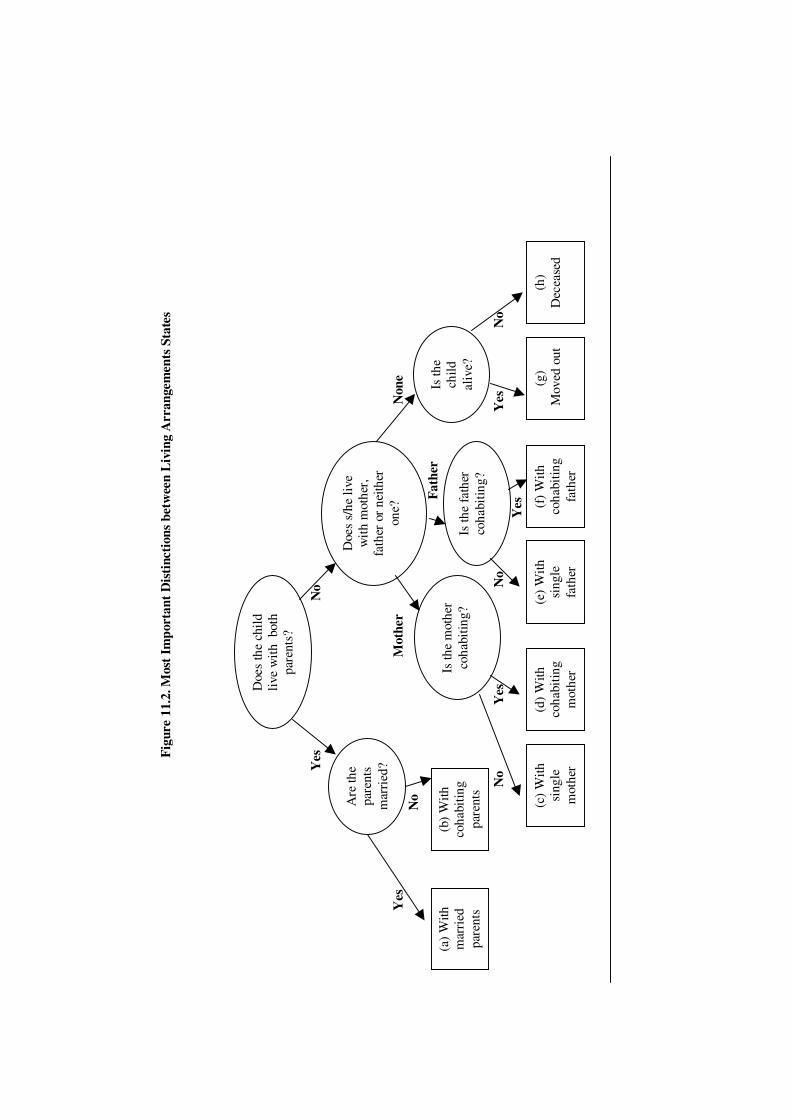
F
igur
e 11
.2. M
ost
Impo
rtan
t D
isti
ncti
ons
betw
een
Liv
ing
Arr
ange
men
ts S
tate
s
Y
es
No
Yes
M
othe
r
N
one
No
F
athe
r
N
o
Y
es
No
Y
es
N
o
Yes
Doe
s th
e ch
ild
live
wit
h b
oth
pare
nts?
Are
the
pare
nts
mar
ried
?
Doe
s s/
he li
ve
wit
h m
othe
r,
fath
er o
r ne
ither
on
e?
(a)
With
m
arri
ed
pare
nts
(b)
With
co
habi
ting
pare
nts
Is th
e m
othe
r co
habi
ting?
Is
the
fath
er
coha
bitin
g?
Is th
e ch
ild
aliv
e?
(c)
With
si
ngle
m
othe
r
(d)
With
co
habi
ting
mot
her
(e)
With
si
ngle
fa
ther
(f)
With
co
habi
ting
fath
er
(g)
Mov
ed o
ut(h
) D
ecea
sed

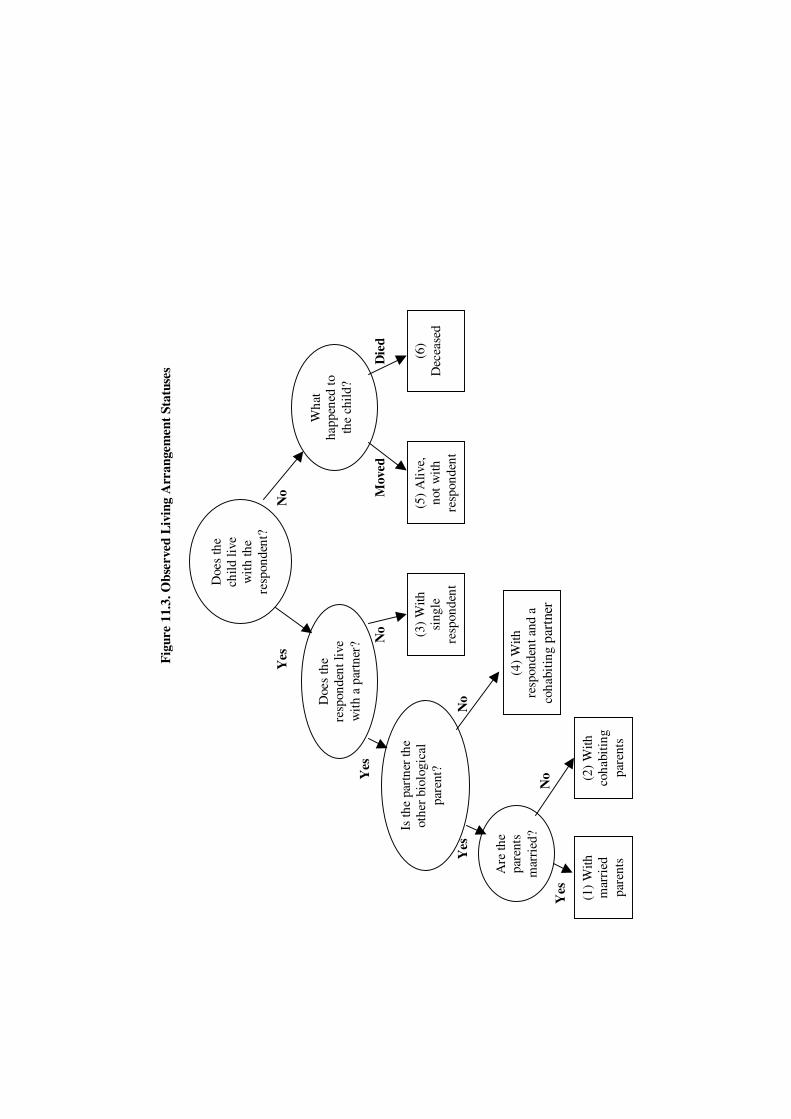
F
igur
e 11
.3. O
bser
ved
Liv
ing
Arr
ange
men
t St
atus
es
Yes
No
Y
es
N
o
M
oved
D
ied
Y
es
N
o
N
o
Y
es
Doe
s th
e ch
ild li
ve
wit
h th
e re
spon
dent
?
Doe
s th
e re
spon
dent
live
w
ith
a pa
rtne
r?
Wha
t ha
ppen
ed to
th
e ch
ild?
Is th
e pa
rtne
r th
e ot
her
biol
ogic
al
pare
nt?
(4)
With
re
spon
dent
and
a
coha
bitin
gpa
rtne
r
Are
the
pare
nts
mar
ried
?
(1)
With
m
arri
ed
pare
nts
(2)
With
co
habi
ting
pare
nts
(3)
With
si
ngle
re
spon
dent
(5)
Aliv
e,
not w
ith
resp
onde
nt
(6)
Dec
ease
d

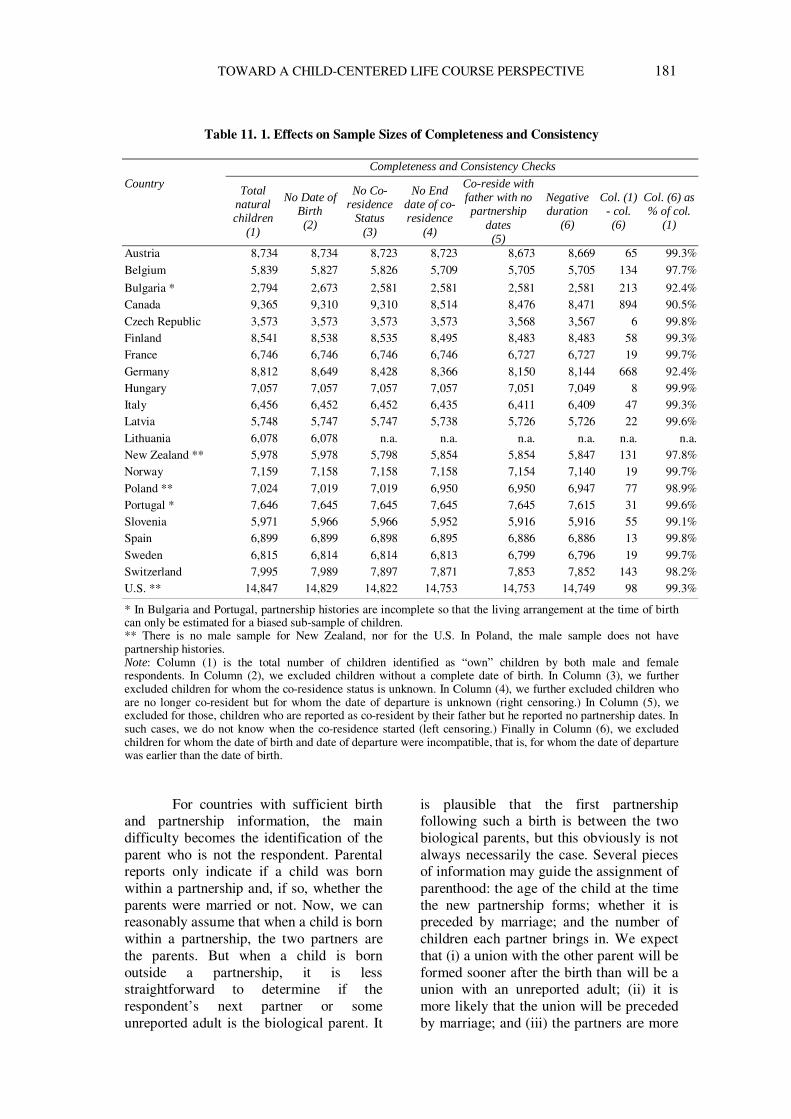
TOWARD A CHILD-CENTERED LIFE COURSE PERSPECTIVE 181
Table 11. 1. Effects on Sample Sizes of Completeness and Consistency
Completeness and Consistency Checks
Country Total
natural children
(1)
No Date of Birth (2)
No Co-residence
Status (3)
No End date of co-residence
(4)
Co-reside with father with no partnership
dates (5)
Negative duration
(6)
Col. (1) - col. (6)
Col. (6) as % of col.
(1)
Austria 8,734 8,734 8,723 8,723 8,673 8,669 65 99.3%Belgium 5,839 5,827 5,826 5,709 5,705 5,705 134 97.7%
Bulgaria * 2,794 2,673 2,581 2,581 2,581 2,581 213 92.4%Canada 9,365 9,310 9,310 8,514 8,476 8,471 894 90.5%Czech Republic 3,573 3,573 3,573 3,573 3,568 3,567 6 99.8%Finland 8,541 8,538 8,535 8,495 8,483 8,483 58 99.3%France 6,746 6,746 6,746 6,746 6,727 6,727 19 99.7%Germany 8,812 8,649 8,428 8,366 8,150 8,144 668 92.4%Hungary 7,057 7,057 7,057 7,057 7,051 7,049 8 99.9%Italy 6,456 6,452 6,452 6,435 6,411 6,409 47 99.3%Latvia 5,748 5,747 5,747 5,738 5,726 5,726 22 99.6%Lithuania 6,078 6,078 n.a. n.a. n.a. n.a. n.a. n.a.New Zealand ** 5,978 5,978 5,798 5,854 5,854 5,847 131 97.8%Norway 7,159 7,158 7,158 7,158 7,154 7,140 19 99.7%Poland ** 7,024 7,019 7,019 6,950 6,950 6,947 77 98.9%Portugal * 7,646 7,645 7,645 7,645 7,645 7,615 31 99.6%Slovenia 5,971 5,966 5,966 5,952 5,916 5,916 55 99.1%Spain 6,899 6,899 6,898 6,895 6,886 6,886 13 99.8%Sweden 6,815 6,814 6,814 6,813 6,799 6,796 19 99.7%Switzerland 7,995 7,989 7,897 7,871 7,853 7,852 143 98.2%U.S. ** 14,847 14,829 14,822 14,753 14,753 14,749 98 99.3%
* In Bulgaria and Portugal, partnership histories are incomplete so that the living arrangement at the time of birth can only be estimated for a biased sub-sample of children. ** There is no male sample for New Zealand, nor for the U.S. In Poland, the male sample does not have partnership histories. Note: Column (1) is the total number of children identified as “own” children by both male and female respondents. In Column (2), we excluded children without a complete date of birth. In Column (3), we further excluded children for whom the co-residence status is unknown. In Column (4), we further excluded children who are no longer co-resident but for whom the date of departure is unknown (right censoring.) In Column (5), we excluded for those, children who are reported as co-resident by their father but he reported no partnership dates. In such cases, we do not know when the co-residence started (left censoring.) Finally in Column (6), we excluded children for whom the date of birth and date of departure were incompatible, that is, for whom the date of departure was earlier than the date of birth.
For countries with sufficient birth and partnership information, the main difficulty becomes the identification of the parent who is not the respondent. Parental reports only indicate if a child was born within a partnership and, if so, whether the parents were married or not. Now, we can reasonably assume that when a child is born within a partnership, the two partners are the parents. But when a child is born outside a partnership, it is less straightforward to determine if the respondent’s next partner or some unreported adult is the biological parent. It
is plausible that the first partnership following such a birth is between the two biological parents, but this obviously is not always necessarily the case. Several pieces of information may guide the assignment of parenthood: the age of the child at the time the new partnership forms; whether it is preceded by marriage; and the number of children each partner brings in. We expect that (i) a union with the other parent will be formed sooner after the birth than will be a union with an unreported adult; (ii) it is more likely that the union will be preceded by marriage; and (iii) the partners are more
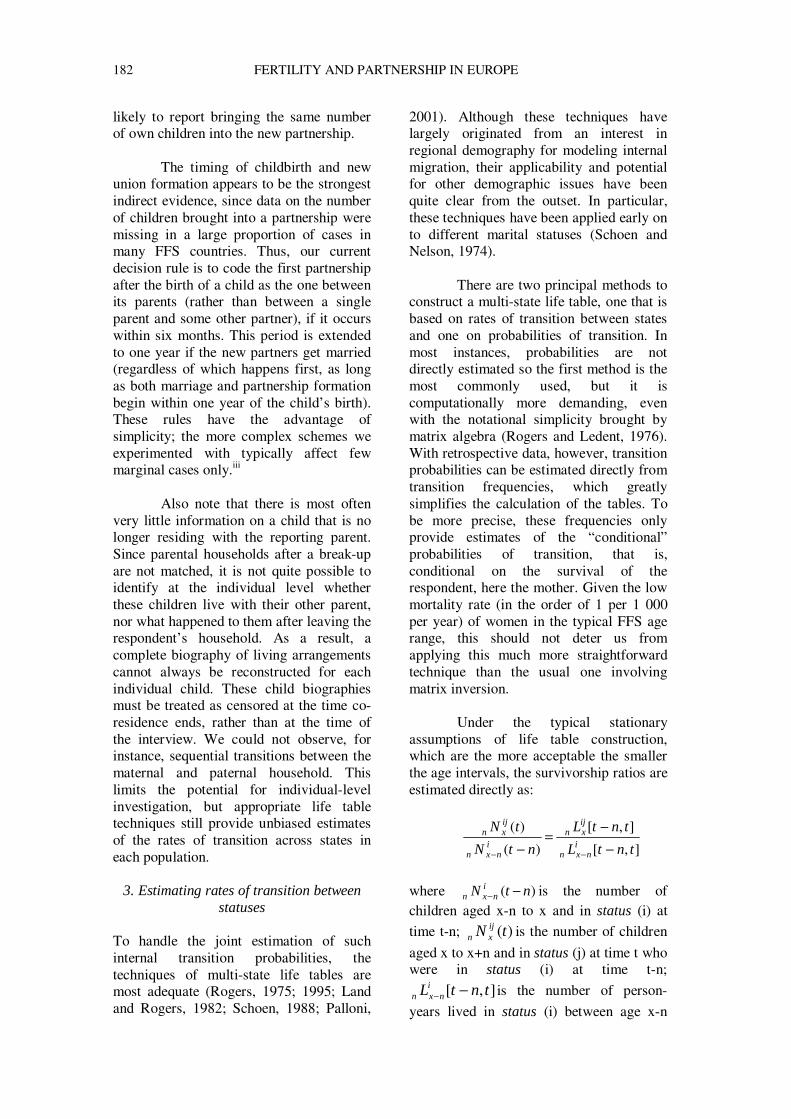
182 FERTILITY AND PARTNERSHIP IN EUROPE
likely to report bringing the same number of own children into the new partnership.
The timing of childbirth and new
union formation appears to be the strongest indirect evidence, since data on the number of children brought into a partnership were missing in a large proportion of cases in many FFS countries. Thus, our current decision rule is to code the first partnership after the birth of a child as the one between its parents (rather than between a single parent and some other partner), if it occurs within six months. This period is extended to one year if the new partners get married (regardless of which happens first, as long as both marriage and partnership formation begin within one year of the child’s birth). These rules have the advantage of simplicity; the more complex schemes we experimented with typically affect few marginal cases only.iii
Also note that there is most often very little information on a child that is no longer residing with the reporting parent. Since parental households after a break-up are not matched, it is not quite possible to identify at the individual level whether these children live with their other parent, nor what happened to them after leaving the respondent’s household. As a result, a complete biography of living arrangements cannot always be reconstructed for each individual child. These child biographies must be treated as censored at the time co-residence ends, rather than at the time of the interview. We could not observe, for instance, sequential transitions between the maternal and paternal household. This limits the potential for individual-level investigation, but appropriate life table techniques still provide unbiased estimates of the rates of transition across states in each population.
3. Estimating rates of transition between
statuses
To handle the joint estimation of such internal transition probabilities, the techniques of multi-state life tables are most adequate (Rogers, 1975; 1995; Land and Rogers, 1982; Schoen, 1988; Palloni,
2001). Although these techniques have largely originated from an interest in regional demography for modeling internal migration, their applicability and potential for other demographic issues have been quite clear from the outset. In particular, these techniques have been applied early on to different marital statuses (Schoen and Nelson, 1974).
There are two principal methods to construct a multi-state life table, one that is based on rates of transition between states and one on probabilities of transition. In most instances, probabilities are not directly estimated so the first method is the most commonly used, but it is computationally more demanding, even with the notational simplicity brought by matrix algebra (Rogers and Ledent, 1976). With retrospective data, however, transition probabilities can be estimated directly from transition frequencies, which greatly simplifies the calculation of the tables. To be more precise, these frequencies only provide estimates of the “conditional” probabilities of transition, that is, conditional on the survival of the respondent, here the mother. Given the low mortality rate (in the order of 1 per 1 000 per year) of women in the typical FFS age range, this should not deter us from applying this much more straightforward technique than the usual one involving matrix inversion.
Under the typical stationary
assumptions of life table construction, which are the more acceptable the smaller the age intervals, the survivorship ratios are estimated directly as:
],[
],[
)(
)(
tntL
tntL
ntN
tNi
nxn
ijxn
inxn
ijxn
−−
=− −−
where )( ntN inxn −− is the number of
children aged x-n to x and in status (i) at
time t-n; )(tN ijxn is the number of children
aged x to x+n and in status (j) at time t who were in status (i) at time t-n;
],[ tntLinxn −− is the number of person-
years lived in status (i) between age x-n
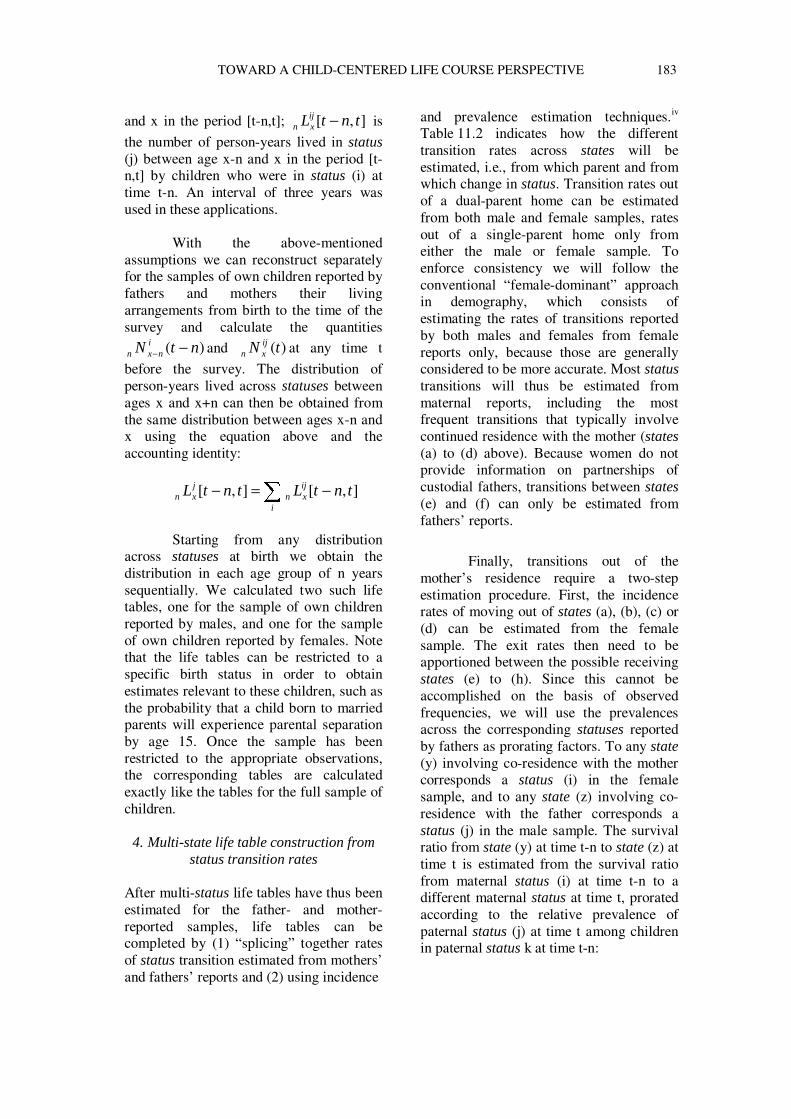
TOWARD A CHILD-CENTERED LIFE COURSE PERSPECTIVE 183
and x in the period [t-n,t]; ],[ tntLijxn − is
the number of person-years lived in status (j) between age x-n and x in the period [t-n,t] by children who were in status (i) at time t-n. An interval of three years was used in these applications.
With the above-mentioned
assumptions we can reconstruct separately for the samples of own children reported by fathers and mothers their living arrangements from birth to the time of the survey and calculate the quantities
)( ntN inxn −− and )(tN ij
xn at any time t
before the survey. The distribution of person-years lived across statuses between ages x and x+n can then be obtained from the same distribution between ages x-n and x using the equation above and the accounting identity:
∑ −=−i
ijxn
jxn tntLtntL ],[],[
Starting from any distribution
across statuses at birth we obtain the distribution in each age group of n years sequentially. We calculated two such life tables, one for the sample of own children reported by males, and one for the sample of own children reported by females. Note that the life tables can be restricted to a specific birth status in order to obtain estimates relevant to these children, such as the probability that a child born to married parents will experience parental separation by age 15. Once the sample has been restricted to the appropriate observations, the corresponding tables are calculated exactly like the tables for the full sample of children.
4. Multi-state life table construction from
status transition rates
After multi-status life tables have thus been estimated for the father- and mother-reported samples, life tables can be completed by (1) “splicing” together rates of status transition estimated from mothers’ and fathers’ reports and (2) using incidence
and prevalence estimation techniques.iv Table 11.2 indicates how the different transition rates across states will be estimated, i.e., from which parent and from which change in status. Transition rates out of a dual-parent home can be estimated from both male and female samples, rates out of a single-parent home only from either the male or female sample. To enforce consistency we will follow the conventional “female-dominant” approach in demography, which consists of estimating the rates of transitions reported by both males and females from female reports only, because those are generally considered to be more accurate. Most status transitions will thus be estimated from maternal reports, including the most frequent transitions that typically involve continued residence with the mother (states (a) to (d) above). Because women do not provide information on partnerships of custodial fathers, transitions between states (e) and (f) can only be estimated from fathers’ reports.
Finally, transitions out of the
mother’s residence require a two-step estimation procedure. First, the incidence rates of moving out of states (a), (b), (c) or (d) can be estimated from the female sample. The exit rates then need to be apportioned between the possible receiving states (e) to (h). Since this cannot be accomplished on the basis of observed frequencies, we will use the prevalences across the corresponding statuses reported by fathers as prorating factors. To any state (y) involving co-residence with the mother corresponds a status (i) in the female sample, and to any state (z) involving co-residence with the father corresponds a status (j) in the male sample. The survival ratio from state (y) at time t-n to state (z) at time t is estimated from the survival ratio from maternal status (i) at time t-n to a different maternal status at time t, prorated according to the relative prevalence of paternal status (j) at time t among children in paternal status k at time t-n:
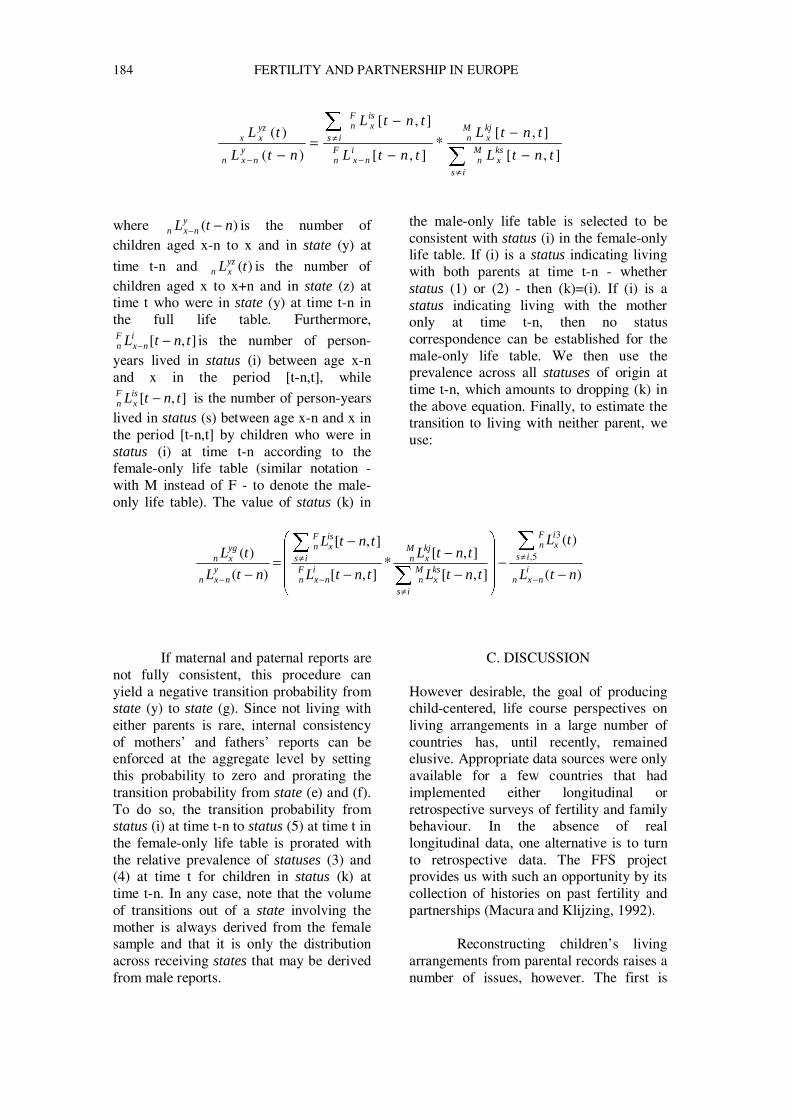
184 FERTILITY AND PARTNERSHIP IN EUROPE
∑
∑
≠−
≠
− −−
−
−=
−is
ksx
Mn
kjx
Mn
inx
Fn
is
isx
Fn
ynxn
yzxx
tntL
tntL
tntL
tntL
ntL
tL
],[
],[*
],[
],[
)(
)(
where )( ntLynxn −− is the number of
children aged x-n to x and in state (y) at
time t-n and )(tLyzxn is the number of
children aged x to x+n and in state (z) at time t who were in state (y) at time t-n in the full life table. Furthermore,
],[ tntLinx
Fn −− is the number of person-years lived in status (i) between age x-n and x in the period [t-n,t], while
],[ tntLisx
Fn − is the number of person-years lived in status (s) between age x-n and x in the period [t-n,t] by children who were in status (i) at time t-n according to the female-only life table (similar notation - with M instead of F - to denote the male-only life table). The value of status (k) in
the male-only life table is selected to be consistent with status (i) in the female-only life table. If (i) is a status indicating living with both parents at time t-n - whether status (1) or (2) - then (k)=(i). If (i) is a status indicating living with the mother only at time t-n, then no status correspondence can be established for the male-only life table. We then use the prevalence across all statuses of origin at time t-n, which amounts to dropping (k) in the above equation. Finally, to estimate the transition to living with neither parent, we use:
)(
)(
],[
],[*
],[
],[
)(
)( 5,
3
ntL
tL
tntL
tntL
tntL
tntL
ntL
tLi
nxn
is
ix
Fn
is
ksx
Mn
kjx
Mn
inx
Fn
is
isx
Fn
ynxn
ygxn
−−
−−
−
−=
− −
≠
≠−
≠
−
∑
∑
∑
If maternal and paternal reports are
not fully consistent, this procedure can yield a negative transition probability from state (y) to state (g). Since not living with either parents is rare, internal consistency of mothers’ and fathers’ reports can be enforced at the aggregate level by setting this probability to zero and prorating the transition probability from state (e) and (f). To do so, the transition probability from status (i) at time t-n to status (5) at time t in the female-only life table is prorated with the relative prevalence of statuses (3) and (4) at time t for children in status (k) at time t-n. In any case, note that the volume of transitions out of a state involving the mother is always derived from the female sample and that it is only the distribution across receiving states that may be derived from male reports.
C. DISCUSSION
However desirable, the goal of producing child-centered, life course perspectives on living arrangements in a large number of countries has, until recently, remained elusive. Appropriate data sources were only available for a few countries that had implemented either longitudinal or retrospective surveys of fertility and family behaviour. In the absence of real longitudinal data, one alternative is to turn to retrospective data. The FFS project provides us with such an opportunity by its collection of histories on past fertility and partnerships (Macura and Klijzing, 1992).
Reconstructing children’s living
arrangements from parental records raises a number of issues, however. The first is
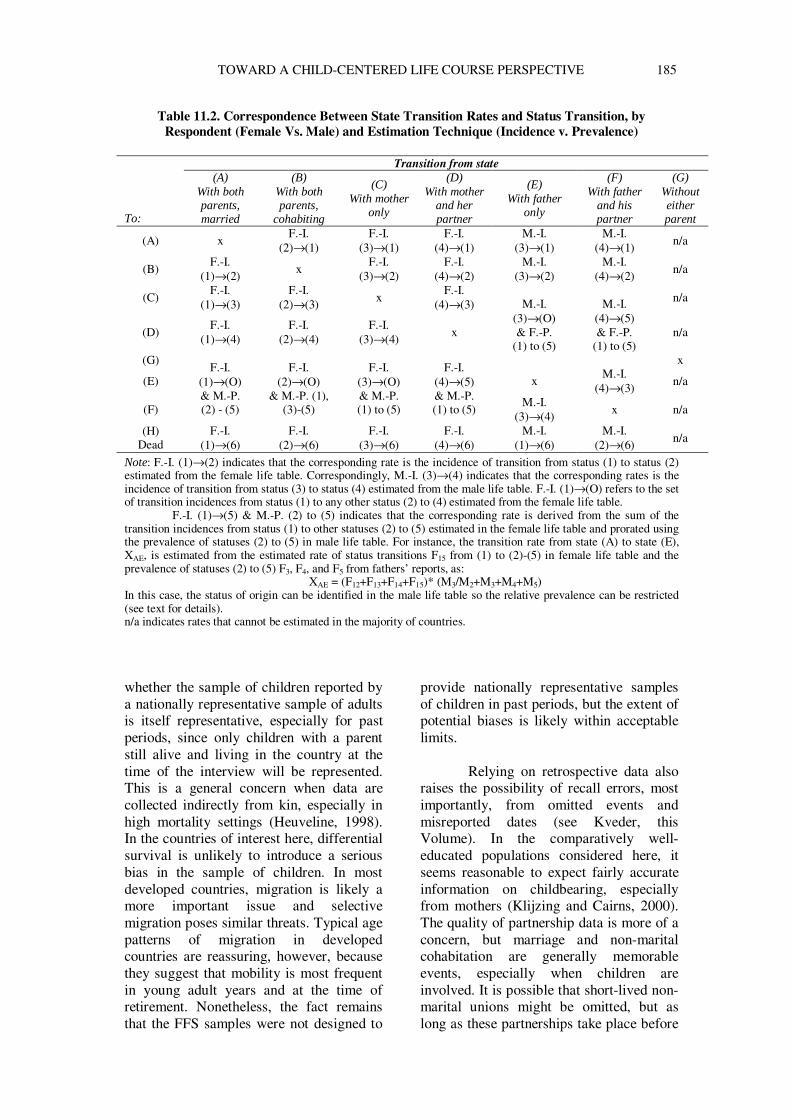
TOWARD A CHILD-CENTERED LIFE COURSE PERSPECTIVE 185
Table 11.2. Correspondence Between State Transition Rates and Status Transition, by Respondent (Female Vs. Male) and Estimation Technique (Incidence v. Prevalence)
Transition from state
To:
(A) With both parents, married
(B) With both parents,
cohabiting
(C) With mother
only
(D) With mother
and her partner
(E) With father
only
(F) With father
and his partner
(G) Without either parent
(A) x F.-I.
(2)→(1) F.-I.
(3)→(1) F.-I.
(4)→(1) M.-I.
(3)→(1) M.-I.
(4)→(1) n/a
(B) F.-I.
(1)→(2) x
F.-I. (3)→(2)
F.-I. (4)→(2)
M.-I. (3)→(2)
M.-I. (4)→(2)
n/a
(C) F.-I.
(1)→(3) F.-I.
(2)→(3) x
F.-I. (4)→(3)
n/a
(D)
F.-I. (1)→(4)
F.-I. (2)→(4)
F.-I. (3)→(4)
x n/a
(G)
M.-I. (3)→(O) & F.-P.
(1) to (5)
M.-I. (4)→(5) & F.-P.
(1) to (5) x
(E) x M.-I.
(4)→(3) n/a
(F)
F.-I. (1)→(O) & M.-P. (2) - (5)
F.-I. (2)→(O)
& M.-P. (1), (3)-(5)
F.-I. (3)→(O) & M.-P. (1) to (5)
F.-I. (4)→(5) & M.-P. (1) to (5)
M.-I. (3)→(4)
x n/a
(H) Dead
F.-I. (1)→(6)
F.-I. (2)→(6)
F.-I. (3)→(6)
F.-I. (4)→(6)
M.-I. (1)→(6)
M.-I. (2)→(6)
n/a
Note: F.-I. (1)→(2) indicates that the corresponding rate is the incidence of transition from status (1) to status (2) estimated from the female life table. Correspondingly, M.-I. (3)→(4) indicates that the corresponding rates is the incidence of transition from status (3) to status (4) estimated from the male life table. F.-I. (1)→(O) refers to the set of transition incidences from status (1) to any other status (2) to (4) estimated from the female life table.
F.-I. (1)→(5) & M.-P. (2) to (5) indicates that the corresponding rate is derived from the sum of the transition incidences from status (1) to other statuses (2) to (5) estimated in the female life table and prorated using the prevalence of statuses (2) to (5) in male life table. For instance, the transition rate from state (A) to state (E), XAE, is estimated from the estimated rate of status transitions F15 from (1) to (2)-(5) in female life table and the prevalence of statuses (2) to (5) F3, F4, and F5 from fathers’ reports, as:
XAE = (F12+F13+F14+F15)* (M3/M2+M3+M4+M5) In this case, the status of origin can be identified in the male life table so the relative prevalence can be restricted (see text for details). n/a indicates rates that cannot be estimated in the majority of countries.
whether the sample of children reported by a nationally representative sample of adults is itself representative, especially for past periods, since only children with a parent still alive and living in the country at the time of the interview will be represented. This is a general concern when data are collected indirectly from kin, especially in high mortality settings (Heuveline, 1998). In the countries of interest here, differential survival is unlikely to introduce a serious bias in the sample of children. In most developed countries, migration is likely a more important issue and selective migration poses similar threats. Typical age patterns of migration in developed countries are reassuring, however, because they suggest that mobility is most frequent in young adult years and at the time of retirement. Nonetheless, the fact remains that the FFS samples were not designed to
provide nationally representative samples of children in past periods, but the extent of potential biases is likely within acceptable limits.
Relying on retrospective data also
raises the possibility of recall errors, most importantly, from omitted events and misreported dates (see Kveder, this Volume). In the comparatively well-educated populations considered here, it seems reasonable to expect fairly accurate information on childbearing, especially from mothers (Klijzing and Cairns, 2000). The quality of partnership data is more of a concern, but marriage and non-marital cohabitation are generally memorable events, especially when children are involved. It is possible that short-lived non-marital unions might be omitted, but as long as these partnerships take place before
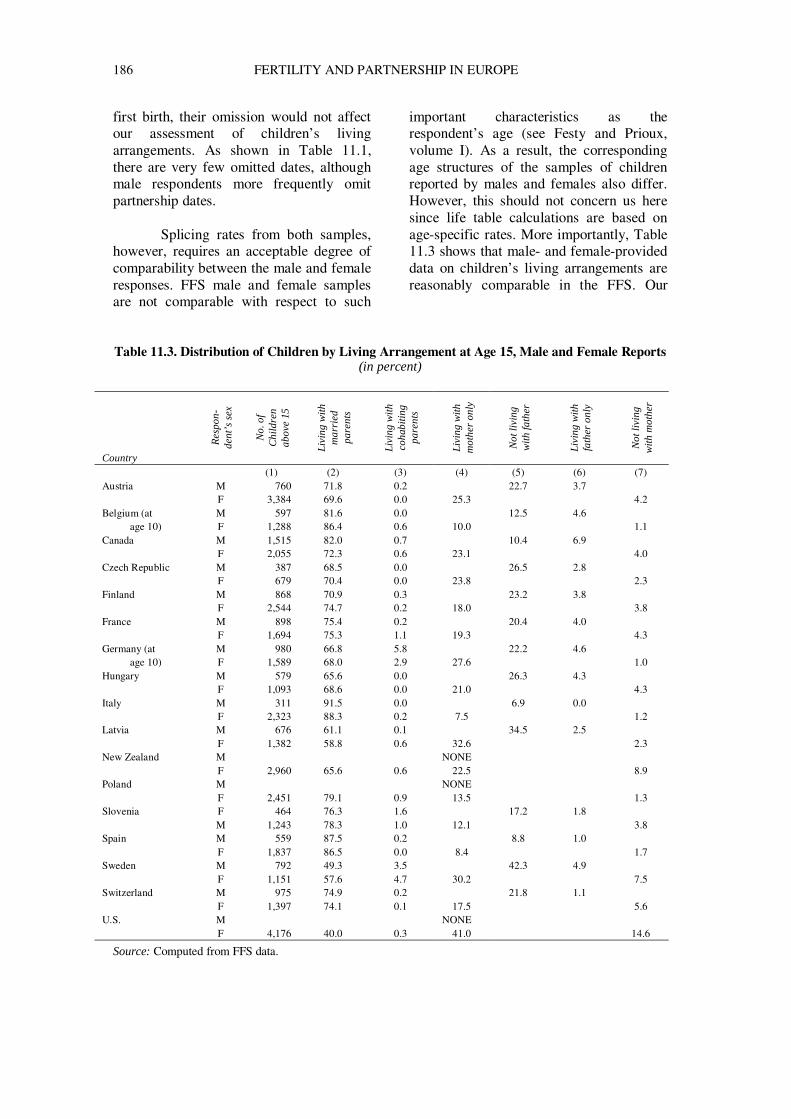
186 FERTILITY AND PARTNERSHIP IN EUROPE
first birth, their omission would not affect our assessment of children’s living arrangements. As shown in Table 11.1, there are very few omitted dates, although male respondents more frequently omit partnership dates.
Splicing rates from both samples,
however, requires an acceptable degree of comparability between the male and female responses. FFS male and female samples are not comparable with respect to such
important characteristics as the respondent’s age (see Festy and Prioux, volume I). As a result, the corresponding age structures of the samples of children reported by males and females also differ. However, this should not concern us here since life table calculations are based on age-specific rates. More importantly, Table 11.3 shows that male- and female-provided data on children’s living arrangements are reasonably comparable in the FFS. Our
Table 11.3. Distribution of Children by Living Arrangement at Age 15, Male and Female Reports
(in percent)
Country
Res
pon-
dent
’s s
ex
No.
of
Chi
ldre
n ab
ove
15
Livi
ng w
ith
mar
ried
pa
rent
s
Livi
ng w
ith
coha
bitin
g pa
rent
s
Livi
ng w
ith
mot
her
only
Not
livi
ng
with
fath
er
Livi
ng w
ith
fath
er o
nly
Not
livi
ng
with
mot
her
(1) (2) (3) (4) (5) (6) (7) Austria M 760 71.8 0.2 22.7 3.7
F 3,384 69.6 0.0 25.3 4.2 Belgium (at M 597 81.6 0.0 12.5 4.6
age 10) F 1,288 86.4 0.6 10.0 1.1 Canada M 1,515 82.0 0.7 10.4 6.9 F 2,055 72.3 0.6 23.1 4.0 Czech Republic M 387 68.5 0.0 26.5 2.8
F 679 70.4 0.0 23.8 2.3 Finland M 868 70.9 0.3 23.2 3.8
F 2,544 74.7 0.2 18.0 3.8 France M 898 75.4 0.2 20.4 4.0
F 1,694 75.3 1.1 19.3 4.3 Germany (at M 980 66.8 5.8 22.2 4.6
age 10) F 1,589 68.0 2.9 27.6 1.0 Hungary M 579 65.6 0.0 26.3 4.3
F 1,093 68.6 0.0 21.0 4.3 Italy M 311 91.5 0.0 6.9 0.0
F 2,323 88.3 0.2 7.5 1.2 Latvia M 676 61.1 0.1 34.5 2.5
F 1,382 58.8 0.6 32.6 2.3 New Zealand M NONE F 2,960 65.6 0.6 22.5 8.9 Poland M NONE
F 2,451 79.1 0.9 13.5 1.3 Slovenia F 464 76.3 1.6 17.2 1.8 M 1,243 78.3 1.0 12.1 3.8 Spain M 559 87.5 0.2 8.8 1.0
F 1,837 86.5 0.0 8.4 1.7 Sweden M 792 49.3 3.5 42.3 4.9
F 1,151 57.6 4.7 30.2 7.5 Switzerland M 975 74.9 0.2 21.8 1.1
F 1,397 74.1 0.1 17.5 5.6 U.S. M NONE
F 4,176 40.0 0.3 41.0 14.6
Source: Computed from FFS data.
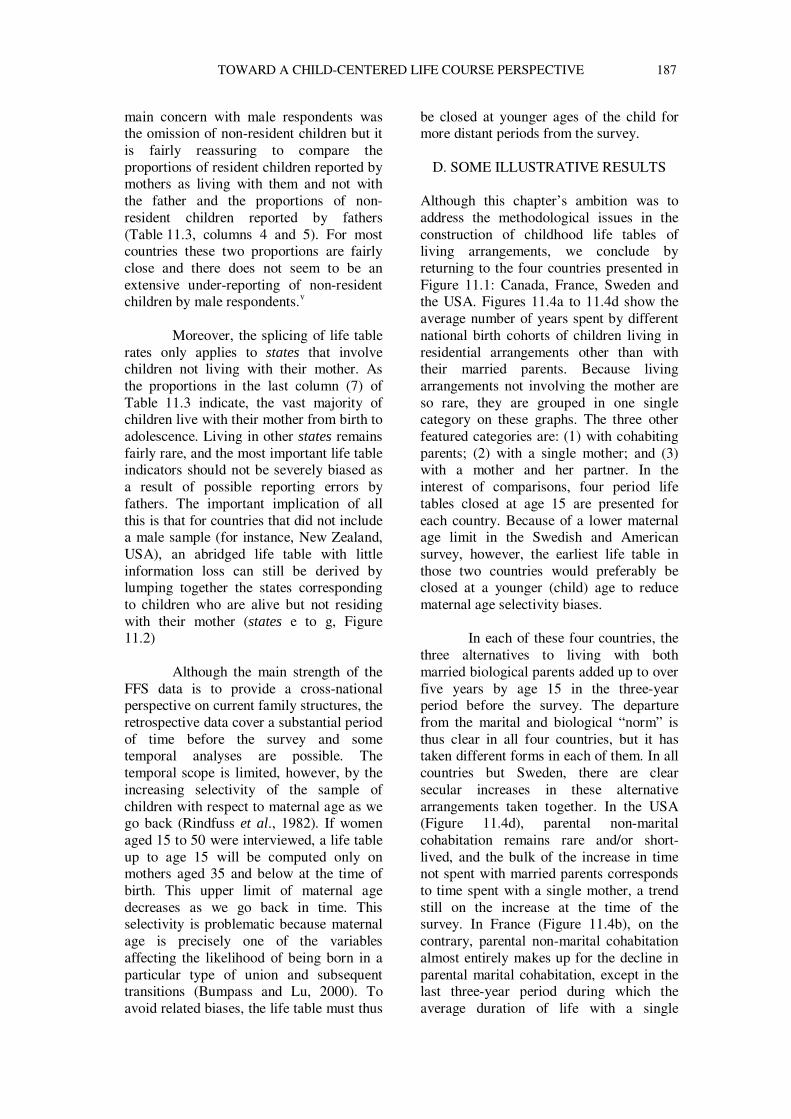
TOWARD A CHILD-CENTERED LIFE COURSE PERSPECTIVE 187
main concern with male respondents was the omission of non-resident children but it is fairly reassuring to compare the proportions of resident children reported by mothers as living with them and not with the father and the proportions of non-resident children reported by fathers (Table 11.3, columns 4 and 5). For most countries these two proportions are fairly close and there does not seem to be an extensive under-reporting of non-resident children by male respondents.v
Moreover, the splicing of life table
rates only applies to states that involve children not living with their mother. As the proportions in the last column (7) of Table 11.3 indicate, the vast majority of children live with their mother from birth to adolescence. Living in other states remains fairly rare, and the most important life table indicators should not be severely biased as a result of possible reporting errors by fathers. The important implication of all this is that for countries that did not include a male sample (for instance, New Zealand, USA), an abridged life table with little information loss can still be derived by lumping together the states corresponding to children who are alive but not residing with their mother (states e to g, Figure 11.2)
Although the main strength of the
FFS data is to provide a cross-national perspective on current family structures, the retrospective data cover a substantial period of time before the survey and some temporal analyses are possible. The temporal scope is limited, however, by the increasing selectivity of the sample of children with respect to maternal age as we go back (Rindfuss et al., 1982). If women aged 15 to 50 were interviewed, a life table up to age 15 will be computed only on mothers aged 35 and below at the time of birth. This upper limit of maternal age decreases as we go back in time. This selectivity is problematic because maternal age is precisely one of the variables affecting the likelihood of being born in a particular type of union and subsequent transitions (Bumpass and Lu, 2000). To avoid related biases, the life table must thus
be closed at younger ages of the child for more distant periods from the survey.
D. SOME ILLUSTRATIVE RESULTS
Although this chapter’s ambition was to address the methodological issues in the construction of childhood life tables of living arrangements, we conclude by returning to the four countries presented in Figure 11.1: Canada, France, Sweden and the USA. Figures 11.4a to 11.4d show the average number of years spent by different national birth cohorts of children living in residential arrangements other than with their married parents. Because living arrangements not involving the mother are so rare, they are grouped in one single category on these graphs. The three other featured categories are: (1) with cohabiting parents; (2) with a single mother; and (3) with a mother and her partner. In the interest of comparisons, four period life tables closed at age 15 are presented for each country. Because of a lower maternal age limit in the Swedish and American survey, however, the earliest life table in those two countries would preferably be closed at a younger (child) age to reduce maternal age selectivity biases.
In each of these four countries, the
three alternatives to living with both married biological parents added up to over five years by age 15 in the three-year period before the survey. The departure from the marital and biological “norm” is thus clear in all four countries, but it has taken different forms in each of them. In all countries but Sweden, there are clear secular increases in these alternative arrangements taken together. In the USA (Figure 11.4d), parental non-marital cohabitation remains rare and/or short-lived, and the bulk of the increase in time not spent with married parents corresponds to time spent with a single mother, a trend still on the increase at the time of the survey. In France (Figure 11.4b), on the contrary, parental non-marital cohabitation almost entirely makes up for the decline in parental marital cohabitation, except in the last three-year period during which the average duration of life with a single
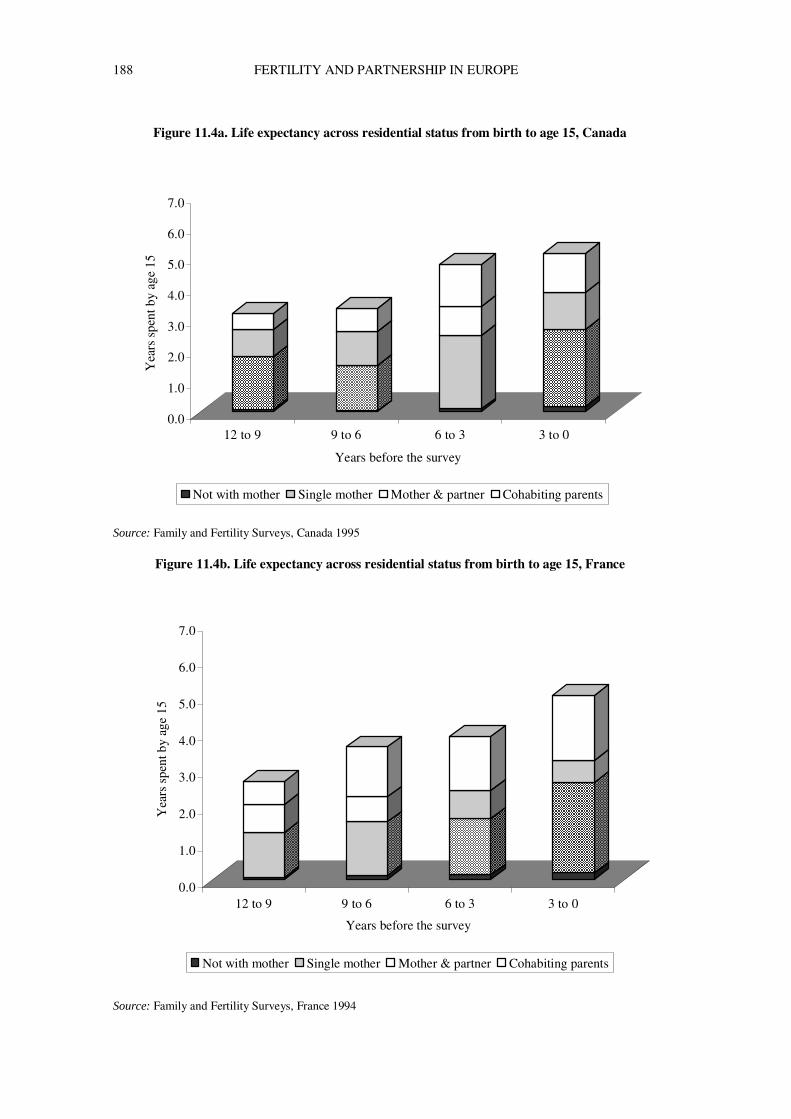
188 FERTILITY AND PARTNERSHIP IN EUROPE
Figure 11.4a. Life expectancy across residential status from birth to age 15, Canada
Source: Family and Fertility Surveys, Canada 1995
Figure 11.4b. Life expectancy across residential status from birth to age 15, France
Source: Family and Fertility Surveys, France 1994
0.0
1.0
2.0
3.0
4.0
5.0
6.0
7.0
Yea
rs s
pent
by
age
15
12 to 9 9 to 6 6 to 3 3 to 0
Years before the survey
Not with mother Single mother Mother & partner Cohabiting parents
0.0
1.0
2.0
3.0
4.0
5.0
6.0
7.0
Yea
rs s
pent
by
age
15
12 to 9 9 to 6 6 to 3 3 to 0
Years before the survey
Not with mother Single mother Mother & partner Cohabiting parents
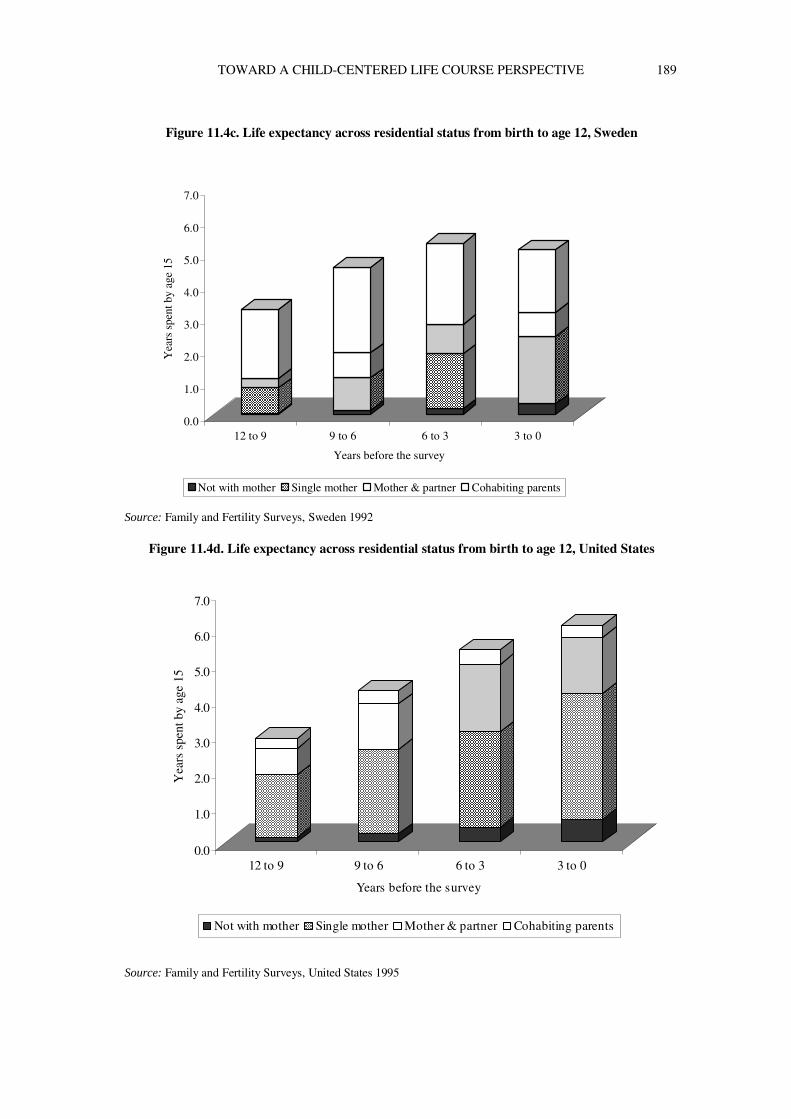
TOWARD A CHILD-CENTERED LIFE COURSE PERSPECTIVE 189
Figure 11.4c. Life expectancy across residential status from birth to age 12, Sweden
Source: Family and Fertility Surveys, Sweden 1992
Figure 11.4d. Life expectancy across residential status from birth to age 12, United States
Source: Family and Fertility Surveys, United States 1995
0.0
1.0
2.0
3.0
4.0
5.0
6.0
7.0
Yea
rs s
pent
by
age
15
12 to 9 9 to 6 6 to 3 3 to 0
Years before the survey
Not with mother Single mother Mother & partner Cohabiting parents
0.0
1.0
2.0
3.0
4.0
5.0
6.0
7.0
Yea
rs s
pent
by
age
15
12 to 9 9 to 6 6 to 3 3 to 0
Years before the survey
Not with mother Single mother Mother & partner Cohabiting parents
190 FERTILITY AND PARTNERSHIP IN EUROPE
mother increases sharply. Canada (Figure 11.4a) displays an intermediate trend; both living with non-married cohabiting parents and with a single mother make up roughly to the same extent for a decline in the number of years spent with married parents, particularly in the last six years before the survey. As expected, Sweden (Figure 11.4c) displays the highest average time spent with non-married cohabiting parents, a peculiarity that seems to be fading by the time of the survey.
These few illustrative results
suggest that there is much more variety in family trends across Western societies than one may suspect at first. It may seem that the Western family is affected across societies by common macro-structural factors that tend to produce more frequent out-of-wedlock births, divorce, and non-marital cohabitation. In fact, there not only seems to be variation in the timing of family changes, but also real differences in national patterns of children’s living arrangements and in their recent evolutions. The rich FFS data provide the opportunity to study these differences in greater detail than was possible before, primarily because they capture unmarried as well as married partnerships throughout the life course of recent birth cohorts. At the time of these surveys, most systems of children’s living arrangements were clearly undergoing profound transformations. We look forward to analyzing these data further and hope that the FFS project will continue to give us an opportunity to follow the trajectories of the Western family in the present decade.
REFERENCES Amato, P. R. and B. Keith (1991). Parental divorce
and the Well-Being of Children: a Meta-Analysis. Psychological Bulletin 110, 26-46.
Bumpass, L. L. (1984). Children and Marital Disruption: A Replication and Update. Demography 21, 71-82.
Bumpass, L. L. and H. H. Lu (2000). Trends in Cohabitation and Implications for Children's Family Contexts in the United States. Population Studies 54, 29-41.
Bumpass, L. L. and R. K. Raley (1995). Redefining Single-Parent Families: Cohabitation and Changing Family Reality. Demography 32, 97-109.
Bumpass, L. L. and R. R. Rindfuss (1979). Children's Experience of Marital Disruption. American Journal of Sociology 85, 49-65.
Bumpass, L. L. and J. A. Sweet (1989). Children's Experience in Single-Parent Families: Implications of Cohabitation and Marital Transitions. Family Planning Perspectives 21, 256-260.
Castro Martín, T. and L. L. Bumpass (1989). Recent Trends in Marital Disruption. Demography 26, 37-51.
Cherlin, A. J. (1999). Going to Extremes: Family Structure, Children's Well-Being, and Social Science. Demography 36, 421-428.
Cherlin, A. J. and F. F. Furstenberg, Jr. (1994). Stepfamilies in the United States: a reconsideration. Annual Review of Sociology 20, 359-381.
Furstenberg, F. F. Jr. and A. J. Cherlin (1991). Divided Families: What Happens to Children When Parents Part. Cambridge, MA: Harvard University Press.
Furstenberg, F. F. Jr., C. W. Nord, J. L. Peterson, and N. Zill (1983). The Life Course of Children of Divorce: Marital Disruption and Parental Contact. American Sociological Review 48, 656-668.
Goode, W.J. (1970). World Revolution and Family Patterns. New York: Free Press.
Granström, F. (1997). Fertility and Family Surveys in Countries of the ECE Region. Standard Country Report Sweden. Economic Studies No. 10b. New York/Geneva: United Nations.
Heuveline, P. (1998). L'insoutenable incertitude du nombre: Estimation des décès de la période Khmer Rouge. Population 53, 1103-1118.
Hoem, B. and J. M. Hoem (1992). The Disruption of Marital and Non-Marital Unions in Contemporary Sweden. In J. Trussell, R. Hankinson, and J. Tilton (Eds). Demographic Applications of Event History Analysis. Oxford: Clarendon Press, 61-93.
Kiernan, K. E. (1999). European Perspectives on Non-Marital Childbearing. Paper Presented at the Conference on Non-Marital Childbearing. Madison, WI, April 29-30, 1999.
Klijzing, E., and H. Cairns (2000). On the quality of FFS event history data: of critical importance in life course research. GLOBALIFE Working Paper Series, No. 13, University of Bielefeld, Faculty of Sociology.
Land, K. C. and A. Rogers (Eds.) (1982). Multidimensional Mathematical Demography. New York: Academic Press.
Macura, M. and E. Klijzing (1992). Fertility and Family Surveys in Countries of the ECE Region. Manuscript, Population Activities Unit of the Economic Commission for Europe, Geneva.
McLanahan, S. and G. Sandefur (1994). Growing Up With a Single Parent: What Hurts, What Helps. Cambridge, Mass.: Harvard University Press.
Murphy, M. (2000). The Evolution of Cohabitation in Britain, 1960-95. Population Studies 54, 43-56.
Palloni, A. (2001). Increment-Decrement Life Tables. In S. H. Preston, P. Heuveline, and M. Guillot. Demography: Measuring and Modeling
TOWARD A CHILD-CENTERED LIFE COURSE PERSPECTIVE 191
Population Processes. Oxford, England and Malden, MA: Blackwell Publishers, 256-272.
Prinz, C. (1995). Cohabiting, Married or Single: Portraying, Analyzing and Modeling New Living Arrangements in the Changing Societies of Europe. Brookfield, Vermont: Ashgate Publishing Co.
Rindfuss, R. R., J. Palmore, and L. L. Bumpass (1982). Selectivity and the Analysis of Birth Intervals With Survey Data. Asian and Pacific Census Forum 8, 5-16.
Rogers, A. (1975). Introduction to Multiregional Mathematical Demography. New York: Wiley.
Rogers, A. (1995). Multiregional Demography: Principles, Methods and Extensions. New York: Wiley.
Rogers, A. and J. Ledent (1976). Increment-Decrement Life Tables: A Comment. Demography 13, 287-290.
Sandefur, G. D. and J. Mosley (1997). Family Structure, Stability, and the Well-Being of Children. In R. M. Hauser et al. (Eds) Indicators of Children's Well-Being. New York: Russell Sage Foundation, 328-345.
Schoen, R. (1988). Modeling Multigroup Populations. New York: Plenum Press.
Schoen, R. and V. E. Nelson (1974). Marriage, Divorce, and Mortality: a Life Table Analysis. Demography 11, 267-290.
Smith, H. L., S. P. Morgan, and T. Koropeckyj-Cox (1996). A Decomposition of Trends in Nonmarital Fertility Ratios of Blacks and Whites in the United States. Demography 33, 141-151.
Toulemon, L. (1997). Cohabitation is here to stay. Population: An English Selection 9, 11-56.
Toulemon, L., and C. de Guibert-Lantoine (1998). Fertility and Family Surveys in Countries of the ECE Region. Standard Country Report. France. Economic Studies 10e. United Nations: New York/Geneva: United Nations
Wojtkiewicz, R. A. (1993). Simplicity and complexity in the effects of parental structure on high school graduation. Demography 30, 701-717.
Wu Zeng (1999). Fertility and Family Surveys in Countries of the ECE Region. Standard Country Report. Canada. Economic Studies 10k. United Nations: New York/Geneva: United Nations
ENDNOTES i This research has been supported in part by grant 2 P30-HD18288-16 from the National Institute on Child and Human Development. The authors also wish to thank the FFS Advisory Group of comparative research for its permission, granted under project number 57, to use the FFS data on which this study is based. Additional releases and support from the Institut National de la Statistique et des Etudes Economiques, the Bundesinstitut für Bevölkerungsforschung, the Swiss Federal Statistical Office, and Statistics Sweden are also gratefully acknowledged. Larry Bumpass, Martine Corijn, Gert Hullen, Erik Klijzing, Kurt Schmidheiny, and Laurent Toulemon provided essential information about the survey data, whereas Ye Luo created the working files used in the analyses presented here. Thanks also go to Jan Hoem for comments and suggestions. While this research would not have been possible without the contributions of the above agencies and persons, whatever flaws may remain in it are the sole responsibility of the authors. ii The 21 countries are shown in Table 9.1. Additional FFS data from Estonia, Greece and the Netherlands were not available to us at the time of writing. iii To take a numerical example from the USA - the country with the highest proportions of births out-of-partnership - we had data on 2 421 births three to six years before the survey. Of those births, 521 were born outside a partnership and of those, 205 experienced at least one partnership formation of their mother before the survey, three to six years later. The problem of identifying whether the first partner of their mother was in fact their father thus concerned these 8.5 per cent of the total birth cohort. Given our allocation rule that combines timing and marital status, we estimated that 59 children (2.4 per cent) experienced their parents’ forming a partnership. If we had used a stricter timing rule of six months regardless of marital status, the estimate would have been 56 children (2.3 per cent). With a more liberal timing rule of one full year regardless of marital status, the estimate would have been 78 children (3.2 per cent), and with an additional six months in the case of marriage, the estimate would become 82 children (3.4 per cent). Although the uncertainty about the exact value is unfortunate, the numerical impact on the average estimates for the birth cohort is thus limited, even in a country where out-of-partnership births and repartnering are frequent. iv In the three countries for which only a female sample is available, we can only compute a life table with fewer states from the mother-reported sample. Namely, all states that do not involve the mother - states (e), (f), and (g) - remain grouped into a single status “alive but not living with the mother”. v Belgium and Germany exhibit very different male and female distributions because in these countries the age range of adults in the sample is 20-40 and the number of children 15 and older is quite small. Thus, for these two countries we estimated the distributions at age 10.
193
CHAPTER 12
IMPACT OF POPULATION RELATED POLICIES
ON SELECTED LIVING ARRANGEMENTS: COMPARATIVE ANALYSES AT THE REGIONAL LEVEL
IN BELGIUM, THE NETHERLANDS, AND SWITZERLAND
Beat Fux and A. Doris Baumgartner∗
∗ Sociological Institute, University of Zurich, Zurich (Switzerland)
A. INTRODUCTION Over the past few decades, the traditional family has undergone important transformations. Declining fertility but increasing divorce and female labour force participation became some of the dominant subjects of scientific research. During this period new family forms entered into competition with the “bourgeois type of family” (Parsons’ „normal” family) and its predetermined gender division of labour (the male breadwinner model). However, the dissemination of these new living arrangements, like unmarried cohabitation, lone parenthood, voluntary childlessness or living apart together, as well as their legitimacy vary significantly across countries, and even within countries.
In the face of these changes,
increasing priority was given to questions like: What is, could or should be the role of the state in the field of family related policies? Do different forms of government support have an impact on the spread of certain living arrangements? If so, through which mechanisms? Although such queries led to many scientific studies on family policy matters, only limited progress in this field can be registered. In particular, hardly any direct causal effects could be detected or quantified for particular family benefits or provisions.
The reasons for the limited
knowledge on these topics is at least threefold. Firstly, family policy refers to an
over-complex system of interdependencies in which three subsystems - individuals, families, and the state - are involved in multiple ways (Kaufmann and Herlth, 1982). This leads to methodological problems that cannot easily be solved in an appropriate way. Besides, they are compounded by the lack of strictly comparative information on family related policies. Further difficulties arise from the fact that next to universal benefits, there are also means-tested and tax-related benefits as well as particular benefits for specific sub-groups only. In their impact analysis one has therefore to distinguish between different types of recipients as well as between different living arrangements. Furthermore, the general scarcity of longitudinal individual-level data aggravates the micro-macro problem. Comparative large-scale surveys like the FFS certainly improve the situation but do not remedy the problem. Secondly, concise theories on the subject are lacking. Admittedly, macro-analytical approaches exist that compare the effects of family policy expenditures on the distribution of selected family forms or on particular demographic indicators such as total fertility, extra-marital fertility or labour force participation rates (Ekert, 1986; Blanchet and Ekert-Jaffé, 1988; Huber and Stephens, 1992; Gauthier, 1993, 1996; Hoem, 1998). But these approaches often neglect the interests and intentions of individual actors or specific sub-groups of the population. There are also economic theories such as the New Home Economics,
194 FERTILITY AND PARTNERSHIP IN EUROPE
which mostly focus on the concept of the costs of children (Becker, 1981; Cherlin, 2000; Friedman et al., 1994). Even though these theories argue from a micro-analytical perspective, they often tend to overemphasise the dimension of economic rationality, as if children were just consumer goods. Another group of theories have made attempts to catch up on these arrears. Among them are Caldwell’s wealth flows theory (Caldwell, 1982), Esping-Andersen’s theory of welfare capitalism (Esping-Andersen, 1990), Kaufmann’s micro-simulations (Kaufmann et al., 1988, 1992), and generalised rational-choice approaches (Cliquet et al., 1992; de Bruijn, 1992; Fux, 1994). However, some of their proposals are not explicitly devoted to family policy, but to welfare policies in a much broader sense. Thirdly, besides the above-mentioned difficulties, comparative studies on the potential effects of family policies should take into account the peculiarities of countries concerning the past and present state of their economies, their cultural traditions, as well as their family policy systems (Lesthaeghe and Moors, 2000; Billari et al., this Volume).
Against this background, the
present chapter can deliver only preliminary answers to the question: are there particular models of the family that are encouraged or – the opposite – discouraged by different welfare policies, and if so, which are these models? The objective of this chapter is therewith twofold. Firstly, we propose an impact model which stresses, on the one hand, the interdependencies between economic preconditions, societal cleavages, demographic prerequisites, and family related policies, and, on the other, the spread and adoption of selected living arrangements. Secondly, by concentrating on three smaller but highly segmented countries, namely, Belgium, the Netherlands, and Switzerland, we test selected hypotheses. Data used for these purposes come from different sources such as population censuses, comparative policy databases, various national statistics, as well as from national FFSi. More detailed information is given in the Appendix.
B. AN APPROACH TO ANALYSE THE IMPACT OF FAMILY POLICIES ON
LIVING ARRANGEMENTS One can distinguish two different types of welfare or family policy impact models. A first type - we call it the causal interpretation model - assumes that a government is implementing a certain policy in order to directly influence the behaviour of families and/or individuals. Human behaviour is considered as determined by external factors, such as the interests of governmental actors to promote, prevent, or regulate a certain outcome. This type of explanation has some important shortcomings. First of all, countries infrequently formulate policies that explicitly relate to the family or other particular living arrangements. Furthermore, it has been argued that governmental acting often produces unintended consequences. In addition, causal models mostly do not allow a clear description of how individual-level mechanisms lead to a certain outcome. Finally, although causal models are based on well-defined relations between actors and behavioural outcomes, differential effects for certain time-periods or for some sub-groups as well as indirect effects seem often to be neglected. In reviewing the literature on this (see e.g. Fux, 2001), one can say that most authors express severe doubts as to whether welfare or family policies do have a direct quantitative long-term impact on individual behaviour (Höhn and Schubnell, 1986). However, although such a scepticism about causal effects seems legitimate, one should not exclude the possibility of interdependent relations.
Therefore, a second type of impact
model – we call it the dynamic interdependencies model – considers human behaviour as being indeterministic. According to this model - similar to rational choice models - individual interests, preferences, and intentions can neither be explained nor predicted in a strict sense. The government as well as families and individuals are considered as embedded in a network of interdependent relations. Both groups of actors evaluate societal processes
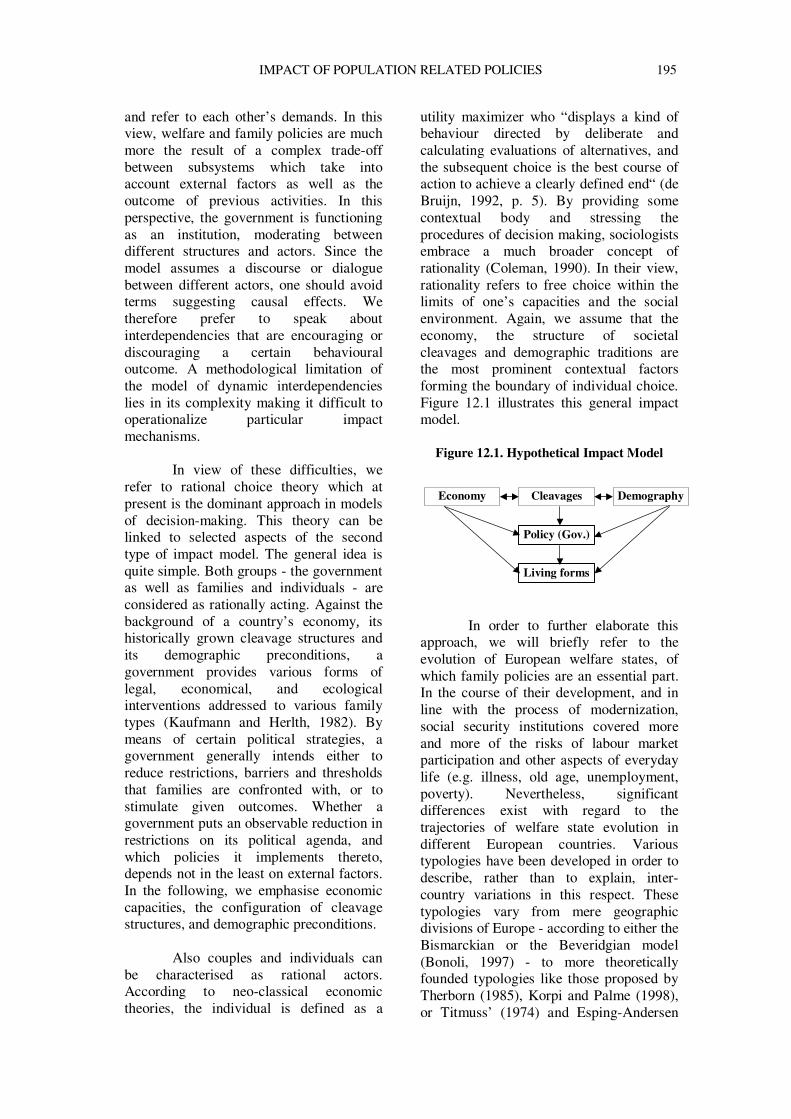
IMPACT OF POPULATION RELATED POLICIES 195
and refer to each other’s demands. In this view, welfare and family policies are much more the result of a complex trade-off between subsystems which take into account external factors as well as the outcome of previous activities. In this perspective, the government is functioning as an institution, moderating between different structures and actors. Since the model assumes a discourse or dialogue between different actors, one should avoid terms suggesting causal effects. We therefore prefer to speak about interdependencies that are encouraging or discouraging a certain behavioural outcome. A methodological limitation of the model of dynamic interdependencies lies in its complexity making it difficult to operationalize particular impact mechanisms.
In view of these difficulties, we
refer to rational choice theory which at present is the dominant approach in models of decision-making. This theory can be linked to selected aspects of the second type of impact model. The general idea is quite simple. Both groups - the government as well as families and individuals - are considered as rationally acting. Against the background of a country’s economy, its historically grown cleavage structures and its demographic preconditions, a government provides various forms of legal, economical, and ecological interventions addressed to various family types (Kaufmann and Herlth, 1982). By means of certain political strategies, a government generally intends either to reduce restrictions, barriers and thresholds that families are confronted with, or to stimulate given outcomes. Whether a government puts an observable reduction in restrictions on its political agenda, and which policies it implements thereto, depends not in the least on external factors. In the following, we emphasise economic capacities, the configuration of cleavage structures, and demographic preconditions.
Also couples and individuals can
be characterised as rational actors. According to neo-classical economic theories, the individual is defined as a
utility maximizer who “displays a kind of behaviour directed by deliberate and calculating evaluations of alternatives, and the subsequent choice is the best course of action to achieve a clearly defined end“ (de Bruijn, 1992, p. 5). By providing some contextual body and stressing the procedures of decision making, sociologists embrace a much broader concept of rationality (Coleman, 1990). In their view, rationality refers to free choice within the limits of one’s capacities and the social environment. Again, we assume that the economy, the structure of societal cleavages and demographic traditions are the most prominent contextual factors forming the boundary of individual choice. Figure 12.1 illustrates this general impact model.
Figure 12.1. Hypothetical Impact Model
In order to further elaborate this approach, we will briefly refer to the evolution of European welfare states, of which family policies are an essential part. In the course of their development, and in line with the process of modernization, social security institutions covered more and more of the risks of labour market participation and other aspects of everyday life (e.g. illness, old age, unemployment, poverty). Nevertheless, significant differences exist with regard to the trajectories of welfare state evolution in different European countries. Various typologies have been developed in order to describe, rather than to explain, inter-country variations in this respect. These typologies vary from mere geographic divisions of Europe - according to either the Bismarckian or the Beveridgian model (Bonoli, 1997) - to more theoretically founded typologies like those proposed by Therborn (1985), Korpi and Palme (1998), or Titmuss’ (1974) and Esping-Andersen
Cleavages Economy Demography
Policy (Gov.)
Living forms
196 FERTILITY AND PARTNERSHIP IN EUROPE
(1990). Concerning the three countries under observation, one can state that according to most of these typologies they represent rather clearly distinct welfare regimes. In Esping-Andersen’s terminology, Belgium represents the conservative, the Netherlands the social-democratic, and Switzerland the liberal welfare regime.
The family policy systems of these
three welfare regimes can ideal-typically be characterised as follows. Countries with a social-democratic regime prefer ecological interventions (e.g. services), a fact which might be explained by their support for women’s emancipation through increased labour force participation and education. In these countries, the amount of family allowances is markedly higher, but with a smaller progression of benefits in relation to children’s parity. The duration of maternity leave is longer, and there is a preference for parental rather than child-care leave, which only women are entitled to. Since these measures are expensive, they require higher taxes from the citizens. Countries representing the conservative type show many similarities with countries of the social-democratic type. Nevertheless, they differ with regard to the following aspects. The objective of their family policy is centred on providing monetary transfers between married couples, on the one hand, and individuals in non-marital living arrangements, on the other. Support for women’s emancipation is of minor importance. These countries prefer economic interventions, e.g. high family allowances that are linked to children’s parity. The overall expenditure of this type of family policy is lower than in the social-democratic regime, but markedly higher than in the liberal. The peculiarities of the latter are to be described in negative terms, rather than in terms of clearly structured preferences. Characteristic are a short duration of maternity leave, mostly in the absence of payment guarantees, and relatively low tax rates because social security expenditures as well as maternity and family expenditures are significantly lower. By contrast, the average income of individuals in liberal welfare regimes is
often comparatively high. Figure 12.2 illustrates for Belgium, the Netherlands, and Switzerland the changing levels of overall family cash benefits and expenditures on family services. Cash benefits are highest in Belgium. On the other hand, the Netherlands is more generous with regard to services addressed to families. Switzerland ranks lowest on both dimensions (services are marginal and, therefore, not documented). Figure 12.2 also shows the dismantling of family policies over time, particularly in Belgium and the Netherlands during the 1980s. C. HYPOTHESES AND DESCRIPTION
OF BASIC DEVELOPMENTS The selection of these three smaller Western European countries depends first of all on our interest to study the relevance of structural and cultural variations for various household and family forms on a sub-national level, i.e. in provinces (Belgium and the Netherlands) or cantons (Switzerland). All three countries are characterised by a strong internal segmentation in terms of religious denominations, languages, the degree of urbanization and, finally, the structure of the economic sectors. Furthermore, as explained above, each of them represents a particular welfare and family policy regime. Through regional level analysis one can simultaneously control for these cleavage and welfare policy effects on family related behaviour.
Analyses are concentrated mainly
on four living arrangements: one-person households, childless couples, mono-parental families, and households with five or more persons. We do not particularly focus on married couples with one or two children, which is the most frequent family form in many countries (see Kaufmann et al., 1997), but instead investigate living arrangements that can be assumed to be highly dependent on contextual factors. We suppose that the occurrence of one-person households and childless couples depends strongly on the process of (either structural or cultural) modernisation in a country or region. Larger families - those with 3 or
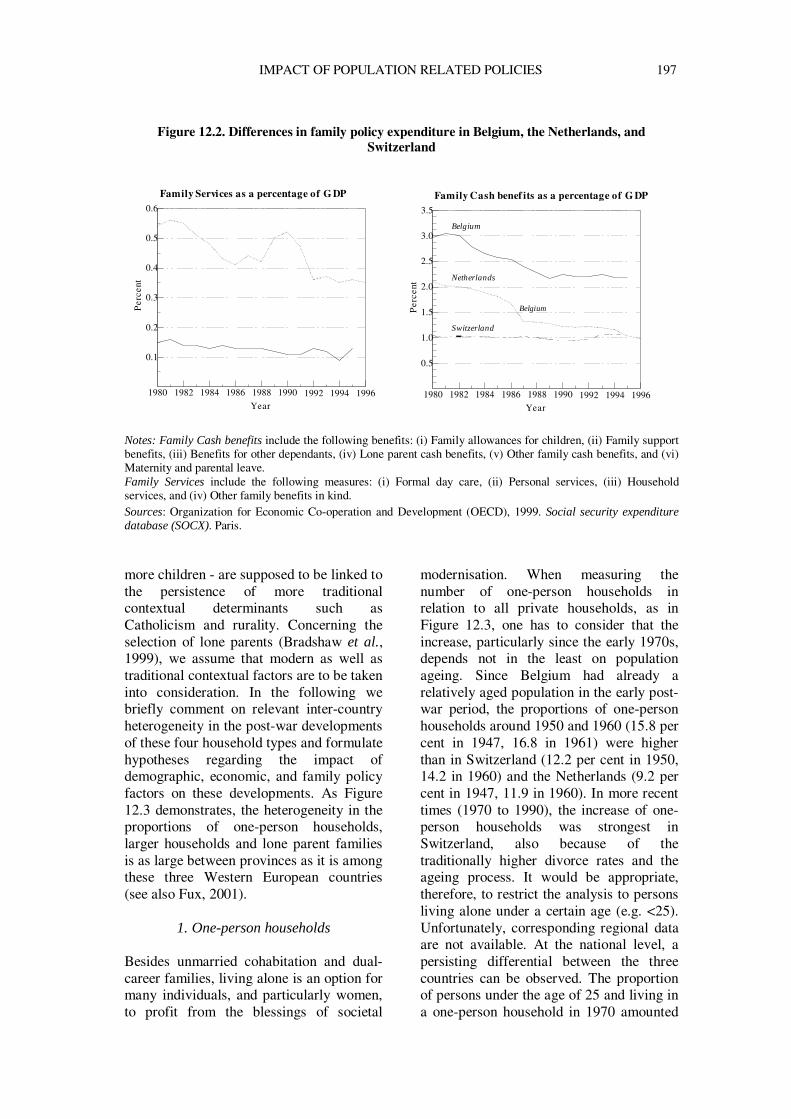
IMPACT OF POPULATION RELATED POLICIES 197
Figure 12.2. Differences in family policy expenditure in Belgium, the Netherlands, and
Switzerland
Notes: Family Cash benefits include the following benefits: (i) Family allowances for children, (ii) Family support benefits, (iii) Benefits for other dependants, (iv) Lone parent cash benefits, (v) Other family cash benefits, and (vi) Maternity and parental leave. Family Services include the following measures: (i) Formal day care, (ii) Personal services, (iii) Household services, and (iv) Other family benefits in kind. Sources: Organization for Economic Co-operation and Development (OECD), 1999. Social security expenditure database (SOCX). Paris.
more children - are supposed to be linked to the persistence of more traditional contextual determinants such as Catholicism and rurality. Concerning the selection of lone parents (Bradshaw et al., 1999), we assume that modern as well as traditional contextual factors are to be taken into consideration. In the following we briefly comment on relevant inter-country heterogeneity in the post-war developments of these four household types and formulate hypotheses regarding the impact of demographic, economic, and family policy factors on these developments. As Figure 12.3 demonstrates, the heterogeneity in the proportions of one-person households, larger households and lone parent families is as large between provinces as it is among these three Western European countries (see also Fux, 2001).
1. One-person households Besides unmarried cohabitation and dual-career families, living alone is an option for many individuals, and particularly women, to profit from the blessings of societal
modernisation. When measuring the number of one-person households in relation to all private households, as in Figure 12.3, one has to consider that the increase, particularly since the early 1970s, depends not in the least on population ageing. Since Belgium had already a relatively aged population in the early post-war period, the proportions of one-person households around 1950 and 1960 (15.8 per cent in 1947, 16.8 in 1961) were higher than in Switzerland (12.2 per cent in 1950, 14.2 in 1960) and the Netherlands (9.2 per cent in 1947, 11.9 in 1960). In more recent times (1970 to 1990), the increase of one-person households was strongest in Switzerland, also because of the traditionally higher divorce rates and the ageing process. It would be appropriate, therefore, to restrict the analysis to persons living alone under a certain age (e.g. <25). Unfortunately, corresponding regional data are not available. At the national level, a persisting differential between the three countries can be observed. The proportion of persons under the age of 25 and living in a one-person household in 1970 amounted
Netherlands
Switzerland
Belgium
1980 1982 1984 1986 1988 1990 1992 1994 1996
0.5
1.0
1.5
2.0
2.5
3.0
3.5
YearP
erce
nt
Family Cash benef its as a percentage of G DP
1980 1982 1984 1986 1988 1990 1992 1994 1996
0.1
0.2
0.3
0.4
0.5
0.6
Year
Per
cent
Family Services as a percentage of G DP
Belgium
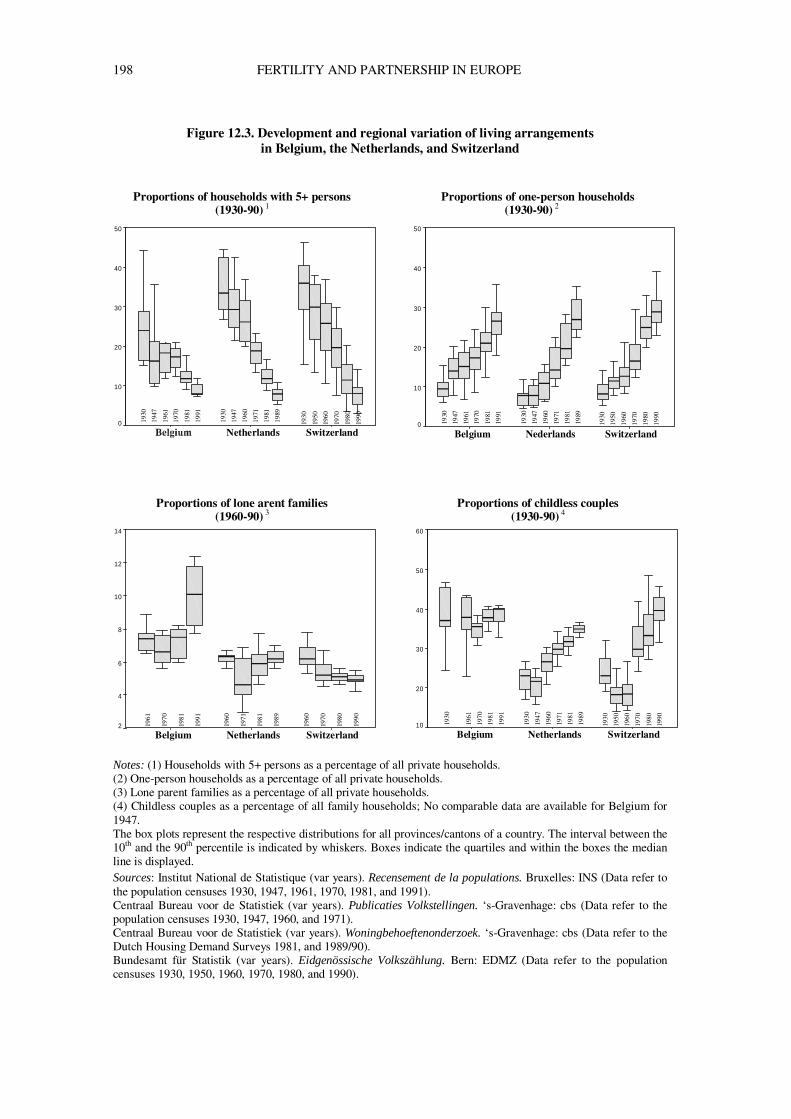
198 FERTILITY AND PARTNERSHIP IN EUROPE
Figure 12.3. Development and regional variation of living arrangements
in Belgium, the Netherlands, and Switzerland
Proportions of households with 5+ persons (1930-90) 1
Proportions of one-person households (1930-90) 2
Proportions of lone arent families (1960-90) 3
Proportions of childless couples
(1930-90) 4
Notes: (1) Households with 5+ persons as a percentage of all private households. (2) One-person households as a percentage of all private households. (3) Lone parent families as a percentage of all private households. (4) Childless couples as a percentage of all family households; No comparable data are available for Belgium for 1947. The box plots represent the respective distributions for all provinces/cantons of a country. The interval between the 10th and the 90th percentile is indicated by whiskers. Boxes indicate the quartiles and within the boxes the median line is displayed. Sources: Institut National de Statistique (var years). Recensement de la populations. Bruxelles: INS (Data refer to the population censuses 1930, 1947, 1961, 1970, 1981, and 1991). Centraal Bureau voor de Statistiek (var years). Publicaties Volkstellingen. ‘s-Gravenhage: cbs (Data refer to the population censuses 1930, 1947, 1960, and 1971). Centraal Bureau voor de Statistiek (var years). Woningbehoeftenonderzoek. ‘s-Gravenhage: cbs (Data refer to the Dutch Housing Demand Surveys 1981, and 1989/90). Bundesamt für Statistik (var years). Eidgenössische Volkszählung. Bern: EDMZ (Data refer to the population censuses 1930, 1950, 1960, 1970, 1980, and 1990).
50
40
30
20
10
0
Netherlands Switzerland
1930
1947
1960
1971
1981
1989
1930
1947
1961
1970
1981
1991
1930
1950
1960
1970
1980
1990
50
40
30
20
10
0
NederlandsBelgium Switzerland
1930
1950
1960
1970
1980
1990
1930
1947
1960
1971
1981
1989
1930
1947
1961
1970
1981
1991
0
0
0
0
0
0
6
5
4
3
2
1
NetherlandsBelgium Switzerland
1930
1950
1960
1970
1980
1990
1930
1947
1960
1971
1981
1989
1930
1961
1970
1981
1991
14
12
10
8
6
4
2
NetherlandsBelgium Switzerland
1961
1970
1981
1991
1960
1971
1981
1989
1960
1970
1980
1990
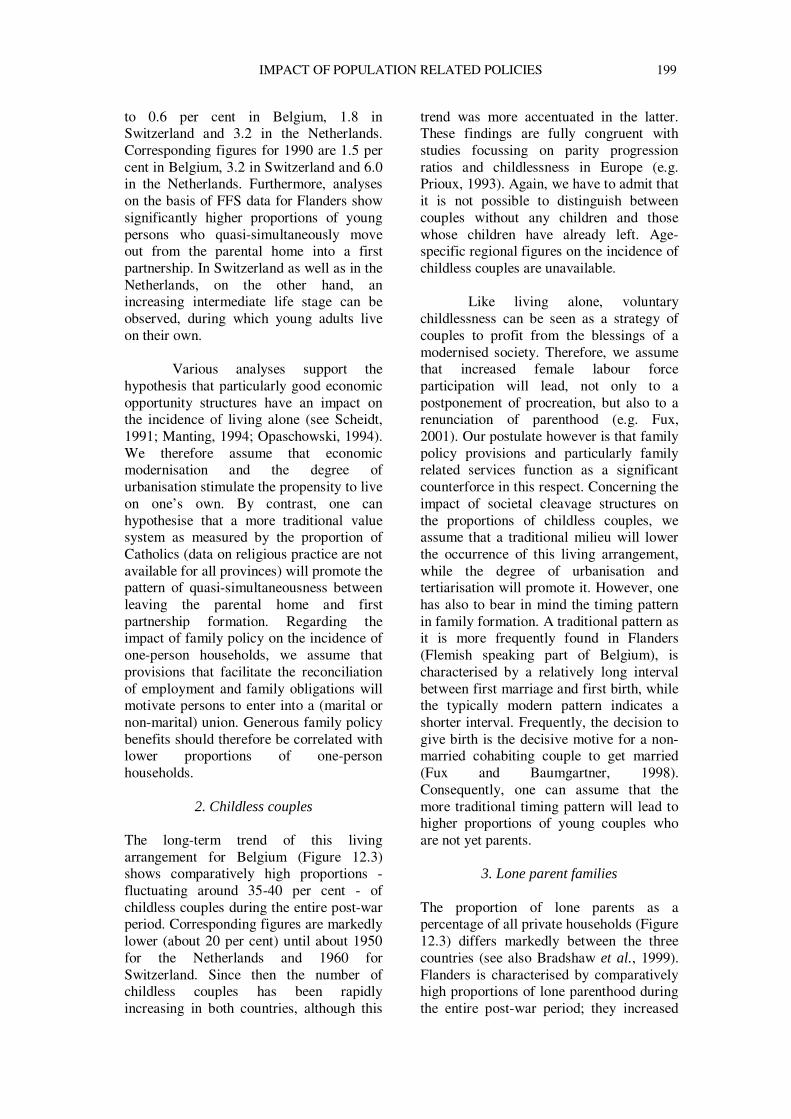
IMPACT OF POPULATION RELATED POLICIES 199
to 0.6 per cent in Belgium, 1.8 in Switzerland and 3.2 in the Netherlands. Corresponding figures for 1990 are 1.5 per cent in Belgium, 3.2 in Switzerland and 6.0 in the Netherlands. Furthermore, analyses on the basis of FFS data for Flanders show significantly higher proportions of young persons who quasi-simultaneously move out from the parental home into a first partnership. In Switzerland as well as in the Netherlands, on the other hand, an increasing intermediate life stage can be observed, during which young adults live on their own.
Various analyses support the
hypothesis that particularly good economic opportunity structures have an impact on the incidence of living alone (see Scheidt, 1991; Manting, 1994; Opaschowski, 1994). We therefore assume that economic modernisation and the degree of urbanisation stimulate the propensity to live on one’s own. By contrast, one can hypothesise that a more traditional value system as measured by the proportion of Catholics (data on religious practice are not available for all provinces) will promote the pattern of quasi-simultaneousness between leaving the parental home and first partnership formation. Regarding the impact of family policy on the incidence of one-person households, we assume that provisions that facilitate the reconciliation of employment and family obligations will motivate persons to enter into a (marital or non-marital) union. Generous family policy benefits should therefore be correlated with lower proportions of one-person households.
2. Childless couples
The long-term trend of this living arrangement for Belgium (Figure 12.3) shows comparatively high proportions - fluctuating around 35-40 per cent - of childless couples during the entire post-war period. Corresponding figures are markedly lower (about 20 per cent) until about 1950 for the Netherlands and 1960 for Switzerland. Since then the number of childless couples has been rapidly increasing in both countries, although this
trend was more accentuated in the latter. These findings are fully congruent with studies focussing on parity progression ratios and childlessness in Europe (e.g. Prioux, 1993). Again, we have to admit that it is not possible to distinguish between couples without any children and those whose children have already left. Age-specific regional figures on the incidence of childless couples are unavailable.
Like living alone, voluntary
childlessness can be seen as a strategy of couples to profit from the blessings of a modernised society. Therefore, we assume that increased female labour force participation will lead, not only to a postponement of procreation, but also to a renunciation of parenthood (e.g. Fux, 2001). Our postulate however is that family policy provisions and particularly family related services function as a significant counterforce in this respect. Concerning the impact of societal cleavage structures on the proportions of childless couples, we assume that a traditional milieu will lower the occurrence of this living arrangement, while the degree of urbanisation and tertiarisation will promote it. However, one has also to bear in mind the timing pattern in family formation. A traditional pattern as it is more frequently found in Flanders (Flemish speaking part of Belgium), is characterised by a relatively long interval between first marriage and first birth, while the typically modern pattern indicates a shorter interval. Frequently, the decision to give birth is the decisive motive for a non-married cohabiting couple to get married (Fux and Baumgartner, 1998). Consequently, one can assume that the more traditional timing pattern will lead to higher proportions of young couples who are not yet parents.
3. Lone parent families
The proportion of lone parents as a percentage of all private households (Figure 12.3) differs markedly between the three countries (see also Bradshaw et al., 1999). Flanders is characterised by comparatively high proportions of lone parenthood during the entire post-war period; they increased
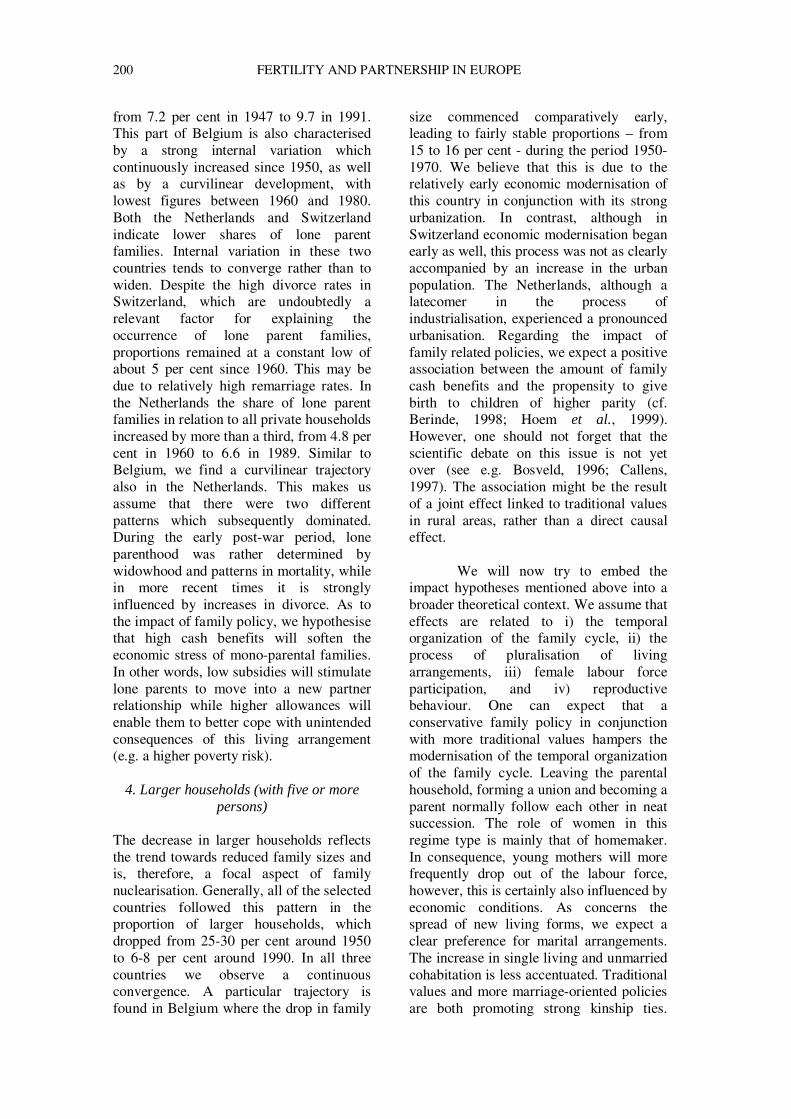
200 FERTILITY AND PARTNERSHIP IN EUROPE
from 7.2 per cent in 1947 to 9.7 in 1991. This part of Belgium is also characterised by a strong internal variation which continuously increased since 1950, as well as by a curvilinear development, with lowest figures between 1960 and 1980. Both the Netherlands and Switzerland indicate lower shares of lone parent families. Internal variation in these two countries tends to converge rather than to widen. Despite the high divorce rates in Switzerland, which are undoubtedly a relevant factor for explaining the occurrence of lone parent families, proportions remained at a constant low of about 5 per cent since 1960. This may be due to relatively high remarriage rates. In the Netherlands the share of lone parent families in relation to all private households increased by more than a third, from 4.8 per cent in 1960 to 6.6 in 1989. Similar to Belgium, we find a curvilinear trajectory also in the Netherlands. This makes us assume that there were two different patterns which subsequently dominated. During the early post-war period, lone parenthood was rather determined by widowhood and patterns in mortality, while in more recent times it is strongly influenced by increases in divorce. As to the impact of family policy, we hypothesise that high cash benefits will soften the economic stress of mono-parental families. In other words, low subsidies will stimulate lone parents to move into a new partner relationship while higher allowances will enable them to better cope with unintended consequences of this living arrangement (e.g. a higher poverty risk).
4. Larger households (with five or more persons)
The decrease in larger households reflects the trend towards reduced family sizes and is, therefore, a focal aspect of family nuclearisation. Generally, all of the selected countries followed this pattern in the proportion of larger households, which dropped from 25-30 per cent around 1950 to 6-8 per cent around 1990. In all three countries we observe a continuous convergence. A particular trajectory is found in Belgium where the drop in family
size commenced comparatively early, leading to fairly stable proportions – from 15 to 16 per cent - during the period 1950-1970. We believe that this is due to the relatively early economic modernisation of this country in conjunction with its strong urbanization. In contrast, although in Switzerland economic modernisation began early as well, this process was not as clearly accompanied by an increase in the urban population. The Netherlands, although a latecomer in the process of industrialisation, experienced a pronounced urbanisation. Regarding the impact of family related policies, we expect a positive association between the amount of family cash benefits and the propensity to give birth to children of higher parity (cf. Berinde, 1998; Hoem et al., 1999). However, one should not forget that the scientific debate on this issue is not yet over (see e.g. Bosveld, 1996; Callens, 1997). The association might be the result of a joint effect linked to traditional values in rural areas, rather than a direct causal effect.
We will now try to embed the
impact hypotheses mentioned above into a broader theoretical context. We assume that effects are related to i) the temporal organization of the family cycle, ii) the process of pluralisation of living arrangements, iii) female labour force participation, and iv) reproductive behaviour. One can expect that a conservative family policy in conjunction with more traditional values hampers the modernisation of the temporal organization of the family cycle. Leaving the parental household, forming a union and becoming a parent normally follow each other in neat succession. The role of women in this regime type is mainly that of homemaker. In consequence, young mothers will more frequently drop out of the labour force, however, this is certainly also influenced by economic conditions. As concerns the spread of new living forms, we expect a clear preference for marital arrangements. The increase in single living and unmarried cohabitation is less accentuated. Traditional values and more marriage-oriented policies are both promoting strong kinship ties.
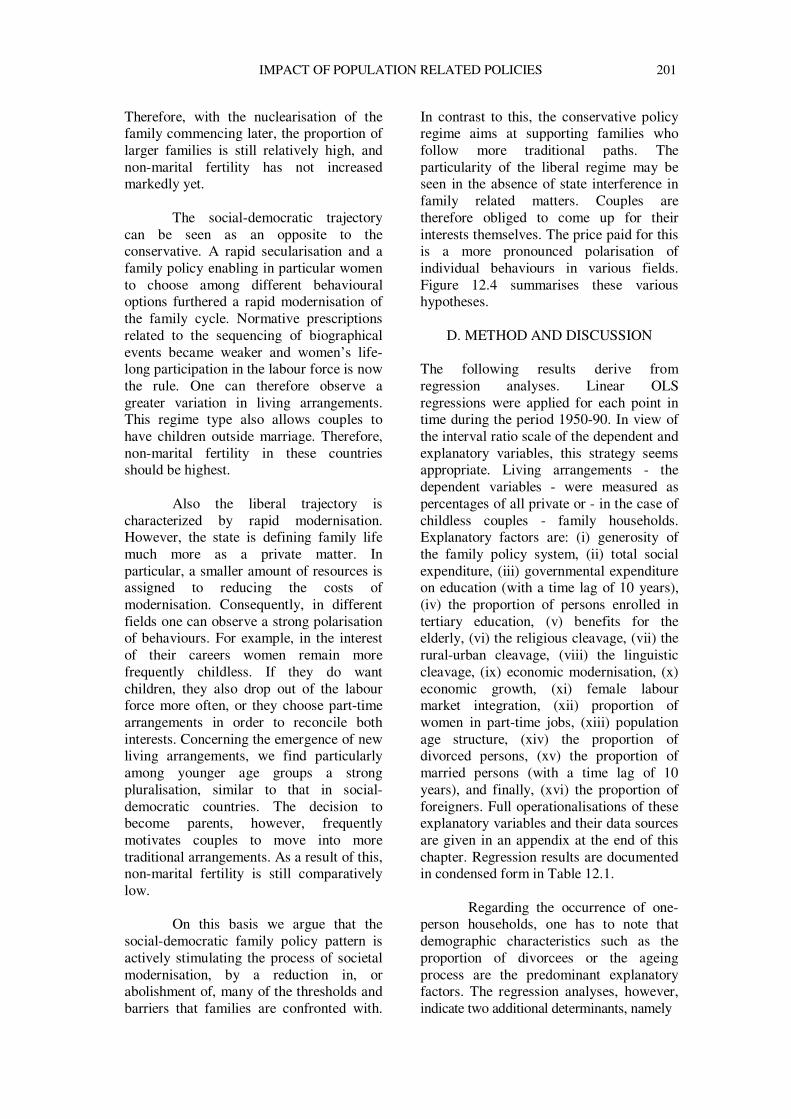
IMPACT OF POPULATION RELATED POLICIES 201
Therefore, with the nuclearisation of the family commencing later, the proportion of larger families is still relatively high, and non-marital fertility has not increased markedly yet.
The social-democratic trajectory
can be seen as an opposite to the conservative. A rapid secularisation and a family policy enabling in particular women to choose among different behavioural options furthered a rapid modernisation of the family cycle. Normative prescriptions related to the sequencing of biographical events became weaker and women’s life-long participation in the labour force is now the rule. One can therefore observe a greater variation in living arrangements. This regime type also allows couples to have children outside marriage. Therefore, non-marital fertility in these countries should be highest.
Also the liberal trajectory is
characterized by rapid modernisation. However, the state is defining family life much more as a private matter. In particular, a smaller amount of resources is assigned to reducing the costs of modernisation. Consequently, in different fields one can observe a strong polarisation of behaviours. For example, in the interest of their careers women remain more frequently childless. If they do want children, they also drop out of the labour force more often, or they choose part-time arrangements in order to reconcile both interests. Concerning the emergence of new living arrangements, we find particularly among younger age groups a strong pluralisation, similar to that in social-democratic countries. The decision to become parents, however, frequently motivates couples to move into more traditional arrangements. As a result of this, non-marital fertility is still comparatively low.
On this basis we argue that the
social-democratic family policy pattern is actively stimulating the process of societal modernisation, by a reduction in, or abolishment of, many of the thresholds and barriers that families are confronted with.
In contrast to this, the conservative policy regime aims at supporting families who follow more traditional paths. The particularity of the liberal regime may be seen in the absence of state interference in family related matters. Couples are therefore obliged to come up for their interests themselves. The price paid for this is a more pronounced polarisation of individual behaviours in various fields. Figure 12.4 summarises these various hypotheses.
D. METHOD AND DISCUSSION The following results derive from regression analyses. Linear OLS regressions were applied for each point in time during the period 1950-90. In view of the interval ratio scale of the dependent and explanatory variables, this strategy seems appropriate. Living arrangements - the dependent variables - were measured as percentages of all private or - in the case of childless couples - family households. Explanatory factors are: (i) generosity of the family policy system, (ii) total social expenditure, (iii) governmental expenditure on education (with a time lag of 10 years), (iv) the proportion of persons enrolled in tertiary education, (v) benefits for the elderly, (vi) the religious cleavage, (vii) the rural-urban cleavage, (viii) the linguistic cleavage, (ix) economic modernisation, (x) economic growth, (xi) female labour market integration, (xii) proportion of women in part-time jobs, (xiii) population age structure, (xiv) the proportion of divorced persons, (xv) the proportion of married persons (with a time lag of 10 years), and finally, (xvi) the proportion of foreigners. Full operationalisations of these explanatory variables and their data sources are given in an appendix at the end of this chapter. Regression results are documented in condensed form in Table 12.1.
Regarding the occurrence of one-person households, one has to note that demographic characteristics such as the proportion of divorcees or the ageing process are the predominant explanatory factors. The regression analyses, however, indicate two additional determinants, namely
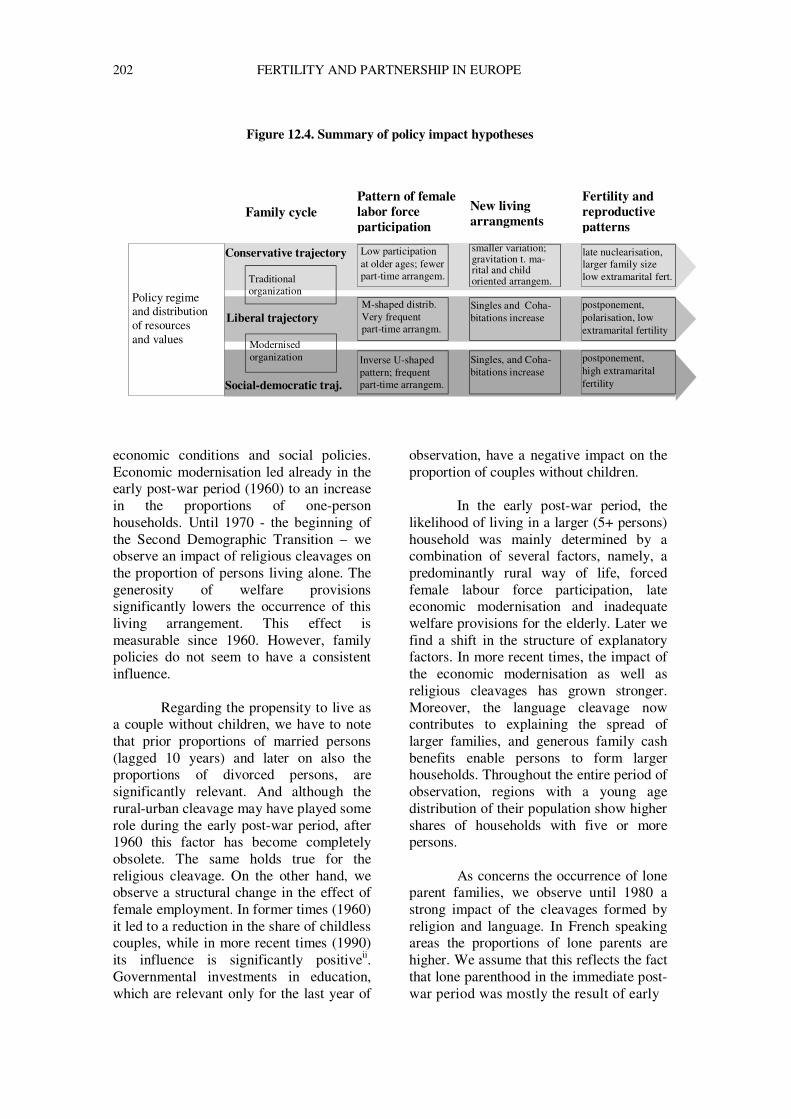
202 FERTILITY AND PARTNERSHIP IN EUROPE
Figure 12.4. Summary of policy impact hypotheses economic conditions and social policies. Economic modernisation led already in the early post-war period (1960) to an increase in the proportions of one-person households. Until 1970 - the beginning of the Second Demographic Transition – we observe an impact of religious cleavages on the proportion of persons living alone. The generosity of welfare provisions significantly lowers the occurrence of this living arrangement. This effect is measurable since 1960. However, family policies do not seem to have a consistent influence.
Regarding the propensity to live as
a couple without children, we have to note that prior proportions of married persons (lagged 10 years) and later on also the proportions of divorced persons, are significantly relevant. And although the rural-urban cleavage may have played some role during the early post-war period, after 1960 this factor has become completely obsolete. The same holds true for the religious cleavage. On the other hand, we observe a structural change in the effect of female employment. In former times (1960) it led to a reduction in the share of childless couples, while in more recent times (1990) its influence is significantly positiveii. Governmental investments in education, which are relevant only for the last year of
observation, have a negative impact on the proportion of couples without children.
In the early post-war period, the
likelihood of living in a larger (5+ persons) household was mainly determined by a combination of several factors, namely, a predominantly rural way of life, forced female labour force participation, late economic modernisation and inadequate welfare provisions for the elderly. Later we find a shift in the structure of explanatory factors. In more recent times, the impact of the economic modernisation as well as religious cleavages has grown stronger. Moreover, the language cleavage now contributes to explaining the spread of larger families, and generous family cash benefits enable persons to form larger households. Throughout the entire period of observation, regions with a young age distribution of their population show higher shares of households with five or more persons.
As concerns the occurrence of lone
parent families, we observe until 1980 a strong impact of the cleavages formed by religion and language. In French speaking areas the proportions of lone parents are higher. We assume that this reflects the fact that lone parenthood in the immediate post-war period was mostly the result of early
Traditional organization
Modernised organization Inverse U-shaped
pattern; frequent part-time arrangem.
Family cycle Pattern of female labor force participation
M-shaped distrib.Very frequentpart-time arrangm.
Low participation at older ages; fewerpart-time arrangem.
New living arrangments
Fertility and reproductive patterns
smaller variation;gravitation t. ma-rital and child oriented arrangem.
Singles and Coha-bitations increase
Singles, and Coha-bitations increase
late nuclearisation, larger family size low extramarital fert.
postponement, polarisation, low extramarital fertility
postponement, high extramarital fertility Social-democratic traj.
Conservative trajectory
Liberal trajectory
Policy regime and distribution of resources and values

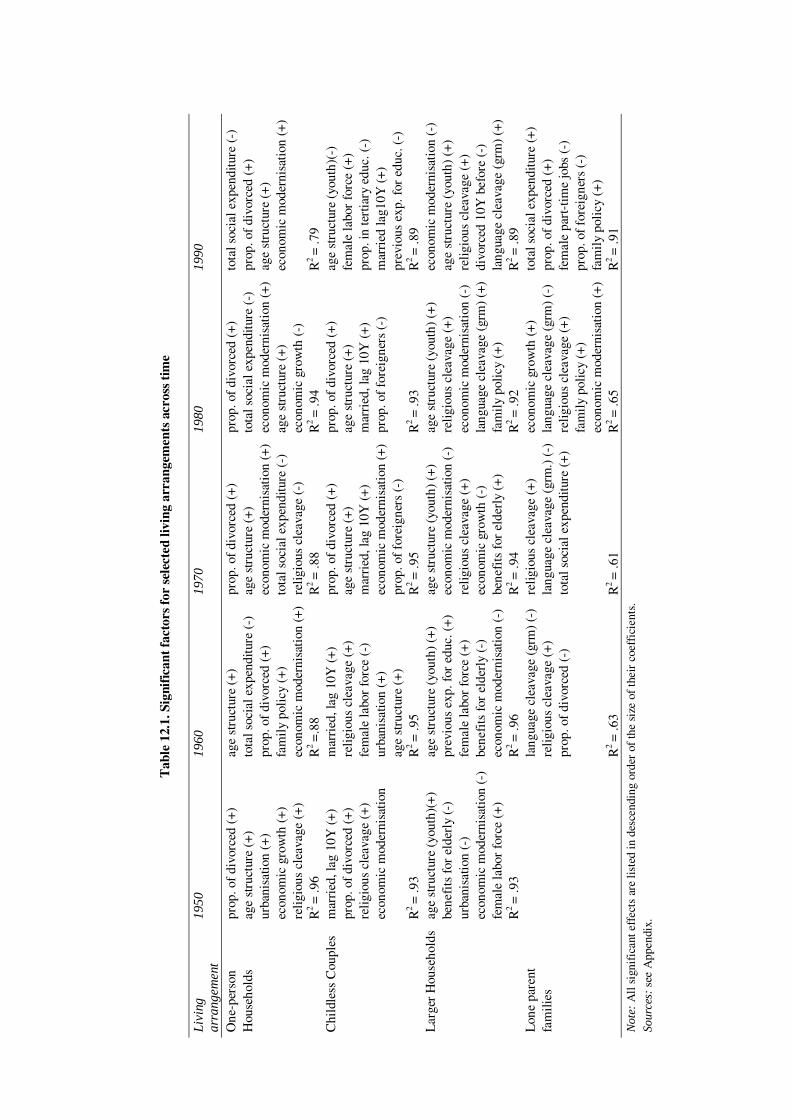
Tab
le 1
2.1.
Sig
nifi
cant
fact
ors
for
sele
cted
livi
ng a
rran
gem
ents
acr
oss
tim
e Li
ving
ar
rang
emen
t 19
50
1960
19
70
1980
19
90
One
-per
son
prop
. of
divo
rced
(+
) ag
e st
ruct
ure
(+)
prop
. of
divo
rced
(+
) pr
op. o
f di
vorc
ed (
+)
tota
l soc
ial e
xpen
ditu
re (
-)
Hou
seho
lds
age
stru
ctur
e (+
) to
tal s
ocia
l exp
endi
ture
(-)
ag
e st
ruct
ure
(+)
tota
l soc
ial e
xpen
ditu
re (
-)
prop
. of
divo
rced
(+
)
urba
nisa
tion
(+)
prop
. of
divo
rced
(+
) ec
onom
ic m
oder
nisa
tion
(+
) ec
onom
ic m
oder
nisa
tion
(+
)ag
e st
ruct
ure
(+)
ec
onom
ic g
row
th (
+)
fam
ily
poli
cy (
+)
tota
l soc
ial e
xpen
ditu
re (
-)
age
stru
ctur
e (+
) ec
onom
ic m
oder
nisa
tion
(+
)
relig
ious
cle
avag
e (+
) ec
onom
ic m
oder
nisa
tion
(+
)re
ligio
us c
leav
age
(-)
econ
omic
gro
wth
(-)
R
2 =
.96
R2 =
.88
R2
= .8
8 R
2 =
.94
R2
= .7
9 C
hild
less
Cou
ples
m
arri
ed, l
ag 1
0Y (
+)
mar
ried
, lag
10Y
(+
) pr
op. o
f di
vorc
ed (
+)
prop
. of
divo
rced
(+
) ag
e st
ruct
ure
(you
th)(
-)
pr
op. o
f di
vorc
ed (
+)
relig
ious
cle
avag
e (+
) ag
e st
ruct
ure
(+)
age
stru
ctur
e (+
) fe
mal
e la
bor
forc
e (+
)
relig
ious
cle
avag
e (+
) fe
mal
e la
bor
forc
e (-
) m
arri
ed, l
ag 1
0Y (
+)
mar
ried
, lag
10Y
(+
) pr
op. i
n te
rtia
ry e
duc.
(-)
econ
omic
mod
erni
sati
on
urba
nisa
tion
(+)
econ
omic
mod
erni
sati
on (
+)
prop
. of
fore
igne
rs (
-)
mar
ried
lag1
0Y (
+)
age
stru
ctur
e (+
) pr
op. o
f fo
reig
ners
(-)
prev
ious
exp
. for
edu
c. (
-)
R
2 =
.93
R2 =
.95
R2
= .9
5 R
2 =
.93
R2
= .8
9 L
arge
r H
ouse
hold
s ag
e st
ruct
ure
(you
th)(
+)
age
stru
ctur
e (y
outh
) (+
) ag
e st
ruct
ure
(you
th)
(+)
age
stru
ctur
e (y
outh
) (+
) ec
onom
ic m
oder
nisa
tion
(-)
bene
fits
for
eld
erly
(-)
pr
evio
us e
xp. f
or e
duc.
(+
) ec
onom
ic m
oder
nisa
tion
(-)
re
ligio
us c
leav
age
(+)
age
stru
ctur
e (y
outh
) (+
)
urba
nisa
tion
(-)
fem
ale
labo
r fo
rce
(+)
relig
ious
cle
avag
e (+
) ec
onom
ic m
oder
nisa
tion
(-)
re
ligio
us c
leav
age
(+)
ec
onom
ic m
oder
nisa
tion
(-)
be
nefi
ts f
or e
lder
ly (
-)
econ
omic
gro
wth
(-)
la
ngua
ge c
leav
age
(grm
) (+
)di
vorc
ed 1
0Y b
efor
e (-
)
fem
ale
labo
r fo
rce
(+)
econ
omic
mod
erni
sati
on (
-)
bene
fits
for
eld
erly
(+
) fa
mil
y po
licy
(+
) la
ngua
ge c
leav
age
(grm
) (+
)
R2
= .9
3 R
2 =
.96
R2
= .9
4 R
2 =
.92
R2
= .8
9 L
one
pare
nt
la
ngua
ge c
leav
age
(grm
) (-
) re
ligio
us c
leav
age
(+)
econ
omic
gro
wth
(+
) to
tal s
ocia
l exp
endi
ture
(+
) fa
mili
es
re
ligio
us c
leav
age
(+)
lang
uage
cle
avag
e (g
rm.)
(-)
la
ngua
ge c
leav
age
(grm
) (-
) pr
op. o
f di
vorc
ed (
+)
prop
. of
divo
rced
(-)
to
tal s
ocia
l exp
endi
ture
(+
) re
ligio
us c
leav
age
(+)
fem
ale
part
-tim
e jo
bs (
-)
fam
ily
poli
cy (
+)
prop
. of
fore
igne
rs (
-)
econ
omic
mod
erni
sati
on (
+)
fam
ily
poli
cy (
+)
R2 =
.63
R2
= .6
1 R
2 =
.65
R2
= .9
1 N
ote:
All
sign
ific
ant e
ffec
ts a
re li
sted
in d
esce
ndin
g or
der
of th
e si
ze o
f th
eir
coef
fici
ents
. So
urce
s: s
ee A
ppen
dix.

204 FERTILITY AND PARTNERSHIP IN EUROPE
widowhood rather than of free choice. The negative sign of the proportion of divorcees in 1960 supports this assumption. Since 1980, however, the occurrence of lone parenthood is much more determined by the degree of economic modernisation and welfare policies. By consequence, in 1990 the proportion of divorcees is positively associated with the proportions of lone parents. As expected, the generosity of a country’s family policy is promoting the spread of this living arrangement.
For the following analyses that
attempt to summarise the results from the perspective of regions, we have trichotomised the structure of household types into units: - where living arrangements without children (one-person households, childless couples) are over-represented by more than one standard deviation; - where living arrangements with children (large households, lone parent families) are over-represented by more than one standard deviation; and, - without any marked over-representations (each living arrangement is within one standard deviation).
The two dimensions lying behind these distinct types - the existence of a family sector versus the existence of a non-family sector - have been defined elsewhere (Dorbritz and Fux, 1997, p. 26).
By applying the biplot technique,
we measure the associations between these three categories, on the one hand, and the above mentioned analytical dimensionsiii at a regional level, on the other (Figure 12.5). The biplot technique (Gabriel, 1971) allows to visualise in one single graph both the association between variables as well as the spread of the three types of living arrangements by regioniv.
We expect that the spread of one-person households and childless couples is strongly related to societal modernisation, while that of large households and lone parent families more to traditional structures and cleavages.
From an overall perspective, one can state that there is a trend towards a certain homogenisation of living arrangements across periods. A gravitation towards the third category (no over-representations) is most clearly observed in the Netherlands. Although a marked heterogeneity was found in Belgium between the Walloon provinces with more traditional household types and Flanders with less of them, and similarly in Switzerland between the rural and Catholic parts in the centre versus the rest of the country, one can say that the impact of societal cleavages has become weaker. This fact is leading to a convergence between the regional units.
From about 1950 and until at least
1970, the occurrence of child-centred household types was strongly correlated with or determined by denominational structures, i.e. the proportion of Catholics. In areas characterised by strong urbanisation and advanced tertiarisation of their labour markets, living arrangements without children such as one-person households and childless couples were more frequent. In addition, next to the cleavages, demographic characteristics like ageing or the proportion of divorcees are the second most important determinants. They became predominant in the 1970s, i.e., at the beginning of the Second Demographic Transition. In recent times, the explanatory power of a region’s welfare expenditure and family related policies significantly increased. One can say that generous family benefits are associated with the occurrence of child-centred household types, while previous expenditures on education seem to stimulate female labour force participation and, therefore, to correspond with higher proportions of childless household types.
Although particularly large
households are strongly declining in all three countries, one can find remarkable intra-country differences. An over-representation of child-centred living arrangements was nearly universal in Belgium around 1950. Since then, the gap
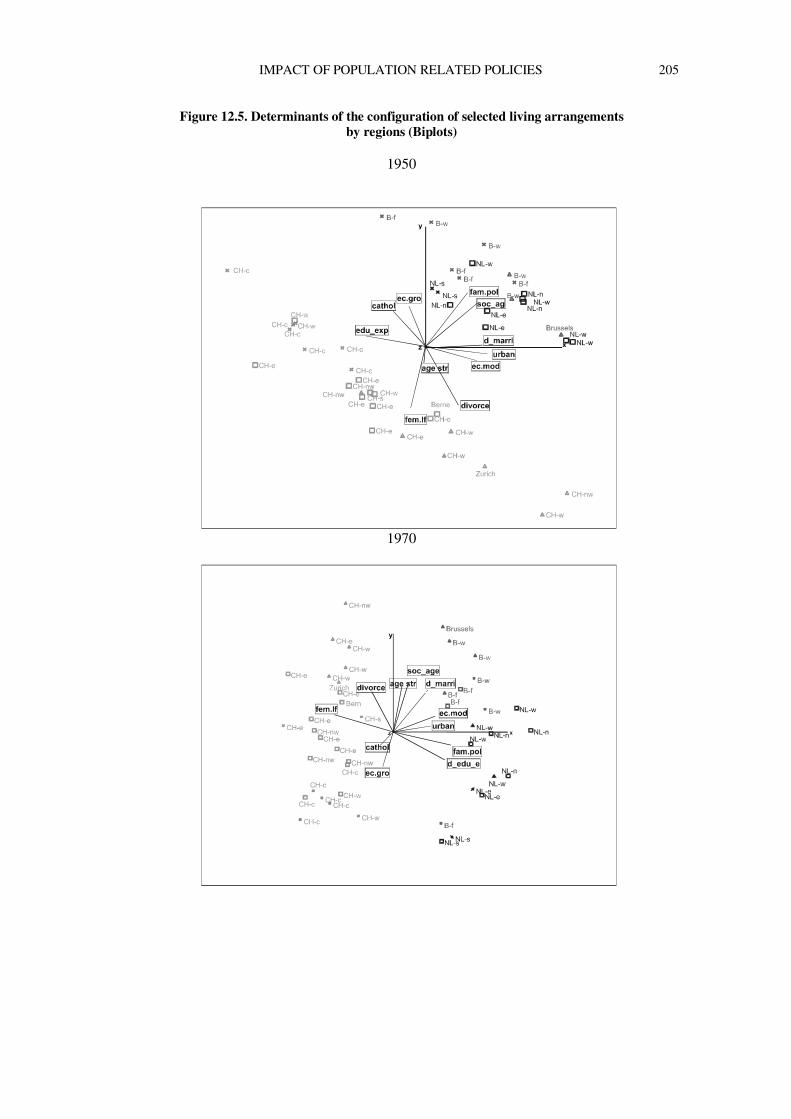
IMPACT OF POPULATION RELATED POLICIES
205
Figure 12.5. Determinants of the configuration of selected living arrangements by regions (Biplots)
1950
1970
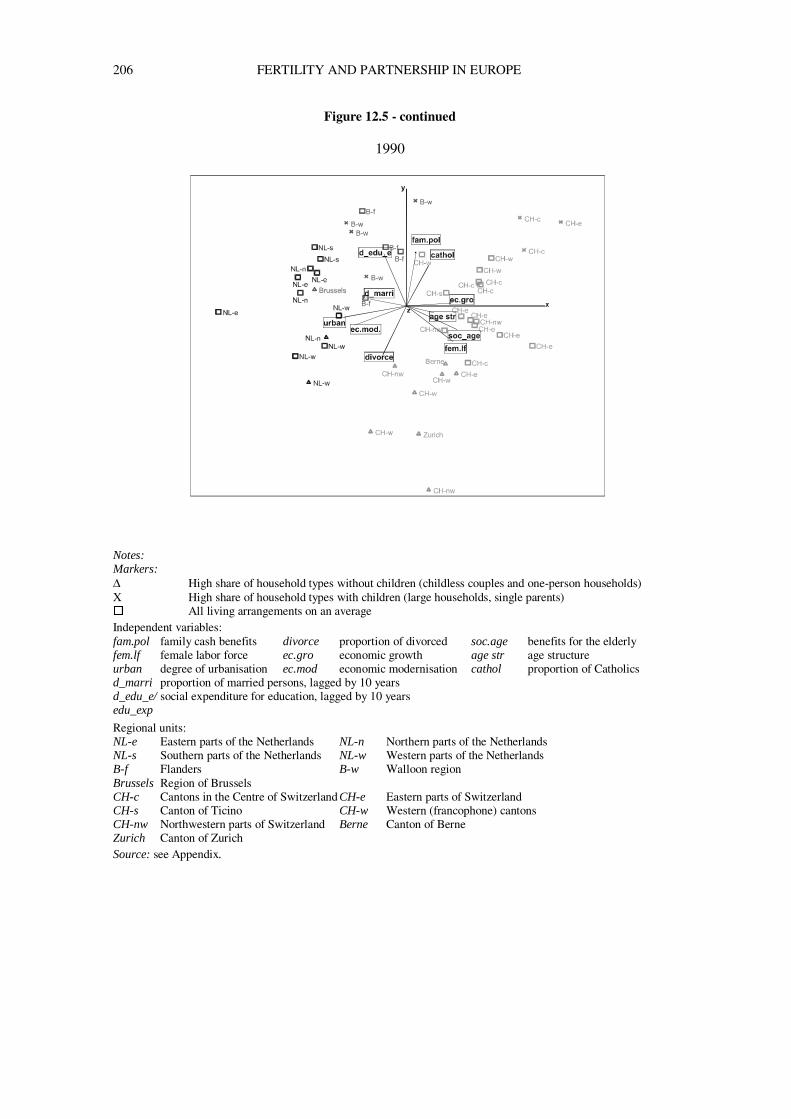
206 FERTILITY AND PARTNERSHIP IN EUROPE
Figure 12.5 - continued
1990
Notes: Markers: ∆ High share of household types without children (childless couples and one-person households) X High share of household types with children (large households, single parents) � All living arrangements on an average Independent variables: fam.pol family cash benefits divorce proportion of divorced soc.age benefits for the elderly fem.lf female labor force ec.gro economic growth age str age structure urban degree of urbanisation ec.mod economic modernisation cathol proportion of Catholics d_marri proportion of married persons, lagged by 10 years d_edu_e/ social expenditure for education, lagged by 10 years edu_exp
Regional units: NL-e Eastern parts of the Netherlands NL-n Northern parts of the Netherlands NL-s Southern parts of the Netherlands NL-w Western parts of the Netherlands B-f Flanders B-w Walloon region Brussels Region of Brussels CH-c Cantons in the Centre of Switzerland CH-e Eastern parts of Switzerland CH-s Canton of Ticino CH-w Western (francophone) cantons CH-nw Northwestern parts of Switzerland Berne Canton of Berne Zurich Canton of Zurich Source: see Appendix.
IMPACT OF POPULATION RELATED POLICIES 207
between the more traditional French speaking provinces and Flanders which shows a more rapid modernisation, became wider. In the Netherlands around 1950, more traditional household types were to be found mainly in the Catholic provinces of the south. However, towards the 1980s these differences disappeared and the Netherlands actually developed into a very homogeneous country. Similar developments can be observed for Switzerland, even though there are still a number of cantons where traditional household types are over-represented. In contrast to Belgium, these are the rather rural and Catholic areas, while the linguistic cleavage is of minor importance.
As regards the impact of welfare
and family policies on the configuration of living arrangements, we can state that both governmental investments in education and generous family benefits enable young persons and particularly women to better live up to the demands of a modern economy and society. However, family benefits lead to a certain inertia that is facilitating the persistence of more traditional household types, while considerable governmental investments in the education of the young are strongly correlated with the increase of one-person households and childless couples.
Finally, is the hypothesis regarding
the impact of different welfare regimes according to Esping-Andersen's typology supported by our findings? Firstly, we can state that the conservative – or familialistic – regime as represented by Belgium indeed shows a comparatively late nuclearisation as well as a strong gravitation towards marital living arrangements. Also the hypothesis of a more traditional organisation of the life course finds confirmation (corresponding evidence not documented in this chapter but see Fux, 2001). By contrast, the social-democratic regime as represented by the Netherlands is characterised by a comparatively early nuclearisation, a rapid spread of one-person households and childless couples, as well as by a modernisation of the temporal organization of the family cycle,
particularly from the 1970s onwards. Nevertheless, the Netherlands is by no means the best prototype of this kind of regime. On the contrary, in many respects it followed for a long time rather the conservative pattern. However, the rapid expansion of the welfare state since the late 1960s corresponds with an even more rapid modernisation of living arrangements. Regarding the liberal regime type, there is evidence supporting the hypothesised polarisation between different trends, that is, rapid modernisation on the one hand and persistently strong societal cleavages, on the other. The relatively poor welfare support may be partly responsible for the fact that traditional ties have remained fairly significant until the present day. A corresponding polarisation is also to be found at the level of individual behaviour.
E. CONCLUDING REMARKS Our analyses lead us to the following conclusions. The configuration of living arrangements is interdependently related with: (i) demographic conditions, in particular the age structure of populations; (ii) economic conditions; (iii) cleavage structures; and (iv) family policies.
Besides depending on mere
demographic factors like the age composition of a population which obviously has a strong impact on the configuration of living arrangements, relevant changes in household and family structures also depend on a country’s economic development. Economic modernisation and the process of tertiarisation accelerate the process of family nuclearisation. As a result of this, larger households die out while smaller ones (young persons living alone, childless couples) come to the fore. Nevertheless, as concerns the configuration of living arrangements on a regional level, we found a marked regional heterogeneity that depends not in the least on the structural and cultural segmentations of the countries under observation. Particularly during the early post-war period these cleavage lines have had a strong impact on the occurrence of different household types. With the
FERTILITY AND PARTNERSHIP IN EUROPE
208
passage of time their impact decreased, leading to a certain convergence between regions. This holds true in particular for the Netherlands. However, the linguistic cleavage in Belgium as well as the urban-rural differential along with the denominational structures in Switzerland remain relevant determinants of the occurrence of different living arrangements.
Regarding the impact of family
policies, we observe an increasing explanatory power of welfare provisions. Policies which strengthen a more traditional configuration of living arrangements, as well as policies which open the path for a modernisation of living forms, reveal markedly strong effects. On the other hand, an absence of state interference in the field of family related policies is aggravating the everyday life situation for individuals and couples. Despite the evidence according to which welfare provisions and family policies have an impact on the spread and distribution of living arrangements, one should bear in mind that the structure of these determinants has changed considerably across time. On the basis of our analyses it does not always seem possible to conclude that it is a country’s particular trajectory of social change that is triggering a certain policy, or - conversely - that it is a certain policy that is behind the spread or rather the confinement of alternative living arrangements. We therefore prefer to speak of an interdependent bargaining relationship between both processes.
REFERENCES
Becker, G. S. (1981). A Treatise on the Family.
Cambridge (Mass.): Harvard University Press. Berinde, D. (1998). The effect of family policy on the
third births: a comparative study of France and Sweden. INED Séminaire „Démodynamiques“. Paris, 17 decembre.
Blanchet, D. and Ekert-Jaffé, O. (1988). The demographic impact of family benefits: evidence from a micromodel and from macro-data. Paper presented at the IUSSP seminar on the family, the market and the state in ageing societies. Japan.
Bonoli, G. (1997). Classifying Welfare States: a Two-dimension approach. Journal of Social Policy (Cambridge), 26, 3, 351-372.
Bosveld, W. (1996). The Ageing of Fertility in Europe. A Comparative Demographic-Analytic
Study. PDOD Publications. Amsterdam: Thesis Publishers.
Bradshaw, J., Stimson, C., Skinner, Ch., and Williams, J. (1999). Absent fathers? London: Routledge.
de Bruijn, B. (1992). The Concept of Rationality in Social Sciences. Groningen: PDOD-Paper, No. 9.
Caldwell, J.C. (1982). Theory of Fertility Decline. London: Academic Press.
Callens, Marc (1997). Arbeidsmarktparticipatie en het derde kind in Vlaanderen. Nego V resultaten [Labour market participation and the third child in Flanders, FFS results]. Bevolking en Gezin, 1997, 2.
Cherlin, A. J. (2000). Toward a New Home Socioeconomics of Union Formation. In L. Waite et al., Ties that Bind: Perspectives on Marriage and Cohabitation. Hawthorne: Aldine de Gruyter, 126-144.
Cliquet R.L., Deven, F., Corijn, M., Callens, M., and Lodewijckx, E. (1992). The 1991 Fertility and Family Survey in Flanders (NEGO V), Framework and Questionnaire. Brussels: CBGS Werkdocumenten, No. 82.
Coleman, J. S. (1990). Foundations of Social Theory. Cambridge (Mass.): Harvard University Press.
Dorbritz, J., and Fux, B. (1997). Einstellungen zur Familienpolitik in Europa. Ergebnisse eines vergleichenden Surveys in den Ländern des “European Comparative Survey on Population Policy Acceptance (PPA) [Family policy attitudes in Europe: Data from the comparative survey on Population Policy Acceptance]. München: Boldt.
Ekert, O. (1986). Effets et limites des aides financières aux familles: une expérience et une modèle. [Impact and limitations of financial support for families: an example and a model]. Population, 41, 2, 327-248.
Esping-Andersen, G. (1990). The three worlds of welfare capitalism. Oxford: Polity Press.
Flora, P. (1987). Growth to Limits - The Western European Welfare State since World War II. Berlin: De Gruyter.
Flora, P., Alber, J.; Eichenberg, R., Kohl, J., Kraus, F., Pfenning, W., and Seebohm, K. (1983). State, Economy, and Society in Western Europe 1815-1975. A Data Handbook in two Volumes, Vol. 1 and 2. Frankfurt: Campus Verlag.
Friedman, D., Hechter, M. and Kanazawa, S. (1994). A theory of the value of children. Paper presented at the IUSSP seminar on Values and Fertility change. Sion.
Fux, B. (1994). Der familienpolitische Diskurs. Eine theoretische und empirische Untersuchung über das Zusammenwirken und den Wandel von Familienpolitik, Fertilität und Familie. [The family policy rationale: A theoretical and empirical study of the relationship and changes of family policy, fertility and family] Berlin: Duncker & Humblot.
Fux, B. and Baumgartner, A.D. (1998). Wandel von familialen Lebensformen - Lebensverläufe, Lebensentwürfe. [Changes of living arrangements and life courses] (report on the basis of the Swiss FFS). Zürich. Unpublished.
Fux, B. (2001). Which models of the family are en- or discouraged by different family policies? In F.-
IMPACT OF POPULATION RELATED POLICIES
209
X. Kaufmann, (Ed.), Family Life and Family Policy in Europe, vol. 2. Oxford: Clarendon Press.
Gabriel, K.R. (1971). The biplot, Biometrika, 58, 453-467.
Gabadinho, A. and P. Wanner (1999). Fertility and family surveys in countries of the ECE region. Standard Country Report Switzerland. Economic Studies 10m. New York/Geneva: United Nations.
Gauthier, A. H. (1993). Families and welfare benefits: the measured and unmeasured effects. Amsterdam: PDOD-Paper, No. 17.
Gauthier, A. H. (1996). The state and the family – A comparative analysis of family policies in industrialized countries. Oxford: Clarendon press.
Höhn, Ch. and Schubnell, H. (1986). Bevöl-kerungspolitische Maßnahmen und ihre Wirksamkeit in ausgewählten europäischen Industrienationen (I) [Family policy measures and their efficacy in selected European industrialized countries].Zeitschrift für Bevölkerungsforschung, 12, 3-51.
Hoem, B. (1998). Entry into motherhood in Sweden: the influence of economic factors on the rise and fall in fertility 1986-1997. Paper Conference on Lowest Low Fertility. Rostock.
Hoem, J.M., Prskawetz, A. and Neyer, G. (1999). Third Births in Austria: The Effect of Public Policies, Educational Attainment, and Labour-Force Attachment. Rostock: Max Planck Institute for Demographic Research, Working Paper No. 2.
Huber, E. and Stephens J. D. (1992). Economic internationalisation, the European Community, and the Social Democratic Welfare State. Paper presented at the meeting of the American Political Association. Chicago.
Kaufmann, F.-X., and Strohmeier, K.P. (1988). Partnerbeziehungen und Familienentwicklung in Nordrhein-Westfalen. Generatives Verhalten im sozialen und regionalen Kontext. [Partnership and family development in Nordrhein-Westfalen. Reproductive behaviour in social and regional context] Düsseldorf: Schriftenreihe des Ministerpräsidenten des Landes Nordrhein-Westfalen (Heft 50).
Kaufmann, F.-X. Strohmeier, K.P., and Federkeil, G. (1992). Wirkungen politischen Handelns auf den Bevölkerungsprozess. Ansätze für methodische Analysen. [Impact of policy action on the demographic process. Outline for an analysis] Boppard: Boldt.
Kaufmann, F.-X.; Kuijsten, A.; Schulze, H.-J., and Strohmeier, K.P. (1997). Family Life and Family Policies in Europe. vol. 1, Structures and Trends in the 1980s. Oxford: Clarendon Press.
Kaufmann, F.-X. and Herlth, A. (1982). Elemente einer soziologischen Theorie sozialpolitischer Intervention. [Elements from a sociological theorie of social policy intervention] In F.-X.
Kaufmann, (Ed.) Staatliche Sozialpolitik und Familie [Social policy and family]. München, Wien: Oldenburg, 49-86.
Korpi, W. and Palme, J. (1998). The Paradox of Redistribution and Strategies of Equality: Welfare State institutions, Inequality, and Poverty in the Western Countries, American Sociological Review, 63, 661-687.
Latten J. and A. de Graaf (1997). Fertility and Family surveys in countries of the ECE region. Standard Country Report The Netherlands. Economic Studies 10c. New York/Geneva: United Nations.
Lesthaeghe, R. and Moors, G. (2000). Recent Trends in Fertility and Household Formation in the Industrialized World. Brussels: Interface Demography Department of social research, Vrije Universiteit.
Lodewijckx, E. (1999). Fertility and Family Surveys in countries of the ECE region. Standard Country Report Belgium. Economic Studies 10l. New York/Geneva: United Nations.
Manting, D. (1994). Dynamics in Marriage and Cohabitation. An inter-temporal, life course analysis of first union formation and dissolution. PDOD Publications. Amsterdam: Thesis Publishers.
Mannheim Centre for European Social Research (MZES) (2000). Family Policy Database. Mannheim.
Opaschowski, H.W. (1994). Singles: Die Hätschelkinder der Konsumgesellschaft. [Pampered children in the consumer society] In G. Grözinger (Ed.) Das Single. Gesellschaftliche Folgen eines Trends. [Sinbles: Societal implications of trends]. Opladen: Leske + Budrich, 25-40.
Organization for Economic Co-operation and Development (OECD) (1999). Social security expenditure database (SOCX). Paris: OECD.
Prioux, F. (1993). L'infécondité en Europe [Infertility in Europe]. In A. Blum and J.-L. Rallu (Eds). European population. II. Demographic dynamics, Paris: Edition John Libbey. 231-254.
Ritzmann-Blickenstorfer, H. (1996). Historische Statistik der Schweiz. [Historical statistics of Switserland] Zürich: Chronos.
Scheidt, J.V. (1991). Die Wonnen der Einsamkeit. [The bliss of solititude] In N. Copray (Ed.) Lieber allein? Im Sog der Single-Gesellschaft [Preferably alone? Caught up in the singles society] München: Kösel, 120-126.
Therborn, G. (1985). Arbeitslosigkeit, Strategien und Politikansätze in den OECD-Ländern. [Unemployment, strategies and policy outlines in the OECD countries]. Hamburg: VSA.
Titmuss, (1974). Social Policy. An Introduction. London: George Allen & Unwin Ltd.
FERTILITY AND PARTNERSHIP IN EUROPE
210
APPENDIX
Period covered by the analyses The analyses refer to the following dates: Belgium: 1947; 1961; 1970; 1981; 1991 Netherlands: 1947; 1960; 1971; 1981*; 1989/90* (* = Woningbehoeftenonderzoek) Switzerland: 1950; 1960; 1970; 1980; 1990.
Corresponding regional data were collected from national population censuses and the Dutch Housing demand Surveys (Woningbehoeftenonderzoek, since 1981) Operationalization of independent variables A. WELFARE POLICIES 1. Social expenditure
O(perationalization): Total social expenditure as a percentage of GDP S(ources):
• Flora, P. et al. (1983). State, Economy and Society in Western Europe 1815-1975; • Flora, P. (1987). Growth to Limits; • OECD (1999). Social Expenditure Database; • National Welfare Statistics.
2. Family cash benefits O: Total family cash benefits as a percentage of GDP S: • Mannheim Centre for European Social Research (MZES) (2000).Family policy Database;
• OECD (1999). Social Expenditure Database. 3. Benefits for the elderly
O: Total old age cash benefits as a percentage of GDP S: • Flora, P. et al. (1983). State, Economy and Society in Western Europe 1815-1975;
• Flora, P. (1987). Growth to Limits; • OECD (1999). Social Expenditure Database.
4. Social expenditure for education O: Total social expenditure for education as a percentage of GDP (time-lag 10 years) S: • Flora, P. et al. (1983). State, Economy and Society in Western Europe 1815-1975;
• Flora, P. (1987). Growth to Limits; • National Welfare Statistics.
5. People in tertiary education O: People enrolled in tertiary education as a percentage of the population 20-24 S: • Flora, P. et al. (1983). State, Economy and Society in Western Europe 1815-1975;
• Flora, P. (1987). Growth to Limits; • National Statistics on Education.
B: CLEAVAGES 6. Religious cleavage
O: Catholics as a percentage of the total population S: • Flora, P. et al. (1983). State, Economy and Society in Western Europe 1815-1975;
• Flora, P. (1987). Growth to Limits; • Ritzmann-Blickenstorfer, H. (1996). • Historische Statistik der Schweiz.
7. Rural-urban cleavage O: Proportion of communities with more than 10’000 inhabitants S: • National Population Censuses;
• Flora, P. et al. (1983). State, Economy and Society in Western Europe 1815-1975; • Flora, P. (1987). Growth to Limits;
8. Linguistic cleavage O: German/Dutch speaking people as a percentage of the total population S: • National Population Censuses;
• Flora, P. et al. (1983). State, Economy and Society in Western Europe 1815-1975; • Flora, P. (1987). Growth to Limits;

IMPACT OF POPULATION RELATED POLICIES
211
C. ECONOMY 9. Economic modernization
O: Employees in the service sector as a percentage of the economically active population S: • National Population Censuses;
• National Labor Force Surveys. 10. Economic growth
O: Growth rate of regional GDP in percent S: • Eurostat;
• National Economic Statistics. 11. Female labor market integration
O: Female labor force as a percentage of the economically active population S: • National Population Censuses; • National Labor Force Surveys.
12. Part-time employment O: Proportion of women in part-time jobs S: • National Population Censuses; • National Labor Force Surveys.
D. DEMOGRAPHY 13. Age-structure
O: Dependency ratio (65+/15-64*100) S: • National Population Censuses.
14. Dependency ratio of the young O: Dependency ratio (0-15/15-64*100) S: • National Population Censuses.
15. Civil State (Divorcees) O: Divorced people as a percentage of the total population S: • National Population Censuses.
16. Civil State (Married) O: Married people as a percentage of the total population (lag 10 years) S: • National Population Censuses.
17 Nationality O: Foreigners as a percentage of the total population S: • National Population Censuses.
For indicators, which are not available on regional level (e.g. welfare policies in Belgium and
the Netherlands) we calculated approximations by taking into account regional GDP and the relevant population segments in each province).
ENDNOTES i Unfortunately, the Dutch FFS data set was unavailable for researchers, so that we only could refer to published information. Furthermore, the Belgium FFS covers only Flanders and the region of Brussels, a fact which is limiting regional analyses. ii Perhaps it is also a matter of cultural change as Goldscheider (2000) explains who supposes a growing gender role differentiation. iii Because of better clearness we renounced to include several dimensions (ii, iv, viii, xii, xvi). iv On the basis of principal components we construct a two or three-dimensional space with the variables on the one hand and the units (cantons, provinces) on the other hand. Calculating the inner products of rows and columns of a data matrix you can project the approximations on a lower dimensional space. By consequence we reach two biplots. One is the column matrix biplot, which represents the variables well. The length of each vector can be interpreted as influence power of each variable. The angle between the single vectors indicates the correlation between two variables. A 90º angle sets no correlation. You can also see the correlation in the row matrix plot, which describes the (regional) units in the best way. In the following we use only the row matrix plot to illustrate the situation of each regional unit as well as possible.
213
CHAPTER 13
FERTILITY AND THE ROLE OF FAMILY STRATEGIES IN HUNGARY,
ITALY, THE NETHERLANDS AND SWEDENi
Willy Bosveld*
* University of Amsterdam , Amsterdam (The Netherlands)
A. INTRODUCTION The second half of the 1990s was characterised by a pluriformity of family forms, including an increasing number of options in the type and timing of events. As a result, great variation exists nowadays in family behaviour across social groups and countries (Kaufmann, 1997; Moors and Palomba, 1995; Prinz, 1995). The trajectories that women follow in the various countries with respect to their fertility and partner careers, and the different contextual settings in which these unfold, lead to much between-country variation. The objective of this chapter is to gain insight into the differences in fertility behaviour and the role of family strategies between Hungary, Italy, the Netherlands and Sweden, for females 15-40 years of age in the period 1970-92.
Having FFS data at hand, a comparison of individual behaviour between countries has become easier than ever before. However, when drawing conclusions about between-country differences from these micro-level data, we must simultaneously be aware of the possibility that they result from between-country variation in contextual settings. To deal with this problem of the so-called micro-macro link we introduce the strategy concept. This concept is defined as the
tactics that people use to balance their needs and wants given the characteristics of a particular macro-level opportunity structure and their individual life stage, so as to reach the best possible level of long-term satisfaction. Between-country variations in life strategies are the result of differences in options that people have. These in turn are the result of a complex relationship between individual behaviour and country-specific opportunities and constraints.
Family strategies thus refer to the
life stage characteristics of individual fertility and partnership careers as well as to relevant contextual options. To give an example, a person living alone at a given point in time may have certain options to change this status. He or she may have the possibility to live together with a partner in non-marital cohabitation or in marriage, or to go back to his or her parents. The particular strategy that this person will follow may depend partly on the contextual setting. For instance, is non-marital cohabitation acceptable or not? Or, how is marriage viewed? Is it directly related to having children? Is it seen as the only possibility to have a sexual relationship? From a life course perspective, most women have a partner before they give birth but the kind of union - marital or not - they are in at that
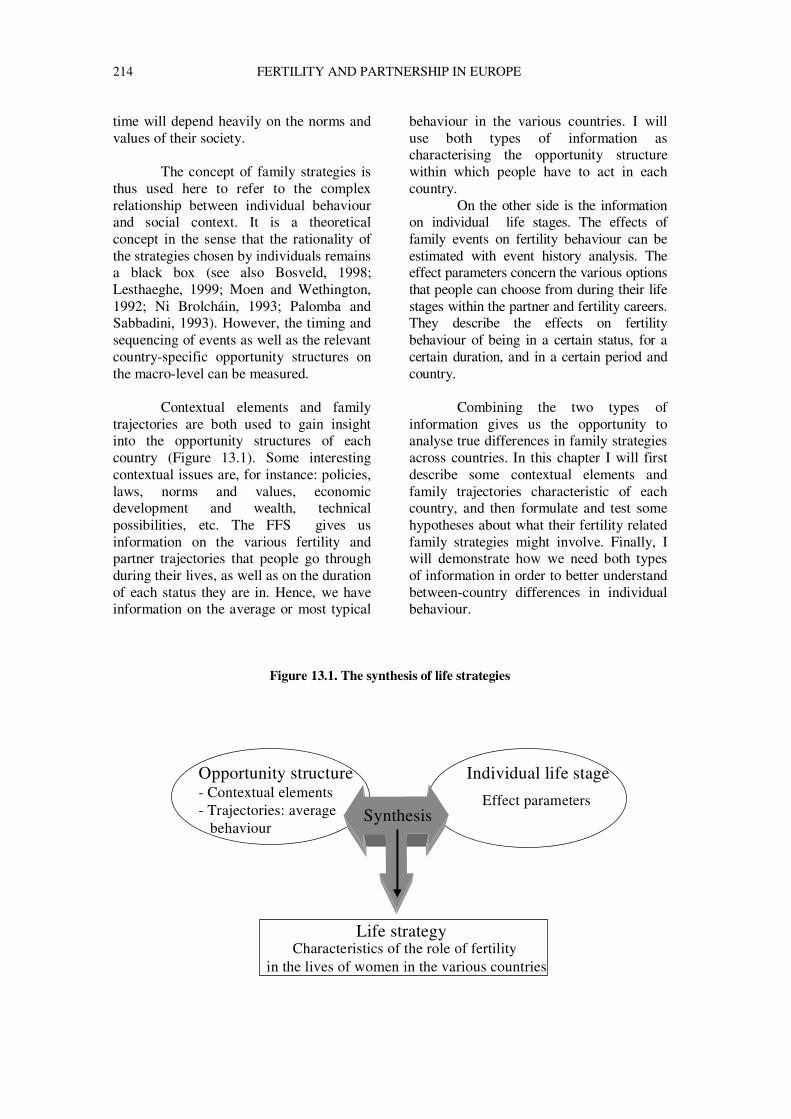
214 FERTILITY AND PARTNERSHIP IN EUROPE
time will depend heavily on the norms and values of their society.
The concept of family strategies is
thus used here to refer to the complex relationship between individual behaviour and social context. It is a theoretical concept in the sense that the rationality of the strategies chosen by individuals remains a black box (see also Bosveld, 1998; Lesthaeghe, 1999; Moen and Wethington, 1992; Ni Brolcháin, 1993; Palomba and Sabbadini, 1993). However, the timing and sequencing of events as well as the relevant country-specific opportunity structures on the macro-level can be measured.
Contextual elements and family trajectories are both used to gain insight into the opportunity structures of each country (Figure 13.1). Some interesting contextual issues are, for instance: policies, laws, norms and values, economic development and wealth, technical possibilities, etc. The FFS gives us information on the various fertility and partner trajectories that people go through during their lives, as well as on the duration of each status they are in. Hence, we have information on the average or most typical
behaviour in the various countries. I will use both types of information as characterising the opportunity structure within which people have to act in each country.
On the other side is the information on individual life stages. The effects of family events on fertility behaviour can be estimated with event history analysis. The effect parameters concern the various options that people can choose from during their life stages within the partner and fertility careers. They describe the effects on fertility behaviour of being in a certain status, for a certain duration, and in a certain period and country.
Combining the two types of
information gives us the opportunity to analyse true differences in family strategies across countries. In this chapter I will first describe some contextual elements and family trajectories characteristic of each country, and then formulate and test some hypotheses about what their fertility related family strategies might involve. Finally, I will demonstrate how we need both types of information in order to better understand between-country differences in individual behaviour.
Figure 13.1. The synthesis of life strategies
Opportunity structure- Contextual elements- Trajectories: average behaviour
Individual life stage
Life strategy
SynthesisEffect parameters
Characteristics of the role of fertility in the lives of women in the various countries
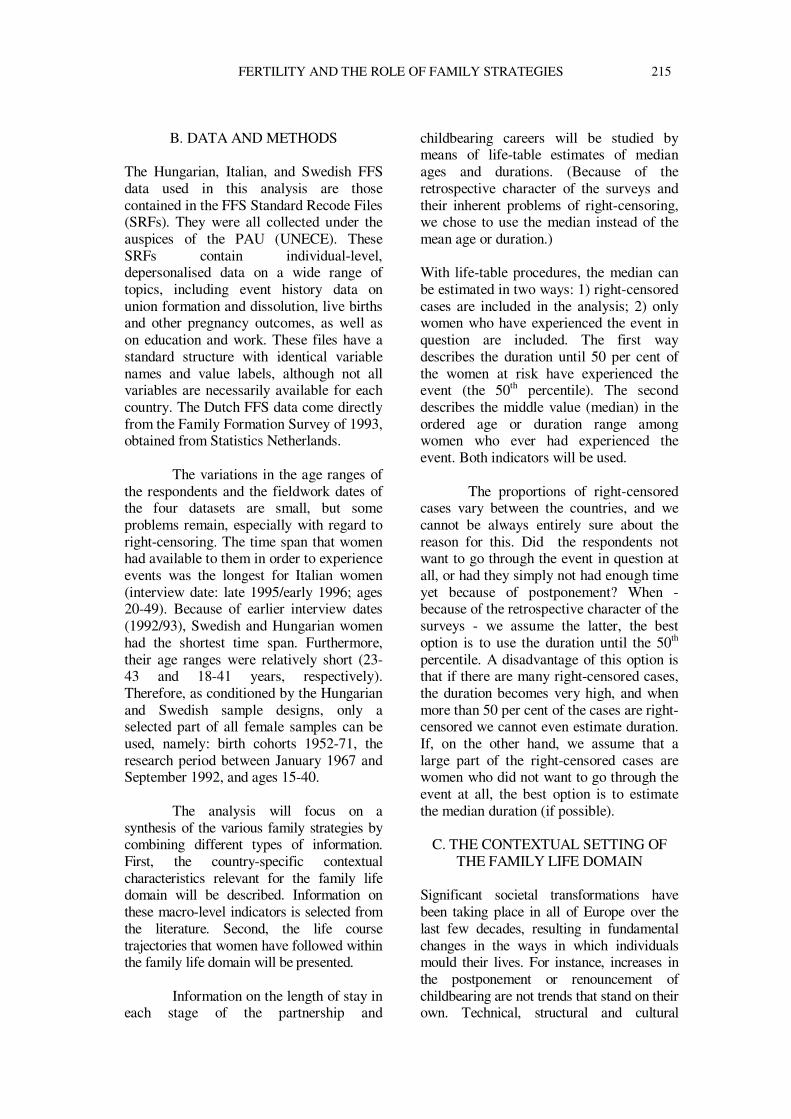
FERTILITY AND THE ROLE OF FAMILY STRATEGIES 215
B. DATA AND METHODS The Hungarian, Italian, and Swedish FFS data used in this analysis are those contained in the FFS Standard Recode Files (SRFs). They were all collected under the auspices of the PAU (UNECE). These SRFs contain individual-level, depersonalised data on a wide range of topics, including event history data on union formation and dissolution, live births and other pregnancy outcomes, as well as on education and work. These files have a standard structure with identical variable names and value labels, although not all variables are necessarily available for each country. The Dutch FFS data come directly from the Family Formation Survey of 1993, obtained from Statistics Netherlands.
The variations in the age ranges of the respondents and the fieldwork dates of the four datasets are small, but some problems remain, especially with regard to right-censoring. The time span that women had available to them in order to experience events was the longest for Italian women (interview date: late 1995/early 1996; ages 20-49). Because of earlier interview dates (1992/93), Swedish and Hungarian women had the shortest time span. Furthermore, their age ranges were relatively short (23-43 and 18-41 years, respectively). Therefore, as conditioned by the Hungarian and Swedish sample designs, only a selected part of all female samples can be used, namely: birth cohorts 1952-71, the research period between January 1967 and September 1992, and ages 15-40.
The analysis will focus on a
synthesis of the various family strategies by combining different types of information. First, the country-specific contextual characteristics relevant for the family life domain will be described. Information on these macro-level indicators is selected from the literature. Second, the life course trajectories that women have followed within the family life domain will be presented.
Information on the length of stay in
each stage of the partnership and
childbearing careers will be studied by means of life-table estimates of median ages and durations. (Because of the retrospective character of the surveys and their inherent problems of right-censoring, we chose to use the median instead of the mean age or duration.)
With life-table procedures, the median can be estimated in two ways: 1) right-censored cases are included in the analysis; 2) only women who have experienced the event in question are included. The first way describes the duration until 50 per cent of the women at risk have experienced the event (the 50th percentile). The second describes the middle value (median) in the ordered age or duration range among women who ever had experienced the event. Both indicators will be used.
The proportions of right-censored cases vary between the countries, and we cannot be always entirely sure about the reason for this. Did the respondents not want to go through the event in question at all, or had they simply not had enough time yet because of postponement? When - because of the retrospective character of the surveys - we assume the latter, the best option is to use the duration until the 50th percentile. A disadvantage of this option is that if there are many right-censored cases, the duration becomes very high, and when more than 50 per cent of the cases are right-censored we cannot even estimate duration. If, on the other hand, we assume that a large part of the right-censored cases are women who did not want to go through the event at all, the best option is to estimate the median duration (if possible).
C. THE CONTEXTUAL SETTING OF
THE FAMILY LIFE DOMAIN Significant societal transformations have been taking place in all of Europe over the last few decades, resulting in fundamental changes in the ways in which individuals mould their lives. For instance, increases in the postponement or renouncement of childbearing are not trends that stand on their own. Technical, structural and cultural
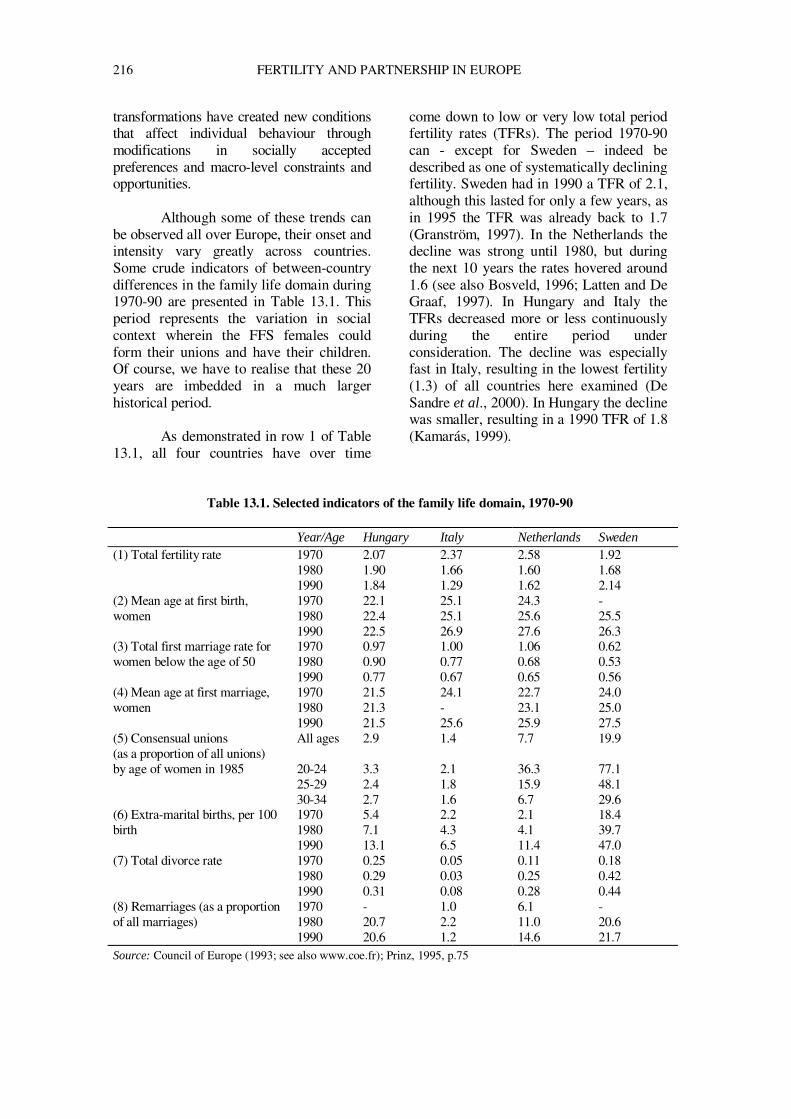
216 FERTILITY AND PARTNERSHIP IN EUROPE
transformations have created new conditions that affect individual behaviour through modifications in socially accepted preferences and macro-level constraints and opportunities.
Although some of these trends can be observed all over Europe, their onset and intensity vary greatly across countries. Some crude indicators of between-country differences in the family life domain during 1970-90 are presented in Table 13.1. This period represents the variation in social context wherein the FFS females could form their unions and have their children. Of course, we have to realise that these 20 years are imbedded in a much larger historical period.
As demonstrated in row 1 of Table
13.1, all four countries have over time
come down to low or very low total period fertility rates (TFRs). The period 1970-90 can - except for Sweden – indeed be described as one of systematically declining fertility. Sweden had in 1990 a TFR of 2.1, although this lasted for only a few years, as in 1995 the TFR was already back to 1.7 (Granström, 1997). In the Netherlands the decline was strong until 1980, but during the next 10 years the rates hovered around 1.6 (see also Bosveld, 1996; Latten and De Graaf, 1997). In Hungary and Italy the TFRs decreased more or less continuously during the entire period under consideration. The decline was especially fast in Italy, resulting in the lowest fertility (1.3) of all countries here examined (De Sandre et al., 2000). In Hungary the decline was smaller, resulting in a 1990 TFR of 1.8 (Kamarás, 1999).
Table 13.1. Selected indicators of the family life domain, 1970-90 Year/Age Hungary Italy Netherlands Sweden (1) Total fertility rate 1970
1980 1990
2.07 1.90 1.84
2.37 1.66 1.29
2.58 1.60 1.62
1.92 1.68 2.14
(2) Mean age at first birth, women
1970 1980 1990
22.1 22.4 22.5
25.1 25.1 26.9
24.3 25.6 27.6
- 25.5 26.3
(3) Total first marriage rate for women below the age of 50
1970 1980 1990
0.97 0.90 0.77
1.00 0.77 0.67
1.06 0.68 0.65
0.62 0.53 0.56
(4) Mean age at first marriage, women
1970 1980 1990
21.5 21.3 21.5
24.1 - 25.6
22.7 23.1 25.9
24.0 25.0 27.5
(5) Consensual unions (as a proportion of all unions) by age of women in 1985
All ages 20-24 25-29 30-34
2.9 3.3 2.4 2.7
1.4 2.1 1.8 1.6
7.7 36.3 15.9 6.7
19.9 77.1 48.1 29.6
(6) Extra-marital births, per 100 birth
1970 1980 1990
5.4 7.1 13.1
2.2 4.3 6.5
2.1 4.1 11.4
18.4 39.7 47.0
(7) Total divorce rate 1970 1980 1990
0.25 0.29 0.31
0.05 0.03 0.08
0.11 0.25 0.28
0.18 0.42 0.44
(8) Remarriages (as a proportion of all marriages)
1970 1980 1990
- 20.7 20.6
1.0 2.2 1.2
6.1 11.0 14.6
- 20.6 21.7
Source: Council of Europe (1993; see also www.coe.fr); Prinz, 1995, p.75
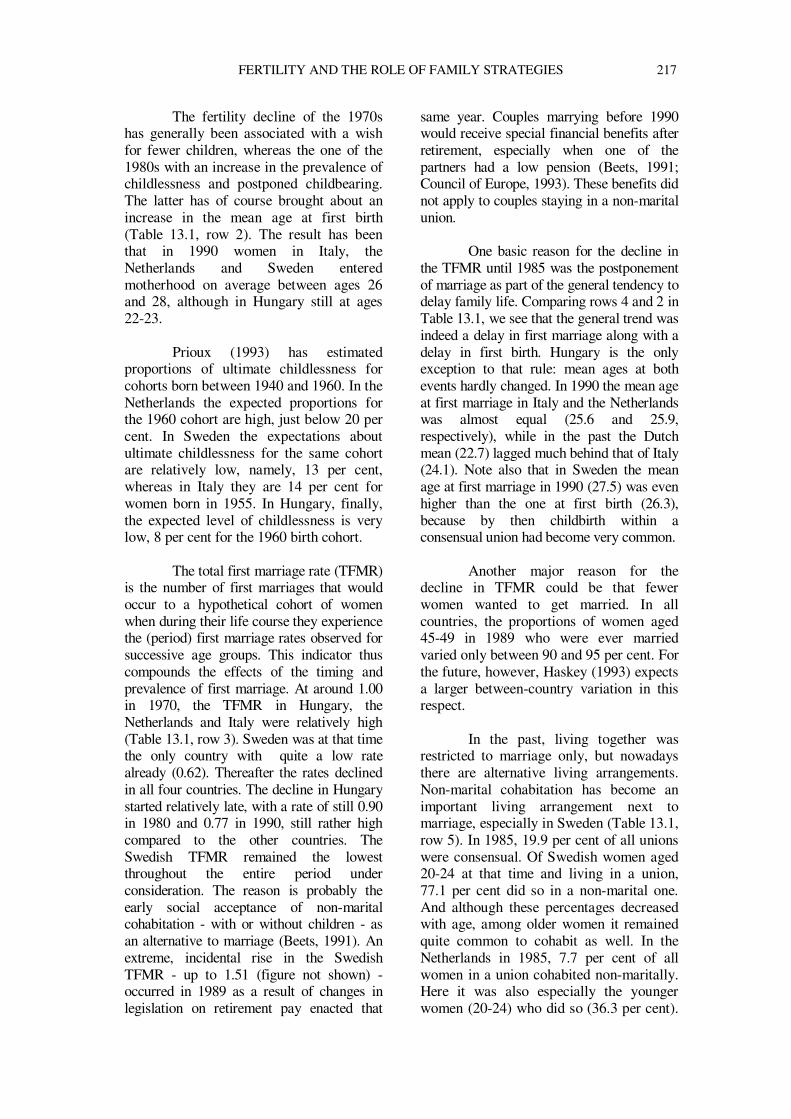
FERTILITY AND THE ROLE OF FAMILY STRATEGIES 217
The fertility decline of the 1970s has generally been associated with a wish for fewer children, whereas the one of the 1980s with an increase in the prevalence of childlessness and postponed childbearing. The latter has of course brought about an increase in the mean age at first birth (Table 13.1, row 2). The result has been that in 1990 women in Italy, the Netherlands and Sweden entered motherhood on average between ages 26 and 28, although in Hungary still at ages 22-23.
Prioux (1993) has estimated
proportions of ultimate childlessness for cohorts born between 1940 and 1960. In the Netherlands the expected proportions for the 1960 cohort are high, just below 20 per cent. In Sweden the expectations about ultimate childlessness for the same cohort are relatively low, namely, 13 per cent, whereas in Italy they are 14 per cent for women born in 1955. In Hungary, finally, the expected level of childlessness is very low, 8 per cent for the 1960 birth cohort.
The total first marriage rate (TFMR) is the number of first marriages that would occur to a hypothetical cohort of women when during their life course they experience the (period) first marriage rates observed for successive age groups. This indicator thus compounds the effects of the timing and prevalence of first marriage. At around 1.00 in 1970, the TFMR in Hungary, the Netherlands and Italy were relatively high (Table 13.1, row 3). Sweden was at that time the only country with quite a low rate already (0.62). Thereafter the rates declined in all four countries. The decline in Hungary started relatively late, with a rate of still 0.90 in 1980 and 0.77 in 1990, still rather high compared to the other countries. The Swedish TFMR remained the lowest throughout the entire period under consideration. The reason is probably the early social acceptance of non-marital cohabitation - with or without children - as an alternative to marriage (Beets, 1991). An extreme, incidental rise in the Swedish TFMR - up to 1.51 (figure not shown) - occurred in 1989 as a result of changes in legislation on retirement pay enacted that
same year. Couples marrying before 1990 would receive special financial benefits after retirement, especially when one of the partners had a low pension (Beets, 1991; Council of Europe, 1993). These benefits did not apply to couples staying in a non-marital union.
One basic reason for the decline in
the TFMR until 1985 was the postponement of marriage as part of the general tendency to delay family life. Comparing rows 4 and 2 in Table 13.1, we see that the general trend was indeed a delay in first marriage along with a delay in first birth. Hungary is the only exception to that rule: mean ages at both events hardly changed. In 1990 the mean age at first marriage in Italy and the Netherlands was almost equal (25.6 and 25.9, respectively), while in the past the Dutch mean (22.7) lagged much behind that of Italy (24.1). Note also that in Sweden the mean age at first marriage in 1990 (27.5) was even higher than the one at first birth (26.3), because by then childbirth within a consensual union had become very common.
Another major reason for the
decline in TFMR could be that fewer women wanted to get married. In all countries, the proportions of women aged 45-49 in 1989 who were ever married varied only between 90 and 95 per cent. For the future, however, Haskey (1993) expects a larger between-country variation in this respect.
In the past, living together was restricted to marriage only, but nowadays there are alternative living arrangements. Non-marital cohabitation has become an important living arrangement next to marriage, especially in Sweden (Table 13.1, row 5). In 1985, 19.9 per cent of all unions were consensual. Of Swedish women aged 20-24 at that time and living in a union, 77.1 per cent did so in a non-marital one. And although these percentages decreased with age, among older women it remained quite common to cohabit as well. In the Netherlands in 1985, 7.7 per cent of all women in a union cohabited non-maritally. Here it was also especially the younger women (20-24) who did so (36.3 per cent).
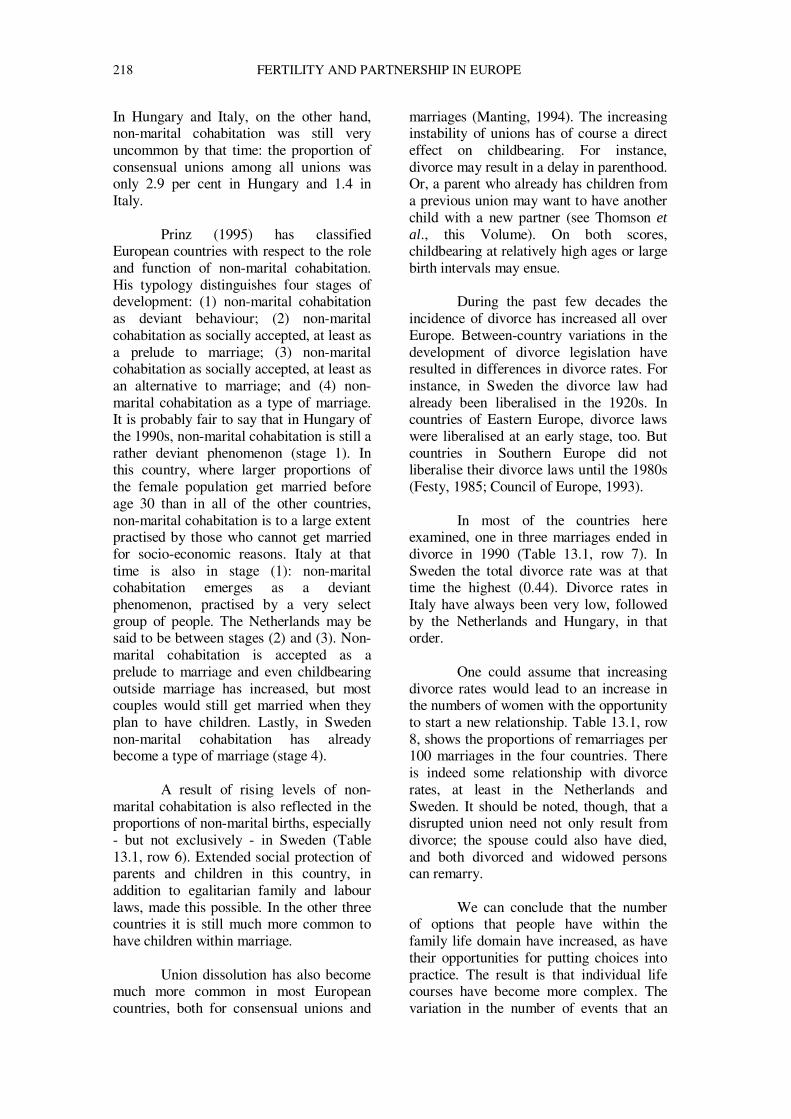
218 FERTILITY AND PARTNERSHIP IN EUROPE
In Hungary and Italy, on the other hand, non-marital cohabitation was still very uncommon by that time: the proportion of consensual unions among all unions was only 2.9 per cent in Hungary and 1.4 in Italy.
Prinz (1995) has classified
European countries with respect to the role and function of non-marital cohabitation. His typology distinguishes four stages of development: (1) non-marital cohabitation as deviant behaviour; (2) non-marital cohabitation as socially accepted, at least as a prelude to marriage; (3) non-marital cohabitation as socially accepted, at least as an alternative to marriage; and (4) non-marital cohabitation as a type of marriage. It is probably fair to say that in Hungary of the 1990s, non-marital cohabitation is still a rather deviant phenomenon (stage 1). In this country, where larger proportions of the female population get married before age 30 than in all of the other countries, non-marital cohabitation is to a large extent practised by those who cannot get married for socio-economic reasons. Italy at that time is also in stage (1): non-marital cohabitation emerges as a deviant phenomenon, practised by a very select group of people. The Netherlands may be said to be between stages (2) and (3). Non-marital cohabitation is accepted as a prelude to marriage and even childbearing outside marriage has increased, but most couples would still get married when they plan to have children. Lastly, in Sweden non-marital cohabitation has already become a type of marriage (stage 4).
A result of rising levels of non-
marital cohabitation is also reflected in the proportions of non-marital births, especially - but not exclusively - in Sweden (Table 13.1, row 6). Extended social protection of parents and children in this country, in addition to egalitarian family and labour laws, made this possible. In the other three countries it is still much more common to have children within marriage.
Union dissolution has also become much more common in most European countries, both for consensual unions and
marriages (Manting, 1994). The increasing instability of unions has of course a direct effect on childbearing. For instance, divorce may result in a delay in parenthood. Or, a parent who already has children from a previous union may want to have another child with a new partner (see Thomson et al., this Volume). On both scores, childbearing at relatively high ages or large birth intervals may ensue.
During the past few decades the
incidence of divorce has increased all over Europe. Between-country variations in the development of divorce legislation have resulted in differences in divorce rates. For instance, in Sweden the divorce law had already been liberalised in the 1920s. In countries of Eastern Europe, divorce laws were liberalised at an early stage, too. But countries in Southern Europe did not liberalise their divorce laws until the 1980s (Festy, 1985; Council of Europe, 1993).
In most of the countries here
examined, one in three marriages ended in divorce in 1990 (Table 13.1, row 7). In Sweden the total divorce rate was at that time the highest (0.44). Divorce rates in Italy have always been very low, followed by the Netherlands and Hungary, in that order.
One could assume that increasing
divorce rates would lead to an increase in the numbers of women with the opportunity to start a new relationship. Table 13.1, row 8, shows the proportions of remarriages per 100 marriages in the four countries. There is indeed some relationship with divorce rates, at least in the Netherlands and Sweden. It should be noted, though, that a disrupted union need not only result from divorce; the spouse could also have died, and both divorced and widowed persons can remarry.
We can conclude that the number
of options that people have within the family life domain have increased, as have their opportunities for putting choices into practice. The result is that individual life courses have become more complex. The variation in the number of events that an
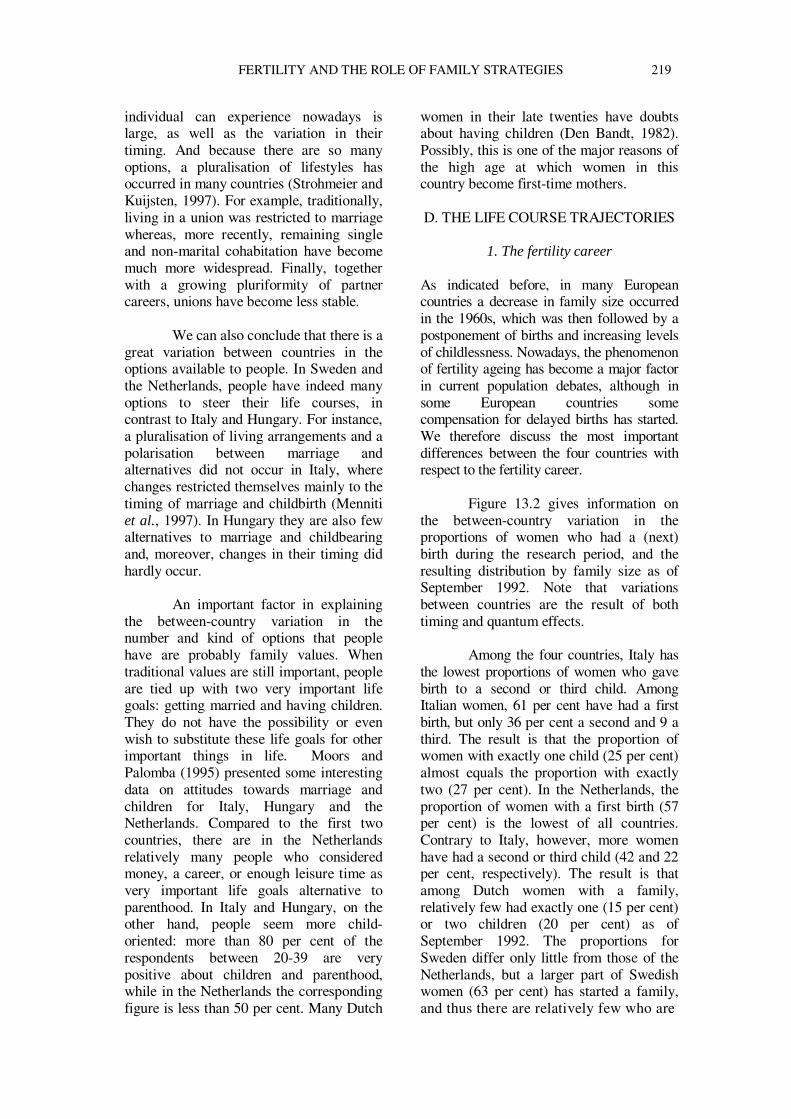
FERTILITY AND THE ROLE OF FAMILY STRATEGIES 219
individual can experience nowadays is large, as well as the variation in their timing. And because there are so many options, a pluralisation of lifestyles has occurred in many countries (Strohmeier and Kuijsten, 1997). For example, traditionally, living in a union was restricted to marriage whereas, more recently, remaining single and non-marital cohabitation have become much more widespread. Finally, together with a growing pluriformity of partner careers, unions have become less stable.
We can also conclude that there is a
great variation between countries in the options available to people. In Sweden and the Netherlands, people have indeed many options to steer their life courses, in contrast to Italy and Hungary. For instance, a pluralisation of living arrangements and a polarisation between marriage and alternatives did not occur in Italy, where changes restricted themselves mainly to the timing of marriage and childbirth (Menniti et al., 1997). In Hungary they are also few alternatives to marriage and childbearing and, moreover, changes in their timing did hardly occur.
An important factor in explaining
the between-country variation in the number and kind of options that people have are probably family values. When traditional values are still important, people are tied up with two very important life goals: getting married and having children. They do not have the possibility or even wish to substitute these life goals for other important things in life. Moors and Palomba (1995) presented some interesting data on attitudes towards marriage and children for Italy, Hungary and the Netherlands. Compared to the first two countries, there are in the Netherlands relatively many people who considered money, a career, or enough leisure time as very important life goals alternative to parenthood. In Italy and Hungary, on the other hand, people seem more child-oriented: more than 80 per cent of the respondents between 20-39 are very positive about children and parenthood, while in the Netherlands the corresponding figure is less than 50 per cent. Many Dutch
women in their late twenties have doubts about having children (Den Bandt, 1982). Possibly, this is one of the major reasons of the high age at which women in this country become first-time mothers.
D. THE LIFE COURSE TRAJECTORIES
1. The fertility career As indicated before, in many European countries a decrease in family size occurred in the 1960s, which was then followed by a postponement of births and increasing levels of childlessness. Nowadays, the phenomenon of fertility ageing has become a major factor in current population debates, although in some European countries some compensation for delayed births has started. We therefore discuss the most important differences between the four countries with respect to the fertility career.
Figure 13.2 gives information on the between-country variation in the proportions of women who had a (next) birth during the research period, and the resulting distribution by family size as of September 1992. Note that variations between countries are the result of both timing and quantum effects.
Among the four countries, Italy has
the lowest proportions of women who gave birth to a second or third child. Among Italian women, 61 per cent have had a first birth, but only 36 per cent a second and 9 a third. The result is that the proportion of women with exactly one child (25 per cent) almost equals the proportion with exactly two (27 per cent). In the Netherlands, the proportion of women with a first birth (57 per cent) is the lowest of all countries. Contrary to Italy, however, more women have had a second or third child (42 and 22 per cent, respectively). The result is that among Dutch women with a family, relatively few had exactly one (15 per cent) or two children (20 per cent) as of September 1992. The proportions for Sweden differ only little from those of the Netherlands, but a larger part of Swedish women (63 per cent) has started a family, and thus there are relatively few who are
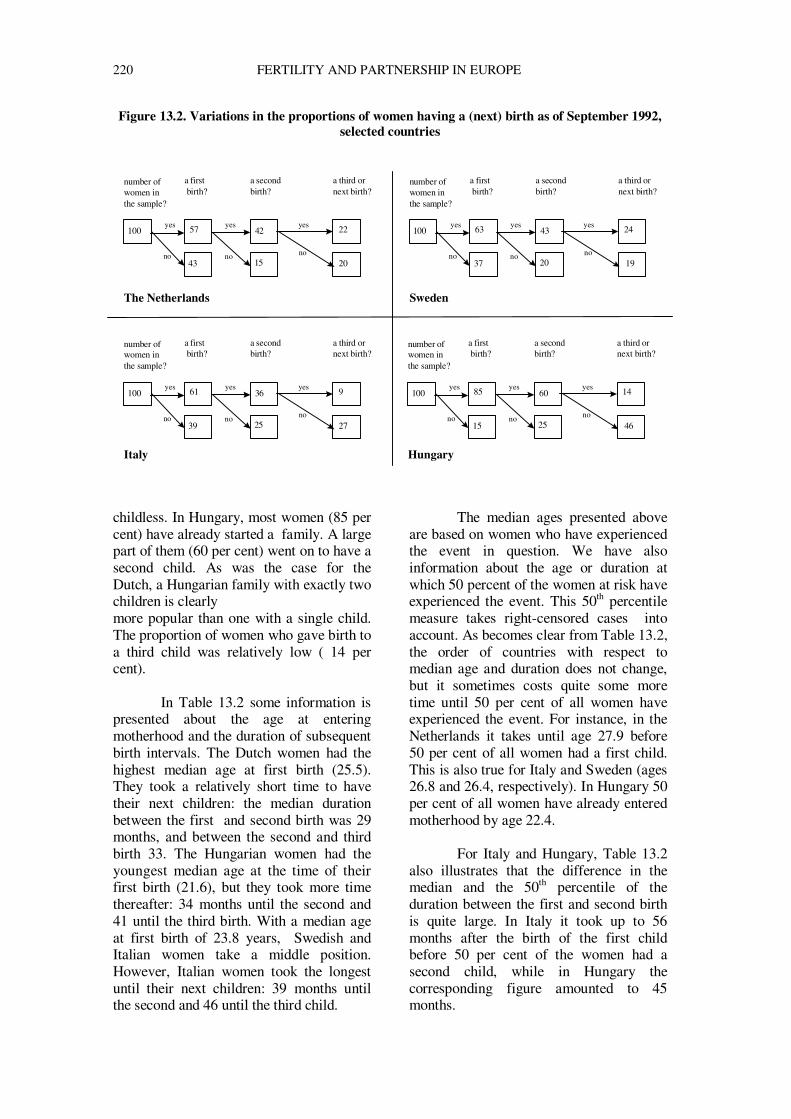
220 FERTILITY AND PARTNERSHIP IN EUROPE
Figure 13.2. Variations in the proportions of women having a (next) birth as of September 1992, selected countries
childless. In Hungary, most women (85 per cent) have already started a family. A large part of them (60 per cent) went on to have a second child. As was the case for the Dutch, a Hungarian family with exactly two children is clearly more popular than one with a single child. The proportion of women who gave birth to a third child was relatively low ( 14 per cent).
In Table 13.2 some information is presented about the age at entering motherhood and the duration of subsequent birth intervals. The Dutch women had the highest median age at first birth (25.5). They took a relatively short time to have their next children: the median duration between the first and second birth was 29 months, and between the second and third birth 33. The Hungarian women had the youngest median age at the time of their first birth (21.6), but they took more time thereafter: 34 months until the second and 41 until the third birth. With a median age at first birth of 23.8 years, Swedish and Italian women take a middle position. However, Italian women took the longest until their next children: 39 months until the second and 46 until the third child.
The median ages presented above are based on women who have experienced the event in question. We have also information about the age or duration at which 50 percent of the women at risk have experienced the event. This 50th percentile measure takes right-censored cases into account. As becomes clear from Table 13.2, the order of countries with respect to median age and duration does not change, but it sometimes costs quite some more time until 50 per cent of all women have experienced the event. For instance, in the Netherlands it takes until age 27.9 before 50 per cent of all women had a first child. This is also true for Italy and Sweden (ages 26.8 and 26.4, respectively). In Hungary 50 per cent of all women have already entered motherhood by age 22.4.
For Italy and Hungary, Table 13.2
also illustrates that the difference in the median and the 50th percentile of the duration between the first and second birth is quite large. In Italy it took up to 56 months after the birth of the first child before 50 per cent of the women had a second child, while in Hungary the corresponding figure amounted to 45 months.
The Netherlands
number ofwomen inthe sample?
a first birth?
a secondbirth?
a third ornext birth?
yes
no
yesyes
nono
100 57
43
42
15
22
20
Hungary
number ofwomen inthe sample?
a first birth?
a secondbirth?
a third ornext birth?
yes
no
yesyes
nono
100 85
15
60
25
14
46
Italy
number ofwomen inthe sample?
a first birth?
a secondbirth?
a third ornext birth?
yes
no
yesyes
nono
100 61
39
36
25
9
27
Sweden
number ofwomen inthe sample?
a first birth?
a secondbirth?
a third ornext birth?
yes
no
yesyes
nono
100 63
37
43
20
24
19
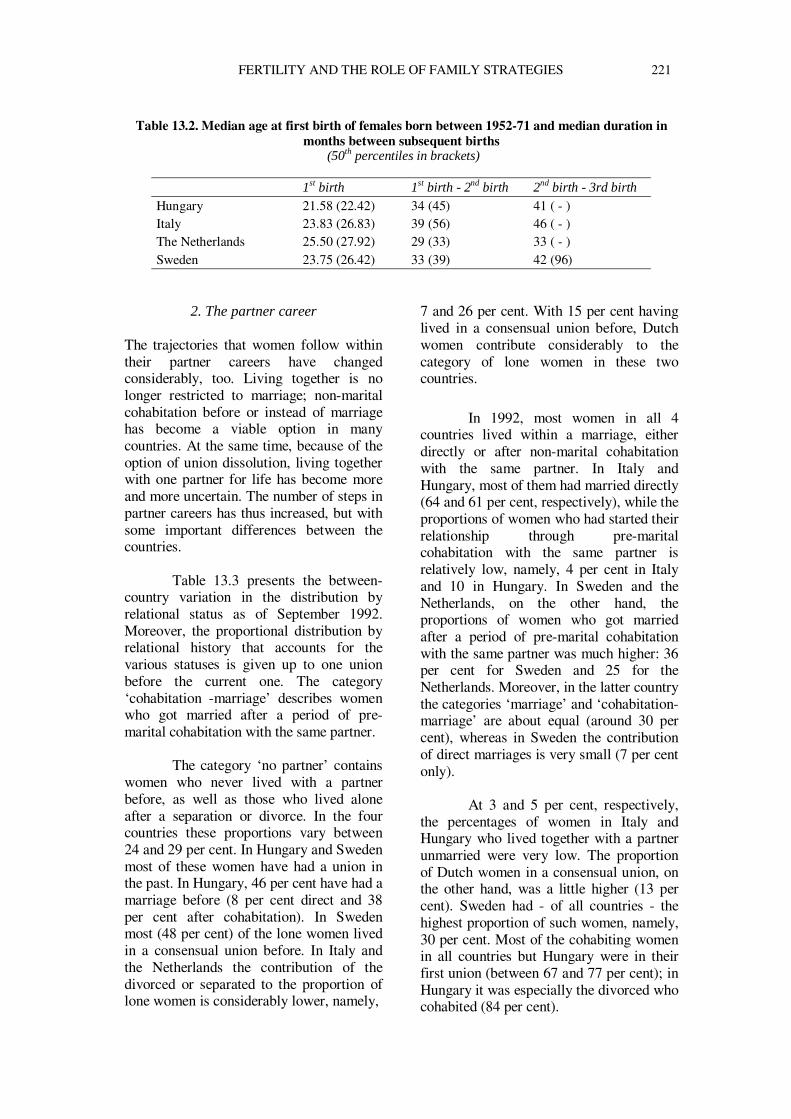
FERTILITY AND THE ROLE OF FAMILY STRATEGIES 221
Table 13.2. Median age at first birth of females born between 1952-71 and median duration in
months between subsequent births (50th percentiles in brackets)
1st birth 1st birth - 2nd birth 2nd birth - 3rd birth
Hungary 21.58 (22.42) 34 (45) 41 ( - ) Italy 23.83 (26.83) 39 (56) 46 ( - ) The Netherlands 25.50 (27.92) 29 (33) 33 ( - ) Sweden 23.75 (26.42) 33 (39) 42 (96)
2. The partner career The trajectories that women follow within their partner careers have changed considerably, too. Living together is no longer restricted to marriage; non-marital cohabitation before or instead of marriage has become a viable option in many countries. At the same time, because of the option of union dissolution, living together with one partner for life has become more and more uncertain. The number of steps in partner careers has thus increased, but with some important differences between the countries.
Table 13.3 presents the between-country variation in the distribution by relational status as of September 1992. Moreover, the proportional distribution by relational history that accounts for the various statuses is given up to one union before the current one. The category ‘cohabitation -marriage’ describes women who got married after a period of pre-marital cohabitation with the same partner.
The category ‘no partner’ contains
women who never lived with a partner before, as well as those who lived alone after a separation or divorce. In the four countries these proportions vary between 24 and 29 per cent. In Hungary and Sweden most of these women have had a union in the past. In Hungary, 46 per cent have had a marriage before (8 per cent direct and 38 per cent after cohabitation). In Sweden most (48 per cent) of the lone women lived in a consensual union before. In Italy and the Netherlands the contribution of the divorced or separated to the proportion of lone women is considerably lower, namely,
7 and 26 per cent. With 15 per cent having lived in a consensual union before, Dutch women contribute considerably to the category of lone women in these two countries.
In 1992, most women in all 4 countries lived within a marriage, either directly or after non-marital cohabitation with the same partner. In Italy and Hungary, most of them had married directly (64 and 61 per cent, respectively), while the proportions of women who had started their relationship through pre-marital cohabitation with the same partner is relatively low, namely, 4 per cent in Italy and 10 in Hungary. In Sweden and the Netherlands, on the other hand, the proportions of women who got married after a period of pre-marital cohabitation with the same partner was much higher: 36 per cent for Sweden and 25 for the Netherlands. Moreover, in the latter country the categories ‘marriage’ and ‘cohabitation-marriage’ are about equal (around 30 per cent), whereas in Sweden the contribution of direct marriages is very small (7 per cent only).
At 3 and 5 per cent, respectively,
the percentages of women in Italy and Hungary who lived together with a partner unmarried were very low. The proportion of Dutch women in a consensual union, on the other hand, was a little higher (13 per cent). Sweden had - of all countries - the highest proportion of such women, namely, 30 per cent. Most of the cohabiting women in all countries but Hungary were in their first union (between 67 and 77 per cent); in Hungary it was especially the divorced who cohabited (84 per cent).
222 FERTILITY AND PARTNERSHIP IN EUROPE
Table 13.3. Proportional distribution by partner status as of September 1992 and previous partner histories, for selected countries.
Country Proportional distribution by current
partnership status (as of September 1992) Proportional distribution by previous partnership status
Hungary 24 % no partner 29 % never had a partner 25 % after a cohabitation 8 % after a marriage 38 % after cohabitation - marriage
5 % cohabitation 17 % after another cohabitation 67 % after a marriage 17 % after cohabitation - marriage
61% marriage 93 % first relationship 5 % after a cohabitation with different partner 2 % after another marriage
10% cohabitation – marriage 70 % first relationship 10 % after a cohabitation with different partner 20 % after a marriage
Italy 29 % no partner 93 % never had a partner
7 % after marriage 3 % cohabitation 67 % first relationship
33 % after a marriage 64 % marriage 100 % first relationship 4 % cohabitation – marriage 75 % first relationship
25 % after a cohabitation with different partner The Netherlands 27 % no partner 74 % never had a partner
15 % cohabitation 7 % marriage 4 % after cohabitation - marriage
13 % cohabitation 77 % first relationship 15 % after another cohabitation 8 % after a marriage
35 % marriage 97 % first relationship 3 % after a cohabitation with different partner
25 % cohabitation- marriage 84 % first relationship 12 % after a cohabitation with different partner 4 % after a marriage
Sweden 27 % no partner 41 % never had a partner
48 % after cohabitation 4 % after marriage 7 % after cohabitation - marriage
30 % cohabitation 70 % first relationship 23 % after another cohabitation 7 % after cohabitation - marriage
7 % marriage 86 % first relationship 14 % after a cohabitation with different partner
36 % cohabitation – marriage 75 % first relationship 22 % after a cohabitation with different partner 3 % after another cohabitation - marriage
In Table 13.4 some information is presented about the age at entering a first partnership (marriage) and the duration of non-marital cohabitation when followed by marriage with the same partner. If non-marital cohabitation is a prelude to marriage, it is somewhat confusing to see that in Hungary, Italy and the Netherlands the median ages at first marriage are lower
than those at first union. A possible explanation could be selection: women who marry directly tend to have other characteristics than women who marry after pre-marital cohabitation. On the other hand, in Italy the 50th percentile age at the start of a first partnership (24.4) is equal to that at first marriage, whereas in the Netherlands it is lower (23.0 against 24.1).
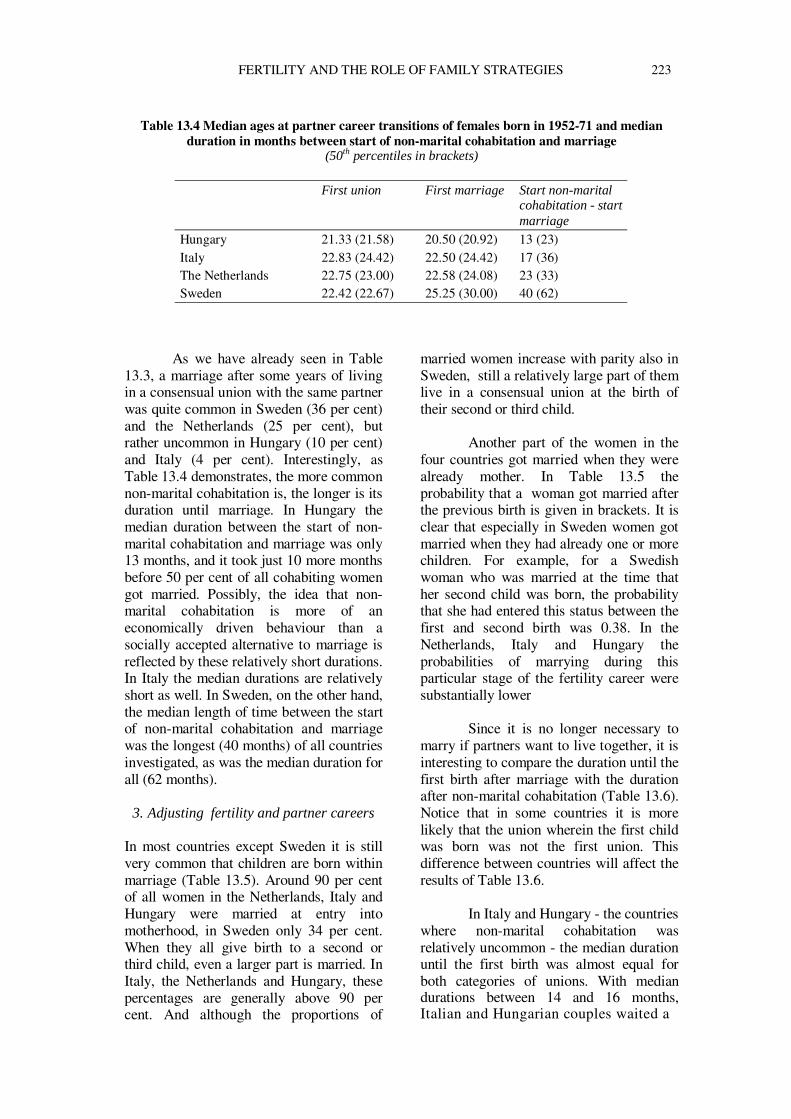
FERTILITY AND THE ROLE OF FAMILY STRATEGIES 223
Table 13.4 Median ages at partner career transitions of females born in 1952-71 and median
duration in months between start of non-marital cohabitation and marriage (50th percentiles in brackets)
First union First marriage Start non-marital
cohabitation - start marriage
Hungary 21.33 (21.58) 20.50 (20.92) 13 (23) Italy 22.83 (24.42) 22.50 (24.42) 17 (36) The Netherlands 22.75 (23.00) 22.58 (24.08) 23 (33) Sweden 22.42 (22.67) 25.25 (30.00) 40 (62)
As we have already seen in Table 13.3, a marriage after some years of living in a consensual union with the same partner was quite common in Sweden (36 per cent) and the Netherlands (25 per cent), but rather uncommon in Hungary (10 per cent) and Italy (4 per cent). Interestingly, as Table 13.4 demonstrates, the more common non-marital cohabitation is, the longer is its duration until marriage. In Hungary the median duration between the start of non-marital cohabitation and marriage was only 13 months, and it took just 10 more months before 50 per cent of all cohabiting women got married. Possibly, the idea that non-marital cohabitation is more of an economically driven behaviour than a socially accepted alternative to marriage is reflected by these relatively short durations. In Italy the median durations are relatively short as well. In Sweden, on the other hand, the median length of time between the start of non-marital cohabitation and marriage was the longest (40 months) of all countries investigated, as was the median duration for all (62 months).
3. Adjusting fertility and partner careers
In most countries except Sweden it is still very common that children are born within marriage (Table 13.5). Around 90 per cent of all women in the Netherlands, Italy and Hungary were married at entry into motherhood, in Sweden only 34 per cent. When they all give birth to a second or third child, even a larger part is married. In Italy, the Netherlands and Hungary, these percentages are generally above 90 per cent. And although the proportions of
married women increase with parity also in Sweden, still a relatively large part of them live in a consensual union at the birth of their second or third child.
Another part of the women in the four countries got married when they were already mother. In Table 13.5 the probability that a woman got married after the previous birth is given in brackets. It is clear that especially in Sweden women got married when they had already one or more children. For example, for a Swedish woman who was married at the time that her second child was born, the probability that she had entered this status between the first and second birth was 0.38. In the Netherlands, Italy and Hungary the probabilities of marrying during this particular stage of the fertility career were substantially lower
Since it is no longer necessary to
marry if partners want to live together, it is interesting to compare the duration until the first birth after marriage with the duration after non-marital cohabitation (Table 13.6). Notice that in some countries it is more likely that the union wherein the first child was born was not the first union. This difference between countries will affect the results of Table 13.6.
In Italy and Hungary - the countries
where non-marital cohabitation was relatively uncommon - the median duration until the first birth was almost equal for both categories of unions. With median durations between 14 and 16 months, Italian and Hungarian couples waited a
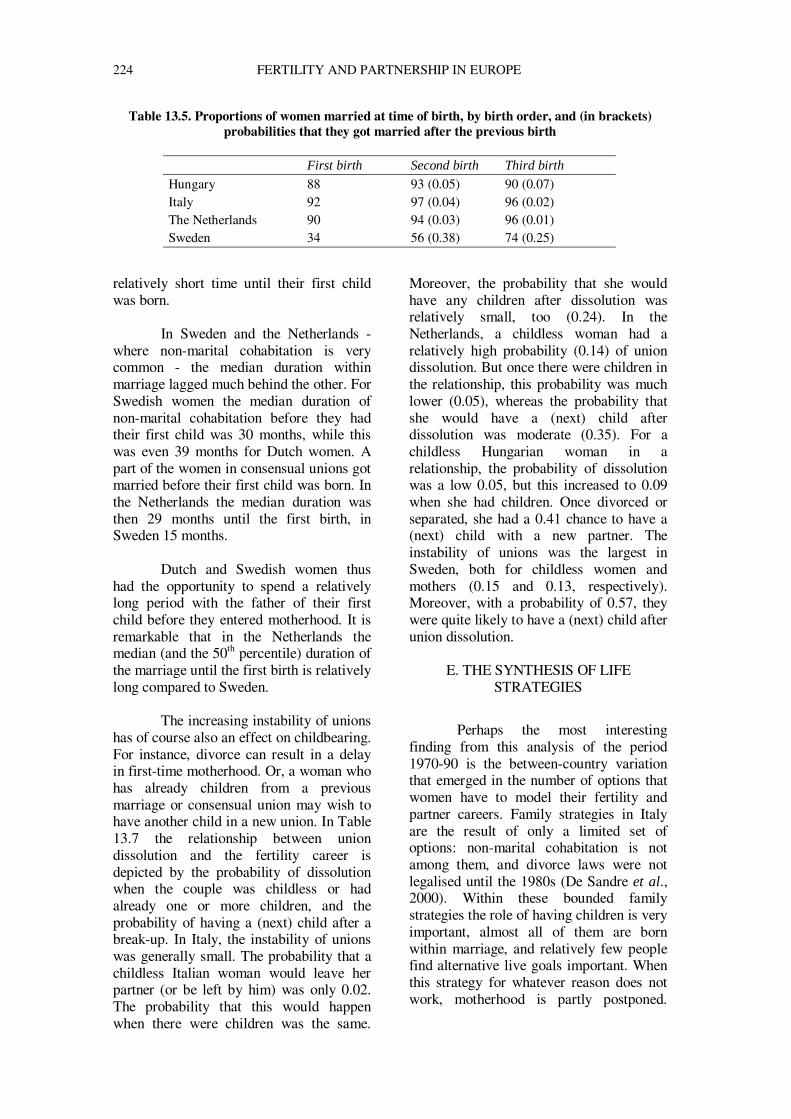
224 FERTILITY AND PARTNERSHIP IN EUROPE
Table 13.5. Proportions of women married at time of birth, by birth order, and (in brackets) probabilities that they got married after the previous birth
First birth Second birth Third birth
Hungary 88 93 (0.05) 90 (0.07) Italy 92 97 (0.04) 96 (0.02) The Netherlands 90 94 (0.03) 96 (0.01) Sweden 34 56 (0.38) 74 (0.25)
relatively short time until their first child was born.
In Sweden and the Netherlands -
where non-marital cohabitation is very common - the median duration within marriage lagged much behind the other. For Swedish women the median duration of non-marital cohabitation before they had their first child was 30 months, while this was even 39 months for Dutch women. A part of the women in consensual unions got married before their first child was born. In the Netherlands the median duration was then 29 months until the first birth, in Sweden 15 months.
Dutch and Swedish women thus
had the opportunity to spend a relatively long period with the father of their first child before they entered motherhood. It is remarkable that in the Netherlands the median (and the 50th percentile) duration of the marriage until the first birth is relatively long compared to Sweden.
The increasing instability of unions
has of course also an effect on childbearing. For instance, divorce can result in a delay in first-time motherhood. Or, a woman who has already children from a previous marriage or consensual union may wish to have another child in a new union. In Table 13.7 the relationship between union dissolution and the fertility career is depicted by the probability of dissolution when the couple was childless or had already one or more children, and the probability of having a (next) child after a break-up. In Italy, the instability of unions was generally small. The probability that a childless Italian woman would leave her partner (or be left by him) was only 0.02. The probability that this would happen when there were children was the same.
Moreover, the probability that she would have any children after dissolution was relatively small, too (0.24). In the Netherlands, a childless woman had a relatively high probability (0.14) of union dissolution. But once there were children in the relationship, this probability was much lower (0.05), whereas the probability that she would have a (next) child after dissolution was moderate (0.35). For a childless Hungarian woman in a relationship, the probability of dissolution was a low 0.05, but this increased to 0.09 when she had children. Once divorced or separated, she had a 0.41 chance to have a (next) child with a new partner. The instability of unions was the largest in Sweden, both for childless women and mothers (0.15 and 0.13, respectively). Moreover, with a probability of 0.57, they were quite likely to have a (next) child after union dissolution.
E. THE SYNTHESIS OF LIFE
STRATEGIES
Perhaps the most interesting finding from this analysis of the period 1970-90 is the between-country variation that emerged in the number of options that women have to model their fertility and partner careers. Family strategies in Italy are the result of only a limited set of options: non-marital cohabitation is not among them, and divorce laws were not legalised until the 1980s (De Sandre et al., 2000). Within these bounded family strategies the role of having children is very important, almost all of them are born within marriage, and relatively few people find alternative live goals important. When this strategy for whatever reason does not work, motherhood is partly postponed.
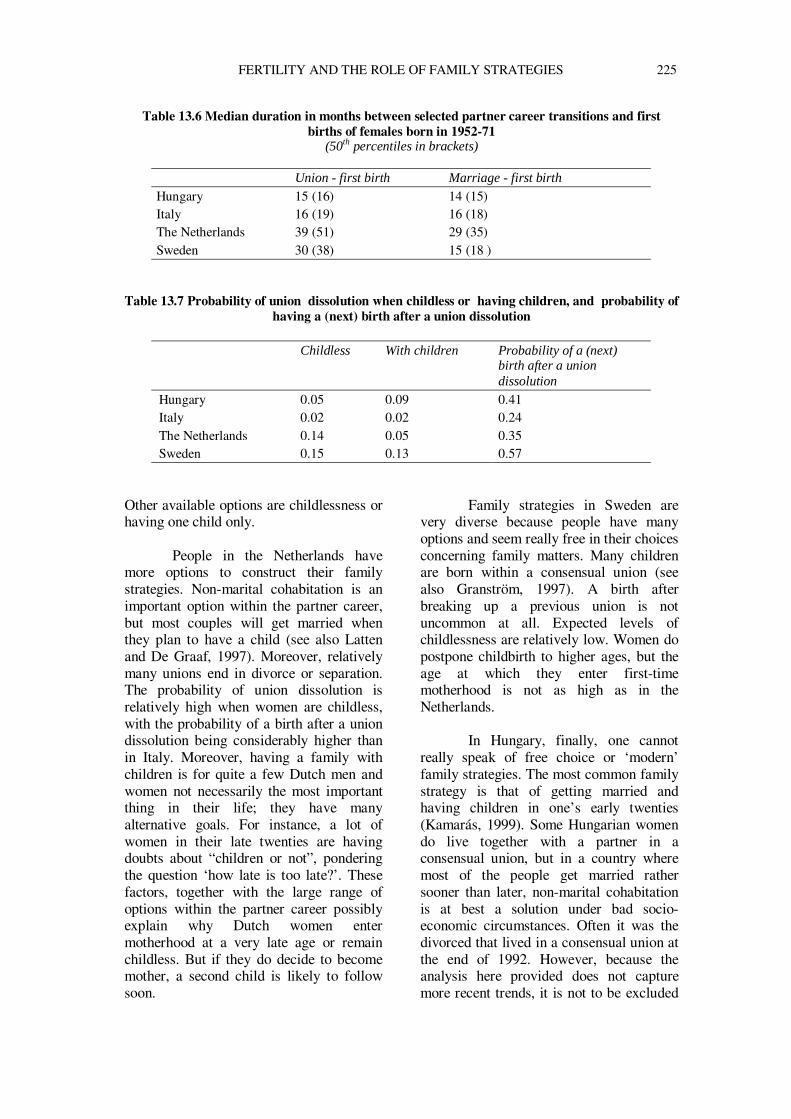
FERTILITY AND THE ROLE OF FAMILY STRATEGIES 225
Table 13.6 Median duration in months between selected partner career transitions and first births of females born in 1952-71
(50th percentiles in brackets)
Union - first birth Marriage - first birth
Hungary 15 (16) 14 (15) Italy 16 (19) 16 (18) The Netherlands 39 (51) 29 (35) Sweden 30 (38) 15 (18 )
Table 13.7 Probability of union dissolution when childless or having children, and probability of
having a (next) birth after a union dissolution
Childless With children Probability of a (next) birth after a union dissolution
Hungary 0.05 0.09 0.41 Italy 0.02 0.02 0.24 The Netherlands 0.14 0.05 0.35 Sweden 0.15 0.13 0.57
Other available options are childlessness or having one child only.
People in the Netherlands have more options to construct their family strategies. Non-marital cohabitation is an important option within the partner career, but most couples will get married when they plan to have a child (see also Latten and De Graaf, 1997). Moreover, relatively many unions end in divorce or separation. The probability of union dissolution is relatively high when women are childless, with the probability of a birth after a union dissolution being considerably higher than in Italy. Moreover, having a family with children is for quite a few Dutch men and women not necessarily the most important thing in their life; they have many alternative goals. For instance, a lot of women in their late twenties are having doubts about “children or not”, pondering the question ‘how late is too late?’. These factors, together with the large range of options within the partner career possibly explain why Dutch women enter motherhood at a very late age or remain childless. But if they do decide to become mother, a second child is likely to follow soon.
Family strategies in Sweden are very diverse because people have many options and seem really free in their choices concerning family matters. Many children are born within a consensual union (see also Granström, 1997). A birth after breaking up a previous union is not uncommon at all. Expected levels of childlessness are relatively low. Women do postpone childbirth to higher ages, but the age at which they enter first-time motherhood is not as high as in the Netherlands.
In Hungary, finally, one cannot
really speak of free choice or ‘modern’ family strategies. The most common family strategy is that of getting married and having children in one’s early twenties (Kamarás, 1999). Some Hungarian women do live together with a partner in a consensual union, but in a country where most of the people get married rather sooner than later, non-marital cohabitation is at best a solution under bad socio-economic circumstances. Often it was the divorced that lived in a consensual union at the end of 1992. However, because the analysis here provided does not capture more recent trends, it is not to be excluded
226 FERTILITY AND PARTNERSHIP IN EUROPE
that the number of options in Hungary - as well as in Italy - has increased since then.
More life course analysis is needed
than here provided in order to better understand how various options in family strategies affect fertility behaviour. For instance, is there a relationship between non-marital cohabitation and childbirth? And, is such a relationship the same in all countries or does it matter whether non-marital cohabitation is a deviant way of living or a broadly accepted behaviour? If deviant, is the effect on childbirth negative? If broadly accepted, positive? But then we must explain what such a difference in effects may mean, or – conversely – any similarity between them.
For instance, some researchers
found a strong negative effect of non-marital cohabitation on the birth of the first child in both Italy and Sweden, although we know that many women in Sweden - contrary to Italy - have a child within a consensual union. The usual interpretation of the negative effect for Italy is that it is indeed not very likely that Italian women have a child within a consensual union. But in Sweden the story of strategy is completely different. Probably the reason for the negative effect is that many consensual unions end in separation before any childbearing takes place. Therefore, if we really want to compare countries with respect to fertility behaviour, we must take this micro-macro link into account.
Of course, family strategies are not
the only factors affecting fertility behaviour. We can expect that an important part of the family strategies in the four countries be economically driven (cf. Blossfeld and Klijzing, forthcoming). We can thus probably better understand how a growing number of life course options affect fertility behaviour, if the economic life is also incorporated. Such an analysis would concern the education and work biographies of individuals, as well as the country-specific institutions making it either possible or difficult to combine role careers in the private and public domains.
REFERENCES
Beets, G.C.N. (1991). Wordt Zweden traditioneler?
[Is Sweden becoming more traditional?,]Demos, 7, 28-30.
Blossfeld, H.-P., and E. Klijzing, Eds. (forthcoming), The transition to adulthood in a globalizing world. A comparison of fourteen countries.
Bosveld, W. (1996), The ageing of fertility in Europe: a comparative demographic-analytic study. Amsterdam: Thesis Publishers (PDOD-Publication).
Bosveld, W. (1998). Explaining the between-country variation in fertility: the theoretical link between individual behaviour and social context. Amsterdam: Nethur-Demography (Paper no. 41).
Council of Europe (1993). Recent demographic trends in Europe and North America, 1992. Strasbourg: Council of Europe.
Den Bandt, M.-L. (1982). Vrijwillig kinderloze vrouwen, verkenningen rond een keuze [Voluntary childless women, explorations of a choice]. Deventer: Van Lochum Slaterus.
De Sandre, P., F. Ongaro, R. Rettaroli, and S. Salvini (2000). Fertility and Family Surveys in Countries of the ECE Region, Standard Country Report Italy. Economic Studies No. 10o. New York/Geneva: United Nations.
Festy, P. (1985). Divorce, juridical separation and remarriage. Recent trends in the member states of the Council of Europe. Strasbourg: Council of Europe (Population Studies 17).
Granström, F. (1997). Fertility and Family Surveys in Countries of the ECE Region, Standard Country Report Sweden. Economic Studies No. 10b. New York/Geneva: United Nations.
Haskey, J. (1993). Formation and dissolutions of unions in the different countries: Council of Europe, 251-338.
Kamarás, F. (1999). Fertility and Family Surveys in Countries of the ECE Region, Standard Country Report Hungary. Economic Studies No. 10j. New York/Geneva: United Nations.
Latten, J., and A. de Graaf (1997). Fertility and Family Surveys in Countries of the ECE Region, Standard Country Report The Netherlands. Economic Studies No. 10c. New York/Geneva: United Nations.
Lesthaeghe, R. (1999). Is low fertility only a temporary phenomenon in the EU? Paper presented at the seminar on “the lowest low fertility”, Max Planck Institute fir Demographic Research, Rostock, 10 and 11 December, 1998. Brussel/Gent (IPD-Working-Paper 1999-1).
Kaufmann, F.X. (1997). In: F.X. Kaufman, A.C. Kuijsten et al. (Eds). Family life and family policies in Europe. Volume 1, Structures and trends.
Manting, D. (1994). Dynamics in marriage and cohabitation: an inter-temporal, life course analysis of first union formation and dissolution. Amsterdam: Thesis Publishers (PDOD-Publications).
FERTILITY AND THE ROLE OF FAMILY STRATEGIES 227
Menniti, A., R. Palomba and L.L. Sabbadini (1997). Italy: changing family from within. In: F.X. Kaufman, A.C. Kuijsten et al. (Eds). Family life and family policies in Europe. Volume 1, Structures and trends 225-252.
Moen, P. and E. Wethington, (1992). The concept of family adaptive strategies. In: Annual Review of Sociology, 18, 233-251.
Moors H. and R. Palomba (1995). Population, family and welfare. A comparative survey of European attitudes. Volume 1, Oxford: Clarendon Press.
Ní Bhrolcháin, M. (1993). Women’s and men’s life strategies in developed societies. In: International Population Conference, 1993, IUSSP, Montreal, 2, 179-190.
Palomba, R. and L.L. Sabbadini (1993). Female life strategies: the way of comprise. In: International Population Conference, 1993, IUSSP, Montreal, 2, 219-231.
Prinz, C. (1995). Cohabiting, marriage or single. England: Avebury.
Prioux, F. (1993). L'infecondité en Europe. [Infertility in Europe] In A. Blum & J.L. Rallu (Eds.), European population. II. Demographic dynamics. Montrouge: John Libbey Eurotext and INED, 231-251.
Strohmeier, K.P. and A.C. Kuijsten (1997). Family life policies in Europe: an introduction. In F.X. Kaufman et al. (Eds). Family life and family policies in Europe. Volume 1, Structures and trends, 1-11.
ENDNOTES i The author wishes to thank the Advisory Group of the FFS programme of comparative research for its permission, granted under identification number 8, to use the FFS data on which this study is based.