Embed Size (px)
Citation preview
1
Chapter 1
Catalyst Fundamentals in Industrial Catalysis
Draft Chapter Prepared By
Robert Farauto
Lucas Dorazio
2
Chapter Outline
1 Catalyst Fundamentals Industrial Catalysis
1.1 Introduction
1.2 Catalyzed versus Non‐catalyzed Reactions
1.2.1 Example Reaction: Liquid Phase Redox Reaction
1.2.2 Example Reaction: CO Oxidation
1.2.3 Homogeneous vs. Heterogeneous Catalysts
1.3 Selectivity and Catalytic Reactions
1.4 Physical Structure of a Heterogeneous Catalyst
1.4.1 Active Species
1.4.2 Promoters
1.4.3 Carriers
1.4.4 Structure of the Catalyst and Catalytic Reactor
1.5 Adsorption and Kinetic Models for Heterogeneous Catalysis
1.5.1 Langmuir Isotherm
1.5.2 Reaction Kinetic Models
1.5.2.1 Langmuir‐Hinshelwood Kinetic Mechanism
1.5.2.2 Mars van Krevelen Kinetic Mechanism
1.5.2.3 Eley‐Rideal Kinetic Mechanism
1.5.3 Empirical Power Rate Law
1.6 Chemical and Physical Steps Occurring during Heterogeneous Catalysis
1.6.1 Mass Transfer Phenomena and Surface Reaction
1.6.2 Catalyst Effectiveness and Concentration Gradients
1.6.3 The Rate Limiting Step
3
1 Catalyst Fundamentals Industrial Catalysis
1.1 Introduction
Chemical reactions occur by breaking chemical bonds of reactants and forming new bonds and
new compounds. Breaking stable bonds requires the absorption of energy while making new bonds
results in the liberation of energy. The combination of these energies results in either an exothermic
reaction in which the conversion of reactants to products liberates energy or an endothermic process in
which the conversion process requires energy. In the former case the energy of the product is lower
than that of the reactants with the difference being the heat liberated. In the latter case the product
energy is greater by the amount that must be added to conserve the total energy of the system. Under
the same reaction conditions the heat of reaction (ΔH) being a thermodynamic function does not
depend on the path or rate by which reactants are converted to products. Similarly the ΔG of the
reaction is not dependent on the reaction path since it too is a thermodynamic state function. This will
be emphasized once we discuss catalytic reactions. The rate of reaction is determined by the slowest
step in a conversion process independent of the energy content of the reactants or products.
1.2 Catalyzed verses non‐catalyzed reactions
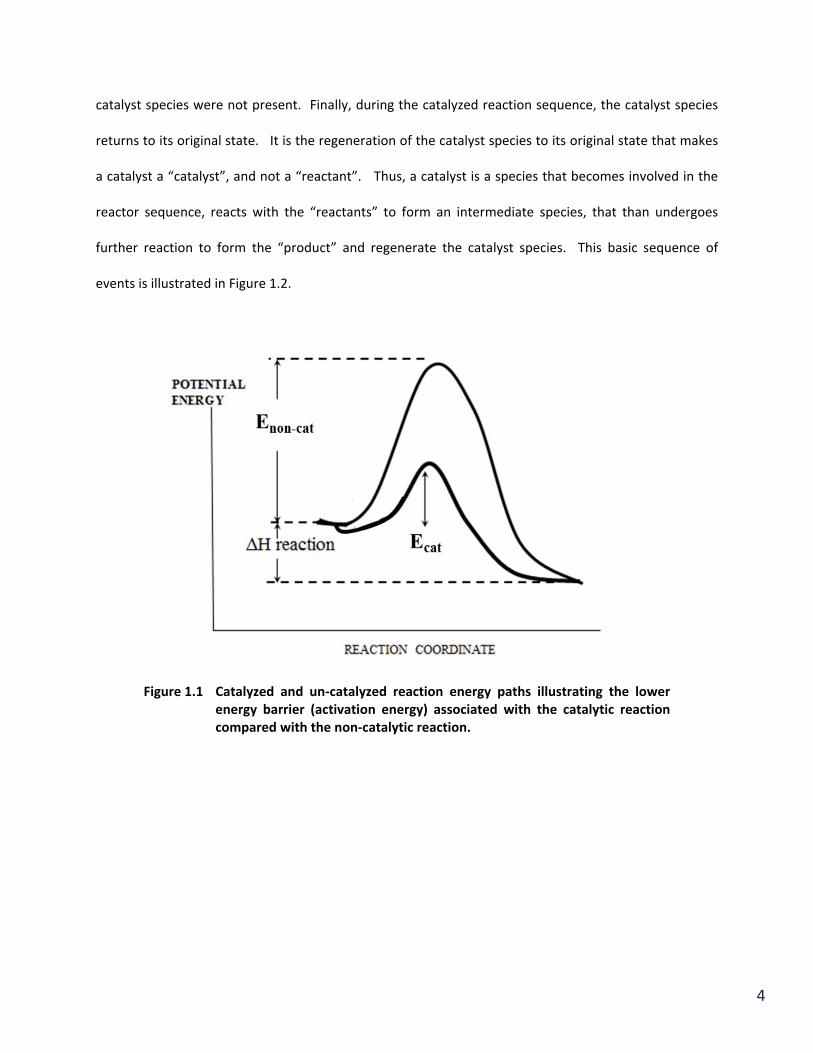
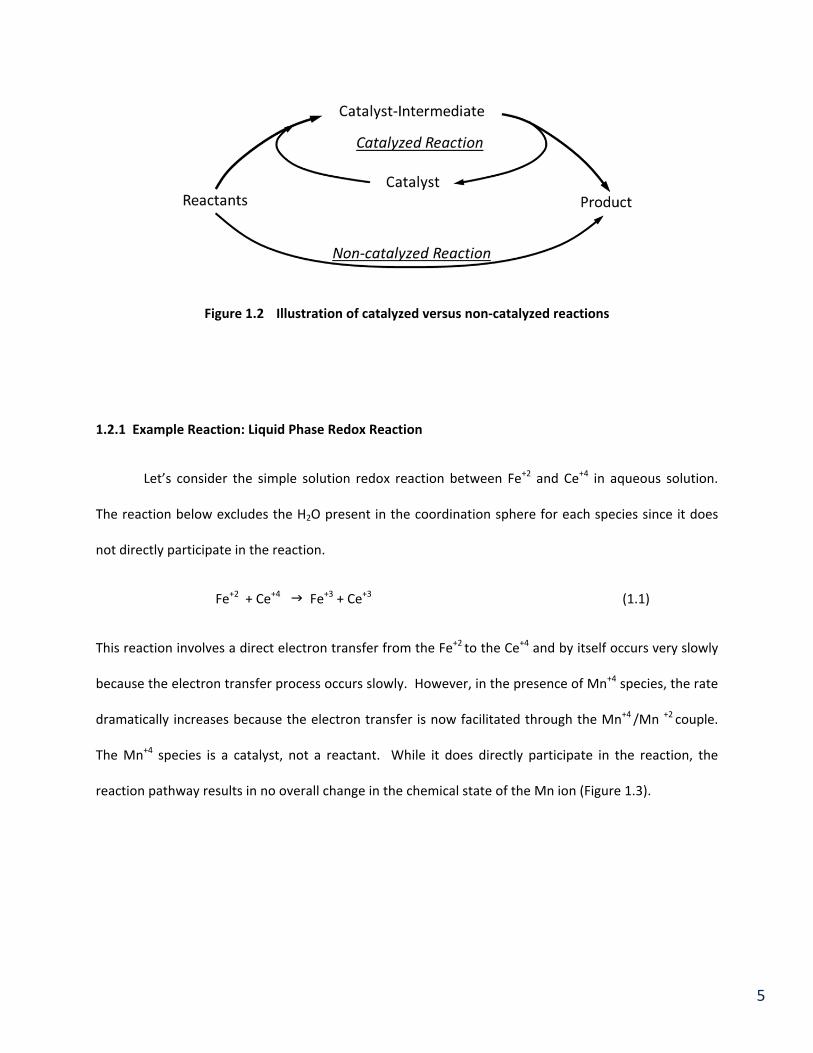
In the most basic sense, the purpose of the catalyst is to provide a reaction pathway or
mechanism that has a lower activation barrier compared to the non‐catalyzed pathway, which is
illustrated in Figure 1.1. In any reaction, catalyzed or non‐catalyzed, the reaction sequence occurs
through a series of elementary steps. In a non‐catalyzed reaction, the species that participate in the
reaction sequence are derived solely from the reactants. In a catalyzed reaction, the catalyst is simply
an additional species that becomes involved in the reaction sequence. More importantly, the
intermediate species involving catalyst species are easier to form (i.e. lower energy barrier) than if the
4
catalyst species were not present. Finally, during the catalyzed reaction sequence, the catalyst species
returns to its original state. It is the regeneration of the catalyst species to its original state that makes
a catalyst a “catalyst”, and not a “reactant”. Thus, a catalyst is a species that becomes involved in the
reactor sequence, reacts with the “reactants” to form an intermediate species, that than undergoes
further reaction to form the “product” and regenerate the catalyst species. This basic sequence of
events is illustrated in Figure 1.2.
Figure 1.1 Catalyzed and un‐catalyzed reaction energy paths illustrating the lower
energy barrier (activation energy) associated with the catalytic reaction compared with the non‐catalytic reaction.
5
Figure 1.2 Illustration of catalyzed versus non‐catalyzed reactions
1.2.1 Example Reaction: Liquid Phase Redox Reaction
Let’s consider the simple solution redox reaction between Fe+2 and Ce+4 in aqueous solution.
The reaction below excludes the H2O present in the coordination sphere for each species since it does
not directly participate in the reaction.
Fe+2 + Ce+4 Fe+3 + Ce+3 (1.1)
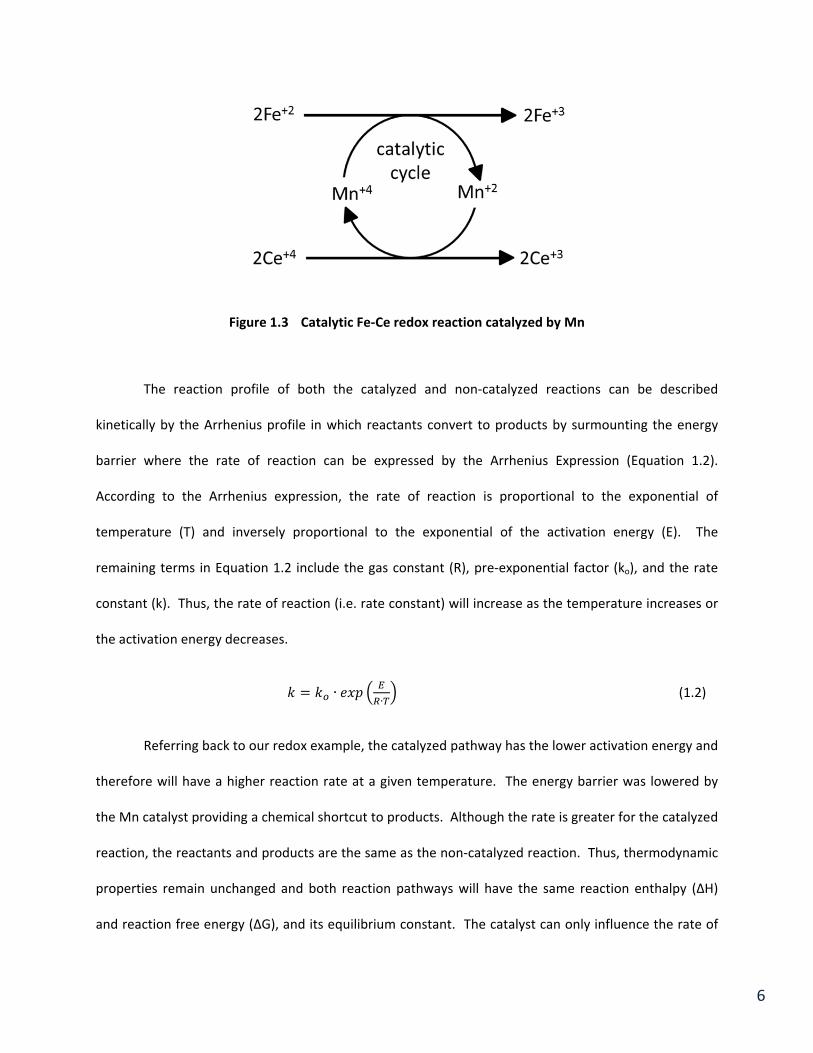
This reaction involves a direct electron transfer from the Fe+2 to the Ce+4 and by itself occurs very slowly
because the electron transfer process occurs slowly. However, in the presence of Mn+4 species, the rate
dramatically increases because the electron transfer is now facilitated through the Mn+4 /Mn +2 couple.
The Mn+4 species is a catalyst, not a reactant. While it does directly participate in the reaction, the
reaction pathway results in no overall change in the chemical state of the Mn ion (Figure 1.3).
6
Figure 1.3 Catalytic Fe‐Ce redox reaction catalyzed by Mn
The reaction profile of both the catalyzed and non‐catalyzed reactions can be described
kinetically by the Arrhenius profile in which reactants convert to products by surmounting the energy
barrier where the rate of reaction can be expressed by the Arrhenius Expression (Equation 1.2).
According to the Arrhenius expression, the rate of reaction is proportional to the exponential of
temperature (T) and inversely proportional to the exponential of the activation energy (E). The
remaining terms in Equation 1.2 include the gas constant (R), pre‐exponential factor (ko), and the rate
constant (k). Thus, the rate of reaction (i.e. rate constant) will increase as the temperature increases or
the activation energy decreases.
∙∙
(1.2)
Referring back to our redox example, the catalyzed pathway has the lower activation energy and
therefore will have a higher reaction rate at a given temperature. The energy barrier was lowered by
the Mn catalyst providing a chemical shortcut to products. Although the rate is greater for the catalyzed
reaction, the reactants and products are the same as the non‐catalyzed reaction. Thus, thermodynamic
properties remain unchanged and both reaction pathways will have the same reaction enthalpy (ΔH)
and reaction free energy (ΔG), and its equilibrium constant. The catalyst can only influence the rate of
7
which reactants are converted to products in accordance to the equilibrium constant and cannot make
thermodynamically unfavorable reactions occur. In industrial practice reactions conditions, such as
temperature, pressure and reactant compositions are varied to bring the equilibrium to a desirable
value to permit the reaction to occur.
1.2.2 Example Reaction: Gas Phase Oxidation Reaction
Now we will consider the conversion of carbon monoxide (CO), a known human poison, to CO2,
a reaction of great importance to the quality of air we breathe daily. The overall rate of the non‐catalytic
reaction is controlled by the dissociation of the O2 molecule to O atoms (rate limiting step) which rapidly
reacts with CO forming CO2. The temperature required to initiate the dissociation of O2 is greater than
700oC and once provided the reaction rapidly goes to completion with a net liberation of energy (the
heat of reaction is exothermic). The requirement to bring about the O2 dissociation and ultimately the
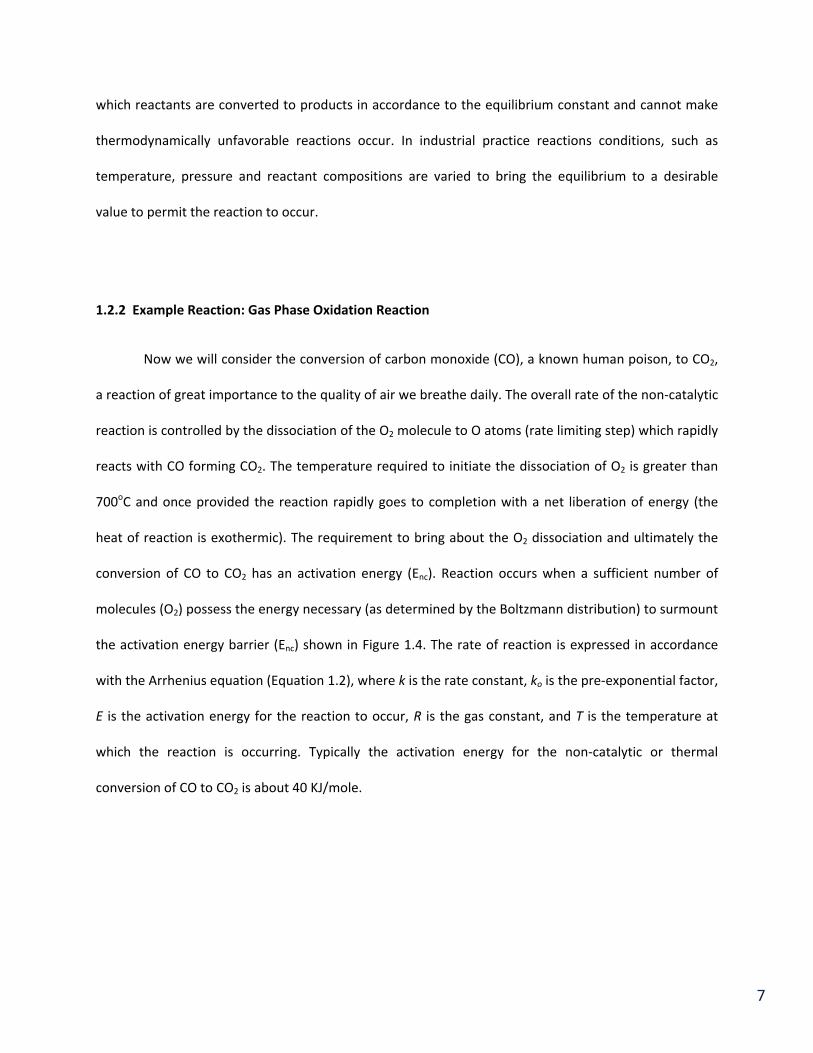
conversion of CO to CO2 has an activation energy (Enc). Reaction occurs when a sufficient number of
molecules (O2) possess the energy necessary (as determined by the Boltzmann distribution) to surmount
the activation energy barrier (Enc) shown in Figure 1.4. The rate of reaction is expressed in accordance
with the Arrhenius equation (Equation 1.2), where k is the rate constant, ko is the pre‐exponential factor,
E is the activation energy for the reaction to occur, R is the gas constant, and T is the temperature at
which the reaction is occurring. Typically the activation energy for the non‐catalytic or thermal
conversion of CO to CO2 is about 40 KJ/mole.
8
Figure 1.4 Activation energy diagram for a) thermal reaction of CO and O2 and b) the same reaction in the presence of Pt. Activation energy for the non‐catalyzed reaction is Enc. The Pt catalyzed reaction activation energy is designated Ec. Note that heat of reaction ΔH is the same for both reactions.
Let us now discuss the effect of passing the same gaseous reactants, CO and O2, through a
reactor containing a solid catalyst. Since the process is now carried out in two separate phases the term
heterogeneous catalytic reaction is used. In the presence of a catalyst such as Pt, the O2 and CO
molecules adsorb on separate sites in a process called chemisorption in which a chemical partial bond is
formed between reactants and the catalyst surface. Dissociation of chemisorbed O2 molecules to
chemisorbed O atoms is very rapid occurring essentially at room temperature. Highly reactive adsorbed
O atoms react with chemisorbed CO on adjacent Pt sites producing CO2 which desorbs from the Pt site
completing the reaction and freeing the catalytic site for another cycle. The presence of the Pt catalyst
greatly facilitates the dissociation of oxygen, which was the slow energy intensive step associated with
the gas phase oxidation of CO. Thus the activation energy for the Pt catalyzed reaction (Ec), shown in
Figure 1.4 (b), is considerably smaller than that for the non‐catalyzed reaction, enhancing the conversion
9
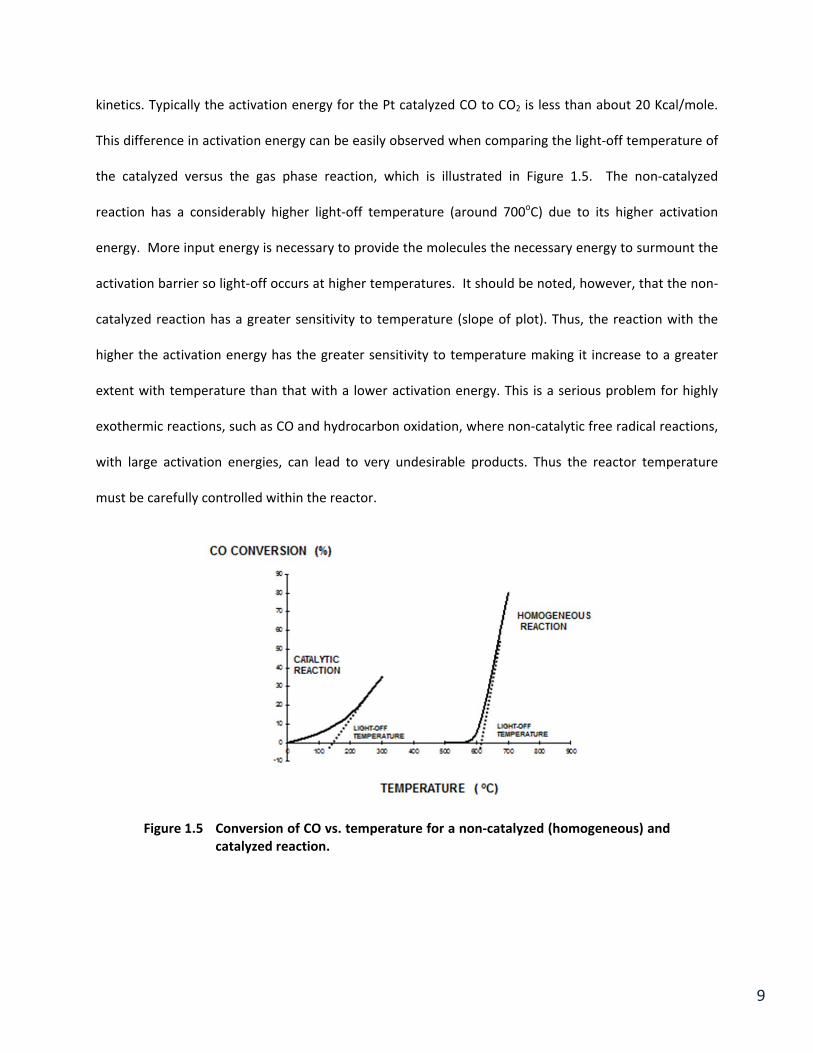
kinetics. Typically the activation energy for the Pt catalyzed CO to CO2 is less than about 20 Kcal/mole.
This difference in activation energy can be easily observed when comparing the light‐off temperature of
the catalyzed versus the gas phase reaction, which is illustrated in Figure 1.5. The non‐catalyzed
reaction has a considerably higher light‐off temperature (around 700oC) due to its higher activation
energy. More input energy is necessary to provide the molecules the necessary energy to surmount the
activation barrier so light‐off occurs at higher temperatures. It should be noted, however, that the non‐
catalyzed reaction has a greater sensitivity to temperature (slope of plot). Thus, the reaction with the
higher the activation energy has the greater sensitivity to temperature making it increase to a greater
extent with temperature than that with a lower activation energy. This is a serious problem for highly
exothermic reactions, such as CO and hydrocarbon oxidation, where non‐catalytic free radical reactions,
with large activation energies, can lead to very undesirable products. Thus the reactor temperature
must be carefully controlled within the reactor.
Figure 1.5 Conversion of CO vs. temperature for a non‐catalyzed (homogeneous) and catalyzed reaction.
10
Equations relating reaction rates to activation energies will be discussed in considerable detail in
Chapter 4 but for now it is sufficient to understand that a relationship exists between the activation
energy and reaction rate.
Relative to one that is not catalyzed, kinetic rate studies indicate that the rate limiting step is the
reaction of chemisorbed CO with chemisorbed O atoms on adjacent Pt sites. The reaction occurs around
100oC far below the 700oC required for the non‐catalytic process described above. Thus the catalyst
provides a new reaction pathway in which the rate limiting step is altered from one of high temperature
dissociation of O2 to that of the reaction between two adsorbed moieties on adjacent Pt sites at a
significantly lower temperature. This shows the great importance of catalysis in enhancing rates of
reaction allowing them to occur at moderate temperatures as indicated in this example. Lower
operating temperature translate to energy savings, less expensive reactor materials of construction,
preferred product distributions with greater rates of production with smaller size reactors. For this
reason catalysts are commonly used in many industrial applications ranging from petroleum processing,
chemical and energy synthesis and environmental emission control (Bartholomew and Farrauto 2006).
Inspection of Figure 1.4 (b) indicates an energy decrease associated with the adsorption of CO
and O2 on the Pt surface (Δ Ha) due to its exothermic nature. This is a consequence of the decreased
entropy (ΔS) when the molecules are confined in an adsorbed state with the commensurate loss in a
degree of freedom. Since ΔGa must be negative and ‐TΔSa is positive ΔHa must be negative in accordance
with ΔGa = ΔHa – TΔ Sa. Desorption is always endothermic.
Non‐catalyzed reactions have much higher activation energies and therefore conversion is
initiated by at much higher temperatures by a different mechanism. This is clear from Figure 1.5 that
shows the higher temperature required for the homogeneous or non‐catalytic reactions. Also the slope
11
of this reaction is much larger than that of the catalyzed reaction. This clearly illustrates the value of a
catalyst from the energy point of view.
1.2.3 Homogeneous versus Heterogeneous Catalysis
In the past two sections, we presented two examples of catalysis. The first involved a redox
reaction between ions of Fe and Ce in the presence of Mn ions. In this example, the catalyst and
reactants were in the same phase. When the catalyst and reactants exist in the same phase, the catalyst
is classified as a homogeneous catalyst. Most often in homogeneous catalysis, the catalyst is codisolved
into a solvent with the reactants, which in this example the solvent is water. In our redox example, the
homogeneous catalyst was a simple Mn ion. However, homogenous catalysts can include a wide variety
of complex molecules such as metal‐ligand complexes, organometallic complexes, and enzymes.
Homogeneous catalysts are typically limited to mild reaction conditions, however where they can be
used, they can offer many advantages such as the absence of diffusion limitations and high effectiveness
of catalytic materials. One significant issue associated with homogeneous catalysis is separating the
catalyst from the reaction species, which typically requires significant additional processing steps
downstream of the catalytic reactor. Over the last five decades, the application of homogeneous
catalysis has grown greatly and has a significant potential for the future. Homogeneous catalysis will be
discussed in depth in Chapter X.
When the catalyst and reaction species exist in different phases, this catalyst is classified as a
heterogeneous catalyst. Heterogeneous catalysts were the first to be used commercially and have
dominated industrial practice for over a century. For pollution abatement in automobiles and factories,
heterogeneous catalysis is exclusively used. For these reasons, this book focuses on heterogeneous
catalysis. The platinum catalyst used in our CO oxidation example is considered a heterogeneous
catalyst. In this case, the CO molecules diffuse from the gas phase and adsorb onto the solid platinum
12
surface where chemical reaction can occur. Unlike the homogeneous catalyst that is well dispersed
into the reaction mixture, heterogeneous catalyst can only occur on the solid surfaces exposed to the
gas or liquid phase containing the reactants. Thus, the surface area of exposed catalyst becomes a
critical important. In the case of precious metal catalyst, such as our Pt oxidation catalyst, the platinum
is dispersed into a high surface area solid to maximize the exposed surface area. Dispersion is one issue
associated with heterogeneous catalysis. Another issue is the presence of diffusion limitations. To
diffuse from the bulk gas stream to the surface of the catalyst, the CO molecule must diffuse through
the thin boundary layer surrounding catalyst particle and diffuse through the pore structure of the
catalyst particle itself. In some cases, the rate of diffusion can be actually slower than the rate of
reaction. The physical processes occurring during heterogeneous catalysis and the concept of the rate
limiting step will be reviewed in more detail later in this chapter.
1.3 Selectivity and Catalytic Reactions
The selectivity of a reaction is generally defined as the ratio of the amount of desired product
formed to the amount of undesired product formed in a reaction. Mathematically, this ratio can be
expressed in many different terms, which is given in Equation 1.3.
(1.3)
The catalyst has the potential to greatly influence selectivity by preferentially lowering the activation
energy for a particular step in the reaction sequence and increasing the rate at which this step proceeds.
For the same reactants at the same conditions, different catalysts will influence the rate of different
reactions that are possible. Thus, the catalyst can greatly influence reaction selectivity. By choosing the
proper catalyst the selectivity towards the desired product can be enhanced even if other products are
more thermodynamically favored. For example, consider the oxidation of ammonia for the production
13
of nitric acid (Chapter X). Two ammonia oxidation reactions are possible, which are given in Equation
1.4 and 1.5. For the production of nitric acid, it is the formation of NO that is the desired reaction. From
a thermodynamic perspective, the equilibrium constant for the N2 forming reaction is four orders of
magnitude greater than the NO forming reaction, which means the formation of N2 is greatly favored
thermodynamically. However, when this reaction occurs in the presence of a Pt‐Rh catalyst, the
formation of NO greatly exceeds that of N2. Thus, the Pt‐Rh catalyst greatly favors the reaction
sequence to form NO and selectively enhances the rate of this reaction over the formation of N2.
4 NH3 + 5 O2 4 NO + 6 H2O (1.4)
4 NH3 + 3 O2 2 N2 + 6 H2O (1.5)
Another example of a catalyst influencing product selectivity is the oxidation of ethylene.
Consider the comparison between the products produced when Pt is used as a catalyst as opposed to
oxides of vanadium for the oxidation of ethylene. In the case of Pt, the carbon in the ethylene is
completely oxidized to CO2 with a selectivity of 100%.
Pt C2H4 + 3O2 ‐‐‐‐‐‐‐‐‐‐‐‐‐‐‐‐> 2CO2 + 2H2O (1.6)
However, the V2O5 catalyst favors the selective oxidation on only one carbon in the ethylene yielding an
aldehyde because this reaction pathway with this catalyst has the lowest activation energy compared to
the complete combustion to CO2 and H2O.
V2O5 C2H4 + 1/2O2 ‐‐‐‐‐‐‐‐‐‐‐‐‐‐‐‐‐> CH3CH=O (1.7)
For Pt the reaction products are exclusively CO2 and H2O thus selectivity is essentially 100% making it a
good catalyst for pollution abatement. While for V2O5 the selectivity is about 80‐90% towards the
14
aldehyde with the balance 20‐10% being CO2 and H2O. Clearly V2O5 would not be desirable for
conversion of hydrocarbons such as ethylene to harmless CO2 and H2O but is used commercially for
selective partial oxidation reactions to desirable chemicals. So it is the function of the catalyst with
optimum reaction conditions to reduce the activation energy of the path that will yield the most
desirable product. The ability to 1) enhance reaction rates and 2) direct reactants to specific products
makes catalysis extremely important in the environmental, petroleum, and chemical industries.
An important reaction in the automotive catalytic converter is the reduction of NO by H2 during
a specific driving mode that will be discussed later in the automobile converter chapter. Two parallel
reaction pathways are possible one desirable leading to N2 formation and the other undesirable
producing toxic NH3.
Rh 2H2 + 2NO ‐‐‐‐‐‐‐‐‐‐‐‐‐ > N2 + 2H2O (1.8)
Pt 5 H2 + 2NO ‐‐‐‐‐‐‐‐‐‐‐‐‐‐ > 2NH3 + 2H2O (1.9)
Clearly Rh is more selective and dominates the NO to N2 pathway with a rate considerable
higher than that undesired pathway leading to NH3 formation when Pt is used.
The reaction conditions also have a pronounced effect on product distribution
depending on activation energies for all possible reactions. For example NO (component of acid
rain and a contributor to ozone formation) emitted from automobile engines and power plant
exhausts can be reduced using a V2O5‐containing catalyst with high selectivity provided the
temperature is maintained between 250‐300oC.
15
250‐300oC 2NH3 + NO +O2 ‐‐‐‐‐‐‐‐‐‐‐‐‐‐‐‐‐‐ > 3/2N2 + 3H2O (1.10)
> 300oC 2NH3 + NO + 5/2O2 ‐‐‐‐‐‐‐‐‐‐‐‐‐‐‐‐‐ > 3NO + 3H2O (1.11)
Ammonia also decomposes to N2 above 300oC and thus is not available to reduce the NO
> 300oC 2NH3 + 3/2O2 ‐‐‐‐‐‐‐‐‐‐‐‐‐‐‐‐‐‐‐ > N2 + 3H2O (1.12)
The desired reaction is favored below 300oC since it has the lowest activation energy of the
other two reactions. Once the temperature exceeds 300oC the reactions with the higher
activation energy (greater temperature sensitivity) become favored and mixed products form.
Examples of Selectivity calculations for reactions with multiple products
General equation for selectivity
xA + x/2 B → yC
Selectivity of C = (moles of C produced) (x/y) x 100 (moles of A consumed)
2NO + 2H2 → N2 + 3H2O
( 1mole) (0.3 moles)
↓ (not balanced) 2NH3 (0.4 moles)
Selectivity to N2 = (moles of N2 formed) (2) x 100 = (0.3 moles N2) 2 x 100 = 60% (moles of NO converted) (I mole of NO consumed)
Selectivity to NH3 = (moles of NH3 formed) x 100 = (0.4 moles NH3 x 100 = 40% (moles of NO consumed) (1 mole NO consumed)
16
Carbon balance = (Sum of C atoms in all products*) x 100 = Should be close to close to 100% (Sum of C Atoms in all reactants)
= includes unreacted reactants
1.4 Physical Structure of a Heterogeneous Catalyst
All heterogeneous catalysts are solid substances that can be classified into two general
categories: unsupported or supported. Most heterogeneous catalysts fall under the “supported”
category, where the active material is dispersed into a carrier (i.e. support). The primary function of the
carrier is to maintain the dispersion of the active phase. As an example of supported and unsupported
catalysts, consider the process for ammonia synthesis (Equation 1.13) where both supported and
unsupported catalysts are used. One catalyst used for this reaction is unsupported iron oxide. In the
preparation of this catalyst, the iron oxide is melted with small amounts of other additives, then poured
into water to form small particles of the iron oxide catalyst. Thus, the bulk of the catalyst structure is
comprised of a porous iron oxide. Another catalyst used for this reaction is ruthenium supported on a
high surface area carbon carrier. In the preparation of this catalyst, a small amount of ruthenium is
dispersed into the carbon carrier. Thus, the bulk of the catalyst is comprised of carbon with small
“islands” of well‐dispersed ruthenium. Both types of catalyst structures are widely used and the optimal
catalyst structure if often a function of several variables include the nature of the active species, catalyst
manufacturing cost, the desired catalyst form to be used in the industrial process.
3 H2 + N2 2 NH3 (1.13)
Whether supported or unsupported, the catalyst will be comprised on two basic components: active
species and promoters. In the case of the supported catalyst, a carrier material is also present. The
17
species which adsorbs the gas phase reactant and on which the surface reaction occurs is called the
active species. Within the active species, the specific atomic location where adsorption and reaction
occurs is called the active site. It is on the active site where the short lived reaction intermediates form
on the catalyst surface, which are called the active center. Beyond the active species, there are often
other species incorporated into the catalyst structure, called promoters, that either improves the activity
of the active species by positively participating in the surface reaction sequence (chemical promoter) or
helps maintain the catalyst activity over time by stabilizing the catalyst structure (textural promoter).
1.4.1 Active Catalytic Species
Group VIIIB metals and their oxides such as Fe, Co, Ni are catalytic as are Cu and Ag (Group 1b) ,
V (Group Vb) and Cr and Mo (Group V1b) and in specific combinations are mainly used in the chemical
and petroleum industries. These are referred to as base metals (oxides). Precious metals such as Pt, Pd,
Ru and Rh are also in Group VIII are very commonly used broadly in all industries. Ironically the
precious metals are also referred to as the noble metals for their resistance to oxidation, various poisons
and high temperatures yet they are some of the most catalytically active elements in nature due to their
ability to chemisorb and convert adsorbed species with high rates. They are rare, very expensive and
thus when no longer performing satisfactorily they are recycled, purified and reused. They are primarily
mined in South Africa and Russia with small deposits in Canada and the US. In most cases both base
and precious metals (or their oxides) are deposited on high surface area carriers in order to maximize
their accessible catalytic sites.
It should be understood that often the active catalytic component is not always present in its
native elemental state but may be present as an oxide. For the oxidation of many hydrocarbons Pd is
18
most catalytically active as PdO while for the hydrogenation reactions Ni, Cu, Pd metal are most active.
Vanadium pentoxide (V2O5) is an active catalyst for oxidizing SO2 to SO3 in the manufacture of sulfuric
acid. In contrast Ni metal is active for hydrogenation reactions.
Throughout this book you will see the breath of applications for all of these metal and their oxides as
catalysts that enhance activity and selectivity.
1.4.2 Chemical and Textural Promoters
The main catalytic component dominates the activity and the selectivity but oxides or metal promoters,
that may or may not be catalytic for the reaction of interest, can promote the activity or further enhance
one reaction over another. Promoters are generally classified as two types: chemical promoters and
textural (structural) promoters. In the case of the chemical promoter, the material facilitates the
surface reaction. In the case of the textural promoter, the material stabilizes the metal dispersion or the
structure of the carrier, which prevents or slows catalyst deactivation over time. There are many
examples for a wide variety of petroleum, chemical, environmental and alternative energy processes we
will discuss in subsequent chapters but just to give a preview here are some examples. The addition of
CeO2 to a precious metal catalyst such as Pt or Pd in the automotive catalyst promotes the oxidation of
hydrocarbons and carbon monoxide decreasing the minimum temperature needed to initiate catalytic
oxidation during the cold start portion of the automobile cycle requirement. Adding Cl to a naphtha
reforming catalyst PtRe/Al2O3 used to make high octane gasoline enhances the acidity of the catalyst
and catalyzes isomerization reactions generating branched hydrocarbons with high octane. The addition
of sulfur to a hydro desulfurization catalysts (Co, Mo/Al2O3) diminishes over activity leading to
undesired gaseous products during the desulfurization of crude oils. The addition of alkali (K2O) to a
19
Ni/Al2O3 steam reforming catalyst decreases acidity and promotes steam gasification minimizing carbon
formation. One more example will be instructive in demonstrating the important role of small amounts
of promoters in altering catalyst selectivity. In the generation of fuel cell quality H2 the gas stream is
enriched in H2 by promoting the oxidation of CO by water in the water gas shift reaction using a Pt‐
containing catalyst. For a Pt only catalyst appreciable amounts of undesired methane are formed during
the reaction at 300oC. The addition of 5‐10% ZnO to the catalyst suppresses the methanation reaction
and avoids the consumption of H2 and the large exotherm associated with the reaction (Korotkikh et al
2003).
CO + H2O ‐‐‐‐ > H2 + CO2 (1.14)
CO + 3 H2 ‐‐‐‐ > CH4 + H2O (1.15)
1.4.3 Carrier Materials
In most industrial reactions, the number of reactant molecules converted to products in a given time is
directly related to the number of catalytic sites available to the reactants. It is, therefore, common
practice to maximize the number of active sites by dispersing the catalytic components onto a porous
material . Maximizing the surface area of the catalytic components, such as Pt, Fe, Ni, Rh, Pd, CuO, PdO,
CoO, and so forth increases the number of sites upon which chemisorption and catalytic reaction can
occur. The catalytic components are introduced into the carrier by impregnation from aqueous solutions.
ts on a high surface area carrier, such as Al2O3, SiO2, TiO2, SiO2‐Al2O3, zeolites, CeO2, etc. In most cases
carriers themselves are not catalytically active for the specific reaction in question, but do play a major
role in promoting the activity, selectivity and maintaining the overall stability and durability of the
finished catalyst. Such is the case in the hydrogenation of organic functional groups where high surface
area carbons are used as carriers for precious metals and Ni. In these cases the carrier plays a role in
20
activity and selectivity by adsorbing the organic compound prior to hydrogenation by the metallic
catalytic component. For now when we speak of the catalyst it is understood to be composed of
catalytic components dispersed on high surface area porous carriers. Exceptions to this broad definition
will be discussed in the application section.
1.4.4 Structure of the Catalyst and Catalytic Reactor
In chemical and petroleum applications many different catalyst structures can be used. The structure
depends on a number of factors such as volume of product to be produced, addition or withdrawal of
heat, thermodynamic equilibrium, need for frequent regenerations, life etc. The rationale for each
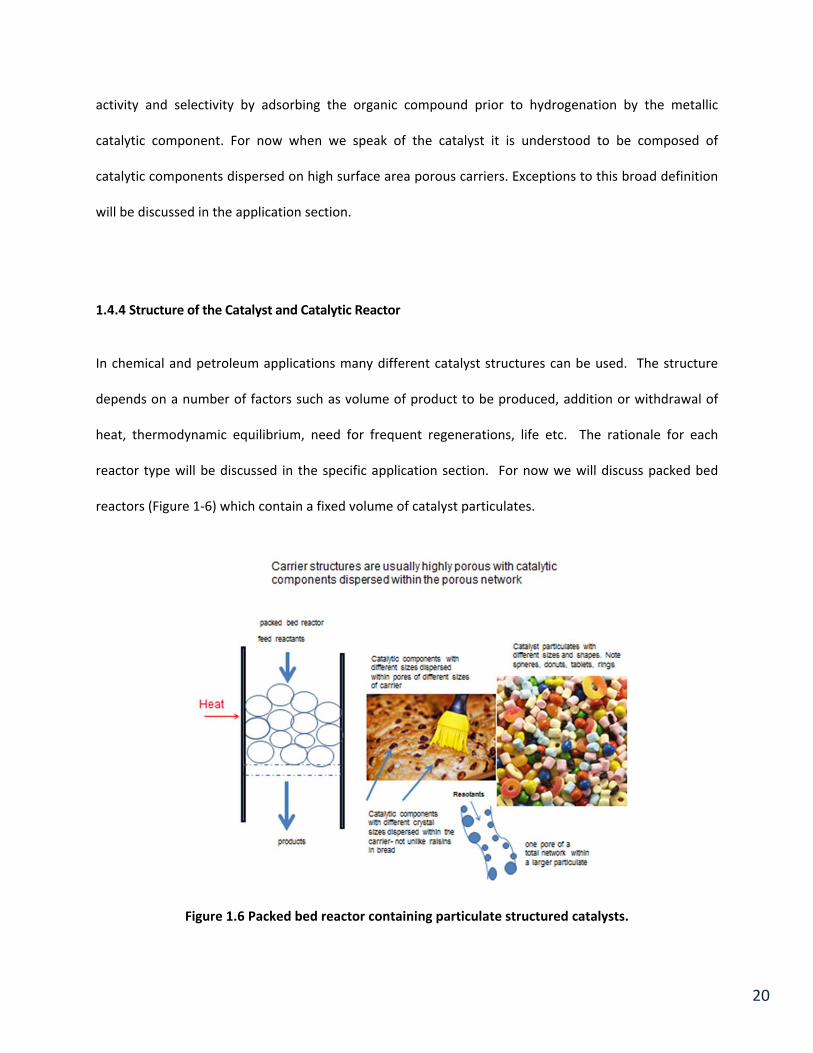
reactor type will be discussed in the specific application section. For now we will discuss packed bed
reactors (Figure 1‐6) which contain a fixed volume of catalyst particulates.
Figure 1.6 Packed bed reactor containing particulate structured catalysts.
21
The catalyst is present in a pre‐shaped particulate containing the catalytic component dispersed on the
carrier. The size and shape of the catalyst depends on the nature of flow, permitted pressure drop,
requirement for heat management (exothermic or endothermic reactions), mechanical strength, etc.
Spherical and tablet shapes 3‐10 mm are commonly used. The proper flow of inlet reactant gas is
established by individually controlled mass flow meters. The mixed reactants are continuously
preheated and the conversion of reactants and appearance of products observed using analytical
instrumentation such as a gas chromatograph or other suitable equipment calibrated for specific for
reactants and products amounts. The inlet, mid‐bed and outlet temperatures are commonly measured
using thermocouples.
The preparation and properties of these materials and their influence on catalytic reactions will
be discussed in Chapter 2, but, for now, γ‐Al2O3 (the most commonly used carrier in catalysis especially
for chemical and petroleum applications) will be used to develop a model of a heterogeneous catalyst.
The pores of γ‐Al2O3 the carrier are typically 2‐10 nm in diameter but irregularly shaped. The simplistic
drawing shown in Figure 1‐6 has circular catalytic components dispersed on the walls similar to raisin in
a cake. The physical surface area of the carrier is the sum of all internal areas of the oxide from all the
walls of each and every pore. It is upon these internal walls that the catalytic components are bound.
The catalytic surface area is the sum of all the areas of the active catalytic components in this example.
The smaller the individual size of the active catalytic material (higher catalytic surface area), the more
sites are available for the reactants to interact. As a rough approximation, one assumes the higher the
catalytic surface area, the higher the rate of reaction for a process controlled by kinetics. This is often
the case but there are exceptions in which a particular reaction is said to be structurally sensitive and
the rate is a maximum when interacting with a catalytic crystal size of a specific size range.
22
This procedure maximizes the catalytic area but also introduces other physical processes such as
mass transfer of the reactants to the catalytic sites. Each of these processes has a rate influenced by the
hydrodynamics of the fluid flow, the pore size and structure of the carrier, and the molecular
dimensions of the diffusing molecule (Farrauto and Bartholomew 2006, Morbidelli et al.2001). These are
discussed below.
1.5 Adsorption and Kinetic Models for Heterogeneous Catalysis
In heterogeneous catalysis, the initiating and terminating steps for the surface reaction involves
the adsorption of the reactant onto and the desorption of the product from the surface. In chemical
terms, adsorption is the formation of chemical bonds between the adsorbing species (adsorbate) and
the adsorbing surface (adsorbent). In general, there are two kinds of adsorptions, chemical and physical,
typically referred to as chemisorption and physisorption. Physisorption is the relatively weak,
nonselective condensation of gaseous molecules on a solid at relatively low temperatures. In contrast,
chemisorption is the relatively strong, selective adsorption of chemically reactive gases on available sites
of metal or metal oxide surfaces. In chemisorption, the adsorbent‐adsorbate interaction involves the
formation of chemical bonds and heats of reaction on the order of 50‐300 kJ/mol. It is the formation of
these strong bonds that alters the chemical nature of the adsorbate, making the newly formed structure
more reactive and more easily transformed than the gaseous molecule.
The maximum number of reactant molecules adsorbed onto a unit area of catalyst surface will
be the number of available catalytic sites per unit area. In the case where all catalytic sites are covered
with an adsorbate molecule, the surface is said to be saturated and the fractional site coverage () is
23
unity. Adsorption and desorption is continuously occurring even when the net number of adsorbed
species reaches a steady state. Thus, an equilibrium coverage is established, where the fractional
coverage at equilibrium is a function of temperature, adsorbate partial pressure, and the chemical
nature of the adsorbate.
In heterogeneous catalysis, it is essential to know the amount of reactants that adsorb onto a
given area of catalyst surface. The quantity of adsorbed species is generally characterized by an
isotherm, which is a mathematical relationship between fractional site coverage () and temperature.
The rate of reaction on the catalyst surface is going to be a function of the surface concentration of
reactants, not necessarily the gas phase reactant concentrations. However, we can only measure the
gas phase concentration of the reactant. Thus, the isotherm provides us with the link between the gas
phase concentration (measurable) and the surface concentration (immeasurable).
1.5.1 Langmuir Isotherm:
There are many different isotherm forms, but the Langmuir isotherm is the simplest and most
widely used form that is applicable to many reactions. The Langmuir isotherm is based on the key
assumption that all sites on the adsorbent surface are of equal energies. It also assumes the rate
limiting step is the surface reaction between adsorbed species with all others fast and in equilibrium. In
spite of this ideal view its application yields reasonable predictions.
Consider the example reaction presented earlier where CO is oxidized on a platinum catalyst. In
this reaction, CO and O2 must adsorb onto the platinum surface for reaction to occur. Further, the O2‐Pt
must dissociate to form two Pt‐O species. We can use the Langmuir isotherm to predict the surface
24
concentration of each reactant and how the surface concentrations will vary with reaction conditions.
We first consider the strong adsorption of CO in equilibrium with the surface of Pt.
CO + Pt ↔ CO ‐ ‐ ‐ Pt (1.16)
The forward rate of Equation 1.16 (CO adsorption) is given by
(Rate)fCO = kfCO PCO (1 ‐ θCO) (1.17)
kfCO = the forward rate constant of CO adsorption on Pt, PCO = the partial pressure of CO and θCO =the
fraction of the surface of Pt covered by CO. The term (1‐θCO) is the fractional number of sites available
for additional CO adsorption on the Pt surface. The isotherm also assumes each site is occupied by only
one adsorbate molecule and full coverage is a monolayer.
The rate or reverse of Equation 1.16 (CO desorption) is given by
(Rate)dCO = kdCO θCO (1.18)
At equilibrium the forward and desorption rates are equal and the ratio of the forward rate to reverse
rate is defined as the adsorption equilibrium constant (Equation 1.19)
kfCO/kdCO = KCO (1.19)
kfCO PCO (1 ‐ θCO) = kdCO θCO (1.20)
θCO = KCOPCO / (1 + KCO PCO) (1.21)
Thus, Equation 1.10 provides the surface concentration of adsorbed CO as a function of CO partial
pressure and the adsorption equilibrium constant. The adsorption equilibrium constant captures the
25
influence of temperature and chemical nature of the adsorbate since the forward and reverse rate
constants are a function of these parameters. Plotting Equation (1.10) generates Figure 1‐7
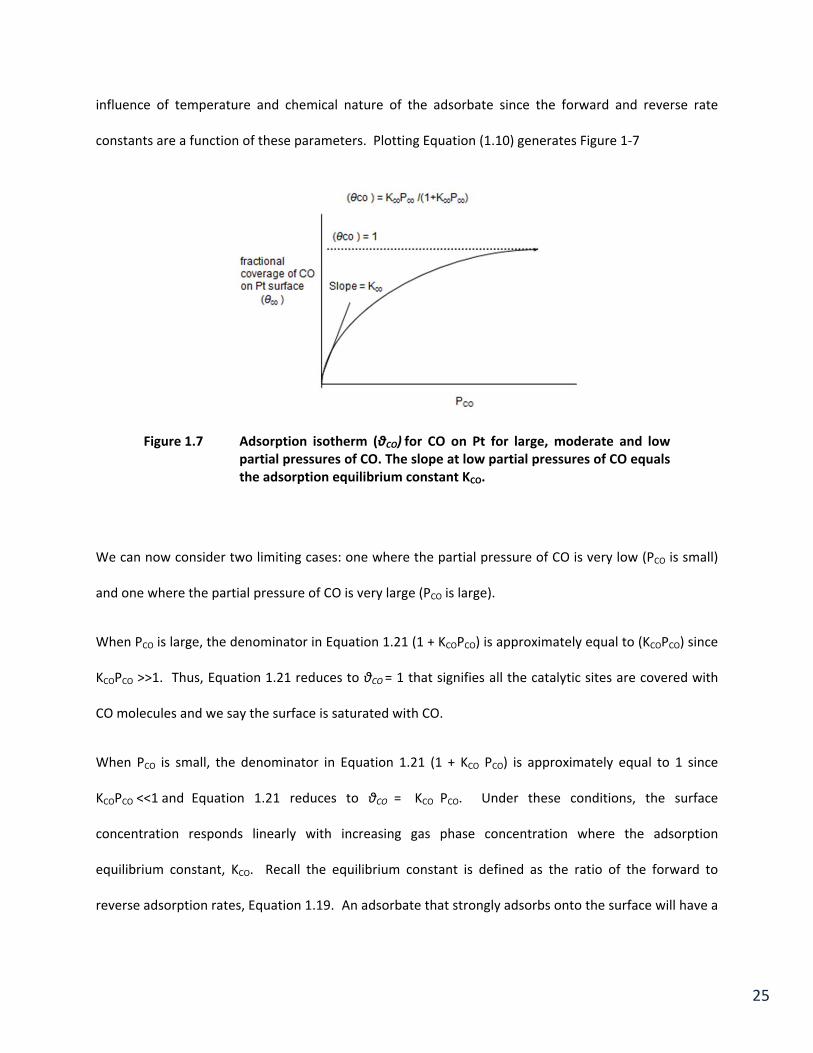
Figure 1.7 Adsorption isotherm (θCO) for CO on Pt for large, moderate and low partial pressures of CO. The slope at low partial pressures of CO equals the adsorption equilibrium constant KCO.
We can now consider two limiting cases: one where the partial pressure of CO is very low (PCO is small)
and one where the partial pressure of CO is very large (PCO is large).
When PCO is large, the denominator in Equation 1.21 (1 + KCOPCO) is approximately equal to (KCOPCO) since
KCOPCO >>1. Thus, Equation 1.21 reduces to θCO = 1 that signifies all the catalytic sites are covered with
CO molecules and we say the surface is saturated with CO.
When PCO is small, the denominator in Equation 1.21 (1 + KCO PCO) is approximately equal to 1 since
KCOPCO <<1 and Equation 1.21 reduces to θCO = KCO PCO. Under these conditions, the surface
concentration responds linearly with increasing gas phase concentration where the adsorption
equilibrium constant, KCO. Recall the equilibrium constant is defined as the ratio of the forward to
reverse adsorption rates, Equation 1.19. An adsorbate that strongly adsorbs onto the surface will have a
26
relatively large equilibrium constant and surface coverage will increase rapidly with increasing gas
partial pressure. This is the case for CO on Pt, which is illustrated in Figure 1‐4 as the steeply sloped
trace at low PCO.
At moderate values of PCO, Equation 1.21 applies as written with the curve becomes more shallow as PCO
increases.
The isotherm for dissociative chemisorption of O2 on Pt is similarly generated where θO refers to
the fractional coverage by O atoms consistent with the stoichiometry for CO oxidation of one O atom for
each CO.
O2 + Pt ↔ 2O ‐ ‐ ‐ Pt (1.22)
The rate of the forward (adsorption of O2 on Pt)
(Rate)fO2 = kfO2 PO2 (1 ‐ θO)2 (1.23)
The rate of the reverse reaction (O desorption from Pt) is
(Rate)dO2 = kdO2 θO2 (1.24)
The square term for both the forward and reverse rates is due to the lower probability that two adjacent
Pt sites will be available to accommodate two oxygen atoms resulting from the dissociative
chemisorption of O2 on Pt. Similarly two adsorbed O atoms on Pt must be adjacent for desorption and
recombination of diatomic O2 to occur. Also the adsorption equilibrium constant (KO2) for O2 on Pt is
kfO2/ kdO2.
Equating forward and reverse rates
kfO2 PO2 (1 ‐ θO)2 = kdO2 θO2 (1.25)
27
θO = KO21/2 PO2
1/2 / (1 + KO2 PO2)1/2 (1.26)
Plotting the fractional coverage of oxygen atoms verses PO21/2 generates a similar plot as Figure 1.5 but
the slope at low PO2 = KO2 ½ . At high PO2
and θO = 1.
The isotherm provides us with the relationship for reactant surface concentration as a function of
reaction conditions (i.e. temperature and reactant partial pressure). The next step is to use this
information to estimate the rate of chemical reaction occurring on the catalyst surface. For this, we
need to make some
1.5.2 Reaction Kinetic Models
The isotherm provides us with the relationship for reactant surface concentration as a function
of reaction conditions (i.e. temperature and reactant partial pressure). The next step is to use this
information to estimate the rate of chemical reaction occurring on the catalyst surface. To develop an
expression for reaction rate, we need to know or assume a mechanism for the surface reaction.
Specifically, the mechanism considers which reactants adsorb onto the surface and on which active
species do they adsorb? While anything is possible, three general mechanism are used to describe
adsorption and reaction in heterogeneous catalysis:
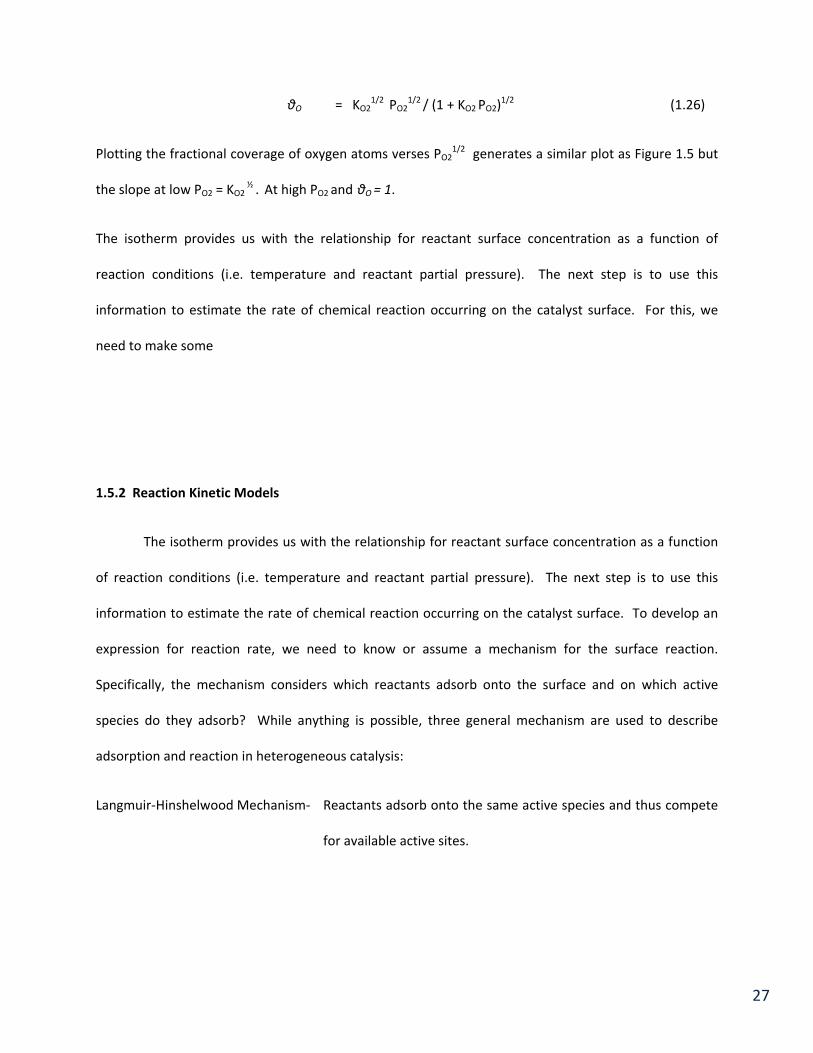
Langmuir‐Hinshelwood Mechanism‐ Reactants adsorb onto the same active species and thus compete
for available active sites.
28
Figure 1.8 Illustration of Langmuir‐Hinshelwood Reaction Mechanism
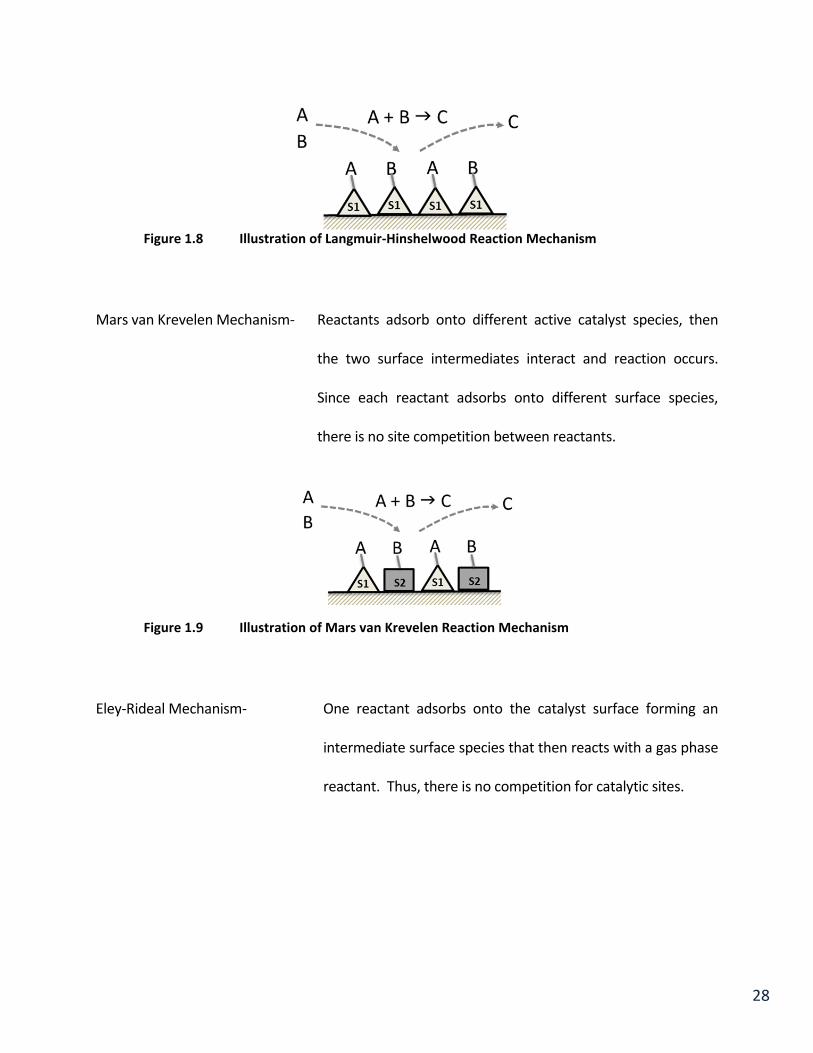
Mars van Krevelen Mechanism‐ Reactants adsorb onto different active catalyst species, then
the two surface intermediates interact and reaction occurs.
Since each reactant adsorbs onto different surface species,
there is no site competition between reactants.
Figure 1.9 Illustration of Mars van Krevelen Reaction Mechanism
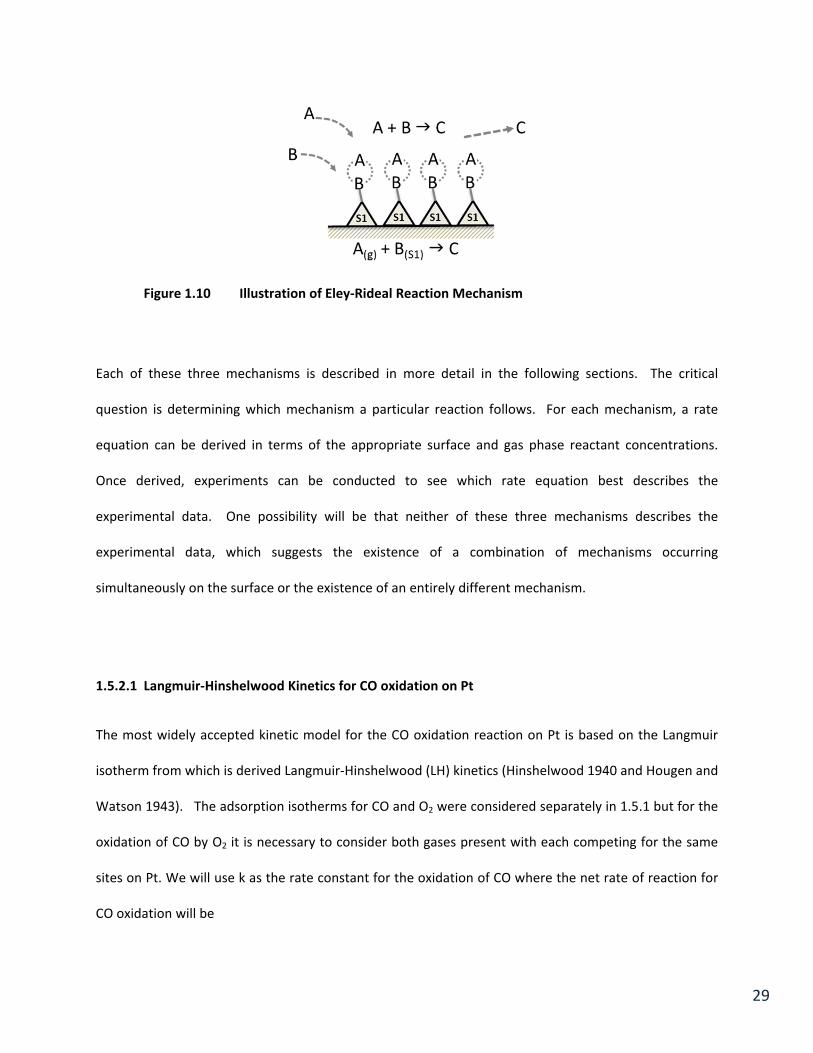
Eley‐Rideal Mechanism‐ One reactant adsorbs onto the catalyst surface forming an
intermediate surface species that then reacts with a gas phase
reactant. Thus, there is no competition for catalytic sites.
29
Figure 1.10 Illustration of Eley‐Rideal Reaction Mechanism
Each of these three mechanisms is described in more detail in the following sections. The critical
question is determining which mechanism a particular reaction follows. For each mechanism, a rate
equation can be derived in terms of the appropriate surface and gas phase reactant concentrations.
Once derived, experiments can be conducted to see which rate equation best describes the
experimental data. One possibility will be that neither of these three mechanisms describes the
experimental data, which suggests the existence of a combination of mechanisms occurring
simultaneously on the surface or the existence of an entirely different mechanism.
1.5.2.1 Langmuir‐Hinshelwood Kinetics for CO oxidation on Pt
The most widely accepted kinetic model for the CO oxidation reaction on Pt is based on the Langmuir
isotherm from which is derived Langmuir‐Hinshelwood (LH) kinetics (Hinshelwood 1940 and Hougen and
Watson 1943). The adsorption isotherms for CO and O2 were considered separately in 1.5.1 but for the
oxidation of CO by O2 it is necessary to consider both gases present with each competing for the same
sites on Pt. We will use k as the rate constant for the oxidation of CO where the net rate of reaction for
CO oxidation will be
30
[Rate]CO = k θCO θO (1.27)
The surface coverage of CO and O, θCO and θO respectively, must be modified to account for the
competitive adsorption that occurs on the active Pt sites. Specifically, the fraction of open sites used to
determine the rate of adsorption must include terms for both O and CO as written in Equation 1.28.
(Rate)fCO = kfCO PCO (1 ‐ θCO ‐ θO) (1.28)
However, the desorption rate for CO is still only dependent on the sites occupied by CO and remains
unchanged from Equation 1.18.
(Rate)dCO = kdCO θCO (1.29)
Equating adsorption (1.28) and desorption (1.18) rates at equilibrium and recognizing that
kfCO / kdCO = KCO yields an expression for the surface concentration of CO.
KCO PCO = θCO (1 ‐ θCO – θO) (1.30)
However, Equation 1.30 contains two unknowns, θCO and θO. Before we can solve Equation 1.30 any
further, we need an expression for θO. Following a similar approach to that used previously, for the rate
of adsorption and desorption of O2 we obtain
KO21/2 PO2
1/2 = θO2 / (1 ‐ θCO – θO) (1.31)
Simplification is achieved by dividing (1.30) by (1.31)
θO = θCO KO21/2 PO2
1/2 / KCO PCO (1.32)
We now substitute (1.32) into (1.30) to yield an expression for θCO in terms of known quantities.
θCO = KCOPCO/ (1 + KCO PCO + KO21/2 PO2
1/2 ) (1.33)
31
Similarly, we substitute (1.33) into (1.32) to yield an expression for θO in terms of known quantites.
θO = KO21/2 PO2
1/2 KCOPCO / (1 + KCO PCO + KO21/2 PO2
1/2 ) (1.34)
Now we have an expression for θCO and θO that can be substituted into Equation 1.27 to develop a rate
expression for CO oxidation in terms of the surface concentration of CO and O.
[Rate]CO = k θCO θO (1.27)
[Rate]CO = k KCOPCO KO21/2 PO2
1/2 / (1 + KCO PCO + KO21/2 PO2
1/2 )2 (1.35)
Let’s now consider the concentration extremes when the concentration of CO is very low and very high.
For low PCO, Equation 1.35 reduces to Equation 1.36.
[Rate]CO = k KCO PCO KO21/2 PO2
1/2 / (1 + KO21/2 PO2
1/2 )2 (1.36)
This shows a direct relationship between the rate and PCO when PO2 is constant
For large PCO, Equation 1.35 reduces to Equation 1.37.
[Rate]CO = k KO21/2 PO2
1/2 / ( PCO KCO) (1.37)
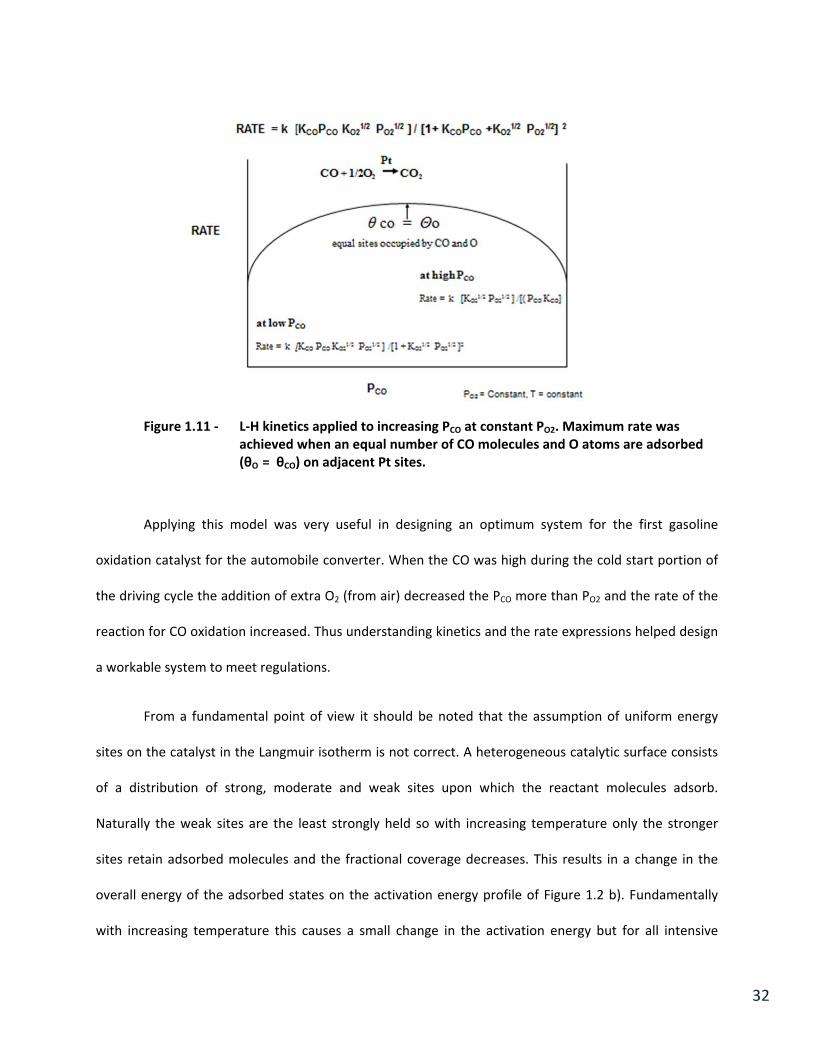
Equation 1.37 indicates that the rate of reaction will decrease as the gas phase concentration of CO
becomes high. This means high CO concentrations inhibit the rate of reaction, which is due to CO
saturating the catalyst surface and displacing adsorbed oxygen. Thus, the reaction rate approaches zero
a high and low CO concentrations, which indicates a maximum in rate exists when θO = θCO, which is
shown graphically in Figure 1.11
32
Figure 1.11 ‐ L‐H kinetics applied to increasing PCO at constant PO2. Maximum rate was achieved when an equal number of CO molecules and O atoms are adsorbed (θO = θCO) on adjacent Pt sites.
Applying this model was very useful in designing an optimum system for the first gasoline
oxidation catalyst for the automobile converter. When the CO was high during the cold start portion of
the driving cycle the addition of extra O2 (from air) decreased the PCO more than PO2 and the rate of the
reaction for CO oxidation increased. Thus understanding kinetics and the rate expressions helped design
a workable system to meet regulations.
From a fundamental point of view it should be noted that the assumption of uniform energy
sites on the catalyst in the Langmuir isotherm is not correct. A heterogeneous catalytic surface consists
of a distribution of strong, moderate and weak sites upon which the reactant molecules adsorb.
Naturally the weak sites are the least strongly held so with increasing temperature only the stronger
sites retain adsorbed molecules and the fractional coverage decreases. This results in a change in the
overall energy of the adsorbed states on the activation energy profile of Figure 1.2 b). Fundamentally
with increasing temperature this causes a small change in the activation energy but for all intensive

33
purposes can be ignored when making activation energy measurements. Measurements of activation
energies will be discussed later.
1.5.3 Mars van Krevelen Kinetic Mechanism
There are a number of reactions that proceed by a surface redox mechanism where oxygen is provided
by one catalytic component to an adsorbed reactant on another catalyst site leading to oxidation.
Examples for this mechanism apply when V2O5 is the catalyst for the oxidation of sulfur dioxide to sulfur
trioxide. It also applies to oxidation of benzene to benzoquinone. We will use an example of the
oxidation of CO over copper oxide and iron oxide to demonstrate the mechanism and rate equation.
These mechanisms are known as Mars‐Van Krevelen (MvK). In this case gas phase CO reduces Cu+2 to
Cu+1 (Equation 1.38). The FeO contributes its O to re‐oxidize the Cu to +2 with reduced Fe forming
(Equation 1.39). Gas phase O2 then adsorbs and oxidizes the Fe to FeO (Equation 1.40).
CO + 2CuO → Cu2O + CO2 (1.38)
Cu2O + FeO → 2CuO + Fe (1.39)
½ O2 + Fe → FeO (1.40)
Net reaction CO + 1/2O2 → CO2
The overall rate of reaction can be written recognizing that Θ equals the fractional coverage of O atoms
on the Fe species.
Overall oxidation of CO
Rate CO = k1PCO Θ (1.41)
34
Rate of re‐oxidation of the Fe,
Rate o = k2 PO21/2 (1‐Θ) (1.42)
The overall oxidation rate of the CO can be no faster that the rate at which Fe is re‐oxidized at steady
state so we can equate the two equations
k1 P CO Θ = k2 PO21/2 (1‐Θ) (1.43)
Θ = k2 PO2 1/2 / k1PCO + k2PO2
1/2 (1.44)
The MvK rate equation for CO oxidation can be written
R = k1 k2 PCO PO21/2 / k1PCO + k2 PO2
1/2 (1.45)
This expression recognizes that the rate is dependent on the gas phase partial pressure of both CO and
O2.
At low CO/O2 the rate reduces to k1 PCO
At high CO/O2 the rate reduces to k2 PO21/2
1.5.4 Eley‐Rideal Kinetic Mechanism
This model represents a case where a gas phase reactant reacts with a reactant that has adsorbed onto
the catalyst surface.
A(s) + B(g) → C(g) + D(g)
Assuming C and D do not adsorb and A adsorbs with an equilibrium constant KA and gas species B does
not compete with A for catalytic sites and only adsorbs on adsorbed A, the expression reduces to
35
Rate = k ΘA PB (1.46)
Rate = k KA PB /( 1 + KA) (1.47)
This rate model has not been proven to apply to any reaction to date but is only shown in hopes that
someday it will be useful. There is some speculation that the oxidation of ethylene to ethylene oxide
with a Ag catalyst might follow a Eley‐Rideal mechanism. If so O2 dissociatively chemisorbs onto the Ag
and ethylene then adsorbs on the adsorbed O‐ ‐‐‐Ag.
It should be understood that empirical models (see chapter 4) are often more useful than kinetic models
for industrial applications since reactions are carried out often in regimes in which kinetics and diffusion
are significant.
1.6 Chemical and Physical Steps in Occurring during Heterogeneous Catalysis
1.6.1 Mass Transfer Phenomena and Surface Reaction
To maximize reaction rates, it is essential to insure accessibility of all reactants to the active catalytic
component sites dispersed within the internal pore network of the carrier. Once again, let’s consider
the physical and chemical steps occurring during heterogeneous CO oxidation in a packed bed catalytic
reactor.
CO and O2 molecules are flowing through a bed of a solid particulate catalyst. To be converted to CO2,
the following physical and chemical steps must occur:
1. CO and O2 must make contact with the outer surface of the carrier (or
washcoat in the case of a monolithic supported catalyst) containing the
catalytic sites. To do so, they must diffuse through a stagnant thin layer of
36
gas or boundary layer forming around the solid catalyst particles. Bulk
molecular diffusion rates vary approximately with T3/2 and typically have an
“apparent” activation energies, E1 = 2‐4 Kcal/mole.
The term “apparent” activation energy is used here to distinguish the
physical phenomena of diffusion from the truly activated chemical
processes that occur at the catalytic site. Diffusion reactions are a physical
phenomena and thus are not an activated processes. Thus term “apparent”
activation energy is a convenient term used to give a figure of merit for
reaction sensitivity to temperature.
2. Since the bulk of the catalytic components are internally dispersed, the
majority of CO and O2 molecules must diffuse through the porous network
towards the active catalytic sites. The “apparent” activation energy for pore
diffusion, E2, is approximately 1/2 that of a chemical reaction or about 6‐10
Kcal/mole.
3. Once the molecules CO and O2 arrive at the catalytic site, O2 dissociates
quickly and chemisorption of both O and CO occurs on adjacent catalytic
sites. The kinetics generally follow exponential dependence on temperature;
i.e., exp (‐E3/RT), where E3 is the activation energy, which for chemisorption,
is typically greater than 10 Kcal/mole.
4. An activated complex forms between adsorbed CO and adsorbed O with an
energy equal to that at the peak of the activation energy profile since this is
the rate limiting step. At this point the activated complex has sufficient
37
energy to convert to CO2 which remains adsorbed on the catalytic site
Kinetics also follow exponential dependence on temperature; i.e., (‐E4/RT)
with activation energies typically greater than 10 Kcal./mole.
5. CO2 desorbs from the site following exponential kinetics; i.e., exp(‐E5/RT)
with activation energies typically greater than 10 Kcal./mole.
6. The desorbed CO2 diffuses through the porous network towards the outer
surface with an “apparent” activation energy and kinetics similar to step 2.
7. CO2 must diffuse through the stagnant layer and, finally, into the bulk gas.
Reaction rates follow T3/2 dependence. “Apparent” activation energies are
also similar to step 1) less than 2‐4 KCal/mole.
Steps 1 and 7 represent bulk mass transfer which is a function of the specific molecules, the dynamics of
the flow conditions, and the geometric surface area (outside or external area) of the catalyst/carrier.
Pore diffusion, illustrated in steps 2 and 6, depends primarily on the size and shape of both the pore and
the diffusing reactants and product. Steps 3, 4 and 5 are related to the chemical interactions of reac‐
tants and products (i.e. CO, O2 and CO2) at the catalytic site(s). The sequence of these three processes as
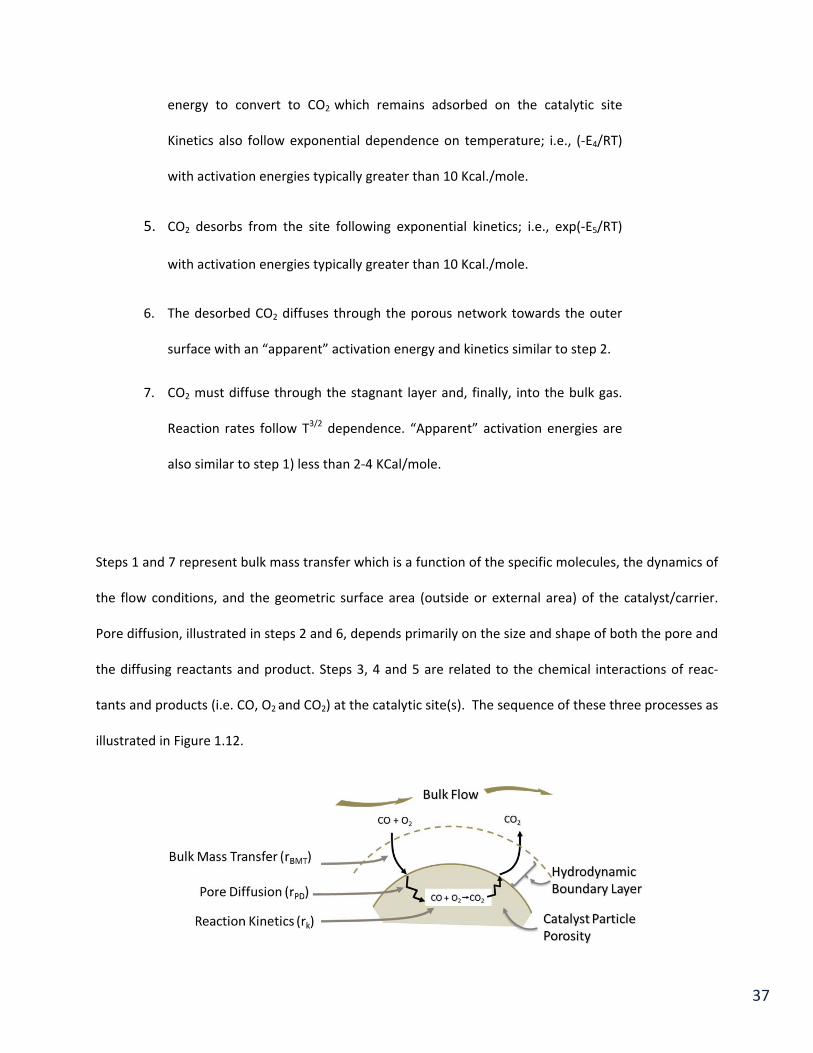
illustrated in Figure 1.12.
38
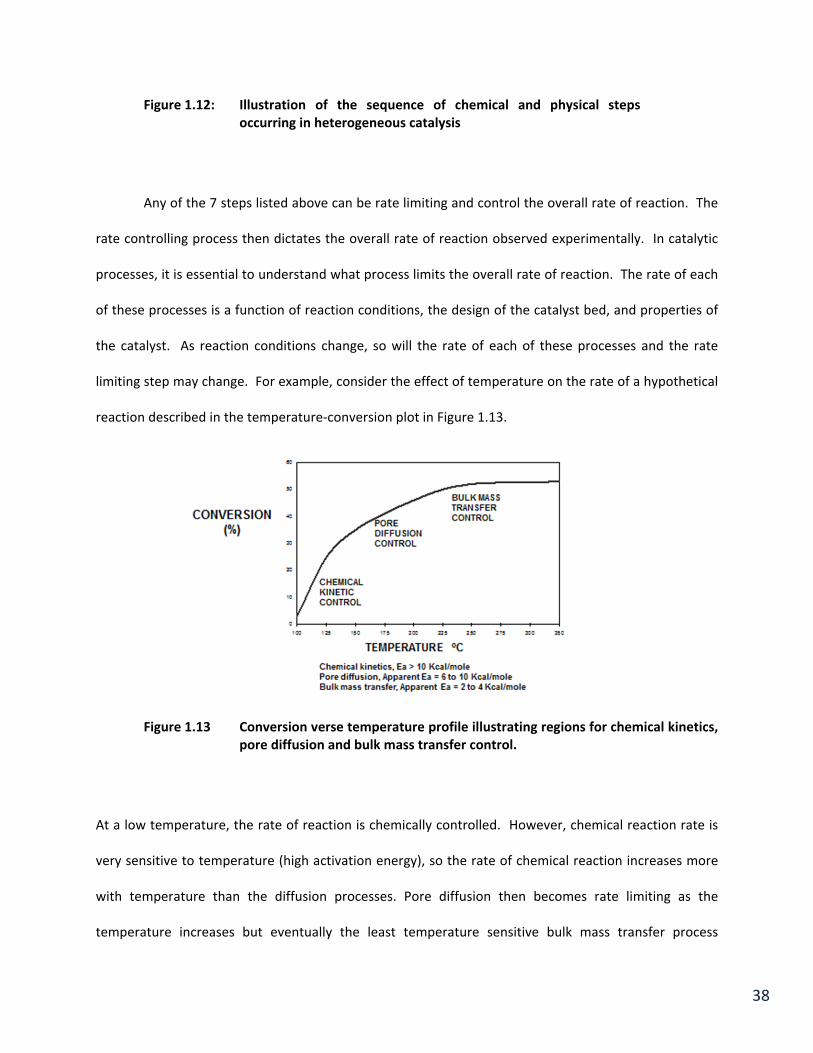
Figure 1.12: Illustration of the sequence of chemical and physical steps occurring in heterogeneous catalysis
Any of the 7 steps listed above can be rate limiting and control the overall rate of reaction. The
rate controlling process then dictates the overall rate of reaction observed experimentally. In catalytic
processes, it is essential to understand what process limits the overall rate of reaction. The rate of each
of these processes is a function of reaction conditions, the design of the catalyst bed, and properties of
the catalyst. As reaction conditions change, so will the rate of each of these processes and the rate
limiting step may change. For example, consider the effect of temperature on the rate of a hypothetical
reaction described in the temperature‐conversion plot in Figure 1.13.
Figure 1.13 Conversion verse temperature profile illustrating regions for chemical kinetics, pore diffusion and bulk mass transfer control.
At a low temperature, the rate of reaction is chemically controlled. However, chemical reaction rate is
very sensitive to temperature (high activation energy), so the rate of chemical reaction increases more
with temperature than the diffusion processes. Pore diffusion then becomes rate limiting as the
temperature increases but eventually the least temperature sensitive bulk mass transfer process
39
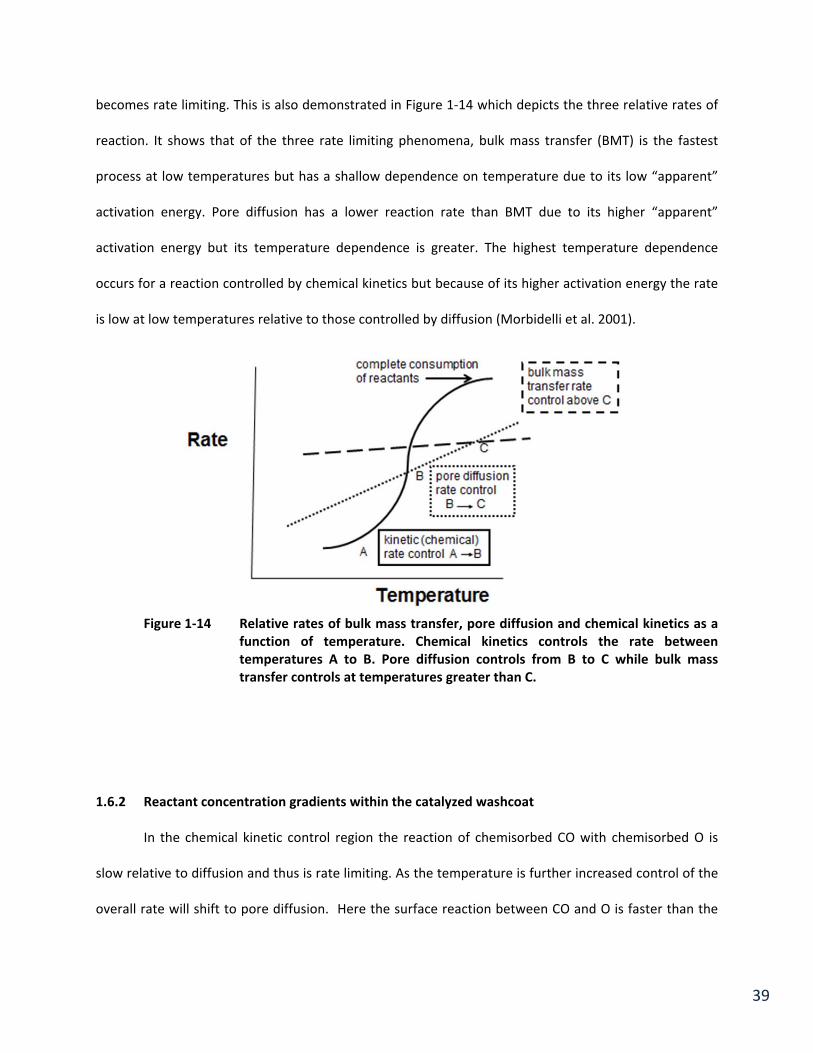
becomes rate limiting. This is also demonstrated in Figure 1‐14 which depicts the three relative rates of
reaction. It shows that of the three rate limiting phenomena, bulk mass transfer (BMT) is the fastest
process at low temperatures but has a shallow dependence on temperature due to its low “apparent”
activation energy. Pore diffusion has a lower reaction rate than BMT due to its higher “apparent”
activation energy but its temperature dependence is greater. The highest temperature dependence
occurs for a reaction controlled by chemical kinetics but because of its higher activation energy the rate
is low at low temperatures relative to those controlled by diffusion (Morbidelli et al. 2001).
Figure 1‐14 Relative rates of bulk mass transfer, pore diffusion and chemical kinetics as a
function of temperature. Chemical kinetics controls the rate between temperatures A to B. Pore diffusion controls from B to C while bulk mass transfer controls at temperatures greater than C.
1.6.2 Reactant concentration gradients within the catalyzed washcoat
In the chemical kinetic control region the reaction of chemisorbed CO with chemisorbed O is
slow relative to diffusion and thus is rate limiting. As the temperature is further increased control of the
overall rate will shift to pore diffusion. Here the surface reaction between CO and O is faster than the
40
rate in gaseous CO and O2 can be supplied to the sites and a concentration gradient exists decreasing
within the washcoat. This is referred to as intra‐particle diffusion in which the catalytic components
deep within the washcoat are not being completely utilized or have an effectiveness factor less than 1.
The effectiveness factor is the ratio of the actual rate verses the theoretical maximum rate and can be
thought of as a measure of the utilization of the catalytic component(s). At higher temperatures the
rate of diffusion of the CO and O2 from the bulk gas to the external surface of the washcoat is slow
relative to the other processes and the rate becomes controlled by bulk mass transfer. In this regime the
CO and O2 are converted to CO2 as soon as they arrive at the external surface of the washcoat. The
concentration of reactant and product is essentially zero at the external interface of the washcoat and
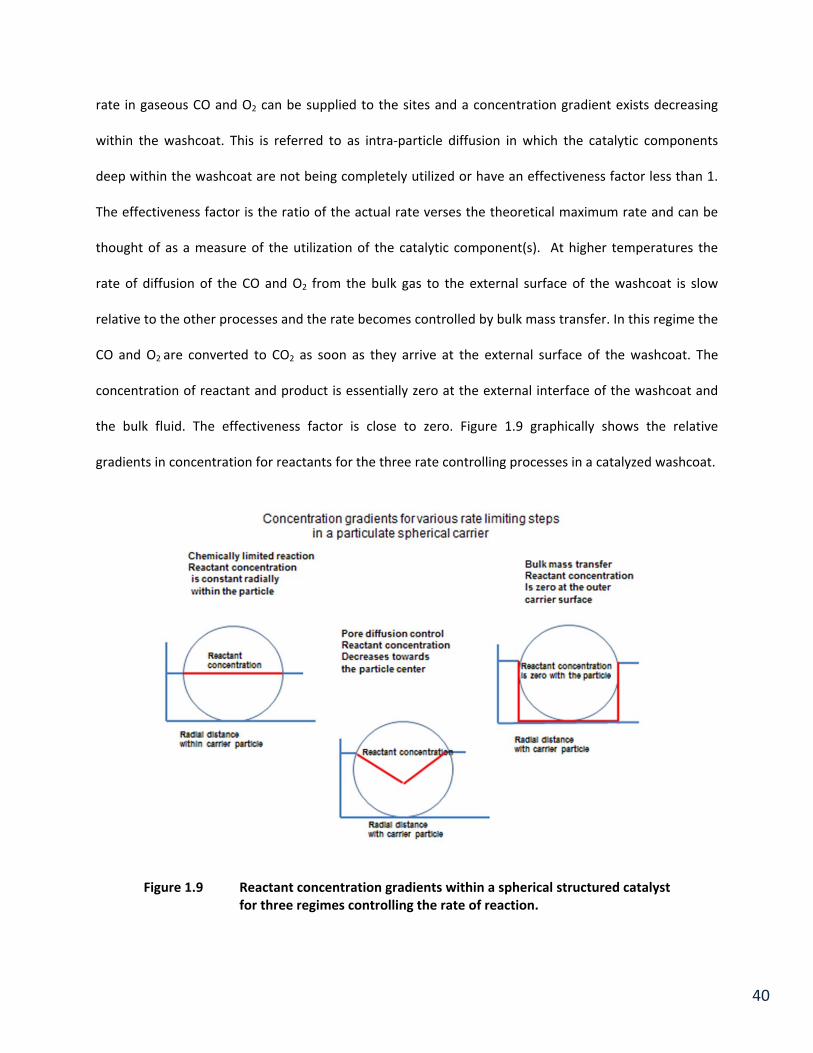
the bulk fluid. The effectiveness factor is close to zero. Figure 1.9 graphically shows the relative
gradients in concentration for reactants for the three rate controlling processes in a catalyzed washcoat.
Figure 1.9 Reactant concentration gradients within a spherical structured catalyst for three regimes controlling the rate of reaction.
41
1.6.3 The Rate Limiting Step
The efficiency with which a catalyst functions in a process depends of what controls the overall
reaction rate. If the kinetics of a process are measured and found to be in a regime where chemical
kinetics are rate controlling the catalyst should be made with as high a catalytic surface area as possible.
This is accomplished by increasing the catalytic component loading and/or dispersion so that every
catalytic site is available to the reactants. Furthermore, the catalytic components should be dispersed
uniformly throughout the interior of the carrier; with an effectiveness factor approaching 1. Process
parameters, such as an increase in temperature, promotes a reaction controlled by chemical kinetics.
When it is known that a process will have significant pore diffusion limitations the carrier should
be selected with large pores and to locate the catalytic components as close to the surface as possible to
improve the effectiveness factor. To enhance the transport rate one can decrease the thickness of the
washcoat to decrease the diffusion path of reactants and products. A temperature increase will have
some effect of enhancing the rate but to a lesser extent than for those reactions controlled by chemical
kinetics.
The rate of mass transfer is enhanced by increasing turbulence in the bulk gas and by increasing
the geometric surface area (i.e. external area) of the washcoated monolithic catalyst. This can be
accomplished by selecting a monolith with a high geometric surface area or density of channels per unit
area. Clearly increasing the catalytic components surface area, the loading of the catalytic components
or the size of the pores will have no effect on enhancing the rate of mass transfer since these catalyst
properties do not participate in the rate limiting step. Also temperature will have virtually no impact on
the BMT rate.
42
References
Avgouropoulos, G., Ioannides, T., Papadopoulos, C., Hocevar, S, Matralis, H. “A comparative study of Pt/
Al2O3, Au/œ- Fe2O3 and CuO‐CeO2 catalysts for the selective oxidation of carbon monoxide in excess
hydrogen” Catalysis Today 75 (2002) 157.
Bartholomew, C., and Farrauto, R. and Fundamentals of Industrial Catalytic Processes, Second edition,
Wiley and Sons, Hoboken, NJ (2006).
Bollinger, M. and Vannice, M.A. “ A kinetics and Drift study of low temperature carbon
monoxide oxidation over Au‐TiO2 catalysts” APCAT B: Environmental 8 (1996) 417.
Bond, G., Lous, C and Thompson, D. Catalysis by Gold Imperial College Press, London (2006).
Grisel, R. and Nieuwenhuys, B. “A comparative study of the oxidation of CO and CH4 over
Au/MOx/Al2O3 catalysts” Catalysis Today 64 (2001) 69.
Hinshelwood, C. N. The kinetics of chemical change, Oxford, Clarendon Press, London 1940.
Hougen, O. and Watson, K. “Solid Catalysts and Reaction Rates General Principles” Industrial
Engineering Chemistry 35, (1943) 529.
Hurtado, P. Ordonez, S., Sastre, H. and Diez, F. “Development of a kinetic model for the oxidation of
methane over Pd/Al2O3 at dry and wet conditions” Applied Catalysis B: Environmental 51 (2004) 229‐
238.
Korotkikh, O. and Farrauto, R. “Selective catalytic oxidation of CO in H2: Fuel cell applications” Catalysis
Today 62 (2000) 2.
43
Korotkikh,O., Ruettinger, W. and Farrauto, R. (2003) “Suppression of methanation activity by
water gas shift reaction catalyst” US 6,562,315.
Liu X, Korotkikh, O and Farrauto, R. (2002) “Selective catalytic oxidation of CO in H2: a structural of Fe
oxide promoted Pt/alumina catalyst” Applied Catalysis B: Environmental 226, 293.
Mars, P. and Van Krevelen, D. Oxidations carried out by means of vanadium oxide catalysts” Chemical
Engineering Series 3 (1954) 41.
Morbidelli, M., Garvriilidis, A. and Varma, A., Catalyst Design: Optimal distribution of catalyst in pellets,
reactors and membranes, Cambridge University Press, Cambridge, England (2001).
44
Chapter 1 Questions
1. Give everyday examples of how you encounter rate limiting steps using analogies to intrinsic,
pore diffusion and mass transfer controlled reactions.
2. Give examples of how in your everyday life you make decisions regarding selectivity.
3. List 3 examples for each of petroleum and chemical products produced by catalytic processes.
4. Distinguish a homogeneous catalyst and process from a heterogeneous catalyst and process.
5. Why is it important to maximize the number of active sites in a heterogeneous catalyst?
6. What is the practical value in preparing a catalyst or adjusting the process conditions by
knowing the activation energy of a reaction?
7. How would you change the process conditions by knowing that in a hydrocarbon oxidation
reaction the hydrocarbon has a very large inhibition effect as in the equation:
Rate ~ k [(KadsHC PPHC)(KadsO2 PPO2)] / (Kads PPHC )
8a. How does the presence of a catalyst change the thermodynamic equilibrium constant of a
reaction?
b. Two reactions are thermodynamically feasible (both have negative free energies) but one is
much more negative than the other. Can a catalyst direct the reactants to the least favorable?
9. What are the benefits of using a catalyst for abating emissions?
10. Derive the L‐H rate expression for the decomposition of PH3 on a W metallic catalyst where no
products adsorb.
45
W
PH3 → P + 3/2H2
Ans: Rate = k ΘPH3 = k KPH3 PPH3 / 1 + KPH3 PPH3
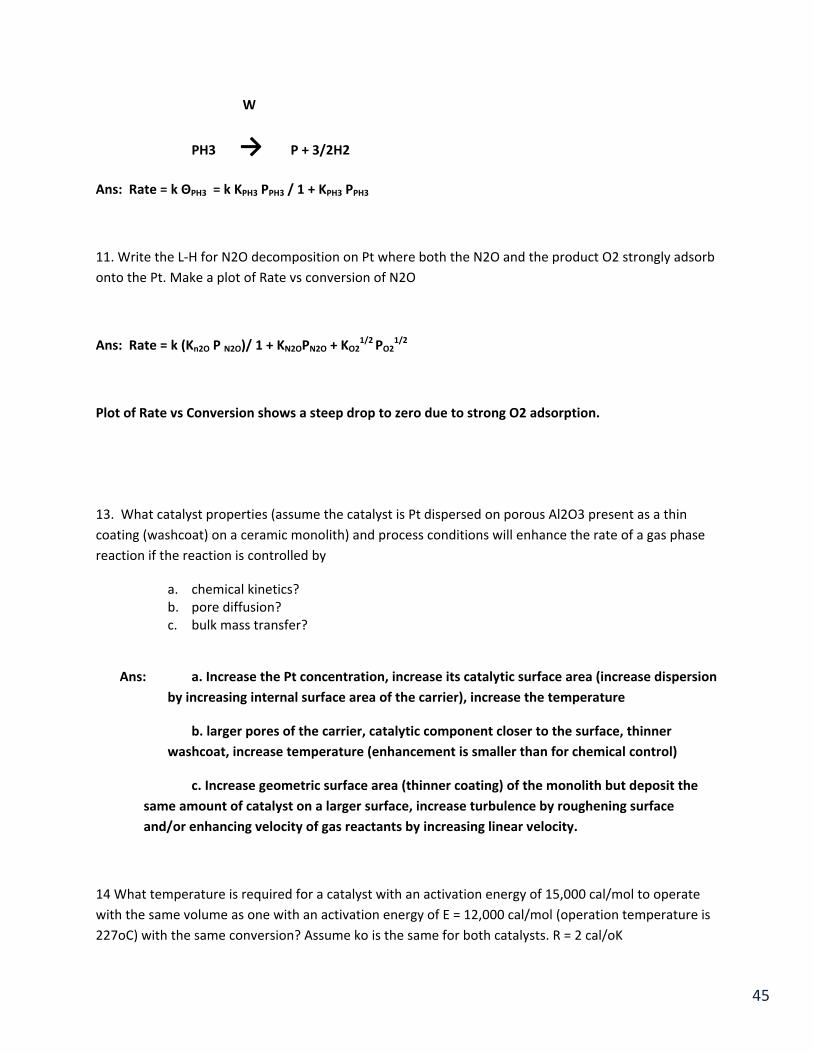
11. Write the L‐H for N2O decomposition on Pt where both the N2O and the product O2 strongly adsorb
onto the Pt. Make a plot of Rate vs conversion of N2O
Ans: Rate = k (Kn2O P N2O)/ 1 + KN2OPN2O + KO21/2 PO2
1/2
Plot of Rate vs Conversion shows a steep drop to zero due to strong O2 adsorption.
13. What catalyst properties (assume the catalyst is Pt dispersed on porous Al2O3 present as a thin
coating (washcoat) on a ceramic monolith) and process conditions will enhance the rate of a gas phase
reaction if the reaction is controlled by
a. chemical kinetics? b. pore diffusion? c. bulk mass transfer?
Ans: a. Increase the Pt concentration, increase its catalytic surface area (increase dispersion
by increasing internal surface area of the carrier), increase the temperature
b. larger pores of the carrier, catalytic component closer to the surface, thinner
washcoat, increase temperature (enhancement is smaller than for chemical control)
c. Increase geometric surface area (thinner coating) of the monolith but deposit the
same amount of catalyst on a larger surface, increase turbulence by roughening surface
and/or enhancing velocity of gas reactants by increasing linear velocity.
14 What temperature is required for a catalyst with an activation energy of 15,000 cal/mol to operate
with the same volume as one with an activation energy of E = 12,000 cal/mol (operation temperature is
227oC) with the same conversion? Assume ko is the same for both catalysts. R = 2 cal/oK
46
Answer to 14
ko/SV21.2 Exp [‐ 12,000 cal/mol/(2 cal/oK)(500oK))] = ko/SV12 Exp [‐ 15,000 cal/mol/(2 cal/oK)(T15))]
exp (‐6000/500oK) = exp (‐7500/ T15)
ln of both sides
6000/500 = 7500/ T15 or T15= 625oK
15. How will the rate constant (and hence the reaction rate) change when the temperature is increased from 100oC to 110oC? Assume an activation energy of 20 Kcal/mole with the universal gas constant = 2 cal/deg‐mole. Feel free also to use joules for activation energy with (R = 8.3 J/mol‐oK)
Ans:
100oC = 373oK
110oC = 383oK
A. k383 = ko exp [‐20,000/ 2 (383)]
B k373 = ko exp [‐20,000/ 2 (373)]
A/B
= exp [‐10,000/383 + 10,000/373]
= exp [‐26.10 + 26.80] = exp {0.7}
k383/k373 = exp [0.7]
k383/k373 = 2
47
16.a. Consider a reaction with two possible product distributions; one desired and .the other not. Why is
it important to know their respective activation energies?
Ans a: By knowing the activation energy you can estimate the rate limiting step. This will allow you to
make adjustments in the catalyst and process temperature to favor one over the other. Low
Temperature will favor the one with the smallest activation energy.
You can calculate the ratio of rate at any temperature for all reactions. By using ratios the k0 cancel
and the relative rates will be determined by the temperatures using the known activation energy.
b..What conditions would you use in the process to favor the desired reaction? Plot their respective
relative rates vs temperature
Answer b: Operate at a low temperature to favor the desired reaction. The favored reaction will
increase with temperature slower than the un desired one. It allows you to work in a temperature
range best for the desired reaction. A plot of Rate vs T will show a higher rate at the lower T for the
desired reaction with the lower E. As the T increases the undesired Rate will overcome the more
desired.
17.
What properties of the particulate catalyst and process conditions can be changed to enhance the rate
limiting step for each of the four separate cases of rate control?
1. Bulk Mass Transfer
2. Pore Diffusion
3. Chemical
4. Heat transfer
Ans: 1. BMT: Increase the GSA by decreasing particulate size, increase turbulence, increase surface
roughness. Very small effect due to temperature
2. Pore Diffusion: Increase the pore diameter of the carrier, decrease the particle size which
decreases the diffusion path, change the shape and geometry of the particle to decrease the diffusion
path, deposit catalytic component closer to the outer surface, mild effect when the temperature is
increased.
3. Chemical: Increase catalytic sites by increased loading and dispersion, increase the
temperature.

48
4. Heat Transfer: Select a carrier with a low heat capacity (low SA, more dense), use a reactor
with a small diameter (smaller radius), Smaller particles in packed bed to maximize contact and
radial conductivity, reconsider and use a metal monolith upon which the catalyst is deposited.