Embed Size (px)
DESCRIPTION
Chapter 1. Introduction to the Scientific Method Can Science Cure the Common Cold?. Biology 103 Dr. Brent Palmer Syllabus Schedule Three Websites 1. UK Blackboard 2. Class website http://web.as.uky.edu/Biology/faculty/palmer 3. Mastering Biology www.masteringbiology.com. - PowerPoint PPT Presentation
Citation preview

Steve McCommasSouthern Illinois State University
PowerPoint lecture prepared by
Copyright © 2010 Pearson Education, Inc.
Chapter 1Introduction to the Scientific Method Can Science Cure the Common Cold?
Copyright © 2010 Pearson Education, Inc.
Biology 103 Dr. Brent Palmer Syllabus Schedule
Three Websites
1. UK Blackboard
2. Class website
http://web.as.uky.edu/Biology/faculty/palmer
3. Mastering Biology
www.masteringbiology.com

Copyright © 2010 Pearson Education, Inc.
WHY YOU SHOULD CARE ABOUT BIOLOGY
Biology is about you! Cancer - 1 IN 4 people will get cancer
Lung Cancer 1/3 of U.S. smokes 160,000/yr get lung cancer 145,000 will die in 3 years (90%)
Skin cancer – melanoma is the most deadly form of cancer!
Breast cancer 1 in 9 women will get

Copyright © 2010 Pearson Education, Inc.
WHY YOU SHOULD CARE ABOUT BIOLOGY
Destruction of tropical rain forests Hundreds of thousands of acres are cleared
every day 1-2 percent every year They will never grow back
Green house effect is here Melting of glaciers and polar ice caps Crop failures, drought, famine

Copyright © 2010 Pearson Education, Inc.
WHY YOU SHOULD CARE ABOUT BIOLOGY
Loss of Biological diversity 100,000 species extinct in the next 20 yrs nearly 1/4 of all species on earth They are lost forever genes are lost --> cure for cancer and AIDS
gone Aesthetics and moral --> a barren planet

Copyright © 2010 Pearson Education, Inc.
WHY YOU SHOULD CARE ABOUT BIOLOGY
Overpopulation I remember 3 billion people on the planet, then
4, then 5, then 6 billion people Now 6,860,482,878 people in the world! population will double in 40 years 10-14 billion people by 2050 mostly in poor 3rd world countries can we continue to feed the world, especially
with the green house effect? balance of world power?

Copyright © 2010 Pearson Education, Inc.
1.1 The Process of Science
Science is NOT a giant collection of facts to be memorized.
Science is a Process, using the scientific method: Observing Proposing ideas - Hypotheses Testing the hypotheses Discarding those ideas that fail

Copyright © 2010 Pearson Education, Inc.
1.1 The Process of Science
The Nature of Hypotheses Hypothesis: proposed explanation for
observation Testable and potentially falsifiable
Were to hypotheses come from?
Copyright © 2010 Pearson Education, Inc. Figure 1.1
1.1 The Process of Science
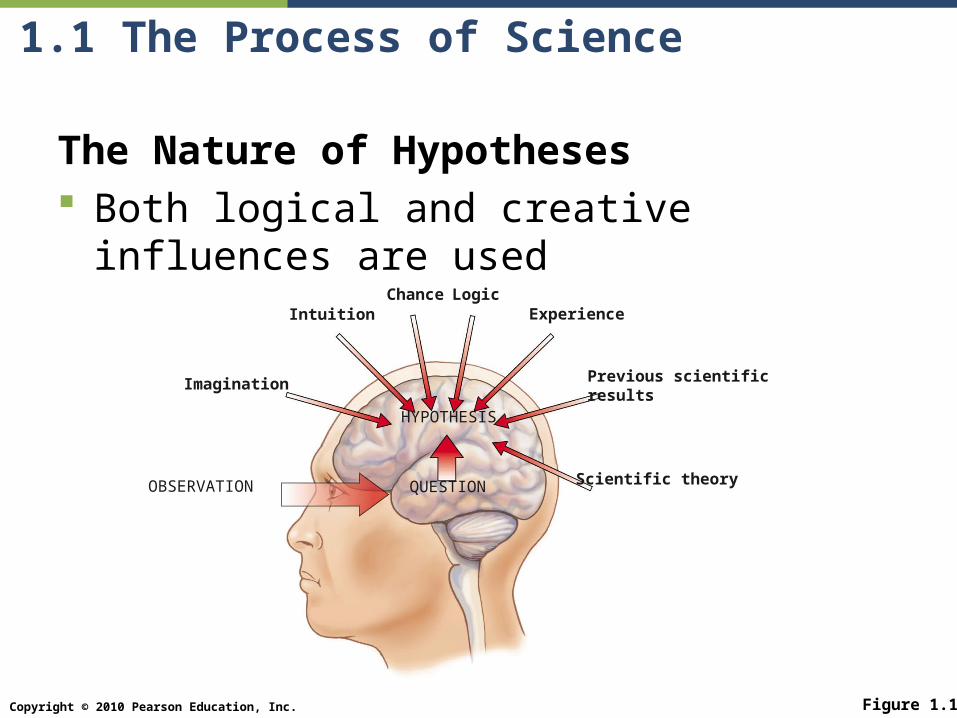
The Nature of Hypotheses Both logical and creative influences are used
OBSERVATION
Imagination
IntuitionChance Logic
Experience
Previous scientificresults
Scientific theory
HYPOTHESIS
QUESTION
Copyright © 2010 Pearson Education, Inc.
1.1 The Process of Science
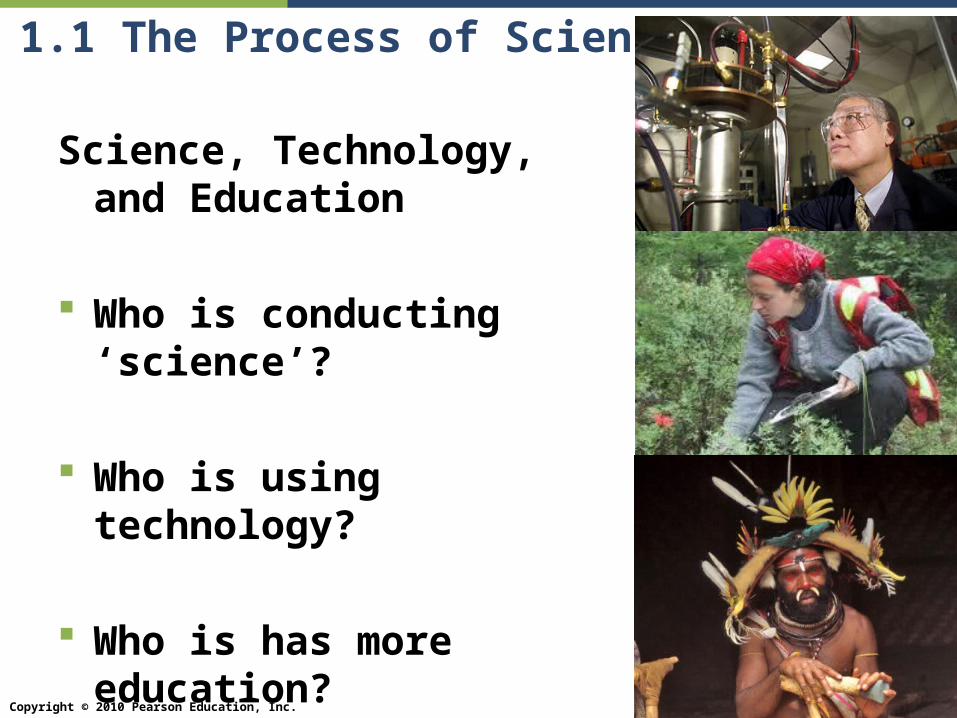
Science, Technology, and Education
Who is conducting ‘science’?
Who is using technology?
Who is has more education?

Copyright © 2010 Pearson Education, Inc.
1.1 The Process of Science
Science versus Technology Science is a process that uses the scientific
method It may not require technology, depending upon
hypothesis
Technology uses advanced instrumentation But just by having instrumentation does not mean it is
being used to in science (i.e., not testing hypothesis).

Copyright © 2010 Pearson Education, Inc.
1.1 The Process of Science
Science, Technology, and Education
Who is conducting ‘science’?
Who is using technology?
Who is has more education?

Copyright © 2010 Pearson Education, Inc.
1.1 The Process of Science
Pseudoscience Pretends to be science Often starts with a conclusion and then
tries to find ‘proof’ for it Only accepts evidence that supports their
theory, and rejects evidence that does not support it
Copyright © 2010 Pearson Education, Inc.
1.1 The Process of Science
Scientific Theory Powerful, broad explanation of a large set of
observations Rests on many hypotheses that have been
tested Generates additional hypotheses

Copyright © 2010 Pearson Education, Inc.
1.1 The Process of Science
Example: Germ Theory People used to think diseases were caused
by things like: bad air – so they would not go out at night, or bad blood – which they treated with blood
letting
Louis Pasteur observed that microorganisms caused milk to spoil Hypothesized the microorganisms caused
deseases too
Robert Koch demonstrated that anthrax bacteria caused the disease in mice

Copyright © 2010 Pearson Education, Inc.
1.1 The Process of ScienceThe Logic of Hypothesis Tests Inductive reasoning: combining a series of
specific observations into a generalization Fruits and Veg’s contain lots of Vit C People who eat lots of fruits and Veg’s are
generally healthier Vit C is an anti-inflammatory agent, which reduces
nose & throat irritation
From these observations a hypothesis is formed: Consuming vitamin C decreases the risk of
catching a cold

Copyright © 2010 Pearson Education, Inc.
1.1 The Process of ScienceThe Logic of Hypothesis Tests Inductive reasoning
EXAMPLE The sun rises in the east every morning It travels across the sky It sets in the west every morning
> Therefore, the sun rotates around the earth
Just because a series of observations appear right doesn’t mean they are.
> MUST BE TESTED!!
Copyright © 2010 Pearson Education, Inc.
1.1 The Process of Science
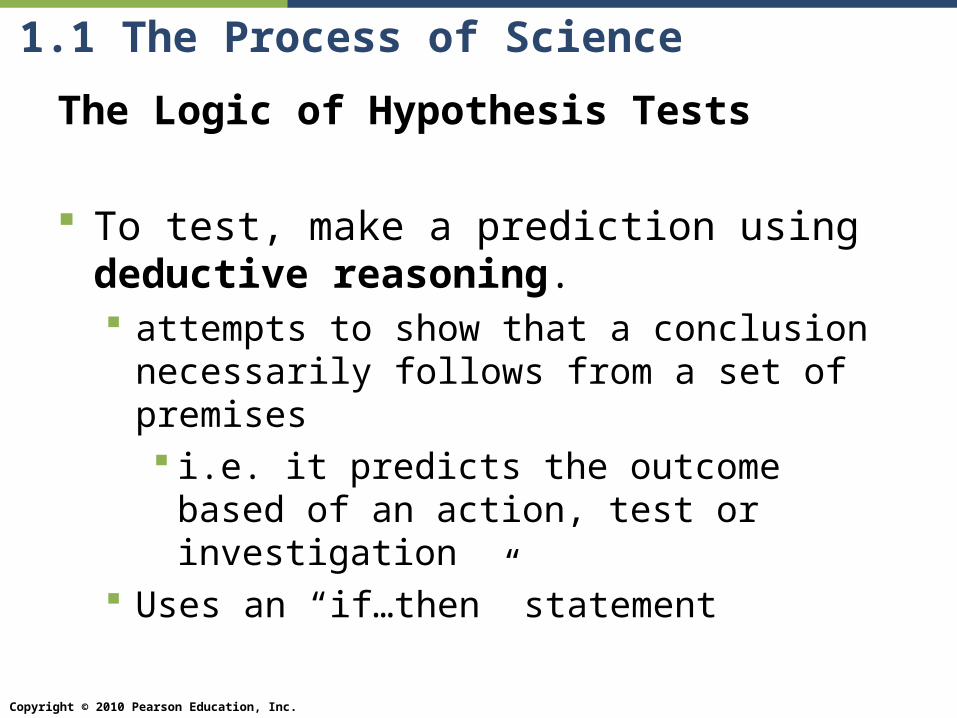
The Logic of Hypothesis Tests
To test, make a prediction using deductive reasoning. attempts to show that a conclusion necessarily
follows from a set of premises i.e. it predicts the outcome based of an
action, test or investigation Uses an “if…then” statement
Copyright © 2010 Pearson Education, Inc.
1.1 The Process of Science
The Logic of Hypothesis Tests
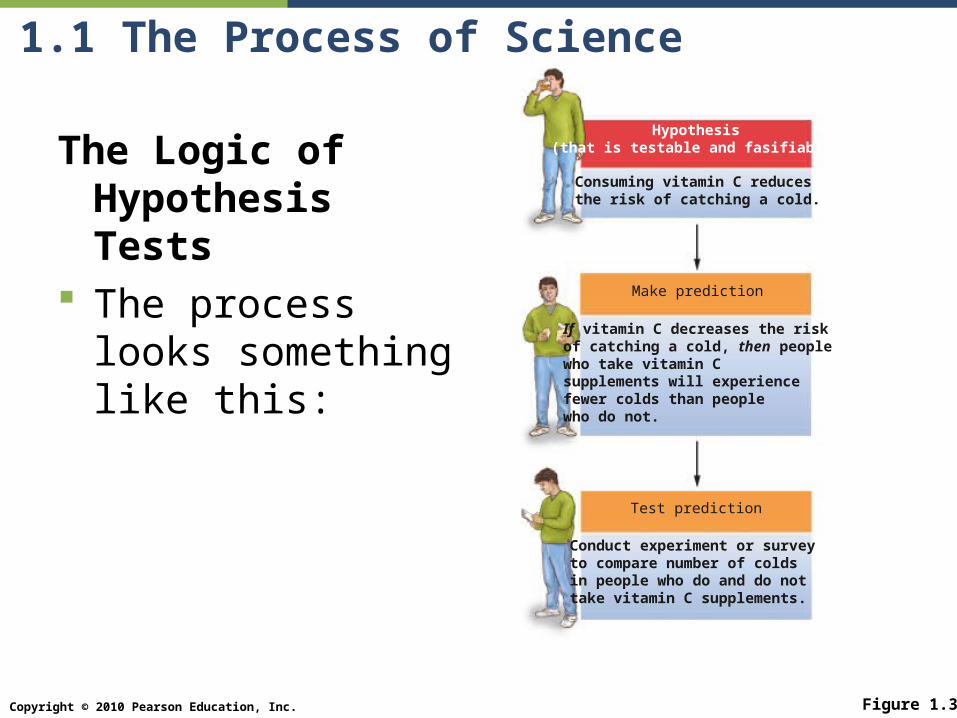
The process looks something like this:
Figure 1.3
Hypothesis(that is testable and fasifiable)
Make prediction
Consuming vitamin C reduces the risk of catching a cold.
If vitamin C decreases the riskof catching a cold, then peoplewho take vitamin C supplements will experience fewer colds than people who do not.
Test prediction
Conduct experiment or survey to compare number of colds in people who do and do not take vitamin C supplements.

Copyright © 2010 Pearson Education, Inc.
1.1 The Process of Science
Figure 1.3 (continued)
If people who take vitamin C suffer fewercolds than those who do not. . .
If people who take vitamin C suffer the same number of colds or more than those who do not. . .
Conclude that prediction is
true
Conclude that prediction is
false
Do not reject the hypothesis
Reject the hypothesis
Conduct additional
tests
Consider alternative hypotheses

Copyright © 2010 Pearson Education, Inc.
1.1 The Process of Science
The Logic of Hypothesis Tests A hypothesis that fails our test is rejected
and considered disproven. A hypothesis that passes is supported, but
not proven. Why not? An alternative hypothesis might
be the real explanation.
> it is possible to disprove a hypothesis, but never possible to prove a hypothesis
Copyright © 2010 Pearson Education, Inc.
1.2 Hypothesis Testing
Vit C helps prevent colds First proposed by Noble prize winning
chemist Linus Pauling in 1970 Based on a few studies conducted between
1930s and 1970s Subsequently disproven by lots of more
thorough research

Copyright © 2010 Pearson Education, Inc.
1.2 Hypothesis Testing
When is a hypothesis considered true? When one hypothesis has not been disproven
through repeated testing and all reasonable alternative hypothesis have been
eliminated. But may be rejected in the future
>Truth in science is what we know an understand based on all currently available information, but may be changed when new information is available

Copyright © 2010 Pearson Education, Inc.
1.2 Hypothesis Testing
The most powerful way to test hypotheses: do experiments

Copyright © 2010 Pearson Education, Inc.
1.2 Hypothesis Testing
Experiments support the hypothesis that the common cold is caused by a virus.
Figure 1.4
(b) How the virus causes a cold(a) Cold–causing virus
Virus introduces its genetic material into a host cell.
New copies of the virus are released, killing host cell. These copies can infect other cells in the same person or cells in another person (for example, if transmitted by a sneeze).
The viral genetic material instructs the host cell to make new copies of the virus. Immune system cells target infected host cells. Side effects are increased mucus production and throat irritation.
Protein shell
Genetic material and proteins
Virus
Host cell
Viruscopies
Releasedviruscopies
Immune system cells
Nasalpassages
Throat
Mucus
1
2
3
Copyright © 2010 Pearson Education, Inc.
1.2 Hypothesis Testing
The Experimental Method - Terminology Experiments are carefully regulated
situations. Variables: factors that can change in value
under different conditions Independent variables can be manipulated by
the scientist Dependent variables change depending upon
the dependent variable

Copyright © 2010 Pearson Education, Inc.
1.2 Hypothesis Testing
Controlled Experiments Controlled experiment: tests the effect of a
single variable at a time Control: a subject who is not exposed to the
experimental treatment Differences can be attributed to the
experimental treatment.

Copyright © 2010 Pearson Education, Inc.
1.2 Hypothesis Testing
Animation—Science as a Process: Arriving at Scientific Insights
PLAY

Copyright © 2010 Pearson Education, Inc.
1.2 Hypothesis Testing
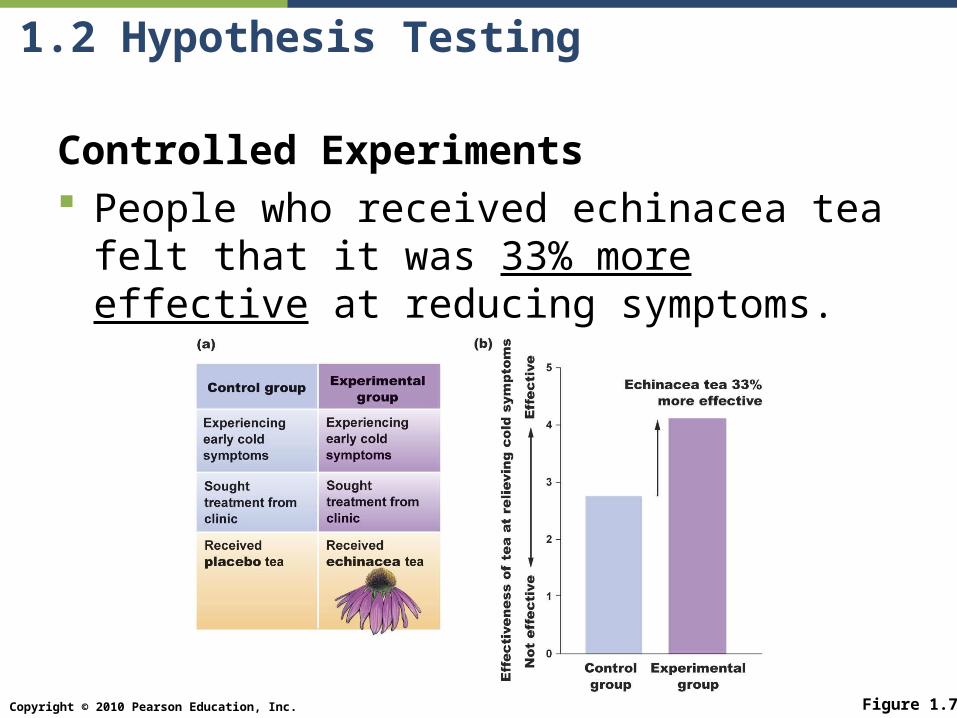
Controlled Experiments Example: Echinacea tea experiment:
Hypothesis: drinking Echinacea tea relieves cold symptoms
Experimental group drinks Echinacea tea 5-6 times daily.
Control group drinks “sham” Echinacea tea (placebo).
Both groups rated the effectiveness of their treatment on relieving cold symptoms.
Copyright © 2010 Pearson Education, Inc.
1.2 Hypothesis Testing
Controlled Experiments People who received echinacea tea felt that it
was 33% more effective at reducing symptoms.
Figure 1.7

Copyright © 2010 Pearson Education, Inc.
1.2 Hypothesis Testing
Minimizing Bias in Experimental Design If human subjects know whether they have
received the real treatment or a placebo, they may be biased.
Blind experiment: subjects don’t know what kind of treatment they have received
Double blind experiment: the person administering the treatments also doesn’t know until after the experiment is over “gold standard” for experimentation

Copyright © 2010 Pearson Education, Inc.
1.2 Hypothesis Testing
Using Correlation to Test Hypotheses It is not always possible or ethical to
experiment on humans. Using existing data, is there a correlation
between variables?

Copyright © 2010 Pearson Education, Inc.
1.2 Hypothesis Testing
Using Correlation to Test Hypotheses Hypothesis: stress makes people more
susceptible to catching a cold Is there a correlation between stress and the
number of colds people have caught?

Copyright © 2010 Pearson Education, Inc.
1.2 Hypothesis Testing
Using Correlation to Test Hypotheses Results of such a study: the number of colds
increases as stress levels increase.
Figure 1.10
Copyright © 2010 Pearson Education, Inc.
1.2 Hypothesis Testing
Using Correlation to Test Hypotheses Caution! Correlation does not imply
causation. The correlation might be due to other
reasons.

Copyright © 2010 Pearson Education, Inc.
1.2 Hypothesis Testing
Using Correlation to Test Hypotheses
Figure 1.11

Copyright © 2010 Pearson Education, Inc.
1.3 Understanding Statistics
Overview: What Statistical Tests Can Tell Us Statistics extend the results from small
samples to an entire population. It determines if the difference between two
samples are real or due to chance Statistics measures:
Sample size Variation with the sample
Copyright © 2010 Pearson Education, Inc.
1.3 Understanding Statistics
The Problem of Sampling Error Sampling error: the effect of chance We can calculate the probability that a result
is simply due to sampling error. Statistically significant: an observed
difference is probably not due to sampling error

Copyright © 2010 Pearson Education, Inc.
1.3 Understanding Statistics
The Problem of Sampling Error Experimental and control groups (samples)
will never be identical because all living organisms are unique Sometimes the observed difference between
groups is only due to sample error and not experimental treatment
Copyright © 2010 Pearson Education, Inc.
1.3 Understanding Statistics
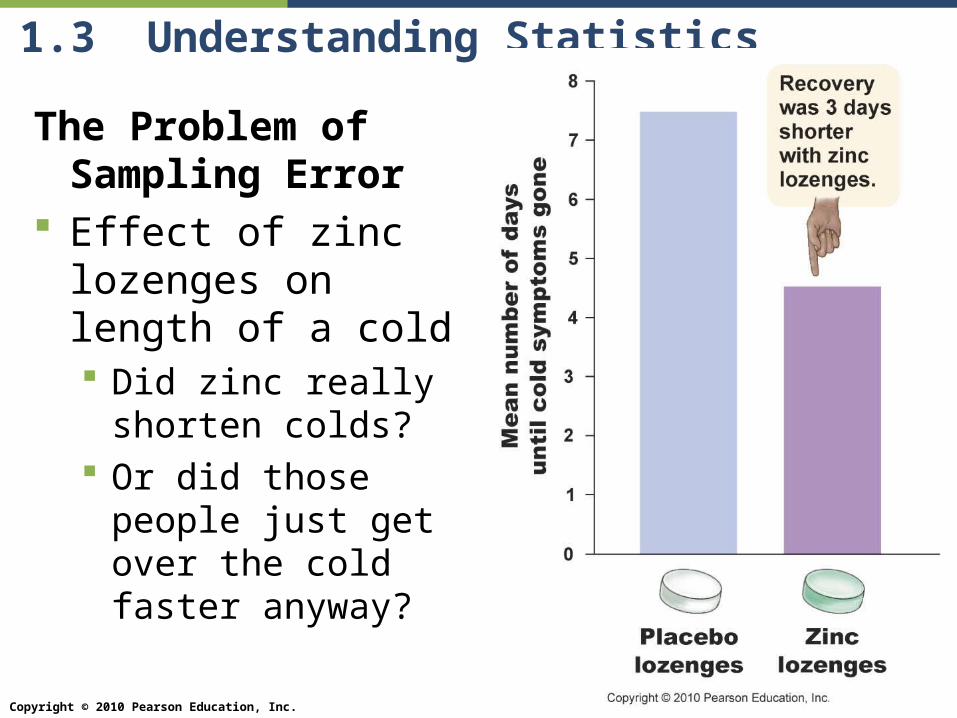
The Problem of Sampling Error
Effect of zinc lozenges on length of a cold Did zinc really
shorten colds? Or did those people
just get over the cold faster anyway?
Copyright © 2010 Pearson Education, Inc.
1.3 Understanding Statistics
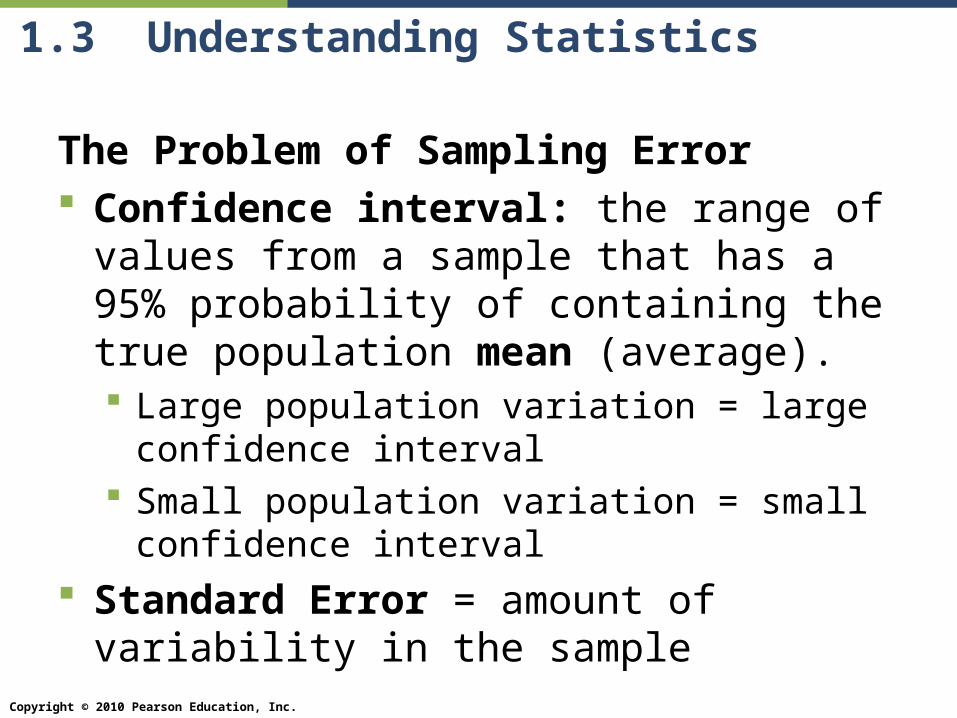
The Problem of Sampling Error Confidence interval: the range of values
from a sample that has a 95% probability of containing the true population mean (average). Large population variation = large confidence
interval Small population variation = small confidence
interval
Standard Error = amount of variability in the sample
Copyright © 2010 Pearson Education, Inc.
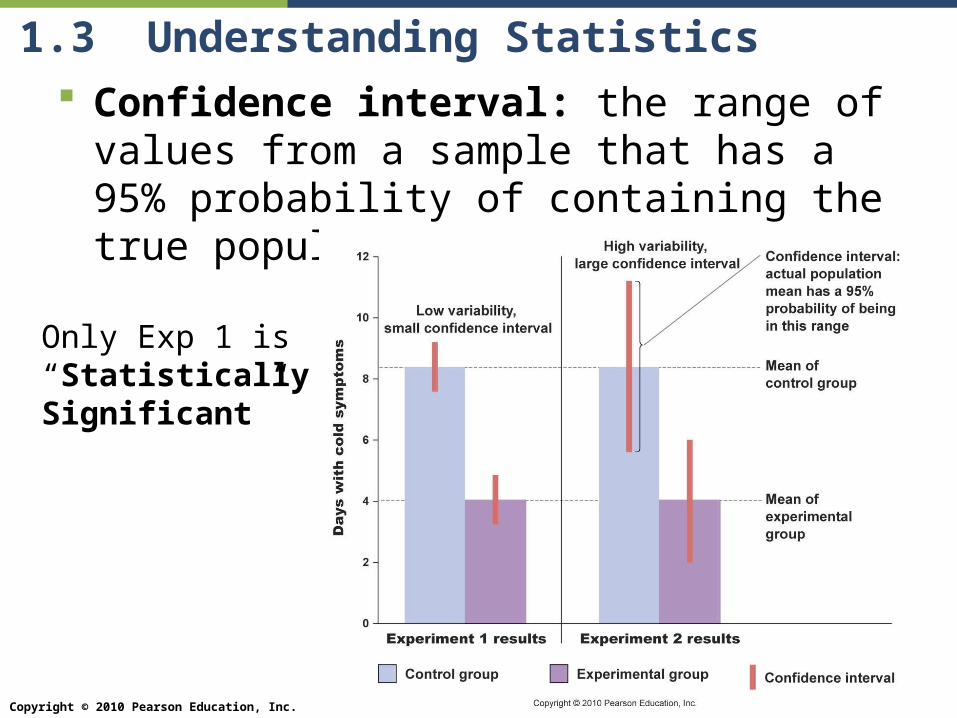
1.3 Understanding Statistics Confidence interval: the range of values
from a sample that has a 95% probability of containing the true population mean (average).
Only Exp 1 is “Statistically Significant”

Copyright © 2010 Pearson Education, Inc.
1.3 Understanding Statistics
Factors that Influence Statistical Significance
Sample size Bigger is better: more likely to detect
differences
Variance of the population Statistical significance is harder to find in highly
variable populations

Copyright © 2010 Pearson Education, Inc.
1.3 Understanding Statistics
What Does Statistical Significance Really Mean?
Most scientists accept a 5% probability of error (i.e. P<0.05) This means that the probability that the
experimental groups were different by sampling error alone is 5%
That means that 1 in 20 (5%) of statistically significant research is really just a false positive

Copyright © 2010 Pearson Education, Inc.
1.3 Understanding StatisticsFactors that Influence Statistical
Significance
Figure 1.15

Copyright © 2010 Pearson Education, Inc.
1.3 Understanding Statistics
What Statistical Tests Cannot Tell Us If an experiment was designed and carried
out properly Evaluate the probability of sampling error, not
observer error May not be of any biological significance

Copyright © 2010 Pearson Education, Inc.
1.4 Evaluating Scientific Information
Primary Sources Researchers can submit a paper about their
results to a professional journal (primary source).
Peer review: evaluation of submitted papers by other experts
Secondary sources: books, news reports, the internet, and advertisements

Copyright © 2010 Pearson Education, Inc.
1.4 Evaluating Scientific Information

Copyright © 2010 Pearson Education, Inc.
1.4 Evaluating Scientific Information
Information from Anecdotes Anecdotal evidence is based on one
person’s experience, not on experimental data. Example: a testimonial from a celebrity

Copyright © 2010 Pearson Education, Inc.
1.4 Evaluating Scientific Information
Science in the News Secondary sources may be missing critical
information or report the information incorrectly.
Consider the source of media reports.

Copyright © 2010 Pearson Education, Inc.
1.4 Evaluating Scientific Information
Science in the News Be careful with the internet since anyone can
post information. Be very cautious about claims made in paid
advertisements.
Copyright © 2010 Pearson Education, Inc.
1.4 Evaluating Scientific Information
Understanding Science from Secondary Sources
Use your understanding of the process of science to evaluate science stories.
News media generally highlight only those science stories that seem newsworthy.
They are more likely to report a positive result than a negative one.

Copyright © 2010 Pearson Education, Inc.
1.4 Evaluating Scientific Information
Checklist for evaluating science in the News
Table 1.2 on page 24.

Copyright © 2010 Pearson Education, Inc.
1.5 Is There a Cure for the Common Cold?
No effect on cold susceptibility: Vitamin C Exposure to cold temperatures Exercise
No vaccine for the common cold
But prevention methods are known. Wash your hands!

![Chapter 1: Getting Started with Alteryx · Chapter 1 [ 42 ] Chapter 4: Writing Fast and Accurate. Chapter 1 [ 43 ] Chapter 1 [ 44 ]](https://img.pdfslide.us/doc/110x75/5e903c60f316447eb43c0e7a/chapter-1-getting-started-with-alteryx-chapter-1-42-chapter-4-writing-fast.jpg)