Embed Size (px)
Citation preview
1
Chapter 02
Managing Effective Projects
Chiun-Ming Liu
Department of Industrial Engineering and Systems Management
Feng Chia University
2
Outline
Terminology
1. Project Management across the Organization
2. Defining and Organizing Projects
3. Planning Projects
4. Monitoring and Controlling Projects
3
Terminology /2
• A project is an interrelated set of activities with a
definite starting and ending point, which results in a
unique outcome from a specific allocation of resources.
• A program is an interdependent set of projects that
have a common strategic purpose.
• The three main goals of any project are to:
– Complete the project on time
– Not exceed the budget
– Meet the specifications to the satisfactions of the
customer
4
Terminology /1
• Project management is a systemized, phased
approach to defining, organizing, planning, monitoring,
and controlling projects.
• Operations strategy initiatives often require the
coordination of many interdependent projects.
5
1. Project Management across the
Organization
• Projects often cut across organizational lines because
they need the skills of multiple professions and
organizations.
• Many departments should be involved in a project.
• For example, consider an information systems project
to develop a corporate customer database at a bank.
• Such an information systems project at a bank
requires services spanning from several departments:
– Information systems department
– Marketing department
– Finance department
6
2. Defining and Organizing Projects
• A clear understanding of a project’s organization and
how personnel are going to work together to complete
the project are keys to success.
• We will address (1) defining the scope and objectives,
(2) selecting the project manager and team, and (3)
selecting the organizational structure.
7
(1) Defining the scope and objectives of a
project
• A thorough project objective statement of a project’s
scope, time frame, and allocated resources is
essential to managing the project.
• A scope of a project is a succinct statement of project
objectives and the essence of the desired project
outcomes.
• Changes to scope are called scope creep, and are
primary causes of failed projects.
• The time frame for a project should be as specific as
possible.
• The allocation of resources should be expressed as
a monetary figure or as full-time equivalents of
personnel time.
8
(2) Selecting the Project Manager and Team
• Once the project is selected, a project manager and a team must be chosen.
• A good project manager must be:
– Facilitator: resolves conflicts; has leadership skills and a systems view
– Communicator: communicates to senior management and stakeholders
– Decision maker: makes tough decisions
• Project team members must have:
– Technical competence: required for the tasks
– Sensitivity: interpersonal conflicts
– Dedication: solve project problems
9
(3) Selecting Organizational Structure
• The relationship of the project manager to the project
team is determined by the firm’s organizational structure.
• Three types of organizational structure:
– Functional: the project is housed in a specific
department or functional areas
– Pure project: the team members work exclusively for
the project manager on a particular project
– Matrix: a compromise between the functional and
pure project structure.
10
3. Planning Projects
• After the project is defined and organized, the team
must formulate a plan that identifies the specific tasks
to be accomplished and a schedule for their
completion.
• There are five steps to planning projects:
1. Defining the work breakdown structure
2. Diagramming the project network
3. Developing the schedule
4. Analyzing the cost-time trade-offs
5. Assessing risks
11
1. Defining the Work Breakdown Structure
• Work Breakdown Structure (WBS): a statement of all
the tasks that must be completed.
• The project manager must work closely with the team to
identify all work tasks.
• In the process of accumulating work tasks, the team
generates a hierarchy to the work breakdown.
• An activity is the smallest unit of work effort consuming
both time and resources that the project manager can
schedule and control.
• Task ownership: each activity in the WBS must have an
owner who is responsible for doing the work.
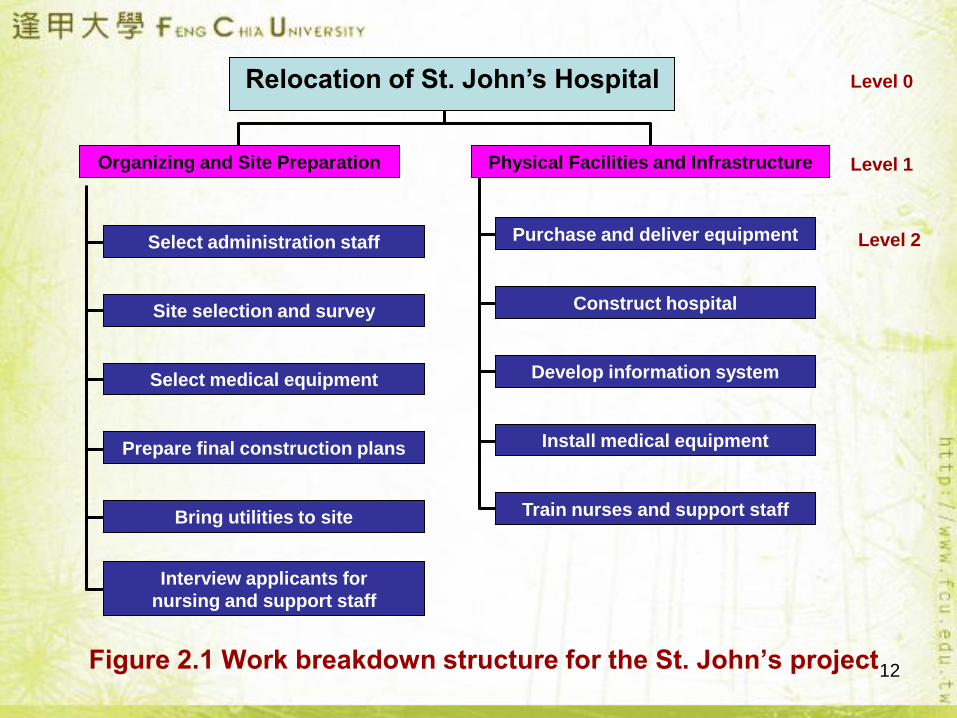
12
Purchase and deliver equipment
Construct hospital
Develop information system
Install medical equipment
Train nurses and support staff
Figure 2.1 Work breakdown structure for the St. John’s project
Select administration staff
Site selection and survey
Select medical equipment
Prepare final construction plans
Bring utilities to site
Interview applicants for
nursing and support staff
Organizing and Site Preparation Physical Facilities and Infrastructure Level 1
Level 0
Level 2
Relocation of St. John’s Hospital
13
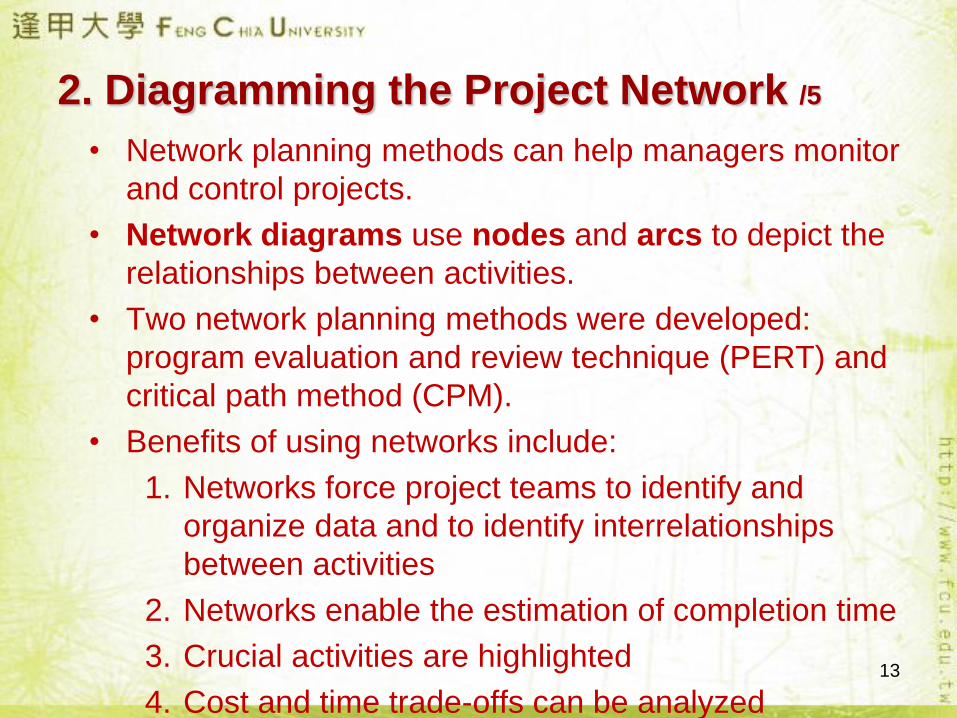
2. Diagramming the Project Network /5
• Network planning methods can help managers monitor
and control projects.
• Network diagrams use nodes and arcs to depict the
relationships between activities.
• Two network planning methods were developed:
program evaluation and review technique (PERT) and
critical path method (CPM).
• Benefits of using networks include:
1. Networks force project teams to identify and
organize data and to identify interrelationships
between activities
2. Networks enable the estimation of completion time
3. Crucial activities are highlighted
4. Cost and time trade-offs can be analyzed
14
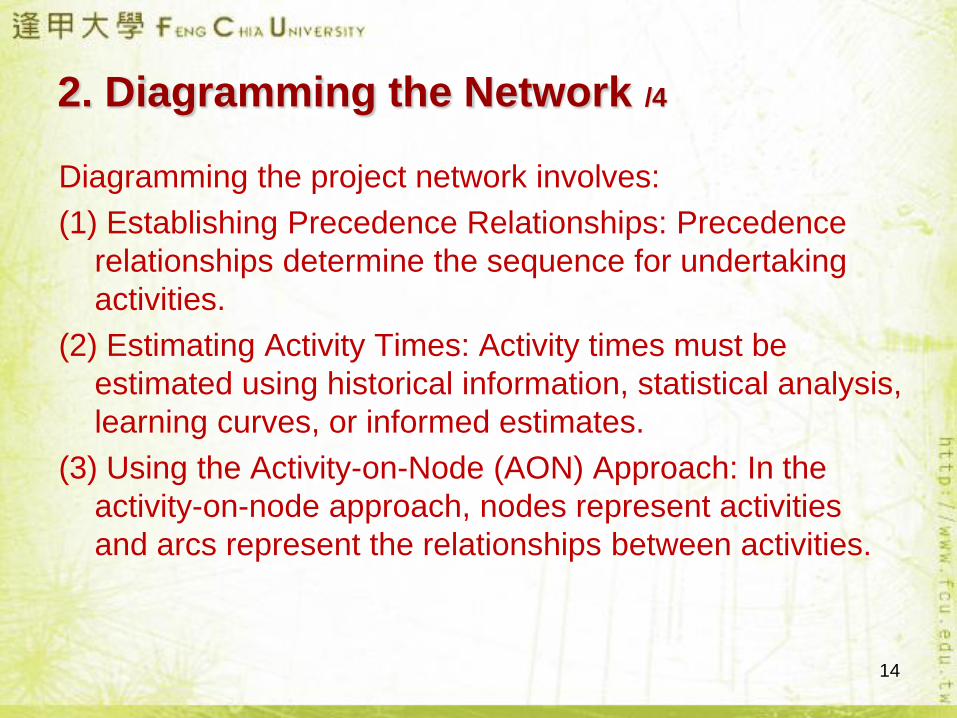
2. Diagramming the Network /4
Diagramming the project network involves:
(1) Establishing Precedence Relationships: Precedence
relationships determine the sequence for undertaking
activities.
(2) Estimating Activity Times: Activity times must be
estimated using historical information, statistical analysis,
learning curves, or informed estimates.
(3) Using the Activity-on-Node (AON) Approach: In the
activity-on-node approach, nodes represent activities
and arcs represent the relationships between activities.
15
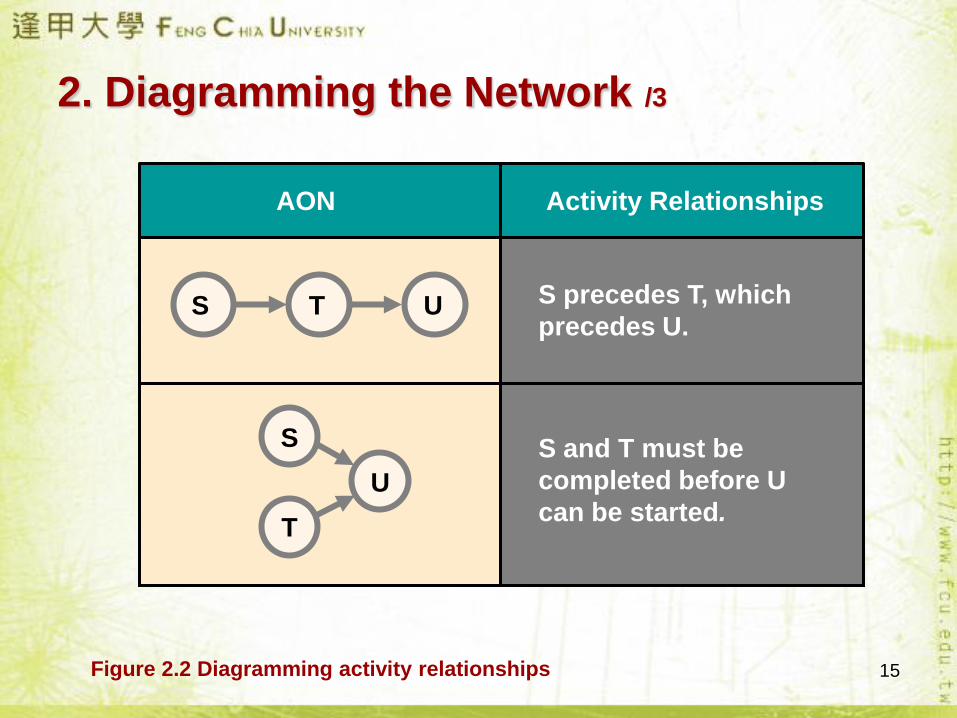
S T U S precedes T, which
precedes U.
2. Diagramming the Network /3
AON Activity Relationships
S
T
U
S and T must be
completed before U
can be started.
Figure 2.2 Diagramming activity relationships
16
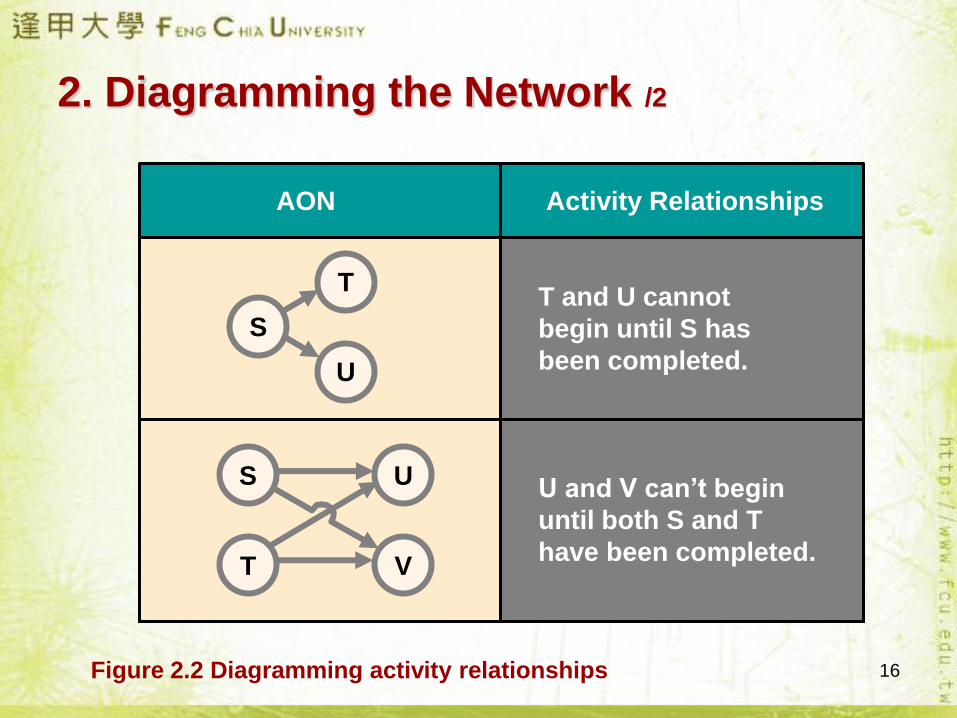
2. Diagramming the Network /2
AON Activity Relationships
T
U
ST and U cannot
begin until S has
been completed.
S
T
U
V
U and V can’t begin
until both S and T
have been completed.
Figure 2.2 Diagramming activity relationships
17
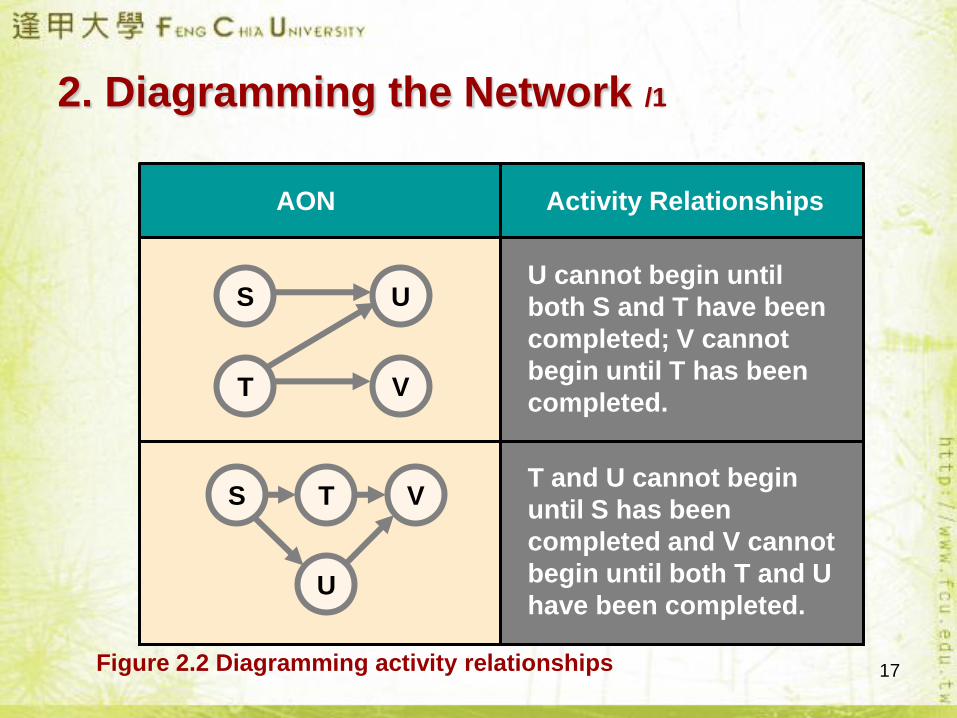
2. Diagramming the Network /1
AON Activity Relationships
S
T
U
V
U cannot begin until
both S and T have been
completed; V cannot
begin until T has been
completed.
S T V
U
T and U cannot begin
until S has been
completed and V cannot
begin until both T and U
have been completed.
Figure 2.2 Diagramming activity relationships
18
Example 2.1 St. John’s Hospital Project
• Judy Kramer, the project manager for the St. John’s
hospital project, divided the project into two major
modules: organizing and site preparation and physical
facilities and infrastructure..
• She assigned John Stewart overall responsibility for the
Organizing and Site Preparation module and Sarah
Walker the responsibility for the Physical Facilities and
Infrastructure module.
• Using the WBS, the project team developed the
precedence relationships, activity time, and activity
responsibilities shown in the following table.
19
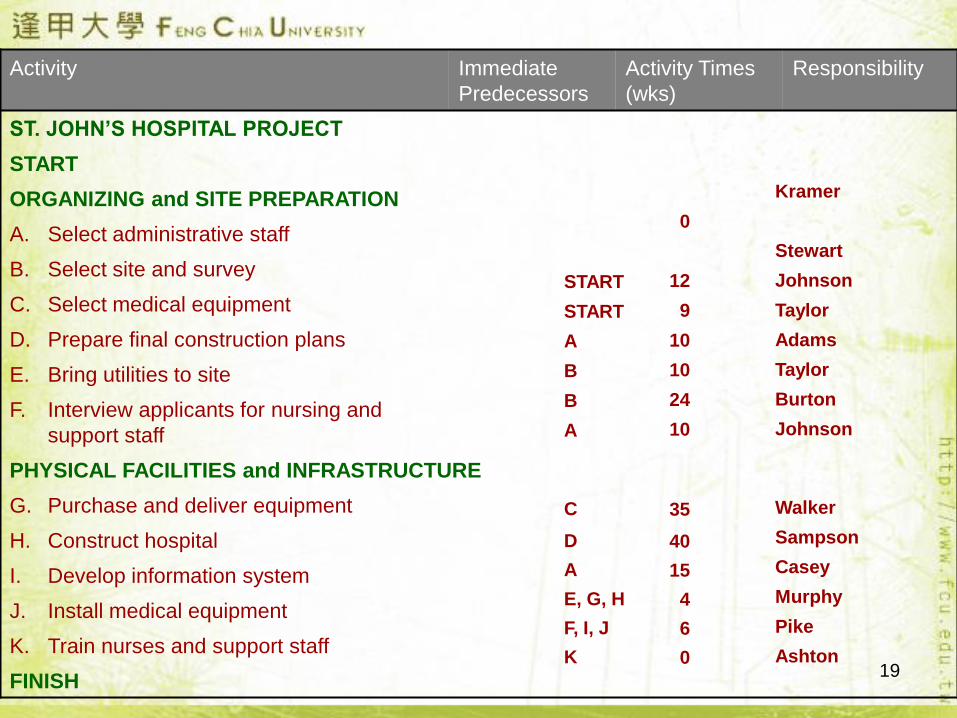
Activity Immediate
Predecessors
Activity Times
(wks)
Responsibility
ST. JOHN’S HOSPITAL PROJECT
START
ORGANIZING and SITE PREPARATION
A. Select administrative staff
B. Select site and survey
C. Select medical equipment
D. Prepare final construction plans
E. Bring utilities to site
F. Interview applicants for nursing and
support staff
PHYSICAL FACILITIES and INFRASTRUCTURE
G. Purchase and deliver equipment
H. Construct hospital
I. Develop information system
J. Install medical equipment
K. Train nurses and support staff
FINISH
START
START
A
B
B
A
C
D
A
E, G, H
F, I, J
K
0
12
9
10
10
24
10
35
40
15
4
6
0
Kramer
Stewart
Johnson
Taylor
Adams
Taylor
Burton
Johnson
Walker
Sampson
Casey
Murphy
Pike
Ashton
20
Activity Immediate
Predecessors
Activity Times
(wks)
Responsibility
ST. JOHN’S HOSPITAL PROJECT
START
ORGANIZING and SITE PREPARATION
A. Select administrative staff
B. Select site and survey
C. Select medical equipment
D. Prepare final construction plans
E. Bring utilities to site
F. Interview applicants for nursing and
support staff
PHYSICAL FACILITIES and INFRASTRUCTURE
G. Purchase and deliver equipment
H. Construct hospital
I. Develop information system
J. Install medical equipment
K. Train nurses and support staff
FINISH
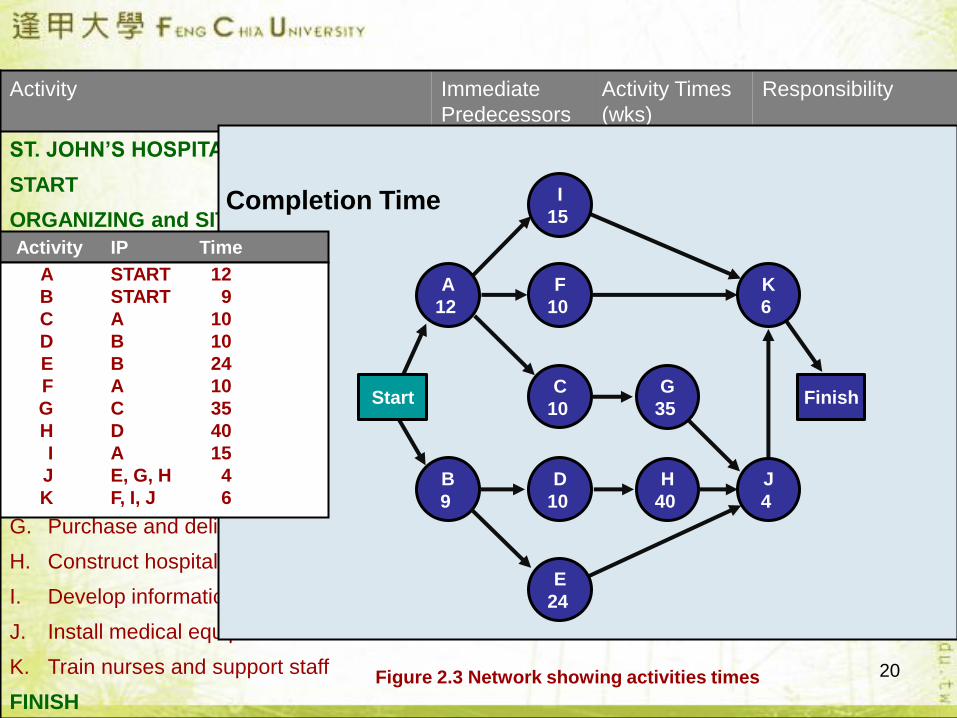
Completion Time
Finish
K
6
I
15
F
10
C
10
H
40
J
4
A
12
B
9
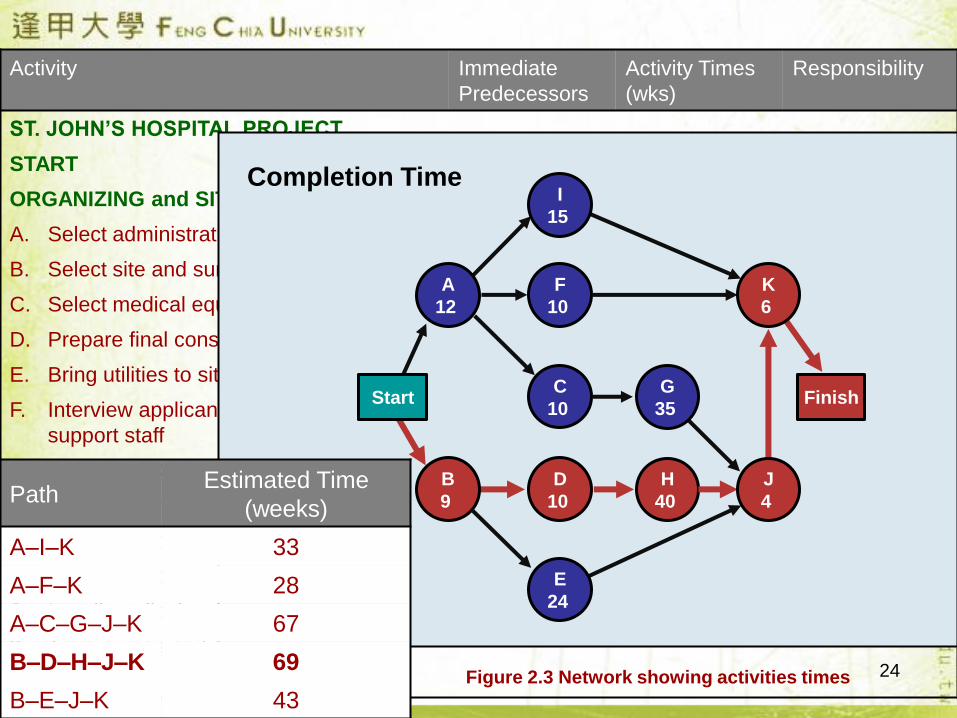
Figure 2.3 Network showing activities times
StartG
35
D
10
E
24
Activity IP Time
A START 12
B START 9
C A 10
D B 10
E B 24
F A 10
G C 35
H D 40
I A 15
J E, G, H 4
K F, I, J 6
21
3. Developing the Schedule /6
• A key advantage of network planning methods is the
creation of a schedule of project activities that will help
managers achieve the objectives of the project.
• Managers can:
1. Estimate the completion time by finding the critical
path.
2. Identify start and finish times for each activity.
3. Calculate the amount of slack time for each activity.
22
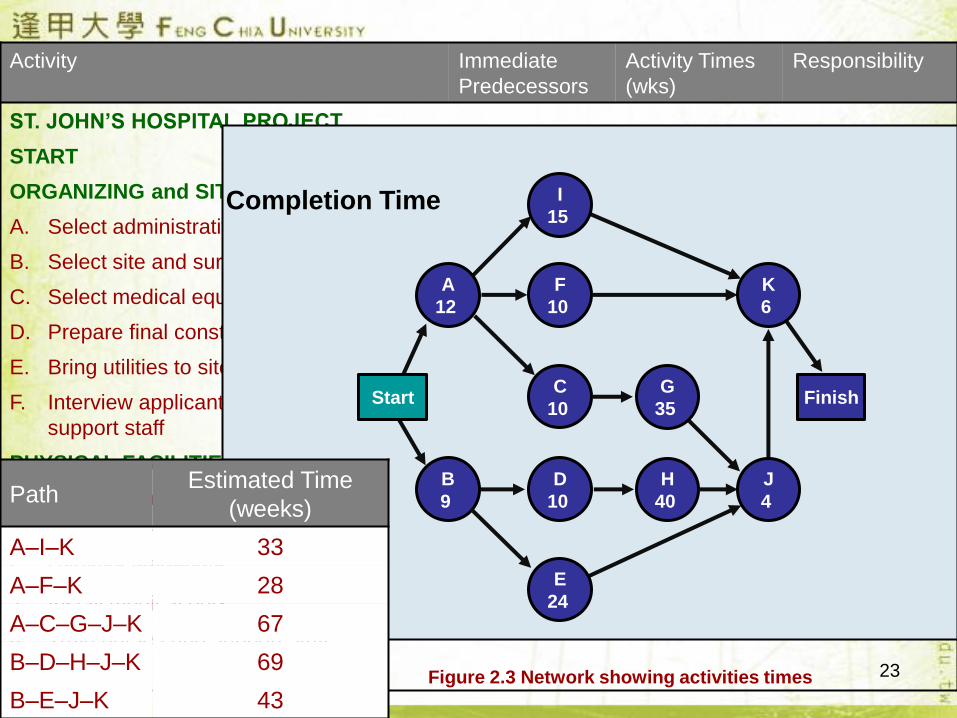
3. Developing the Schedule /5
(1) Estimating the completion time by finding the
critical path.
• The sequence of activities between a project’s start and
finish is a path.
• The critical path is the path that takes the longest time
to complete.
• The activities along the critical path determine the
completion time of the project.
23
Activity Immediate
Predecessors
Activity Times
(wks)
Responsibility
ST. JOHN’S HOSPITAL PROJECT
START
ORGANIZING and SITE PREPARATION
A. Select administrative staff
B. Select site and survey
C. Select medical equipment
D. Prepare final construction plans
E. Bring utilities to site
F. Interview applicants for nursing and
support staff
PHYSICAL FACILITIES and INFRASTRUCTURE
G. Purchase and deliver equipment
H. Construct hospital
I. Develop information system
J. Install medical equipment
K. Train nurses and support staff
FINISH
Completion Time
Finish
K
6
I
15
F
10
C
10
D
10
H
40
J
4
A
12
B
9
Figure 2.3
StartG
35
E
24
PathEstimated Time
(weeks)
A–I–K 33
A–F–K 28
A–C–G–J–K 67
B–D–H–J–K 69
B–E–J–K 43Figure 2.3 Network showing activities times
24
Activity Immediate
Predecessors
Activity Times
(wks)
Responsibility
ST. JOHN’S HOSPITAL PROJECT
START
ORGANIZING and SITE PREPARATION
A. Select administrative staff
B. Select site and survey
C. Select medical equipment
D. Prepare final construction plans
E. Bring utilities to site
F. Interview applicants for nursing and
support staff
PHYSICAL FACILITIES and INFRASTRUCTURE
G. Purchase and deliver equipment
H. Construct hospital
I. Develop information system
J. Install medical equipment
K. Train nurses and support staff
FINISH
Completion Time
Finish
K
6
I
15
F
10
C
10
D
10
H
40
J
4
A
12
B
9
StartG
35
E
24
PathEstimated Time
(weeks)
A–I–K 33
A–F–K 28
A–C–G–J–K 67
B–D–H–J–K 69
B–E–J–K 43Figure 2.3 Network showing activities times
25
3. Developing the Schedule /4
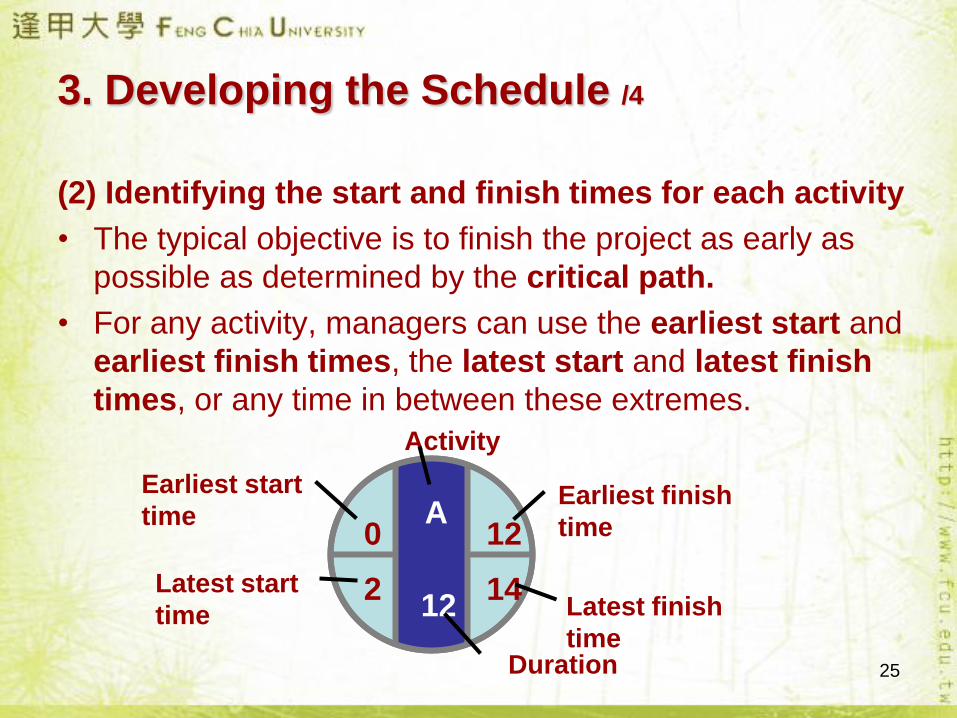
(2) Identifying the start and finish times for each activity
• The typical objective is to finish the project as early as
possible as determined by the critical path.
• For any activity, managers can use the earliest start and
earliest finish times, the latest start and latest finish
times, or any time in between these extremes.
Latest finish
time
Latest start
time
Activity
Duration
Earliest start
timeEarliest finish
time0
2
12
14
A
12
26
3. Developing the Schedule /3
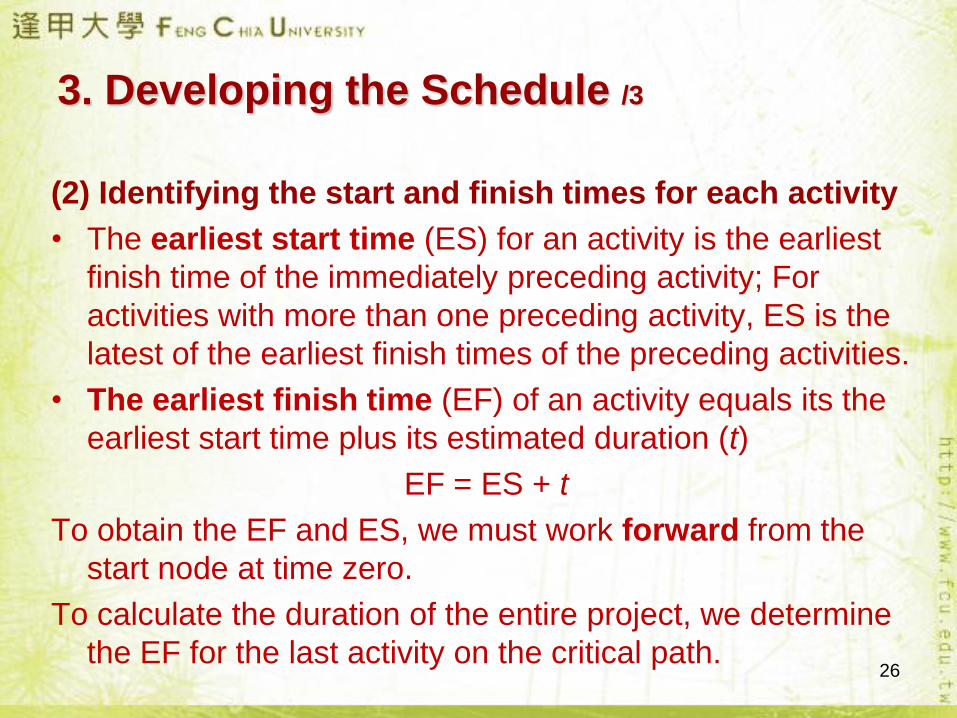
(2) Identifying the start and finish times for each activity
• The earliest start time (ES) for an activity is the earliest
finish time of the immediately preceding activity; For
activities with more than one preceding activity, ES is the
latest of the earliest finish times of the preceding activities.
• The earliest finish time (EF) of an activity equals its the
earliest start time plus its estimated duration (t)
EF = ES + t
To obtain the EF and ES, we must work forward from the
start node at time zero.
To calculate the duration of the entire project, we determine
the EF for the last activity on the critical path.
27
3. Developing the Schedule /2
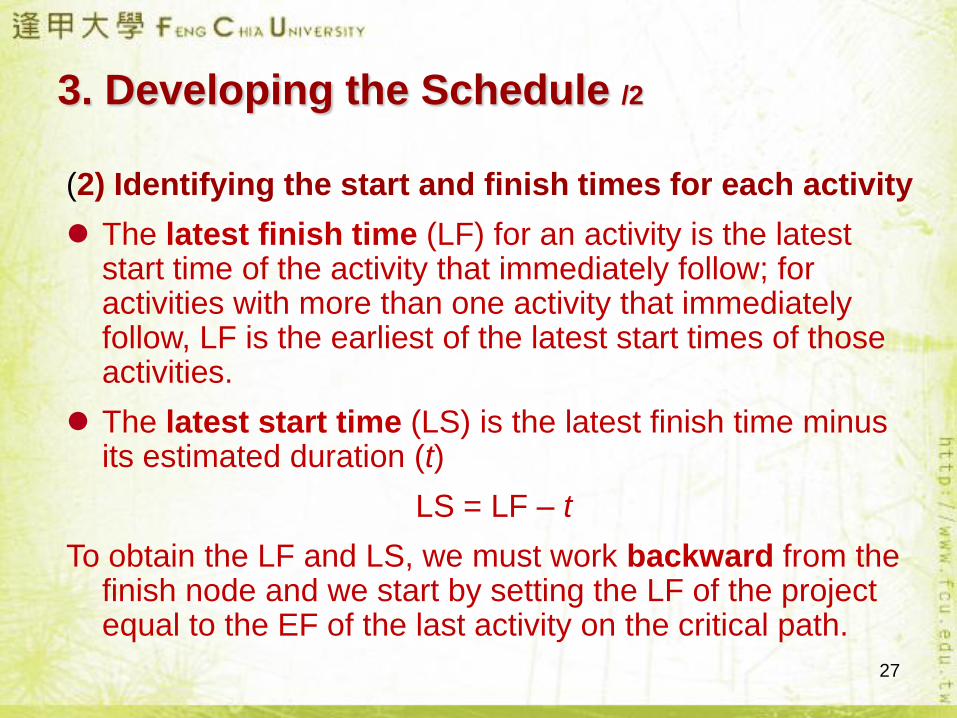
(2) Identifying the start and finish times for each activity
The latest finish time (LF) for an activity is the latest start time of the activity that immediately follow; for activities with more than one activity that immediately follow, LF is the earliest of the latest start times of those activities.
The latest start time (LS) is the latest finish time minus its estimated duration (t)
LS = LF – t
To obtain the LF and LS, we must work backward from the finish node and we start by setting the LF of the project equal to the EF of the last activity on the critical path.
28
3. Developing the Schedule /1
(3) Calculating the amount of slack time for each activity
• Activity slack is the maximum length of time an activity can
be delayed without delaying the entire project.
• Activity slack (S) can be calculated in two ways:
S = LS – ES or S = LF – EF
• Activities on the critical path have zero slack.
• Activity slack is the amount of schedule slippage that can be
tolerated for an activity before the entire project will be
delayed.
29
Calculate the ES, EF, LS, LF, and slack times for each
activity in the hospital project. Which activity should Kramer
start immediately? Figure 2.3 contains the activity times.
SOLUTION
(1) To compute the early start and early finish times, we begin at the start node at time zero. Because activities A and B have no predecessors, the earliest start times for these activities are also zero. The earliest finish times for these activities are:
EFA = 0 + 12 = 12 and EFB = 0 + 9 = 9
EXAMPLE 2.2 /6
30
EXAMPLE 2.2 /5
Because the earliest start time for activities I, F, and C is
the earliest finish time of activity A,
ESI = 12, ESF = 12, and ESC = 12
Similarly,
ESD = 9 and ESE = 9
After placing these ES values on the network diagram, we determine the EF times for activities I, F, C, D, and E:
EFI = 12 + 15 = 27, EFF = 12 + 10 = 22, EFC = 12 + 10 = 22,
EFD = 9 + 10 = 19, and EFE = 9 + 24 = 33
31
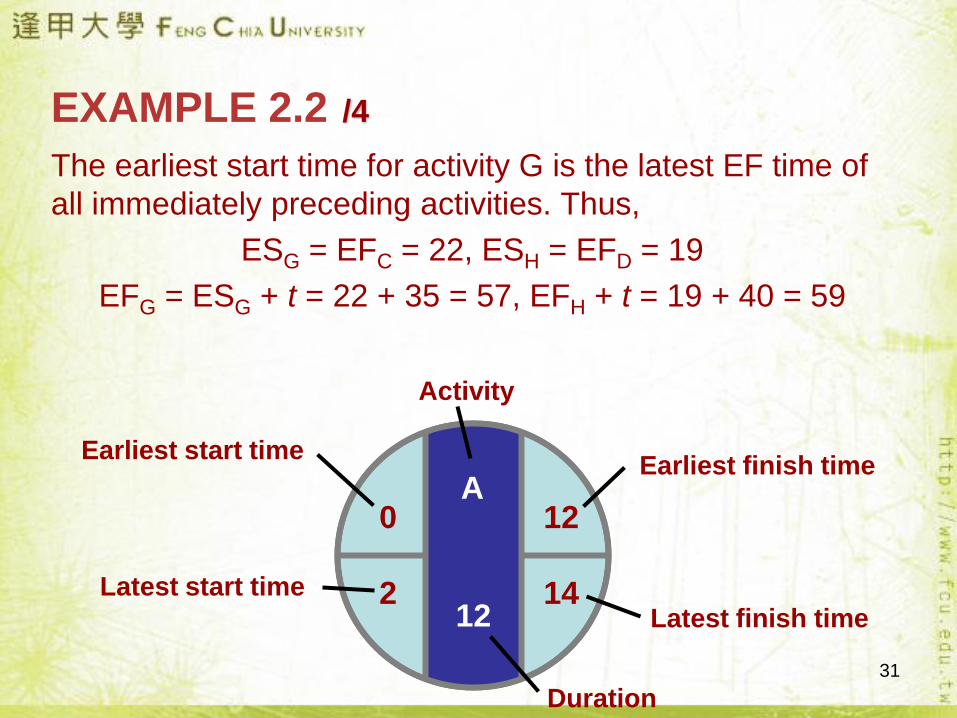
The earliest start time for activity G is the latest EF time of
all immediately preceding activities. Thus,
ESG = EFC = 22, ESH = EFD = 19
EFG = ESG + t = 22 + 35 = 57, EFH + t = 19 + 40 = 59
Latest finish time
Latest start time
Activity
Duration
Earliest start timeEarliest finish time
0
2
12
14
A
12
EXAMPLE 2.2 /4

32
Network Diagram
K
6
C
10
G
35
J
4
H
40
B
9
D
10
E
24
I
15
FinishStart
A
12
F
10
0 9
9 33
9 19 19 59
22 5712 22
59 63
12 27
12 22 63 690 12
Figure 2.4 Network diagram showing earliest start and finish times
Forward method
33
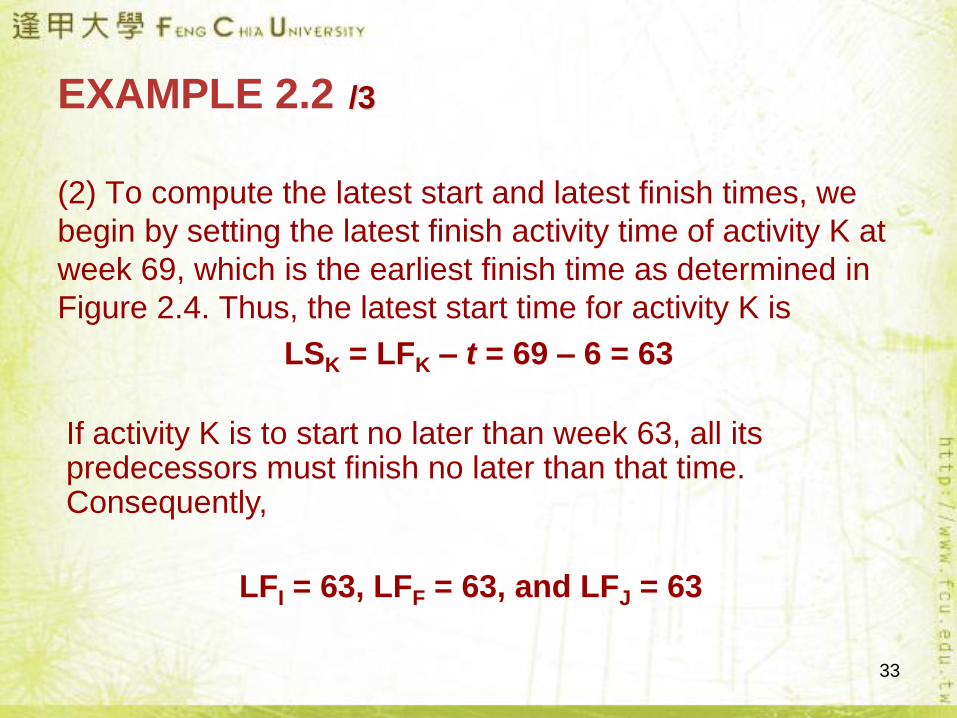
(2) To compute the latest start and latest finish times, we
begin by setting the latest finish activity time of activity K at
week 69, which is the earliest finish time as determined in
Figure 2.4. Thus, the latest start time for activity K is
LSK = LFK – t = 69 – 6 = 63
If activity K is to start no later than week 63, all its predecessors must finish no later than that time. Consequently,
LFI = 63, LFF = 63, and LFJ = 63
EXAMPLE 2.2 /3
34
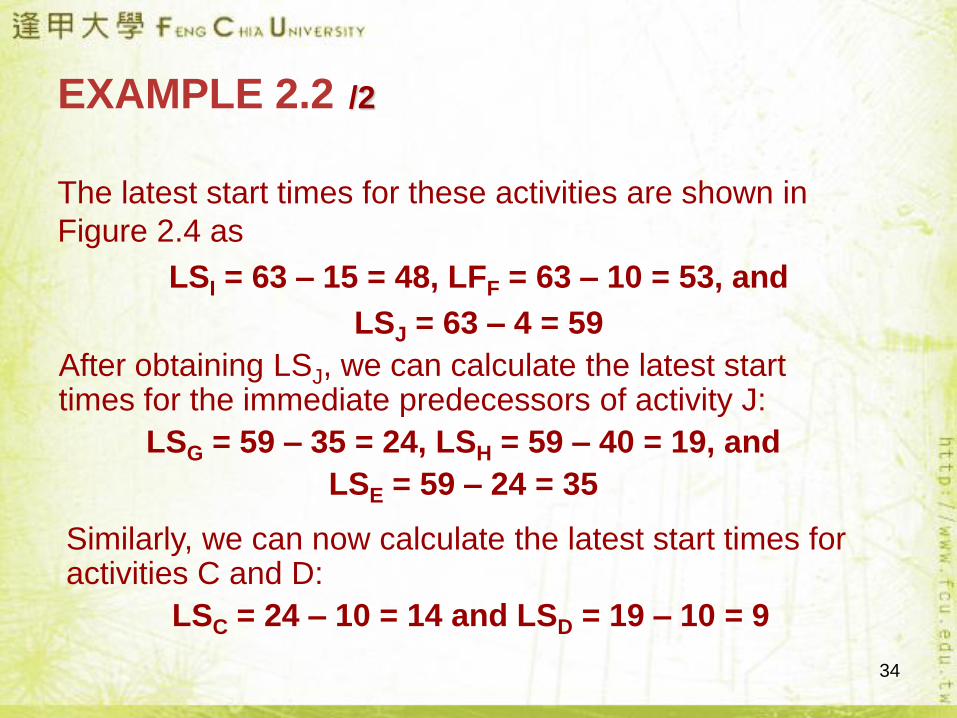
The latest start times for these activities are shown in
Figure 2.4 as
LSI = 63 – 15 = 48, LFF = 63 – 10 = 53, and
LSJ = 63 – 4 = 59
After obtaining LSJ, we can calculate the latest start times for the immediate predecessors of activity J:
LSG = 59 – 35 = 24, LSH = 59 – 40 = 19, and
LSE = 59 – 24 = 35
Similarly, we can now calculate the latest start times for activities C and D:
LSC = 24 – 10 = 14 and LSD = 19 – 10 = 9
EXAMPLE 2.2 /2
35
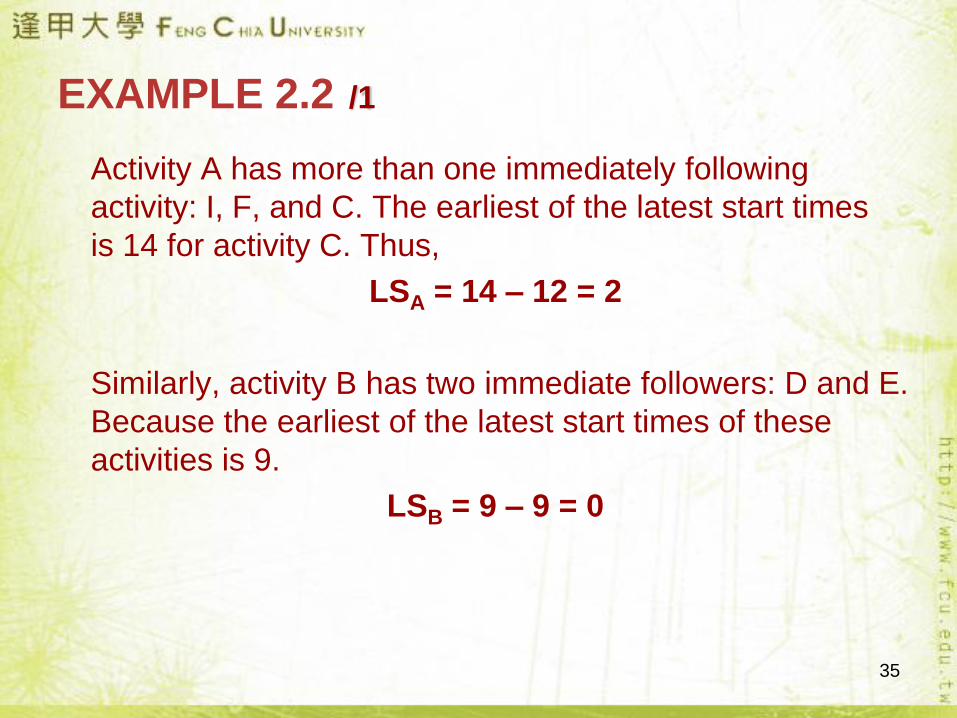
Activity A has more than one immediately following
activity: I, F, and C. The earliest of the latest start times
is 14 for activity C. Thus,
LSA = 14 – 12 = 2
Similarly, activity B has two immediate followers: D and E.
Because the earliest of the latest start times of these
activities is 9.
LSB = 9 – 9 = 0
EXAMPLE 2.2 /1
36
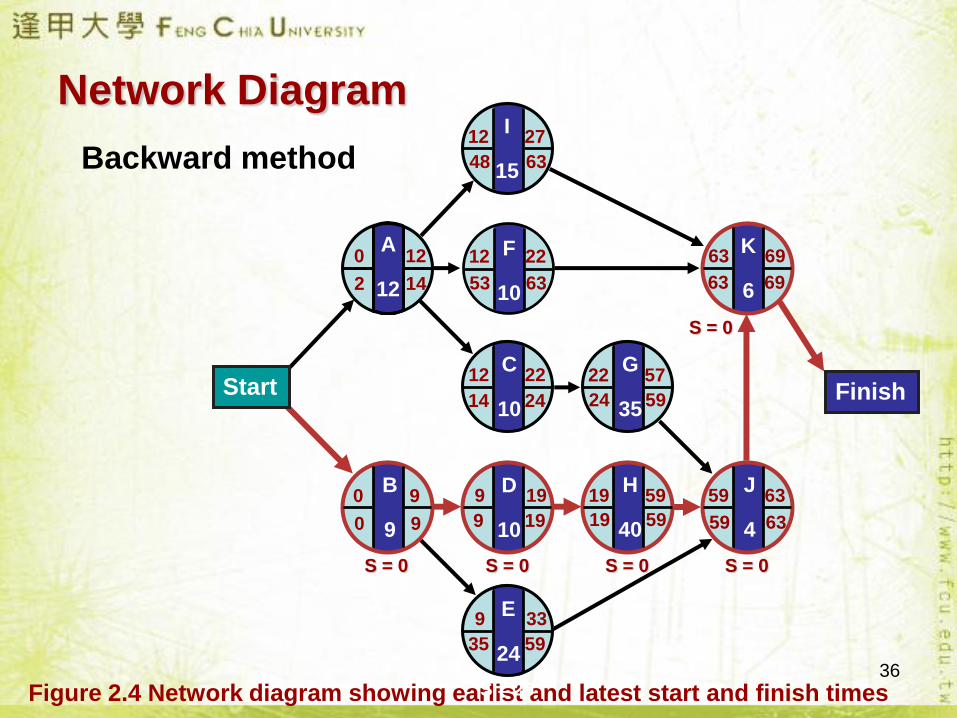
Network Diagram
Figure 2.4 Network diagram showing earlist and latest start and finish times
K
6
C
10
G
35
J
4
H
40
B
9
D
10
E
24
I
15
FinishStart
A
12
F
10
0 9
9 33
9 19 19 59
22 5712 22
59 63
12 27
12 22 63 690 12
48 63
53 63
59 63
24 59
19 59
35 59
14 24
9 19
2 14
0 9
63 69
S = 36
S = 2 S = 41
S = 2
S = 26
S = 2
S = 0
S = 0
S = 0S = 0S = 0
Backward method

37
Network Diagram
Figure 2.4 Network diagram showing start and finish times and activity slack
K
6
C
10
G
35
J
4
H
40
B
9
D
10
E
24
I
15
FinishStart
A
12
F
10
0 9
9 33
9 19 19 59
22 5712 22
59 63
12 27
12 22 63 690 12
48 63
53 63
59 63
24 59
19 59
35 59
14 24
9 19
2 14
0 9
63 69
S = 36
S = 2 S = 41
S = 2
S = 26
S = 2
S = 0
S = 0
S = 0S = 0S = 0
S = 2
S = 36
S = 41
S = 2 S = 2
S = 26
Slack times
38
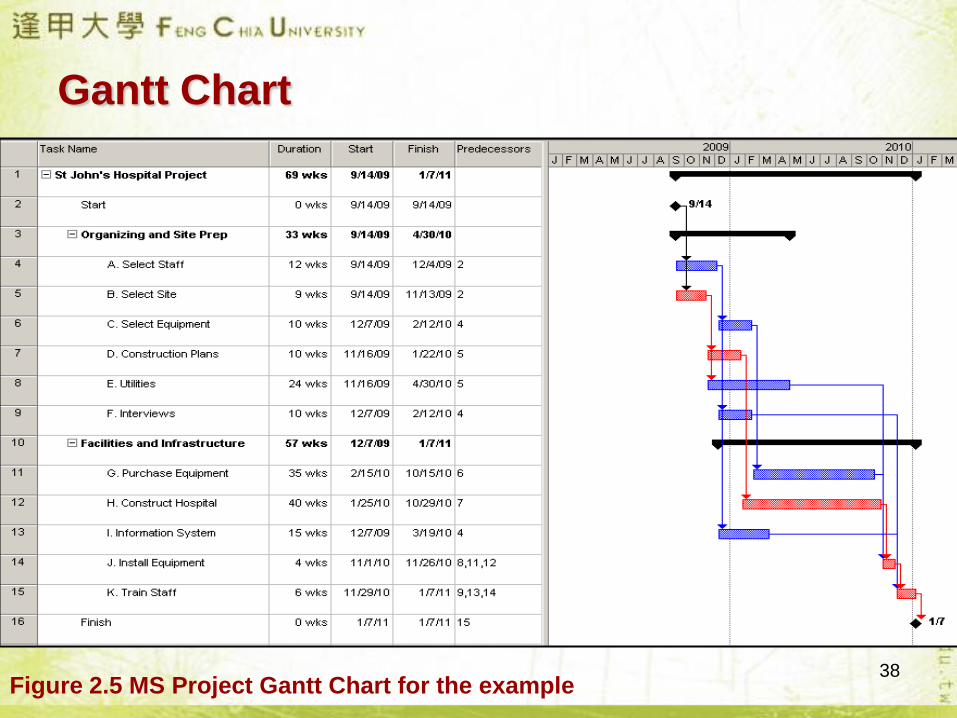
Gantt Chart
Figure 2.5 MS Project Gantt Chart for the example
39
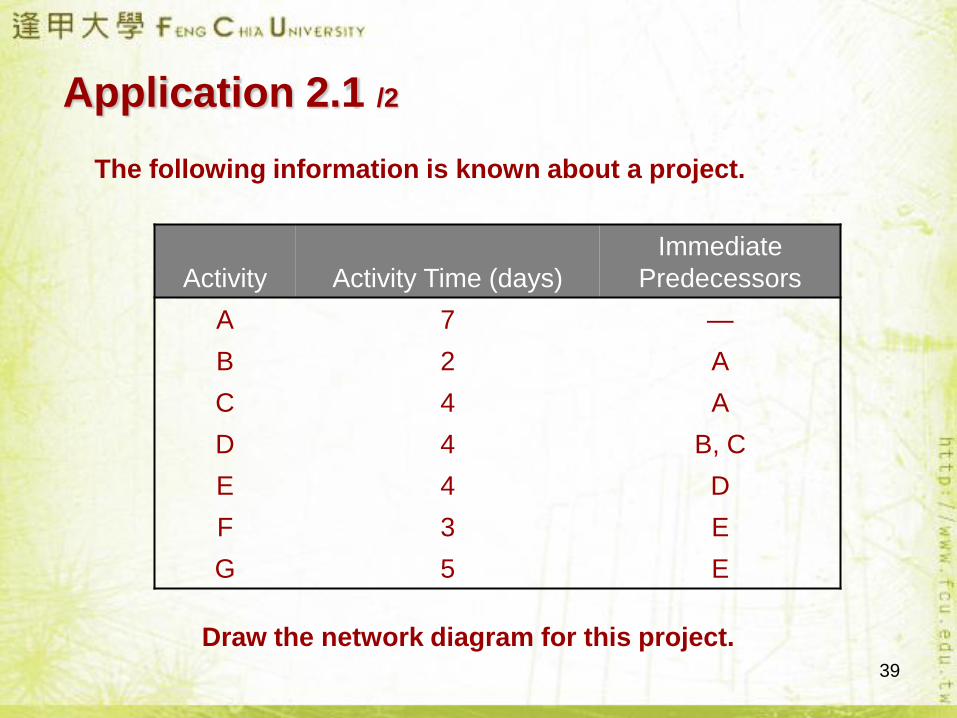
Application 2.1 /2
The following information is known about a project.
Draw the network diagram for this project.
Activity Activity Time (days)
Immediate
Predecessors
A 7 —
B 2 A
C 4 A
D 4 B, C
E 4 D
F 3 E
G 5 E
40
Finish
G
5
F
3
E
4
D
4
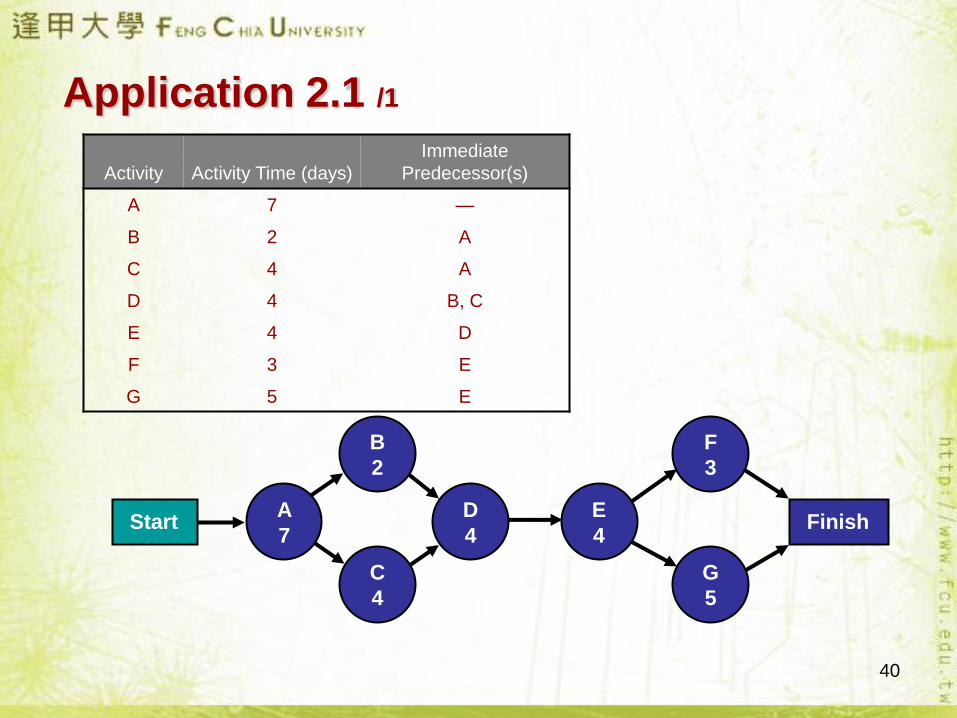
Application 2.1 /1
Activity Activity Time (days)
Immediate
Predecessor(s)
A 7 —
B 2 A
C 4 A
D 4 B, C
E 4 D
F 3 E
G 5 E
B
2
C
4
StartA
7
41
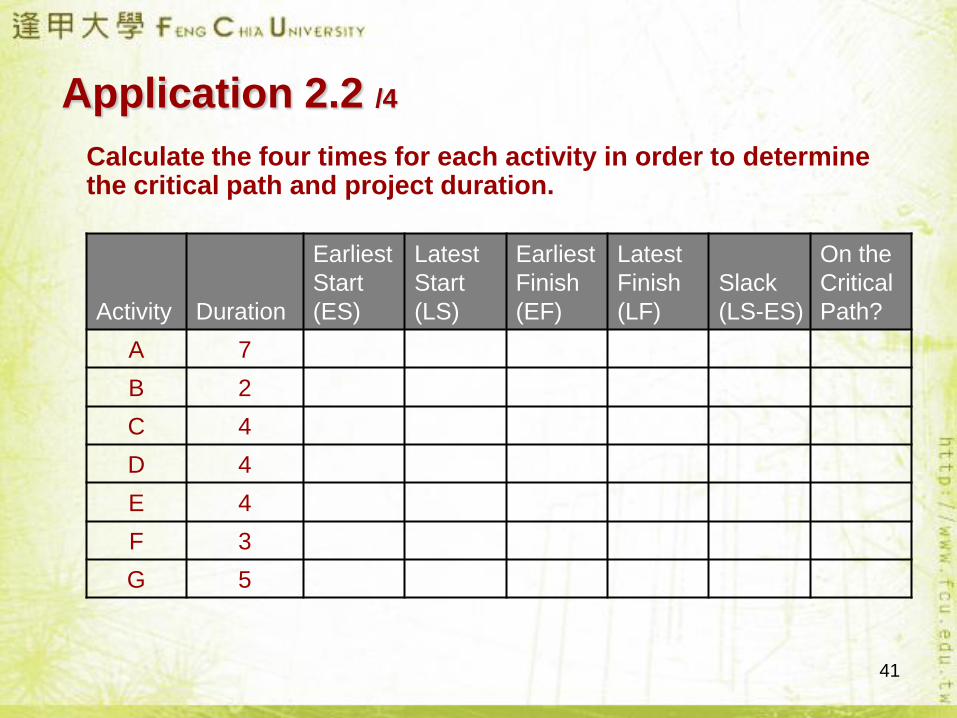
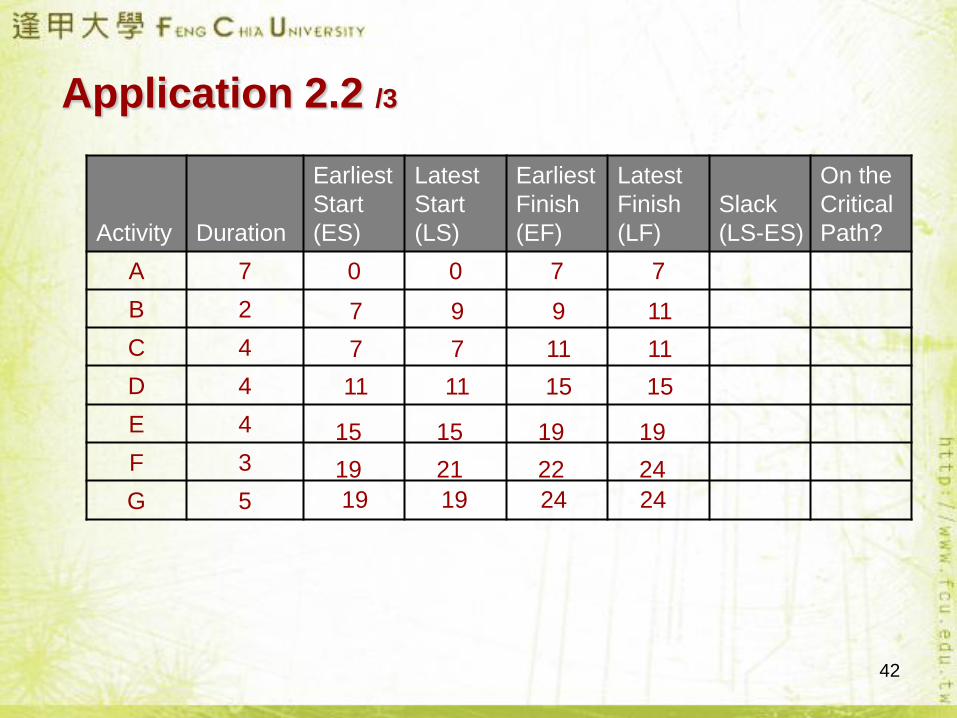
Application 2.2 /4
Calculate the four times for each activity in order to determine the critical path and project duration.
Activity Duration
Earliest
Start
(ES)
Latest
Start
(LS)
Earliest
Finish
(EF)
Latest
Finish
(LF)
Slack
(LS-ES)
On the
Critical
Path?
A 7
B 2
C 4
D 4
E 4
F 3
G 5
42
Application 2.2 /3
Activity Duration
Earliest
Start
(ES)
Latest
Start
(LS)
Earliest
Finish
(EF)
Latest
Finish
(LF)
Slack
(LS-ES)
On the
Critical
Path?
A 7 0 0 7 7
B 2
C 4
D 4
E 4
F 3
G 5
7 9 9 11
7 7 11 11
19 21 22 24
19 19 24 24
11 11 15 15
15 15 19 19
43
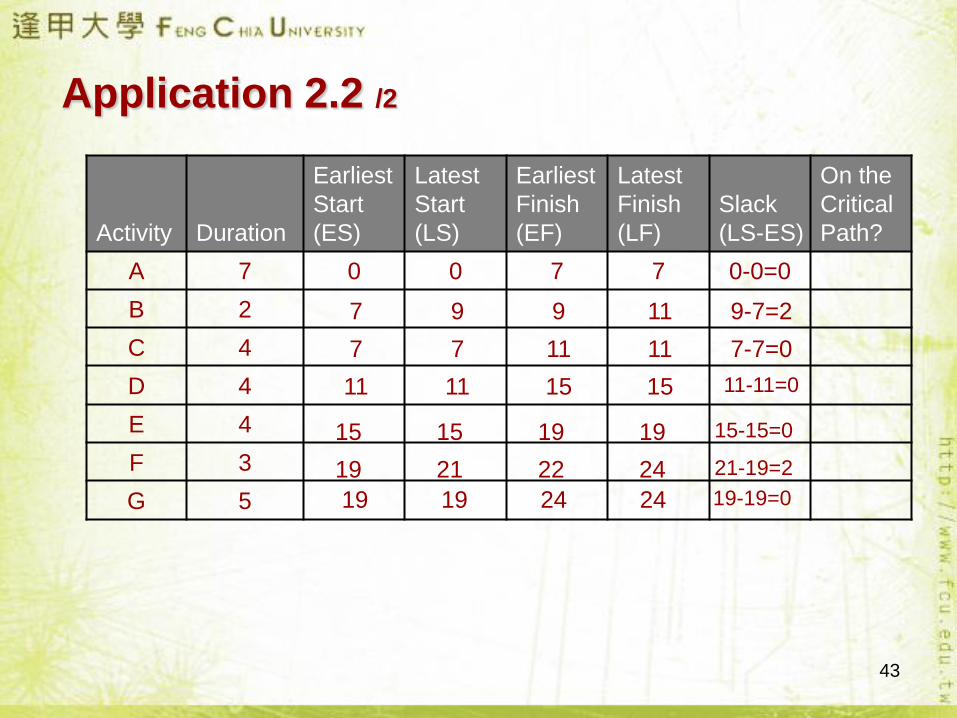
Application 2.2 /2
Activity Duration
Earliest
Start
(ES)
Latest
Start
(LS)
Earliest
Finish
(EF)
Latest
Finish
(LF)
Slack
(LS-ES)
On the
Critical
Path?
A 7 0 0 7 7 0-0=0
B 2
C 4
D 4
E 4
F 3
G 5
7 9 9 11 9-7=2
7 7 11 11 7-7=0
19 21 22 24 21-19=2
19 19 24 24 19-19=0
11 11 15 15 11-11=0
15 15 19 19 15-15=0
44
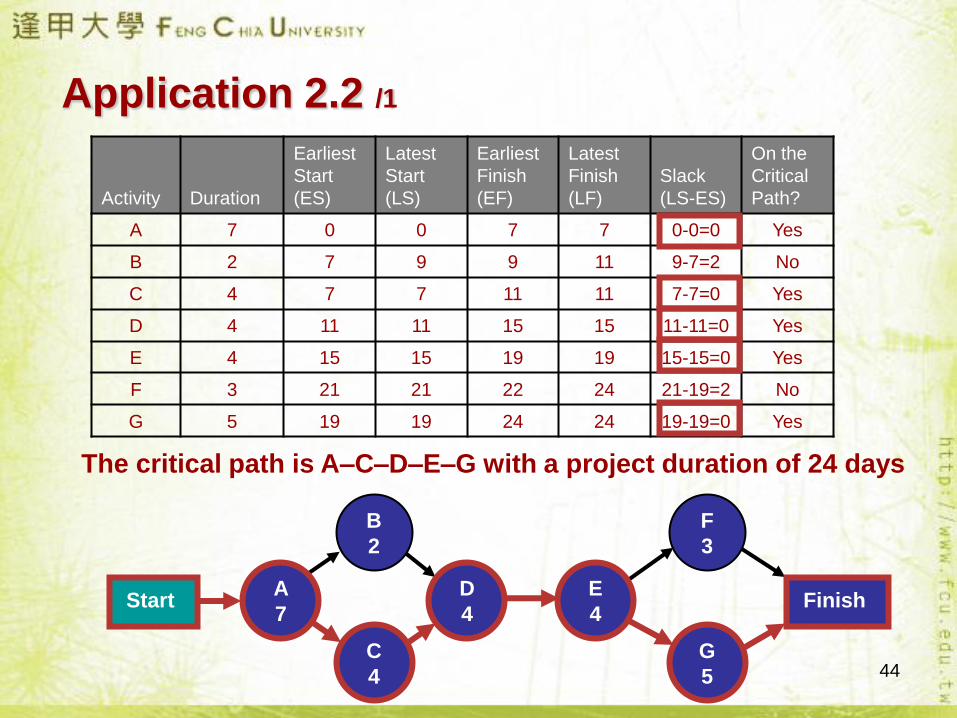
Application 2.2 /1
Activity Duration
Earliest
Start
(ES)
Latest
Start
(LS)
Earliest
Finish
(EF)
Latest
Finish
(LF)
Slack
(LS-ES)
On the
Critical
Path?
A 7 0 0 7 7 0-0=0 Yes
B 2 7 9 9 11 9-7=2 No
C 4 7 7 11 11 7-7=0 Yes
D 4 11 11 15 15 11-11=0 Yes
E 4 15 15 19 19 15-15=0 Yes
F 3 21 21 22 24 21-19=2 No
G 5 19 19 24 24 19-19=0 Yes
Start FinishA
7
B
2
C
4
D
4
E
4
F
3
G
5
The critical path is A–C–D–E–G with a project duration of 24 days
Analyzing Cost-Time Trade-Offs /3
• Keeping cost at acceptable levels is as important as
meeting schedule dates.
• There are always cost-time trade-offs in project
management.
• Managers can shorten individual activity times by using
additional resources such as overtime, personnel, or
equipment.
• So, a project can be completed earlier than scheduled
by hiring more workers or running extra shifts.
• Such actions could be advantageous if savings or
additional revenues accrue from completing the project
early..
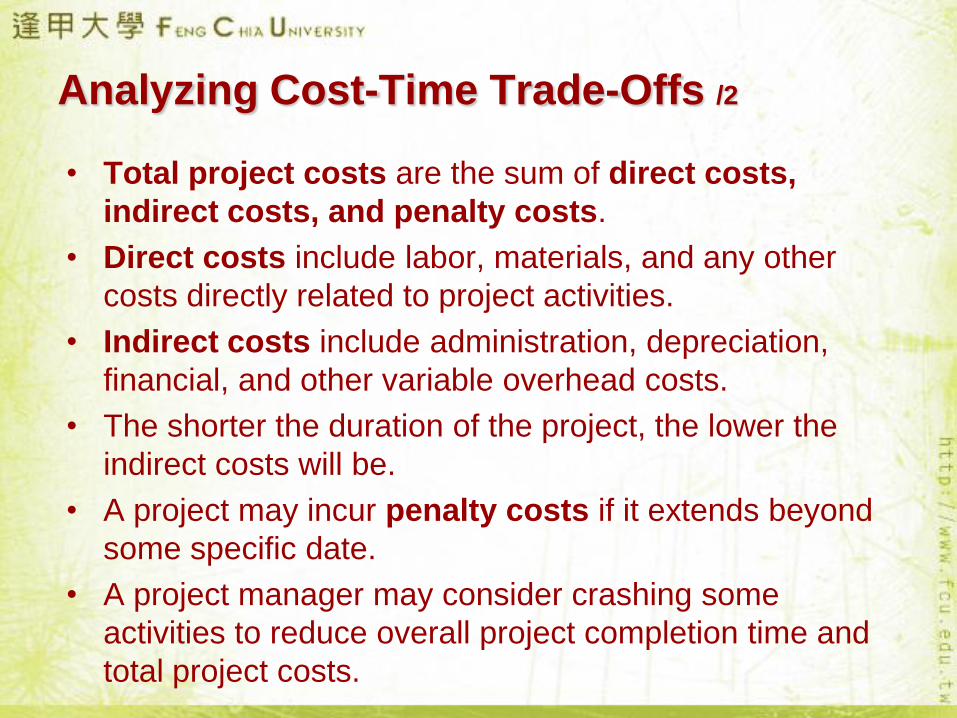
Analyzing Cost-Time Trade-Offs /2
• Total project costs are the sum of direct costs,
indirect costs, and penalty costs.
• Direct costs include labor, materials, and any other
costs directly related to project activities.
• Indirect costs include administration, depreciation,
financial, and other variable overhead costs.
• The shorter the duration of the project, the lower the
indirect costs will be.
• A project may incur penalty costs if it extends beyond
some specific date.
• A project manager may consider crashing some
activities to reduce overall project completion time and
total project costs.
47
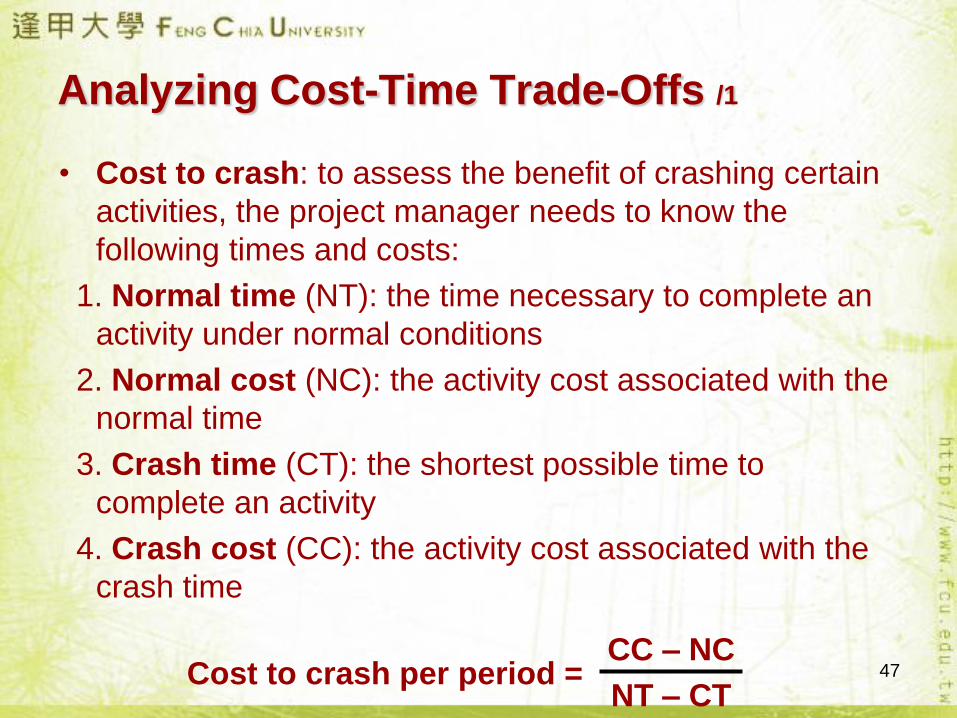
Analyzing Cost-Time Trade-Offs /1
• Cost to crash: to assess the benefit of crashing certain
activities, the project manager needs to know the
following times and costs:
1. Normal time (NT): the time necessary to complete an
activity under normal conditions
2. Normal cost (NC): the activity cost associated with the
normal time
3. Crash time (CT): the shortest possible time to
complete an activity
4. Crash cost (CC): the activity cost associated with the
crash time
Cost to crash per period =CC – NC
NT – CT
48
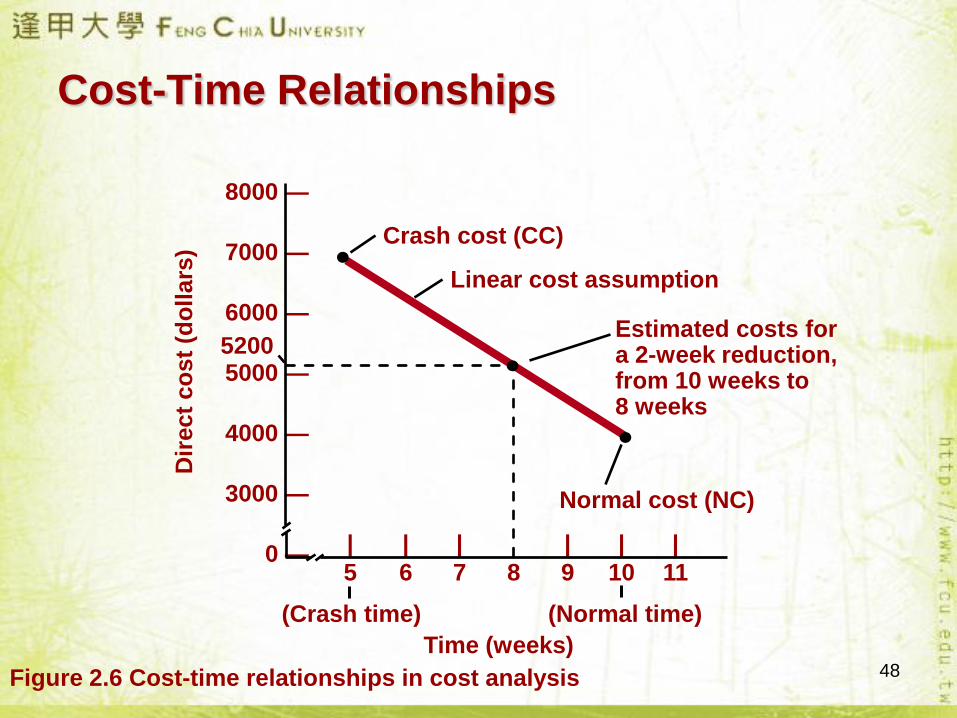
Cost-Time Relationships
Linear cost assumption
8000 —
7000 —
6000 —
5000 —
4000 —
3000 —
0 —
Dir
ect
co
st
(do
llars
)
| | | | | |
5 6 7 8 9 10 11
Time (weeks)
Crash cost (CC)
Normal cost (NC)
(Crash time) (Normal time)
Estimated costs for a 2-week reduction, from 10 weeks to 8 weeks
5200
Figure 2.6 Cost-time relationships in cost analysis
49
A Minimum-Cost Schedule
The procedure of the minimum-cost schedule involves the
following steps:
Step 1. Determine the project’s critical path(s).
Step 2. Find the activity or activities on the critical path(s)
with the lowest cost of crashing per week.
Step 3. Reduce the time for this activity until (a) it cannot
be further reduced, (b) another path become critical, or (c)
the increase in direct costs exceeds the savings that result
from shortening the project. If more than one path is critical,
the time for an activity on each path may have to be
reduced simultaneously.
Step 4. Repeat this procedure until the increase in direct
costs is larger than the savings generated by shortening
the project.
50
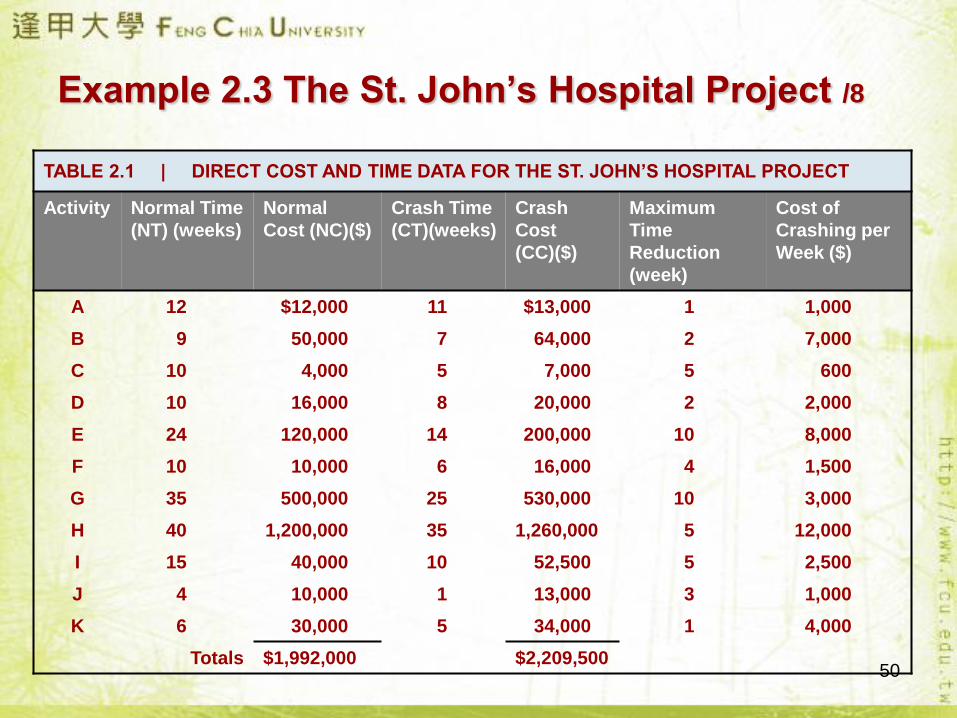
Example 2.3 The St. John’s Hospital Project /8
TABLE 2.1 | DIRECT COST AND TIME DATA FOR THE ST. JOHN’S HOSPITAL PROJECT
Activity Normal Time
(NT) (weeks)
Normal
Cost (NC)($)
Crash Time
(CT)(weeks)
Crash
Cost
(CC)($)
Maximum
Time
Reduction
(week)
Cost of
Crashing per
Week ($)
A 12 $12,000 11 $13,000 1 1,000
B 9 50,000 7 64,000 2 7,000
C 10 4,000 5 7,000 5 600
D 10 16,000 8 20,000 2 2,000
E 24 120,000 14 200,000 10 8,000
F 10 10,000 6 16,000 4 1,500
G 35 500,000 25 530,000 10 3,000
H 40 1,200,000 35 1,260,000 5 12,000
I 15 40,000 10 52,500 5 2,500
J 4 10,000 1 13,000 3 1,000
K 6 30,000 5 34,000 1 4,000
Totals $1,992,000 $2,209,500
51
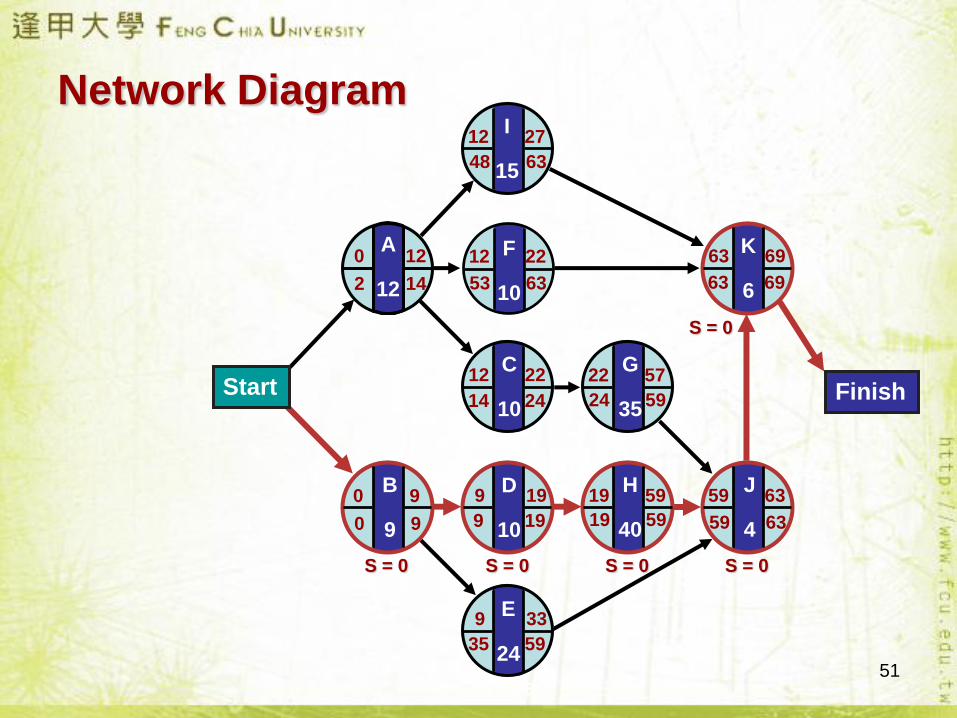
Network Diagram
K
6
C
10
G
35
J
4
H
40
B
9
D
10
E
24
I
15
FinishStart
A
12
F
10
0 9
9 33
9 19 19 59
22 5712 22
59 63
12 27
12 22 63 690 12
48 63
53 63
59 63
24 59
19 59
35 59
14 24
9 19
2 14
0 9
63 69
S = 36
S = 2 S = 41
S = 2
S = 26
S = 2
S = 0
S = 0
S = 0S = 0S = 0
52
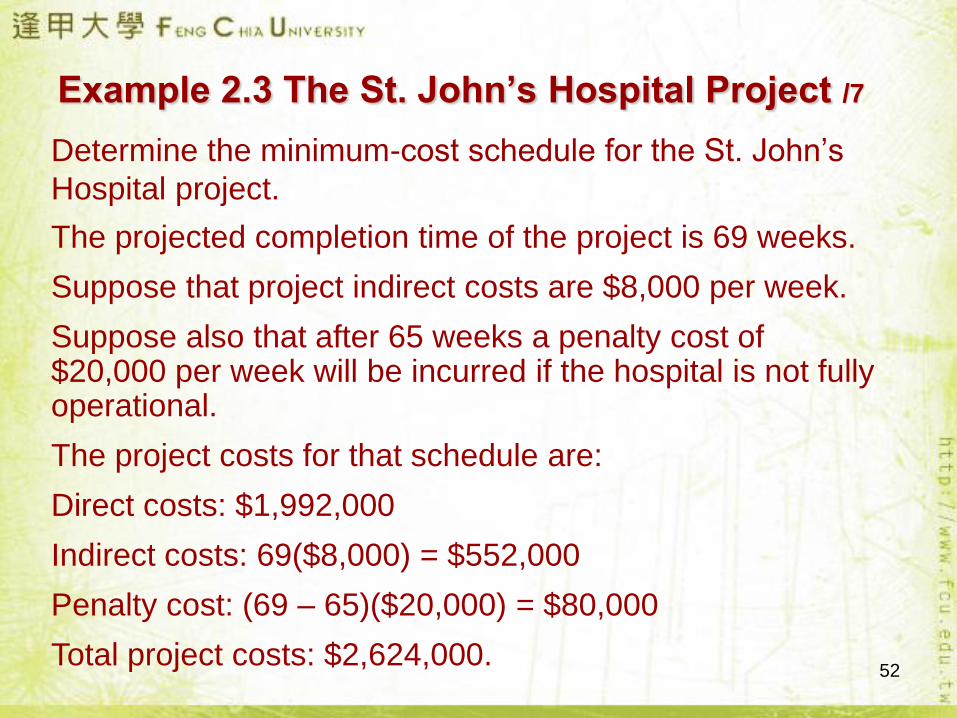
Example 2.3 The St. John’s Hospital Project /7
Determine the minimum-cost schedule for the St. John’s
Hospital project.
The projected completion time of the project is 69 weeks.
Suppose that project indirect costs are $8,000 per week.
Suppose also that after 65 weeks a penalty cost of $20,000 per week will be incurred if the hospital is not fully operational.
The project costs for that schedule are:
Direct costs: $1,992,000
Indirect costs: 69($8,000) = $552,000
Penalty cost: (69 – 65)($20,000) = $80,000
Total project costs: $2,624,000.
53
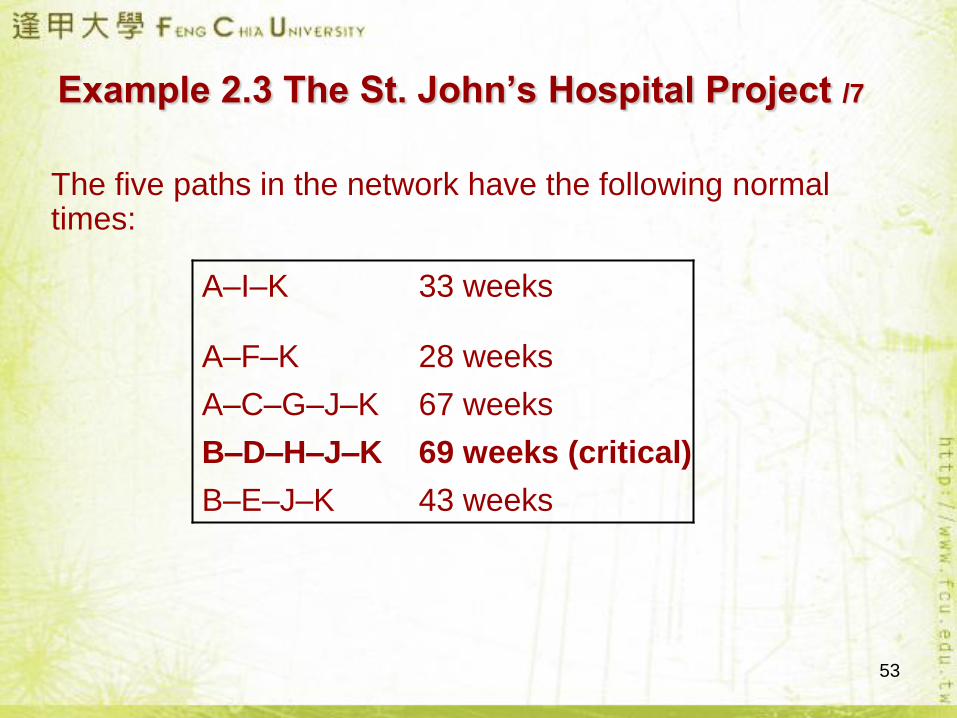
Example 2.3 The St. John’s Hospital Project /7
The five paths in the network have the following normal times:
A–I–K 33 weeks
A–F–K 28 weeks
A–C–G–J–K 67 weeks
B–D–H–J–K 69 weeks (critical)
B–E–J–K 43 weeks
54
Example 2.3 The St. John’s Hospital Project /6
STAGE 1
Step 1. The critical path is B–D–H–J–K.
Step 2. The cheapest activity to crash per week is J at $1,000, which is much less than the savings in indirect and penalty costs of $28,000 per week.
Step 3. Crash activity J by its limit of three weeks because the critical path remains unchanged.
The net savings are 3($28,000) – 3($1,000) = $81,000. The total project costs are now $2,624,000 - $81,000 = $2,543,000.
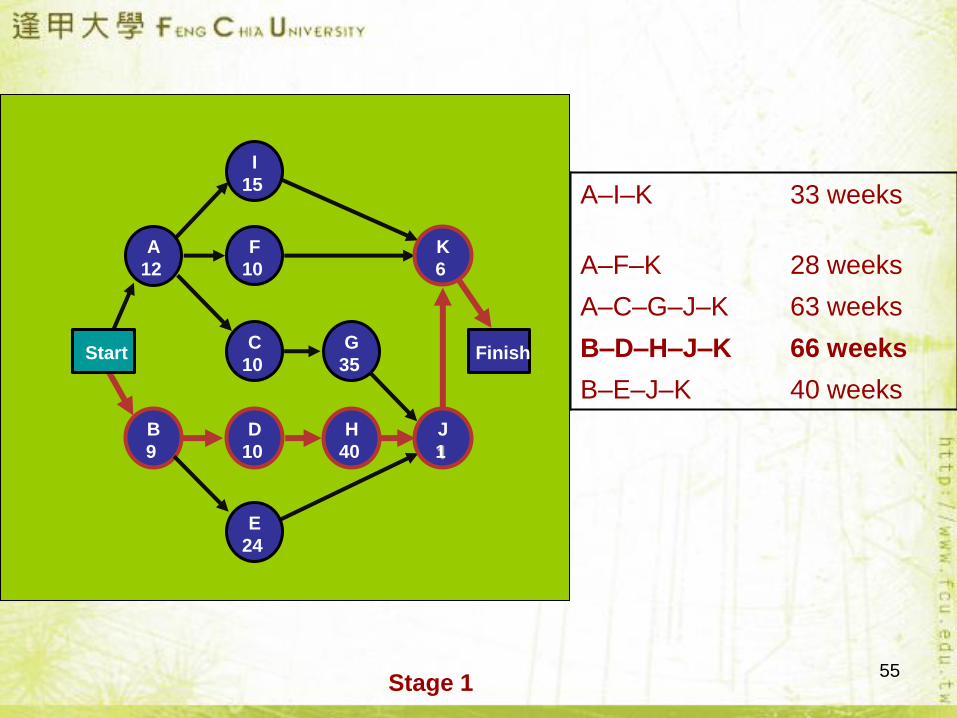
Updated path times are:
55
Finish
K
6
I
15
F
10
C
10
D
10
H
40
J
1
A
12
B
9
StartG
35
E
24
Stage 1
A–I–K 33 weeks
A–F–K 28 weeks
A–C–G–J–K 63 weeks
B–D–H–J–K 66 weeks
B–E–J–K 40 weeks
56
Example 2.3 The St. John’s Hospital Project /5
STAGE 2
Step 1. The critical path is still B–D–H–J–K.
Step 2. The cheapest activity to crash per week is now D at $2,000.
Step 3. Crash D by two weeks. The first week of reduction in activity D saves $28,000 because it eliminates a week of penalty costs, as well as indirect costs. Crashing D by a second week saves only $8,000 in indirect costs because, after week 65, no more penalty costs are incurred. These savings still exceed the cost of crashing D by two weeks.
The net savings are $28,000 + $8,000 – 2($2,000) = $32,000. Total project costs are now $2,543,000 –$32,000 = $2,511,000.
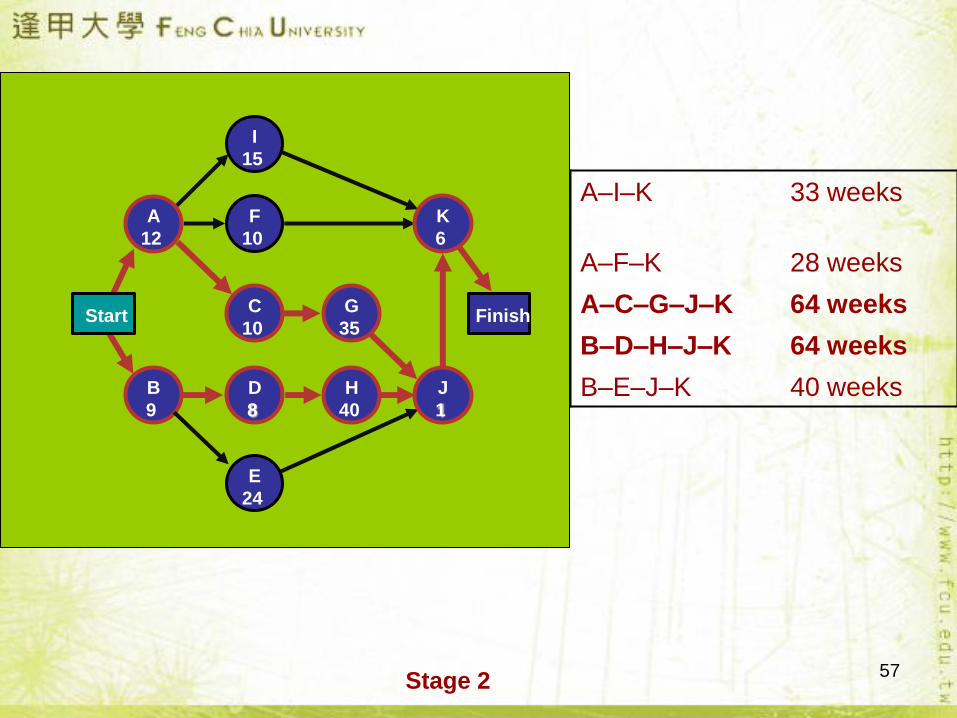
Updated path times are:
57
Finish
K
6
I
15
F
10
C
10
D
8
H
40
J
1
A
12
B
9
StartG
35
E
24
Stage 2
A–I–K 33 weeks
A–F–K 28 weeks
A–C–G–J–K 64 weeks
B–D–H–J–K 64 weeks
B–E–J–K 40 weeks
58
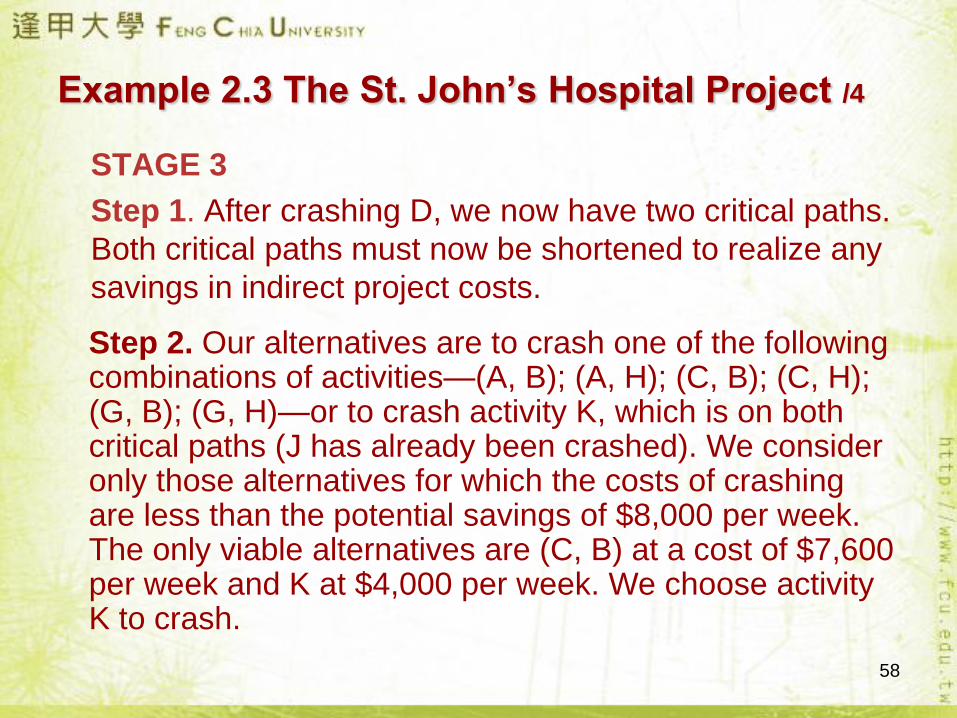
Example 2.3 The St. John’s Hospital Project /4
STAGE 3
Step 1. After crashing D, we now have two critical paths.
Both critical paths must now be shortened to realize any
savings in indirect project costs.
Step 2. Our alternatives are to crash one of the following combinations of activities—(A, B); (A, H); (C, B); (C, H); (G, B); (G, H)—or to crash activity K, which is on both critical paths (J has already been crashed). We consider only those alternatives for which the costs of crashing are less than the potential savings of $8,000 per week. The only viable alternatives are (C, B) at a cost of $7,600 per week and K at $4,000 per week. We choose activity K to crash.
59
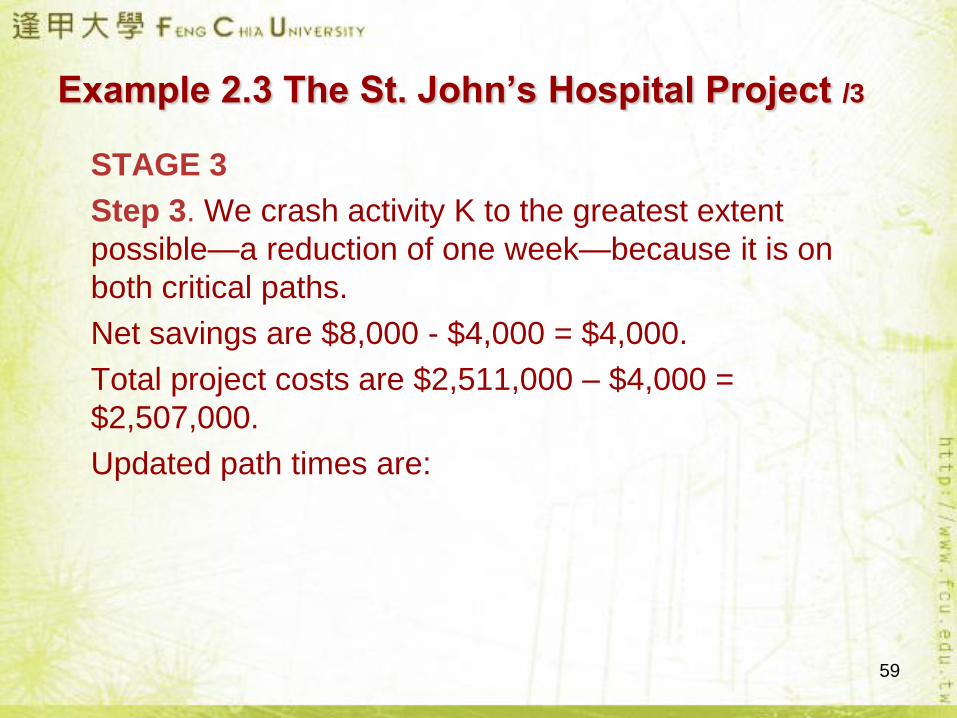
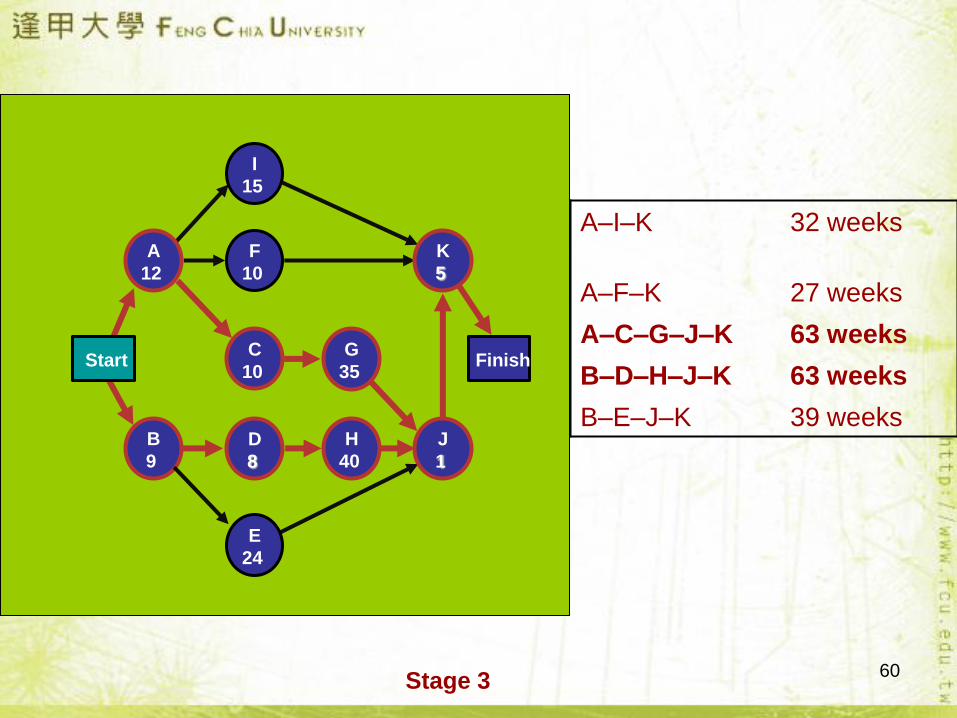
Example 2.3 The St. John’s Hospital Project /3
STAGE 3
Step 3. We crash activity K to the greatest extent
possible—a reduction of one week—because it is on
both critical paths.
Net savings are $8,000 - $4,000 = $4,000.
Total project costs are $2,511,000 – $4,000 =
$2,507,000.
Updated path times are:
60
Finish
K
5
I
15
F
10
C
10
D
8
H
40
J
1
A
12
B
9
StartG
35
E
24
Stage 3
A–I–K 32 weeks
A–F–K 27 weeks
A–C–G–J–K 63 weeks
B–D–H–J–K 63 weeks
B–E–J–K 39 weeks
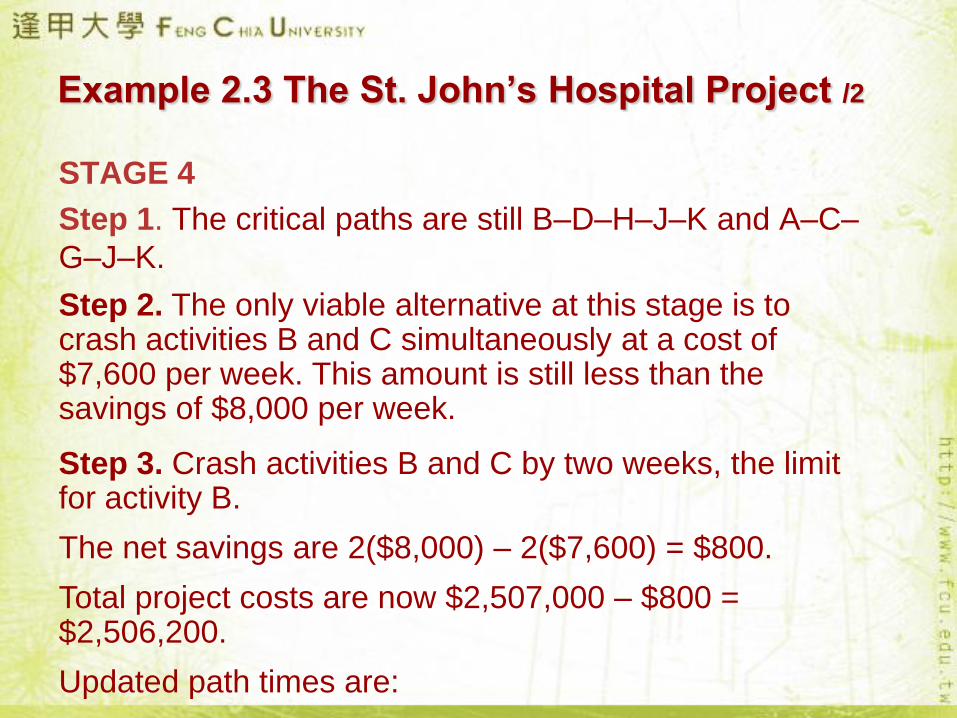
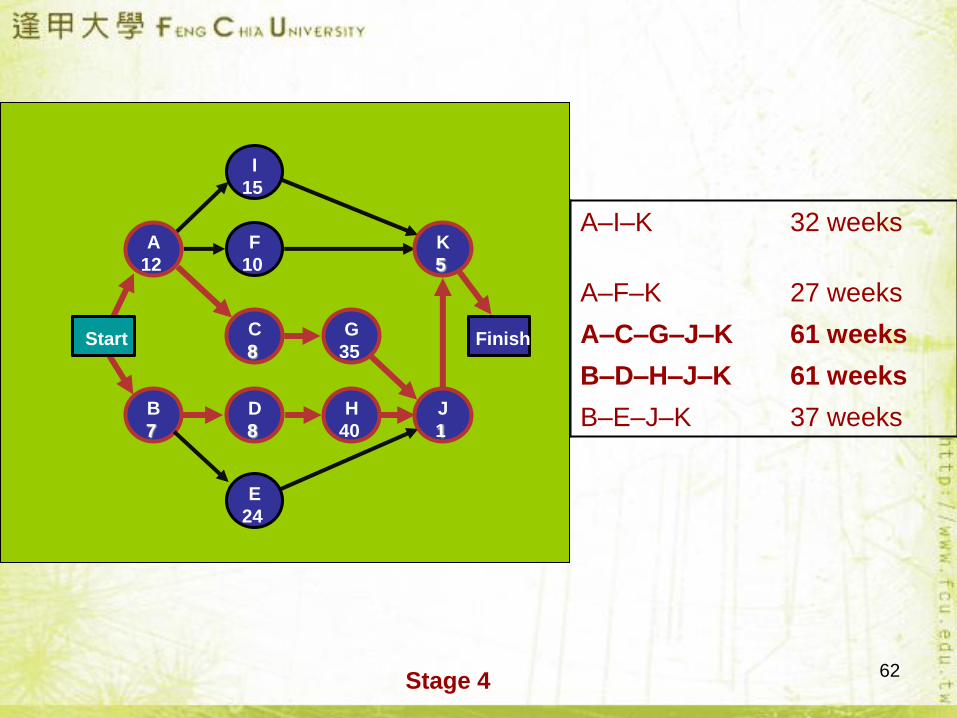
Example 2.3 The St. John’s Hospital Project /2
STAGE 4
Step 1. The critical paths are still B–D–H–J–K and A–C–
G–J–K.
Step 2. The only viable alternative at this stage is to crash activities B and C simultaneously at a cost of $7,600 per week. This amount is still less than the savings of $8,000 per week.
Step 3. Crash activities B and C by two weeks, the limit for activity B.
The net savings are 2($8,000) – 2($7,600) = $800.
Total project costs are now $2,507,000 – $800 = $2,506,200.
Updated path times are:
62
Finish
K
5
I
15
F
10
C
8
D
8
H
40
J
1
A
12
B
7
StartG
35
E
24
Stage 4
A–I–K 32 weeks
A–F–K 27 weeks
A–C–G–J–K 61 weeks
B–D–H–J–K 61 weeks
B–E–J–K 37 weeks
63
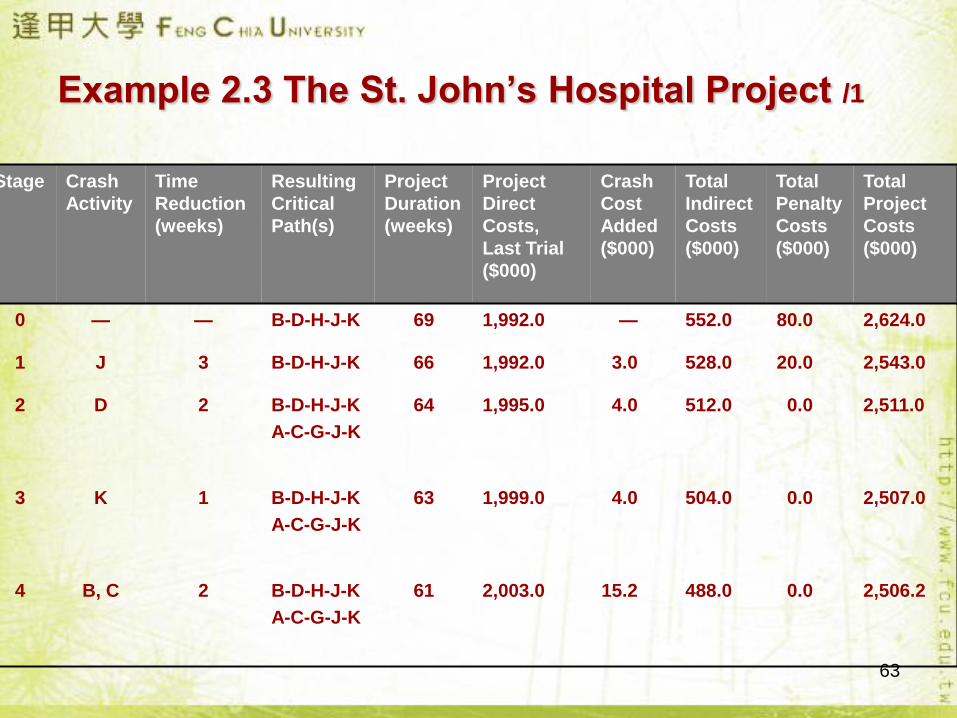
Example 2.3 The St. John’s Hospital Project /1
Stage Crash
Activity
Time
Reduction
(weeks)
Resulting
Critical
Path(s)
Project
Duration
(weeks)
Project
Direct
Costs,
Last Trial
($000)
Crash
Cost
Added
($000)
Total
Indirect
Costs
($000)
Total
Penalty
Costs
($000)
Total
Project
Costs
($000)
0 — — B-D-H-J-K 69 1,992.0 — 552.0 80.0 2,624.0
1 J 3 B-D-H-J-K 66 1,992.0 3.0 528.0 20.0 2,543.0
2 D 2 B-D-H-J-K
A-C-G-J-K
64 1,995.0 4.0 512.0 0.0 2,511.0
3 K 1 B-D-H-J-K
A-C-G-J-K
63 1,999.0 4.0 504.0 0.0 2,507.0
4 B, C 2 B-D-H-J-K
A-C-G-J-K
61 2,003.0 15.2 488.0 0.0 2,506.2
64
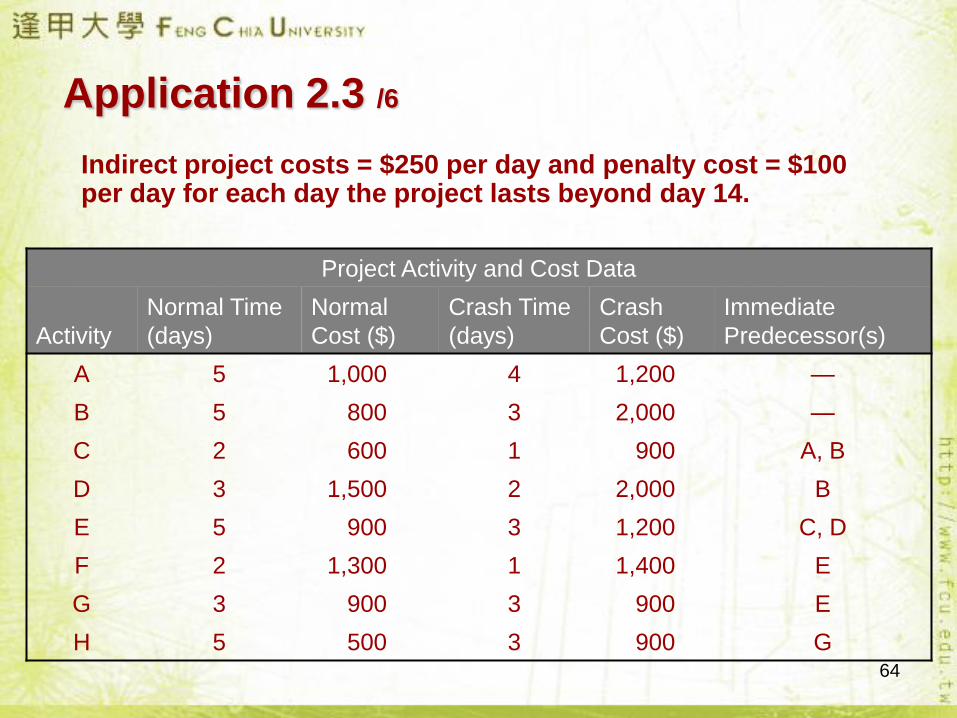
Application 2.3 /6
Indirect project costs = $250 per day and penalty cost = $100 per day for each day the project lasts beyond day 14.
Project Activity and Cost Data
Activity
Normal Time
(days)
Normal
Cost ($)
Crash Time
(days)
Crash
Cost ($)
Immediate
Predecessor(s)
A 5 1,000 4 1,200 —
B 5 800 3 2,000 —
C 2 600 1 900 A, B
D 3 1,500 2 2,000 B
E 5 900 3 1,200 C, D
F 2 1,300 1 1,400 E
G 3 900 3 900 E
H 5 500 3 900 G
65
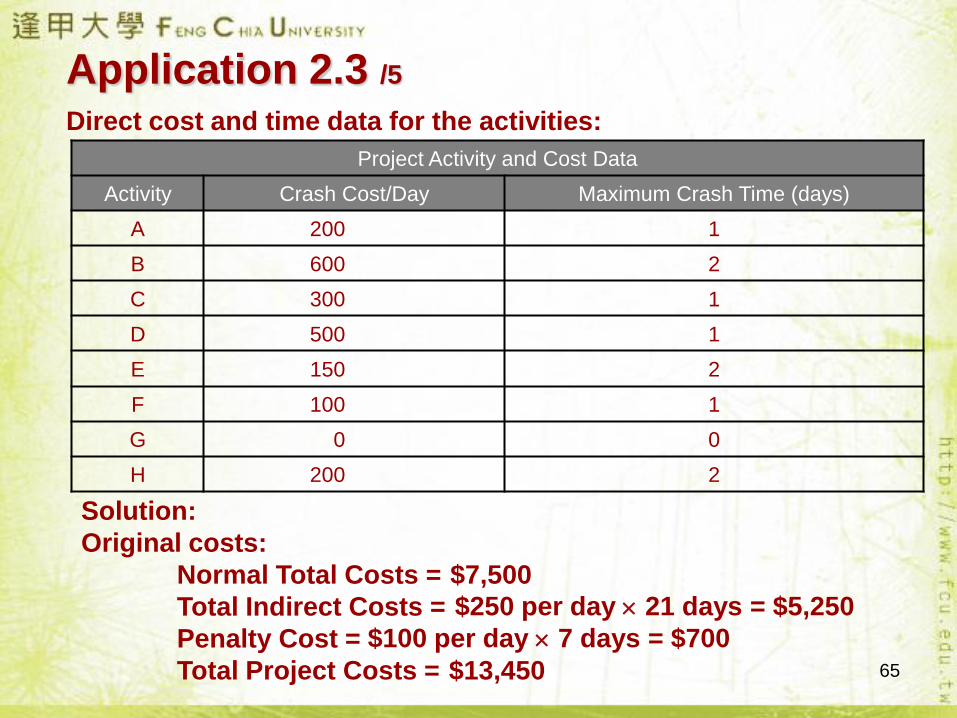
Application 2.3 /5Direct cost and time data for the activities:
Project Activity and Cost Data
Activity Crash Cost/Day Maximum Crash Time (days)
A 200 1
B 600 2
C 300 1
D 500 1
E 150 2
F 100 1
G 0 0
H 200 2
Solution:
Original costs:
Normal Total Costs =
Total Indirect Costs =
Penalty Cost =
Total Project Costs =
$7,500
$250 per day 21 days = $5,250
$100 per day 7 days = $700
$13,450
66
A
7
B
2D
4
F
3
G
5
Start
Finish
C
2
E
5
A
5
B
5
D
3
F
2
G
3H
5
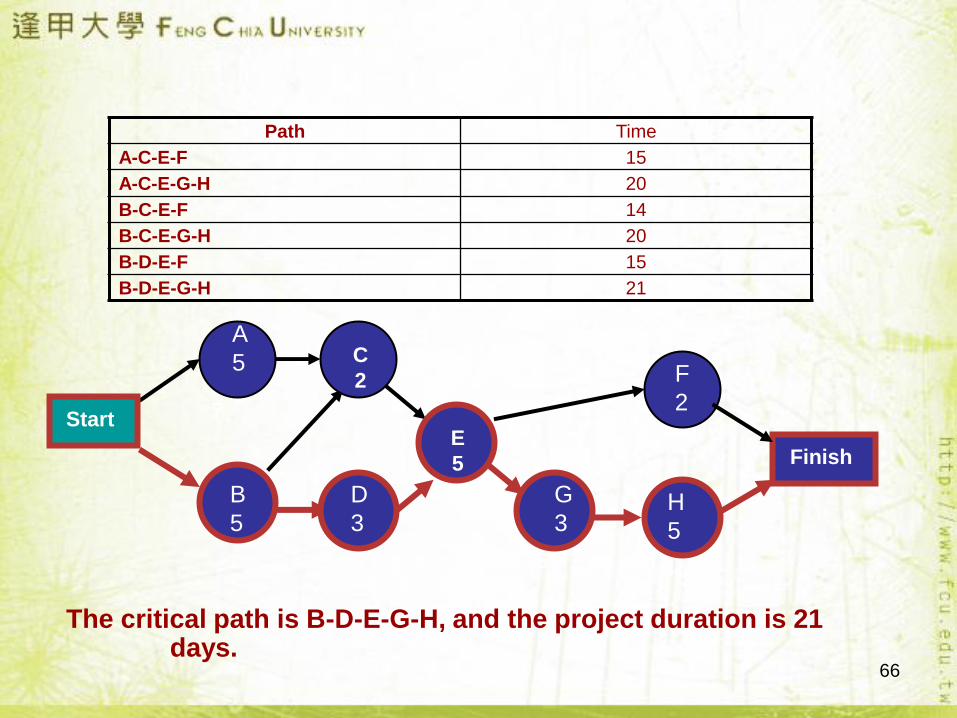
The critical path is B-D-E-G-H, and the project duration is 21 days.
Path Time
A-C-E-F 15
A-C-E-G-H 20
B-C-E-F 14
B-C-E-G-H 20
B-D-E-F 15
B-D-E-G-H 21
67
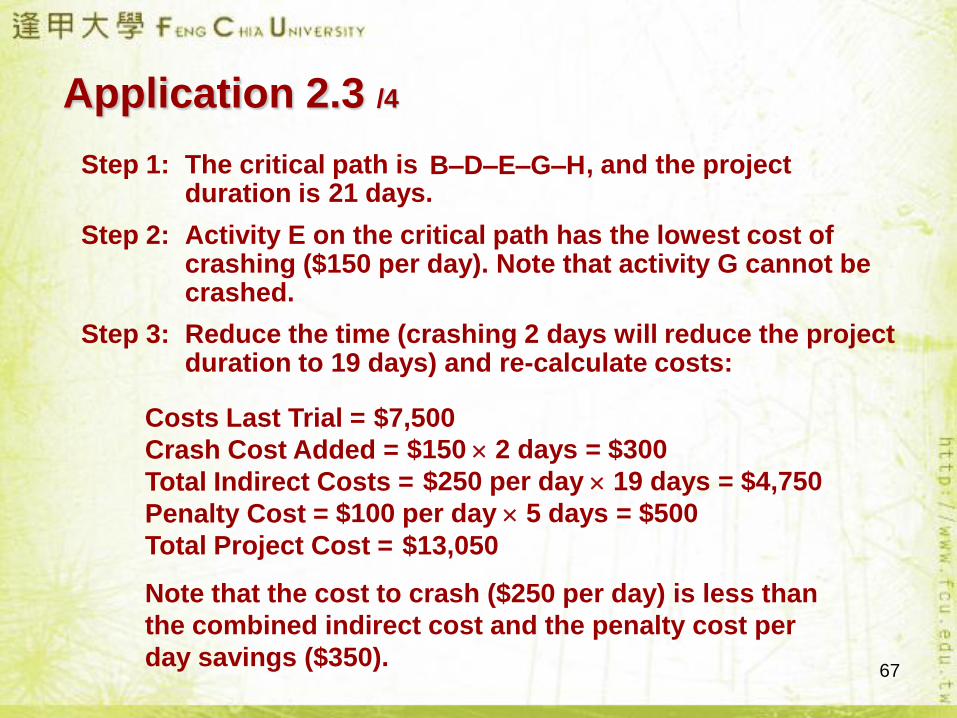
Application 2.3 /4
Step 1: The critical path is , and the project duration is
B–D–E–G–H21 days.
Step 2: Activity E on the critical path has the lowest cost of crashing ($150 per day). Note that activity G cannot be crashed.
Step 3: Reduce the time (crashing 2 days will reduce the project duration to 19 days) and re-calculate costs:
Costs Last Trial =
Crash Cost Added =
Total Indirect Costs =
Penalty Cost =
Total Project Cost =
$7,500
$150 2 days = $300
$250 per day 19 days = $4,750
$100 per day 5 days = $500
$13,050
Note that the cost to crash ($250 per day) is less than
the combined indirect cost and the penalty cost per
day savings ($350).
68
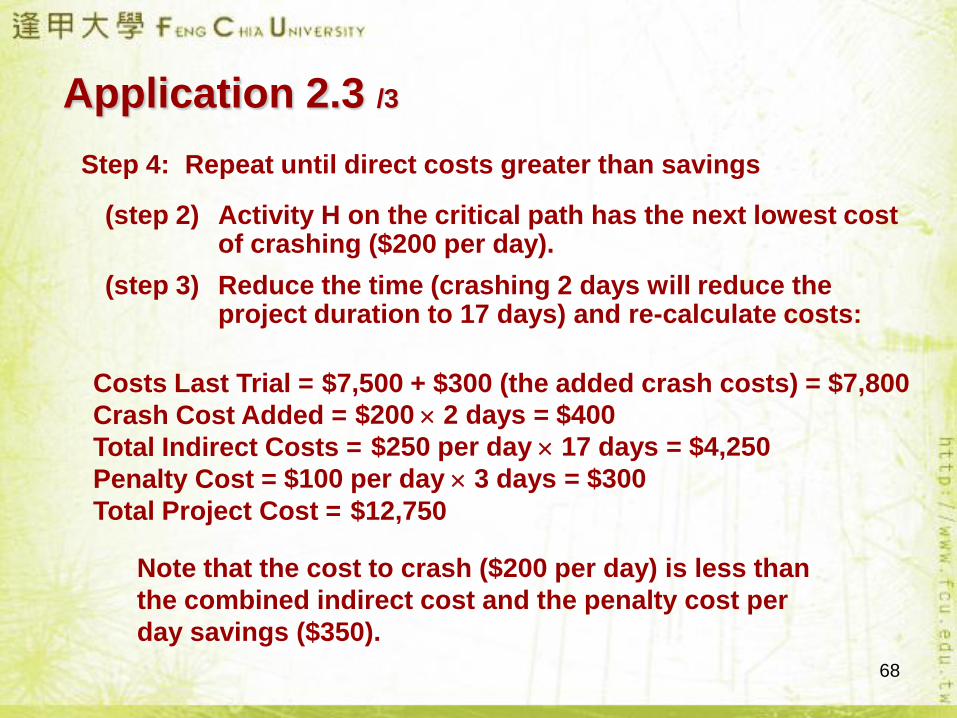
Application 2.3 /3
Step 4: Repeat until direct costs greater than savings
(step 2) Activity H on the critical path has the next lowest cost of crashing ($200 per day).
(step 3) Reduce the time (crashing 2 days will reduce the project duration to 17 days) and re-calculate costs:
Costs Last Trial =
Crash Cost Added =
Total Indirect Costs =
Penalty Cost =
Total Project Cost =
$7,500 + $300 (the added crash costs) = $7,800
$200 2 days = $400
$250 per day 17 days = $4,250
$100 per day 3 days = $300
$12,750
Note that the cost to crash ($200 per day) is less than
the combined indirect cost and the penalty cost per
day savings ($350).
69
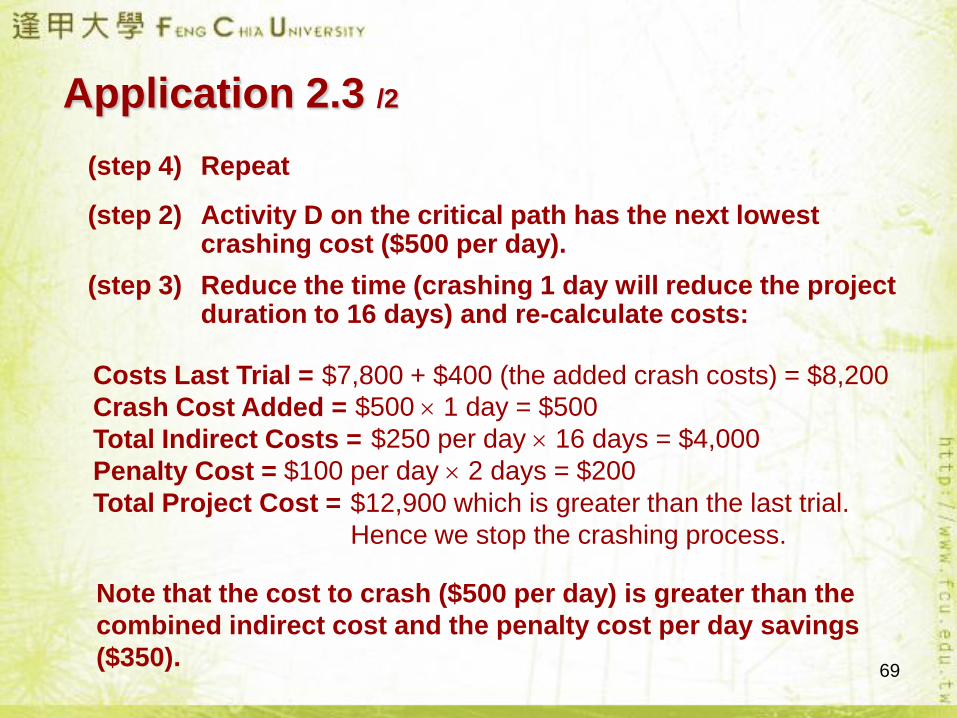
Application 2.3 /2
(step 4) Repeat
(step 2) Activity D on the critical path has the next lowest crashing cost ($500 per day).
(step 3) Reduce the time (crashing 1 day will reduce the project duration to 16 days) and re-calculate costs:
Costs Last Trial =
Crash Cost Added =
Total Indirect Costs =
Penalty Cost =
Total Project Cost =
$7,800 + $400 (the added crash costs) = $8,200
$500 1 day = $500
$250 per day 16 days = $4,000
$100 per day 2 days = $200
$12,900 which is greater than the last trial.
Hence we stop the crashing process.
Note that the cost to crash ($500 per day) is greater than the
combined indirect cost and the penalty cost per day savings
($350).
70
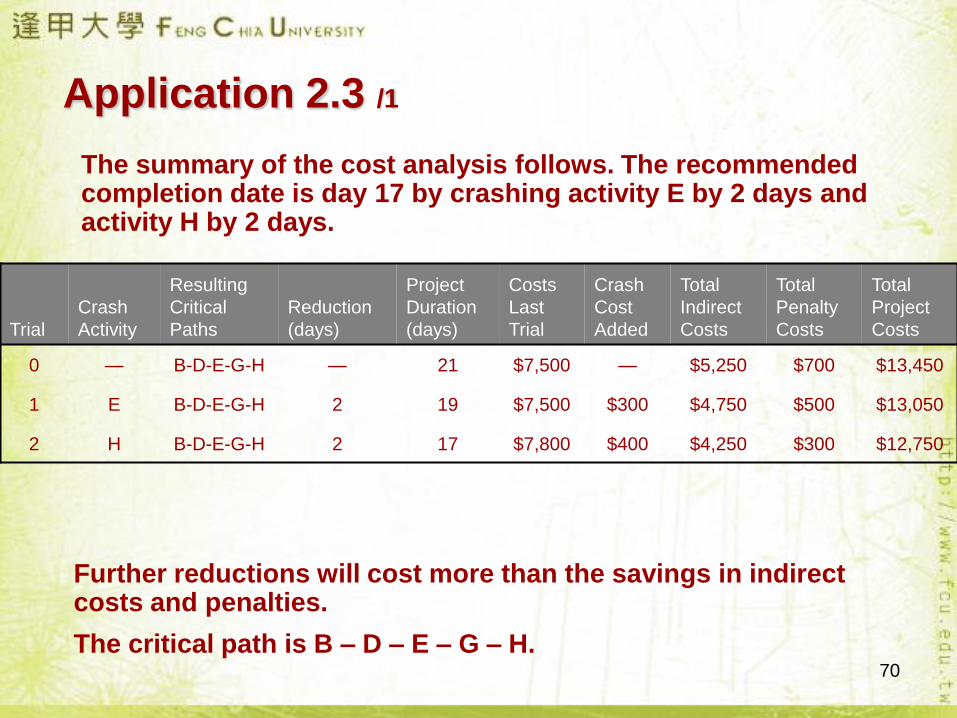
Application 2.3 /1
The summary of the cost analysis follows. The recommended completion date is day 17 by crashing activity E by 2 days and activity H by 2 days.
Trial
Crash
Activity
Resulting
Critical
Paths
Reduction
(days)
Project
Duration
(days)
Costs
Last
Trial
Crash
Cost
Added
Total
Indirect
Costs
Total
Penalty
Costs
Total
Project
Costs
0 — B-D-E-G-H — 21 $7,500 — $5,250 $700 $13,450
1 E B-D-E-G-H 2 19 $7,500 $300 $4,750 $500 $13,050
2 H B-D-E-G-H 2 17 $7,800 $400 $4,250 $300 $12,750
Further reductions will cost more than the savings in indirect costs and penalties.
The critical path is B – D – E – G – H.
71
Assessing Risks
• Risk is the measure of the probability and consequence of not reaching a defined project goal.
• Risk-management plans are developed to identify key risks and prescribe ways to circumvent them.
• Project risk can be assessed by:
– Strategic fit
– Service/product attributes
– Project team capabilities
– Operations
72
Simulation and Statistical Analysis
• When uncertainty is present, simulation can be used to
estimate the project completion time.
• Statistical analysis requires three reasonable estimates
of activity times:
1. Optimistic time (a)
2. Most likely time (m)
3. Pessimistic time (b)
73
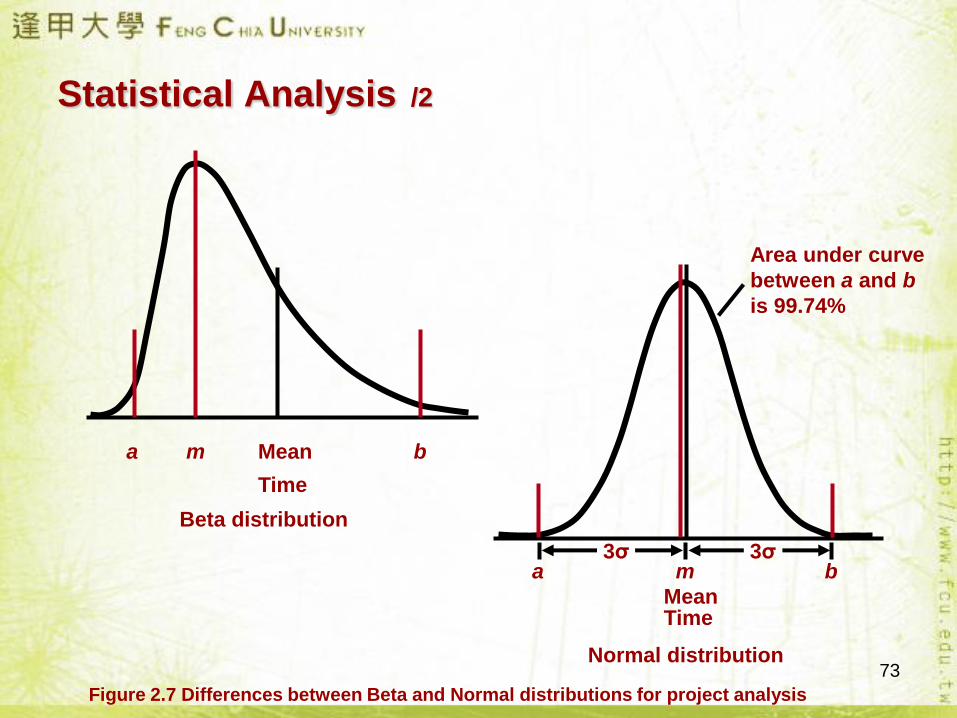
Statistical Analysis /2
a m bMean
Time
Beta distribution
a m b
MeanTime
3σ 3σ
Area under curve
between a and b
is 99.74%
Normal distribution
Figure 2.7 Differences between Beta and Normal distributions for project analysis
74
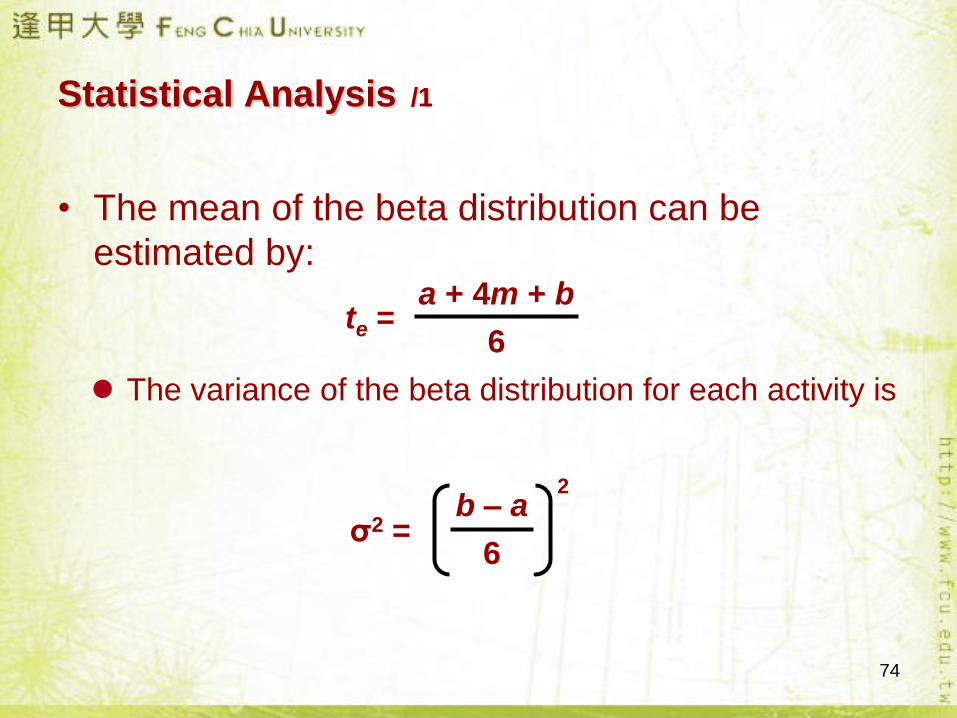
Statistical Analysis /1
• The mean of the beta distribution can be
estimated by:
te =a + 4m + b
6
The variance of the beta distribution for each activity is
σ2 =b – a
6
2
75
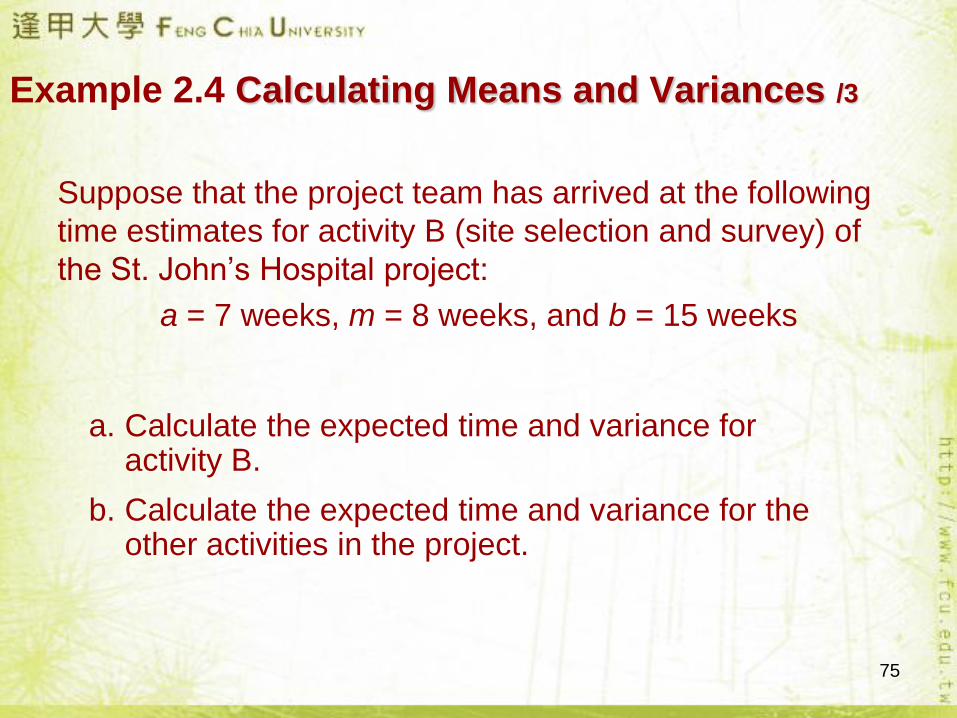
Example 2.4 Calculating Means and Variances /3
Suppose that the project team has arrived at the following
time estimates for activity B (site selection and survey) of
the St. John’s Hospital project:
a = 7 weeks, m = 8 weeks, and b = 15 weeks
a. Calculate the expected time and variance for activity B.
b. Calculate the expected time and variance for the other activities in the project.
76
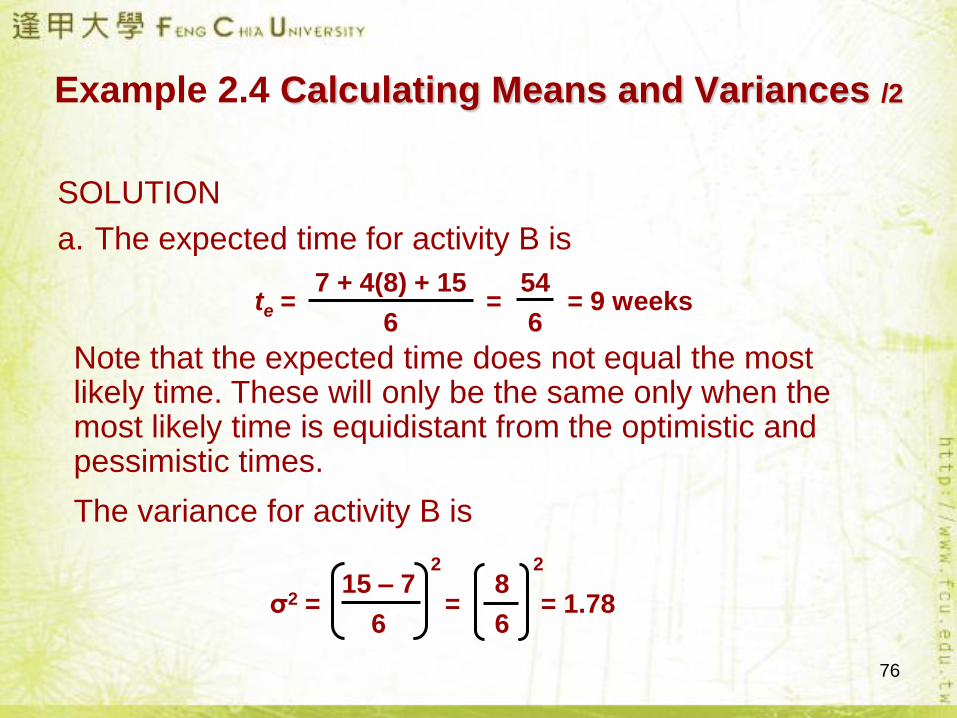
Example 2.4 Calculating Means and Variances /2
SOLUTION
a. The expected time for activity B is
Note that the expected time does not equal the most likely time. These will only be the same only when the most likely time is equidistant from the optimistic and pessimistic times.
The variance for activity B is
te = = = 9 weeks7 + 4(8) + 15
6
54
6
σ2 = = = 1.7815 – 7
6
2
8
6
2
77
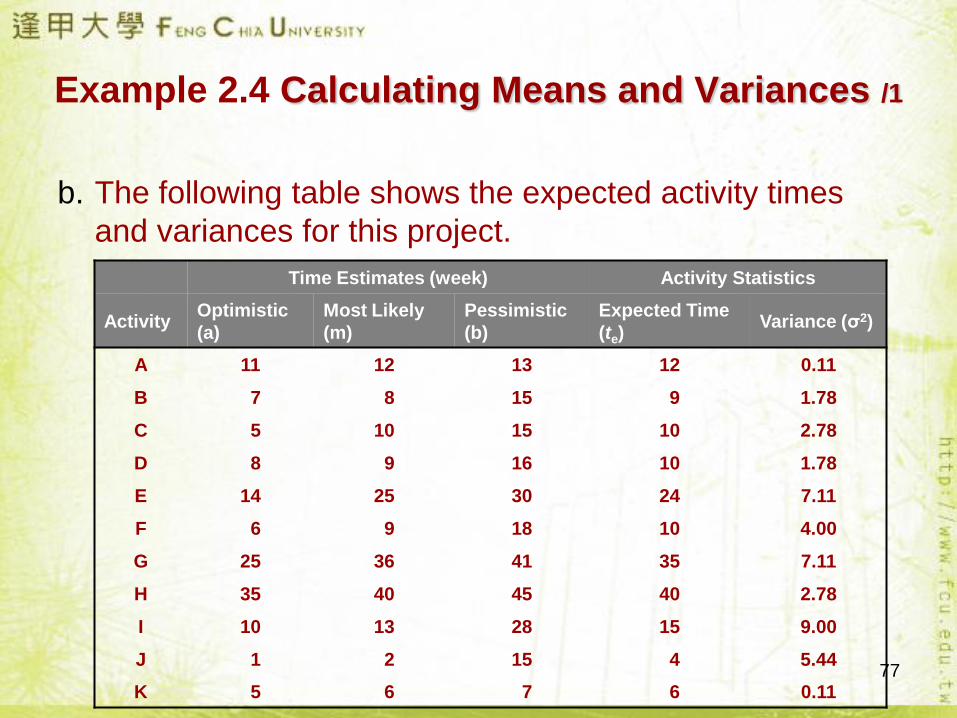
Example 2.4 Calculating Means and Variances /1
b. The following table shows the expected activity times
and variances for this project.
Time Estimates (week) Activity Statistics
ActivityOptimistic
(a)
Most Likely
(m)
Pessimistic
(b)
Expected Time
(te)Variance (σ2)
A 11 12 13 12 0.11
B 7 8 15 9 1.78
C 5 10 15 10 2.78
D 8 9 16 10 1.78
E 14 25 30 24 7.11
F 6 9 18 10 4.00
G 25 36 41 35 7.11
H 35 40 45 40 2.78
I 10 13 28 15 9.00
J 1 2 15 4 5.44
K 5 6 7 6 0.11
78
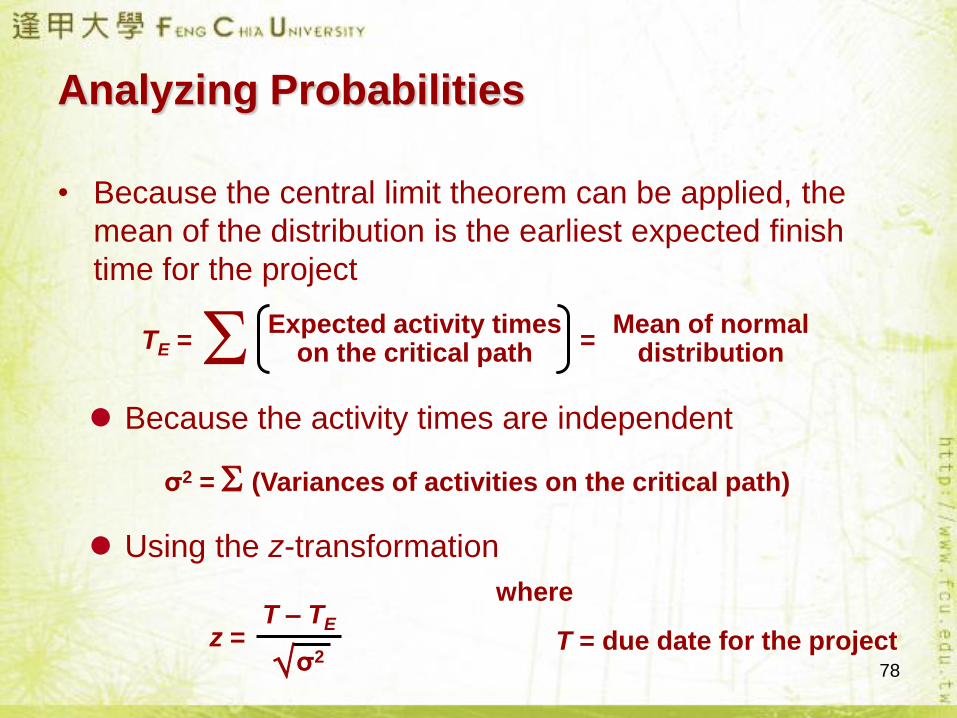
Analyzing Probabilities
• Because the central limit theorem can be applied, the
mean of the distribution is the earliest expected finish
time for the project
TE = =Expected activity times
on the critical path Mean of normal distribution
Because the activity times are independent
σ2 = (Variances of activities on the critical path)
z =T – TE
σ2
Using the z-transformation
where
T = due date for the project
79
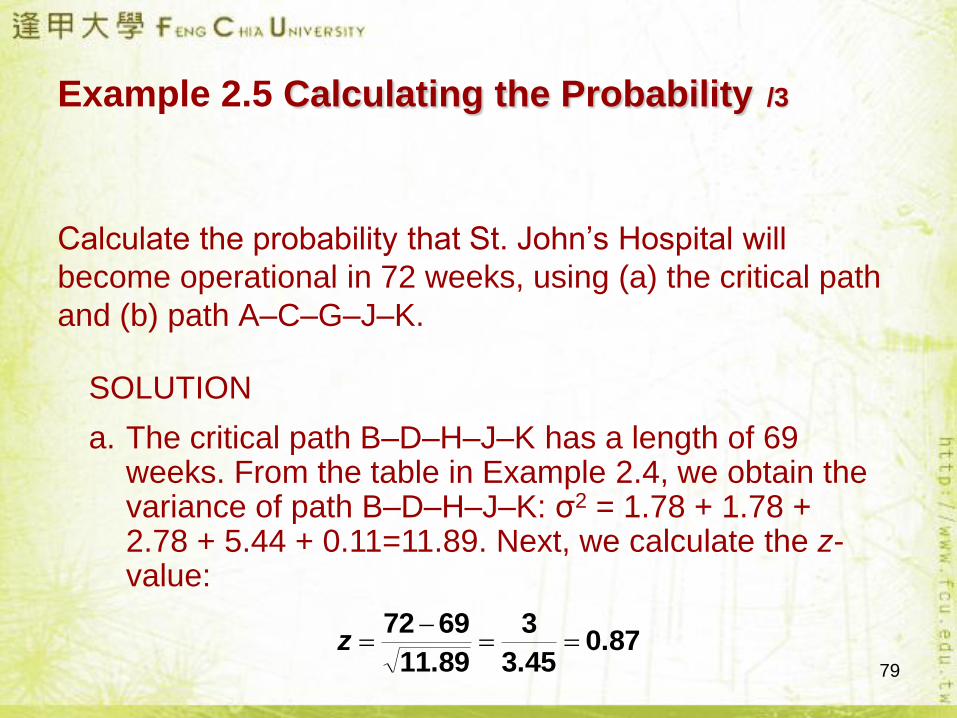
Example 2.5 Calculating the Probability /3
Calculate the probability that St. John’s Hospital will
become operational in 72 weeks, using (a) the critical path
and (b) path A–C–G–J–K.
SOLUTION
a. The critical path B–D–H–J–K has a length of 69 weeks. From the table in Example 2.4, we obtain the variance of path B–D–H–J–K: σ2 = 1.78 + 1.78 + 2.78 + 5.44 + 0.11=11.89. Next, we calculate the z-value:
0.873.45
3
11.89
6972
z
80
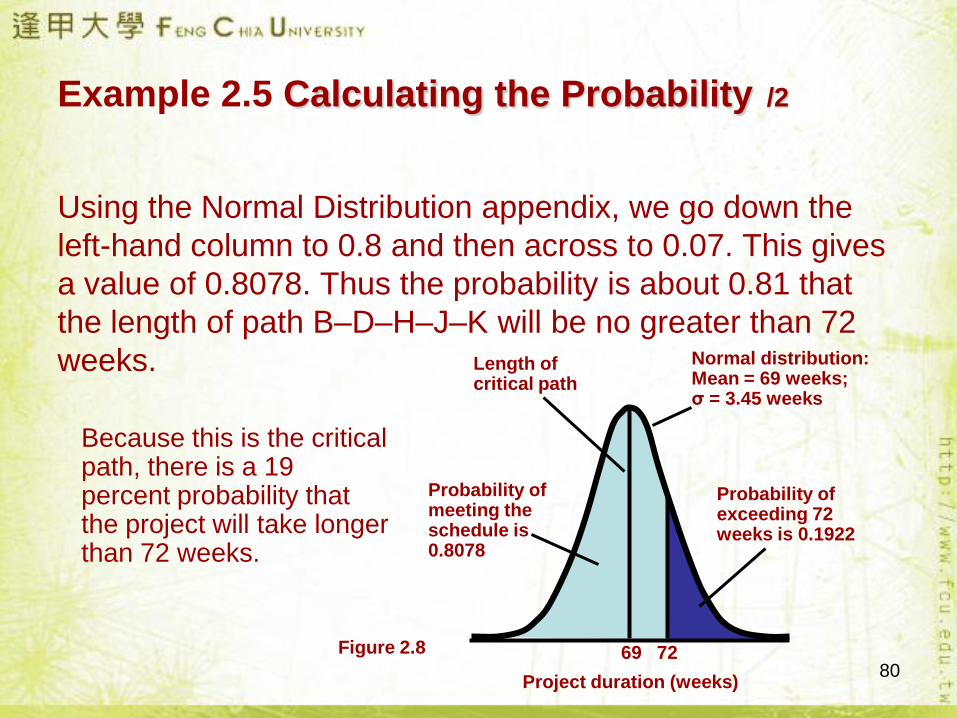
Example 2.5 Calculating the Probability /2
Using the Normal Distribution appendix, we go down the
left-hand column to 0.8 and then across to 0.07. This gives
a value of 0.8078. Thus the probability is about 0.81 that
the length of path B–D–H–J–K will be no greater than 72
weeks. Length of critical path
Probability of meeting the schedule is 0.8078
Normal distribution:Mean = 69 weeks;σ = 3.45 weeks
Probability of exceeding 72 weeks is 0.1922
Project duration (weeks)
69 72
Because this is the critical path, there is a 19 percent probability that the project will take longer than 72 weeks.
Figure 2.8
81
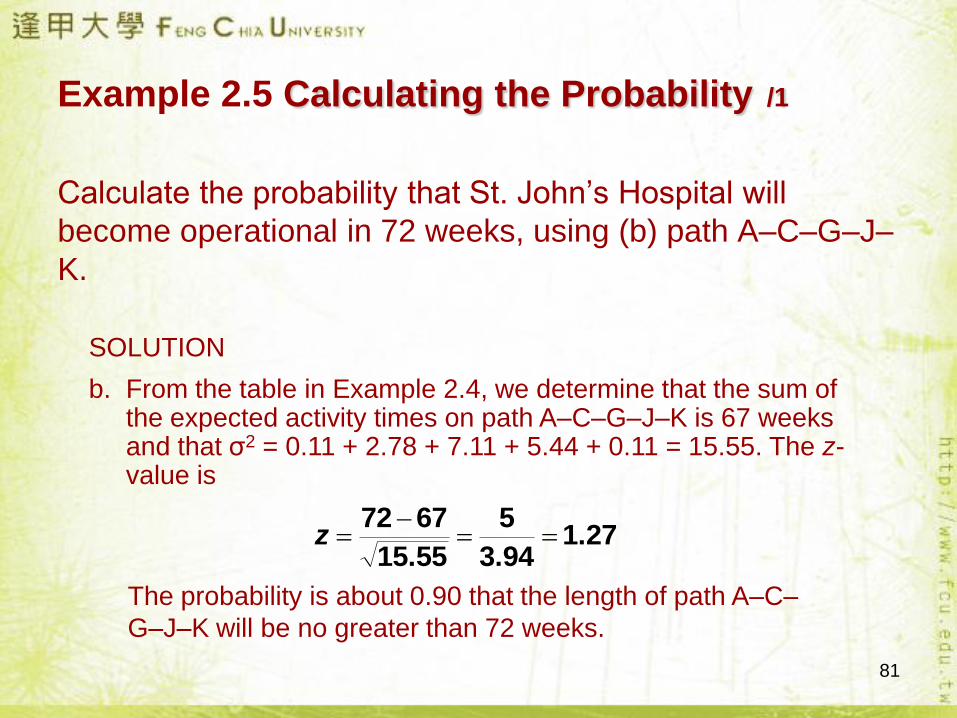
Example 2.5 Calculating the Probability /1
SOLUTION
b. From the table in Example 2.4, we determine that the sum of the expected activity times on path A–C–G–J–K is 67 weeks and that σ2 = 0.11 + 2.78 + 7.11 + 5.44 + 0.11 = 15.55. The z-value is
1.273.94
5
15.55
6772
z
The probability is about 0.90 that the length of path A–C–
G–J–K will be no greater than 72 weeks.
Calculate the probability that St. John’s Hospital will
become operational in 72 weeks, using (b) path A–C–G–J–
K.
82
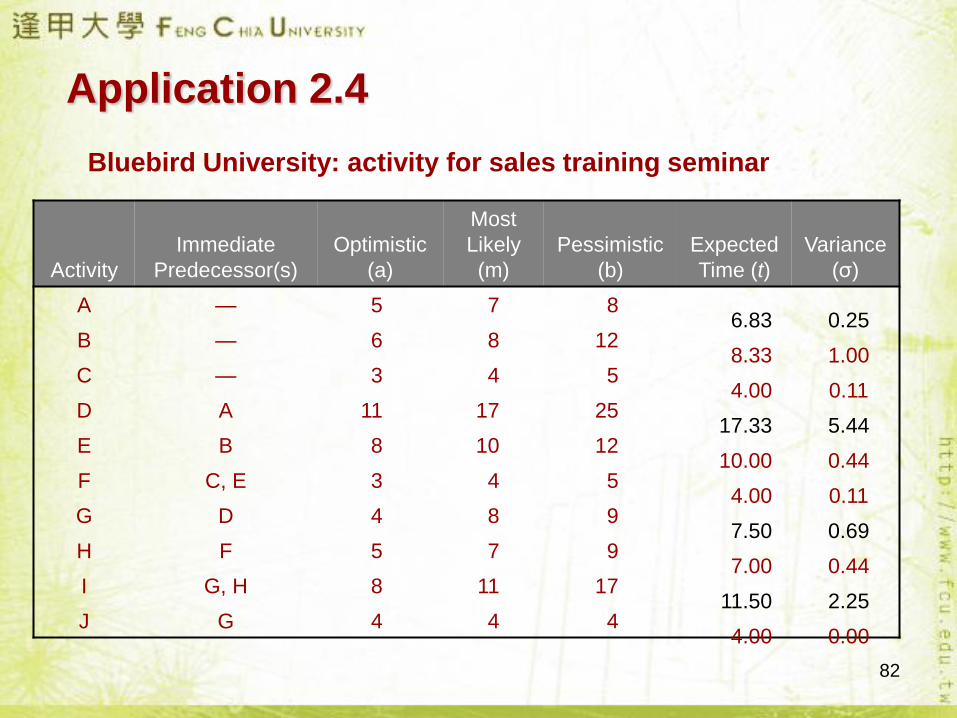
Activity
Immediate
Predecessor(s)
Optimistic
(a)
Most
Likely
(m)
Pessimistic
(b)
Expected
Time (t)
Variance
(σ)
A — 5 7 8
B — 6 8 12
C — 3 4 5
D A 11 17 25
E B 8 10 12
F C, E 3 4 5
G D 4 8 9
H F 5 7 9
I G, H 8 11 17
J G 4 4 4
Application 2.4
Bluebird University: activity for sales training seminar
6.83 0.25
8.33 1.00
4.00 0.11
17.33 5.44
10.00 0.44
4.00 0.11
7.50 0.69
7.00 0.44
11.50 2.25
4.00 0.00
83
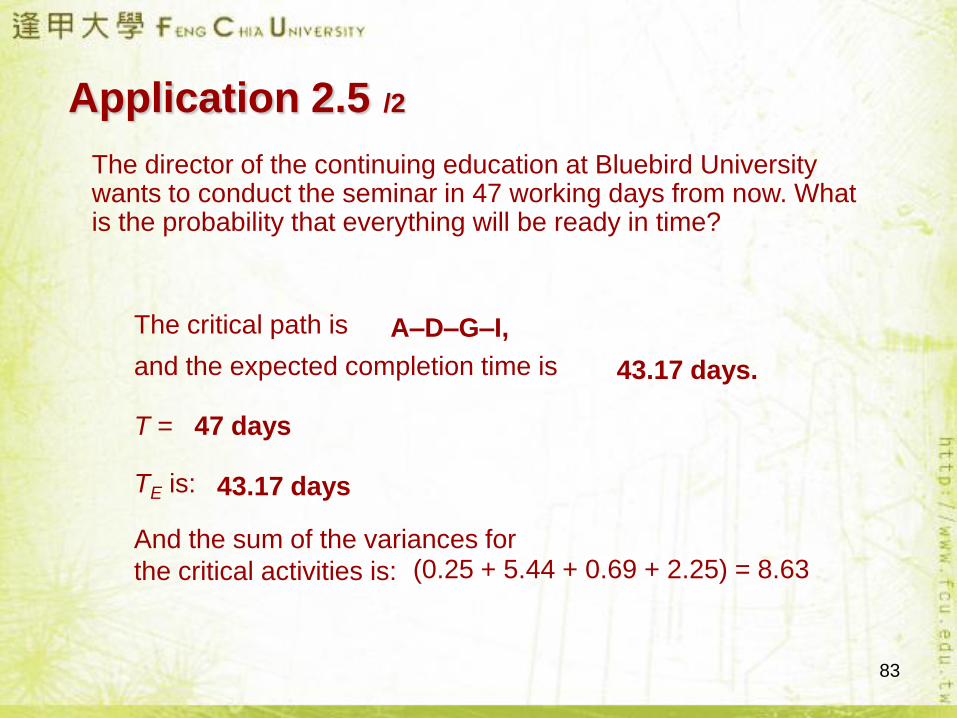
Application 2.5 /2
The director of the continuing education at Bluebird University wants to conduct the seminar in 47 working days from now. What is the probability that everything will be ready in time?
The critical path is
and the expected completion time is
T =
TE is:
A–D–G–I,
43.17 days.
47 days
43.17 days
(0.25 + 5.44 + 0.69 + 2.25) = 8.63And the sum of the variances for
the critical activities is:
84
= = = 1.303.83
2.94
47 – 43.17
8.63
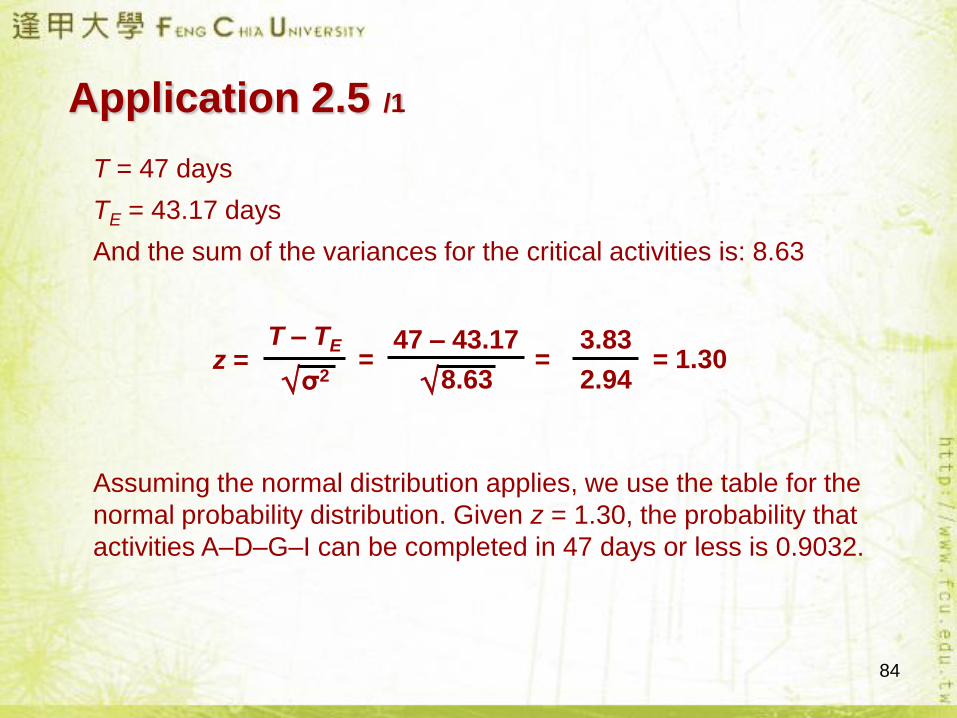
Application 2.5 /1
T = 47 days
TE = 43.17 days
And the sum of the variances for the critical activities is: 8.63
z = T – TE
σ2
Assuming the normal distribution applies, we use the table for the
normal probability distribution. Given z = 1.30, the probability that
activities A–D–G–I can be completed in 47 days or less is 0.9032.
85
Near-Critical Paths
• Project duration is a function of the critical path
• Since activity times vary, paths with nearly the same
length can become critical during the project
• Project managers can use probability estimates to
analyze the chances of near-critical paths delaying the
project
86
4. Monitoring and Controlling Projects
• Tracking systems collect information on three
topics
– Open issues that require resolution
– Risks that might delay the project completion
– Schedule status periodically monitors slack
time to identify activities that are behind
schedule
87
Monitoring Project Status
• Open issues and risks
- reminds the project manager of due dates for open
issues and who was responsible for seeing that they
are resolved
- provides the status of each risk to project delays
specified in the risk management plan
• Schedule status
- provides periodic monitoring of slack time in the
project schedule
- recalculates activities slacks and indicates those
activities that are behind schedule
88
Monitoring Project Resources
• Problems can be alleviated through:
– Resource leveling: the attempt to reduce the peaks and valleys in resource needs by shifting the scheduling of conflicting activities within their earliest and latest start dates
– Resource allocation: the assignment of resources to the most important activities.
– Resource acquisition: the addition of more of an overloaded resource to maintain the schedule of an activity.
89
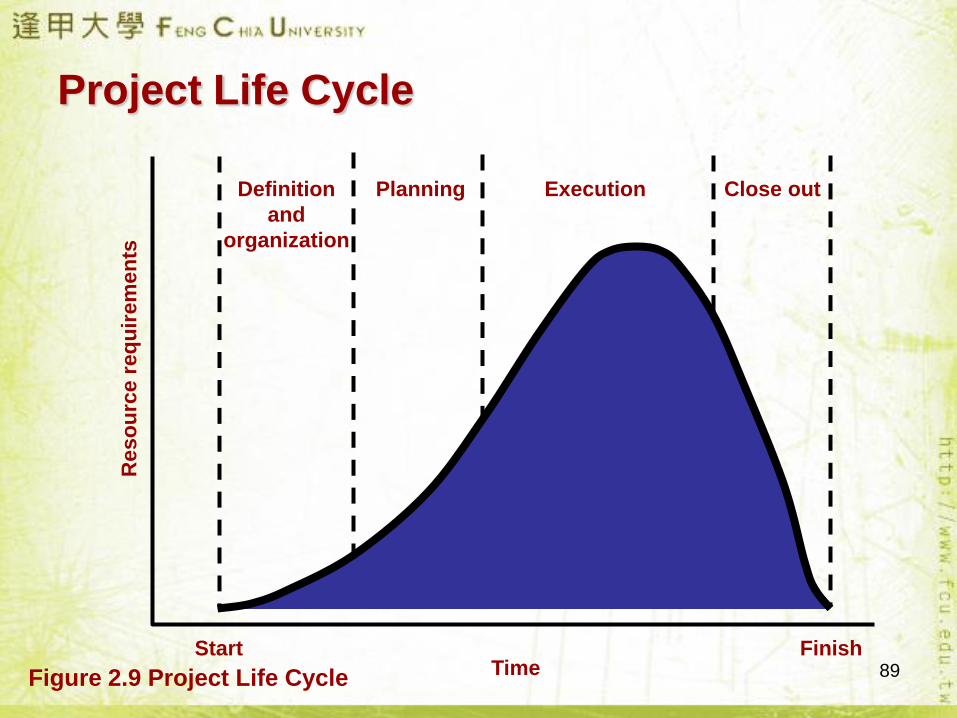
Project Life Cycle
Start Finish
Reso
urc
e r
eq
uir
em
en
ts
Time
Definition
and
organization
Planning Execution Close out
Figure 2.9 Project Life Cycle
90
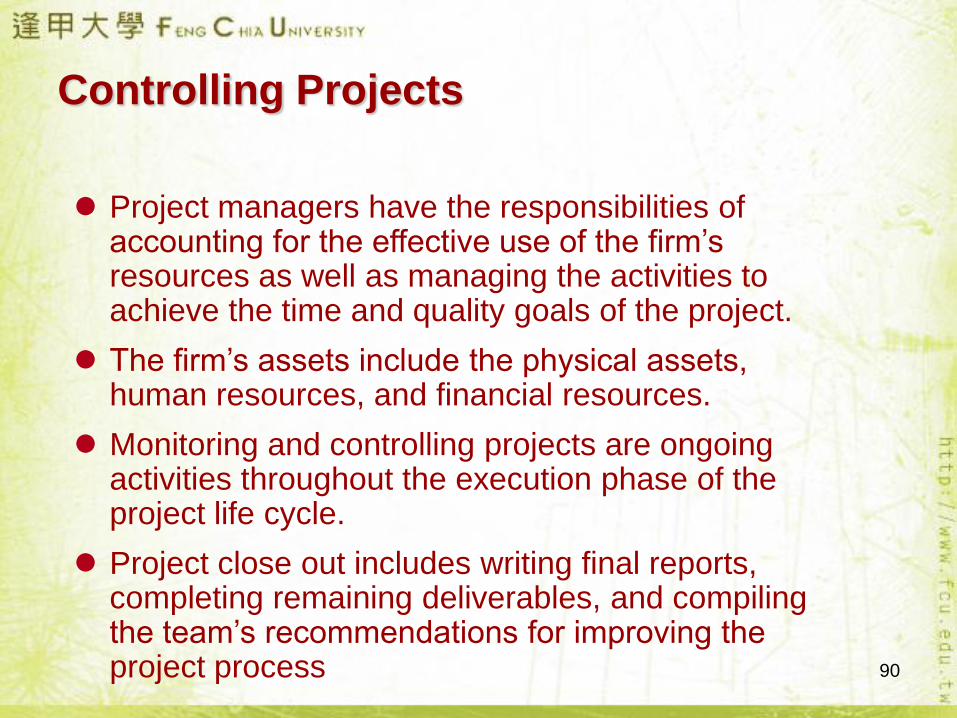
Controlling Projects
Project managers have the responsibilities of accounting for the effective use of the firm’s resources as well as managing the activities to achieve the time and quality goals of the project.
The firm’s assets include the physical assets, human resources, and financial resources.
Monitoring and controlling projects are ongoing activities throughout the execution phase of the project life cycle.
Project close out includes writing final reports, completing remaining deliverables, and compiling the team’s recommendations for improving the project process
91
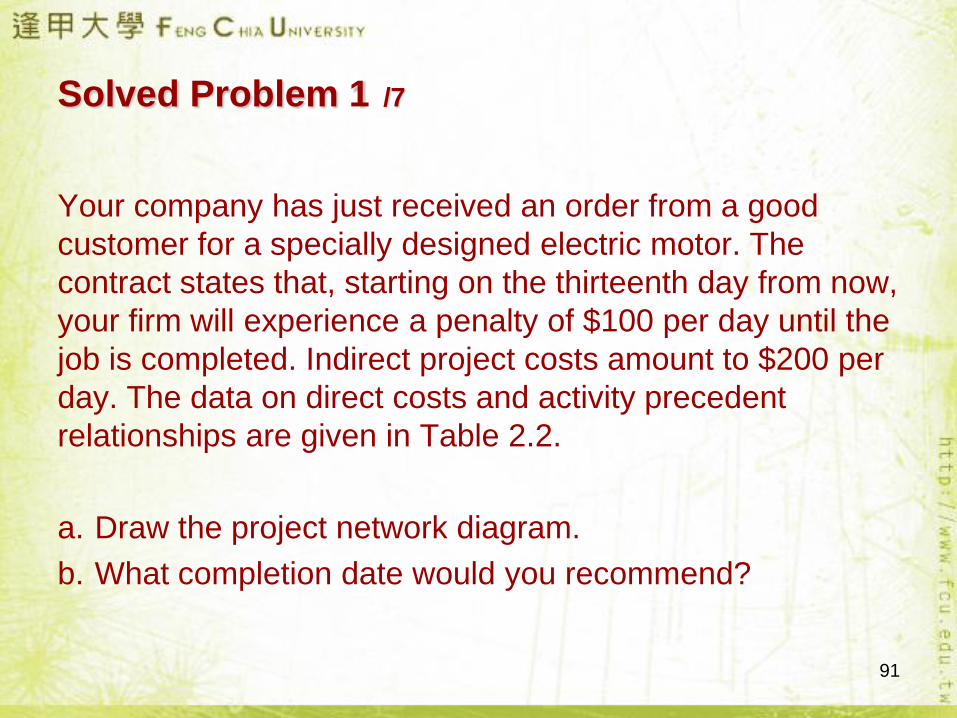
Solved Problem 1 /7
Your company has just received an order from a good
customer for a specially designed electric motor. The
contract states that, starting on the thirteenth day from now,
your firm will experience a penalty of $100 per day until the
job is completed. Indirect project costs amount to $200 per
day. The data on direct costs and activity precedent
relationships are given in Table 2.2.
a. Draw the project network diagram.
b. What completion date would you recommend?
92
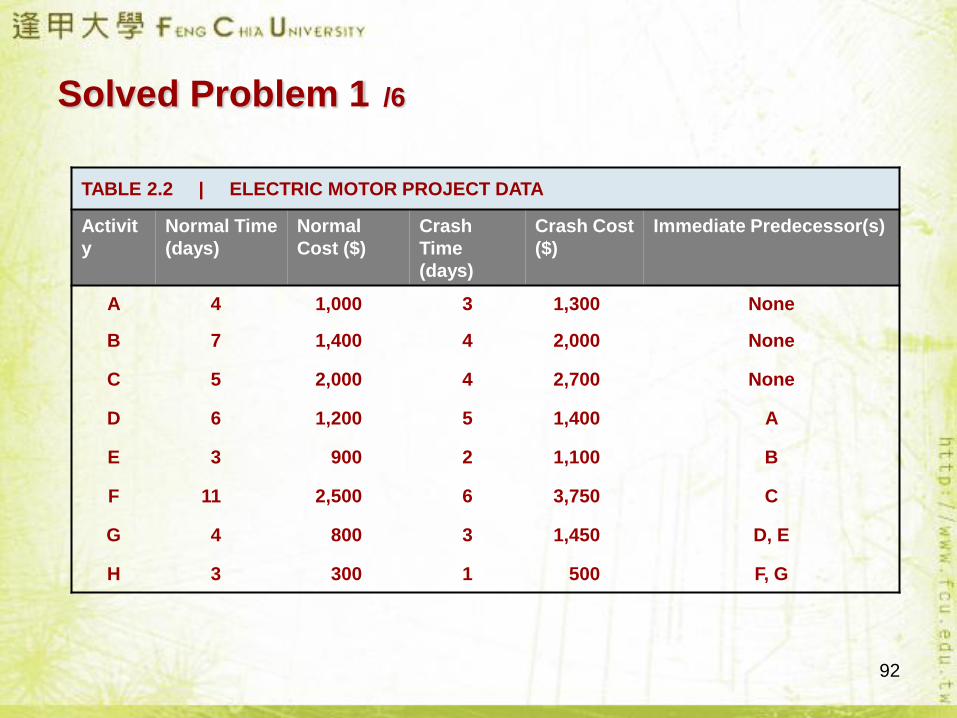
Solved Problem 1 /6
TABLE 2.2 | ELECTRIC MOTOR PROJECT DATA
Activit
y
Normal Time
(days)
Normal
Cost ($)
Crash
Time
(days)
Crash Cost
($)
Immediate Predecessor(s)
A 4 1,000 3 1,300 None
B 7 1,400 4 2,000 None
C 5 2,000 4 2,700 None
D 6 1,200 5 1,400 A
E 3 900 2 1,100 B
F 11 2,500 6 3,750 C
G 4 800 3 1,450 D, E
H 3 300 1 500 F, G
93
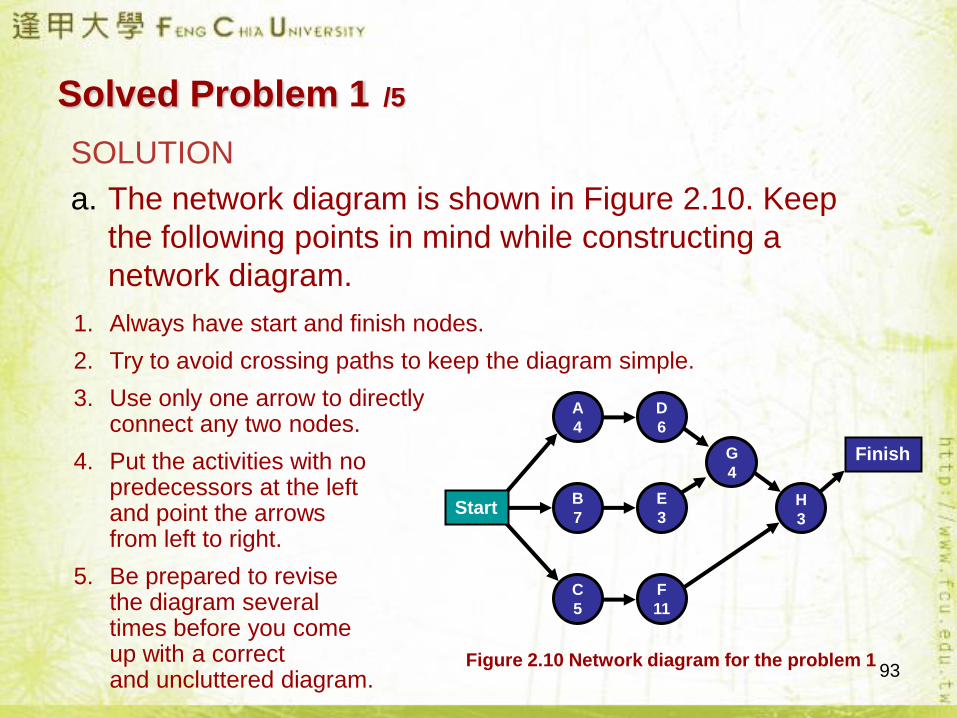
Solved Problem 1 /5
SOLUTION
a. The network diagram is shown in Figure 2.10. Keep
the following points in mind while constructing a
network diagram.
1. Always have start and finish nodes.
2. Try to avoid crossing paths to keep the diagram simple.
3. Use only one arrow to directly connect any two nodes.
4. Put the activities with no predecessors at the left and point the arrows from left to right.
5. Be prepared to revise the diagram several times before you comeup with a correct and uncluttered diagram.
Start
Finish
A
4
B
7
C
5
D
6
E
3
F
11
G
4
H
3
Figure 2.10 Network diagram for the problem 1
94
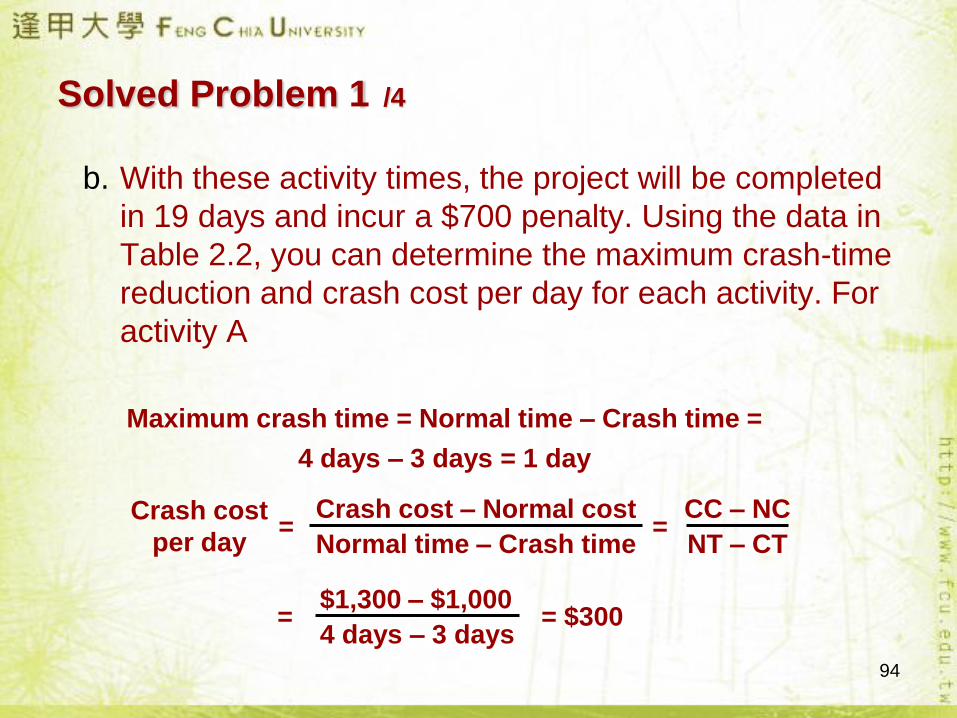
Solved Problem 1 /4
b. With these activity times, the project will be completed
in 19 days and incur a $700 penalty. Using the data in
Table 2.2, you can determine the maximum crash-time
reduction and crash cost per day for each activity. For
activity A
Maximum crash time = Normal time – Crash time =
4 days – 3 days = 1 day
Crash cost
per day= =
Crash cost – Normal cost
Normal time – Crash time
CC – NC
NT – CT
= = $300$1,300 – $1,000
4 days – 3 days
95
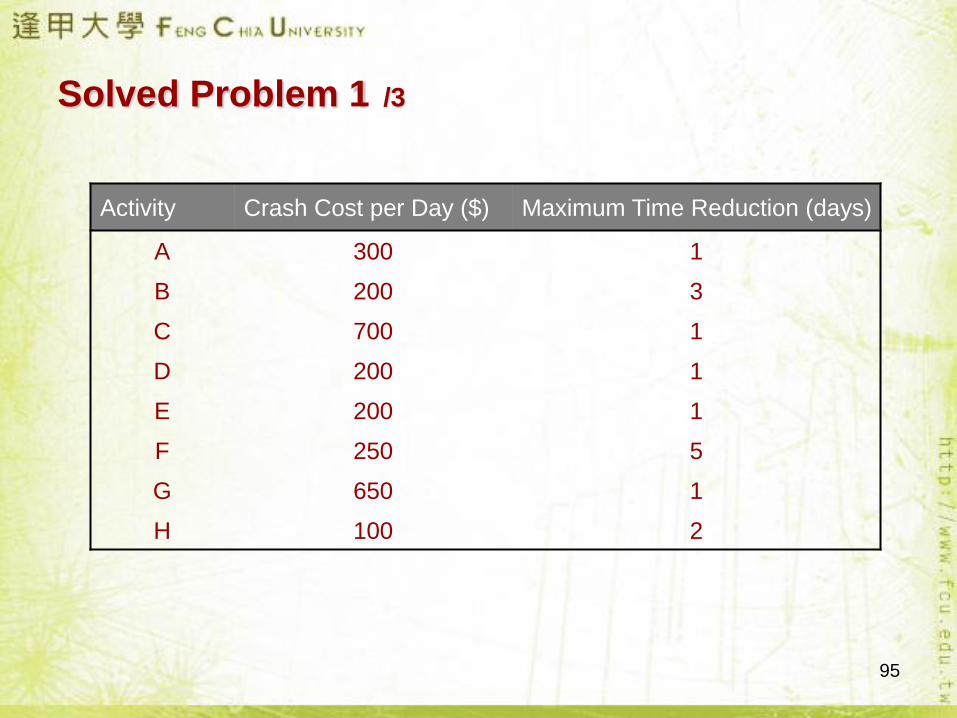
Solved Problem 1 /3
Activity Crash Cost per Day ($) Maximum Time Reduction (days)
A 300 1
B 200 3
C 700 1
D 200 1
E 200 1
F 250 5
G 650 1
H 100 2
96
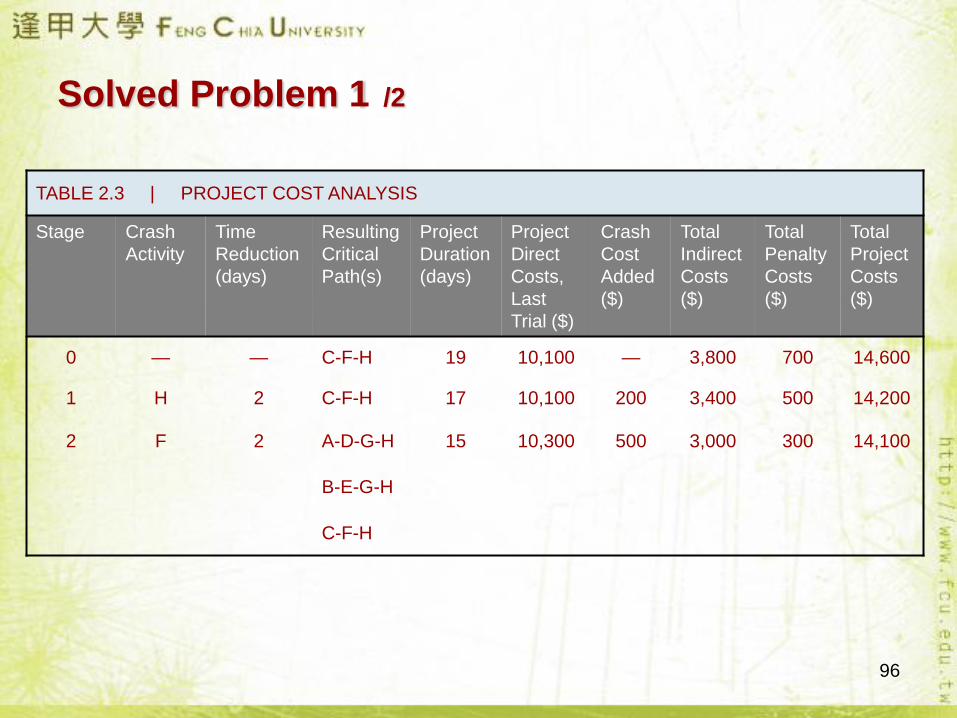
Solved Problem 1 /2
TABLE 2.3 | PROJECT COST ANALYSIS
Stage Crash
Activity
Time
Reduction
(days)
Resulting
Critical
Path(s)
Project
Duration
(days)
Project
Direct
Costs,
Last
Trial ($)
Crash
Cost
Added
($)
Total
Indirect
Costs
($)
Total
Penalty
Costs
($)
Total
Project
Costs
($)
0 — — C-F-H 19 10,100 — 3,800 700 14,600
1 H 2 C-F-H 17 10,100 200 3,400 500 14,200
2 F 2 A-D-G-H 15 10,300 500 3,000 300 14,100
B-E-G-H
C-F-H
97
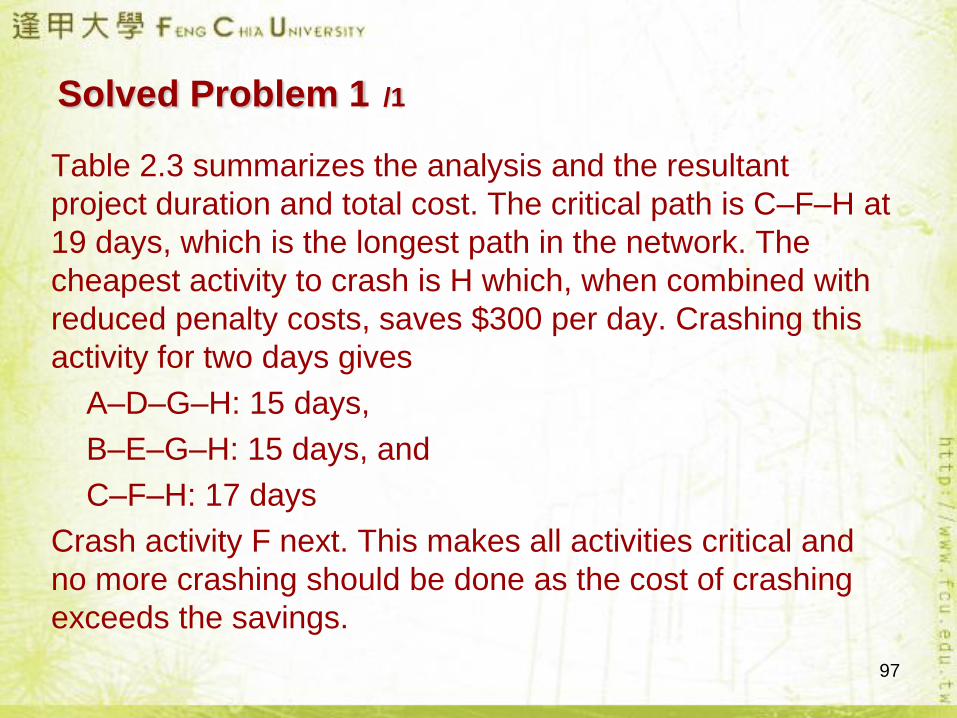
Solved Problem 1 /1
Table 2.3 summarizes the analysis and the resultant
project duration and total cost. The critical path is C–F–H at
19 days, which is the longest path in the network. The
cheapest activity to crash is H which, when combined with
reduced penalty costs, saves $300 per day. Crashing this
activity for two days gives
A–D–G–H: 15 days,
B–E–G–H: 15 days, and
C–F–H: 17 days
Crash activity F next. This makes all activities critical and
no more crashing should be done as the cost of crashing
exceeds the savings.
98
Solved Problem 2 /8
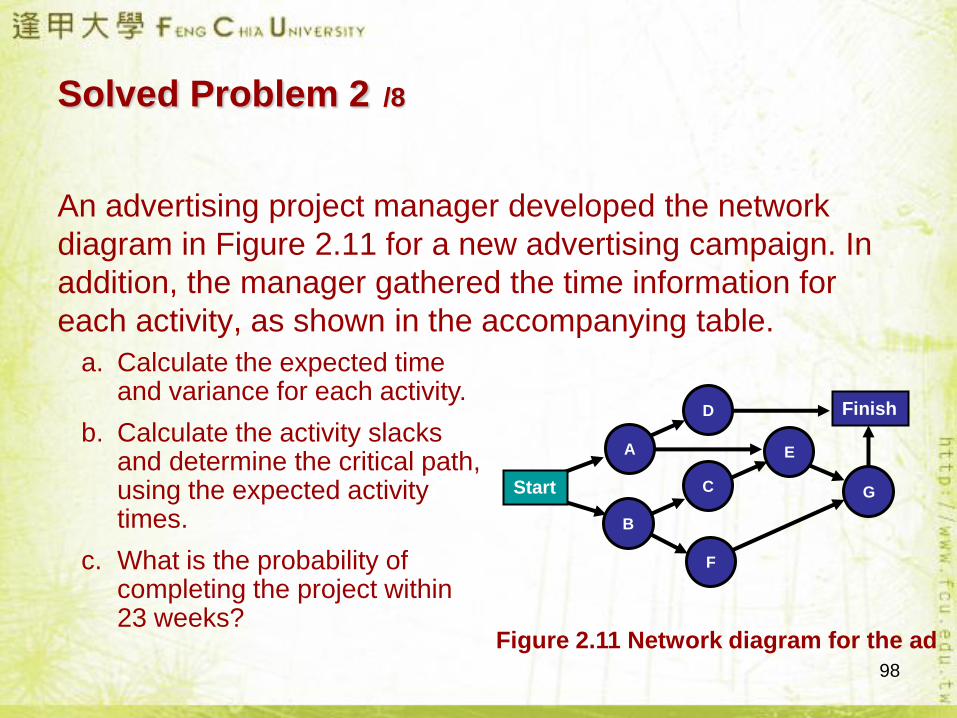
An advertising project manager developed the network
diagram in Figure 2.11 for a new advertising campaign. In
addition, the manager gathered the time information for
each activity, as shown in the accompanying table.
a. Calculate the expected time and variance for each activity.
b. Calculate the activity slacks and determine the critical path, using the expected activity times.
c. What is the probability of completing the project within 23 weeks?
Figure 2.11 Network diagram for the ad
Start
Finish
A
B
C
D
E
F
G
99
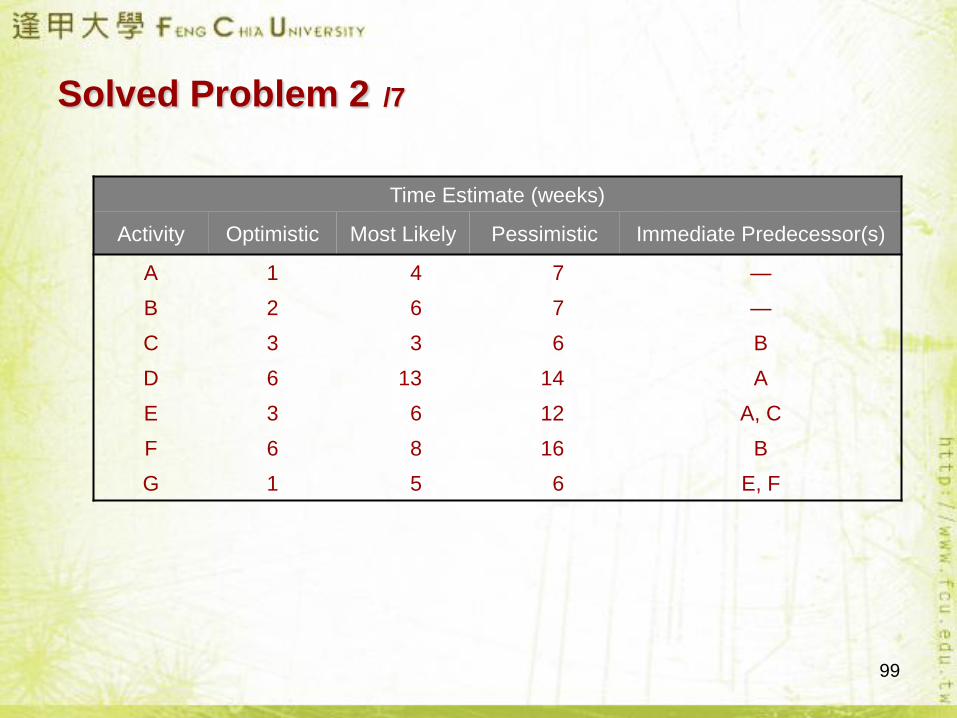
Solved Problem 2 /7
Time Estimate (weeks)
Activity Optimistic Most Likely Pessimistic Immediate Predecessor(s)
A 1 4 7 —
B 2 6 7 —
C 3 3 6 B
D 6 13 14 A
E 3 6 12 A, C
F 6 8 16 B
G 1 5 6 E, F
100
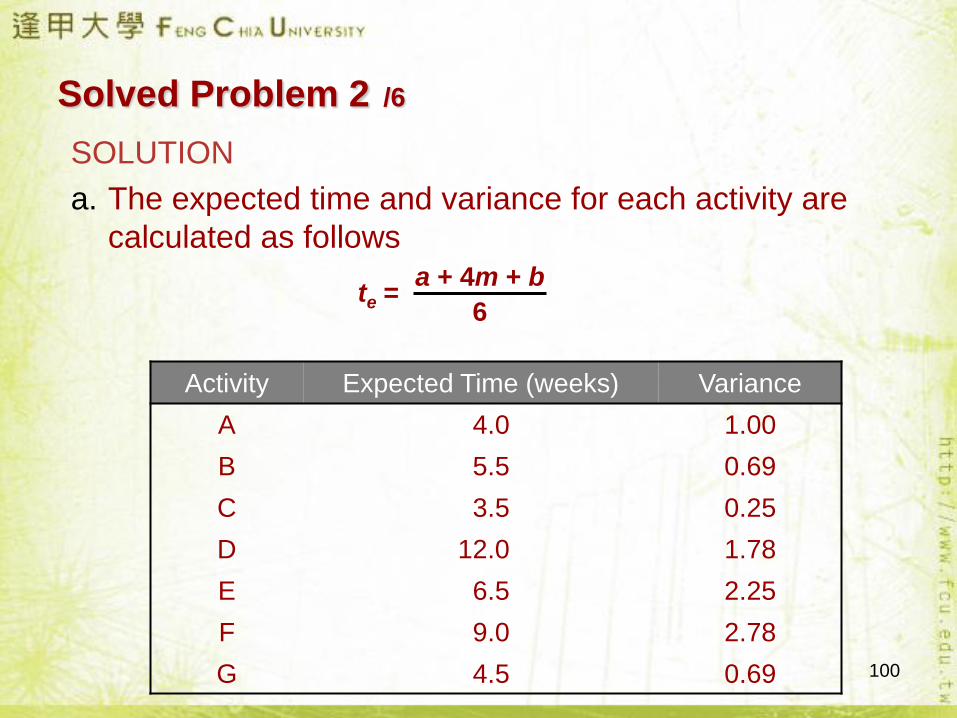
Solved Problem 2 /6
SOLUTION
a. The expected time and variance for each activity are
calculated as follows
te =a + 4m + b
6
Activity Expected Time (weeks) Variance
A 4.0 1.00
B 5.5 0.69
C 3.5 0.25
D 12.0 1.78
E 6.5 2.25
F 9.0 2.78
G 4.5 0.69
101
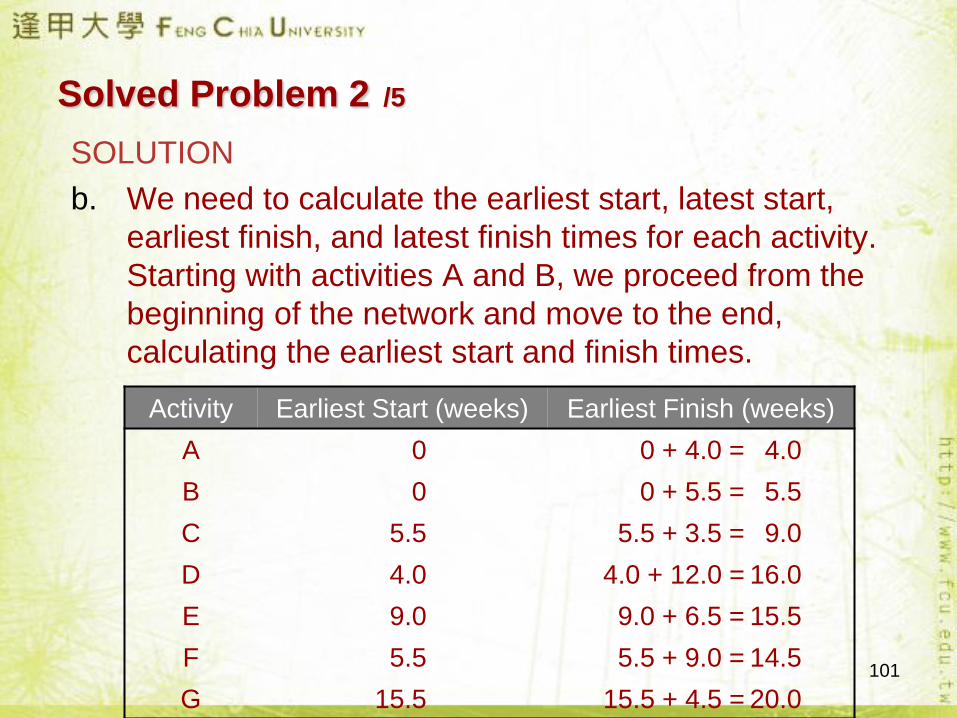
Solved Problem 2 /5
SOLUTION
b. We need to calculate the earliest start, latest start,
earliest finish, and latest finish times for each activity.
Starting with activities A and B, we proceed from the
beginning of the network and move to the end,
calculating the earliest start and finish times.
Activity Earliest Start (weeks) Earliest Finish (weeks)
A 0 0 + 4.0 = 4.0
B 0 0 + 5.5 = 5.5
C 5.5 5.5 + 3.5 = 9.0
D 4.0 4.0 + 12.0 = 16.0
E 9.0 9.0 + 6.5 = 15.5
F 5.5 5.5 + 9.0 = 14.5
G 15.5 15.5 + 4.5 = 20.0
102
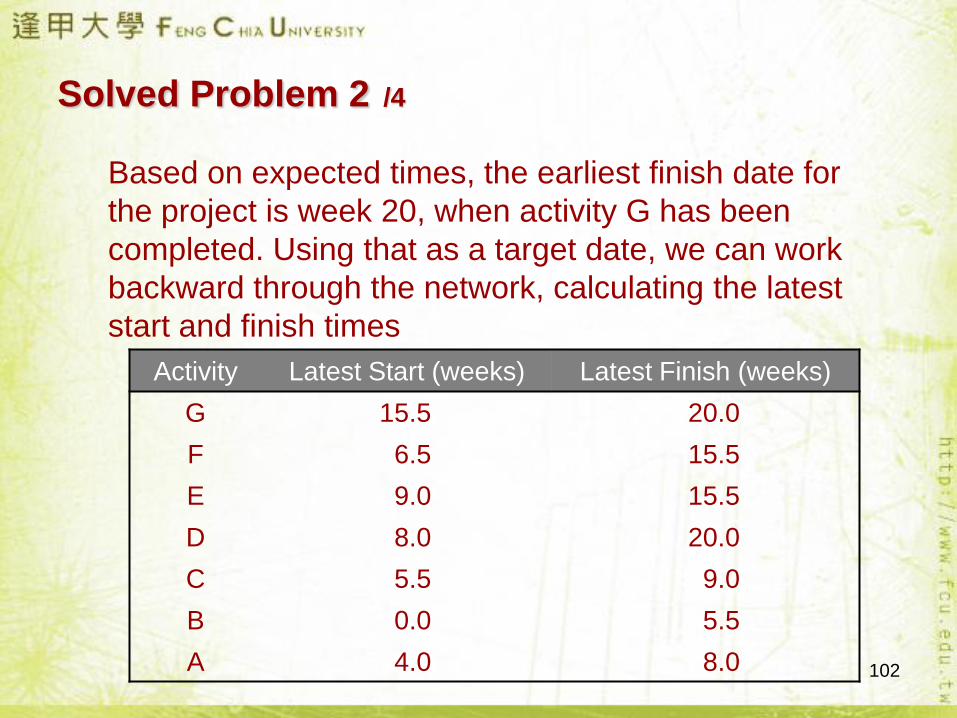
Solved Problem 2 /4
Based on expected times, the earliest finish date for
the project is week 20, when activity G has been
completed. Using that as a target date, we can work
backward through the network, calculating the latest
start and finish times
Activity Latest Start (weeks) Latest Finish (weeks)
G 15.5 20.0
F 6.5 15.5
E 9.0 15.5
D 8.0 20.0
C 5.5 9.0
B 0.0 5.5
A 4.0 8.0
103
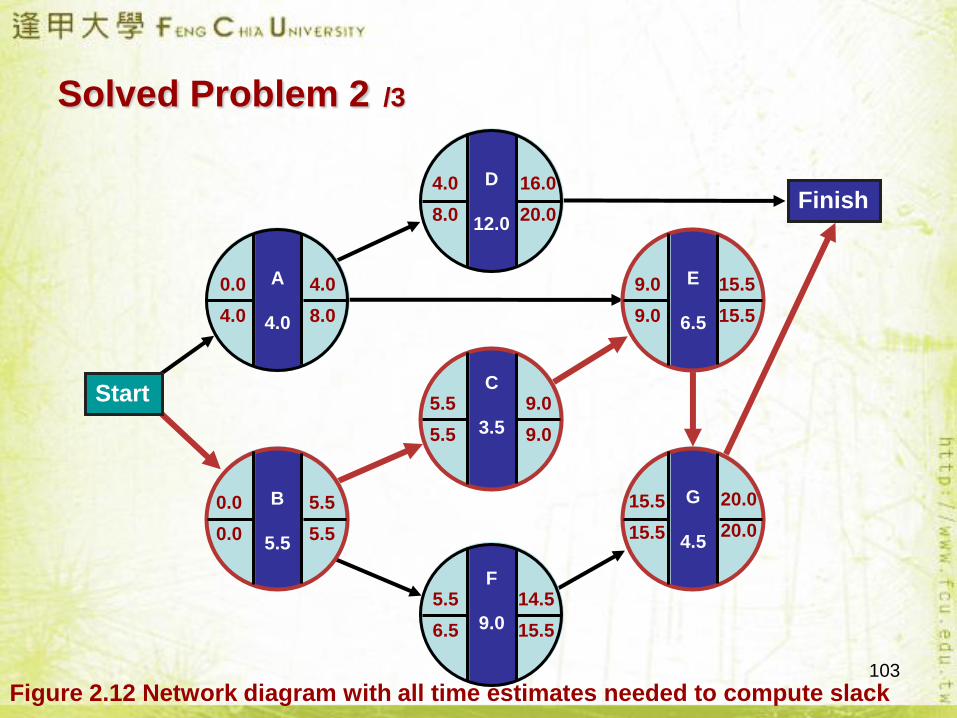
Solved Problem 2 /3
A
4.0
0.0
4.0
4.0
8.0
D
12.0
4.0
8.0
16.0
20.0
E
6.5
9.0
9.0
15.5
15.5
G
4.5
15.5
15.5
20.0
20.0
C
3.5
5.5
5.5
9.0
9.0
F
9.0
5.5
6.5
14.5
15.5
B
5.5
0.0
0.0
5.5
5.5
Finish
Start
Figure 2.12 Network diagram with all time estimates needed to compute slack
104
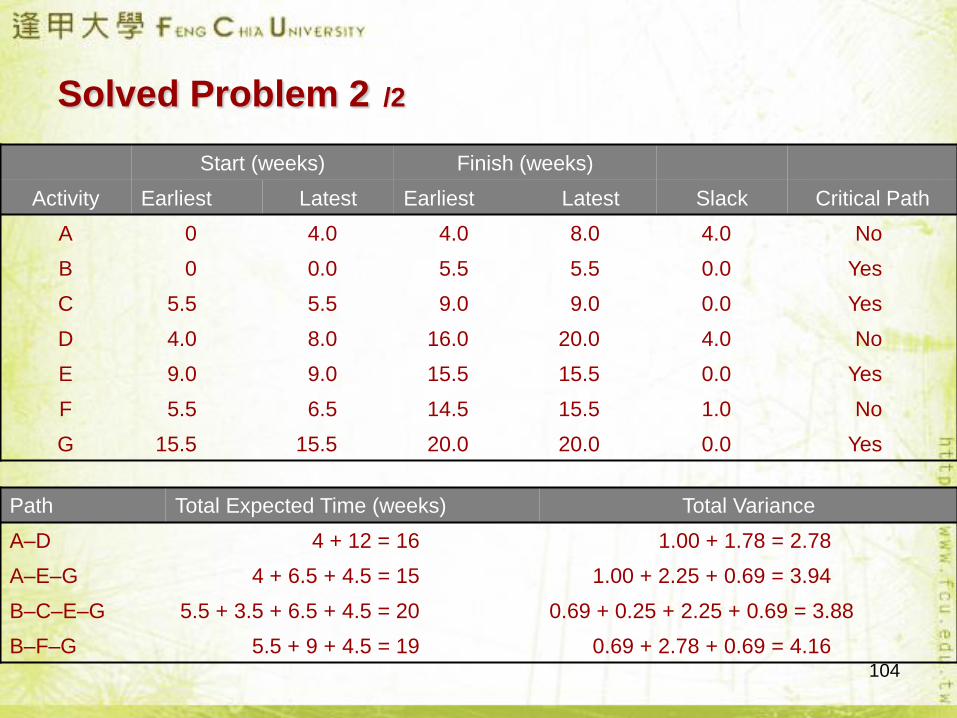
Solved Problem 2 /2
Start (weeks) Finish (weeks)
Activity Earliest Latest Earliest Latest Slack Critical Path
A 0 4.0 4.0 8.0 4.0 No
B 0 0.0 5.5 5.5 0.0 Yes
C 5.5 5.5 9.0 9.0 0.0 Yes
D 4.0 8.0 16.0 20.0 4.0 No
E 9.0 9.0 15.5 15.5 0.0 Yes
F 5.5 6.5 14.5 15.5 1.0 No
G 15.5 15.5 20.0 20.0 0.0 Yes
Path Total Expected Time (weeks) Total Variance
A–D 4 + 12 = 16 1.00 + 1.78 = 2.78
A–E–G 4 + 6.5 + 4.5 = 15 1.00 + 2.25 + 0.69 = 3.94
B–C–E–G 5.5 + 3.5 + 6.5 + 4.5 = 20 0.69 + 0.25 + 2.25 + 0.69 = 3.88
B–F–G 5.5 + 9 + 4.5 = 19 0.69 + 2.78 + 0.69 = 4.16
105
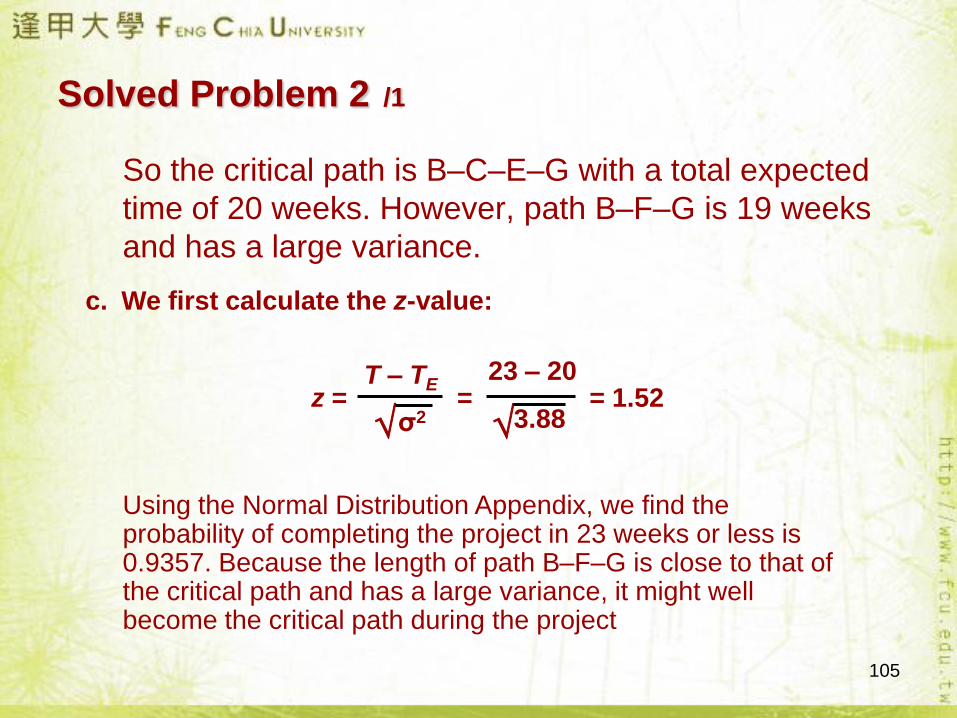
Solved Problem 2 /1
So the critical path is B–C–E–G with a total expected
time of 20 weeks. However, path B–F–G is 19 weeks
and has a large variance.
c. We first calculate the z-value:
z = = = 1.52T – TE
σ2
23 – 20
3.88
Using the Normal Distribution Appendix, we find the probability of completing the project in 23 weeks or less is 0.9357. Because the length of path B–F–G is close to that of the critical path and has a large variance, it might well become the critical path during the project

106
Discussion Session