Embed Size (px)
DESCRIPTION
petro
Citation preview

Chapter 7
Gamma Ray (GR) log
Lecture notes for PET 370
Spring 2012
Prepared by: Thomas W. Engler,
Ph.D., P.E.

GR Log Background
• The Gamma Ray log is a continuous measurement of
the natural radioactivity emanating from the formations?
True or False?

GR Log Background
• The Gamma Ray log is a continuous measurement of
the natural radioactivity emanating from the formations.
True
• The principal isotopes emitting radiation are Potassium-
40, Uranium, and Thorium (K40, U, Th) ?
True or False?

GR Log Background
• The Gamma Ray log is a continuous measurement of
the natural radioactivity emanating from the formations.
True
• Principal isotopes emitting radiation are Potassium-40,
Uranium, and Thorium (K40, U, Th)
True
• Isotopes are concentrated in sands; thus higher
radioactivity occurs in sandstones than other formations.
True or False

GR Log Background
• The Gamma Ray log is a continuous measurement of
the natural radioactivity emanating from the formations.
True
• Principal isotopes emitting radiation are Potassium-40,
Uranium, and Thorium (K40, U, Th)
True
• Isotopes are concentrated in clays; thus higher
radioactivity is in shales than other formations.
False
• Sensitive detectors count the number of gamma rays per
unit of time and record in “API Units” which is 1/200th of
the calibrated, standard response.
True or False?

GR Log Background
• The Gamma Ray log is a continuous measurement of
the natural radioactivity emanating from the formations.
True
• Principal isotopes emitting radiation are Potassium-40,
Uranium, and Thorium (K40, U, Th)
True
• Isotopes are concentrated in clays; thus higher
radioactivity is in shales than other formations.
False
• Sensitive detectors count the number of gamma rays per
unit of time and record in “API Units” which is 1/200th of
the calibrated, standard response.
True

GR Log General GR Response

GR Log Uses
• Estimate bed boundaries, stratigraphic correlations
• Estimate shale content
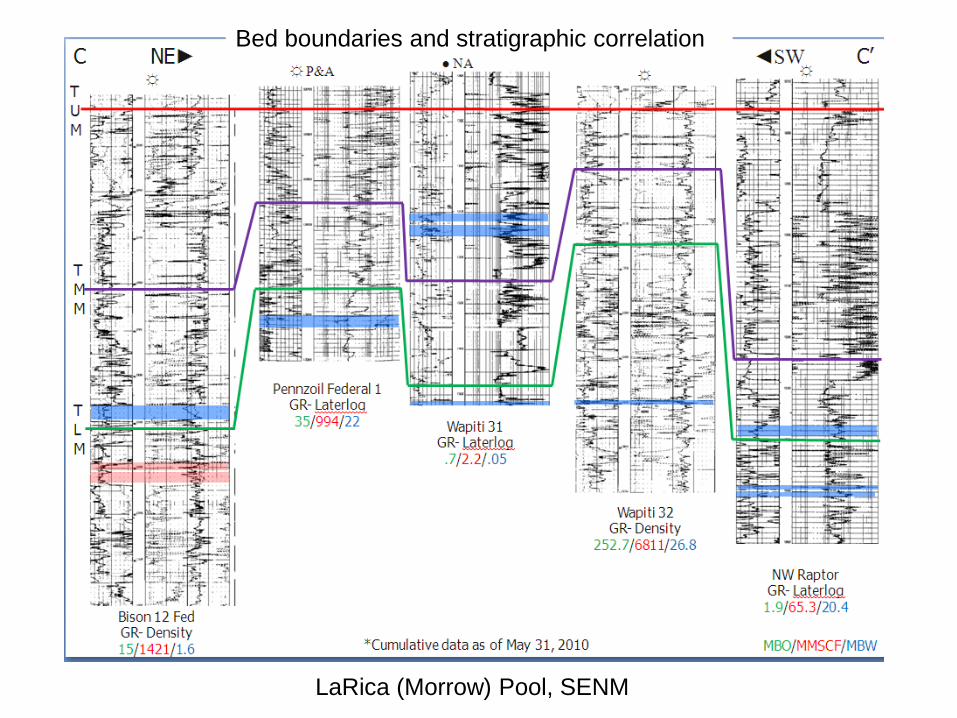
• Perforating depth control
• Identify mineral deposits of potash, uranium, and coal
• Monitor movement of injected radioactive material
Write down five uses of the GR log?
LaRica (Morrow) Pool, SENM
Bed boundaries and stratigraphic correlation
Openhole log
Casedhole log Perforating Depth Control

Openhole log
Casedhole log
Perforating Depth Control

Two-Isotope Tracking in a Two-Stage Fracture Treatment
Monitor movement of injected radioactive material

Gamma ray, density, and microlog-
resistivity data measured in Well Southern
Ute-Mobil 36-1.
Coal intervals are characterized by
densities < 1.75 g/cm3 and lower (20 to
60API) gamma Ray values.
Notice the significant microlog separation
in the coal intervals and the lack of
separation in the noncoal intervals.
Identify mineral deposits of potash, uranium, and coal

GR Log Vsh estimation
• Vsh is the bulk volume of shale (precisely the volume of silt, dry
clay, and bound water) to bulk volume.
• Calculate shale index, IRA , by
where
RAmin is clean zone reading
RAsh is shale zone (max) reading
RA is reading in zone of interest
• GR correlations based on:
– shale distribution type
– age of shale (tertiary or older)
– local area
• Disadvantage: Contamination from non-shale radioactive sources.
minRA
shRA
minRARA
RAI

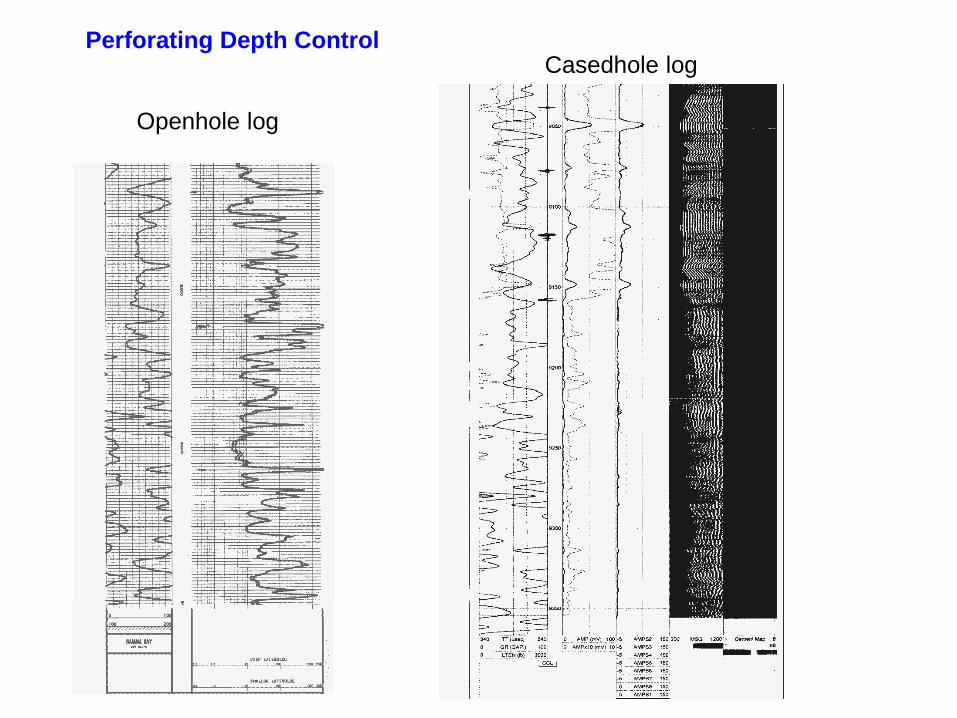
GR Log
Shale Distribution
Define: fe = ft
What is the value
Of Vsh?
fe = ?
Vsh= ?
ft
Vol (str gr)
VB
Name a type of structural shale grain?

GR Log
Shale Distribution
Define: fe = ft
What is the value
Of Vsh?
fe = ?
Vsh= ?
ft -Vsh
Vol (dis)
VB
Name a type of dispersed shale?
GR Log
Shale Distribution
Define: fe = ft
What is the value
Of Vsh?
fe = ?
Vsh= ?
ft -xVsh
Vol (lam)
VB
x= fsh

GR Log Vsh estimation
0.0
0.1
0.2
0.3
0.4
0.5
0.6
0.7
0.8
0.9
1.0
0.0 0.1 0.2 0.3 0.4 0.5 0.6 0.7 0.8 0.9 1.0
Radioactivity Index, IRA
Sh
ale
Vo
lum
e, V
sh
laminated
Clavier, et al
Larionov (older rocks)
Stieber
Larionov (tertiary rocks)

GR Log Vsh estimation
0.0
0.1
0.2
0.3
0.4
0.5
0.6
0.7
0.8
0.9
1.0
0.0 0.1 0.2 0.3 0.4 0.5 0.6 0.7 0.8 0.9 1.0
Radioactivity Index, IRA
Sh
ale
Vo
lum
e, V
sh
laminated
Clavier, et al
Larionov (older rocks)
Stieber
Larionov (tertiary rocks)
RAmin clean sand zone = ?
RA in zone of interest ,Very shaly sand = ?
RAsh shale zone = ?
?
minRA
shRA
minRARA
RAI

GR Log SP/GR Comparison

GR Log Factors affecting tool response
(1). Radiation intensity of the formation
(2). Counter’s efficiency
(3). Time constant (rc)
(4). Logging speed
(5). Borehole environment
Write down five factors that affect GR tool response:

GR Log
Gamma Ray Logs never repeat
exactly! The minor variations are
statistical fluctuations due to the
random nature of the radioactive
pulses reaching the detector.
Typical ranges are 5 - 10 API Units in
shales, and 2 - 4 units in clean
formations
Reduce statistical fluctuations by
optimizing the time constant and
logging speed.
Time constant/logging speed

GR Log
Effect of Time Constant
and Logging Speed
on bed resolution
Time constant/logging speed
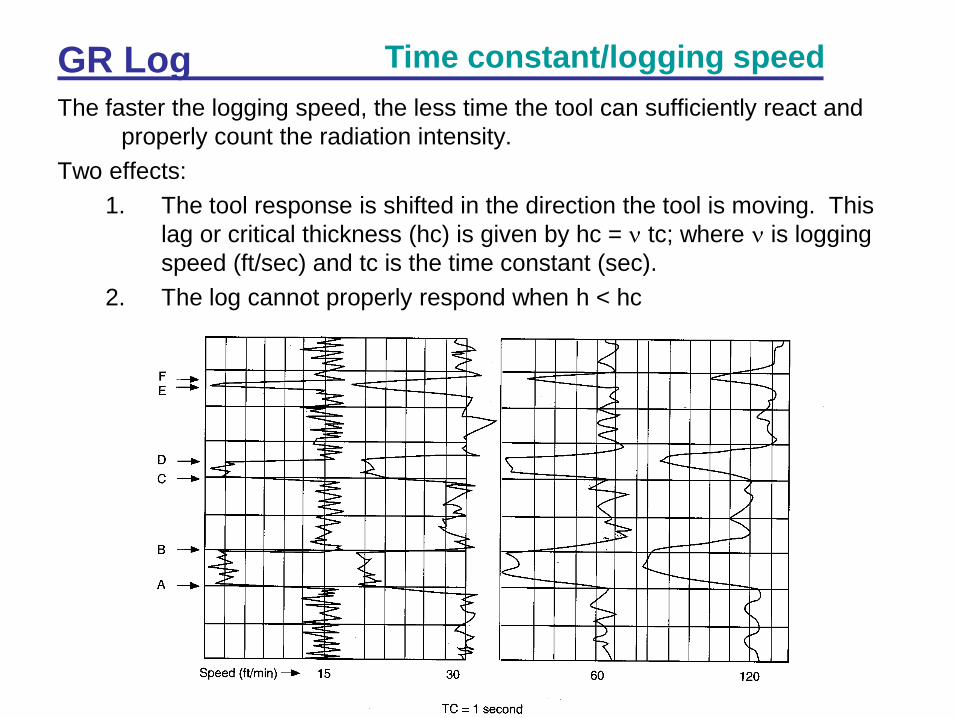
GR Log The faster the logging speed, the less time the tool can sufficiently react and
properly count the radiation intensity.
Two effects:
1. The tool response is shifted in the direction the tool is moving. This
lag or critical thickness (hc) is given by hc = n tc; where n is logging
speed (ft/sec) and tc is the time constant (sec).
2. The log cannot properly respond when h < hc
Time constant/logging speed

GR Log
The time constant and logging speed are regulated so that the GR log
is representative of the formation radioactivity.
1. By experience, hc = 1 ft., avoids excessive distortion of the GR
curve.
2. Common combinations are:
n (ft/hr) tc (seconds)
3,600 1
1,800 2
1,200 3
900 4
Time constant/logging speed

GR Log Borehole effects
Correction typically ignored except for quantitative analysis such
as shale volume calculations.
Function of tool type, borehole size, mud weight, eccentricity

GR Log
Examples:
(1). A GR-CNL-LDT combination is run decentralized. What is the
corrected response if the log response is 40 API units in a 9” hole
with 8.3 ppg mud? ...16” hole ...?
Borehole effects
GRcor/Grlog 1.0
GRcor/Grlog 1.4

GR Log
Examples:
(2). A GR - BHC combination is run centered. What is the corrected
response if the log response is 40 API units in a 9” hole with 16 ppg
mud? ....16” hole....?
Borehole effects
GRcor/Grlog 1.75
GRcor/Grlog 4.5

GR Log References
Bassiouni, Z: Theory, Measurement, and Interpretation of Well Logs, SPE
Textbook Series, Vol. 4, (1994)
Chapter 2, Sec 2.1 – 2.5
Chapter 7, Sec all
Schlumberger, Log Interpretation Charts, Houston, TX (1995)
Western Atlas, Log Interpretation Charts, Houston, TX (1992)


![Sec2 Chap7 Syonan[1]](https://img.pdfslide.us/doc/110x75/555897c1d8b42aa6708b4958/sec2-chap7-syonan1.jpg)