Embed Size (px)
Citation preview
1
GENERAL INTRODUCTION
Since the invention of the laser 50 years ago one of its primary uses was laser ablation
coupled shortly after with optical emission of the ablated matter [1-4] An intense laser
beam is focalised on a sample and the optical emission from the induced plasma is
collected by a spectrometer The analysis of such spectra indicates the elements present in
the plasma This technique is now commonly known as Laser-induced Breakdown
Spectroscopy (LIBS) Before 1980 LIBS was more of a laboratory curiosity that
fascinated people due to its ease in creating a spark (plasma) in various media (gas [5 6]
liquid [7-9] and of course solid [10]) providing an intense optical emission from the laser
spark Shortly after the spectrochemical applications of LIBS driven by its unique
advantages (easy or reduced sample preparation no contact and remote measurement
instantaneous response and precisely localised (micro) surface analysis) started to develop
The first applications of LIBS were investigated at Los Alamos for the detection of
hazardous gases and vapours in air [11 12] and small amounts of beryllium in air or on
filters [13 14] Further development of the technique turned to very practical problems
such as monitoring environmental contamination [15-18] industrial applications for
material processing control [19-21] and sorting of materials to put them in proper scrap
bins [22-24]
New LIBS applications stimulated by a large range of demands in various domains are still
being developed today A few examples are the analysis of art works and cultural heritages
(limited micro destruction) [25-29] homeland security for the investigations on the
detection and analysis of bacteria [30-36] and explosives [37-40] The capability of LIBS
to perform remote detection enables its application in nuclear industry [41-43] A LIBS
module has been integrated by the NASA and the ESA for their planetary exploration
rovers to analyse the soil on Mars [44-50] Today LIBS is an elemental analysis technique
that provides unique features compared to other analytical techniques
However despite these unique features LIBS remains to this day still a technique that
has not yet found a widespread of applications This is not the case for other more
established analytical techniques such as inductively coupled plasma (ICP) One of the
2
main reasons behind this comes from the difficulty of LIBS to provide accurate
quantitative measurements The high complexity associated to the laser-matter interaction
attracts efforts of some research groups to investigate the fundamental aspects of the
laser-induced plasma in order to find a convenient solution to significantly improve the
quantitative analysis performance of the LIBS technique Such efforts include the
understanding of different phenomenon involved in the plasma generation and its
evolution as well as the determination of the parameters such as the electronic density
and the temperature with time and space resolutions
In this thesis we are specifically interested in applying the LIBS technique to organic
materials namely polymers Compared to the laser ablation of metals the plasma induced
on polymeric materials is much less documented and therefore their properties are still
not well established The difference between the laser ablations of metallic and polymeric
materials is due to the differences in absorption and ionisation potentials of these two
types of materials In the case of polymeric materials containing metallic trace elements
the mixture of such different properties can complicate the understanding of the
phenomenon They exhibit discrepancies in their optical thermal and mechanical
properties which greatly influences the properties of the resulted plasma Another
complication is the chemical reactions within the plasma and those with the background
gas which changes the plasma stoichiometry during its expansion The purpose of our
study is to better understand the laser ablation of organic materials in order to reach a
better master of the application of LIBS to such materials
There is an actual need of improving the performance of LIBS for such materials In this
thesis more specifically our purpose is to demonstrate the potential of LIBS for the
identification and classification of plastic materials An application of this nature is
particularly important for industries that use automated sorting of plastic wastes
Our approach consisted first of a detailed study of the properties of the laser-induced
plasma on the surface of polymeric materials By studying these properties for a relatively
simple and homogenous polymer sample we are able to infer on the interaction between
the laser pulse and the sample paving the way to understanding such plasma We used
this knowledge to optimise the experimental configuration and spectral data acquisition
parameters in order to record the plasma emission in the best conditions The data
3
treatment strategy was then developed to get the most significant information for sample
classification and identification Once the ensemble of the experimental procedure was
optimised including spectrum acquisition and data treatment a range of plastic materials
with practical application interests was analysed The obtained results indicate the actual
performance of the method and the further development directions needed to meet the
needs of real industrial standards
The presentation of this thesis is structured in the following way The first chapter is
dedicated to recalling the theoretical basis of laser-induced plasma and that of its
diagnostics with the emission spectroscopy In chapter 2 the early stage expansion of the
plasma has been investigated using the technique of time-resolved shadowgraph This
study allowed us to justify our wavelength and laser choices for further analytical
application of laser ablation of polymeric materials Chapter 3 presents the time-resolved
spectroscopic measurements that allowed us to observe the evolution of the plasma as a
function of the time delay after laser impact on the sample surface The plasma
parameters such as the electron density and temperature are extracted for the assessment
of the local thermodynamic equilibrium (LTE) of the plasma They are also used to define
a suitable detection window with an optimal signal-to-noise ratio Chapter 4 represents an
important part of this thesis A classification and identification procedure was developed
for polymeric materials by combining LIBS and data treatment with the artificial neural
networks (ANN) Our results put forth the potential of the LIBS technique to provide fast
and reliable classification and identification of plastics The industry of plastics waste
sorting and recycling could use this technique to complement and improve the already
existing near infra-red spectroscopy technique for such applications After a general
conclusion we shall finish this manuscript by underlining the perspectives opened by the
results obtained during the course of this work
4
[1] TH Maiman Stimulated optical radiation in ruby Nature 187 (1960) 493-494
[2] LJ Radziemski From LASER to LIBS the path of technology development Spectrochim Acta Part B 57 (2002) 1109ndash1113
[3] F Brech L Cross Opticalmicroemission stimulated by a ruby laser Appl Spectrosc 16 (1962) 59
[4] J Debras-Gueacutedon N Liodec De lrsquoutilisation du faisceau drsquoun amplificateur agrave ondes lumineuses par eacutemission induite de rayonnement (laser agrave rubis) comme source eacutenergeacutetique pour lrsquoexcitation des spectres drsquoeacutemission des eacuteleacutements CR Acad Sci 257 (1963) 3336
[5] PD Maker RW Terhune CM Savage Optical third harmonic generation Proceedings of Third International Conference on Quantum Electronics Paris Columbia University Press New York Vol 2 (1964) 1559
[6] M Young M Hercher C-Y Yu Some characteristics of laser-induced air sparks J Appl Phys 37 (1966) 4938ndash4940
[7] David A Cremers Leon J Radziemski and Thomas R Loree Spectrochemical Analysis of Liquids Using the Laser Spark Applied Spectroscopy 38 (1984) 721-729
[8] J R Wachter D A Cremers Determination of Uranium in Solution Using Laser-Induced Breakdown Spectroscopy Applied Spectroscopy 41 (1987) 1042-1048
[9] H A Archontaki and S R Crouch Evaluation of an Isolated Droplet Sample Introduction System for Laser-Induced Breakdown Spectroscopy Applied Spectroscopy 42 (1988) 741-746
[10] A Felske W-D Hagenah K Laqua Uber einige Erfahrungen bei der Makrospektralanalyse mit Laserlichtquellen I Durchschnittanalyse metallischer Proben Spectrochim Acta Part B 27 (1972) 1
[11] LJ Radziemski TR Loree Laser-induced breakdown spectroscopy time-resolved applications J Plasma Chem Plasma Proc 1 (1981) 281ndash293
[12] DA Cremers LJ Radziemski Detection of chlorine and fluorine in air by laser-induced breakdown spectrometry Anal Chem 55 (1983) 1252ndash1256
[13] LJ Radziemski DA Cremers TR Loree Detection of beryllium by laser-induced breakdown spectroscopy Spectrochim Acta Part B 38 (1983) 349ndash355
[14] DA Cremers LJ Radziemski Direct detection of beryllium on filters using the laser spark Appl Spectrosc 39 (1985) 57ndash63
[15] R Wisbrun I Schechter R Niessner H Schroeder and K L Kompa Detector for trace elemental analysis of solid environmental samples by laser plasma spectroscopy Anal Chem 66 (1994) 2964-2975
[16] A Ciucci V Palleschi S Rastelli et al Trace pollutions analysis in a soil by a time-resolved laser-induced breakdown spectroscopy technique Appl Phys B ndash Las Opt 63 (1996) 185-190
[17] I B Gornushikin J I Kim B W Smith S A Baker and Winefordner Determination of cobalt in soil steel and graphite using excited-state laser fluorescence induced in a laser spark Appl Spectrosc 51 (1997) 1055-1059
5
[18] F Hilbk-Kortenbruck R Noll P Wintjens H Falk and C Becker Analysis of heavy metals in soils using laser-induced breakdown spectroscopy combined with laser-induced fluorescence Spectrochem Acta B 56 (2001) 933-945
[19] C Aragon JA Aguilera J Campos Determination of carbon content in molten steel using laser-induced breakdown spectroscopy Appl Spectrosc 47 (1993) 606ndash608
[20] JA Aguilera C Aragon J Campos Determination of carbon content in steel using laser-induced breakdown spectroscopy Appl Spectrosc 46 (1992) 1382ndash1387
[21] M Sabsabi P Cielo Quantitative analysis of aluminium alloys by laser-induced breakdown spectroscopy and plasma characterization Appl Spectrosc 49 (1995) 499ndash507
[22] R Sattmann I Moumlnch H Krause R Noll S Couris A Hatziapostolou A Mavromanolakis C Fotakis E Larrauri and R Miguel Laser-induced breakdown spectroscopy for polymer identification Appl Spectroscopy 52 (1998) 456-461
[23] I Moumlnch R Noll R Buchholz and J Worringer Laser identifies steel grades Stainless Steel World 12 (2000) 25-29
[24] H Fink U Panne and R Niessner Analysis of recycled thermoplastics from consumer electronics by laser-induced plasma spectroscopy Anal Chem Acta 440 (2001) 17-25
[25] D Anglos Laser-Induced Breakdown Spectroscopy in Art and Archaeology Applied Spectroscopy 55 (2001) 186A-205A
[26] L Burgio K Melessanaki M Doulgeridis R J H Clark and D Anglos Pigment identification in paintings employing laser induced breakdown spectroscopy and Raman microscopy Spectrochimica Acta Part B56 (2001) 905-913
[27] M Bicchieri M Nardone PA Russo A Sodo M Corsi G Cristoforetti V Palleschi A Salvetti E Tognoni Characterization of azurite and lazurite based pigments by laser induced breakdown spectroscopy and micro-Raman spectroscopy Spectrochimica Acta Part B56 (2001) 905-913
[28] F Colao R Fantoni V Lazic and V Spizzichino Laser-induced breakdown spectroscopy for semi-quantitative and quantitative analyses of artworks-application on multi-layered ceramics and copper based alloys Spectrochim Acta Part B 31 (2002)1219-1234
[29] V Detalle Q Glorieux R Bruder D LHermite A Semerok La spectroscopie deacutemission optique sur plasma induit par laser (LIBS) Un nouvel outil analytique pour leacutetude in situ de la peinture murale et des polychromies = Laser induced breakdown spectroscopy (LIBS) a new analytical technique for in situ study of painted artworks L Actualiteacute chimique no312-13 (2007) 98-104
[30] J Hybl G Lithgow and S G Buckley Appl Spectrosc Laser-Induced Breakdown Spectroscopy Detection and Classification of Biological Aerosols 57 (2003) 1207-1215
[31] A C Samuels F C De Lucia Jr K L McNesby and A W Miziolek Appl Opt Laser-induced breakdown spectroscopy of bacterial spores molds pollens and protein initial studies of discrimination potential 42 (2003) 6205-6209
6
[32] S Morel N Leon P Adam and J Amouroux Appl Opt Detection of bacteria by time-resolved laser-induced breakdown spectroscopy 42 (2003) 6184-6191
[33] C A Munson F C De Lucia Jr T Piehler K L McNesby and A W Miziolek Investigation of statistics strategies for improving the discriminating power of laser-induced breakdown spectroscopy for chemical and biological warfare agent simulants Spectrochim Acta Part B 60 (2005) 1217-1224
[34] Matthieu Baudelet Laurent Guyon Jin Yu Jean-Pierre Wolf Tanguy Amodeo Emeric Freacutejafon Patrick Laloi Spectral signature of native CN bonds for bacterium detection and identification using femtosecond laser-induced breakdown spectroscopy Appl Phys Lett 88 (2006) 063901
[35] Matthieu Baudelet Laurent Guyon Jin Yu Jean-Pierre Wolf Tanguy Amodeo Emeric Freacutejafon Patrick Laloi Femtosecond time resolved laser-induced breakdown spectroscopy for detection and identification of bacteria a comparison to the nanosecond regime J Appl Phys 99 (2006) 084701
[36] Matthieu Baudelet Jin Yu Myriam Bossu Julien Jovelet and Jean-Pierre Wolf Tanguy Amodeo and Emeric Freacutejafon Patrick Laloi Discrimination of microbiological samples using femtosecond laser-induced breakdown spectroscopy Appl Phys Lett 89 (2006) 163903
[37] Russell SHarmon FrankCDeLucia Jr Aaron LaPointe Raymond JWinkel Jr Andrzej W Miziolek LIBS for landmine detection and discrimination Anal Bioanal Chem 385 (2006) 1140ndash1148
[38] Frank C De Lucia Jr Russell S Harmon Kevin L McNesby Raymon J Wonkel Jr Andrzej W Miziolek Laser-induced breakdown spectroscopy analysis of energetic materials Appl Opt 42 (2003) 6148ndash6152
[39] Alexander Portnov Salman Rosenwaks Ilana Bar Emission following laser-induced breakdown spectroscopy of organic compounds in ambient air Appl Opt 42 (2003) 2835ndash2842
[40] Cristina Lopez-Moreno Sandiago Palanco J Javier Laserna Frank DeLucia Jr Andrzej Miziolek Jeremy Rose Roy A Walter Andrew I Whitehouse Test of stand-off laser-induced breakdown spectroscopy sensor for the detection of explosive residual on solid surface J Anal At Spectrom 21 (2006) 55ndash60
[41] C M Davies H H Telle and A W Williams Remote in situ analytical spectroscopy and its applications in the nuclear industry Fresenius Journal of Analytical Chemistry 355 (1996)
[42] A I Whitehouse J Young I M Botheroyd S Lawson C P Evans and J Wright Remote material analysis of nuclear power station steam generator tubes by laser-induced breakdown spectroscopy Spectrochimica Acta B 56 (2001) 821-830
[43] Laurent Salmon Analyse LIBS en milieu nucleacuteaire talk in Journeacutees LIBS Mai 18-19 2009 Bordeaux France
[44] CB Dreyer G S Mungas P Thanh and JG Radziszewski Study of Sub-mJ-Excited Laser Induced Plasma Combined with Raman Spectroscopy under Mars Atmosphere-Simulated Conditions Spectrochimica Acta B 62 (2007) 19
7
[45] GS Mungas CB Dreyer AJ Bauer Elemental Abundance Measurement using Micro-LIBS for Space Exploration Lunar and Planetary Science Conference XXXX 2264 (2009)
[46] Andrew K Knight Nancy L Scherbarth David A Cremers and Monty J Ferris Characterization of Laser-Induced Breakdown Spectroscopy (LIBS) for Application to Space Exploration Appl Spectrosc 54 (2000) 331-340
[47] F Colao R Fantoni V Lazic A Paolini F Fabbri GG Ori L Marinangeli A Baliva Investigation of LIBS feasibility for in situ planetary exploration An analysis on Martian rock analogues Planetary and Space Science 52 (2004) 117 ndash 123
[48] Beacuteatrice Salleacute David A Cremer Sylvestre Maurice Roger C Wens Laser-induced breakdown spectroscopy for space exploration applications Influence of the ambient pressure on the calibration curves prepared from soil and clay samples Spectrochimica Acta B 60 (2005) 479-490
[49] Jean-Baptiste Sirven Beacuteatrice Salleacute Patrick Mauchien Jean-Luc Lacour Sylvestre Maurice and Geacuterard Manhegraves Feasibility study of rock identification at the surface of Mars by remote laser-induced breakdown spectroscopy and three chemometric methods J Anal At Spectrom 22 (2007) 1471ndash1480
[50] Patrick Mauchien Jean-luc Lacour Beacuteatrice Salleacute Laurent Salmon Lanalyse chimique des roches martiennes Clefs CEA no54 (2006) 73-77
8
9
CHAPTER I THEORETICAL BASIS
1 INTRODUCTION Laser ablation of metals has been the subject of a large number of studies leading to a lot
of published results when compared with organic samples [1] The ablation of metals
remains easier to understand when compared to organic substances which add more
complications to the mechanism of plasma generation This is especially true when we
consider metallic elements in an organic matrix Due to different absorption properties
the laser interaction with organic and with metallic samples differs putting forth even
further discrepancies of the plasma properties ie non stoichiometric ablation because of
the large difference between their ionisation potentials To improve the understanding of
the laser ablation of polymers we decided to study simple polymer samples such as
Nylon or PVC
10
In this chapter we wish to recall briefly the basic fundamentals that we used in our
understanding of the laser-induced plasma and the spectroscopy of plasmas induced from
polymeric materials Many parameters can influence the plasma properties but we shall
first begin with the main differences between the plasma generations with femtosecond or
nanosecond laser pulses A further emphasis will be made between UV and IR
nanosecond laser pulses After briefly discussing the plasma formation we shall evoke
our methods for plasma diagnostics (electronic density and temperature calculations) The
spectral emission is used to calculate the electronic density (mainly Stark broadening) and
the different plasma temperatures (atomic ionic and molecular) These measurements
will allow us to assess the local thermal equilibrium (LTE) of the plasma An introduction
of calibration free LIBS (CF-LIBS) finishes off this chapter even if we still have not used
this method of analysis in this thesis The advantages associated with this technique have
greatly attracted us and we would like to implement it in our further works
2 PLASMA GENERATION The mechanisms involved in the ablation depend on a number of variables that effect the
interaction between the laser pulse and the sample target Firstly the properties of laser
pulses can lead to different interaction regimes with regards to the pulse duration the
wavelength and the fluence of the pulses Secondly the target (can be in a solid liquid or
gas form) and its properties also influence the ablation due to its specific laser absorption
mechanism and matrix effects Lastly the surrounding atmosphere during ablation such
as the pressure and the ambient gas (inert air vacuum etc) will also influence the plasma
generation and its expansion The main differences between nanosecond and femtosecond
laser ablation will be evoked here followed by the main mechanisms in which a plasma is
formed
Laser ablation consists of focalising an intense laser emission on a sample and removing
matter from the surface For a LIBS measurement a focalising lens directs and
concentrates the laser pulse energy on the surface of the material of interest For this
reason we shall often talk in terms of the pertinent factors which are the fluence (often
expressed in 119869 frasl 119888119898sup2) or the irradiance (often expressed in 119866119882 frasl 119888119898sup2 ) They allow us to
take into account the size of the section of the focalised beam and the laser pulse duration
11
respectively In order to generate a plasma the irradiance must be greater than what is
called the ablation threshold 119868119905ℎ (or a fluence greater than 119865119905ℎ) As a consequence the
locally removed mass exhibits rapid melting and evaporation to form a vapour This
vaporised mass is exploded out of the material at a supersonic velocity However only
when the vapour is sufficiently ionised can it be then called a plasma [2] We can note at
this point that our experimental research was conducted so that the laser fluence was
always above the threshold value to ensure the plasma generation
21 LASER-MATTER INTERACTION
The practical reason for which we would like to go into the further detail of the
fundamentals of the laser-matter interaction is because it will enable us to define the
appropriate optimisation of our LIBS experimental parameters For us this means finding
the parameters where we are able to acquire the most significant results As already
discussed the pulse duration has a significant impact on the ablation process In the
nanosecond regime there is a significant interaction between the laser emission and the
ablated material In the femtosecond regime the laser pulse does not directly interact with
the generated plasma This laser-plasma interaction therefore drastically influences the
plasma properties We shall start by discussing the nanosecond regime (in UV and IR)
then the femtosecond regime
211 Nanosecond Ablation
The most common type of laser used in LIBS is the nanosecond NdYAG which can
provide pulse in different wavelengths ranging from UV to IR Nanosecond lasers emit
pulses long enough (around 5 ns FWHM in our case) their ldquotailrdquo remains present during
plasma formation and expansion This leads to a significant post-ablation interaction
between them ie the laser energy continues to be absorbed by the vapour The laser
energy can be absorbed by atoms or molecules leading to their excitation or even their
ionisation [3] The laser energy can also be absorbed by free electrons leading to their
heating and the cascade ionisations due to subsequent collisions between electrons and
atoms or molecules The initial temperatures can be very high (6000 ndash 20000 K) with
high electron densities (1017 minus 1019 cmminus3) [4] The energy loss and cooling of the
12
electrons is mainly due to the thermal propagation into the target [5] The heat
propagation diffuses a few microns into the target causing it to melt in a non-
homogenous way creating craters with messy borders
Depending on the irradiance and the wavelength of the pulse the ablation mechanisms
can be either dominated by thermal (melting sublimation and vaporisation) or non-
thermal (direct molecular bond breaking) processes We will focus on laser irradiances
greater than 108 Wcmsup2 to create plasmas with high enough temperatures to ensure the
atomic excitation and ionisation of the metallic elements present in certain polymers The
subsequent laser-plasma interaction enables even further heating of the free electrons
within the plasma
The photon absorption in a plasma is mainly due to inverse Bremsstrahlung (IB) and
photoionisation (PI) processes since the other absorption mechanisms have smaller cross
sections and are ignored at this laser intensity [467] The consequence of IB is higher
temperature of electrons These excited electrons in turn collide with neighbouring ions or
neutral atoms more violently causing the liberation of other electrons and in turn ionising
more atoms This phenomenon is known as avalanche ionisation As long as the
electromagnetic field of the laser remains in interaction with the electrons this process
will repeat itself increasing the ionisation degree of the plasma [2] The cross sections of
the collisions between electrons-ions are much greater than those between electron-
neutrals
The inverse Bremsstrahlung (IB) absorption 120572119868119861(119888119898minus1) is approximately proportional to
1205823 as can be seen in Equation (11) The second part of the right hand side accounts for
the simulated emission [2 3]
13
120572119868119861 = 1198761198731198901198730 + 4 1198906 1205823 119873119890 119885sup2 119873119894
3 ℎ 1198884 119898119890
21205873 119898119890 119896119861 119879119890
12 1 minus 119890119909119901 minus
ℎ 119888120582 119896119861 119879119890
(11)
With 120572119868119861 inverse Bremsstrahlung absorption coefficient (119888119898minus1) 119876 cross section for electron-photon absorption (1198881198982) 119873119890 electron density (119888119898minus3) 1198730 neutral atom density (119888119898minus3) 120582 ablation wavelength (cm) 119885 ion charge (1 or 0) 119873119894 ion density (119888119898minus3) 119888 speed of light (119888119898119904) ℎ Plankrsquos constant (eV s) 119898119890 electron mass (119872119890119881119888sup2) kB Boltzmanns constant (eVK) T excitation temperature (K) e elementary charge
Another photon absorption process that initiates the plasma formation by producing more
free electrons is photoionisation Photoionisation is defined as the ionisation of an atom or
a molecule by a single or several photons that have a sufficient amount of energy to
directly eject an electron out of the atom or molecule When the combination of a few
photons is required the process is called multiphoton ionisation (MPI) The energy
associated to a photon is defined in Equation (12) and is inversely proportional to 120582 This
indicates that UV radiation will therefore more efficient for ionising atoms or molecules
then IR wavelengths
119864 = ℎ120584 =ℎ119888120582 (12)
Laser-plasma interaction is the main ionising mechanism of the vapour dominating the
direct ionisation of particles when vaporised [8] where 10 of the particles are
considered to be ionised [9 10] The coupling between the laser and the plasma
complicates the evolution of the plasma For example plasma screening (can also be
called shielding) can occur in a sufficiently dense plasma ie the electronic density
reaches the critical density 119873119888(119888119898minus3) defined by Equation (13) [8 10]
119873119888 = 1021
1205822 (13)
With 120582 wavelength (microm)
14
It can be seen that 119873119888 is inversely proportional to the square of the wavelength 120582(micro119898) ie
shorter wavelengths have higher critical densities diminishing the probability for
shielding When the plasma reaches this density the ldquotailrdquo of the laser pulse is reflected
backwards and its interaction with the plasma (especially the core) is no longer possible
For laser ablation of polymers there can be photochemical or photothermal ablation
There is even the possibility of having a mixture of both Photochemical ablation is
defined as the absorption of laser photon (or photons) to dissociate the molecular bonds
within the polymer and directly evaporate the matter Photothermal ablation is when heat
is dissipated within the sample to cause melting and etching [1112] which is more
commonly observed in laser ablation of metals
The ablation depth for polymers per laser pulse 119871 is expressed in Equation (14) The
logarithmic dependence with the ablation fluence can be applied to most solids even if it
is more commonly used for polymers [13]
119871 cong 120572minus1 ln 119865119865119905ℎ
(14)
With 119871 ablation depth per laser pulse (micrompulse) 120572 absorption coefficient of the sample (cm-1) 119865119905ℎ ablation threshold fluence (J cm-2) 119865 laser fluence (J cm-2)
Srinivasan felt the need to introduce another term to Equation (14) to put forth the
contributions of both the photochemical and photothermal mechanisms [14]
119871 cong 120572minus1 ln 119865119865119905ℎ
+ 119860 exp minus1198641119877119879
(15)
With 1198641 activation energy (119888119886119897 frasl 119898119900119897) T temperature of the sample (K) 119860 prefactor of the Arrhenius equation 119877 gas constant (119888119886119897 frasl (119870 119898119900119897))
15
a Infrared ablation (1064 nm)
For the ablation of polymeric materials the photoionisation is very weak in this regime as
the infrared photons do not carry a sufficient amount of energy to chemically break the
bonds Due to the insufficient amount of energy of one IR photon to break the chemical
bonds present in polymers it is more likely to see photothermal ablation in this case The
vibrational modes of molecules absorb the laser energy and diffuse it in the form of heat
This leads the sample surface to melt In order to have ablation a chemical bond needs to
absorb several quanta of laser energy to induce evaporation During this time however
the material located close to this area will undergo a melting process [11] This leads to a
low efficiency of matter removal by ablation The post-ablation heating observed in IR
ablation is quite efficient which leads to a higher temperature in the plume In fact Wang
et al [16] reported the plasma emission to be up to 5 times higher for IR emission for the
main carbon line at 248 nm The observed enhancement in optical emission from the
plasma is due to a higher temperature rather an increase in the ablated material due to the
high energy of the excited state
More specifically for the post-ablation interaction between the plasma and the laser in
this regime the main absorption mechanism is the inverse Bremsstrahlung as indicated in
Equation (11) causing strong electron heating in the plasma and cascade ionisations The
electron density of the plasma will then increase to the point where it reaches 119873119888 and
visible partial screening (also called shielding) of the plasma can be observed The laser
irradiance needs to be greater than 2 times 108 Wcmsup2 for plasma shielding to take place [3]
Chapter 2 presents shadowgraph images of the plasma in expansion to show this
phenomenon very clearly [2] When partial screening commences the laser pulse ldquotailrdquo
can no longer couple to the target material as its entire energy is absorbed by the plasma
or even reflected Therefore even when the fluence increases the ablation depth remains
low The consequence on the plasma expansion is the laser-supported detonation wave
(LSD) as it will be shown in Chapter 2
16
b Ultraviolet ablation (266 nm)
Inverse Bremsstrahlung is less efficient for UV ablation than in IR ablation However the
multi photon ionisation coefficient is much higher leading to a large number of ions [7]
The recombination processes that compete with the electron generation by multiphoton
ionisation may reduce the amount of charged particles in the plasma The critical electron
density is higher in this regime reducing the effect of plasma shielding This allows a
more efficient coupling between the laser pulse and the target The energy associated to
this wavelength is greater than 47 eV This means that the UV wavelength has enough
energy to chemically dissociate and break the bonds through multi photon process
within the matrix for most organic materials
When bonds are broken in a non-thermal manner ie not heat induced but more
chemically broken the ablation is said to be photochemical [17] When a polymer
absorbs a UV photon it can either excite the kinetic energy of its internal vibrational
transitions (photothermal) or directly break a chemical bond within the target [11] For
UV nanosecond ablation there is usually a mixture between both photothermal and
photochemical ablation The photochemical processes that intervene in UV ablation
results in higher ablation rates (ablation efficiency which is the ablated mass per laser
pulse per unit area [218]) Furthermore the rotational translational and vibrational
temperatures of ablated species are not in equilibrium The shockwaves have higher
initial velocities the surface swelling is faster and a lower ablation threshold value is
found when compared to IR ablation [219]
To conclude about the differences between the nanosecond UV and IR ablation regimes
regimes we present a model by Garrison et al [11] in Figure 1 which illustrates the
photochemical ablation (no melting can be seen around the crater just a clean expulsion of
matter) and the photothermal ablation (melting and evaporation)
17
Figure 1 Nanosecond laser ablation of polymers in air [11] at different time delays after laser impact a) UV ablation (1 photon per monomer) b) IR ablation (1 photon per monomer) c) IR ablation (4 photons of energy delivered to each monomer) There is a slight perspective in the drawings
212 Femtosecond Ablation
In the case of femtosecond ablation the phenomenon responsible for the ejection of
matter from the surface of a target is the Coulomb explosion otherwise known as non-
thermal melting When the electronic excitation energy due to the intense laser field is
transferred to the lattice phonons in the form of kinetic energy the atomic motion can be
so violent as to break the bonds that hold solids together The release of the electrons of
the solid [20] leaves behind a locally positively charged lattice Since the electrons are
negatively charged this mutual repulsion (Coulomb repulsion) creates an explosion
where a small cluster of charged and energetic ions creates a plasma
The energy absorbed by the electrons increases instantaneously but the time it takes for
them to transfer their energy to the lattice phonons depends on the thermal conductivity of
the sample [15] and cannot be neglected for femtosecond ablation For femtosecond
ablation the heat diffused to the target represents only a tiny part of the laser energy The
rest of the very intense beam is used to create photothermal changes and multi-photon
ionisation
The craters produced in this regime have smoother edges and can be processed more
precisely compared to the craters induced by nanosecond pulses This can be due to the
absence of the liquid phase in femtosecond ablation The velocity of the ejected mass is
a cb
18
considerably faster than the thermal velocity of the particles [18] Photons from visible
and IR femtosecond pulses do not have enough energy for ionisation The absorption of
several photons (multi-photon absorption MPA) makes the ionisation possible but makes
the process more sensitive to the laser intensity [21] 119872119875119860 = 120590 119868119898 where 119898 satisfies the
equation 119898ℏ120596 gt 119864119892 Due to the higher peak intensities of ultrashort laser pulses the
interband transitions are significantly increased Ablation efficiency is best for
femtosecond pulses and it is improved for ns pulses when the laser wavelength decreases
on metal targets [18] Our shadowgraph experiments will demonstrate that this is also the
case for polymeric targets
In femtosecond ablation the laser pulse is absent during the plasma expansion meaning
that there is no interaction between the laser pulse and the expanding plasma The pulse
shielding effects is totally absent Due to high intensity of a femtosecond pulse it can
however create an ionised channel by breaking down the air molecules during its passage
This can be observed in the shadowgraphs in Chapter 2
22 PLASMA FORMATION Figure 2 shows the different steps observed during the nanosecond ablation of a solid
sample The laser pulse strikes the sample surface (a) where it is first absorbed The
energy absorbed is rapidly converted into heat and causes the sample to locally melt Due
to the focalisation that increases the irradiance the laser beam contains enough energy to
induce vaporisation and fragmentation (b) The boiling point is reached when the pressure
of the vapour exceeds that of the ambient environment As seen before for intensities
higher than 108 Wcmsup2 a large number of electrons ions and excited atoms are present in
the vapour and absorb part of the laser energy leading to a breakdown in the vapour and
its ionization (c) [67] At this moment the plasma is dominated by the continuum
emission that overbears any other atomic emissions The emission detected in this phase
is mainly due to the Bremsstrahlung and the recombination processes
When the laser pulse is over the plasma continues to expand very rapidly attaining
supersonic velocities [11] (~ 106 cms) perpendicular to the surface The ions formed at
the beginning start to capture the free electrons leading to neutrals De-excitation of ions
19
and neutrals lead to the emission of characteristic photons a very important point that
allows us to determine the concentration of the elements in the plasma with the LIBS
technique (d) This phase is followed by the formation of aggregates and clusters due to
the decrease in temperatures (e) which are deposited around the crater along with the
molten material created by the laser melting (f)
Different time stages can be studied during the expansion of the plasma Figure 1 shows
the time evolution of these stages (A B C and D) with regards to a femtosecond and
nanosecond laser pulse duration The first phase A represents the time that the laser pulse
transfers its energy to the sample The laser photons are immediately absorbed by the
surface electrons (~10-15 s) It then takes ~100 fs for them to thermalise amongst
themselves and transfer their energy in turn to the lattice phonons (a few ps) Followed by
phase B where the plasma vapour containing ions atoms and molecular fragments
initiates its expansion into the surrounding environment Due to the supersonic velocity of
this expansion a shockwave engulfs the plasma This expansion continues for several
microseconds From the formation of the plasma and until its dissipation it emits
radiation The continuum radiation is followed by the ionic atomic and molecular
emission lines that can be used to determine the elements present within the plasma In
phase C the excited ions atoms and molecules return to a more stable state by emitting
photons The plasma further relaxes in phase D where its temperature falls below the
fusion temperature and the condensation starts to form nanoparticles [1] In this thesis we
will mainly focus on parts B and C where the expansion and the spectral emission of the
plasma will be studied
20
Figure 2 Plasma formation for nanosecond pulses with sufficiently high fluence [2223]
ns laser pulse
e
Polyatomicagregats
f
Deposition of ablated material
a
Laser
1 fs
bVapor
Fragmentation
100 ps
c
Shockwave
Emission
Absorption
1 ns
d
Plume expansion
1 ns ndash 100 micros
21
3 LIP EMISSION SPECTROSCOPY
31 LIP EMISSION
Laser-induced breakdown spectroscopy (LIBS) uses the spectral emission from the laser-
induced plasma (LIP) for elemental analysis of the target However from the moment the
plasma is formed until the moment it is dissipated it goes through different stages The
spectra collected at different delays and different gate widths are therefore different Figure
3 shows the evolution of the optical emission intensity with regards to the time after the
laser pulse strikes the sample It can be divided into two parts a very intense signal that
comes from the continuum and the atomic or molecular signals used to characterise the
sample At early delays (especially when the laser pulse is still present) the optical signal is
dominated by a strong continuum emission During laser ablation ions and neutral atoms
are liberated and are further ionised by the laser pulse Therefore ionic lines are first seen
followed by atomic and finally molecular spectral emission lines The delay after laser
impact chosen and the gate width are important criteria depending on what is to be
analysed Time-resolved studies are the best way to find the most adequate time delay and
gate width according to the application
Figure 3 The evolution of the intensity emission from a laser induced plasma [24]
1ns 10ns 100ns 1micros 10micros 100micros
Time after laser impact
Inte
nsity
[au
]
Laser
Continuum
Atomic lines (I)
Ionic lines (II)
DelayGate
Molecular lines
pulse
Gate of detector
22
Since these excited states are not stable the electrons within the atoms and molecules will
return to more stable energy levels by releasing their excess energy in the form of photons
(Figure 4) This can be done either by spontaneous emission or by intense enough
collisions Contrary to the continuum radiation the photons emitted (ℎ120584119894119895) are specific to
their transitions and therefore represent different atomic or molecular information This
information is the essential for the diagnostics of the plasma ie calculate the electron
density and the temperature
Figure 4 Continuum and Spectral line emission
Bremsstrahlung Radiation
In the first picoseconds the electrons and ions start colliding and interacting When a free-
electron is decelerated in the presence of a strong electromagnetic field such as the one of
an atomic nucleus the loss of kinetic energy is transformed into radiation shown in
Figure 5 This process is called Bremsstrahlung which is the German term meaning
ldquobraking radiationrdquo Since the electron started being free and after the interaction
remained free it is known as a free-free transition However when a free electron is
captured by an ion instead of being deviated this leads a free-bound transition The
n = 1
n = 5
n = 3n = 4
n = 2
En(eV)
0 n rarrinfin
Excitation
Ionisation
hν21Emission
Continuum
Spectral discrete emission lines
Continuum emission
23
excess kinetic energy is given off in the form of a photon resulting in recombination
radiation These two radiation mechanisms are responsible for the continuum emission
Since this emission is mainly due to the free electrons present in the plasma it does not
represent any spectral lines
Figure 5 Bremsstrahlung radiation
Spectral line emission
The LIBS technique is based on the study of the light emission from a laser-induced
plasma After an enough long delay a discrete spectrum is recorded with peaks produced
at specific wavelengths This means that every peak corresponds to an element and this is
how we use the plasma to characterise the ablated matter For molecular lines it often
comes in a group of lines which can be observed in the results in Chapter 3 Between the
time the photon is emitted and the time it is detected it has the possibility to get
reabsorbed by other ions or atoms An optically thick plasma means most of the radiation
cannot escape the plasma due to high absorption When the photons are directly detected
the plasma is said to be optically thin This is the ideal situation for LIBS but
unfortunately this is not always the case Corrections have to be made and some spectral
lines have to altogether be ignored to avoid erroneous interpretations
Self-absorption and Self-reversal
Electron approaching a positively charged
particle with energy E1
Electron changes direction and decreases
in energy E2
Positively charged particle
The sudden decrease in energy results in the emission of a photon
(E2 - E1)
h f = E2 ndash E1
E1
E2
e
e
24
The corrections are not the same depending on how the photon is reabsorbed If the
photon emitted from one atom is absorbed by another atom of the same element close by
considered to be at the same temperature and surrounded by the same electron density
the spectral line is said to be self-absorbed Transitions which involve the fundamental
level are more affected by such perturbations When a photon is emitted from the hot core
of the plasma and absorbed by an atom of the same element in the cooler exterior where
the temperatures and the electronic density differ the phenomenon of self-reversal is
observed Both phenomena give rise to distorted spectral lines which can be seen in
Figure 6 Self-reversal results in broadening but most importantly it is marked by a dip in
the centre of the peak Self-absorption broadens the spectral line making it difficult to
distinguish from other non-distorted lines
Figure 6 Self-absorption (upper) and Self-reversal (lower) spectral distortions [25]
A lot of emphasis is given to spectral line analysis because they are the basis of plasma
diagnostics and the technique of LIBS For example the electronic density can be found
by studying the spectral line width and the temperature can be calculated using the line
intensities Due to the self-absorption or self-reversal it is crucial to carefully select the
Wavelength (nm) Wavelength (nm)
Inte
nsit
y (a
u)
Inte
nsit
y (a
u)
Absorption of a photon by a near by atom with not a large
difference in temperature(T1 harr T1 ) and (T2 harr T2)
Absorption of a photon by a far away atom with a large difference in temperature
(T1 harr T2)
Emission (T Ne N1)
Absorption (T Ne N2)
Emission (T1 Ne N1)
Absorption (T2 Ne N2)
Resulting Profile
Resulting Profile
25
spectral lines Self-absorbed lines are not always easy to identify because of having the
same allure as non absorbed lines The spectral lines chosen should ideally have [26]
strong intensity in the working spectral range
minimum overlapping with other lines
minimum self-absorption
without saturation for the detector
In practice these ideal lines are very difficult to attain altogether There are a few
compromises that need to be done For example when a line is known to be self-
absorbed their intensities should be corrected before being used or otherwise excluded
from the calculations Lines that include the fundamental level should also be avoided
[27] from a certain value of the electron density
32 PLASMA DIAGNOSTICS
The plasma dynamics and time evolution have interested many researchers for a few
decades [13 28 29] Temporal and spatial evolutions have been extensively studied to
understand the different mechanisms that occur after laser impact A certain emphasis is
taken on electron density and temperature calculations from spectral data Some of these
calculations particularly the those for estimating the plasma temperature can only be used
when the plasma is considered to be at a certain equilibrium known as the local
thermodynamics equilibrium (LTE)
Before going into more detail regarding LTE explanations on the electron density and
temperature calculations will be first explained For now very simply LTE first requires
that the plasma has a certain electron density larger than a critical value (equation (142))
and then that all the species present (atomic ionic and molecular) be defined by the same
and unique temperature In other words the excitation temperatures of different spaces
(atoms ions and molecules) must have the same value as temperature of the electrons
For the LIP plasma a transient and expanding plasma other criteria which takes into
account the time evolution and the inhomogeneity of the plasma need to be considered
26
[30 31] Only when these criteria are fulfilled the LTE can be considered In addition
for a typical LIBS plasma only neutral and singly charged ions are taken into account for
the following calculations [24]
321 Electron Density Calculation
The different spectral line broadening mechanisms need to be understood in order to
correctly extract the electronic density Each of them has a particular influence on the
spectral line Some are represented by the Gaussian profile and others the Lorentzian one
This will be explained in more detail below followed by stating how the electron density
can be calculated
a Broadening Mechanisms
Natural line broadening
The natural line broadening is due to the finite time that an atom spends in its excited
state 119864119894 and results in a Lorentzian profile [32] If the mean time at 119864119894 is Δt then the
Heisenberg uncertainty principle states that
Δ119864119894 Δ119905119894 ge ℎ
2120587 (16)
The frequency 120584119894119895 (119904minus1) considered for a transition from 119864119894 to 119864119895 is
120584119894119895 =119864119894 minus 119864119895ℎ (17)
Considering the finite line width Δ120584119873119886119905119906119903119886119897 (119904minus1) the natural broadening can be
expressed as
Δ120584119873119886119905119906119903119886119897 = 1Δ119905119894
+ 1Δ119905119895
2120587 (18)
27
The value at the spectral range of 300 nm is of the order of 0000005 nm which means
that it will be neglected for atomic spectra from a laser induced plasma
Doppler broadening
The Doppler broadening [32] is the broadening of spectral lines due to the Doppler Effect
resulting from the thermal motions of atoms and molecules in the plasma (some moving
towards and others away from the detector) The higher the temperature or pressure
within the plasma the faster the particles move increasing the chances of collisions The
particles in motion are considered to have a Maxwellian velocity distribution resulting in
a Gaussian spectral broadening profile The FWHM of the profile depends only on the
frequency of the spectral line the mass of the emitting particles and their temperature as
can be stated in (110)
∆12058212
119863119900119901119901119897119890119903 = (716 times 10minus17) 120582 11987911987212 (19)
With 119879 emittersrsquo temperature (K) 119872 atomic weight (amu) 120582 wavelength (Aring)
For the spectral range frequently used in LIBS (UV to IR) Doppler broadening is not the
main line broadening mechanism If an extremely high plasma temperature is considered
(105 119870) the corresponding Doppler broadening for the visible range is only 001 nm
This is negligible compared to actual spectral line widths
28
Stark broadening
Collision-induced broadening sometimes called pressure broadening is a result of the
deformation of atoms or molecules when they bounce off each other For example they
may not be as symmetrical after a collision as they were before These deformations
perturb the quantum mechanical energy levels of the atom or molecule slightly shifting
the frequencies of the emission or absorption lines Just like Doppler broadening the
spectral lines are therefore broadened This effect depends on both the pressure and
temperature of the gas
Stark broadening is a particular case of pressure broadening where atoms interact with the
neighbouring charged particles such as ions and electrons According to quantum
mechanics the interaction will slightly modify the energy levels considered in the
transition inducing the spectral line to broaden The broadening is homogeneous and
corresponds to the Lorentzian profile It follows from the Lorentz Force Law that the
magnitude of the perturbing electric field (119865) created by fast moving electrons and
relatively slow ions (119890) at a certain distance (119903) is given by
119865 = 1
41205871205760 119890119903sup2
(110)
During the plasma expansion where the electron density of the plasma is quite high this
is the main broadening mechanism dominating the natural and Doppler mechanisms [8]
Instrumental broadening
Measured line profiles also experience influence from the instrument resolution It is
dependent on the slit width the grating dispersion and the detector Diffraction from a slit
gives us a cardinal sinusoidal pattern which can be approximated using a Gaussian
profile
29
b Electron Density
Finally with all these mechanisms taken into consideration the spectral lines can be fitted
with a Voigt profile the result of the convolution of Lorentz (Stark broadening) and
Gaussian (Instrumental broadening) Natural and Doppler broadening are considered as
negligible for atomic spectra of a laser-induced plasma [26]
119881(120582 (119899119898)) = 119866120582 Δ120582119863119900119901119901119897119890119903 Δ120582119868119899119904119905 otimes 119871(120582 Δ120582119878119905119886119903119896) (111)
Δ120582119866119886119906119904119904(119899119898) = Δ120582sup2119863119900119901119901119897119890119903 + Δ120582sup2119868119899119904119905 (112)
Linear Stark Effect
The line width and the electronic density of the plasma are closely linked with each other
There exists a direct relationship between Stark broadening and the electronic density
especially at short delays where the plasma is quite dense [32] For hydrogen this
relationship is linear because of its linear dependence with the Lorentz force which
results in a symmetrical broadening The electron density can be calculated using the
following equation [32]
119873119890(119888119898minus3) = 802 times 1012 Δ120582s
12057212(119873119890119879)32
(113)
With Δ120582s FWHM of the line (Aring) 12057212 half width of the reduced Stark profile(Aring)
The parameter 12057212 depends slightly on the excitation temperature 119879119890119909119888 and the electron
density 119873119890 Values of this parameter can be found in ref [32] with precision in the range of
10
Quadratic Stark Effect
For other non-hydrogen-like atoms stark broadening is proportional to Fsup2 and is thus
called the quadratic Stark effect Their density can be calculated using the following
equation
30
119873119890(119888119898minus3) = 119873119903119890119891Δ1205821198781199051198861199031198962120596119903119890119891
(114)
With 119873119903119890119891 reference 119873119890 (~ 1016 minus 1017 119888119898minus3) ωref impact parameter at this reference density
Hydrogen Balmer 119919120630 Emission
Even though both linear and quadratic Stark effects are observed in the LIBS spectra
more focus is taken on extracting information from hydrogen or hydrogen-like atoms
Their linear dependence allows more accuracy and ease when calculating the half width
of line profiles providing more reliable results [8 26] The hydrogen Balmer line 119867120572 (656
nm) emission line width in function of the detection delays is often used to study the
temporal evolution of the electron density in the plasma during its expansion and decay
[33]
In organic materials the presence of hydrogen in the matrix allows for a well isolated
and significantly intense peak In addition this line is strongly affected by the linear Stark
effect [32] Its use for electron density determination has been extensively reported for the
diagnostics of laser ablation plasma [34 35] The surrounding electrons are mainly taken
into consideration rather than the ions which have a much weaker impact on the total line
broadening [36] Even though hydrogen is part of the polymer matrix 119867120572the auto-
absorption can be neglected as long as the electronic density is less than 1018 119888119898minus3 [35]
Figure 7 shows 119867120572 spectral line fitted with Voigt profiles for a potato Measurement were
taken at different delays (100 300 600 and 1000 ns) after laser impact to put forth its
evolution with time A narrowing of the line along with a shift towards smaller
wavelengths can be seen
31
Figure 7 Stark Broadening The 119815120514 fitted with Voigt profiles for a potato sample Different laser impact delays were taken (100 300 600 and 1000 ns after laser impact) [37]
322 Temperature Calculation
For temperature calculations the differences between the line intensities are taken into
account rather than the broadening There are different methods Boltzmann (one element
one species (neutral or ions)) plot Saha-Boltzmann plot (one element different species
(neutral and ions)) ionic temperature (one element in its neutral and ionic state) and
molecular temperature (vibrational) To estimate the temperatures it must be assumed
that the plasma is in LTE
a Boltzmann method (Excitation temperature)
There is a correlation between the transition emission (observed by a spectral line in the
spectrum) and the Boltzmann equation At 0 K all the atoms are in their fundamental
electronic configuration In addition at this temperature they are considered to be
motionless with absolutely no kinetic energy As the temperature increases they begin to
move and gain more energy to access different excited configurations as can be seen in
Figure 8 The distribution of this population follows the exponential nature of the
Boltzmann law
645 650 655 660 665 67000
02
04
06
08
10
Ca (6
439
1 nm
)
Ca (6
462
6 nm
)
Ca (6
493
8 nm
) 100 ns 300 ns 600 ns 1000 ns
Norm
aliz
ed In
tens
ity (a
u)
Wavelength (nm)
Hα (65627 nm)
32
Figure 8 Boltzmann electron population distribution at different energy levels
At a sufficiently high temperature collisions between electrons and atoms can become
efficient to excite atoms The population distribution among the different energy levels
obeys the exponential law present in the Maxwell-Boltzmann distribution [34]
119873119894119885 = 119873119885 119892119894119890
minus119864119894119885
119896119861119879
119880119885(119879) (115)
With 119873119894119885 number of particles in state i (119888119898minus3) 119864119894119885 energy of the i-th state (eV) gi degeneracy of energy level i T absolute temperature(K) N total number of particles (119888119898minus3) Z Z=0 (neutral) and Z=1 (singly-charged ions)
The denominator 119880119885(119879) is known as the partition function and can be calculated by
equation (122) Due to the difficulties associated with these calculations we only state
the equation required but we do not calculate it ourselves
119880119885(119879) = 119892119894119894
119890minus119864119894
119885
119896119861119879
(116)
With 119880119885(119879) partition funtion
T = 0 K Warm Hot
j
i
hνijAij
Ei gi
Ej gj
En (eV)
33
The excited atoms return to their lower energy configurations by emitting photons
Spectral lines corresponding to the transitions between these different levels can be
observed in emission spectra Each photon has a specific wavelength that is unique for
every transition enabling us to detect the elements present The line intensity can be
calculated by the following formula
119868119894119895119885 = 1
4120587 ℎ120584 119873119894119885 119860119894119895 = 1
4120587ℎ119888120582119894119895
119873119894119885119860119894119895 (117)
With 119868119894119895119885 line intensity 120582119894119895 wavelength of the transition (119899119898) 119860119894119895 transition probability
If the Boltzmann equation is used in the equation (126) the intensity can be written as
119868119894119895119885 = 1
4120587 ℎ119888120582119894119895
119873119885 119892119894 119860119894119895119880119885(119879) 119890119909119901 minus
119864119894119885
119896119861119879 rArr
119868119894119895119885 120582119894119895119892119894 119860119894119895
= 1
4120587 ℎ119888119873119885 119880119885(119879) 119890119909119901 minus
119864119894119885
119896119861119879 (118)
In a more simplified version the linearization of the spectral intensity line represents the
wavelength intensity with regards to the different energy transitions for the same species
(neutral or ionic)
119897119899 119868119894119895119885 120582119894119895119892119894 119860119894119895
= minus1119896119861119879
119864119894119885 + 119897119899 1
4120587ℎ119888119873119885
119880119885(119879) (119)
If the upper excited energy levels of a given species are known along with the statistical
weights transition probabilities and wavelength for some transitions then the excited
temperature can be deduced by measuring the emission radiances [38] The use of
transitions between largely separated levels leads to more precise results because the line
fit becomes more reliable This method is known as the Boltzmann plot (BP) method
[26] Assuming the LTE is established within the plasma the population in different
levels is governed by the Boltzmann distribution
The value of Aji is only known with a precsion in the range of 10 - 30 depending on the
transitions used Some authors believe that in practice the linearity of the plot is an
34
indication for the satisfaction of LTE [39 40] while others think that a straight line can
also be obtained even when the level population is out of LTE [41] Both agree that the
excitation temperature of a species within a plasma in LTE is inversely proportional to
the slope of the Boltzmann plot minus 1119896119879119890119909119888
shown in equation (129) The measurement of
the line intensities is therefore a crucial factor to obtain the optimal temperature
calculations using the BP method For this an intensity calibration of the detection
system must be performed especially when the selected lines extend over a large spectral
range It goes without saying that self-absorbed or self-reversed lines will lead to
inconsistent temperatures
For more reliable results the spectral lines should be well isolated without interference
from other transitions These conditions can be satisfied for transition metals such as iron
or titanium or alkaline earth metals such as calcium for which a large number of
transitions are available in the visible spectral range The elemental metallic trace lines
present in the polymer spectra are the result of contaminations that come from fillers and
additives added to enhance physical properties Their presence facilitates the temperature
calculations especially titanium because the organic elements (C H O and N) do not
have enough lines for such measurements
b Saha-Boltzmann Plot Method
The Boltzmann plot method has the convenience of being relatively simple but it is not
very accurate The energy gap between the upper levels of the two lines is usually small
for the same ionisation degree [42] One way to make it more precise is to significantly
extend the range of 119864119894 This can be done by using both ionic (II) and atomic (I) elements
on the same plot by combining the Boltzmann distribution with the following Saha
equation
119873119890119873119911
119873119911minus1 =2119880119885(119879)119880119885minus1(119879)
2120587119898119890119896119861119879
ℎsup232
exp minus 119864infin119885minus1 minus ∆119864infin119885minus1
119896119861119879 (120)
With 120549119864infin119885minus1 correction of the ionization energy 119864infin119885minus1 119864infin119885minus1 ionisation energy of the lower ionisation stage
35
This method named the Saha-Boltzmann plot method allows a significant extension of
the range of Ei distributing the data from the spectra over a larger range of energy
allowing for a more accurate linear plot
The following calculations are considered for a plasma in LTE therefore we can consider
that the excitation temperature 119879119890119909119888 and the ionisation temperature 119879119894119900119899 are equal The
Boltzmann and Saha equation are then defined by a single temperature value The result
is an equation similar to that of the BP method but with a few corrections
119897119899 119868119894119895119885 120582119894119895119892119894 119860119894119895
lowast
= minus1119896119861119879
119864119894119885lowast + 119897119899
14120587
ℎ1198881198730
1198800(119879) (121)
With 1198730 number of neutral atoms (Z=0) 1198800(119879) partition function for neutral atoms (Z=0) ions and electron values included
The equation is valid for atoms that are both neutral and ionised but in order to plot them
on a same graph there must be some adjustments (designated by ) made to the abscise
(119864119894119885) and the ordinate ( 119897119899 119868119894119895119885 120582119894119895119892119894 119860119894119895
) values in equation (128) There is a likelihood law to
find atoms ionised more than once in a LIBS spectra It is important to note that for
ionised marked species (119885 ge 1) the quantities with the superscript must be replaced by
the following expressions
For the abscise values
119864119894119885lowast = 119864119894119885 + 119864119894119900119899 (122)
With 119864119894119900119899 ionisation energy
For the ordinates
119897119899 119868119894119895119885 120582119894119895119892119894 119860119894119895
lowast
= 119897119899 119868119894119895119885 120582119894119895119892119894 119860119894119895
minus 119911119897119899 2(2120587119898119890119896119861)32
ℎ311987932
119873119890 (123)
119864119894119900119899119864119894119885Obviously for 119885 = 0 (neutral atoms) the Saha-Boltzmann equation becomes
identical to the Boltzmann equation since the last term becomes equal to 0 For ionised
species this term depends on the temperature 119879 therefore an iterative procedure needs
to be used to determine the temperature and plug it into the equation In practice only a
few iterations are needed to converge
36
c Ionic Temperature
The ionic temperature also uses the combination of the Saha and the Boltzmann equation
previously mentioned In this case the temperature can be found for an ionised species of
a given element The use of LTE conditions which states that the ionic and excitation
temperatures are equal along with the transition information of two different ionisation
degrees (119911 = 0 and 119911 = 1) gives the following intensity ratio between ions and neutral
atoms [42 43]
119868119894119900119899119868119886119905119900119898
= 483 times 1015
119873119890 119892119894 119860119894119895
120582119894119895119894119900119899
120582119894119895119892119894 119860119894119895
119886119905119900119898
11987932119894119900119899 119890119909119901minus119864119894119900119899119885 minus 119864119886119905119900119898119885
119896119861119879119894119900119899 (124)
With 119864119894119900119899119885 energy of the upper level of transition for ions 119864119886119905119900119898119885 energy of the upper level of transition for atoms
With a known ionisation energy 119864119894119900119899 and electronic density 119873119890 (measured by Stark
broadening described previously) along with the spectroscopic parameters of both these
transitions the ionic temperature can be calculated
d Molecular Temperature
The plasma is expected to have both ionic and atomic spectra but of polymers (detailed
in Chapter 2) molecular emission is also expected Mostly we see spectral lines emitted
by CN and C2 which can be used to calculate the molecular temperature The theoretical
considerations in Figure 4 show that molecules are created after the atoms and ions ie
their spectral emission should be observed after the ionic and atomic ones as shown by
our experimental results in Chapter 3
The vibrational temperature is determined with CN molecular band head emission present
in organic materials The vibrational temperature is extracted using the method described
in ref [42] Diatomic molecules possess many vibrational levels where molecules in the
upper vibrational state νprimecan decay into lower electronic states νprimeprime They put forth the
correlation between the sum of the band strengths and with the number of molecules in
each respective state as can be seen in Equations (132) and (133)
37
119868(120584prime 120584primeprime)
1205844 120584primeprime
prop 119873120584prime (125)
119868(120584prime 120584primeprime)
1205844 120584prime
prop 119873120584primeprime (126)
With 120584prime vibrational upper electronic state (119888119898minus1) 120584primeprime vibrational lower electronic state (119888119898minus1) 120584 frequency (119888119898minus1) 119873120584prime numbers of molecules present in 120584prime (119888119898minus3) 119873120584primeprime numbers of molecules present in 120584primeprime (119888119898minus3)
If we consider that the LIBS plasma is in local thermodynamic equilibrium it can be
possible to calculate the number densities of an excited molecule by using Equation
(134)
120584119894119895 = 119864119894 minus 119864119895ℎ
1198971198991205824 119868120584prime120584primeprime120584
= 1198621 minus 119866( 120584prime ) ℎ119888
119896119861119879119907119894119887 (127)
With 120582 wavelength of each transition 120584rsquo 119886119899119889 120584rdquo (nm) 119866( 120584prime ) vibrational term value to 120584prime 1198621 constant 119879119907119894119887 vibrational temperature (K) 119868120584prime120584primeprime measured intensity
By plotting lnsum λ4 Iνprimeνprimeprimeνprimeprime with regards to G(νrsquo) the slope provides the determination of
the vibrational temperature The results have been further confirmed by using the
temperature calculation by the spectrum simulation with the LIFBASE software [37] for
temperature ranging from 5000 to 20000 K The comparison showed good agreements
with a typical accuracy of 5-10
4 LOCAL THERMODYNAMIC EQUILIBRIUM The first optical thinness has already been discussed According to the talk presented by
Omenetto at EMSLIBS [45] there are two essential criteria that need to be filled in order
to consider the LTE The criteria are an electronic density minimal requirement
(McWhirter criterion) and the definition of a unique plasma temperature for all species in
the plasma
38
41 ELECTRON DENSITY CRITERION For the population of excited states for the elements in the plasma to be predominately
caused by collisions with electrons and not by radiative processes it requires a minimal
electron density to ensure these collisions The radiative processes explained before such
as photon absorption recombination radiation and spontaneous emission are in this case
negligible This minimal electron density is known as the McWhirter criterion and is
defined as [50]
119899119890 ge 16 times 1012 11987912 (∆119864)3 (128)
With ∆119864 (119890119881) largest gap between 2 adjacent energy levels T (K) plasma temperature
This condition is deduced for hydrogen and hydrogen-like atoms in an optically thin
stationary and homogenous plasma [45] The largest gap for hydrogen is indeed between
the ground state and the first excited energy state and corresponds to 4 eV This is not
always the case for other elements Figure 9 shows that the largest energy gap for oxygen
does not include the ground state In this case the largest gap must be used
Figure 9 Oxygen energy levels [45]
1
2
3
kj ih
E max g max
E min g min
GROUND STATE
ΔE 12 ~ 33 eVΔE 13 ~ 5 eV
ΔE max ~ 10 eV
39
Considering a plasma at 7000 K the required electronic density comes out to
119873119890 = 86 times 1015119888119898minus3 (129)
This is the necessary but not sufficient requirement for the LTE that is typically fulfilled
during the first stages of the plasma lifetime Due to the large 120549119864 often associated with
the lower lying energy states this condition can be difficult to satisfy A solution would
be to use higher excitation levels were ΔE are close enough to allow the equation to hold
the plasma would be in partial LTE
42 TEMPERATURE CRITERION
As explained previously the plasma consists of different particles (atoms ions
molecules hellip) in excited or fundamental states In addition different energy processes
take place within the plasma and can each be characterised by their own temperature
Therefore there is not clear definition of the plasma temperature unless the different
temperatures converge and one can describe the entire plasma with one and unique
temperature Otherwise the notion of plasma temperature would be confusing as it would
not be clear as to lsquowhatrsquo temperature was in question Four different temperatures can be
used to characterise the plasma and are listed below
Kinetic energy (Maxwell-Boltzmann distribution law) electron temperature
This energy is associated the motion of the electrons In the case of plasma it defines the
energy of the electrons that obey the Maxwell distribution law ie the Maxwellian
velocity distribution The interactions involving electrons and other particles are not taken
into consideration here just their free motion between subsequent collisions The
Maxwell-Boltzmann distribution law is characterized by the electron temperature
Internal energy (Boltzmann law) excitation temperature
Elements (atoms ions or molecules) in the plasma have the ability to access higher
energy configurations as the temperature increases The population amongst these excited
configurations obey the Boltzmann law characterised by the excitation temperature
40
Ionisation energy (Saha law) ionic temperature
Saharsquos law is used to describe the population distribution among successive ionisation
degrees within the plasma ie the distribution of the same element in different ionisation
stages In a typical LIBS spectrum and mainly for what concerns us this is limited to
species ionised only once
Radiation energy (Plankrsquos law) radiation temperature
Plankrsquos law describes the spectral radiance distribution from electromagnetic radiation
emitted from a black body ie optically thick plasma
Each one of these processes can attain their own individual equilibrium without being in
equilibrium with the rest However for complete thermal equilibrium (CTE) all the
temperatures must be simultaneously equal defining one and unique plasma temperature
119879119890minus equiv 119879119890119909119888 equiv 119879119894119900119899 equiv 119879119903119886119889 (130)
Complete LTE
For the LIBS plasma the complete thermodynamic equilibrium cannot be attained
because one expects an optically thin plasma As stated the Plank law requires the plasma
to be optically thick at all frequencies [24] Optically thick plasma means the line
intensities are distorted and misleading due to re-absorption of emitted photons within the
plasma The radiative life of the emitting particles and the duration of the laser pulse are
much smaller than the duration of the radiative life of the plasma So the emission is not
due to the photo-excitation mechanism but rather the thermal electron impact excitation
In a typical LIBS plasma in the typical time frame emission from electron collisions are
said to be the rate determining mechanisms dominating the radiative emission These
reasons explain why the radiation temperature is often decoupled from the others
allowing the opportunity to find a temperature that satisfies Maxwell Boltzmann and
Saha laws In this case we cannot talk about CTE but instead we talk about LTE
41
When considering a plasma in LTE 119879119890minus equiv 119879119890119909119888 equiv 119879119894119900119899 meaning the temperature that
depicts the population of atomic and ionic energy levels is the same for the atoms of the
same element in different ionisation stages Light emission collection depends on the
angle aperture of the collection apparatus Even if a plasma is in LTE it takes into
consideration only the mean values of T and Ne but not the spatial decoupling where the
plasma has different temperatures at different spatial positions Panne et al [46] noticed
that the geometrical observation in LIBS setup generated different temperatures and
electronic densities The influence of the collection system must be taken into
consideration when comparing spectral data obtained by different methods
The use of BP method to evaluate the LTE leads to erroneous results [47] due to the lack
of sufficient spectral lines used The ionisation temperature obtained by the Saha law
provides a better estimate for the real plasma properties [48] Milan et al [49] found
through spatially resolved measurements of ablation of a silicon sample that the cooler
regions near the exterior of the plasma affected the excitation temperature more than the
ionic temperature Hence since most temperature evaluations are based on a space
averaging technique the ionisation temperature seems to provide more accurate results
They concluded that 119879119890119909119888 = 119879119894119900119899 on silicon sample after 2 micros Others have taken another
step forward by calculating the vibrational temperature when molecular spectra are
detected Hermann et al [51] deduced that the electronic temperature converged with the
vibrational temperature associated to graphite samples only after 1 micros At this point there
was a thermalisation between the electrons and heavier particles Rusak and al [52] added
the temperature associated with the rotational energy of molecular bands only to notice no
LTE during the first micros of the plasma for power densities lower than 1 (119866119882) frasl 119888119898sup2
They did deduce the equilibrium between the excitation and vibration temperature
however
Whilst some authors like Capitelli et al [4] doubt that there can be a true existence of LTE
in laser induced plasma due to the high imprecision of the partition function values
Simeonsson and al [48] estimated that kinetic equilibrium between electrons and heavier
ions and neutrals was reached only 10 ns after the laser pulse impact while the excited
states needed 50 ns to reach a Boltzmann-like distribution for H C O and Cl Amoruso
and al [6 7] support this hypothesis stating that the electrons could effectively transfer
42
their absorbed energy on to other ions during the laser pulse The time needed for the
transfer is between 10minus10 minus 10minus11 119904 according to [53] much shorter than most laser
pulse durations They conclude that the electron temperature can be assumed to be nearly
the same as the ion temperatures
Finally the state of LTE can be considered as a good approximation for the plasma used
for LIBS measurements generally true for delays greater than 1 micros and over an interval in
the order of 1 micros For polymers the signal intensity is less intense and does not last as
long as that of metals By choosing an inadequate acquisition delay the McWhirter
criterion might be violated as there might not be enough electrons due to the weak
emission signal This hypothesis needs to be backed by proper plasma modelling or time
and spatial resolved plasma detection as it depends very strongly on the properties that
influence the plasma formation ie laser pulse energy pulse duration ambient gas
acquisition gate time etc These parameters need to be accurately detailed to ensure the
reproducibility of the experimental results
43 INTRODUCTION TO CF-LIBS LIBS has the ability to detect the elements present in a sample sometimes at a ppm level
with little or no sample preparation required Other techniques such as ICP-MS have this
ability as well but need time for sample preparation often required to be dissolved into a
liquid state Their main advantage over the LIBS technique is their precision at
quantifying the element concentrations The task of rendering LIBS capable of somewhat
similar quantitative measurements is undergoing
Quantitative analysis can be done in several ways [54] One method to determine the
concentration of each element independently is through the emission lines of accurately
known transition probabilities followed by absolute measurements of the integrated
intensities Another way would be to compare the elemental emission lines relative to the
most abundant element in the sample This method only requires the ratios of the
transition probability of the emission lines Of course as with all information attained
43
from the spectra a greater number of lines provide better results Therefore to increase
the accuracy of these methods a well calibrated broad band spectrum is required
An approach widely used compares the spectra intensity lines with known calibration
standards ie calibration curves As long as the properties of the sample being analysed
and the standard sample matrices are similar this method can be very practical The result
of the matrix effect can be observed when comparing two known identical concentrations
of an element It would be expected to see identical emission intensities but this can be
distorted due to the matrix effect The sensitivity of the measurements are sensitively
dependant on the laser-matter interaction this includes the matrix effects
The use of calibration curves when possible provides promising results when dealing with
homogenous samples ie constant matrix effect [54] However as the sample gets more
complicated for example organic samples the calibration curves are not always easy to
create The notion of a reference sample where all the element concentrations are already
known for polymers can be accepted A problem arises when dealing with more
complicated samples such as vegetables or soil How can one create a reference sample
for an inhomogeneous sample or a sample with unknown matrix Add to this the
complications of varying matrix effects associated to the local in homogeneity of such
samples In this case the reproducibility of LIBS is therefore reduced and the errors
associated with the measurement increase drastically Construction of a calibration curve
is highly complicated and nearly impossible
The notion of Calibration-Free LIBS (CF-LIBS) was proposed by Ciucci et al [55] Such
procedure can in the ideal case provide solution for inhomogeneous sample or those with
unknown matrix The idea behind this method was to go around these matrix effects by
making each measurement self consistent ie avoid the need to compare it with
calibration curves For this method works these are three requirements for the ablation
and the resulted plasma [54]
Stoichiometric ablation
Plasma must be in LTE
Optically thin plasma
44
The last two requirements have already been discussed previously Stoichiometric
ablation means that the composition of the ablated mass is representative of that of the
sample This is the basis of LIBS and other laser ablation techniques in general This
allows to characterize the sample analyzed using the light emitted from the plasma Russo
and al mentioned in their paper in 1991 [56] that stoichiometric ablation existed for laser
power densities greater than 109 119882119888119898sup2 a condition generally satisfied for nanosecond
or shorter duration pulse ablation Borisov and al [57] stated that the degree of
stoichiometric ablation was reduced when the crater depth increased He put forth two
hypotheses for this statement The first imagined that the geometric factors reduced the
power density and the second consisted of shielding and thermal variations within the
crater
Elemental fractionation of the sample was observed with longer laser pulses [2]
Femtosecond ablation reduced this problem and showed an increase in the ablation
efficiency Russo et al 2002 [58] performed nanosecond and femtosecond ablation on
glass samples and did not come to the same conclusion They believed that the pulse
duration alone was not enough to account for fractionation The generated plasma and the
shockwave induced with the plasma could influence it as well The mass removal depends
on the heat conduction of the laser pulse within the sample as well as the recoil pressure
which is a consequence of the shockwaves Shockwaves present in femtosecond laser
ablation are due to the high velocity of the ejected mass
For the CF-LIBS calculations the use of the Boltzmann plot method was first used
(includes the total plasma number density and volume and the experimental geometry)
[54]
119868120484120485 = 119865 119862119904 119860119894119895 119892119894 119890119909119901 minus
119864119894119896119861119879
119880119904(119879) (131)
With 119868120484120485 measured integral line intensity (counts) CS concentration of the emitting species S US(T) partition function of the emitting species F optical efficiency of the collection system
45
Equation (132) requires information either protruding from spectral databases or directly
from the experimental category
Aij gi Eij US (T) rarr spectral database
F CS T rarr experimental data
If 119910 119909119898 119886119899119889 119902119904 are introduced as the following
119910 = 119897119899 119868119894119895
119892119894 119860119894119895 (132)
119909 = 119864119894 (133)
119898 = minus1119896119861119879
(134)
119902119878 = ln 119862119878 119865119880119904(119879) (135)
The Boltzmann equation can be written simply in the form
119910 = 119898119909 + 119902119878 (136)
Where 119898 is associated with the temperature of the plasma and 119902119878 is associated with the
concentration of the emitting species 119878 One spectral line emission produces one point on
the Boltzmann plot diagram This way all the emitting species can be represented in one
diagram If the condition of LTE is fulfilled and the lines are carefully selected to avoid
self-absorption each emitting species should align on parallel lines The same
temperature means the same slope 119898 for all elements These calculations require that the
spectral data contain
At least 2 emission lines from the same species to determine the electronic
temperature
At least 1 emission line with known spectroscopic parameters to calculate the
electronic density
46
The y-intercept given by 119902119878 of each line is proportional to the natural logarithm of its
concentration Once the electronic temperature is calculated the concentration of species
of the corresponding element which sums up the concentrations of both the neutral and
single ionised atoms can be determined The F parameter creates a bit of a problem but is
solved by using the normalisation relation if an internal standard is not known
119862119890 = 1119890
(137)
where the sum of the total element concentration should be 1 Even if in theory this
method can provide very accurate results the LIBS measurements with CF-LIBS are only
at best 3-5 experimentally reproducible [59] and the errors associated with the
probability transitions can go from 10-30 [54] If more spectral lines were used this
could average out the uncertainties linked with the probability transitions and provide
more accurate line plots
Initially CF-LIBS introduced by Ciucci [54] excluded self-absorbed lines However it is
possible to include these lines by using a recursive method This means the use of more
points (more spectral lines) for even more accurate information This method predicts the
intensity of the self-absorbed line The scattering around the best fit line can be reduced
putting forth evidence that it is mainly due to self-absorption effects and not experimental
errors fitting errors or even uncertainties related to transition probabilities
47
5 CONCLUSION
The emission line intensities depend on the plasma properties that are influenced by the
ablation laser pulse (wavelength pulse duration pulse energy) the sample (matrix
effects inhomogeneities) and the ambient gas (vacuum inert air and the pressure) It can
also be related back to the concentration of the elements present within the plasma A
detailed understanding of the laser-induced plasma is the basis of high quality quantitative
measurements with LIBS A thorough knowledge on evaporation ejection of particles
hydrodynamic explosion shock waves plasma initiation and expansion not to forget the
laser-plasma interaction is needed All these parameters can influence the amount and the
composition of the ablated mass
In the following chapters of this thesis we will present the study of such parameters for
the ablation of different polymer samples First we study the plasma formation and
expansion by shadowgraphic measurements under different ablation regimes This is
followed by time-resolved analysis of the spectroscopic plasma emission for the
optimisation of experimental acquisition parameters (local thermodynamic equilibrium
signal-to-noise ratio acquisition gate width etc) We are interested in CF-LIBS because it
is the only method that allows a direct analysis without the use of calibration curves
Before applying this method however certain notions and understanding of the physics
behind the induced plasma especially for organic substances is needed Therefore the
last chapter has for aim to classify and identify various polymers through different
multivariate analysis techniques It emphasises that the work in this thesis is more
qualitative than quantitative The aim behind this reasoning is to be able find an
application for the industrial sorting of plastics with what we already know today In the
future we hope that the additional information presented here of plasmas induced on
polymers will allow us the ability to use calibration free methods to provide more precise
quantitative measurements
48
References
[1] M Baudelet Proprieacuteteacutes physico-chimique du plasma induit par laser en regime nanoseconde et femtoseconde PhD Thesis Universiteacute Claude Bernard-Lyon 1 2007
[2] RE Russo XL Mao JH Yoo and JJ Gonzalez Laser Ablation Laser InducedBreakdown Spectroscopy Elsevier Science Amsterdam Netherlands 2007
[3] A Bogaerts Z Chen R Gijbels A Vertes Laser ablation of copper in different background gases comparative study by numerical modelling and experiments Journal of Analytical Atomic Spectrometry 21 384ndash395 2006
[4] M Capitelli A Casavola G Colonna A De Giacomo Laser-induced plasma expansion theoretical and experimental aspects Spectrochimica Acta Part B 59(2004) 271ndash289
[5] BN Chichkov C Momma S Nolte F yon Alvensleben A Tiinnermann Femtosecond picosecond and nanosecond laser ablation of solids Applied Physics A63 109 (1996)
[6] S Amoruso Modeling of UV pulsed-laser ablation of metallic targets Applied Physics A 69 323ndash332 1999
[7] S Amoruso R Bruzzese N Spinelli and R Velotta Characterization of laser ablation plasmas Journal of physics B 32 R131ndashR172 1999
[8] VN Rai SN Thakur Physics of Plasma in Laser-Induced Breakdown Spectroscopy Laser Induced Breakdown Spectroscopy Elsevier Science Amsterdam Netherlands 2007
[9] S Siano Principles of Laser Cleaning in Conservation Handbook on the Use of Lasers in Conservation and Conservation Science 2007
[10] DA Cremers and LJ Radziemski Handbook of Laser-Induced Breakdown Spectroscopy 2006
[11] B J Garrison and R Srinivasan Laser ablation of organic polymers microscopic models for photochemical and thermal processes Journal of Applied Physics 57 2909 (1985)
[12] H Schmidt J Ihlemann B Wolff-Rottke K Luther and J Troe Ultraviolet laser ablation of polymers spot size pulse duration and plume attenuation effects explained J Appl Phys 83 5458 (1998)
[13] T Lippert M Hauer CR Phipps Fundamentals and applications of polymers designed for laser ablation Appl Phys A 77 259ndash264 (2003)
[14] R Srinivasan B Braren RW Dreyfus L Hadel and DE Seeger Mechanism of the ultraviolet laser ablation of polymethylmethacrylate at 193 and 248 nm
49
laser-induced fluorescence analysis chemical analysis and doping studies Journal of the Optical Society of America B 3785ndash791 1986
[15] M Hashida H Mishima S Tokita and S Sakabe Non-thermal ablation of expanded polytetrafluoroethylene with an intense femtosecond-pulse laser Optics Express Vol17 Issue 15 pp 13116-13121 2009
[16] QWang P Jander C Fricke-Begemann R Noll Comparison of 1064 nm and 266 nm excitation of laser-induced plasmas for several types of plastics and one explosive Spectrochimica Acta Part B 63 1011ndash1015 (2008)
[17] R Srinivasan B Braren KG Casey and M Yeh Ultrafast imaging of ultraviolet laser ablation and etching of polymethylmethacrylate Applied Physics Letters 55 (26)2790ndash2791 1989
[18] A Semerok C Chaleacuteard V Detalle J-L Lacour P Mauchien P Meynadier C Nouvellon B Salleacute P Palianov M Perdrix and G Petite Experimental investigations of laser ablation efficiency of pure metals with femto pico and nanosecond pulses Applied Surface Science 138ndash139311ndash 314 1999
[19] YG Yingling B J Garrison Photochemical ablation of organic solids NuclearInstruments and Methods in Physics Research B 202 188ndash194 (2003)
[20] Sci-Tech Encyclopaedia McGraw-Hill Encyclopaedia of Science and Technology 5thedition The McGraw-Hill Companies Inc
[21] SS Mao F Queacutereacute S Guizard X Mao RE Russo G Petite and P Martin Dynamics of femtosecond laser interactions with dielectrics Appl Phys A 79 1695ndash1709 2004
[22] JM Vadillo and J J Laserna Laser-induced plasma spectrometry truly asurface analytical tool Spectrochimica Acta Part B 59147ndash161 2003
[23] M Corsi G Cristoforetti M Hidalgo D Iriarte S Legnaioli V Palleschi A Salvetti and E Tognoni Temporal and spatial evolution of a laser induced plasma from a steel target Applied Spectroscopy Volume 57 Issue 6 Pages 187A-198A and 591-727 (2002) pp 715-721(7)
[24] AW Miziolek V Palleschi and I Schechter Laser Induced Breakdown Spectroscopy (LIBS) fundamentals and applications Cambridge University Press Cambridge UK (2006)
[25] RD Cowan and GH Dieke Self-Absorption of Spectrum Lines Reviews of Modern Physics Vol 20 Number 2 1948
[26] C Aragoacuten JA Aguilera Characterization of laser induced plasmas by optical emission spectroscopy A review of experiments and methods Spectrochimica Acta Part B 63 (2008) 893ndash916
[27] V Motto-Ros AS Koujelev GR Osinski AE Dudelzak Quantitative multi-elemental laser-induced breakdown spectroscopy using artificial neural networks Journal of the European Optical Society - Rapid Publications 3 08011 (2008)
50
[28] SS Harilal CV Bindhu MS Tillack F Najmabadi and AC Gaeris Internal structure and expansion dynamics of laser ablation plumes into ambient gases Journal of applied physics volume 93 number 5 2003
[29] V Margetic A Pakulev A Stockhaus M Bolshov K Niemax R Hergenroumlder A comparison of nanosecond and femtosecond laser-induced plasma spectroscopy of brass samples Spectrochimica Acta Part B 55_20001771]1785
[30] G Cristoforetti G Lorenzetti S Legnaioli V Palleschi Investigation on the role of air in the dynamical evolution and thermodynamic state of a laser-induced aluminium plasma by spatial- and time-resolved spectroscopy Spectrochimica Acta Part BArticle in Press 2010
[31] Q L Ma V Motto-Ros W Q Lei M Boueri X S Bai L J Zheng H P Zeng and J Yu Temporal and spatial dynamics of laser-induced aluminum plasma in argon background at atmospheric pressure interplay with the ambient gas Accepted Spectrochimica Acta Part B 2010
[32] HR Griem Spectral Line Broadening by Plasmas Academic Press New York and London 1974
[33] E Tognoni G Cristoforetti S Legnaioli V Palleschi A Salvetti M Mueller U Panne I Gornushkin A numerical study of expected accuracy and precision in Calibration-Free Laser-Induced Breakdown Spectroscopy in the assumption of ideal analytical plasma Spectrochimica Acta Part B 62 1287ndash1302 (2007)
[34] J Ashkenazy R Kipper and M Caner Spectroscopic measurements of electron density of capillary plasma based of Stark broadening of hydrogen lines V43 N10Physical Review A 1991
[35] AM El Sherbini H Hegazy ThM El Sherbini Measurement of electron density utilizing the Hα-line from laser produced plasma in air Spectrochimica Acta Part B 61(2006) 532ndash539
[36] NM Shaikh B Rashid S Hafeez Y Jamil and MA Baig Measurement of electron density and temperature of a laser-induced zinc plasma J Phys D Applied Physics 39 (2006) 1384ndash1391
[37] W Lei V Motto-Ros M Boueri Q Ma D Zhang L Zheng H Zeng J Yu Time resolved characterization of laser-induced plasma from fresh potatoes Spectrochimica Acta Part B 64 (2009) 891ndash898
[38] CA Bye and A Scheeline Saha-Boltzmann Statistics for Determination of Electron Temperature and Density in Spark Discharges Using an EchelleCCD System Applied Spectroscopy Volume 47 Number 12 1993
[39] J L Throne Plastic Process Engineering Man Dekker New York (1979)
[40] C Gauthier Deacuteveloppement de la technique de la double impulsion laser pour ameacuteliorer les performances analytiques de lrsquoablation laser coupleacutee agrave la
51
spectromeacutetrie drsquoeacutemission optique (ALSEO) sur solides Applications nucleacuteaires Universiteacute Henri Poincareacute ndash Nancy I 2005
[41] B C Castle K Visser B W Smith and J D Winefordner Level populations in a laser-induced plasma on a lead target Spectrochimica Acta Part B 52 1995ndash2009 1997
[42] SS Harilal Riju C Issac CV Bindhu Pramod Gopinath VPN Nampoori CPG Vallabhan Time resolved study of CN band emission from plasma generated by laser irradiation of graphite Spectrochimica Acta Part A 53 (1997) 1527-1536
[43] O Bartheacutelemy J Margot M Chaker M Sabsabi F Vidal T W Johnston S Laville and B Le Drogoff Influence of the laser parameters on the space and time characteristics of an aluminum laser-induced plasma Spectrochimica Acta Part B 60905ndash914 2005
[44] O Bartheacutelemy J Margot S Laville F Vidal M Chaker B Le Drogoff TW Johnston and M Sabsabi Investigation of the state of local thermodynamic equilibrium of a laser-produced aluminum plasma Applied Spectroscopy 59 (2005) pp 529ndash536
[45] N Omenetto EMSLIBS TALK Rome 2009
[46] U Panne C Haisch M Clara R Niessner Analysis of glass and glass melts during the vitrification process of fly and bottom ashes by laser-induced plasma spectroscopy Part I Normalization and plasma diagnostics Spectrochimica Acta Part B 53 (1998) 1957ndash1968
[47] MC Quintero A Rodero MC Garcia and A Sola Determination of the Excitation Temperature in a Nonthermodynamic-Equilibrium High-Pressure Helium Microwave Plasma Torch Applied Spectroscopy 51 202A-205A and 765-911 (1997)
[48] JB Simeonsson and AW Miziolek Time-resolved emission studies of ArF-laser produced micro-plasmas Vol 32 No 6 APPLIED OPTICS 1993
[49] M Milaacuten and JJ Laserna Diagnostics of silicon plasmas produced by visible nanosecond laser ablation Spectrochimica Acta Part B 56 (2001) pp 275ndash288
[50] G Cristoforetti A De Giacomo M DellAglio S Legnaioli E Tognoni V Palleschi and N Omenetto Local Thermodynamic Equilibrium in Laser-Induced Breakdown Spectroscopy Beyond the McWhirter criterion Spectrochimica Acta Part B 65(2010) 86-95
[51] J Hermann C Boulmer-Leborgne B Dubreuil and IN Mihailescu Influence of irradiation conditions on plasma evolution in laserndashsurface interaction J Appl Phys 74 (1993) pp 3071ndash3079
52
[52] DA Rusak BC Castle BW Smith JD Winefordner Recent trends and the future of laser induced plasma spectroscopy Trends in analytical chemistry vol 17 nos 8+9 1998
[53] JF Ready Effects of High-Power Laser Radiation (Academic New York 1971)
[54] E Tognoni V Palleschi M Corsi G Cristoforetti N Omenetto I Gornushkin B W Smith and J D Winefordner From sample to signal in laser-induced breakdown spectroscopy a complex route to quantitative analysis Laser Induced Breakdown Spectroscopy (LIBS) fundamentals and applications Cambridge University Press Cambridge UK (2006)
[55] A Ciucci M Corsi V Palleschi S Rastelli A Salvetti and E Tognoni New procedure for quantitative elemental analysis by laser-induced plasma spectroscopy Applied Spectroscopy 53 960 1999
[56] WT Chan and RE Russo Study of laserndashmaterial interactions using inductively coupled plasma-atomic emission spectrometry Spectrochimica Acta Part B 46 (1991) pp 1471ndash1486
[57] OV Borisov XL Mao and RE Russo Effects of crater development on fractionation and signal intensity during laser ablation inductively coupled plasma mass spectrometry Spectrochimica Acta Part B Atomic Spectroscopy Volume 55 Issue 11 2000 1693-1704
[58] RE Russo X Mao JJ Gonzalez and SS Mao Femtosecond laser ablation ICP-MS Journal of Analytical Atomic Spectrometry 17 1072ndash1075 2002
[59] DellrsquoAglio M De Giacomo A Gaudiuso R De Pascale O Senesi GS Longo S Laser induced breakdown spectroscopy applications to meteorites chemical analysis and composition profiles Geochimica et Cosmochimica Acta (2010) doi 101016jgca201009018
2
main reasons behind this comes from the difficulty of LIBS to provide accurate
quantitative measurements The high complexity associated to the laser-matter interaction
attracts efforts of some research groups to investigate the fundamental aspects of the
laser-induced plasma in order to find a convenient solution to significantly improve the
quantitative analysis performance of the LIBS technique Such efforts include the
understanding of different phenomenon involved in the plasma generation and its
evolution as well as the determination of the parameters such as the electronic density
and the temperature with time and space resolutions
In this thesis we are specifically interested in applying the LIBS technique to organic
materials namely polymers Compared to the laser ablation of metals the plasma induced
on polymeric materials is much less documented and therefore their properties are still
not well established The difference between the laser ablations of metallic and polymeric
materials is due to the differences in absorption and ionisation potentials of these two
types of materials In the case of polymeric materials containing metallic trace elements
the mixture of such different properties can complicate the understanding of the
phenomenon They exhibit discrepancies in their optical thermal and mechanical
properties which greatly influences the properties of the resulted plasma Another
complication is the chemical reactions within the plasma and those with the background
gas which changes the plasma stoichiometry during its expansion The purpose of our
study is to better understand the laser ablation of organic materials in order to reach a
better master of the application of LIBS to such materials
There is an actual need of improving the performance of LIBS for such materials In this
thesis more specifically our purpose is to demonstrate the potential of LIBS for the
identification and classification of plastic materials An application of this nature is
particularly important for industries that use automated sorting of plastic wastes
Our approach consisted first of a detailed study of the properties of the laser-induced
plasma on the surface of polymeric materials By studying these properties for a relatively
simple and homogenous polymer sample we are able to infer on the interaction between
the laser pulse and the sample paving the way to understanding such plasma We used
this knowledge to optimise the experimental configuration and spectral data acquisition
parameters in order to record the plasma emission in the best conditions The data
3
treatment strategy was then developed to get the most significant information for sample
classification and identification Once the ensemble of the experimental procedure was
optimised including spectrum acquisition and data treatment a range of plastic materials
with practical application interests was analysed The obtained results indicate the actual
performance of the method and the further development directions needed to meet the
needs of real industrial standards
The presentation of this thesis is structured in the following way The first chapter is
dedicated to recalling the theoretical basis of laser-induced plasma and that of its
diagnostics with the emission spectroscopy In chapter 2 the early stage expansion of the
plasma has been investigated using the technique of time-resolved shadowgraph This
study allowed us to justify our wavelength and laser choices for further analytical
application of laser ablation of polymeric materials Chapter 3 presents the time-resolved
spectroscopic measurements that allowed us to observe the evolution of the plasma as a
function of the time delay after laser impact on the sample surface The plasma
parameters such as the electron density and temperature are extracted for the assessment
of the local thermodynamic equilibrium (LTE) of the plasma They are also used to define
a suitable detection window with an optimal signal-to-noise ratio Chapter 4 represents an
important part of this thesis A classification and identification procedure was developed
for polymeric materials by combining LIBS and data treatment with the artificial neural
networks (ANN) Our results put forth the potential of the LIBS technique to provide fast
and reliable classification and identification of plastics The industry of plastics waste
sorting and recycling could use this technique to complement and improve the already
existing near infra-red spectroscopy technique for such applications After a general
conclusion we shall finish this manuscript by underlining the perspectives opened by the
results obtained during the course of this work
4
[1] TH Maiman Stimulated optical radiation in ruby Nature 187 (1960) 493-494
[2] LJ Radziemski From LASER to LIBS the path of technology development Spectrochim Acta Part B 57 (2002) 1109ndash1113
[3] F Brech L Cross Opticalmicroemission stimulated by a ruby laser Appl Spectrosc 16 (1962) 59
[4] J Debras-Gueacutedon N Liodec De lrsquoutilisation du faisceau drsquoun amplificateur agrave ondes lumineuses par eacutemission induite de rayonnement (laser agrave rubis) comme source eacutenergeacutetique pour lrsquoexcitation des spectres drsquoeacutemission des eacuteleacutements CR Acad Sci 257 (1963) 3336
[5] PD Maker RW Terhune CM Savage Optical third harmonic generation Proceedings of Third International Conference on Quantum Electronics Paris Columbia University Press New York Vol 2 (1964) 1559
[6] M Young M Hercher C-Y Yu Some characteristics of laser-induced air sparks J Appl Phys 37 (1966) 4938ndash4940
[7] David A Cremers Leon J Radziemski and Thomas R Loree Spectrochemical Analysis of Liquids Using the Laser Spark Applied Spectroscopy 38 (1984) 721-729
[8] J R Wachter D A Cremers Determination of Uranium in Solution Using Laser-Induced Breakdown Spectroscopy Applied Spectroscopy 41 (1987) 1042-1048
[9] H A Archontaki and S R Crouch Evaluation of an Isolated Droplet Sample Introduction System for Laser-Induced Breakdown Spectroscopy Applied Spectroscopy 42 (1988) 741-746
[10] A Felske W-D Hagenah K Laqua Uber einige Erfahrungen bei der Makrospektralanalyse mit Laserlichtquellen I Durchschnittanalyse metallischer Proben Spectrochim Acta Part B 27 (1972) 1
[11] LJ Radziemski TR Loree Laser-induced breakdown spectroscopy time-resolved applications J Plasma Chem Plasma Proc 1 (1981) 281ndash293
[12] DA Cremers LJ Radziemski Detection of chlorine and fluorine in air by laser-induced breakdown spectrometry Anal Chem 55 (1983) 1252ndash1256
[13] LJ Radziemski DA Cremers TR Loree Detection of beryllium by laser-induced breakdown spectroscopy Spectrochim Acta Part B 38 (1983) 349ndash355
[14] DA Cremers LJ Radziemski Direct detection of beryllium on filters using the laser spark Appl Spectrosc 39 (1985) 57ndash63
[15] R Wisbrun I Schechter R Niessner H Schroeder and K L Kompa Detector for trace elemental analysis of solid environmental samples by laser plasma spectroscopy Anal Chem 66 (1994) 2964-2975
[16] A Ciucci V Palleschi S Rastelli et al Trace pollutions analysis in a soil by a time-resolved laser-induced breakdown spectroscopy technique Appl Phys B ndash Las Opt 63 (1996) 185-190
[17] I B Gornushikin J I Kim B W Smith S A Baker and Winefordner Determination of cobalt in soil steel and graphite using excited-state laser fluorescence induced in a laser spark Appl Spectrosc 51 (1997) 1055-1059
5
[18] F Hilbk-Kortenbruck R Noll P Wintjens H Falk and C Becker Analysis of heavy metals in soils using laser-induced breakdown spectroscopy combined with laser-induced fluorescence Spectrochem Acta B 56 (2001) 933-945
[19] C Aragon JA Aguilera J Campos Determination of carbon content in molten steel using laser-induced breakdown spectroscopy Appl Spectrosc 47 (1993) 606ndash608
[20] JA Aguilera C Aragon J Campos Determination of carbon content in steel using laser-induced breakdown spectroscopy Appl Spectrosc 46 (1992) 1382ndash1387
[21] M Sabsabi P Cielo Quantitative analysis of aluminium alloys by laser-induced breakdown spectroscopy and plasma characterization Appl Spectrosc 49 (1995) 499ndash507
[22] R Sattmann I Moumlnch H Krause R Noll S Couris A Hatziapostolou A Mavromanolakis C Fotakis E Larrauri and R Miguel Laser-induced breakdown spectroscopy for polymer identification Appl Spectroscopy 52 (1998) 456-461
[23] I Moumlnch R Noll R Buchholz and J Worringer Laser identifies steel grades Stainless Steel World 12 (2000) 25-29
[24] H Fink U Panne and R Niessner Analysis of recycled thermoplastics from consumer electronics by laser-induced plasma spectroscopy Anal Chem Acta 440 (2001) 17-25
[25] D Anglos Laser-Induced Breakdown Spectroscopy in Art and Archaeology Applied Spectroscopy 55 (2001) 186A-205A
[26] L Burgio K Melessanaki M Doulgeridis R J H Clark and D Anglos Pigment identification in paintings employing laser induced breakdown spectroscopy and Raman microscopy Spectrochimica Acta Part B56 (2001) 905-913
[27] M Bicchieri M Nardone PA Russo A Sodo M Corsi G Cristoforetti V Palleschi A Salvetti E Tognoni Characterization of azurite and lazurite based pigments by laser induced breakdown spectroscopy and micro-Raman spectroscopy Spectrochimica Acta Part B56 (2001) 905-913
[28] F Colao R Fantoni V Lazic and V Spizzichino Laser-induced breakdown spectroscopy for semi-quantitative and quantitative analyses of artworks-application on multi-layered ceramics and copper based alloys Spectrochim Acta Part B 31 (2002)1219-1234
[29] V Detalle Q Glorieux R Bruder D LHermite A Semerok La spectroscopie deacutemission optique sur plasma induit par laser (LIBS) Un nouvel outil analytique pour leacutetude in situ de la peinture murale et des polychromies = Laser induced breakdown spectroscopy (LIBS) a new analytical technique for in situ study of painted artworks L Actualiteacute chimique no312-13 (2007) 98-104
[30] J Hybl G Lithgow and S G Buckley Appl Spectrosc Laser-Induced Breakdown Spectroscopy Detection and Classification of Biological Aerosols 57 (2003) 1207-1215
[31] A C Samuels F C De Lucia Jr K L McNesby and A W Miziolek Appl Opt Laser-induced breakdown spectroscopy of bacterial spores molds pollens and protein initial studies of discrimination potential 42 (2003) 6205-6209
6
[32] S Morel N Leon P Adam and J Amouroux Appl Opt Detection of bacteria by time-resolved laser-induced breakdown spectroscopy 42 (2003) 6184-6191
[33] C A Munson F C De Lucia Jr T Piehler K L McNesby and A W Miziolek Investigation of statistics strategies for improving the discriminating power of laser-induced breakdown spectroscopy for chemical and biological warfare agent simulants Spectrochim Acta Part B 60 (2005) 1217-1224
[34] Matthieu Baudelet Laurent Guyon Jin Yu Jean-Pierre Wolf Tanguy Amodeo Emeric Freacutejafon Patrick Laloi Spectral signature of native CN bonds for bacterium detection and identification using femtosecond laser-induced breakdown spectroscopy Appl Phys Lett 88 (2006) 063901
[35] Matthieu Baudelet Laurent Guyon Jin Yu Jean-Pierre Wolf Tanguy Amodeo Emeric Freacutejafon Patrick Laloi Femtosecond time resolved laser-induced breakdown spectroscopy for detection and identification of bacteria a comparison to the nanosecond regime J Appl Phys 99 (2006) 084701
[36] Matthieu Baudelet Jin Yu Myriam Bossu Julien Jovelet and Jean-Pierre Wolf Tanguy Amodeo and Emeric Freacutejafon Patrick Laloi Discrimination of microbiological samples using femtosecond laser-induced breakdown spectroscopy Appl Phys Lett 89 (2006) 163903
[37] Russell SHarmon FrankCDeLucia Jr Aaron LaPointe Raymond JWinkel Jr Andrzej W Miziolek LIBS for landmine detection and discrimination Anal Bioanal Chem 385 (2006) 1140ndash1148
[38] Frank C De Lucia Jr Russell S Harmon Kevin L McNesby Raymon J Wonkel Jr Andrzej W Miziolek Laser-induced breakdown spectroscopy analysis of energetic materials Appl Opt 42 (2003) 6148ndash6152
[39] Alexander Portnov Salman Rosenwaks Ilana Bar Emission following laser-induced breakdown spectroscopy of organic compounds in ambient air Appl Opt 42 (2003) 2835ndash2842
[40] Cristina Lopez-Moreno Sandiago Palanco J Javier Laserna Frank DeLucia Jr Andrzej Miziolek Jeremy Rose Roy A Walter Andrew I Whitehouse Test of stand-off laser-induced breakdown spectroscopy sensor for the detection of explosive residual on solid surface J Anal At Spectrom 21 (2006) 55ndash60
[41] C M Davies H H Telle and A W Williams Remote in situ analytical spectroscopy and its applications in the nuclear industry Fresenius Journal of Analytical Chemistry 355 (1996)
[42] A I Whitehouse J Young I M Botheroyd S Lawson C P Evans and J Wright Remote material analysis of nuclear power station steam generator tubes by laser-induced breakdown spectroscopy Spectrochimica Acta B 56 (2001) 821-830
[43] Laurent Salmon Analyse LIBS en milieu nucleacuteaire talk in Journeacutees LIBS Mai 18-19 2009 Bordeaux France
[44] CB Dreyer G S Mungas P Thanh and JG Radziszewski Study of Sub-mJ-Excited Laser Induced Plasma Combined with Raman Spectroscopy under Mars Atmosphere-Simulated Conditions Spectrochimica Acta B 62 (2007) 19
7
[45] GS Mungas CB Dreyer AJ Bauer Elemental Abundance Measurement using Micro-LIBS for Space Exploration Lunar and Planetary Science Conference XXXX 2264 (2009)
[46] Andrew K Knight Nancy L Scherbarth David A Cremers and Monty J Ferris Characterization of Laser-Induced Breakdown Spectroscopy (LIBS) for Application to Space Exploration Appl Spectrosc 54 (2000) 331-340
[47] F Colao R Fantoni V Lazic A Paolini F Fabbri GG Ori L Marinangeli A Baliva Investigation of LIBS feasibility for in situ planetary exploration An analysis on Martian rock analogues Planetary and Space Science 52 (2004) 117 ndash 123
[48] Beacuteatrice Salleacute David A Cremer Sylvestre Maurice Roger C Wens Laser-induced breakdown spectroscopy for space exploration applications Influence of the ambient pressure on the calibration curves prepared from soil and clay samples Spectrochimica Acta B 60 (2005) 479-490
[49] Jean-Baptiste Sirven Beacuteatrice Salleacute Patrick Mauchien Jean-Luc Lacour Sylvestre Maurice and Geacuterard Manhegraves Feasibility study of rock identification at the surface of Mars by remote laser-induced breakdown spectroscopy and three chemometric methods J Anal At Spectrom 22 (2007) 1471ndash1480
[50] Patrick Mauchien Jean-luc Lacour Beacuteatrice Salleacute Laurent Salmon Lanalyse chimique des roches martiennes Clefs CEA no54 (2006) 73-77
8
9
CHAPTER I THEORETICAL BASIS
1 INTRODUCTION Laser ablation of metals has been the subject of a large number of studies leading to a lot
of published results when compared with organic samples [1] The ablation of metals
remains easier to understand when compared to organic substances which add more
complications to the mechanism of plasma generation This is especially true when we
consider metallic elements in an organic matrix Due to different absorption properties
the laser interaction with organic and with metallic samples differs putting forth even
further discrepancies of the plasma properties ie non stoichiometric ablation because of
the large difference between their ionisation potentials To improve the understanding of
the laser ablation of polymers we decided to study simple polymer samples such as
Nylon or PVC
10
In this chapter we wish to recall briefly the basic fundamentals that we used in our
understanding of the laser-induced plasma and the spectroscopy of plasmas induced from
polymeric materials Many parameters can influence the plasma properties but we shall
first begin with the main differences between the plasma generations with femtosecond or
nanosecond laser pulses A further emphasis will be made between UV and IR
nanosecond laser pulses After briefly discussing the plasma formation we shall evoke
our methods for plasma diagnostics (electronic density and temperature calculations) The
spectral emission is used to calculate the electronic density (mainly Stark broadening) and
the different plasma temperatures (atomic ionic and molecular) These measurements
will allow us to assess the local thermal equilibrium (LTE) of the plasma An introduction
of calibration free LIBS (CF-LIBS) finishes off this chapter even if we still have not used
this method of analysis in this thesis The advantages associated with this technique have
greatly attracted us and we would like to implement it in our further works
2 PLASMA GENERATION The mechanisms involved in the ablation depend on a number of variables that effect the
interaction between the laser pulse and the sample target Firstly the properties of laser
pulses can lead to different interaction regimes with regards to the pulse duration the
wavelength and the fluence of the pulses Secondly the target (can be in a solid liquid or
gas form) and its properties also influence the ablation due to its specific laser absorption
mechanism and matrix effects Lastly the surrounding atmosphere during ablation such
as the pressure and the ambient gas (inert air vacuum etc) will also influence the plasma
generation and its expansion The main differences between nanosecond and femtosecond
laser ablation will be evoked here followed by the main mechanisms in which a plasma is
formed
Laser ablation consists of focalising an intense laser emission on a sample and removing
matter from the surface For a LIBS measurement a focalising lens directs and
concentrates the laser pulse energy on the surface of the material of interest For this
reason we shall often talk in terms of the pertinent factors which are the fluence (often
expressed in 119869 frasl 119888119898sup2) or the irradiance (often expressed in 119866119882 frasl 119888119898sup2 ) They allow us to
take into account the size of the section of the focalised beam and the laser pulse duration
11
respectively In order to generate a plasma the irradiance must be greater than what is
called the ablation threshold 119868119905ℎ (or a fluence greater than 119865119905ℎ) As a consequence the
locally removed mass exhibits rapid melting and evaporation to form a vapour This
vaporised mass is exploded out of the material at a supersonic velocity However only
when the vapour is sufficiently ionised can it be then called a plasma [2] We can note at
this point that our experimental research was conducted so that the laser fluence was
always above the threshold value to ensure the plasma generation
21 LASER-MATTER INTERACTION
The practical reason for which we would like to go into the further detail of the
fundamentals of the laser-matter interaction is because it will enable us to define the
appropriate optimisation of our LIBS experimental parameters For us this means finding
the parameters where we are able to acquire the most significant results As already
discussed the pulse duration has a significant impact on the ablation process In the
nanosecond regime there is a significant interaction between the laser emission and the
ablated material In the femtosecond regime the laser pulse does not directly interact with
the generated plasma This laser-plasma interaction therefore drastically influences the
plasma properties We shall start by discussing the nanosecond regime (in UV and IR)
then the femtosecond regime
211 Nanosecond Ablation
The most common type of laser used in LIBS is the nanosecond NdYAG which can
provide pulse in different wavelengths ranging from UV to IR Nanosecond lasers emit
pulses long enough (around 5 ns FWHM in our case) their ldquotailrdquo remains present during
plasma formation and expansion This leads to a significant post-ablation interaction
between them ie the laser energy continues to be absorbed by the vapour The laser
energy can be absorbed by atoms or molecules leading to their excitation or even their
ionisation [3] The laser energy can also be absorbed by free electrons leading to their
heating and the cascade ionisations due to subsequent collisions between electrons and
atoms or molecules The initial temperatures can be very high (6000 ndash 20000 K) with
high electron densities (1017 minus 1019 cmminus3) [4] The energy loss and cooling of the
12
electrons is mainly due to the thermal propagation into the target [5] The heat
propagation diffuses a few microns into the target causing it to melt in a non-
homogenous way creating craters with messy borders
Depending on the irradiance and the wavelength of the pulse the ablation mechanisms
can be either dominated by thermal (melting sublimation and vaporisation) or non-
thermal (direct molecular bond breaking) processes We will focus on laser irradiances
greater than 108 Wcmsup2 to create plasmas with high enough temperatures to ensure the
atomic excitation and ionisation of the metallic elements present in certain polymers The
subsequent laser-plasma interaction enables even further heating of the free electrons
within the plasma
The photon absorption in a plasma is mainly due to inverse Bremsstrahlung (IB) and
photoionisation (PI) processes since the other absorption mechanisms have smaller cross
sections and are ignored at this laser intensity [467] The consequence of IB is higher
temperature of electrons These excited electrons in turn collide with neighbouring ions or
neutral atoms more violently causing the liberation of other electrons and in turn ionising
more atoms This phenomenon is known as avalanche ionisation As long as the
electromagnetic field of the laser remains in interaction with the electrons this process
will repeat itself increasing the ionisation degree of the plasma [2] The cross sections of
the collisions between electrons-ions are much greater than those between electron-
neutrals
The inverse Bremsstrahlung (IB) absorption 120572119868119861(119888119898minus1) is approximately proportional to
1205823 as can be seen in Equation (11) The second part of the right hand side accounts for
the simulated emission [2 3]
13
120572119868119861 = 1198761198731198901198730 + 4 1198906 1205823 119873119890 119885sup2 119873119894
3 ℎ 1198884 119898119890
21205873 119898119890 119896119861 119879119890
12 1 minus 119890119909119901 minus
ℎ 119888120582 119896119861 119879119890
(11)
With 120572119868119861 inverse Bremsstrahlung absorption coefficient (119888119898minus1) 119876 cross section for electron-photon absorption (1198881198982) 119873119890 electron density (119888119898minus3) 1198730 neutral atom density (119888119898minus3) 120582 ablation wavelength (cm) 119885 ion charge (1 or 0) 119873119894 ion density (119888119898minus3) 119888 speed of light (119888119898119904) ℎ Plankrsquos constant (eV s) 119898119890 electron mass (119872119890119881119888sup2) kB Boltzmanns constant (eVK) T excitation temperature (K) e elementary charge
Another photon absorption process that initiates the plasma formation by producing more
free electrons is photoionisation Photoionisation is defined as the ionisation of an atom or
a molecule by a single or several photons that have a sufficient amount of energy to
directly eject an electron out of the atom or molecule When the combination of a few
photons is required the process is called multiphoton ionisation (MPI) The energy
associated to a photon is defined in Equation (12) and is inversely proportional to 120582 This
indicates that UV radiation will therefore more efficient for ionising atoms or molecules
then IR wavelengths
119864 = ℎ120584 =ℎ119888120582 (12)
Laser-plasma interaction is the main ionising mechanism of the vapour dominating the
direct ionisation of particles when vaporised [8] where 10 of the particles are
considered to be ionised [9 10] The coupling between the laser and the plasma
complicates the evolution of the plasma For example plasma screening (can also be
called shielding) can occur in a sufficiently dense plasma ie the electronic density
reaches the critical density 119873119888(119888119898minus3) defined by Equation (13) [8 10]
119873119888 = 1021
1205822 (13)
With 120582 wavelength (microm)
14
It can be seen that 119873119888 is inversely proportional to the square of the wavelength 120582(micro119898) ie
shorter wavelengths have higher critical densities diminishing the probability for
shielding When the plasma reaches this density the ldquotailrdquo of the laser pulse is reflected
backwards and its interaction with the plasma (especially the core) is no longer possible
For laser ablation of polymers there can be photochemical or photothermal ablation
There is even the possibility of having a mixture of both Photochemical ablation is
defined as the absorption of laser photon (or photons) to dissociate the molecular bonds
within the polymer and directly evaporate the matter Photothermal ablation is when heat
is dissipated within the sample to cause melting and etching [1112] which is more
commonly observed in laser ablation of metals
The ablation depth for polymers per laser pulse 119871 is expressed in Equation (14) The
logarithmic dependence with the ablation fluence can be applied to most solids even if it
is more commonly used for polymers [13]
119871 cong 120572minus1 ln 119865119865119905ℎ
(14)
With 119871 ablation depth per laser pulse (micrompulse) 120572 absorption coefficient of the sample (cm-1) 119865119905ℎ ablation threshold fluence (J cm-2) 119865 laser fluence (J cm-2)
Srinivasan felt the need to introduce another term to Equation (14) to put forth the
contributions of both the photochemical and photothermal mechanisms [14]
119871 cong 120572minus1 ln 119865119865119905ℎ
+ 119860 exp minus1198641119877119879
(15)
With 1198641 activation energy (119888119886119897 frasl 119898119900119897) T temperature of the sample (K) 119860 prefactor of the Arrhenius equation 119877 gas constant (119888119886119897 frasl (119870 119898119900119897))
15
a Infrared ablation (1064 nm)
For the ablation of polymeric materials the photoionisation is very weak in this regime as
the infrared photons do not carry a sufficient amount of energy to chemically break the
bonds Due to the insufficient amount of energy of one IR photon to break the chemical
bonds present in polymers it is more likely to see photothermal ablation in this case The
vibrational modes of molecules absorb the laser energy and diffuse it in the form of heat
This leads the sample surface to melt In order to have ablation a chemical bond needs to
absorb several quanta of laser energy to induce evaporation During this time however
the material located close to this area will undergo a melting process [11] This leads to a
low efficiency of matter removal by ablation The post-ablation heating observed in IR
ablation is quite efficient which leads to a higher temperature in the plume In fact Wang
et al [16] reported the plasma emission to be up to 5 times higher for IR emission for the
main carbon line at 248 nm The observed enhancement in optical emission from the
plasma is due to a higher temperature rather an increase in the ablated material due to the
high energy of the excited state
More specifically for the post-ablation interaction between the plasma and the laser in
this regime the main absorption mechanism is the inverse Bremsstrahlung as indicated in
Equation (11) causing strong electron heating in the plasma and cascade ionisations The
electron density of the plasma will then increase to the point where it reaches 119873119888 and
visible partial screening (also called shielding) of the plasma can be observed The laser
irradiance needs to be greater than 2 times 108 Wcmsup2 for plasma shielding to take place [3]
Chapter 2 presents shadowgraph images of the plasma in expansion to show this
phenomenon very clearly [2] When partial screening commences the laser pulse ldquotailrdquo
can no longer couple to the target material as its entire energy is absorbed by the plasma
or even reflected Therefore even when the fluence increases the ablation depth remains
low The consequence on the plasma expansion is the laser-supported detonation wave
(LSD) as it will be shown in Chapter 2
16
b Ultraviolet ablation (266 nm)
Inverse Bremsstrahlung is less efficient for UV ablation than in IR ablation However the
multi photon ionisation coefficient is much higher leading to a large number of ions [7]
The recombination processes that compete with the electron generation by multiphoton
ionisation may reduce the amount of charged particles in the plasma The critical electron
density is higher in this regime reducing the effect of plasma shielding This allows a
more efficient coupling between the laser pulse and the target The energy associated to
this wavelength is greater than 47 eV This means that the UV wavelength has enough
energy to chemically dissociate and break the bonds through multi photon process
within the matrix for most organic materials
When bonds are broken in a non-thermal manner ie not heat induced but more
chemically broken the ablation is said to be photochemical [17] When a polymer
absorbs a UV photon it can either excite the kinetic energy of its internal vibrational
transitions (photothermal) or directly break a chemical bond within the target [11] For
UV nanosecond ablation there is usually a mixture between both photothermal and
photochemical ablation The photochemical processes that intervene in UV ablation
results in higher ablation rates (ablation efficiency which is the ablated mass per laser
pulse per unit area [218]) Furthermore the rotational translational and vibrational
temperatures of ablated species are not in equilibrium The shockwaves have higher
initial velocities the surface swelling is faster and a lower ablation threshold value is
found when compared to IR ablation [219]
To conclude about the differences between the nanosecond UV and IR ablation regimes
regimes we present a model by Garrison et al [11] in Figure 1 which illustrates the
photochemical ablation (no melting can be seen around the crater just a clean expulsion of
matter) and the photothermal ablation (melting and evaporation)
17
Figure 1 Nanosecond laser ablation of polymers in air [11] at different time delays after laser impact a) UV ablation (1 photon per monomer) b) IR ablation (1 photon per monomer) c) IR ablation (4 photons of energy delivered to each monomer) There is a slight perspective in the drawings
212 Femtosecond Ablation
In the case of femtosecond ablation the phenomenon responsible for the ejection of
matter from the surface of a target is the Coulomb explosion otherwise known as non-
thermal melting When the electronic excitation energy due to the intense laser field is
transferred to the lattice phonons in the form of kinetic energy the atomic motion can be
so violent as to break the bonds that hold solids together The release of the electrons of
the solid [20] leaves behind a locally positively charged lattice Since the electrons are
negatively charged this mutual repulsion (Coulomb repulsion) creates an explosion
where a small cluster of charged and energetic ions creates a plasma
The energy absorbed by the electrons increases instantaneously but the time it takes for
them to transfer their energy to the lattice phonons depends on the thermal conductivity of
the sample [15] and cannot be neglected for femtosecond ablation For femtosecond
ablation the heat diffused to the target represents only a tiny part of the laser energy The
rest of the very intense beam is used to create photothermal changes and multi-photon
ionisation
The craters produced in this regime have smoother edges and can be processed more
precisely compared to the craters induced by nanosecond pulses This can be due to the
absence of the liquid phase in femtosecond ablation The velocity of the ejected mass is
a cb
18
considerably faster than the thermal velocity of the particles [18] Photons from visible
and IR femtosecond pulses do not have enough energy for ionisation The absorption of
several photons (multi-photon absorption MPA) makes the ionisation possible but makes
the process more sensitive to the laser intensity [21] 119872119875119860 = 120590 119868119898 where 119898 satisfies the
equation 119898ℏ120596 gt 119864119892 Due to the higher peak intensities of ultrashort laser pulses the
interband transitions are significantly increased Ablation efficiency is best for
femtosecond pulses and it is improved for ns pulses when the laser wavelength decreases
on metal targets [18] Our shadowgraph experiments will demonstrate that this is also the
case for polymeric targets
In femtosecond ablation the laser pulse is absent during the plasma expansion meaning
that there is no interaction between the laser pulse and the expanding plasma The pulse
shielding effects is totally absent Due to high intensity of a femtosecond pulse it can
however create an ionised channel by breaking down the air molecules during its passage
This can be observed in the shadowgraphs in Chapter 2
22 PLASMA FORMATION Figure 2 shows the different steps observed during the nanosecond ablation of a solid
sample The laser pulse strikes the sample surface (a) where it is first absorbed The
energy absorbed is rapidly converted into heat and causes the sample to locally melt Due
to the focalisation that increases the irradiance the laser beam contains enough energy to
induce vaporisation and fragmentation (b) The boiling point is reached when the pressure
of the vapour exceeds that of the ambient environment As seen before for intensities
higher than 108 Wcmsup2 a large number of electrons ions and excited atoms are present in
the vapour and absorb part of the laser energy leading to a breakdown in the vapour and
its ionization (c) [67] At this moment the plasma is dominated by the continuum
emission that overbears any other atomic emissions The emission detected in this phase
is mainly due to the Bremsstrahlung and the recombination processes
When the laser pulse is over the plasma continues to expand very rapidly attaining
supersonic velocities [11] (~ 106 cms) perpendicular to the surface The ions formed at
the beginning start to capture the free electrons leading to neutrals De-excitation of ions
19
and neutrals lead to the emission of characteristic photons a very important point that
allows us to determine the concentration of the elements in the plasma with the LIBS
technique (d) This phase is followed by the formation of aggregates and clusters due to
the decrease in temperatures (e) which are deposited around the crater along with the
molten material created by the laser melting (f)
Different time stages can be studied during the expansion of the plasma Figure 1 shows
the time evolution of these stages (A B C and D) with regards to a femtosecond and
nanosecond laser pulse duration The first phase A represents the time that the laser pulse
transfers its energy to the sample The laser photons are immediately absorbed by the
surface electrons (~10-15 s) It then takes ~100 fs for them to thermalise amongst
themselves and transfer their energy in turn to the lattice phonons (a few ps) Followed by
phase B where the plasma vapour containing ions atoms and molecular fragments
initiates its expansion into the surrounding environment Due to the supersonic velocity of
this expansion a shockwave engulfs the plasma This expansion continues for several
microseconds From the formation of the plasma and until its dissipation it emits
radiation The continuum radiation is followed by the ionic atomic and molecular
emission lines that can be used to determine the elements present within the plasma In
phase C the excited ions atoms and molecules return to a more stable state by emitting
photons The plasma further relaxes in phase D where its temperature falls below the
fusion temperature and the condensation starts to form nanoparticles [1] In this thesis we
will mainly focus on parts B and C where the expansion and the spectral emission of the
plasma will be studied
20
Figure 2 Plasma formation for nanosecond pulses with sufficiently high fluence [2223]
ns laser pulse
e
Polyatomicagregats
f
Deposition of ablated material
a
Laser
1 fs
bVapor
Fragmentation
100 ps
c
Shockwave
Emission
Absorption
1 ns
d
Plume expansion
1 ns ndash 100 micros
21
3 LIP EMISSION SPECTROSCOPY
31 LIP EMISSION
Laser-induced breakdown spectroscopy (LIBS) uses the spectral emission from the laser-
induced plasma (LIP) for elemental analysis of the target However from the moment the
plasma is formed until the moment it is dissipated it goes through different stages The
spectra collected at different delays and different gate widths are therefore different Figure
3 shows the evolution of the optical emission intensity with regards to the time after the
laser pulse strikes the sample It can be divided into two parts a very intense signal that
comes from the continuum and the atomic or molecular signals used to characterise the
sample At early delays (especially when the laser pulse is still present) the optical signal is
dominated by a strong continuum emission During laser ablation ions and neutral atoms
are liberated and are further ionised by the laser pulse Therefore ionic lines are first seen
followed by atomic and finally molecular spectral emission lines The delay after laser
impact chosen and the gate width are important criteria depending on what is to be
analysed Time-resolved studies are the best way to find the most adequate time delay and
gate width according to the application
Figure 3 The evolution of the intensity emission from a laser induced plasma [24]
1ns 10ns 100ns 1micros 10micros 100micros
Time after laser impact
Inte
nsity
[au
]
Laser
Continuum
Atomic lines (I)
Ionic lines (II)
DelayGate
Molecular lines
pulse
Gate of detector
22
Since these excited states are not stable the electrons within the atoms and molecules will
return to more stable energy levels by releasing their excess energy in the form of photons
(Figure 4) This can be done either by spontaneous emission or by intense enough
collisions Contrary to the continuum radiation the photons emitted (ℎ120584119894119895) are specific to
their transitions and therefore represent different atomic or molecular information This
information is the essential for the diagnostics of the plasma ie calculate the electron
density and the temperature
Figure 4 Continuum and Spectral line emission
Bremsstrahlung Radiation
In the first picoseconds the electrons and ions start colliding and interacting When a free-
electron is decelerated in the presence of a strong electromagnetic field such as the one of
an atomic nucleus the loss of kinetic energy is transformed into radiation shown in
Figure 5 This process is called Bremsstrahlung which is the German term meaning
ldquobraking radiationrdquo Since the electron started being free and after the interaction
remained free it is known as a free-free transition However when a free electron is
captured by an ion instead of being deviated this leads a free-bound transition The
n = 1
n = 5
n = 3n = 4
n = 2
En(eV)
0 n rarrinfin
Excitation
Ionisation
hν21Emission
Continuum
Spectral discrete emission lines
Continuum emission
23
excess kinetic energy is given off in the form of a photon resulting in recombination
radiation These two radiation mechanisms are responsible for the continuum emission
Since this emission is mainly due to the free electrons present in the plasma it does not
represent any spectral lines
Figure 5 Bremsstrahlung radiation
Spectral line emission
The LIBS technique is based on the study of the light emission from a laser-induced
plasma After an enough long delay a discrete spectrum is recorded with peaks produced
at specific wavelengths This means that every peak corresponds to an element and this is
how we use the plasma to characterise the ablated matter For molecular lines it often
comes in a group of lines which can be observed in the results in Chapter 3 Between the
time the photon is emitted and the time it is detected it has the possibility to get
reabsorbed by other ions or atoms An optically thick plasma means most of the radiation
cannot escape the plasma due to high absorption When the photons are directly detected
the plasma is said to be optically thin This is the ideal situation for LIBS but
unfortunately this is not always the case Corrections have to be made and some spectral
lines have to altogether be ignored to avoid erroneous interpretations
Self-absorption and Self-reversal
Electron approaching a positively charged
particle with energy E1
Electron changes direction and decreases
in energy E2
Positively charged particle
The sudden decrease in energy results in the emission of a photon
(E2 - E1)
h f = E2 ndash E1
E1
E2
e
e
24
The corrections are not the same depending on how the photon is reabsorbed If the
photon emitted from one atom is absorbed by another atom of the same element close by
considered to be at the same temperature and surrounded by the same electron density
the spectral line is said to be self-absorbed Transitions which involve the fundamental
level are more affected by such perturbations When a photon is emitted from the hot core
of the plasma and absorbed by an atom of the same element in the cooler exterior where
the temperatures and the electronic density differ the phenomenon of self-reversal is
observed Both phenomena give rise to distorted spectral lines which can be seen in
Figure 6 Self-reversal results in broadening but most importantly it is marked by a dip in
the centre of the peak Self-absorption broadens the spectral line making it difficult to
distinguish from other non-distorted lines
Figure 6 Self-absorption (upper) and Self-reversal (lower) spectral distortions [25]
A lot of emphasis is given to spectral line analysis because they are the basis of plasma
diagnostics and the technique of LIBS For example the electronic density can be found
by studying the spectral line width and the temperature can be calculated using the line
intensities Due to the self-absorption or self-reversal it is crucial to carefully select the
Wavelength (nm) Wavelength (nm)
Inte
nsit
y (a
u)
Inte
nsit
y (a
u)
Absorption of a photon by a near by atom with not a large
difference in temperature(T1 harr T1 ) and (T2 harr T2)
Absorption of a photon by a far away atom with a large difference in temperature
(T1 harr T2)
Emission (T Ne N1)
Absorption (T Ne N2)
Emission (T1 Ne N1)
Absorption (T2 Ne N2)
Resulting Profile
Resulting Profile
25
spectral lines Self-absorbed lines are not always easy to identify because of having the
same allure as non absorbed lines The spectral lines chosen should ideally have [26]
strong intensity in the working spectral range
minimum overlapping with other lines
minimum self-absorption
without saturation for the detector
In practice these ideal lines are very difficult to attain altogether There are a few
compromises that need to be done For example when a line is known to be self-
absorbed their intensities should be corrected before being used or otherwise excluded
from the calculations Lines that include the fundamental level should also be avoided
[27] from a certain value of the electron density
32 PLASMA DIAGNOSTICS
The plasma dynamics and time evolution have interested many researchers for a few
decades [13 28 29] Temporal and spatial evolutions have been extensively studied to
understand the different mechanisms that occur after laser impact A certain emphasis is
taken on electron density and temperature calculations from spectral data Some of these
calculations particularly the those for estimating the plasma temperature can only be used
when the plasma is considered to be at a certain equilibrium known as the local
thermodynamics equilibrium (LTE)
Before going into more detail regarding LTE explanations on the electron density and
temperature calculations will be first explained For now very simply LTE first requires
that the plasma has a certain electron density larger than a critical value (equation (142))
and then that all the species present (atomic ionic and molecular) be defined by the same
and unique temperature In other words the excitation temperatures of different spaces
(atoms ions and molecules) must have the same value as temperature of the electrons
For the LIP plasma a transient and expanding plasma other criteria which takes into
account the time evolution and the inhomogeneity of the plasma need to be considered
26
[30 31] Only when these criteria are fulfilled the LTE can be considered In addition
for a typical LIBS plasma only neutral and singly charged ions are taken into account for
the following calculations [24]
321 Electron Density Calculation
The different spectral line broadening mechanisms need to be understood in order to
correctly extract the electronic density Each of them has a particular influence on the
spectral line Some are represented by the Gaussian profile and others the Lorentzian one
This will be explained in more detail below followed by stating how the electron density
can be calculated
a Broadening Mechanisms
Natural line broadening
The natural line broadening is due to the finite time that an atom spends in its excited
state 119864119894 and results in a Lorentzian profile [32] If the mean time at 119864119894 is Δt then the
Heisenberg uncertainty principle states that
Δ119864119894 Δ119905119894 ge ℎ
2120587 (16)
The frequency 120584119894119895 (119904minus1) considered for a transition from 119864119894 to 119864119895 is
120584119894119895 =119864119894 minus 119864119895ℎ (17)
Considering the finite line width Δ120584119873119886119905119906119903119886119897 (119904minus1) the natural broadening can be
expressed as
Δ120584119873119886119905119906119903119886119897 = 1Δ119905119894
+ 1Δ119905119895
2120587 (18)
27
The value at the spectral range of 300 nm is of the order of 0000005 nm which means
that it will be neglected for atomic spectra from a laser induced plasma
Doppler broadening
The Doppler broadening [32] is the broadening of spectral lines due to the Doppler Effect
resulting from the thermal motions of atoms and molecules in the plasma (some moving
towards and others away from the detector) The higher the temperature or pressure
within the plasma the faster the particles move increasing the chances of collisions The
particles in motion are considered to have a Maxwellian velocity distribution resulting in
a Gaussian spectral broadening profile The FWHM of the profile depends only on the
frequency of the spectral line the mass of the emitting particles and their temperature as
can be stated in (110)
∆12058212
119863119900119901119901119897119890119903 = (716 times 10minus17) 120582 11987911987212 (19)
With 119879 emittersrsquo temperature (K) 119872 atomic weight (amu) 120582 wavelength (Aring)
For the spectral range frequently used in LIBS (UV to IR) Doppler broadening is not the
main line broadening mechanism If an extremely high plasma temperature is considered
(105 119870) the corresponding Doppler broadening for the visible range is only 001 nm
This is negligible compared to actual spectral line widths
28
Stark broadening
Collision-induced broadening sometimes called pressure broadening is a result of the
deformation of atoms or molecules when they bounce off each other For example they
may not be as symmetrical after a collision as they were before These deformations
perturb the quantum mechanical energy levels of the atom or molecule slightly shifting
the frequencies of the emission or absorption lines Just like Doppler broadening the
spectral lines are therefore broadened This effect depends on both the pressure and
temperature of the gas
Stark broadening is a particular case of pressure broadening where atoms interact with the
neighbouring charged particles such as ions and electrons According to quantum
mechanics the interaction will slightly modify the energy levels considered in the
transition inducing the spectral line to broaden The broadening is homogeneous and
corresponds to the Lorentzian profile It follows from the Lorentz Force Law that the
magnitude of the perturbing electric field (119865) created by fast moving electrons and
relatively slow ions (119890) at a certain distance (119903) is given by
119865 = 1
41205871205760 119890119903sup2
(110)
During the plasma expansion where the electron density of the plasma is quite high this
is the main broadening mechanism dominating the natural and Doppler mechanisms [8]
Instrumental broadening
Measured line profiles also experience influence from the instrument resolution It is
dependent on the slit width the grating dispersion and the detector Diffraction from a slit
gives us a cardinal sinusoidal pattern which can be approximated using a Gaussian
profile
29
b Electron Density
Finally with all these mechanisms taken into consideration the spectral lines can be fitted
with a Voigt profile the result of the convolution of Lorentz (Stark broadening) and
Gaussian (Instrumental broadening) Natural and Doppler broadening are considered as
negligible for atomic spectra of a laser-induced plasma [26]
119881(120582 (119899119898)) = 119866120582 Δ120582119863119900119901119901119897119890119903 Δ120582119868119899119904119905 otimes 119871(120582 Δ120582119878119905119886119903119896) (111)
Δ120582119866119886119906119904119904(119899119898) = Δ120582sup2119863119900119901119901119897119890119903 + Δ120582sup2119868119899119904119905 (112)
Linear Stark Effect
The line width and the electronic density of the plasma are closely linked with each other
There exists a direct relationship between Stark broadening and the electronic density
especially at short delays where the plasma is quite dense [32] For hydrogen this
relationship is linear because of its linear dependence with the Lorentz force which
results in a symmetrical broadening The electron density can be calculated using the
following equation [32]
119873119890(119888119898minus3) = 802 times 1012 Δ120582s
12057212(119873119890119879)32
(113)
With Δ120582s FWHM of the line (Aring) 12057212 half width of the reduced Stark profile(Aring)
The parameter 12057212 depends slightly on the excitation temperature 119879119890119909119888 and the electron
density 119873119890 Values of this parameter can be found in ref [32] with precision in the range of
10
Quadratic Stark Effect
For other non-hydrogen-like atoms stark broadening is proportional to Fsup2 and is thus
called the quadratic Stark effect Their density can be calculated using the following
equation
30
119873119890(119888119898minus3) = 119873119903119890119891Δ1205821198781199051198861199031198962120596119903119890119891
(114)
With 119873119903119890119891 reference 119873119890 (~ 1016 minus 1017 119888119898minus3) ωref impact parameter at this reference density
Hydrogen Balmer 119919120630 Emission
Even though both linear and quadratic Stark effects are observed in the LIBS spectra
more focus is taken on extracting information from hydrogen or hydrogen-like atoms
Their linear dependence allows more accuracy and ease when calculating the half width
of line profiles providing more reliable results [8 26] The hydrogen Balmer line 119867120572 (656
nm) emission line width in function of the detection delays is often used to study the
temporal evolution of the electron density in the plasma during its expansion and decay
[33]
In organic materials the presence of hydrogen in the matrix allows for a well isolated
and significantly intense peak In addition this line is strongly affected by the linear Stark
effect [32] Its use for electron density determination has been extensively reported for the
diagnostics of laser ablation plasma [34 35] The surrounding electrons are mainly taken
into consideration rather than the ions which have a much weaker impact on the total line
broadening [36] Even though hydrogen is part of the polymer matrix 119867120572the auto-
absorption can be neglected as long as the electronic density is less than 1018 119888119898minus3 [35]
Figure 7 shows 119867120572 spectral line fitted with Voigt profiles for a potato Measurement were
taken at different delays (100 300 600 and 1000 ns) after laser impact to put forth its
evolution with time A narrowing of the line along with a shift towards smaller
wavelengths can be seen
31
Figure 7 Stark Broadening The 119815120514 fitted with Voigt profiles for a potato sample Different laser impact delays were taken (100 300 600 and 1000 ns after laser impact) [37]
322 Temperature Calculation
For temperature calculations the differences between the line intensities are taken into
account rather than the broadening There are different methods Boltzmann (one element
one species (neutral or ions)) plot Saha-Boltzmann plot (one element different species
(neutral and ions)) ionic temperature (one element in its neutral and ionic state) and
molecular temperature (vibrational) To estimate the temperatures it must be assumed
that the plasma is in LTE
a Boltzmann method (Excitation temperature)
There is a correlation between the transition emission (observed by a spectral line in the
spectrum) and the Boltzmann equation At 0 K all the atoms are in their fundamental
electronic configuration In addition at this temperature they are considered to be
motionless with absolutely no kinetic energy As the temperature increases they begin to
move and gain more energy to access different excited configurations as can be seen in
Figure 8 The distribution of this population follows the exponential nature of the
Boltzmann law
645 650 655 660 665 67000
02
04
06
08
10
Ca (6
439
1 nm
)
Ca (6
462
6 nm
)
Ca (6
493
8 nm
) 100 ns 300 ns 600 ns 1000 ns
Norm
aliz
ed In
tens
ity (a
u)
Wavelength (nm)
Hα (65627 nm)
32
Figure 8 Boltzmann electron population distribution at different energy levels
At a sufficiently high temperature collisions between electrons and atoms can become
efficient to excite atoms The population distribution among the different energy levels
obeys the exponential law present in the Maxwell-Boltzmann distribution [34]
119873119894119885 = 119873119885 119892119894119890
minus119864119894119885
119896119861119879
119880119885(119879) (115)
With 119873119894119885 number of particles in state i (119888119898minus3) 119864119894119885 energy of the i-th state (eV) gi degeneracy of energy level i T absolute temperature(K) N total number of particles (119888119898minus3) Z Z=0 (neutral) and Z=1 (singly-charged ions)
The denominator 119880119885(119879) is known as the partition function and can be calculated by
equation (122) Due to the difficulties associated with these calculations we only state
the equation required but we do not calculate it ourselves
119880119885(119879) = 119892119894119894
119890minus119864119894
119885
119896119861119879
(116)
With 119880119885(119879) partition funtion
T = 0 K Warm Hot
j
i
hνijAij
Ei gi
Ej gj
En (eV)
33
The excited atoms return to their lower energy configurations by emitting photons
Spectral lines corresponding to the transitions between these different levels can be
observed in emission spectra Each photon has a specific wavelength that is unique for
every transition enabling us to detect the elements present The line intensity can be
calculated by the following formula
119868119894119895119885 = 1
4120587 ℎ120584 119873119894119885 119860119894119895 = 1
4120587ℎ119888120582119894119895
119873119894119885119860119894119895 (117)
With 119868119894119895119885 line intensity 120582119894119895 wavelength of the transition (119899119898) 119860119894119895 transition probability
If the Boltzmann equation is used in the equation (126) the intensity can be written as
119868119894119895119885 = 1
4120587 ℎ119888120582119894119895
119873119885 119892119894 119860119894119895119880119885(119879) 119890119909119901 minus
119864119894119885
119896119861119879 rArr
119868119894119895119885 120582119894119895119892119894 119860119894119895
= 1
4120587 ℎ119888119873119885 119880119885(119879) 119890119909119901 minus
119864119894119885
119896119861119879 (118)
In a more simplified version the linearization of the spectral intensity line represents the
wavelength intensity with regards to the different energy transitions for the same species
(neutral or ionic)
119897119899 119868119894119895119885 120582119894119895119892119894 119860119894119895
= minus1119896119861119879
119864119894119885 + 119897119899 1
4120587ℎ119888119873119885
119880119885(119879) (119)
If the upper excited energy levels of a given species are known along with the statistical
weights transition probabilities and wavelength for some transitions then the excited
temperature can be deduced by measuring the emission radiances [38] The use of
transitions between largely separated levels leads to more precise results because the line
fit becomes more reliable This method is known as the Boltzmann plot (BP) method
[26] Assuming the LTE is established within the plasma the population in different
levels is governed by the Boltzmann distribution
The value of Aji is only known with a precsion in the range of 10 - 30 depending on the
transitions used Some authors believe that in practice the linearity of the plot is an
34
indication for the satisfaction of LTE [39 40] while others think that a straight line can
also be obtained even when the level population is out of LTE [41] Both agree that the
excitation temperature of a species within a plasma in LTE is inversely proportional to
the slope of the Boltzmann plot minus 1119896119879119890119909119888
shown in equation (129) The measurement of
the line intensities is therefore a crucial factor to obtain the optimal temperature
calculations using the BP method For this an intensity calibration of the detection
system must be performed especially when the selected lines extend over a large spectral
range It goes without saying that self-absorbed or self-reversed lines will lead to
inconsistent temperatures
For more reliable results the spectral lines should be well isolated without interference
from other transitions These conditions can be satisfied for transition metals such as iron
or titanium or alkaline earth metals such as calcium for which a large number of
transitions are available in the visible spectral range The elemental metallic trace lines
present in the polymer spectra are the result of contaminations that come from fillers and
additives added to enhance physical properties Their presence facilitates the temperature
calculations especially titanium because the organic elements (C H O and N) do not
have enough lines for such measurements
b Saha-Boltzmann Plot Method
The Boltzmann plot method has the convenience of being relatively simple but it is not
very accurate The energy gap between the upper levels of the two lines is usually small
for the same ionisation degree [42] One way to make it more precise is to significantly
extend the range of 119864119894 This can be done by using both ionic (II) and atomic (I) elements
on the same plot by combining the Boltzmann distribution with the following Saha
equation
119873119890119873119911
119873119911minus1 =2119880119885(119879)119880119885minus1(119879)
2120587119898119890119896119861119879
ℎsup232
exp minus 119864infin119885minus1 minus ∆119864infin119885minus1
119896119861119879 (120)
With 120549119864infin119885minus1 correction of the ionization energy 119864infin119885minus1 119864infin119885minus1 ionisation energy of the lower ionisation stage
35
This method named the Saha-Boltzmann plot method allows a significant extension of
the range of Ei distributing the data from the spectra over a larger range of energy
allowing for a more accurate linear plot
The following calculations are considered for a plasma in LTE therefore we can consider
that the excitation temperature 119879119890119909119888 and the ionisation temperature 119879119894119900119899 are equal The
Boltzmann and Saha equation are then defined by a single temperature value The result
is an equation similar to that of the BP method but with a few corrections
119897119899 119868119894119895119885 120582119894119895119892119894 119860119894119895
lowast
= minus1119896119861119879
119864119894119885lowast + 119897119899
14120587
ℎ1198881198730
1198800(119879) (121)
With 1198730 number of neutral atoms (Z=0) 1198800(119879) partition function for neutral atoms (Z=0) ions and electron values included
The equation is valid for atoms that are both neutral and ionised but in order to plot them
on a same graph there must be some adjustments (designated by ) made to the abscise
(119864119894119885) and the ordinate ( 119897119899 119868119894119895119885 120582119894119895119892119894 119860119894119895
) values in equation (128) There is a likelihood law to
find atoms ionised more than once in a LIBS spectra It is important to note that for
ionised marked species (119885 ge 1) the quantities with the superscript must be replaced by
the following expressions
For the abscise values
119864119894119885lowast = 119864119894119885 + 119864119894119900119899 (122)
With 119864119894119900119899 ionisation energy
For the ordinates
119897119899 119868119894119895119885 120582119894119895119892119894 119860119894119895
lowast
= 119897119899 119868119894119895119885 120582119894119895119892119894 119860119894119895
minus 119911119897119899 2(2120587119898119890119896119861)32
ℎ311987932
119873119890 (123)
119864119894119900119899119864119894119885Obviously for 119885 = 0 (neutral atoms) the Saha-Boltzmann equation becomes
identical to the Boltzmann equation since the last term becomes equal to 0 For ionised
species this term depends on the temperature 119879 therefore an iterative procedure needs
to be used to determine the temperature and plug it into the equation In practice only a
few iterations are needed to converge
36
c Ionic Temperature
The ionic temperature also uses the combination of the Saha and the Boltzmann equation
previously mentioned In this case the temperature can be found for an ionised species of
a given element The use of LTE conditions which states that the ionic and excitation
temperatures are equal along with the transition information of two different ionisation
degrees (119911 = 0 and 119911 = 1) gives the following intensity ratio between ions and neutral
atoms [42 43]
119868119894119900119899119868119886119905119900119898
= 483 times 1015
119873119890 119892119894 119860119894119895
120582119894119895119894119900119899
120582119894119895119892119894 119860119894119895
119886119905119900119898
11987932119894119900119899 119890119909119901minus119864119894119900119899119885 minus 119864119886119905119900119898119885
119896119861119879119894119900119899 (124)
With 119864119894119900119899119885 energy of the upper level of transition for ions 119864119886119905119900119898119885 energy of the upper level of transition for atoms
With a known ionisation energy 119864119894119900119899 and electronic density 119873119890 (measured by Stark
broadening described previously) along with the spectroscopic parameters of both these
transitions the ionic temperature can be calculated
d Molecular Temperature
The plasma is expected to have both ionic and atomic spectra but of polymers (detailed
in Chapter 2) molecular emission is also expected Mostly we see spectral lines emitted
by CN and C2 which can be used to calculate the molecular temperature The theoretical
considerations in Figure 4 show that molecules are created after the atoms and ions ie
their spectral emission should be observed after the ionic and atomic ones as shown by
our experimental results in Chapter 3
The vibrational temperature is determined with CN molecular band head emission present
in organic materials The vibrational temperature is extracted using the method described
in ref [42] Diatomic molecules possess many vibrational levels where molecules in the
upper vibrational state νprimecan decay into lower electronic states νprimeprime They put forth the
correlation between the sum of the band strengths and with the number of molecules in
each respective state as can be seen in Equations (132) and (133)
37
119868(120584prime 120584primeprime)
1205844 120584primeprime
prop 119873120584prime (125)
119868(120584prime 120584primeprime)
1205844 120584prime
prop 119873120584primeprime (126)
With 120584prime vibrational upper electronic state (119888119898minus1) 120584primeprime vibrational lower electronic state (119888119898minus1) 120584 frequency (119888119898minus1) 119873120584prime numbers of molecules present in 120584prime (119888119898minus3) 119873120584primeprime numbers of molecules present in 120584primeprime (119888119898minus3)
If we consider that the LIBS plasma is in local thermodynamic equilibrium it can be
possible to calculate the number densities of an excited molecule by using Equation
(134)
120584119894119895 = 119864119894 minus 119864119895ℎ
1198971198991205824 119868120584prime120584primeprime120584
= 1198621 minus 119866( 120584prime ) ℎ119888
119896119861119879119907119894119887 (127)
With 120582 wavelength of each transition 120584rsquo 119886119899119889 120584rdquo (nm) 119866( 120584prime ) vibrational term value to 120584prime 1198621 constant 119879119907119894119887 vibrational temperature (K) 119868120584prime120584primeprime measured intensity
By plotting lnsum λ4 Iνprimeνprimeprimeνprimeprime with regards to G(νrsquo) the slope provides the determination of
the vibrational temperature The results have been further confirmed by using the
temperature calculation by the spectrum simulation with the LIFBASE software [37] for
temperature ranging from 5000 to 20000 K The comparison showed good agreements
with a typical accuracy of 5-10
4 LOCAL THERMODYNAMIC EQUILIBRIUM The first optical thinness has already been discussed According to the talk presented by
Omenetto at EMSLIBS [45] there are two essential criteria that need to be filled in order
to consider the LTE The criteria are an electronic density minimal requirement
(McWhirter criterion) and the definition of a unique plasma temperature for all species in
the plasma
38
41 ELECTRON DENSITY CRITERION For the population of excited states for the elements in the plasma to be predominately
caused by collisions with electrons and not by radiative processes it requires a minimal
electron density to ensure these collisions The radiative processes explained before such
as photon absorption recombination radiation and spontaneous emission are in this case
negligible This minimal electron density is known as the McWhirter criterion and is
defined as [50]
119899119890 ge 16 times 1012 11987912 (∆119864)3 (128)
With ∆119864 (119890119881) largest gap between 2 adjacent energy levels T (K) plasma temperature
This condition is deduced for hydrogen and hydrogen-like atoms in an optically thin
stationary and homogenous plasma [45] The largest gap for hydrogen is indeed between
the ground state and the first excited energy state and corresponds to 4 eV This is not
always the case for other elements Figure 9 shows that the largest energy gap for oxygen
does not include the ground state In this case the largest gap must be used
Figure 9 Oxygen energy levels [45]
1
2
3
kj ih
E max g max
E min g min
GROUND STATE
ΔE 12 ~ 33 eVΔE 13 ~ 5 eV
ΔE max ~ 10 eV
39
Considering a plasma at 7000 K the required electronic density comes out to
119873119890 = 86 times 1015119888119898minus3 (129)
This is the necessary but not sufficient requirement for the LTE that is typically fulfilled
during the first stages of the plasma lifetime Due to the large 120549119864 often associated with
the lower lying energy states this condition can be difficult to satisfy A solution would
be to use higher excitation levels were ΔE are close enough to allow the equation to hold
the plasma would be in partial LTE
42 TEMPERATURE CRITERION
As explained previously the plasma consists of different particles (atoms ions
molecules hellip) in excited or fundamental states In addition different energy processes
take place within the plasma and can each be characterised by their own temperature
Therefore there is not clear definition of the plasma temperature unless the different
temperatures converge and one can describe the entire plasma with one and unique
temperature Otherwise the notion of plasma temperature would be confusing as it would
not be clear as to lsquowhatrsquo temperature was in question Four different temperatures can be
used to characterise the plasma and are listed below
Kinetic energy (Maxwell-Boltzmann distribution law) electron temperature
This energy is associated the motion of the electrons In the case of plasma it defines the
energy of the electrons that obey the Maxwell distribution law ie the Maxwellian
velocity distribution The interactions involving electrons and other particles are not taken
into consideration here just their free motion between subsequent collisions The
Maxwell-Boltzmann distribution law is characterized by the electron temperature
Internal energy (Boltzmann law) excitation temperature
Elements (atoms ions or molecules) in the plasma have the ability to access higher
energy configurations as the temperature increases The population amongst these excited
configurations obey the Boltzmann law characterised by the excitation temperature
40
Ionisation energy (Saha law) ionic temperature
Saharsquos law is used to describe the population distribution among successive ionisation
degrees within the plasma ie the distribution of the same element in different ionisation
stages In a typical LIBS spectrum and mainly for what concerns us this is limited to
species ionised only once
Radiation energy (Plankrsquos law) radiation temperature
Plankrsquos law describes the spectral radiance distribution from electromagnetic radiation
emitted from a black body ie optically thick plasma
Each one of these processes can attain their own individual equilibrium without being in
equilibrium with the rest However for complete thermal equilibrium (CTE) all the
temperatures must be simultaneously equal defining one and unique plasma temperature
119879119890minus equiv 119879119890119909119888 equiv 119879119894119900119899 equiv 119879119903119886119889 (130)
Complete LTE
For the LIBS plasma the complete thermodynamic equilibrium cannot be attained
because one expects an optically thin plasma As stated the Plank law requires the plasma
to be optically thick at all frequencies [24] Optically thick plasma means the line
intensities are distorted and misleading due to re-absorption of emitted photons within the
plasma The radiative life of the emitting particles and the duration of the laser pulse are
much smaller than the duration of the radiative life of the plasma So the emission is not
due to the photo-excitation mechanism but rather the thermal electron impact excitation
In a typical LIBS plasma in the typical time frame emission from electron collisions are
said to be the rate determining mechanisms dominating the radiative emission These
reasons explain why the radiation temperature is often decoupled from the others
allowing the opportunity to find a temperature that satisfies Maxwell Boltzmann and
Saha laws In this case we cannot talk about CTE but instead we talk about LTE
41
When considering a plasma in LTE 119879119890minus equiv 119879119890119909119888 equiv 119879119894119900119899 meaning the temperature that
depicts the population of atomic and ionic energy levels is the same for the atoms of the
same element in different ionisation stages Light emission collection depends on the
angle aperture of the collection apparatus Even if a plasma is in LTE it takes into
consideration only the mean values of T and Ne but not the spatial decoupling where the
plasma has different temperatures at different spatial positions Panne et al [46] noticed
that the geometrical observation in LIBS setup generated different temperatures and
electronic densities The influence of the collection system must be taken into
consideration when comparing spectral data obtained by different methods
The use of BP method to evaluate the LTE leads to erroneous results [47] due to the lack
of sufficient spectral lines used The ionisation temperature obtained by the Saha law
provides a better estimate for the real plasma properties [48] Milan et al [49] found
through spatially resolved measurements of ablation of a silicon sample that the cooler
regions near the exterior of the plasma affected the excitation temperature more than the
ionic temperature Hence since most temperature evaluations are based on a space
averaging technique the ionisation temperature seems to provide more accurate results
They concluded that 119879119890119909119888 = 119879119894119900119899 on silicon sample after 2 micros Others have taken another
step forward by calculating the vibrational temperature when molecular spectra are
detected Hermann et al [51] deduced that the electronic temperature converged with the
vibrational temperature associated to graphite samples only after 1 micros At this point there
was a thermalisation between the electrons and heavier particles Rusak and al [52] added
the temperature associated with the rotational energy of molecular bands only to notice no
LTE during the first micros of the plasma for power densities lower than 1 (119866119882) frasl 119888119898sup2
They did deduce the equilibrium between the excitation and vibration temperature
however
Whilst some authors like Capitelli et al [4] doubt that there can be a true existence of LTE
in laser induced plasma due to the high imprecision of the partition function values
Simeonsson and al [48] estimated that kinetic equilibrium between electrons and heavier
ions and neutrals was reached only 10 ns after the laser pulse impact while the excited
states needed 50 ns to reach a Boltzmann-like distribution for H C O and Cl Amoruso
and al [6 7] support this hypothesis stating that the electrons could effectively transfer
42
their absorbed energy on to other ions during the laser pulse The time needed for the
transfer is between 10minus10 minus 10minus11 119904 according to [53] much shorter than most laser
pulse durations They conclude that the electron temperature can be assumed to be nearly
the same as the ion temperatures
Finally the state of LTE can be considered as a good approximation for the plasma used
for LIBS measurements generally true for delays greater than 1 micros and over an interval in
the order of 1 micros For polymers the signal intensity is less intense and does not last as
long as that of metals By choosing an inadequate acquisition delay the McWhirter
criterion might be violated as there might not be enough electrons due to the weak
emission signal This hypothesis needs to be backed by proper plasma modelling or time
and spatial resolved plasma detection as it depends very strongly on the properties that
influence the plasma formation ie laser pulse energy pulse duration ambient gas
acquisition gate time etc These parameters need to be accurately detailed to ensure the
reproducibility of the experimental results
43 INTRODUCTION TO CF-LIBS LIBS has the ability to detect the elements present in a sample sometimes at a ppm level
with little or no sample preparation required Other techniques such as ICP-MS have this
ability as well but need time for sample preparation often required to be dissolved into a
liquid state Their main advantage over the LIBS technique is their precision at
quantifying the element concentrations The task of rendering LIBS capable of somewhat
similar quantitative measurements is undergoing
Quantitative analysis can be done in several ways [54] One method to determine the
concentration of each element independently is through the emission lines of accurately
known transition probabilities followed by absolute measurements of the integrated
intensities Another way would be to compare the elemental emission lines relative to the
most abundant element in the sample This method only requires the ratios of the
transition probability of the emission lines Of course as with all information attained
43
from the spectra a greater number of lines provide better results Therefore to increase
the accuracy of these methods a well calibrated broad band spectrum is required
An approach widely used compares the spectra intensity lines with known calibration
standards ie calibration curves As long as the properties of the sample being analysed
and the standard sample matrices are similar this method can be very practical The result
of the matrix effect can be observed when comparing two known identical concentrations
of an element It would be expected to see identical emission intensities but this can be
distorted due to the matrix effect The sensitivity of the measurements are sensitively
dependant on the laser-matter interaction this includes the matrix effects
The use of calibration curves when possible provides promising results when dealing with
homogenous samples ie constant matrix effect [54] However as the sample gets more
complicated for example organic samples the calibration curves are not always easy to
create The notion of a reference sample where all the element concentrations are already
known for polymers can be accepted A problem arises when dealing with more
complicated samples such as vegetables or soil How can one create a reference sample
for an inhomogeneous sample or a sample with unknown matrix Add to this the
complications of varying matrix effects associated to the local in homogeneity of such
samples In this case the reproducibility of LIBS is therefore reduced and the errors
associated with the measurement increase drastically Construction of a calibration curve
is highly complicated and nearly impossible
The notion of Calibration-Free LIBS (CF-LIBS) was proposed by Ciucci et al [55] Such
procedure can in the ideal case provide solution for inhomogeneous sample or those with
unknown matrix The idea behind this method was to go around these matrix effects by
making each measurement self consistent ie avoid the need to compare it with
calibration curves For this method works these are three requirements for the ablation
and the resulted plasma [54]
Stoichiometric ablation
Plasma must be in LTE
Optically thin plasma
44
The last two requirements have already been discussed previously Stoichiometric
ablation means that the composition of the ablated mass is representative of that of the
sample This is the basis of LIBS and other laser ablation techniques in general This
allows to characterize the sample analyzed using the light emitted from the plasma Russo
and al mentioned in their paper in 1991 [56] that stoichiometric ablation existed for laser
power densities greater than 109 119882119888119898sup2 a condition generally satisfied for nanosecond
or shorter duration pulse ablation Borisov and al [57] stated that the degree of
stoichiometric ablation was reduced when the crater depth increased He put forth two
hypotheses for this statement The first imagined that the geometric factors reduced the
power density and the second consisted of shielding and thermal variations within the
crater
Elemental fractionation of the sample was observed with longer laser pulses [2]
Femtosecond ablation reduced this problem and showed an increase in the ablation
efficiency Russo et al 2002 [58] performed nanosecond and femtosecond ablation on
glass samples and did not come to the same conclusion They believed that the pulse
duration alone was not enough to account for fractionation The generated plasma and the
shockwave induced with the plasma could influence it as well The mass removal depends
on the heat conduction of the laser pulse within the sample as well as the recoil pressure
which is a consequence of the shockwaves Shockwaves present in femtosecond laser
ablation are due to the high velocity of the ejected mass
For the CF-LIBS calculations the use of the Boltzmann plot method was first used
(includes the total plasma number density and volume and the experimental geometry)
[54]
119868120484120485 = 119865 119862119904 119860119894119895 119892119894 119890119909119901 minus
119864119894119896119861119879
119880119904(119879) (131)
With 119868120484120485 measured integral line intensity (counts) CS concentration of the emitting species S US(T) partition function of the emitting species F optical efficiency of the collection system
45
Equation (132) requires information either protruding from spectral databases or directly
from the experimental category
Aij gi Eij US (T) rarr spectral database
F CS T rarr experimental data
If 119910 119909119898 119886119899119889 119902119904 are introduced as the following
119910 = 119897119899 119868119894119895
119892119894 119860119894119895 (132)
119909 = 119864119894 (133)
119898 = minus1119896119861119879
(134)
119902119878 = ln 119862119878 119865119880119904(119879) (135)
The Boltzmann equation can be written simply in the form
119910 = 119898119909 + 119902119878 (136)
Where 119898 is associated with the temperature of the plasma and 119902119878 is associated with the
concentration of the emitting species 119878 One spectral line emission produces one point on
the Boltzmann plot diagram This way all the emitting species can be represented in one
diagram If the condition of LTE is fulfilled and the lines are carefully selected to avoid
self-absorption each emitting species should align on parallel lines The same
temperature means the same slope 119898 for all elements These calculations require that the
spectral data contain
At least 2 emission lines from the same species to determine the electronic
temperature
At least 1 emission line with known spectroscopic parameters to calculate the
electronic density
46
The y-intercept given by 119902119878 of each line is proportional to the natural logarithm of its
concentration Once the electronic temperature is calculated the concentration of species
of the corresponding element which sums up the concentrations of both the neutral and
single ionised atoms can be determined The F parameter creates a bit of a problem but is
solved by using the normalisation relation if an internal standard is not known
119862119890 = 1119890
(137)
where the sum of the total element concentration should be 1 Even if in theory this
method can provide very accurate results the LIBS measurements with CF-LIBS are only
at best 3-5 experimentally reproducible [59] and the errors associated with the
probability transitions can go from 10-30 [54] If more spectral lines were used this
could average out the uncertainties linked with the probability transitions and provide
more accurate line plots
Initially CF-LIBS introduced by Ciucci [54] excluded self-absorbed lines However it is
possible to include these lines by using a recursive method This means the use of more
points (more spectral lines) for even more accurate information This method predicts the
intensity of the self-absorbed line The scattering around the best fit line can be reduced
putting forth evidence that it is mainly due to self-absorption effects and not experimental
errors fitting errors or even uncertainties related to transition probabilities
47
5 CONCLUSION
The emission line intensities depend on the plasma properties that are influenced by the
ablation laser pulse (wavelength pulse duration pulse energy) the sample (matrix
effects inhomogeneities) and the ambient gas (vacuum inert air and the pressure) It can
also be related back to the concentration of the elements present within the plasma A
detailed understanding of the laser-induced plasma is the basis of high quality quantitative
measurements with LIBS A thorough knowledge on evaporation ejection of particles
hydrodynamic explosion shock waves plasma initiation and expansion not to forget the
laser-plasma interaction is needed All these parameters can influence the amount and the
composition of the ablated mass
In the following chapters of this thesis we will present the study of such parameters for
the ablation of different polymer samples First we study the plasma formation and
expansion by shadowgraphic measurements under different ablation regimes This is
followed by time-resolved analysis of the spectroscopic plasma emission for the
optimisation of experimental acquisition parameters (local thermodynamic equilibrium
signal-to-noise ratio acquisition gate width etc) We are interested in CF-LIBS because it
is the only method that allows a direct analysis without the use of calibration curves
Before applying this method however certain notions and understanding of the physics
behind the induced plasma especially for organic substances is needed Therefore the
last chapter has for aim to classify and identify various polymers through different
multivariate analysis techniques It emphasises that the work in this thesis is more
qualitative than quantitative The aim behind this reasoning is to be able find an
application for the industrial sorting of plastics with what we already know today In the
future we hope that the additional information presented here of plasmas induced on
polymers will allow us the ability to use calibration free methods to provide more precise
quantitative measurements
48
References
[1] M Baudelet Proprieacuteteacutes physico-chimique du plasma induit par laser en regime nanoseconde et femtoseconde PhD Thesis Universiteacute Claude Bernard-Lyon 1 2007
[2] RE Russo XL Mao JH Yoo and JJ Gonzalez Laser Ablation Laser InducedBreakdown Spectroscopy Elsevier Science Amsterdam Netherlands 2007
[3] A Bogaerts Z Chen R Gijbels A Vertes Laser ablation of copper in different background gases comparative study by numerical modelling and experiments Journal of Analytical Atomic Spectrometry 21 384ndash395 2006
[4] M Capitelli A Casavola G Colonna A De Giacomo Laser-induced plasma expansion theoretical and experimental aspects Spectrochimica Acta Part B 59(2004) 271ndash289
[5] BN Chichkov C Momma S Nolte F yon Alvensleben A Tiinnermann Femtosecond picosecond and nanosecond laser ablation of solids Applied Physics A63 109 (1996)
[6] S Amoruso Modeling of UV pulsed-laser ablation of metallic targets Applied Physics A 69 323ndash332 1999
[7] S Amoruso R Bruzzese N Spinelli and R Velotta Characterization of laser ablation plasmas Journal of physics B 32 R131ndashR172 1999
[8] VN Rai SN Thakur Physics of Plasma in Laser-Induced Breakdown Spectroscopy Laser Induced Breakdown Spectroscopy Elsevier Science Amsterdam Netherlands 2007
[9] S Siano Principles of Laser Cleaning in Conservation Handbook on the Use of Lasers in Conservation and Conservation Science 2007
[10] DA Cremers and LJ Radziemski Handbook of Laser-Induced Breakdown Spectroscopy 2006
[11] B J Garrison and R Srinivasan Laser ablation of organic polymers microscopic models for photochemical and thermal processes Journal of Applied Physics 57 2909 (1985)
[12] H Schmidt J Ihlemann B Wolff-Rottke K Luther and J Troe Ultraviolet laser ablation of polymers spot size pulse duration and plume attenuation effects explained J Appl Phys 83 5458 (1998)
[13] T Lippert M Hauer CR Phipps Fundamentals and applications of polymers designed for laser ablation Appl Phys A 77 259ndash264 (2003)
[14] R Srinivasan B Braren RW Dreyfus L Hadel and DE Seeger Mechanism of the ultraviolet laser ablation of polymethylmethacrylate at 193 and 248 nm
49
laser-induced fluorescence analysis chemical analysis and doping studies Journal of the Optical Society of America B 3785ndash791 1986
[15] M Hashida H Mishima S Tokita and S Sakabe Non-thermal ablation of expanded polytetrafluoroethylene with an intense femtosecond-pulse laser Optics Express Vol17 Issue 15 pp 13116-13121 2009
[16] QWang P Jander C Fricke-Begemann R Noll Comparison of 1064 nm and 266 nm excitation of laser-induced plasmas for several types of plastics and one explosive Spectrochimica Acta Part B 63 1011ndash1015 (2008)
[17] R Srinivasan B Braren KG Casey and M Yeh Ultrafast imaging of ultraviolet laser ablation and etching of polymethylmethacrylate Applied Physics Letters 55 (26)2790ndash2791 1989
[18] A Semerok C Chaleacuteard V Detalle J-L Lacour P Mauchien P Meynadier C Nouvellon B Salleacute P Palianov M Perdrix and G Petite Experimental investigations of laser ablation efficiency of pure metals with femto pico and nanosecond pulses Applied Surface Science 138ndash139311ndash 314 1999
[19] YG Yingling B J Garrison Photochemical ablation of organic solids NuclearInstruments and Methods in Physics Research B 202 188ndash194 (2003)
[20] Sci-Tech Encyclopaedia McGraw-Hill Encyclopaedia of Science and Technology 5thedition The McGraw-Hill Companies Inc
[21] SS Mao F Queacutereacute S Guizard X Mao RE Russo G Petite and P Martin Dynamics of femtosecond laser interactions with dielectrics Appl Phys A 79 1695ndash1709 2004
[22] JM Vadillo and J J Laserna Laser-induced plasma spectrometry truly asurface analytical tool Spectrochimica Acta Part B 59147ndash161 2003
[23] M Corsi G Cristoforetti M Hidalgo D Iriarte S Legnaioli V Palleschi A Salvetti and E Tognoni Temporal and spatial evolution of a laser induced plasma from a steel target Applied Spectroscopy Volume 57 Issue 6 Pages 187A-198A and 591-727 (2002) pp 715-721(7)
[24] AW Miziolek V Palleschi and I Schechter Laser Induced Breakdown Spectroscopy (LIBS) fundamentals and applications Cambridge University Press Cambridge UK (2006)
[25] RD Cowan and GH Dieke Self-Absorption of Spectrum Lines Reviews of Modern Physics Vol 20 Number 2 1948
[26] C Aragoacuten JA Aguilera Characterization of laser induced plasmas by optical emission spectroscopy A review of experiments and methods Spectrochimica Acta Part B 63 (2008) 893ndash916
[27] V Motto-Ros AS Koujelev GR Osinski AE Dudelzak Quantitative multi-elemental laser-induced breakdown spectroscopy using artificial neural networks Journal of the European Optical Society - Rapid Publications 3 08011 (2008)
50
[28] SS Harilal CV Bindhu MS Tillack F Najmabadi and AC Gaeris Internal structure and expansion dynamics of laser ablation plumes into ambient gases Journal of applied physics volume 93 number 5 2003
[29] V Margetic A Pakulev A Stockhaus M Bolshov K Niemax R Hergenroumlder A comparison of nanosecond and femtosecond laser-induced plasma spectroscopy of brass samples Spectrochimica Acta Part B 55_20001771]1785
[30] G Cristoforetti G Lorenzetti S Legnaioli V Palleschi Investigation on the role of air in the dynamical evolution and thermodynamic state of a laser-induced aluminium plasma by spatial- and time-resolved spectroscopy Spectrochimica Acta Part BArticle in Press 2010
[31] Q L Ma V Motto-Ros W Q Lei M Boueri X S Bai L J Zheng H P Zeng and J Yu Temporal and spatial dynamics of laser-induced aluminum plasma in argon background at atmospheric pressure interplay with the ambient gas Accepted Spectrochimica Acta Part B 2010
[32] HR Griem Spectral Line Broadening by Plasmas Academic Press New York and London 1974
[33] E Tognoni G Cristoforetti S Legnaioli V Palleschi A Salvetti M Mueller U Panne I Gornushkin A numerical study of expected accuracy and precision in Calibration-Free Laser-Induced Breakdown Spectroscopy in the assumption of ideal analytical plasma Spectrochimica Acta Part B 62 1287ndash1302 (2007)
[34] J Ashkenazy R Kipper and M Caner Spectroscopic measurements of electron density of capillary plasma based of Stark broadening of hydrogen lines V43 N10Physical Review A 1991
[35] AM El Sherbini H Hegazy ThM El Sherbini Measurement of electron density utilizing the Hα-line from laser produced plasma in air Spectrochimica Acta Part B 61(2006) 532ndash539
[36] NM Shaikh B Rashid S Hafeez Y Jamil and MA Baig Measurement of electron density and temperature of a laser-induced zinc plasma J Phys D Applied Physics 39 (2006) 1384ndash1391
[37] W Lei V Motto-Ros M Boueri Q Ma D Zhang L Zheng H Zeng J Yu Time resolved characterization of laser-induced plasma from fresh potatoes Spectrochimica Acta Part B 64 (2009) 891ndash898
[38] CA Bye and A Scheeline Saha-Boltzmann Statistics for Determination of Electron Temperature and Density in Spark Discharges Using an EchelleCCD System Applied Spectroscopy Volume 47 Number 12 1993
[39] J L Throne Plastic Process Engineering Man Dekker New York (1979)
[40] C Gauthier Deacuteveloppement de la technique de la double impulsion laser pour ameacuteliorer les performances analytiques de lrsquoablation laser coupleacutee agrave la
51
spectromeacutetrie drsquoeacutemission optique (ALSEO) sur solides Applications nucleacuteaires Universiteacute Henri Poincareacute ndash Nancy I 2005
[41] B C Castle K Visser B W Smith and J D Winefordner Level populations in a laser-induced plasma on a lead target Spectrochimica Acta Part B 52 1995ndash2009 1997
[42] SS Harilal Riju C Issac CV Bindhu Pramod Gopinath VPN Nampoori CPG Vallabhan Time resolved study of CN band emission from plasma generated by laser irradiation of graphite Spectrochimica Acta Part A 53 (1997) 1527-1536
[43] O Bartheacutelemy J Margot M Chaker M Sabsabi F Vidal T W Johnston S Laville and B Le Drogoff Influence of the laser parameters on the space and time characteristics of an aluminum laser-induced plasma Spectrochimica Acta Part B 60905ndash914 2005
[44] O Bartheacutelemy J Margot S Laville F Vidal M Chaker B Le Drogoff TW Johnston and M Sabsabi Investigation of the state of local thermodynamic equilibrium of a laser-produced aluminum plasma Applied Spectroscopy 59 (2005) pp 529ndash536
[45] N Omenetto EMSLIBS TALK Rome 2009
[46] U Panne C Haisch M Clara R Niessner Analysis of glass and glass melts during the vitrification process of fly and bottom ashes by laser-induced plasma spectroscopy Part I Normalization and plasma diagnostics Spectrochimica Acta Part B 53 (1998) 1957ndash1968
[47] MC Quintero A Rodero MC Garcia and A Sola Determination of the Excitation Temperature in a Nonthermodynamic-Equilibrium High-Pressure Helium Microwave Plasma Torch Applied Spectroscopy 51 202A-205A and 765-911 (1997)
[48] JB Simeonsson and AW Miziolek Time-resolved emission studies of ArF-laser produced micro-plasmas Vol 32 No 6 APPLIED OPTICS 1993
[49] M Milaacuten and JJ Laserna Diagnostics of silicon plasmas produced by visible nanosecond laser ablation Spectrochimica Acta Part B 56 (2001) pp 275ndash288
[50] G Cristoforetti A De Giacomo M DellAglio S Legnaioli E Tognoni V Palleschi and N Omenetto Local Thermodynamic Equilibrium in Laser-Induced Breakdown Spectroscopy Beyond the McWhirter criterion Spectrochimica Acta Part B 65(2010) 86-95
[51] J Hermann C Boulmer-Leborgne B Dubreuil and IN Mihailescu Influence of irradiation conditions on plasma evolution in laserndashsurface interaction J Appl Phys 74 (1993) pp 3071ndash3079
52
[52] DA Rusak BC Castle BW Smith JD Winefordner Recent trends and the future of laser induced plasma spectroscopy Trends in analytical chemistry vol 17 nos 8+9 1998
[53] JF Ready Effects of High-Power Laser Radiation (Academic New York 1971)
[54] E Tognoni V Palleschi M Corsi G Cristoforetti N Omenetto I Gornushkin B W Smith and J D Winefordner From sample to signal in laser-induced breakdown spectroscopy a complex route to quantitative analysis Laser Induced Breakdown Spectroscopy (LIBS) fundamentals and applications Cambridge University Press Cambridge UK (2006)
[55] A Ciucci M Corsi V Palleschi S Rastelli A Salvetti and E Tognoni New procedure for quantitative elemental analysis by laser-induced plasma spectroscopy Applied Spectroscopy 53 960 1999
[56] WT Chan and RE Russo Study of laserndashmaterial interactions using inductively coupled plasma-atomic emission spectrometry Spectrochimica Acta Part B 46 (1991) pp 1471ndash1486
[57] OV Borisov XL Mao and RE Russo Effects of crater development on fractionation and signal intensity during laser ablation inductively coupled plasma mass spectrometry Spectrochimica Acta Part B Atomic Spectroscopy Volume 55 Issue 11 2000 1693-1704
[58] RE Russo X Mao JJ Gonzalez and SS Mao Femtosecond laser ablation ICP-MS Journal of Analytical Atomic Spectrometry 17 1072ndash1075 2002
[59] DellrsquoAglio M De Giacomo A Gaudiuso R De Pascale O Senesi GS Longo S Laser induced breakdown spectroscopy applications to meteorites chemical analysis and composition profiles Geochimica et Cosmochimica Acta (2010) doi 101016jgca201009018
3
treatment strategy was then developed to get the most significant information for sample
classification and identification Once the ensemble of the experimental procedure was
optimised including spectrum acquisition and data treatment a range of plastic materials
with practical application interests was analysed The obtained results indicate the actual
performance of the method and the further development directions needed to meet the
needs of real industrial standards
The presentation of this thesis is structured in the following way The first chapter is
dedicated to recalling the theoretical basis of laser-induced plasma and that of its
diagnostics with the emission spectroscopy In chapter 2 the early stage expansion of the
plasma has been investigated using the technique of time-resolved shadowgraph This
study allowed us to justify our wavelength and laser choices for further analytical
application of laser ablation of polymeric materials Chapter 3 presents the time-resolved
spectroscopic measurements that allowed us to observe the evolution of the plasma as a
function of the time delay after laser impact on the sample surface The plasma
parameters such as the electron density and temperature are extracted for the assessment
of the local thermodynamic equilibrium (LTE) of the plasma They are also used to define
a suitable detection window with an optimal signal-to-noise ratio Chapter 4 represents an
important part of this thesis A classification and identification procedure was developed
for polymeric materials by combining LIBS and data treatment with the artificial neural
networks (ANN) Our results put forth the potential of the LIBS technique to provide fast
and reliable classification and identification of plastics The industry of plastics waste
sorting and recycling could use this technique to complement and improve the already
existing near infra-red spectroscopy technique for such applications After a general
conclusion we shall finish this manuscript by underlining the perspectives opened by the
results obtained during the course of this work
4
[1] TH Maiman Stimulated optical radiation in ruby Nature 187 (1960) 493-494
[2] LJ Radziemski From LASER to LIBS the path of technology development Spectrochim Acta Part B 57 (2002) 1109ndash1113
[3] F Brech L Cross Opticalmicroemission stimulated by a ruby laser Appl Spectrosc 16 (1962) 59
[4] J Debras-Gueacutedon N Liodec De lrsquoutilisation du faisceau drsquoun amplificateur agrave ondes lumineuses par eacutemission induite de rayonnement (laser agrave rubis) comme source eacutenergeacutetique pour lrsquoexcitation des spectres drsquoeacutemission des eacuteleacutements CR Acad Sci 257 (1963) 3336
[5] PD Maker RW Terhune CM Savage Optical third harmonic generation Proceedings of Third International Conference on Quantum Electronics Paris Columbia University Press New York Vol 2 (1964) 1559
[6] M Young M Hercher C-Y Yu Some characteristics of laser-induced air sparks J Appl Phys 37 (1966) 4938ndash4940
[7] David A Cremers Leon J Radziemski and Thomas R Loree Spectrochemical Analysis of Liquids Using the Laser Spark Applied Spectroscopy 38 (1984) 721-729
[8] J R Wachter D A Cremers Determination of Uranium in Solution Using Laser-Induced Breakdown Spectroscopy Applied Spectroscopy 41 (1987) 1042-1048
[9] H A Archontaki and S R Crouch Evaluation of an Isolated Droplet Sample Introduction System for Laser-Induced Breakdown Spectroscopy Applied Spectroscopy 42 (1988) 741-746
[10] A Felske W-D Hagenah K Laqua Uber einige Erfahrungen bei der Makrospektralanalyse mit Laserlichtquellen I Durchschnittanalyse metallischer Proben Spectrochim Acta Part B 27 (1972) 1
[11] LJ Radziemski TR Loree Laser-induced breakdown spectroscopy time-resolved applications J Plasma Chem Plasma Proc 1 (1981) 281ndash293
[12] DA Cremers LJ Radziemski Detection of chlorine and fluorine in air by laser-induced breakdown spectrometry Anal Chem 55 (1983) 1252ndash1256
[13] LJ Radziemski DA Cremers TR Loree Detection of beryllium by laser-induced breakdown spectroscopy Spectrochim Acta Part B 38 (1983) 349ndash355
[14] DA Cremers LJ Radziemski Direct detection of beryllium on filters using the laser spark Appl Spectrosc 39 (1985) 57ndash63
[15] R Wisbrun I Schechter R Niessner H Schroeder and K L Kompa Detector for trace elemental analysis of solid environmental samples by laser plasma spectroscopy Anal Chem 66 (1994) 2964-2975
[16] A Ciucci V Palleschi S Rastelli et al Trace pollutions analysis in a soil by a time-resolved laser-induced breakdown spectroscopy technique Appl Phys B ndash Las Opt 63 (1996) 185-190
[17] I B Gornushikin J I Kim B W Smith S A Baker and Winefordner Determination of cobalt in soil steel and graphite using excited-state laser fluorescence induced in a laser spark Appl Spectrosc 51 (1997) 1055-1059
5
[18] F Hilbk-Kortenbruck R Noll P Wintjens H Falk and C Becker Analysis of heavy metals in soils using laser-induced breakdown spectroscopy combined with laser-induced fluorescence Spectrochem Acta B 56 (2001) 933-945
[19] C Aragon JA Aguilera J Campos Determination of carbon content in molten steel using laser-induced breakdown spectroscopy Appl Spectrosc 47 (1993) 606ndash608
[20] JA Aguilera C Aragon J Campos Determination of carbon content in steel using laser-induced breakdown spectroscopy Appl Spectrosc 46 (1992) 1382ndash1387
[21] M Sabsabi P Cielo Quantitative analysis of aluminium alloys by laser-induced breakdown spectroscopy and plasma characterization Appl Spectrosc 49 (1995) 499ndash507
[22] R Sattmann I Moumlnch H Krause R Noll S Couris A Hatziapostolou A Mavromanolakis C Fotakis E Larrauri and R Miguel Laser-induced breakdown spectroscopy for polymer identification Appl Spectroscopy 52 (1998) 456-461
[23] I Moumlnch R Noll R Buchholz and J Worringer Laser identifies steel grades Stainless Steel World 12 (2000) 25-29
[24] H Fink U Panne and R Niessner Analysis of recycled thermoplastics from consumer electronics by laser-induced plasma spectroscopy Anal Chem Acta 440 (2001) 17-25
[25] D Anglos Laser-Induced Breakdown Spectroscopy in Art and Archaeology Applied Spectroscopy 55 (2001) 186A-205A
[26] L Burgio K Melessanaki M Doulgeridis R J H Clark and D Anglos Pigment identification in paintings employing laser induced breakdown spectroscopy and Raman microscopy Spectrochimica Acta Part B56 (2001) 905-913
[27] M Bicchieri M Nardone PA Russo A Sodo M Corsi G Cristoforetti V Palleschi A Salvetti E Tognoni Characterization of azurite and lazurite based pigments by laser induced breakdown spectroscopy and micro-Raman spectroscopy Spectrochimica Acta Part B56 (2001) 905-913
[28] F Colao R Fantoni V Lazic and V Spizzichino Laser-induced breakdown spectroscopy for semi-quantitative and quantitative analyses of artworks-application on multi-layered ceramics and copper based alloys Spectrochim Acta Part B 31 (2002)1219-1234
[29] V Detalle Q Glorieux R Bruder D LHermite A Semerok La spectroscopie deacutemission optique sur plasma induit par laser (LIBS) Un nouvel outil analytique pour leacutetude in situ de la peinture murale et des polychromies = Laser induced breakdown spectroscopy (LIBS) a new analytical technique for in situ study of painted artworks L Actualiteacute chimique no312-13 (2007) 98-104
[30] J Hybl G Lithgow and S G Buckley Appl Spectrosc Laser-Induced Breakdown Spectroscopy Detection and Classification of Biological Aerosols 57 (2003) 1207-1215
[31] A C Samuels F C De Lucia Jr K L McNesby and A W Miziolek Appl Opt Laser-induced breakdown spectroscopy of bacterial spores molds pollens and protein initial studies of discrimination potential 42 (2003) 6205-6209
6
[32] S Morel N Leon P Adam and J Amouroux Appl Opt Detection of bacteria by time-resolved laser-induced breakdown spectroscopy 42 (2003) 6184-6191
[33] C A Munson F C De Lucia Jr T Piehler K L McNesby and A W Miziolek Investigation of statistics strategies for improving the discriminating power of laser-induced breakdown spectroscopy for chemical and biological warfare agent simulants Spectrochim Acta Part B 60 (2005) 1217-1224
[34] Matthieu Baudelet Laurent Guyon Jin Yu Jean-Pierre Wolf Tanguy Amodeo Emeric Freacutejafon Patrick Laloi Spectral signature of native CN bonds for bacterium detection and identification using femtosecond laser-induced breakdown spectroscopy Appl Phys Lett 88 (2006) 063901
[35] Matthieu Baudelet Laurent Guyon Jin Yu Jean-Pierre Wolf Tanguy Amodeo Emeric Freacutejafon Patrick Laloi Femtosecond time resolved laser-induced breakdown spectroscopy for detection and identification of bacteria a comparison to the nanosecond regime J Appl Phys 99 (2006) 084701
[36] Matthieu Baudelet Jin Yu Myriam Bossu Julien Jovelet and Jean-Pierre Wolf Tanguy Amodeo and Emeric Freacutejafon Patrick Laloi Discrimination of microbiological samples using femtosecond laser-induced breakdown spectroscopy Appl Phys Lett 89 (2006) 163903
[37] Russell SHarmon FrankCDeLucia Jr Aaron LaPointe Raymond JWinkel Jr Andrzej W Miziolek LIBS for landmine detection and discrimination Anal Bioanal Chem 385 (2006) 1140ndash1148
[38] Frank C De Lucia Jr Russell S Harmon Kevin L McNesby Raymon J Wonkel Jr Andrzej W Miziolek Laser-induced breakdown spectroscopy analysis of energetic materials Appl Opt 42 (2003) 6148ndash6152
[39] Alexander Portnov Salman Rosenwaks Ilana Bar Emission following laser-induced breakdown spectroscopy of organic compounds in ambient air Appl Opt 42 (2003) 2835ndash2842
[40] Cristina Lopez-Moreno Sandiago Palanco J Javier Laserna Frank DeLucia Jr Andrzej Miziolek Jeremy Rose Roy A Walter Andrew I Whitehouse Test of stand-off laser-induced breakdown spectroscopy sensor for the detection of explosive residual on solid surface J Anal At Spectrom 21 (2006) 55ndash60
[41] C M Davies H H Telle and A W Williams Remote in situ analytical spectroscopy and its applications in the nuclear industry Fresenius Journal of Analytical Chemistry 355 (1996)
[42] A I Whitehouse J Young I M Botheroyd S Lawson C P Evans and J Wright Remote material analysis of nuclear power station steam generator tubes by laser-induced breakdown spectroscopy Spectrochimica Acta B 56 (2001) 821-830
[43] Laurent Salmon Analyse LIBS en milieu nucleacuteaire talk in Journeacutees LIBS Mai 18-19 2009 Bordeaux France
[44] CB Dreyer G S Mungas P Thanh and JG Radziszewski Study of Sub-mJ-Excited Laser Induced Plasma Combined with Raman Spectroscopy under Mars Atmosphere-Simulated Conditions Spectrochimica Acta B 62 (2007) 19
7
[45] GS Mungas CB Dreyer AJ Bauer Elemental Abundance Measurement using Micro-LIBS for Space Exploration Lunar and Planetary Science Conference XXXX 2264 (2009)
[46] Andrew K Knight Nancy L Scherbarth David A Cremers and Monty J Ferris Characterization of Laser-Induced Breakdown Spectroscopy (LIBS) for Application to Space Exploration Appl Spectrosc 54 (2000) 331-340
[47] F Colao R Fantoni V Lazic A Paolini F Fabbri GG Ori L Marinangeli A Baliva Investigation of LIBS feasibility for in situ planetary exploration An analysis on Martian rock analogues Planetary and Space Science 52 (2004) 117 ndash 123
[48] Beacuteatrice Salleacute David A Cremer Sylvestre Maurice Roger C Wens Laser-induced breakdown spectroscopy for space exploration applications Influence of the ambient pressure on the calibration curves prepared from soil and clay samples Spectrochimica Acta B 60 (2005) 479-490
[49] Jean-Baptiste Sirven Beacuteatrice Salleacute Patrick Mauchien Jean-Luc Lacour Sylvestre Maurice and Geacuterard Manhegraves Feasibility study of rock identification at the surface of Mars by remote laser-induced breakdown spectroscopy and three chemometric methods J Anal At Spectrom 22 (2007) 1471ndash1480
[50] Patrick Mauchien Jean-luc Lacour Beacuteatrice Salleacute Laurent Salmon Lanalyse chimique des roches martiennes Clefs CEA no54 (2006) 73-77
8
9
CHAPTER I THEORETICAL BASIS
1 INTRODUCTION Laser ablation of metals has been the subject of a large number of studies leading to a lot
of published results when compared with organic samples [1] The ablation of metals
remains easier to understand when compared to organic substances which add more
complications to the mechanism of plasma generation This is especially true when we
consider metallic elements in an organic matrix Due to different absorption properties
the laser interaction with organic and with metallic samples differs putting forth even
further discrepancies of the plasma properties ie non stoichiometric ablation because of
the large difference between their ionisation potentials To improve the understanding of
the laser ablation of polymers we decided to study simple polymer samples such as
Nylon or PVC
10
In this chapter we wish to recall briefly the basic fundamentals that we used in our
understanding of the laser-induced plasma and the spectroscopy of plasmas induced from
polymeric materials Many parameters can influence the plasma properties but we shall
first begin with the main differences between the plasma generations with femtosecond or
nanosecond laser pulses A further emphasis will be made between UV and IR
nanosecond laser pulses After briefly discussing the plasma formation we shall evoke
our methods for plasma diagnostics (electronic density and temperature calculations) The
spectral emission is used to calculate the electronic density (mainly Stark broadening) and
the different plasma temperatures (atomic ionic and molecular) These measurements
will allow us to assess the local thermal equilibrium (LTE) of the plasma An introduction
of calibration free LIBS (CF-LIBS) finishes off this chapter even if we still have not used
this method of analysis in this thesis The advantages associated with this technique have
greatly attracted us and we would like to implement it in our further works
2 PLASMA GENERATION The mechanisms involved in the ablation depend on a number of variables that effect the
interaction between the laser pulse and the sample target Firstly the properties of laser
pulses can lead to different interaction regimes with regards to the pulse duration the
wavelength and the fluence of the pulses Secondly the target (can be in a solid liquid or
gas form) and its properties also influence the ablation due to its specific laser absorption
mechanism and matrix effects Lastly the surrounding atmosphere during ablation such
as the pressure and the ambient gas (inert air vacuum etc) will also influence the plasma
generation and its expansion The main differences between nanosecond and femtosecond
laser ablation will be evoked here followed by the main mechanisms in which a plasma is
formed
Laser ablation consists of focalising an intense laser emission on a sample and removing
matter from the surface For a LIBS measurement a focalising lens directs and
concentrates the laser pulse energy on the surface of the material of interest For this
reason we shall often talk in terms of the pertinent factors which are the fluence (often
expressed in 119869 frasl 119888119898sup2) or the irradiance (often expressed in 119866119882 frasl 119888119898sup2 ) They allow us to
take into account the size of the section of the focalised beam and the laser pulse duration
11
respectively In order to generate a plasma the irradiance must be greater than what is
called the ablation threshold 119868119905ℎ (or a fluence greater than 119865119905ℎ) As a consequence the
locally removed mass exhibits rapid melting and evaporation to form a vapour This
vaporised mass is exploded out of the material at a supersonic velocity However only
when the vapour is sufficiently ionised can it be then called a plasma [2] We can note at
this point that our experimental research was conducted so that the laser fluence was
always above the threshold value to ensure the plasma generation
21 LASER-MATTER INTERACTION
The practical reason for which we would like to go into the further detail of the
fundamentals of the laser-matter interaction is because it will enable us to define the
appropriate optimisation of our LIBS experimental parameters For us this means finding
the parameters where we are able to acquire the most significant results As already
discussed the pulse duration has a significant impact on the ablation process In the
nanosecond regime there is a significant interaction between the laser emission and the
ablated material In the femtosecond regime the laser pulse does not directly interact with
the generated plasma This laser-plasma interaction therefore drastically influences the
plasma properties We shall start by discussing the nanosecond regime (in UV and IR)
then the femtosecond regime
211 Nanosecond Ablation
The most common type of laser used in LIBS is the nanosecond NdYAG which can
provide pulse in different wavelengths ranging from UV to IR Nanosecond lasers emit
pulses long enough (around 5 ns FWHM in our case) their ldquotailrdquo remains present during
plasma formation and expansion This leads to a significant post-ablation interaction
between them ie the laser energy continues to be absorbed by the vapour The laser
energy can be absorbed by atoms or molecules leading to their excitation or even their
ionisation [3] The laser energy can also be absorbed by free electrons leading to their
heating and the cascade ionisations due to subsequent collisions between electrons and
atoms or molecules The initial temperatures can be very high (6000 ndash 20000 K) with
high electron densities (1017 minus 1019 cmminus3) [4] The energy loss and cooling of the
12
electrons is mainly due to the thermal propagation into the target [5] The heat
propagation diffuses a few microns into the target causing it to melt in a non-
homogenous way creating craters with messy borders
Depending on the irradiance and the wavelength of the pulse the ablation mechanisms
can be either dominated by thermal (melting sublimation and vaporisation) or non-
thermal (direct molecular bond breaking) processes We will focus on laser irradiances
greater than 108 Wcmsup2 to create plasmas with high enough temperatures to ensure the
atomic excitation and ionisation of the metallic elements present in certain polymers The
subsequent laser-plasma interaction enables even further heating of the free electrons
within the plasma
The photon absorption in a plasma is mainly due to inverse Bremsstrahlung (IB) and
photoionisation (PI) processes since the other absorption mechanisms have smaller cross
sections and are ignored at this laser intensity [467] The consequence of IB is higher
temperature of electrons These excited electrons in turn collide with neighbouring ions or
neutral atoms more violently causing the liberation of other electrons and in turn ionising
more atoms This phenomenon is known as avalanche ionisation As long as the
electromagnetic field of the laser remains in interaction with the electrons this process
will repeat itself increasing the ionisation degree of the plasma [2] The cross sections of
the collisions between electrons-ions are much greater than those between electron-
neutrals
The inverse Bremsstrahlung (IB) absorption 120572119868119861(119888119898minus1) is approximately proportional to
1205823 as can be seen in Equation (11) The second part of the right hand side accounts for
the simulated emission [2 3]
13
120572119868119861 = 1198761198731198901198730 + 4 1198906 1205823 119873119890 119885sup2 119873119894
3 ℎ 1198884 119898119890
21205873 119898119890 119896119861 119879119890
12 1 minus 119890119909119901 minus
ℎ 119888120582 119896119861 119879119890
(11)
With 120572119868119861 inverse Bremsstrahlung absorption coefficient (119888119898minus1) 119876 cross section for electron-photon absorption (1198881198982) 119873119890 electron density (119888119898minus3) 1198730 neutral atom density (119888119898minus3) 120582 ablation wavelength (cm) 119885 ion charge (1 or 0) 119873119894 ion density (119888119898minus3) 119888 speed of light (119888119898119904) ℎ Plankrsquos constant (eV s) 119898119890 electron mass (119872119890119881119888sup2) kB Boltzmanns constant (eVK) T excitation temperature (K) e elementary charge
Another photon absorption process that initiates the plasma formation by producing more
free electrons is photoionisation Photoionisation is defined as the ionisation of an atom or
a molecule by a single or several photons that have a sufficient amount of energy to
directly eject an electron out of the atom or molecule When the combination of a few
photons is required the process is called multiphoton ionisation (MPI) The energy
associated to a photon is defined in Equation (12) and is inversely proportional to 120582 This
indicates that UV radiation will therefore more efficient for ionising atoms or molecules
then IR wavelengths
119864 = ℎ120584 =ℎ119888120582 (12)
Laser-plasma interaction is the main ionising mechanism of the vapour dominating the
direct ionisation of particles when vaporised [8] where 10 of the particles are
considered to be ionised [9 10] The coupling between the laser and the plasma
complicates the evolution of the plasma For example plasma screening (can also be
called shielding) can occur in a sufficiently dense plasma ie the electronic density
reaches the critical density 119873119888(119888119898minus3) defined by Equation (13) [8 10]
119873119888 = 1021
1205822 (13)
With 120582 wavelength (microm)
14
It can be seen that 119873119888 is inversely proportional to the square of the wavelength 120582(micro119898) ie
shorter wavelengths have higher critical densities diminishing the probability for
shielding When the plasma reaches this density the ldquotailrdquo of the laser pulse is reflected
backwards and its interaction with the plasma (especially the core) is no longer possible
For laser ablation of polymers there can be photochemical or photothermal ablation
There is even the possibility of having a mixture of both Photochemical ablation is
defined as the absorption of laser photon (or photons) to dissociate the molecular bonds
within the polymer and directly evaporate the matter Photothermal ablation is when heat
is dissipated within the sample to cause melting and etching [1112] which is more
commonly observed in laser ablation of metals
The ablation depth for polymers per laser pulse 119871 is expressed in Equation (14) The
logarithmic dependence with the ablation fluence can be applied to most solids even if it
is more commonly used for polymers [13]
119871 cong 120572minus1 ln 119865119865119905ℎ
(14)
With 119871 ablation depth per laser pulse (micrompulse) 120572 absorption coefficient of the sample (cm-1) 119865119905ℎ ablation threshold fluence (J cm-2) 119865 laser fluence (J cm-2)
Srinivasan felt the need to introduce another term to Equation (14) to put forth the
contributions of both the photochemical and photothermal mechanisms [14]
119871 cong 120572minus1 ln 119865119865119905ℎ
+ 119860 exp minus1198641119877119879
(15)
With 1198641 activation energy (119888119886119897 frasl 119898119900119897) T temperature of the sample (K) 119860 prefactor of the Arrhenius equation 119877 gas constant (119888119886119897 frasl (119870 119898119900119897))
15
a Infrared ablation (1064 nm)
For the ablation of polymeric materials the photoionisation is very weak in this regime as
the infrared photons do not carry a sufficient amount of energy to chemically break the
bonds Due to the insufficient amount of energy of one IR photon to break the chemical
bonds present in polymers it is more likely to see photothermal ablation in this case The
vibrational modes of molecules absorb the laser energy and diffuse it in the form of heat
This leads the sample surface to melt In order to have ablation a chemical bond needs to
absorb several quanta of laser energy to induce evaporation During this time however
the material located close to this area will undergo a melting process [11] This leads to a
low efficiency of matter removal by ablation The post-ablation heating observed in IR
ablation is quite efficient which leads to a higher temperature in the plume In fact Wang
et al [16] reported the plasma emission to be up to 5 times higher for IR emission for the
main carbon line at 248 nm The observed enhancement in optical emission from the
plasma is due to a higher temperature rather an increase in the ablated material due to the
high energy of the excited state
More specifically for the post-ablation interaction between the plasma and the laser in
this regime the main absorption mechanism is the inverse Bremsstrahlung as indicated in
Equation (11) causing strong electron heating in the plasma and cascade ionisations The
electron density of the plasma will then increase to the point where it reaches 119873119888 and
visible partial screening (also called shielding) of the plasma can be observed The laser
irradiance needs to be greater than 2 times 108 Wcmsup2 for plasma shielding to take place [3]
Chapter 2 presents shadowgraph images of the plasma in expansion to show this
phenomenon very clearly [2] When partial screening commences the laser pulse ldquotailrdquo
can no longer couple to the target material as its entire energy is absorbed by the plasma
or even reflected Therefore even when the fluence increases the ablation depth remains
low The consequence on the plasma expansion is the laser-supported detonation wave
(LSD) as it will be shown in Chapter 2
16
b Ultraviolet ablation (266 nm)
Inverse Bremsstrahlung is less efficient for UV ablation than in IR ablation However the
multi photon ionisation coefficient is much higher leading to a large number of ions [7]
The recombination processes that compete with the electron generation by multiphoton
ionisation may reduce the amount of charged particles in the plasma The critical electron
density is higher in this regime reducing the effect of plasma shielding This allows a
more efficient coupling between the laser pulse and the target The energy associated to
this wavelength is greater than 47 eV This means that the UV wavelength has enough
energy to chemically dissociate and break the bonds through multi photon process
within the matrix for most organic materials
When bonds are broken in a non-thermal manner ie not heat induced but more
chemically broken the ablation is said to be photochemical [17] When a polymer
absorbs a UV photon it can either excite the kinetic energy of its internal vibrational
transitions (photothermal) or directly break a chemical bond within the target [11] For
UV nanosecond ablation there is usually a mixture between both photothermal and
photochemical ablation The photochemical processes that intervene in UV ablation
results in higher ablation rates (ablation efficiency which is the ablated mass per laser
pulse per unit area [218]) Furthermore the rotational translational and vibrational
temperatures of ablated species are not in equilibrium The shockwaves have higher
initial velocities the surface swelling is faster and a lower ablation threshold value is
found when compared to IR ablation [219]
To conclude about the differences between the nanosecond UV and IR ablation regimes
regimes we present a model by Garrison et al [11] in Figure 1 which illustrates the
photochemical ablation (no melting can be seen around the crater just a clean expulsion of
matter) and the photothermal ablation (melting and evaporation)
17
Figure 1 Nanosecond laser ablation of polymers in air [11] at different time delays after laser impact a) UV ablation (1 photon per monomer) b) IR ablation (1 photon per monomer) c) IR ablation (4 photons of energy delivered to each monomer) There is a slight perspective in the drawings
212 Femtosecond Ablation
In the case of femtosecond ablation the phenomenon responsible for the ejection of
matter from the surface of a target is the Coulomb explosion otherwise known as non-
thermal melting When the electronic excitation energy due to the intense laser field is
transferred to the lattice phonons in the form of kinetic energy the atomic motion can be
so violent as to break the bonds that hold solids together The release of the electrons of
the solid [20] leaves behind a locally positively charged lattice Since the electrons are
negatively charged this mutual repulsion (Coulomb repulsion) creates an explosion
where a small cluster of charged and energetic ions creates a plasma
The energy absorbed by the electrons increases instantaneously but the time it takes for
them to transfer their energy to the lattice phonons depends on the thermal conductivity of
the sample [15] and cannot be neglected for femtosecond ablation For femtosecond
ablation the heat diffused to the target represents only a tiny part of the laser energy The
rest of the very intense beam is used to create photothermal changes and multi-photon
ionisation
The craters produced in this regime have smoother edges and can be processed more
precisely compared to the craters induced by nanosecond pulses This can be due to the
absence of the liquid phase in femtosecond ablation The velocity of the ejected mass is
a cb
18
considerably faster than the thermal velocity of the particles [18] Photons from visible
and IR femtosecond pulses do not have enough energy for ionisation The absorption of
several photons (multi-photon absorption MPA) makes the ionisation possible but makes
the process more sensitive to the laser intensity [21] 119872119875119860 = 120590 119868119898 where 119898 satisfies the
equation 119898ℏ120596 gt 119864119892 Due to the higher peak intensities of ultrashort laser pulses the
interband transitions are significantly increased Ablation efficiency is best for
femtosecond pulses and it is improved for ns pulses when the laser wavelength decreases
on metal targets [18] Our shadowgraph experiments will demonstrate that this is also the
case for polymeric targets
In femtosecond ablation the laser pulse is absent during the plasma expansion meaning
that there is no interaction between the laser pulse and the expanding plasma The pulse
shielding effects is totally absent Due to high intensity of a femtosecond pulse it can
however create an ionised channel by breaking down the air molecules during its passage
This can be observed in the shadowgraphs in Chapter 2
22 PLASMA FORMATION Figure 2 shows the different steps observed during the nanosecond ablation of a solid
sample The laser pulse strikes the sample surface (a) where it is first absorbed The
energy absorbed is rapidly converted into heat and causes the sample to locally melt Due
to the focalisation that increases the irradiance the laser beam contains enough energy to
induce vaporisation and fragmentation (b) The boiling point is reached when the pressure
of the vapour exceeds that of the ambient environment As seen before for intensities
higher than 108 Wcmsup2 a large number of electrons ions and excited atoms are present in
the vapour and absorb part of the laser energy leading to a breakdown in the vapour and
its ionization (c) [67] At this moment the plasma is dominated by the continuum
emission that overbears any other atomic emissions The emission detected in this phase
is mainly due to the Bremsstrahlung and the recombination processes
When the laser pulse is over the plasma continues to expand very rapidly attaining
supersonic velocities [11] (~ 106 cms) perpendicular to the surface The ions formed at
the beginning start to capture the free electrons leading to neutrals De-excitation of ions
19
and neutrals lead to the emission of characteristic photons a very important point that
allows us to determine the concentration of the elements in the plasma with the LIBS
technique (d) This phase is followed by the formation of aggregates and clusters due to
the decrease in temperatures (e) which are deposited around the crater along with the
molten material created by the laser melting (f)
Different time stages can be studied during the expansion of the plasma Figure 1 shows
the time evolution of these stages (A B C and D) with regards to a femtosecond and
nanosecond laser pulse duration The first phase A represents the time that the laser pulse
transfers its energy to the sample The laser photons are immediately absorbed by the
surface electrons (~10-15 s) It then takes ~100 fs for them to thermalise amongst
themselves and transfer their energy in turn to the lattice phonons (a few ps) Followed by
phase B where the plasma vapour containing ions atoms and molecular fragments
initiates its expansion into the surrounding environment Due to the supersonic velocity of
this expansion a shockwave engulfs the plasma This expansion continues for several
microseconds From the formation of the plasma and until its dissipation it emits
radiation The continuum radiation is followed by the ionic atomic and molecular
emission lines that can be used to determine the elements present within the plasma In
phase C the excited ions atoms and molecules return to a more stable state by emitting
photons The plasma further relaxes in phase D where its temperature falls below the
fusion temperature and the condensation starts to form nanoparticles [1] In this thesis we
will mainly focus on parts B and C where the expansion and the spectral emission of the
plasma will be studied
20
Figure 2 Plasma formation for nanosecond pulses with sufficiently high fluence [2223]
ns laser pulse
e
Polyatomicagregats
f
Deposition of ablated material
a
Laser
1 fs
bVapor
Fragmentation
100 ps
c
Shockwave
Emission
Absorption
1 ns
d
Plume expansion
1 ns ndash 100 micros
21
3 LIP EMISSION SPECTROSCOPY
31 LIP EMISSION
Laser-induced breakdown spectroscopy (LIBS) uses the spectral emission from the laser-
induced plasma (LIP) for elemental analysis of the target However from the moment the
plasma is formed until the moment it is dissipated it goes through different stages The
spectra collected at different delays and different gate widths are therefore different Figure
3 shows the evolution of the optical emission intensity with regards to the time after the
laser pulse strikes the sample It can be divided into two parts a very intense signal that
comes from the continuum and the atomic or molecular signals used to characterise the
sample At early delays (especially when the laser pulse is still present) the optical signal is
dominated by a strong continuum emission During laser ablation ions and neutral atoms
are liberated and are further ionised by the laser pulse Therefore ionic lines are first seen
followed by atomic and finally molecular spectral emission lines The delay after laser
impact chosen and the gate width are important criteria depending on what is to be
analysed Time-resolved studies are the best way to find the most adequate time delay and
gate width according to the application
Figure 3 The evolution of the intensity emission from a laser induced plasma [24]
1ns 10ns 100ns 1micros 10micros 100micros
Time after laser impact
Inte
nsity
[au
]
Laser
Continuum
Atomic lines (I)
Ionic lines (II)
DelayGate
Molecular lines
pulse
Gate of detector
22
Since these excited states are not stable the electrons within the atoms and molecules will
return to more stable energy levels by releasing their excess energy in the form of photons
(Figure 4) This can be done either by spontaneous emission or by intense enough
collisions Contrary to the continuum radiation the photons emitted (ℎ120584119894119895) are specific to
their transitions and therefore represent different atomic or molecular information This
information is the essential for the diagnostics of the plasma ie calculate the electron
density and the temperature
Figure 4 Continuum and Spectral line emission
Bremsstrahlung Radiation
In the first picoseconds the electrons and ions start colliding and interacting When a free-
electron is decelerated in the presence of a strong electromagnetic field such as the one of
an atomic nucleus the loss of kinetic energy is transformed into radiation shown in
Figure 5 This process is called Bremsstrahlung which is the German term meaning
ldquobraking radiationrdquo Since the electron started being free and after the interaction
remained free it is known as a free-free transition However when a free electron is
captured by an ion instead of being deviated this leads a free-bound transition The
n = 1
n = 5
n = 3n = 4
n = 2
En(eV)
0 n rarrinfin
Excitation
Ionisation
hν21Emission
Continuum
Spectral discrete emission lines
Continuum emission
23
excess kinetic energy is given off in the form of a photon resulting in recombination
radiation These two radiation mechanisms are responsible for the continuum emission
Since this emission is mainly due to the free electrons present in the plasma it does not
represent any spectral lines
Figure 5 Bremsstrahlung radiation
Spectral line emission
The LIBS technique is based on the study of the light emission from a laser-induced
plasma After an enough long delay a discrete spectrum is recorded with peaks produced
at specific wavelengths This means that every peak corresponds to an element and this is
how we use the plasma to characterise the ablated matter For molecular lines it often
comes in a group of lines which can be observed in the results in Chapter 3 Between the
time the photon is emitted and the time it is detected it has the possibility to get
reabsorbed by other ions or atoms An optically thick plasma means most of the radiation
cannot escape the plasma due to high absorption When the photons are directly detected
the plasma is said to be optically thin This is the ideal situation for LIBS but
unfortunately this is not always the case Corrections have to be made and some spectral
lines have to altogether be ignored to avoid erroneous interpretations
Self-absorption and Self-reversal
Electron approaching a positively charged
particle with energy E1
Electron changes direction and decreases
in energy E2
Positively charged particle
The sudden decrease in energy results in the emission of a photon
(E2 - E1)
h f = E2 ndash E1
E1
E2
e
e
24
The corrections are not the same depending on how the photon is reabsorbed If the
photon emitted from one atom is absorbed by another atom of the same element close by
considered to be at the same temperature and surrounded by the same electron density
the spectral line is said to be self-absorbed Transitions which involve the fundamental
level are more affected by such perturbations When a photon is emitted from the hot core
of the plasma and absorbed by an atom of the same element in the cooler exterior where
the temperatures and the electronic density differ the phenomenon of self-reversal is
observed Both phenomena give rise to distorted spectral lines which can be seen in
Figure 6 Self-reversal results in broadening but most importantly it is marked by a dip in
the centre of the peak Self-absorption broadens the spectral line making it difficult to
distinguish from other non-distorted lines
Figure 6 Self-absorption (upper) and Self-reversal (lower) spectral distortions [25]
A lot of emphasis is given to spectral line analysis because they are the basis of plasma
diagnostics and the technique of LIBS For example the electronic density can be found
by studying the spectral line width and the temperature can be calculated using the line
intensities Due to the self-absorption or self-reversal it is crucial to carefully select the
Wavelength (nm) Wavelength (nm)
Inte
nsit
y (a
u)
Inte
nsit
y (a
u)
Absorption of a photon by a near by atom with not a large
difference in temperature(T1 harr T1 ) and (T2 harr T2)
Absorption of a photon by a far away atom with a large difference in temperature
(T1 harr T2)
Emission (T Ne N1)
Absorption (T Ne N2)
Emission (T1 Ne N1)
Absorption (T2 Ne N2)
Resulting Profile
Resulting Profile
25
spectral lines Self-absorbed lines are not always easy to identify because of having the
same allure as non absorbed lines The spectral lines chosen should ideally have [26]
strong intensity in the working spectral range
minimum overlapping with other lines
minimum self-absorption
without saturation for the detector
In practice these ideal lines are very difficult to attain altogether There are a few
compromises that need to be done For example when a line is known to be self-
absorbed their intensities should be corrected before being used or otherwise excluded
from the calculations Lines that include the fundamental level should also be avoided
[27] from a certain value of the electron density
32 PLASMA DIAGNOSTICS
The plasma dynamics and time evolution have interested many researchers for a few
decades [13 28 29] Temporal and spatial evolutions have been extensively studied to
understand the different mechanisms that occur after laser impact A certain emphasis is
taken on electron density and temperature calculations from spectral data Some of these
calculations particularly the those for estimating the plasma temperature can only be used
when the plasma is considered to be at a certain equilibrium known as the local
thermodynamics equilibrium (LTE)
Before going into more detail regarding LTE explanations on the electron density and
temperature calculations will be first explained For now very simply LTE first requires
that the plasma has a certain electron density larger than a critical value (equation (142))
and then that all the species present (atomic ionic and molecular) be defined by the same
and unique temperature In other words the excitation temperatures of different spaces
(atoms ions and molecules) must have the same value as temperature of the electrons
For the LIP plasma a transient and expanding plasma other criteria which takes into
account the time evolution and the inhomogeneity of the plasma need to be considered
26
[30 31] Only when these criteria are fulfilled the LTE can be considered In addition
for a typical LIBS plasma only neutral and singly charged ions are taken into account for
the following calculations [24]
321 Electron Density Calculation
The different spectral line broadening mechanisms need to be understood in order to
correctly extract the electronic density Each of them has a particular influence on the
spectral line Some are represented by the Gaussian profile and others the Lorentzian one
This will be explained in more detail below followed by stating how the electron density
can be calculated
a Broadening Mechanisms
Natural line broadening
The natural line broadening is due to the finite time that an atom spends in its excited
state 119864119894 and results in a Lorentzian profile [32] If the mean time at 119864119894 is Δt then the
Heisenberg uncertainty principle states that
Δ119864119894 Δ119905119894 ge ℎ
2120587 (16)
The frequency 120584119894119895 (119904minus1) considered for a transition from 119864119894 to 119864119895 is
120584119894119895 =119864119894 minus 119864119895ℎ (17)
Considering the finite line width Δ120584119873119886119905119906119903119886119897 (119904minus1) the natural broadening can be
expressed as
Δ120584119873119886119905119906119903119886119897 = 1Δ119905119894
+ 1Δ119905119895
2120587 (18)
27
The value at the spectral range of 300 nm is of the order of 0000005 nm which means
that it will be neglected for atomic spectra from a laser induced plasma
Doppler broadening
The Doppler broadening [32] is the broadening of spectral lines due to the Doppler Effect
resulting from the thermal motions of atoms and molecules in the plasma (some moving
towards and others away from the detector) The higher the temperature or pressure
within the plasma the faster the particles move increasing the chances of collisions The
particles in motion are considered to have a Maxwellian velocity distribution resulting in
a Gaussian spectral broadening profile The FWHM of the profile depends only on the
frequency of the spectral line the mass of the emitting particles and their temperature as
can be stated in (110)
∆12058212
119863119900119901119901119897119890119903 = (716 times 10minus17) 120582 11987911987212 (19)
With 119879 emittersrsquo temperature (K) 119872 atomic weight (amu) 120582 wavelength (Aring)
For the spectral range frequently used in LIBS (UV to IR) Doppler broadening is not the
main line broadening mechanism If an extremely high plasma temperature is considered
(105 119870) the corresponding Doppler broadening for the visible range is only 001 nm
This is negligible compared to actual spectral line widths
28
Stark broadening
Collision-induced broadening sometimes called pressure broadening is a result of the
deformation of atoms or molecules when they bounce off each other For example they
may not be as symmetrical after a collision as they were before These deformations
perturb the quantum mechanical energy levels of the atom or molecule slightly shifting
the frequencies of the emission or absorption lines Just like Doppler broadening the
spectral lines are therefore broadened This effect depends on both the pressure and
temperature of the gas
Stark broadening is a particular case of pressure broadening where atoms interact with the
neighbouring charged particles such as ions and electrons According to quantum
mechanics the interaction will slightly modify the energy levels considered in the
transition inducing the spectral line to broaden The broadening is homogeneous and
corresponds to the Lorentzian profile It follows from the Lorentz Force Law that the
magnitude of the perturbing electric field (119865) created by fast moving electrons and
relatively slow ions (119890) at a certain distance (119903) is given by
119865 = 1
41205871205760 119890119903sup2
(110)
During the plasma expansion where the electron density of the plasma is quite high this
is the main broadening mechanism dominating the natural and Doppler mechanisms [8]
Instrumental broadening
Measured line profiles also experience influence from the instrument resolution It is
dependent on the slit width the grating dispersion and the detector Diffraction from a slit
gives us a cardinal sinusoidal pattern which can be approximated using a Gaussian
profile
29
b Electron Density
Finally with all these mechanisms taken into consideration the spectral lines can be fitted
with a Voigt profile the result of the convolution of Lorentz (Stark broadening) and
Gaussian (Instrumental broadening) Natural and Doppler broadening are considered as
negligible for atomic spectra of a laser-induced plasma [26]
119881(120582 (119899119898)) = 119866120582 Δ120582119863119900119901119901119897119890119903 Δ120582119868119899119904119905 otimes 119871(120582 Δ120582119878119905119886119903119896) (111)
Δ120582119866119886119906119904119904(119899119898) = Δ120582sup2119863119900119901119901119897119890119903 + Δ120582sup2119868119899119904119905 (112)
Linear Stark Effect
The line width and the electronic density of the plasma are closely linked with each other
There exists a direct relationship between Stark broadening and the electronic density
especially at short delays where the plasma is quite dense [32] For hydrogen this
relationship is linear because of its linear dependence with the Lorentz force which
results in a symmetrical broadening The electron density can be calculated using the
following equation [32]
119873119890(119888119898minus3) = 802 times 1012 Δ120582s
12057212(119873119890119879)32
(113)
With Δ120582s FWHM of the line (Aring) 12057212 half width of the reduced Stark profile(Aring)
The parameter 12057212 depends slightly on the excitation temperature 119879119890119909119888 and the electron
density 119873119890 Values of this parameter can be found in ref [32] with precision in the range of
10
Quadratic Stark Effect
For other non-hydrogen-like atoms stark broadening is proportional to Fsup2 and is thus
called the quadratic Stark effect Their density can be calculated using the following
equation
30
119873119890(119888119898minus3) = 119873119903119890119891Δ1205821198781199051198861199031198962120596119903119890119891
(114)
With 119873119903119890119891 reference 119873119890 (~ 1016 minus 1017 119888119898minus3) ωref impact parameter at this reference density
Hydrogen Balmer 119919120630 Emission
Even though both linear and quadratic Stark effects are observed in the LIBS spectra
more focus is taken on extracting information from hydrogen or hydrogen-like atoms
Their linear dependence allows more accuracy and ease when calculating the half width
of line profiles providing more reliable results [8 26] The hydrogen Balmer line 119867120572 (656
nm) emission line width in function of the detection delays is often used to study the
temporal evolution of the electron density in the plasma during its expansion and decay
[33]
In organic materials the presence of hydrogen in the matrix allows for a well isolated
and significantly intense peak In addition this line is strongly affected by the linear Stark
effect [32] Its use for electron density determination has been extensively reported for the
diagnostics of laser ablation plasma [34 35] The surrounding electrons are mainly taken
into consideration rather than the ions which have a much weaker impact on the total line
broadening [36] Even though hydrogen is part of the polymer matrix 119867120572the auto-
absorption can be neglected as long as the electronic density is less than 1018 119888119898minus3 [35]
Figure 7 shows 119867120572 spectral line fitted with Voigt profiles for a potato Measurement were
taken at different delays (100 300 600 and 1000 ns) after laser impact to put forth its
evolution with time A narrowing of the line along with a shift towards smaller
wavelengths can be seen
31
Figure 7 Stark Broadening The 119815120514 fitted with Voigt profiles for a potato sample Different laser impact delays were taken (100 300 600 and 1000 ns after laser impact) [37]
322 Temperature Calculation
For temperature calculations the differences between the line intensities are taken into
account rather than the broadening There are different methods Boltzmann (one element
one species (neutral or ions)) plot Saha-Boltzmann plot (one element different species
(neutral and ions)) ionic temperature (one element in its neutral and ionic state) and
molecular temperature (vibrational) To estimate the temperatures it must be assumed
that the plasma is in LTE
a Boltzmann method (Excitation temperature)
There is a correlation between the transition emission (observed by a spectral line in the
spectrum) and the Boltzmann equation At 0 K all the atoms are in their fundamental
electronic configuration In addition at this temperature they are considered to be
motionless with absolutely no kinetic energy As the temperature increases they begin to
move and gain more energy to access different excited configurations as can be seen in
Figure 8 The distribution of this population follows the exponential nature of the
Boltzmann law
645 650 655 660 665 67000
02
04
06
08
10
Ca (6
439
1 nm
)
Ca (6
462
6 nm
)
Ca (6
493
8 nm
) 100 ns 300 ns 600 ns 1000 ns
Norm
aliz
ed In
tens
ity (a
u)
Wavelength (nm)
Hα (65627 nm)
32
Figure 8 Boltzmann electron population distribution at different energy levels
At a sufficiently high temperature collisions between electrons and atoms can become
efficient to excite atoms The population distribution among the different energy levels
obeys the exponential law present in the Maxwell-Boltzmann distribution [34]
119873119894119885 = 119873119885 119892119894119890
minus119864119894119885
119896119861119879
119880119885(119879) (115)
With 119873119894119885 number of particles in state i (119888119898minus3) 119864119894119885 energy of the i-th state (eV) gi degeneracy of energy level i T absolute temperature(K) N total number of particles (119888119898minus3) Z Z=0 (neutral) and Z=1 (singly-charged ions)
The denominator 119880119885(119879) is known as the partition function and can be calculated by
equation (122) Due to the difficulties associated with these calculations we only state
the equation required but we do not calculate it ourselves
119880119885(119879) = 119892119894119894
119890minus119864119894
119885
119896119861119879
(116)
With 119880119885(119879) partition funtion
T = 0 K Warm Hot
j
i
hνijAij
Ei gi
Ej gj
En (eV)
33
The excited atoms return to their lower energy configurations by emitting photons
Spectral lines corresponding to the transitions between these different levels can be
observed in emission spectra Each photon has a specific wavelength that is unique for
every transition enabling us to detect the elements present The line intensity can be
calculated by the following formula
119868119894119895119885 = 1
4120587 ℎ120584 119873119894119885 119860119894119895 = 1
4120587ℎ119888120582119894119895
119873119894119885119860119894119895 (117)
With 119868119894119895119885 line intensity 120582119894119895 wavelength of the transition (119899119898) 119860119894119895 transition probability
If the Boltzmann equation is used in the equation (126) the intensity can be written as
119868119894119895119885 = 1
4120587 ℎ119888120582119894119895
119873119885 119892119894 119860119894119895119880119885(119879) 119890119909119901 minus
119864119894119885
119896119861119879 rArr
119868119894119895119885 120582119894119895119892119894 119860119894119895
= 1
4120587 ℎ119888119873119885 119880119885(119879) 119890119909119901 minus
119864119894119885
119896119861119879 (118)
In a more simplified version the linearization of the spectral intensity line represents the
wavelength intensity with regards to the different energy transitions for the same species
(neutral or ionic)
119897119899 119868119894119895119885 120582119894119895119892119894 119860119894119895
= minus1119896119861119879
119864119894119885 + 119897119899 1
4120587ℎ119888119873119885
119880119885(119879) (119)
If the upper excited energy levels of a given species are known along with the statistical
weights transition probabilities and wavelength for some transitions then the excited
temperature can be deduced by measuring the emission radiances [38] The use of
transitions between largely separated levels leads to more precise results because the line
fit becomes more reliable This method is known as the Boltzmann plot (BP) method
[26] Assuming the LTE is established within the plasma the population in different
levels is governed by the Boltzmann distribution
The value of Aji is only known with a precsion in the range of 10 - 30 depending on the
transitions used Some authors believe that in practice the linearity of the plot is an
34
indication for the satisfaction of LTE [39 40] while others think that a straight line can
also be obtained even when the level population is out of LTE [41] Both agree that the
excitation temperature of a species within a plasma in LTE is inversely proportional to
the slope of the Boltzmann plot minus 1119896119879119890119909119888
shown in equation (129) The measurement of
the line intensities is therefore a crucial factor to obtain the optimal temperature
calculations using the BP method For this an intensity calibration of the detection
system must be performed especially when the selected lines extend over a large spectral
range It goes without saying that self-absorbed or self-reversed lines will lead to
inconsistent temperatures
For more reliable results the spectral lines should be well isolated without interference
from other transitions These conditions can be satisfied for transition metals such as iron
or titanium or alkaline earth metals such as calcium for which a large number of
transitions are available in the visible spectral range The elemental metallic trace lines
present in the polymer spectra are the result of contaminations that come from fillers and
additives added to enhance physical properties Their presence facilitates the temperature
calculations especially titanium because the organic elements (C H O and N) do not
have enough lines for such measurements
b Saha-Boltzmann Plot Method
The Boltzmann plot method has the convenience of being relatively simple but it is not
very accurate The energy gap between the upper levels of the two lines is usually small
for the same ionisation degree [42] One way to make it more precise is to significantly
extend the range of 119864119894 This can be done by using both ionic (II) and atomic (I) elements
on the same plot by combining the Boltzmann distribution with the following Saha
equation
119873119890119873119911
119873119911minus1 =2119880119885(119879)119880119885minus1(119879)
2120587119898119890119896119861119879
ℎsup232
exp minus 119864infin119885minus1 minus ∆119864infin119885minus1
119896119861119879 (120)
With 120549119864infin119885minus1 correction of the ionization energy 119864infin119885minus1 119864infin119885minus1 ionisation energy of the lower ionisation stage
35
This method named the Saha-Boltzmann plot method allows a significant extension of
the range of Ei distributing the data from the spectra over a larger range of energy
allowing for a more accurate linear plot
The following calculations are considered for a plasma in LTE therefore we can consider
that the excitation temperature 119879119890119909119888 and the ionisation temperature 119879119894119900119899 are equal The
Boltzmann and Saha equation are then defined by a single temperature value The result
is an equation similar to that of the BP method but with a few corrections
119897119899 119868119894119895119885 120582119894119895119892119894 119860119894119895
lowast
= minus1119896119861119879
119864119894119885lowast + 119897119899
14120587
ℎ1198881198730
1198800(119879) (121)
With 1198730 number of neutral atoms (Z=0) 1198800(119879) partition function for neutral atoms (Z=0) ions and electron values included
The equation is valid for atoms that are both neutral and ionised but in order to plot them
on a same graph there must be some adjustments (designated by ) made to the abscise
(119864119894119885) and the ordinate ( 119897119899 119868119894119895119885 120582119894119895119892119894 119860119894119895
) values in equation (128) There is a likelihood law to
find atoms ionised more than once in a LIBS spectra It is important to note that for
ionised marked species (119885 ge 1) the quantities with the superscript must be replaced by
the following expressions
For the abscise values
119864119894119885lowast = 119864119894119885 + 119864119894119900119899 (122)
With 119864119894119900119899 ionisation energy
For the ordinates
119897119899 119868119894119895119885 120582119894119895119892119894 119860119894119895
lowast
= 119897119899 119868119894119895119885 120582119894119895119892119894 119860119894119895
minus 119911119897119899 2(2120587119898119890119896119861)32
ℎ311987932
119873119890 (123)
119864119894119900119899119864119894119885Obviously for 119885 = 0 (neutral atoms) the Saha-Boltzmann equation becomes
identical to the Boltzmann equation since the last term becomes equal to 0 For ionised
species this term depends on the temperature 119879 therefore an iterative procedure needs
to be used to determine the temperature and plug it into the equation In practice only a
few iterations are needed to converge
36
c Ionic Temperature
The ionic temperature also uses the combination of the Saha and the Boltzmann equation
previously mentioned In this case the temperature can be found for an ionised species of
a given element The use of LTE conditions which states that the ionic and excitation
temperatures are equal along with the transition information of two different ionisation
degrees (119911 = 0 and 119911 = 1) gives the following intensity ratio between ions and neutral
atoms [42 43]
119868119894119900119899119868119886119905119900119898
= 483 times 1015
119873119890 119892119894 119860119894119895
120582119894119895119894119900119899
120582119894119895119892119894 119860119894119895
119886119905119900119898
11987932119894119900119899 119890119909119901minus119864119894119900119899119885 minus 119864119886119905119900119898119885
119896119861119879119894119900119899 (124)
With 119864119894119900119899119885 energy of the upper level of transition for ions 119864119886119905119900119898119885 energy of the upper level of transition for atoms
With a known ionisation energy 119864119894119900119899 and electronic density 119873119890 (measured by Stark
broadening described previously) along with the spectroscopic parameters of both these
transitions the ionic temperature can be calculated
d Molecular Temperature
The plasma is expected to have both ionic and atomic spectra but of polymers (detailed
in Chapter 2) molecular emission is also expected Mostly we see spectral lines emitted
by CN and C2 which can be used to calculate the molecular temperature The theoretical
considerations in Figure 4 show that molecules are created after the atoms and ions ie
their spectral emission should be observed after the ionic and atomic ones as shown by
our experimental results in Chapter 3
The vibrational temperature is determined with CN molecular band head emission present
in organic materials The vibrational temperature is extracted using the method described
in ref [42] Diatomic molecules possess many vibrational levels where molecules in the
upper vibrational state νprimecan decay into lower electronic states νprimeprime They put forth the
correlation between the sum of the band strengths and with the number of molecules in
each respective state as can be seen in Equations (132) and (133)
37
119868(120584prime 120584primeprime)
1205844 120584primeprime
prop 119873120584prime (125)
119868(120584prime 120584primeprime)
1205844 120584prime
prop 119873120584primeprime (126)
With 120584prime vibrational upper electronic state (119888119898minus1) 120584primeprime vibrational lower electronic state (119888119898minus1) 120584 frequency (119888119898minus1) 119873120584prime numbers of molecules present in 120584prime (119888119898minus3) 119873120584primeprime numbers of molecules present in 120584primeprime (119888119898minus3)
If we consider that the LIBS plasma is in local thermodynamic equilibrium it can be
possible to calculate the number densities of an excited molecule by using Equation
(134)
120584119894119895 = 119864119894 minus 119864119895ℎ
1198971198991205824 119868120584prime120584primeprime120584
= 1198621 minus 119866( 120584prime ) ℎ119888
119896119861119879119907119894119887 (127)
With 120582 wavelength of each transition 120584rsquo 119886119899119889 120584rdquo (nm) 119866( 120584prime ) vibrational term value to 120584prime 1198621 constant 119879119907119894119887 vibrational temperature (K) 119868120584prime120584primeprime measured intensity
By plotting lnsum λ4 Iνprimeνprimeprimeνprimeprime with regards to G(νrsquo) the slope provides the determination of
the vibrational temperature The results have been further confirmed by using the
temperature calculation by the spectrum simulation with the LIFBASE software [37] for
temperature ranging from 5000 to 20000 K The comparison showed good agreements
with a typical accuracy of 5-10
4 LOCAL THERMODYNAMIC EQUILIBRIUM The first optical thinness has already been discussed According to the talk presented by
Omenetto at EMSLIBS [45] there are two essential criteria that need to be filled in order
to consider the LTE The criteria are an electronic density minimal requirement
(McWhirter criterion) and the definition of a unique plasma temperature for all species in
the plasma
38
41 ELECTRON DENSITY CRITERION For the population of excited states for the elements in the plasma to be predominately
caused by collisions with electrons and not by radiative processes it requires a minimal
electron density to ensure these collisions The radiative processes explained before such
as photon absorption recombination radiation and spontaneous emission are in this case
negligible This minimal electron density is known as the McWhirter criterion and is
defined as [50]
119899119890 ge 16 times 1012 11987912 (∆119864)3 (128)
With ∆119864 (119890119881) largest gap between 2 adjacent energy levels T (K) plasma temperature
This condition is deduced for hydrogen and hydrogen-like atoms in an optically thin
stationary and homogenous plasma [45] The largest gap for hydrogen is indeed between
the ground state and the first excited energy state and corresponds to 4 eV This is not
always the case for other elements Figure 9 shows that the largest energy gap for oxygen
does not include the ground state In this case the largest gap must be used
Figure 9 Oxygen energy levels [45]
1
2
3
kj ih
E max g max
E min g min
GROUND STATE
ΔE 12 ~ 33 eVΔE 13 ~ 5 eV
ΔE max ~ 10 eV
39
Considering a plasma at 7000 K the required electronic density comes out to
119873119890 = 86 times 1015119888119898minus3 (129)
This is the necessary but not sufficient requirement for the LTE that is typically fulfilled
during the first stages of the plasma lifetime Due to the large 120549119864 often associated with
the lower lying energy states this condition can be difficult to satisfy A solution would
be to use higher excitation levels were ΔE are close enough to allow the equation to hold
the plasma would be in partial LTE
42 TEMPERATURE CRITERION
As explained previously the plasma consists of different particles (atoms ions
molecules hellip) in excited or fundamental states In addition different energy processes
take place within the plasma and can each be characterised by their own temperature
Therefore there is not clear definition of the plasma temperature unless the different
temperatures converge and one can describe the entire plasma with one and unique
temperature Otherwise the notion of plasma temperature would be confusing as it would
not be clear as to lsquowhatrsquo temperature was in question Four different temperatures can be
used to characterise the plasma and are listed below
Kinetic energy (Maxwell-Boltzmann distribution law) electron temperature
This energy is associated the motion of the electrons In the case of plasma it defines the
energy of the electrons that obey the Maxwell distribution law ie the Maxwellian
velocity distribution The interactions involving electrons and other particles are not taken
into consideration here just their free motion between subsequent collisions The
Maxwell-Boltzmann distribution law is characterized by the electron temperature
Internal energy (Boltzmann law) excitation temperature
Elements (atoms ions or molecules) in the plasma have the ability to access higher
energy configurations as the temperature increases The population amongst these excited
configurations obey the Boltzmann law characterised by the excitation temperature
40
Ionisation energy (Saha law) ionic temperature
Saharsquos law is used to describe the population distribution among successive ionisation
degrees within the plasma ie the distribution of the same element in different ionisation
stages In a typical LIBS spectrum and mainly for what concerns us this is limited to
species ionised only once
Radiation energy (Plankrsquos law) radiation temperature
Plankrsquos law describes the spectral radiance distribution from electromagnetic radiation
emitted from a black body ie optically thick plasma
Each one of these processes can attain their own individual equilibrium without being in
equilibrium with the rest However for complete thermal equilibrium (CTE) all the
temperatures must be simultaneously equal defining one and unique plasma temperature
119879119890minus equiv 119879119890119909119888 equiv 119879119894119900119899 equiv 119879119903119886119889 (130)
Complete LTE
For the LIBS plasma the complete thermodynamic equilibrium cannot be attained
because one expects an optically thin plasma As stated the Plank law requires the plasma
to be optically thick at all frequencies [24] Optically thick plasma means the line
intensities are distorted and misleading due to re-absorption of emitted photons within the
plasma The radiative life of the emitting particles and the duration of the laser pulse are
much smaller than the duration of the radiative life of the plasma So the emission is not
due to the photo-excitation mechanism but rather the thermal electron impact excitation
In a typical LIBS plasma in the typical time frame emission from electron collisions are
said to be the rate determining mechanisms dominating the radiative emission These
reasons explain why the radiation temperature is often decoupled from the others
allowing the opportunity to find a temperature that satisfies Maxwell Boltzmann and
Saha laws In this case we cannot talk about CTE but instead we talk about LTE
41
When considering a plasma in LTE 119879119890minus equiv 119879119890119909119888 equiv 119879119894119900119899 meaning the temperature that
depicts the population of atomic and ionic energy levels is the same for the atoms of the
same element in different ionisation stages Light emission collection depends on the
angle aperture of the collection apparatus Even if a plasma is in LTE it takes into
consideration only the mean values of T and Ne but not the spatial decoupling where the
plasma has different temperatures at different spatial positions Panne et al [46] noticed
that the geometrical observation in LIBS setup generated different temperatures and
electronic densities The influence of the collection system must be taken into
consideration when comparing spectral data obtained by different methods
The use of BP method to evaluate the LTE leads to erroneous results [47] due to the lack
of sufficient spectral lines used The ionisation temperature obtained by the Saha law
provides a better estimate for the real plasma properties [48] Milan et al [49] found
through spatially resolved measurements of ablation of a silicon sample that the cooler
regions near the exterior of the plasma affected the excitation temperature more than the
ionic temperature Hence since most temperature evaluations are based on a space
averaging technique the ionisation temperature seems to provide more accurate results
They concluded that 119879119890119909119888 = 119879119894119900119899 on silicon sample after 2 micros Others have taken another
step forward by calculating the vibrational temperature when molecular spectra are
detected Hermann et al [51] deduced that the electronic temperature converged with the
vibrational temperature associated to graphite samples only after 1 micros At this point there
was a thermalisation between the electrons and heavier particles Rusak and al [52] added
the temperature associated with the rotational energy of molecular bands only to notice no
LTE during the first micros of the plasma for power densities lower than 1 (119866119882) frasl 119888119898sup2
They did deduce the equilibrium between the excitation and vibration temperature
however
Whilst some authors like Capitelli et al [4] doubt that there can be a true existence of LTE
in laser induced plasma due to the high imprecision of the partition function values
Simeonsson and al [48] estimated that kinetic equilibrium between electrons and heavier
ions and neutrals was reached only 10 ns after the laser pulse impact while the excited
states needed 50 ns to reach a Boltzmann-like distribution for H C O and Cl Amoruso
and al [6 7] support this hypothesis stating that the electrons could effectively transfer
42
their absorbed energy on to other ions during the laser pulse The time needed for the
transfer is between 10minus10 minus 10minus11 119904 according to [53] much shorter than most laser
pulse durations They conclude that the electron temperature can be assumed to be nearly
the same as the ion temperatures
Finally the state of LTE can be considered as a good approximation for the plasma used
for LIBS measurements generally true for delays greater than 1 micros and over an interval in
the order of 1 micros For polymers the signal intensity is less intense and does not last as
long as that of metals By choosing an inadequate acquisition delay the McWhirter
criterion might be violated as there might not be enough electrons due to the weak
emission signal This hypothesis needs to be backed by proper plasma modelling or time
and spatial resolved plasma detection as it depends very strongly on the properties that
influence the plasma formation ie laser pulse energy pulse duration ambient gas
acquisition gate time etc These parameters need to be accurately detailed to ensure the
reproducibility of the experimental results
43 INTRODUCTION TO CF-LIBS LIBS has the ability to detect the elements present in a sample sometimes at a ppm level
with little or no sample preparation required Other techniques such as ICP-MS have this
ability as well but need time for sample preparation often required to be dissolved into a
liquid state Their main advantage over the LIBS technique is their precision at
quantifying the element concentrations The task of rendering LIBS capable of somewhat
similar quantitative measurements is undergoing
Quantitative analysis can be done in several ways [54] One method to determine the
concentration of each element independently is through the emission lines of accurately
known transition probabilities followed by absolute measurements of the integrated
intensities Another way would be to compare the elemental emission lines relative to the
most abundant element in the sample This method only requires the ratios of the
transition probability of the emission lines Of course as with all information attained
43
from the spectra a greater number of lines provide better results Therefore to increase
the accuracy of these methods a well calibrated broad band spectrum is required
An approach widely used compares the spectra intensity lines with known calibration
standards ie calibration curves As long as the properties of the sample being analysed
and the standard sample matrices are similar this method can be very practical The result
of the matrix effect can be observed when comparing two known identical concentrations
of an element It would be expected to see identical emission intensities but this can be
distorted due to the matrix effect The sensitivity of the measurements are sensitively
dependant on the laser-matter interaction this includes the matrix effects
The use of calibration curves when possible provides promising results when dealing with
homogenous samples ie constant matrix effect [54] However as the sample gets more
complicated for example organic samples the calibration curves are not always easy to
create The notion of a reference sample where all the element concentrations are already
known for polymers can be accepted A problem arises when dealing with more
complicated samples such as vegetables or soil How can one create a reference sample
for an inhomogeneous sample or a sample with unknown matrix Add to this the
complications of varying matrix effects associated to the local in homogeneity of such
samples In this case the reproducibility of LIBS is therefore reduced and the errors
associated with the measurement increase drastically Construction of a calibration curve
is highly complicated and nearly impossible
The notion of Calibration-Free LIBS (CF-LIBS) was proposed by Ciucci et al [55] Such
procedure can in the ideal case provide solution for inhomogeneous sample or those with
unknown matrix The idea behind this method was to go around these matrix effects by
making each measurement self consistent ie avoid the need to compare it with
calibration curves For this method works these are three requirements for the ablation
and the resulted plasma [54]
Stoichiometric ablation
Plasma must be in LTE
Optically thin plasma
44
The last two requirements have already been discussed previously Stoichiometric
ablation means that the composition of the ablated mass is representative of that of the
sample This is the basis of LIBS and other laser ablation techniques in general This
allows to characterize the sample analyzed using the light emitted from the plasma Russo
and al mentioned in their paper in 1991 [56] that stoichiometric ablation existed for laser
power densities greater than 109 119882119888119898sup2 a condition generally satisfied for nanosecond
or shorter duration pulse ablation Borisov and al [57] stated that the degree of
stoichiometric ablation was reduced when the crater depth increased He put forth two
hypotheses for this statement The first imagined that the geometric factors reduced the
power density and the second consisted of shielding and thermal variations within the
crater
Elemental fractionation of the sample was observed with longer laser pulses [2]
Femtosecond ablation reduced this problem and showed an increase in the ablation
efficiency Russo et al 2002 [58] performed nanosecond and femtosecond ablation on
glass samples and did not come to the same conclusion They believed that the pulse
duration alone was not enough to account for fractionation The generated plasma and the
shockwave induced with the plasma could influence it as well The mass removal depends
on the heat conduction of the laser pulse within the sample as well as the recoil pressure
which is a consequence of the shockwaves Shockwaves present in femtosecond laser
ablation are due to the high velocity of the ejected mass
For the CF-LIBS calculations the use of the Boltzmann plot method was first used
(includes the total plasma number density and volume and the experimental geometry)
[54]
119868120484120485 = 119865 119862119904 119860119894119895 119892119894 119890119909119901 minus
119864119894119896119861119879
119880119904(119879) (131)
With 119868120484120485 measured integral line intensity (counts) CS concentration of the emitting species S US(T) partition function of the emitting species F optical efficiency of the collection system
45
Equation (132) requires information either protruding from spectral databases or directly
from the experimental category
Aij gi Eij US (T) rarr spectral database
F CS T rarr experimental data
If 119910 119909119898 119886119899119889 119902119904 are introduced as the following
119910 = 119897119899 119868119894119895
119892119894 119860119894119895 (132)
119909 = 119864119894 (133)
119898 = minus1119896119861119879
(134)
119902119878 = ln 119862119878 119865119880119904(119879) (135)
The Boltzmann equation can be written simply in the form
119910 = 119898119909 + 119902119878 (136)
Where 119898 is associated with the temperature of the plasma and 119902119878 is associated with the
concentration of the emitting species 119878 One spectral line emission produces one point on
the Boltzmann plot diagram This way all the emitting species can be represented in one
diagram If the condition of LTE is fulfilled and the lines are carefully selected to avoid
self-absorption each emitting species should align on parallel lines The same
temperature means the same slope 119898 for all elements These calculations require that the
spectral data contain
At least 2 emission lines from the same species to determine the electronic
temperature
At least 1 emission line with known spectroscopic parameters to calculate the
electronic density
46
The y-intercept given by 119902119878 of each line is proportional to the natural logarithm of its
concentration Once the electronic temperature is calculated the concentration of species
of the corresponding element which sums up the concentrations of both the neutral and
single ionised atoms can be determined The F parameter creates a bit of a problem but is
solved by using the normalisation relation if an internal standard is not known
119862119890 = 1119890
(137)
where the sum of the total element concentration should be 1 Even if in theory this
method can provide very accurate results the LIBS measurements with CF-LIBS are only
at best 3-5 experimentally reproducible [59] and the errors associated with the
probability transitions can go from 10-30 [54] If more spectral lines were used this
could average out the uncertainties linked with the probability transitions and provide
more accurate line plots
Initially CF-LIBS introduced by Ciucci [54] excluded self-absorbed lines However it is
possible to include these lines by using a recursive method This means the use of more
points (more spectral lines) for even more accurate information This method predicts the
intensity of the self-absorbed line The scattering around the best fit line can be reduced
putting forth evidence that it is mainly due to self-absorption effects and not experimental
errors fitting errors or even uncertainties related to transition probabilities
47
5 CONCLUSION
The emission line intensities depend on the plasma properties that are influenced by the
ablation laser pulse (wavelength pulse duration pulse energy) the sample (matrix
effects inhomogeneities) and the ambient gas (vacuum inert air and the pressure) It can
also be related back to the concentration of the elements present within the plasma A
detailed understanding of the laser-induced plasma is the basis of high quality quantitative
measurements with LIBS A thorough knowledge on evaporation ejection of particles
hydrodynamic explosion shock waves plasma initiation and expansion not to forget the
laser-plasma interaction is needed All these parameters can influence the amount and the
composition of the ablated mass
In the following chapters of this thesis we will present the study of such parameters for
the ablation of different polymer samples First we study the plasma formation and
expansion by shadowgraphic measurements under different ablation regimes This is
followed by time-resolved analysis of the spectroscopic plasma emission for the
optimisation of experimental acquisition parameters (local thermodynamic equilibrium
signal-to-noise ratio acquisition gate width etc) We are interested in CF-LIBS because it
is the only method that allows a direct analysis without the use of calibration curves
Before applying this method however certain notions and understanding of the physics
behind the induced plasma especially for organic substances is needed Therefore the
last chapter has for aim to classify and identify various polymers through different
multivariate analysis techniques It emphasises that the work in this thesis is more
qualitative than quantitative The aim behind this reasoning is to be able find an
application for the industrial sorting of plastics with what we already know today In the
future we hope that the additional information presented here of plasmas induced on
polymers will allow us the ability to use calibration free methods to provide more precise
quantitative measurements
48
References
[1] M Baudelet Proprieacuteteacutes physico-chimique du plasma induit par laser en regime nanoseconde et femtoseconde PhD Thesis Universiteacute Claude Bernard-Lyon 1 2007
[2] RE Russo XL Mao JH Yoo and JJ Gonzalez Laser Ablation Laser InducedBreakdown Spectroscopy Elsevier Science Amsterdam Netherlands 2007
[3] A Bogaerts Z Chen R Gijbels A Vertes Laser ablation of copper in different background gases comparative study by numerical modelling and experiments Journal of Analytical Atomic Spectrometry 21 384ndash395 2006
[4] M Capitelli A Casavola G Colonna A De Giacomo Laser-induced plasma expansion theoretical and experimental aspects Spectrochimica Acta Part B 59(2004) 271ndash289
[5] BN Chichkov C Momma S Nolte F yon Alvensleben A Tiinnermann Femtosecond picosecond and nanosecond laser ablation of solids Applied Physics A63 109 (1996)
[6] S Amoruso Modeling of UV pulsed-laser ablation of metallic targets Applied Physics A 69 323ndash332 1999
[7] S Amoruso R Bruzzese N Spinelli and R Velotta Characterization of laser ablation plasmas Journal of physics B 32 R131ndashR172 1999
[8] VN Rai SN Thakur Physics of Plasma in Laser-Induced Breakdown Spectroscopy Laser Induced Breakdown Spectroscopy Elsevier Science Amsterdam Netherlands 2007
[9] S Siano Principles of Laser Cleaning in Conservation Handbook on the Use of Lasers in Conservation and Conservation Science 2007
[10] DA Cremers and LJ Radziemski Handbook of Laser-Induced Breakdown Spectroscopy 2006
[11] B J Garrison and R Srinivasan Laser ablation of organic polymers microscopic models for photochemical and thermal processes Journal of Applied Physics 57 2909 (1985)
[12] H Schmidt J Ihlemann B Wolff-Rottke K Luther and J Troe Ultraviolet laser ablation of polymers spot size pulse duration and plume attenuation effects explained J Appl Phys 83 5458 (1998)
[13] T Lippert M Hauer CR Phipps Fundamentals and applications of polymers designed for laser ablation Appl Phys A 77 259ndash264 (2003)
[14] R Srinivasan B Braren RW Dreyfus L Hadel and DE Seeger Mechanism of the ultraviolet laser ablation of polymethylmethacrylate at 193 and 248 nm
49
laser-induced fluorescence analysis chemical analysis and doping studies Journal of the Optical Society of America B 3785ndash791 1986
[15] M Hashida H Mishima S Tokita and S Sakabe Non-thermal ablation of expanded polytetrafluoroethylene with an intense femtosecond-pulse laser Optics Express Vol17 Issue 15 pp 13116-13121 2009
[16] QWang P Jander C Fricke-Begemann R Noll Comparison of 1064 nm and 266 nm excitation of laser-induced plasmas for several types of plastics and one explosive Spectrochimica Acta Part B 63 1011ndash1015 (2008)
[17] R Srinivasan B Braren KG Casey and M Yeh Ultrafast imaging of ultraviolet laser ablation and etching of polymethylmethacrylate Applied Physics Letters 55 (26)2790ndash2791 1989
[18] A Semerok C Chaleacuteard V Detalle J-L Lacour P Mauchien P Meynadier C Nouvellon B Salleacute P Palianov M Perdrix and G Petite Experimental investigations of laser ablation efficiency of pure metals with femto pico and nanosecond pulses Applied Surface Science 138ndash139311ndash 314 1999
[19] YG Yingling B J Garrison Photochemical ablation of organic solids NuclearInstruments and Methods in Physics Research B 202 188ndash194 (2003)
[20] Sci-Tech Encyclopaedia McGraw-Hill Encyclopaedia of Science and Technology 5thedition The McGraw-Hill Companies Inc
[21] SS Mao F Queacutereacute S Guizard X Mao RE Russo G Petite and P Martin Dynamics of femtosecond laser interactions with dielectrics Appl Phys A 79 1695ndash1709 2004
[22] JM Vadillo and J J Laserna Laser-induced plasma spectrometry truly asurface analytical tool Spectrochimica Acta Part B 59147ndash161 2003
[23] M Corsi G Cristoforetti M Hidalgo D Iriarte S Legnaioli V Palleschi A Salvetti and E Tognoni Temporal and spatial evolution of a laser induced plasma from a steel target Applied Spectroscopy Volume 57 Issue 6 Pages 187A-198A and 591-727 (2002) pp 715-721(7)
[24] AW Miziolek V Palleschi and I Schechter Laser Induced Breakdown Spectroscopy (LIBS) fundamentals and applications Cambridge University Press Cambridge UK (2006)
[25] RD Cowan and GH Dieke Self-Absorption of Spectrum Lines Reviews of Modern Physics Vol 20 Number 2 1948
[26] C Aragoacuten JA Aguilera Characterization of laser induced plasmas by optical emission spectroscopy A review of experiments and methods Spectrochimica Acta Part B 63 (2008) 893ndash916
[27] V Motto-Ros AS Koujelev GR Osinski AE Dudelzak Quantitative multi-elemental laser-induced breakdown spectroscopy using artificial neural networks Journal of the European Optical Society - Rapid Publications 3 08011 (2008)
50
[28] SS Harilal CV Bindhu MS Tillack F Najmabadi and AC Gaeris Internal structure and expansion dynamics of laser ablation plumes into ambient gases Journal of applied physics volume 93 number 5 2003
[29] V Margetic A Pakulev A Stockhaus M Bolshov K Niemax R Hergenroumlder A comparison of nanosecond and femtosecond laser-induced plasma spectroscopy of brass samples Spectrochimica Acta Part B 55_20001771]1785
[30] G Cristoforetti G Lorenzetti S Legnaioli V Palleschi Investigation on the role of air in the dynamical evolution and thermodynamic state of a laser-induced aluminium plasma by spatial- and time-resolved spectroscopy Spectrochimica Acta Part BArticle in Press 2010
[31] Q L Ma V Motto-Ros W Q Lei M Boueri X S Bai L J Zheng H P Zeng and J Yu Temporal and spatial dynamics of laser-induced aluminum plasma in argon background at atmospheric pressure interplay with the ambient gas Accepted Spectrochimica Acta Part B 2010
[32] HR Griem Spectral Line Broadening by Plasmas Academic Press New York and London 1974
[33] E Tognoni G Cristoforetti S Legnaioli V Palleschi A Salvetti M Mueller U Panne I Gornushkin A numerical study of expected accuracy and precision in Calibration-Free Laser-Induced Breakdown Spectroscopy in the assumption of ideal analytical plasma Spectrochimica Acta Part B 62 1287ndash1302 (2007)
[34] J Ashkenazy R Kipper and M Caner Spectroscopic measurements of electron density of capillary plasma based of Stark broadening of hydrogen lines V43 N10Physical Review A 1991
[35] AM El Sherbini H Hegazy ThM El Sherbini Measurement of electron density utilizing the Hα-line from laser produced plasma in air Spectrochimica Acta Part B 61(2006) 532ndash539
[36] NM Shaikh B Rashid S Hafeez Y Jamil and MA Baig Measurement of electron density and temperature of a laser-induced zinc plasma J Phys D Applied Physics 39 (2006) 1384ndash1391
[37] W Lei V Motto-Ros M Boueri Q Ma D Zhang L Zheng H Zeng J Yu Time resolved characterization of laser-induced plasma from fresh potatoes Spectrochimica Acta Part B 64 (2009) 891ndash898
[38] CA Bye and A Scheeline Saha-Boltzmann Statistics for Determination of Electron Temperature and Density in Spark Discharges Using an EchelleCCD System Applied Spectroscopy Volume 47 Number 12 1993
[39] J L Throne Plastic Process Engineering Man Dekker New York (1979)
[40] C Gauthier Deacuteveloppement de la technique de la double impulsion laser pour ameacuteliorer les performances analytiques de lrsquoablation laser coupleacutee agrave la
51
spectromeacutetrie drsquoeacutemission optique (ALSEO) sur solides Applications nucleacuteaires Universiteacute Henri Poincareacute ndash Nancy I 2005
[41] B C Castle K Visser B W Smith and J D Winefordner Level populations in a laser-induced plasma on a lead target Spectrochimica Acta Part B 52 1995ndash2009 1997
[42] SS Harilal Riju C Issac CV Bindhu Pramod Gopinath VPN Nampoori CPG Vallabhan Time resolved study of CN band emission from plasma generated by laser irradiation of graphite Spectrochimica Acta Part A 53 (1997) 1527-1536
[43] O Bartheacutelemy J Margot M Chaker M Sabsabi F Vidal T W Johnston S Laville and B Le Drogoff Influence of the laser parameters on the space and time characteristics of an aluminum laser-induced plasma Spectrochimica Acta Part B 60905ndash914 2005
[44] O Bartheacutelemy J Margot S Laville F Vidal M Chaker B Le Drogoff TW Johnston and M Sabsabi Investigation of the state of local thermodynamic equilibrium of a laser-produced aluminum plasma Applied Spectroscopy 59 (2005) pp 529ndash536
[45] N Omenetto EMSLIBS TALK Rome 2009
[46] U Panne C Haisch M Clara R Niessner Analysis of glass and glass melts during the vitrification process of fly and bottom ashes by laser-induced plasma spectroscopy Part I Normalization and plasma diagnostics Spectrochimica Acta Part B 53 (1998) 1957ndash1968
[47] MC Quintero A Rodero MC Garcia and A Sola Determination of the Excitation Temperature in a Nonthermodynamic-Equilibrium High-Pressure Helium Microwave Plasma Torch Applied Spectroscopy 51 202A-205A and 765-911 (1997)
[48] JB Simeonsson and AW Miziolek Time-resolved emission studies of ArF-laser produced micro-plasmas Vol 32 No 6 APPLIED OPTICS 1993
[49] M Milaacuten and JJ Laserna Diagnostics of silicon plasmas produced by visible nanosecond laser ablation Spectrochimica Acta Part B 56 (2001) pp 275ndash288
[50] G Cristoforetti A De Giacomo M DellAglio S Legnaioli E Tognoni V Palleschi and N Omenetto Local Thermodynamic Equilibrium in Laser-Induced Breakdown Spectroscopy Beyond the McWhirter criterion Spectrochimica Acta Part B 65(2010) 86-95
[51] J Hermann C Boulmer-Leborgne B Dubreuil and IN Mihailescu Influence of irradiation conditions on plasma evolution in laserndashsurface interaction J Appl Phys 74 (1993) pp 3071ndash3079
52
[52] DA Rusak BC Castle BW Smith JD Winefordner Recent trends and the future of laser induced plasma spectroscopy Trends in analytical chemistry vol 17 nos 8+9 1998
[53] JF Ready Effects of High-Power Laser Radiation (Academic New York 1971)
[54] E Tognoni V Palleschi M Corsi G Cristoforetti N Omenetto I Gornushkin B W Smith and J D Winefordner From sample to signal in laser-induced breakdown spectroscopy a complex route to quantitative analysis Laser Induced Breakdown Spectroscopy (LIBS) fundamentals and applications Cambridge University Press Cambridge UK (2006)
[55] A Ciucci M Corsi V Palleschi S Rastelli A Salvetti and E Tognoni New procedure for quantitative elemental analysis by laser-induced plasma spectroscopy Applied Spectroscopy 53 960 1999
[56] WT Chan and RE Russo Study of laserndashmaterial interactions using inductively coupled plasma-atomic emission spectrometry Spectrochimica Acta Part B 46 (1991) pp 1471ndash1486
[57] OV Borisov XL Mao and RE Russo Effects of crater development on fractionation and signal intensity during laser ablation inductively coupled plasma mass spectrometry Spectrochimica Acta Part B Atomic Spectroscopy Volume 55 Issue 11 2000 1693-1704
[58] RE Russo X Mao JJ Gonzalez and SS Mao Femtosecond laser ablation ICP-MS Journal of Analytical Atomic Spectrometry 17 1072ndash1075 2002
[59] DellrsquoAglio M De Giacomo A Gaudiuso R De Pascale O Senesi GS Longo S Laser induced breakdown spectroscopy applications to meteorites chemical analysis and composition profiles Geochimica et Cosmochimica Acta (2010) doi 101016jgca201009018
10
In this chapter we wish to recall briefly the basic fundamentals that we used in our
understanding of the laser-induced plasma and the spectroscopy of plasmas induced from
polymeric materials Many parameters can influence the plasma properties but we shall
first begin with the main differences between the plasma generations with femtosecond or
nanosecond laser pulses A further emphasis will be made between UV and IR
nanosecond laser pulses After briefly discussing the plasma formation we shall evoke
our methods for plasma diagnostics (electronic density and temperature calculations) The
spectral emission is used to calculate the electronic density (mainly Stark broadening) and
the different plasma temperatures (atomic ionic and molecular) These measurements
will allow us to assess the local thermal equilibrium (LTE) of the plasma An introduction
of calibration free LIBS (CF-LIBS) finishes off this chapter even if we still have not used
this method of analysis in this thesis The advantages associated with this technique have
greatly attracted us and we would like to implement it in our further works
2 PLASMA GENERATION The mechanisms involved in the ablation depend on a number of variables that effect the
interaction between the laser pulse and the sample target Firstly the properties of laser
pulses can lead to different interaction regimes with regards to the pulse duration the
wavelength and the fluence of the pulses Secondly the target (can be in a solid liquid or
gas form) and its properties also influence the ablation due to its specific laser absorption
mechanism and matrix effects Lastly the surrounding atmosphere during ablation such
as the pressure and the ambient gas (inert air vacuum etc) will also influence the plasma
generation and its expansion The main differences between nanosecond and femtosecond
laser ablation will be evoked here followed by the main mechanisms in which a plasma is
formed
Laser ablation consists of focalising an intense laser emission on a sample and removing
matter from the surface For a LIBS measurement a focalising lens directs and
concentrates the laser pulse energy on the surface of the material of interest For this
reason we shall often talk in terms of the pertinent factors which are the fluence (often
expressed in 119869 frasl 119888119898sup2) or the irradiance (often expressed in 119866119882 frasl 119888119898sup2 ) They allow us to
take into account the size of the section of the focalised beam and the laser pulse duration
11
respectively In order to generate a plasma the irradiance must be greater than what is
called the ablation threshold 119868119905ℎ (or a fluence greater than 119865119905ℎ) As a consequence the
locally removed mass exhibits rapid melting and evaporation to form a vapour This
vaporised mass is exploded out of the material at a supersonic velocity However only
when the vapour is sufficiently ionised can it be then called a plasma [2] We can note at
this point that our experimental research was conducted so that the laser fluence was
always above the threshold value to ensure the plasma generation
21 LASER-MATTER INTERACTION
The practical reason for which we would like to go into the further detail of the
fundamentals of the laser-matter interaction is because it will enable us to define the
appropriate optimisation of our LIBS experimental parameters For us this means finding
the parameters where we are able to acquire the most significant results As already
discussed the pulse duration has a significant impact on the ablation process In the
nanosecond regime there is a significant interaction between the laser emission and the
ablated material In the femtosecond regime the laser pulse does not directly interact with
the generated plasma This laser-plasma interaction therefore drastically influences the
plasma properties We shall start by discussing the nanosecond regime (in UV and IR)
then the femtosecond regime
211 Nanosecond Ablation
The most common type of laser used in LIBS is the nanosecond NdYAG which can
provide pulse in different wavelengths ranging from UV to IR Nanosecond lasers emit
pulses long enough (around 5 ns FWHM in our case) their ldquotailrdquo remains present during
plasma formation and expansion This leads to a significant post-ablation interaction
between them ie the laser energy continues to be absorbed by the vapour The laser
energy can be absorbed by atoms or molecules leading to their excitation or even their
ionisation [3] The laser energy can also be absorbed by free electrons leading to their
heating and the cascade ionisations due to subsequent collisions between electrons and
atoms or molecules The initial temperatures can be very high (6000 ndash 20000 K) with
high electron densities (1017 minus 1019 cmminus3) [4] The energy loss and cooling of the
12
electrons is mainly due to the thermal propagation into the target [5] The heat
propagation diffuses a few microns into the target causing it to melt in a non-
homogenous way creating craters with messy borders
Depending on the irradiance and the wavelength of the pulse the ablation mechanisms
can be either dominated by thermal (melting sublimation and vaporisation) or non-
thermal (direct molecular bond breaking) processes We will focus on laser irradiances
greater than 108 Wcmsup2 to create plasmas with high enough temperatures to ensure the
atomic excitation and ionisation of the metallic elements present in certain polymers The
subsequent laser-plasma interaction enables even further heating of the free electrons
within the plasma
The photon absorption in a plasma is mainly due to inverse Bremsstrahlung (IB) and
photoionisation (PI) processes since the other absorption mechanisms have smaller cross
sections and are ignored at this laser intensity [467] The consequence of IB is higher
temperature of electrons These excited electrons in turn collide with neighbouring ions or
neutral atoms more violently causing the liberation of other electrons and in turn ionising
more atoms This phenomenon is known as avalanche ionisation As long as the
electromagnetic field of the laser remains in interaction with the electrons this process
will repeat itself increasing the ionisation degree of the plasma [2] The cross sections of
the collisions between electrons-ions are much greater than those between electron-
neutrals
The inverse Bremsstrahlung (IB) absorption 120572119868119861(119888119898minus1) is approximately proportional to
1205823 as can be seen in Equation (11) The second part of the right hand side accounts for
the simulated emission [2 3]
13
120572119868119861 = 1198761198731198901198730 + 4 1198906 1205823 119873119890 119885sup2 119873119894
3 ℎ 1198884 119898119890
21205873 119898119890 119896119861 119879119890
12 1 minus 119890119909119901 minus
ℎ 119888120582 119896119861 119879119890
(11)
With 120572119868119861 inverse Bremsstrahlung absorption coefficient (119888119898minus1) 119876 cross section for electron-photon absorption (1198881198982) 119873119890 electron density (119888119898minus3) 1198730 neutral atom density (119888119898minus3) 120582 ablation wavelength (cm) 119885 ion charge (1 or 0) 119873119894 ion density (119888119898minus3) 119888 speed of light (119888119898119904) ℎ Plankrsquos constant (eV s) 119898119890 electron mass (119872119890119881119888sup2) kB Boltzmanns constant (eVK) T excitation temperature (K) e elementary charge
Another photon absorption process that initiates the plasma formation by producing more
free electrons is photoionisation Photoionisation is defined as the ionisation of an atom or
a molecule by a single or several photons that have a sufficient amount of energy to
directly eject an electron out of the atom or molecule When the combination of a few
photons is required the process is called multiphoton ionisation (MPI) The energy
associated to a photon is defined in Equation (12) and is inversely proportional to 120582 This
indicates that UV radiation will therefore more efficient for ionising atoms or molecules
then IR wavelengths
119864 = ℎ120584 =ℎ119888120582 (12)
Laser-plasma interaction is the main ionising mechanism of the vapour dominating the
direct ionisation of particles when vaporised [8] where 10 of the particles are
considered to be ionised [9 10] The coupling between the laser and the plasma
complicates the evolution of the plasma For example plasma screening (can also be
called shielding) can occur in a sufficiently dense plasma ie the electronic density
reaches the critical density 119873119888(119888119898minus3) defined by Equation (13) [8 10]
119873119888 = 1021
1205822 (13)
With 120582 wavelength (microm)
14
It can be seen that 119873119888 is inversely proportional to the square of the wavelength 120582(micro119898) ie
shorter wavelengths have higher critical densities diminishing the probability for
shielding When the plasma reaches this density the ldquotailrdquo of the laser pulse is reflected
backwards and its interaction with the plasma (especially the core) is no longer possible
For laser ablation of polymers there can be photochemical or photothermal ablation
There is even the possibility of having a mixture of both Photochemical ablation is
defined as the absorption of laser photon (or photons) to dissociate the molecular bonds
within the polymer and directly evaporate the matter Photothermal ablation is when heat
is dissipated within the sample to cause melting and etching [1112] which is more
commonly observed in laser ablation of metals
The ablation depth for polymers per laser pulse 119871 is expressed in Equation (14) The
logarithmic dependence with the ablation fluence can be applied to most solids even if it
is more commonly used for polymers [13]
119871 cong 120572minus1 ln 119865119865119905ℎ
(14)
With 119871 ablation depth per laser pulse (micrompulse) 120572 absorption coefficient of the sample (cm-1) 119865119905ℎ ablation threshold fluence (J cm-2) 119865 laser fluence (J cm-2)
Srinivasan felt the need to introduce another term to Equation (14) to put forth the
contributions of both the photochemical and photothermal mechanisms [14]
119871 cong 120572minus1 ln 119865119865119905ℎ
+ 119860 exp minus1198641119877119879
(15)
With 1198641 activation energy (119888119886119897 frasl 119898119900119897) T temperature of the sample (K) 119860 prefactor of the Arrhenius equation 119877 gas constant (119888119886119897 frasl (119870 119898119900119897))
15
a Infrared ablation (1064 nm)
For the ablation of polymeric materials the photoionisation is very weak in this regime as
the infrared photons do not carry a sufficient amount of energy to chemically break the
bonds Due to the insufficient amount of energy of one IR photon to break the chemical
bonds present in polymers it is more likely to see photothermal ablation in this case The
vibrational modes of molecules absorb the laser energy and diffuse it in the form of heat
This leads the sample surface to melt In order to have ablation a chemical bond needs to
absorb several quanta of laser energy to induce evaporation During this time however
the material located close to this area will undergo a melting process [11] This leads to a
low efficiency of matter removal by ablation The post-ablation heating observed in IR
ablation is quite efficient which leads to a higher temperature in the plume In fact Wang
et al [16] reported the plasma emission to be up to 5 times higher for IR emission for the
main carbon line at 248 nm The observed enhancement in optical emission from the
plasma is due to a higher temperature rather an increase in the ablated material due to the
high energy of the excited state
More specifically for the post-ablation interaction between the plasma and the laser in
this regime the main absorption mechanism is the inverse Bremsstrahlung as indicated in
Equation (11) causing strong electron heating in the plasma and cascade ionisations The
electron density of the plasma will then increase to the point where it reaches 119873119888 and
visible partial screening (also called shielding) of the plasma can be observed The laser
irradiance needs to be greater than 2 times 108 Wcmsup2 for plasma shielding to take place [3]
Chapter 2 presents shadowgraph images of the plasma in expansion to show this
phenomenon very clearly [2] When partial screening commences the laser pulse ldquotailrdquo
can no longer couple to the target material as its entire energy is absorbed by the plasma
or even reflected Therefore even when the fluence increases the ablation depth remains
low The consequence on the plasma expansion is the laser-supported detonation wave
(LSD) as it will be shown in Chapter 2
16
b Ultraviolet ablation (266 nm)
Inverse Bremsstrahlung is less efficient for UV ablation than in IR ablation However the
multi photon ionisation coefficient is much higher leading to a large number of ions [7]
The recombination processes that compete with the electron generation by multiphoton
ionisation may reduce the amount of charged particles in the plasma The critical electron
density is higher in this regime reducing the effect of plasma shielding This allows a
more efficient coupling between the laser pulse and the target The energy associated to
this wavelength is greater than 47 eV This means that the UV wavelength has enough
energy to chemically dissociate and break the bonds through multi photon process
within the matrix for most organic materials
When bonds are broken in a non-thermal manner ie not heat induced but more
chemically broken the ablation is said to be photochemical [17] When a polymer
absorbs a UV photon it can either excite the kinetic energy of its internal vibrational
transitions (photothermal) or directly break a chemical bond within the target [11] For
UV nanosecond ablation there is usually a mixture between both photothermal and
photochemical ablation The photochemical processes that intervene in UV ablation
results in higher ablation rates (ablation efficiency which is the ablated mass per laser
pulse per unit area [218]) Furthermore the rotational translational and vibrational
temperatures of ablated species are not in equilibrium The shockwaves have higher
initial velocities the surface swelling is faster and a lower ablation threshold value is
found when compared to IR ablation [219]
To conclude about the differences between the nanosecond UV and IR ablation regimes
regimes we present a model by Garrison et al [11] in Figure 1 which illustrates the
photochemical ablation (no melting can be seen around the crater just a clean expulsion of
matter) and the photothermal ablation (melting and evaporation)
17
Figure 1 Nanosecond laser ablation of polymers in air [11] at different time delays after laser impact a) UV ablation (1 photon per monomer) b) IR ablation (1 photon per monomer) c) IR ablation (4 photons of energy delivered to each monomer) There is a slight perspective in the drawings
212 Femtosecond Ablation
In the case of femtosecond ablation the phenomenon responsible for the ejection of
matter from the surface of a target is the Coulomb explosion otherwise known as non-
thermal melting When the electronic excitation energy due to the intense laser field is
transferred to the lattice phonons in the form of kinetic energy the atomic motion can be
so violent as to break the bonds that hold solids together The release of the electrons of
the solid [20] leaves behind a locally positively charged lattice Since the electrons are
negatively charged this mutual repulsion (Coulomb repulsion) creates an explosion
where a small cluster of charged and energetic ions creates a plasma
The energy absorbed by the electrons increases instantaneously but the time it takes for
them to transfer their energy to the lattice phonons depends on the thermal conductivity of
the sample [15] and cannot be neglected for femtosecond ablation For femtosecond
ablation the heat diffused to the target represents only a tiny part of the laser energy The
rest of the very intense beam is used to create photothermal changes and multi-photon
ionisation
The craters produced in this regime have smoother edges and can be processed more
precisely compared to the craters induced by nanosecond pulses This can be due to the
absence of the liquid phase in femtosecond ablation The velocity of the ejected mass is
a cb
18
considerably faster than the thermal velocity of the particles [18] Photons from visible
and IR femtosecond pulses do not have enough energy for ionisation The absorption of
several photons (multi-photon absorption MPA) makes the ionisation possible but makes
the process more sensitive to the laser intensity [21] 119872119875119860 = 120590 119868119898 where 119898 satisfies the
equation 119898ℏ120596 gt 119864119892 Due to the higher peak intensities of ultrashort laser pulses the
interband transitions are significantly increased Ablation efficiency is best for
femtosecond pulses and it is improved for ns pulses when the laser wavelength decreases
on metal targets [18] Our shadowgraph experiments will demonstrate that this is also the
case for polymeric targets
In femtosecond ablation the laser pulse is absent during the plasma expansion meaning
that there is no interaction between the laser pulse and the expanding plasma The pulse
shielding effects is totally absent Due to high intensity of a femtosecond pulse it can
however create an ionised channel by breaking down the air molecules during its passage
This can be observed in the shadowgraphs in Chapter 2
22 PLASMA FORMATION Figure 2 shows the different steps observed during the nanosecond ablation of a solid
sample The laser pulse strikes the sample surface (a) where it is first absorbed The
energy absorbed is rapidly converted into heat and causes the sample to locally melt Due
to the focalisation that increases the irradiance the laser beam contains enough energy to
induce vaporisation and fragmentation (b) The boiling point is reached when the pressure
of the vapour exceeds that of the ambient environment As seen before for intensities
higher than 108 Wcmsup2 a large number of electrons ions and excited atoms are present in
the vapour and absorb part of the laser energy leading to a breakdown in the vapour and
its ionization (c) [67] At this moment the plasma is dominated by the continuum
emission that overbears any other atomic emissions The emission detected in this phase
is mainly due to the Bremsstrahlung and the recombination processes
When the laser pulse is over the plasma continues to expand very rapidly attaining
supersonic velocities [11] (~ 106 cms) perpendicular to the surface The ions formed at
the beginning start to capture the free electrons leading to neutrals De-excitation of ions
19
and neutrals lead to the emission of characteristic photons a very important point that
allows us to determine the concentration of the elements in the plasma with the LIBS
technique (d) This phase is followed by the formation of aggregates and clusters due to
the decrease in temperatures (e) which are deposited around the crater along with the
molten material created by the laser melting (f)
Different time stages can be studied during the expansion of the plasma Figure 1 shows
the time evolution of these stages (A B C and D) with regards to a femtosecond and
nanosecond laser pulse duration The first phase A represents the time that the laser pulse
transfers its energy to the sample The laser photons are immediately absorbed by the
surface electrons (~10-15 s) It then takes ~100 fs for them to thermalise amongst
themselves and transfer their energy in turn to the lattice phonons (a few ps) Followed by
phase B where the plasma vapour containing ions atoms and molecular fragments
initiates its expansion into the surrounding environment Due to the supersonic velocity of
this expansion a shockwave engulfs the plasma This expansion continues for several
microseconds From the formation of the plasma and until its dissipation it emits
radiation The continuum radiation is followed by the ionic atomic and molecular
emission lines that can be used to determine the elements present within the plasma In
phase C the excited ions atoms and molecules return to a more stable state by emitting
photons The plasma further relaxes in phase D where its temperature falls below the
fusion temperature and the condensation starts to form nanoparticles [1] In this thesis we
will mainly focus on parts B and C where the expansion and the spectral emission of the
plasma will be studied
20
Figure 2 Plasma formation for nanosecond pulses with sufficiently high fluence [2223]
ns laser pulse
e
Polyatomicagregats
f
Deposition of ablated material
a
Laser
1 fs
bVapor
Fragmentation
100 ps
c
Shockwave
Emission
Absorption
1 ns
d
Plume expansion
1 ns ndash 100 micros
21
3 LIP EMISSION SPECTROSCOPY
31 LIP EMISSION
Laser-induced breakdown spectroscopy (LIBS) uses the spectral emission from the laser-
induced plasma (LIP) for elemental analysis of the target However from the moment the
plasma is formed until the moment it is dissipated it goes through different stages The
spectra collected at different delays and different gate widths are therefore different Figure
3 shows the evolution of the optical emission intensity with regards to the time after the
laser pulse strikes the sample It can be divided into two parts a very intense signal that
comes from the continuum and the atomic or molecular signals used to characterise the
sample At early delays (especially when the laser pulse is still present) the optical signal is
dominated by a strong continuum emission During laser ablation ions and neutral atoms
are liberated and are further ionised by the laser pulse Therefore ionic lines are first seen
followed by atomic and finally molecular spectral emission lines The delay after laser
impact chosen and the gate width are important criteria depending on what is to be
analysed Time-resolved studies are the best way to find the most adequate time delay and
gate width according to the application
Figure 3 The evolution of the intensity emission from a laser induced plasma [24]
1ns 10ns 100ns 1micros 10micros 100micros
Time after laser impact
Inte
nsity
[au
]
Laser
Continuum
Atomic lines (I)
Ionic lines (II)
DelayGate
Molecular lines
pulse
Gate of detector
22
Since these excited states are not stable the electrons within the atoms and molecules will
return to more stable energy levels by releasing their excess energy in the form of photons
(Figure 4) This can be done either by spontaneous emission or by intense enough
collisions Contrary to the continuum radiation the photons emitted (ℎ120584119894119895) are specific to
their transitions and therefore represent different atomic or molecular information This
information is the essential for the diagnostics of the plasma ie calculate the electron
density and the temperature
Figure 4 Continuum and Spectral line emission
Bremsstrahlung Radiation
In the first picoseconds the electrons and ions start colliding and interacting When a free-
electron is decelerated in the presence of a strong electromagnetic field such as the one of
an atomic nucleus the loss of kinetic energy is transformed into radiation shown in
Figure 5 This process is called Bremsstrahlung which is the German term meaning
ldquobraking radiationrdquo Since the electron started being free and after the interaction
remained free it is known as a free-free transition However when a free electron is
captured by an ion instead of being deviated this leads a free-bound transition The
n = 1
n = 5
n = 3n = 4
n = 2
En(eV)
0 n rarrinfin
Excitation
Ionisation
hν21Emission
Continuum
Spectral discrete emission lines
Continuum emission
23
excess kinetic energy is given off in the form of a photon resulting in recombination
radiation These two radiation mechanisms are responsible for the continuum emission
Since this emission is mainly due to the free electrons present in the plasma it does not
represent any spectral lines
Figure 5 Bremsstrahlung radiation
Spectral line emission
The LIBS technique is based on the study of the light emission from a laser-induced
plasma After an enough long delay a discrete spectrum is recorded with peaks produced
at specific wavelengths This means that every peak corresponds to an element and this is
how we use the plasma to characterise the ablated matter For molecular lines it often
comes in a group of lines which can be observed in the results in Chapter 3 Between the
time the photon is emitted and the time it is detected it has the possibility to get
reabsorbed by other ions or atoms An optically thick plasma means most of the radiation
cannot escape the plasma due to high absorption When the photons are directly detected
the plasma is said to be optically thin This is the ideal situation for LIBS but
unfortunately this is not always the case Corrections have to be made and some spectral
lines have to altogether be ignored to avoid erroneous interpretations
Self-absorption and Self-reversal
Electron approaching a positively charged
particle with energy E1
Electron changes direction and decreases
in energy E2
Positively charged particle
The sudden decrease in energy results in the emission of a photon
(E2 - E1)
h f = E2 ndash E1
E1
E2
e
e
24
The corrections are not the same depending on how the photon is reabsorbed If the
photon emitted from one atom is absorbed by another atom of the same element close by
considered to be at the same temperature and surrounded by the same electron density
the spectral line is said to be self-absorbed Transitions which involve the fundamental
level are more affected by such perturbations When a photon is emitted from the hot core
of the plasma and absorbed by an atom of the same element in the cooler exterior where
the temperatures and the electronic density differ the phenomenon of self-reversal is
observed Both phenomena give rise to distorted spectral lines which can be seen in
Figure 6 Self-reversal results in broadening but most importantly it is marked by a dip in
the centre of the peak Self-absorption broadens the spectral line making it difficult to
distinguish from other non-distorted lines
Figure 6 Self-absorption (upper) and Self-reversal (lower) spectral distortions [25]
A lot of emphasis is given to spectral line analysis because they are the basis of plasma
diagnostics and the technique of LIBS For example the electronic density can be found
by studying the spectral line width and the temperature can be calculated using the line
intensities Due to the self-absorption or self-reversal it is crucial to carefully select the
Wavelength (nm) Wavelength (nm)
Inte
nsit
y (a
u)
Inte
nsit
y (a
u)
Absorption of a photon by a near by atom with not a large
difference in temperature(T1 harr T1 ) and (T2 harr T2)
Absorption of a photon by a far away atom with a large difference in temperature
(T1 harr T2)
Emission (T Ne N1)
Absorption (T Ne N2)
Emission (T1 Ne N1)
Absorption (T2 Ne N2)
Resulting Profile
Resulting Profile
25
spectral lines Self-absorbed lines are not always easy to identify because of having the
same allure as non absorbed lines The spectral lines chosen should ideally have [26]
strong intensity in the working spectral range
minimum overlapping with other lines
minimum self-absorption
without saturation for the detector
In practice these ideal lines are very difficult to attain altogether There are a few
compromises that need to be done For example when a line is known to be self-
absorbed their intensities should be corrected before being used or otherwise excluded
from the calculations Lines that include the fundamental level should also be avoided
[27] from a certain value of the electron density
32 PLASMA DIAGNOSTICS
The plasma dynamics and time evolution have interested many researchers for a few
decades [13 28 29] Temporal and spatial evolutions have been extensively studied to
understand the different mechanisms that occur after laser impact A certain emphasis is
taken on electron density and temperature calculations from spectral data Some of these
calculations particularly the those for estimating the plasma temperature can only be used
when the plasma is considered to be at a certain equilibrium known as the local
thermodynamics equilibrium (LTE)
Before going into more detail regarding LTE explanations on the electron density and
temperature calculations will be first explained For now very simply LTE first requires
that the plasma has a certain electron density larger than a critical value (equation (142))
and then that all the species present (atomic ionic and molecular) be defined by the same
and unique temperature In other words the excitation temperatures of different spaces
(atoms ions and molecules) must have the same value as temperature of the electrons
For the LIP plasma a transient and expanding plasma other criteria which takes into
account the time evolution and the inhomogeneity of the plasma need to be considered
26
[30 31] Only when these criteria are fulfilled the LTE can be considered In addition
for a typical LIBS plasma only neutral and singly charged ions are taken into account for
the following calculations [24]
321 Electron Density Calculation
The different spectral line broadening mechanisms need to be understood in order to
correctly extract the electronic density Each of them has a particular influence on the
spectral line Some are represented by the Gaussian profile and others the Lorentzian one
This will be explained in more detail below followed by stating how the electron density
can be calculated
a Broadening Mechanisms
Natural line broadening
The natural line broadening is due to the finite time that an atom spends in its excited
state 119864119894 and results in a Lorentzian profile [32] If the mean time at 119864119894 is Δt then the
Heisenberg uncertainty principle states that
Δ119864119894 Δ119905119894 ge ℎ
2120587 (16)
The frequency 120584119894119895 (119904minus1) considered for a transition from 119864119894 to 119864119895 is
120584119894119895 =119864119894 minus 119864119895ℎ (17)
Considering the finite line width Δ120584119873119886119905119906119903119886119897 (119904minus1) the natural broadening can be
expressed as
Δ120584119873119886119905119906119903119886119897 = 1Δ119905119894
+ 1Δ119905119895
2120587 (18)
27
The value at the spectral range of 300 nm is of the order of 0000005 nm which means
that it will be neglected for atomic spectra from a laser induced plasma
Doppler broadening
The Doppler broadening [32] is the broadening of spectral lines due to the Doppler Effect
resulting from the thermal motions of atoms and molecules in the plasma (some moving
towards and others away from the detector) The higher the temperature or pressure
within the plasma the faster the particles move increasing the chances of collisions The
particles in motion are considered to have a Maxwellian velocity distribution resulting in
a Gaussian spectral broadening profile The FWHM of the profile depends only on the
frequency of the spectral line the mass of the emitting particles and their temperature as
can be stated in (110)
∆12058212
119863119900119901119901119897119890119903 = (716 times 10minus17) 120582 11987911987212 (19)
With 119879 emittersrsquo temperature (K) 119872 atomic weight (amu) 120582 wavelength (Aring)
For the spectral range frequently used in LIBS (UV to IR) Doppler broadening is not the
main line broadening mechanism If an extremely high plasma temperature is considered
(105 119870) the corresponding Doppler broadening for the visible range is only 001 nm
This is negligible compared to actual spectral line widths
28
Stark broadening
Collision-induced broadening sometimes called pressure broadening is a result of the
deformation of atoms or molecules when they bounce off each other For example they
may not be as symmetrical after a collision as they were before These deformations
perturb the quantum mechanical energy levels of the atom or molecule slightly shifting
the frequencies of the emission or absorption lines Just like Doppler broadening the
spectral lines are therefore broadened This effect depends on both the pressure and
temperature of the gas
Stark broadening is a particular case of pressure broadening where atoms interact with the
neighbouring charged particles such as ions and electrons According to quantum
mechanics the interaction will slightly modify the energy levels considered in the
transition inducing the spectral line to broaden The broadening is homogeneous and
corresponds to the Lorentzian profile It follows from the Lorentz Force Law that the
magnitude of the perturbing electric field (119865) created by fast moving electrons and
relatively slow ions (119890) at a certain distance (119903) is given by
119865 = 1
41205871205760 119890119903sup2
(110)
During the plasma expansion where the electron density of the plasma is quite high this
is the main broadening mechanism dominating the natural and Doppler mechanisms [8]
Instrumental broadening
Measured line profiles also experience influence from the instrument resolution It is
dependent on the slit width the grating dispersion and the detector Diffraction from a slit
gives us a cardinal sinusoidal pattern which can be approximated using a Gaussian
profile
29
b Electron Density
Finally with all these mechanisms taken into consideration the spectral lines can be fitted
with a Voigt profile the result of the convolution of Lorentz (Stark broadening) and
Gaussian (Instrumental broadening) Natural and Doppler broadening are considered as
negligible for atomic spectra of a laser-induced plasma [26]
119881(120582 (119899119898)) = 119866120582 Δ120582119863119900119901119901119897119890119903 Δ120582119868119899119904119905 otimes 119871(120582 Δ120582119878119905119886119903119896) (111)
Δ120582119866119886119906119904119904(119899119898) = Δ120582sup2119863119900119901119901119897119890119903 + Δ120582sup2119868119899119904119905 (112)
Linear Stark Effect
The line width and the electronic density of the plasma are closely linked with each other
There exists a direct relationship between Stark broadening and the electronic density
especially at short delays where the plasma is quite dense [32] For hydrogen this
relationship is linear because of its linear dependence with the Lorentz force which
results in a symmetrical broadening The electron density can be calculated using the
following equation [32]
119873119890(119888119898minus3) = 802 times 1012 Δ120582s
12057212(119873119890119879)32
(113)
With Δ120582s FWHM of the line (Aring) 12057212 half width of the reduced Stark profile(Aring)
The parameter 12057212 depends slightly on the excitation temperature 119879119890119909119888 and the electron
density 119873119890 Values of this parameter can be found in ref [32] with precision in the range of
10
Quadratic Stark Effect
For other non-hydrogen-like atoms stark broadening is proportional to Fsup2 and is thus
called the quadratic Stark effect Their density can be calculated using the following
equation
30
119873119890(119888119898minus3) = 119873119903119890119891Δ1205821198781199051198861199031198962120596119903119890119891
(114)
With 119873119903119890119891 reference 119873119890 (~ 1016 minus 1017 119888119898minus3) ωref impact parameter at this reference density
Hydrogen Balmer 119919120630 Emission
Even though both linear and quadratic Stark effects are observed in the LIBS spectra
more focus is taken on extracting information from hydrogen or hydrogen-like atoms
Their linear dependence allows more accuracy and ease when calculating the half width
of line profiles providing more reliable results [8 26] The hydrogen Balmer line 119867120572 (656
nm) emission line width in function of the detection delays is often used to study the
temporal evolution of the electron density in the plasma during its expansion and decay
[33]
In organic materials the presence of hydrogen in the matrix allows for a well isolated
and significantly intense peak In addition this line is strongly affected by the linear Stark
effect [32] Its use for electron density determination has been extensively reported for the
diagnostics of laser ablation plasma [34 35] The surrounding electrons are mainly taken
into consideration rather than the ions which have a much weaker impact on the total line
broadening [36] Even though hydrogen is part of the polymer matrix 119867120572the auto-
absorption can be neglected as long as the electronic density is less than 1018 119888119898minus3 [35]
Figure 7 shows 119867120572 spectral line fitted with Voigt profiles for a potato Measurement were
taken at different delays (100 300 600 and 1000 ns) after laser impact to put forth its
evolution with time A narrowing of the line along with a shift towards smaller
wavelengths can be seen
31
Figure 7 Stark Broadening The 119815120514 fitted with Voigt profiles for a potato sample Different laser impact delays were taken (100 300 600 and 1000 ns after laser impact) [37]
322 Temperature Calculation
For temperature calculations the differences between the line intensities are taken into
account rather than the broadening There are different methods Boltzmann (one element
one species (neutral or ions)) plot Saha-Boltzmann plot (one element different species
(neutral and ions)) ionic temperature (one element in its neutral and ionic state) and
molecular temperature (vibrational) To estimate the temperatures it must be assumed
that the plasma is in LTE
a Boltzmann method (Excitation temperature)
There is a correlation between the transition emission (observed by a spectral line in the
spectrum) and the Boltzmann equation At 0 K all the atoms are in their fundamental
electronic configuration In addition at this temperature they are considered to be
motionless with absolutely no kinetic energy As the temperature increases they begin to
move and gain more energy to access different excited configurations as can be seen in
Figure 8 The distribution of this population follows the exponential nature of the
Boltzmann law
645 650 655 660 665 67000
02
04
06
08
10
Ca (6
439
1 nm
)
Ca (6
462
6 nm
)
Ca (6
493
8 nm
) 100 ns 300 ns 600 ns 1000 ns
Norm
aliz
ed In
tens
ity (a
u)
Wavelength (nm)
Hα (65627 nm)
32
Figure 8 Boltzmann electron population distribution at different energy levels
At a sufficiently high temperature collisions between electrons and atoms can become
efficient to excite atoms The population distribution among the different energy levels
obeys the exponential law present in the Maxwell-Boltzmann distribution [34]
119873119894119885 = 119873119885 119892119894119890
minus119864119894119885
119896119861119879
119880119885(119879) (115)
With 119873119894119885 number of particles in state i (119888119898minus3) 119864119894119885 energy of the i-th state (eV) gi degeneracy of energy level i T absolute temperature(K) N total number of particles (119888119898minus3) Z Z=0 (neutral) and Z=1 (singly-charged ions)
The denominator 119880119885(119879) is known as the partition function and can be calculated by
equation (122) Due to the difficulties associated with these calculations we only state
the equation required but we do not calculate it ourselves
119880119885(119879) = 119892119894119894
119890minus119864119894
119885
119896119861119879
(116)
With 119880119885(119879) partition funtion
T = 0 K Warm Hot
j
i
hνijAij
Ei gi
Ej gj
En (eV)
33
The excited atoms return to their lower energy configurations by emitting photons
Spectral lines corresponding to the transitions between these different levels can be
observed in emission spectra Each photon has a specific wavelength that is unique for
every transition enabling us to detect the elements present The line intensity can be
calculated by the following formula
119868119894119895119885 = 1
4120587 ℎ120584 119873119894119885 119860119894119895 = 1
4120587ℎ119888120582119894119895
119873119894119885119860119894119895 (117)
With 119868119894119895119885 line intensity 120582119894119895 wavelength of the transition (119899119898) 119860119894119895 transition probability
If the Boltzmann equation is used in the equation (126) the intensity can be written as
119868119894119895119885 = 1
4120587 ℎ119888120582119894119895
119873119885 119892119894 119860119894119895119880119885(119879) 119890119909119901 minus
119864119894119885
119896119861119879 rArr
119868119894119895119885 120582119894119895119892119894 119860119894119895
= 1
4120587 ℎ119888119873119885 119880119885(119879) 119890119909119901 minus
119864119894119885
119896119861119879 (118)
In a more simplified version the linearization of the spectral intensity line represents the
wavelength intensity with regards to the different energy transitions for the same species
(neutral or ionic)
119897119899 119868119894119895119885 120582119894119895119892119894 119860119894119895
= minus1119896119861119879
119864119894119885 + 119897119899 1
4120587ℎ119888119873119885
119880119885(119879) (119)
If the upper excited energy levels of a given species are known along with the statistical
weights transition probabilities and wavelength for some transitions then the excited
temperature can be deduced by measuring the emission radiances [38] The use of
transitions between largely separated levels leads to more precise results because the line
fit becomes more reliable This method is known as the Boltzmann plot (BP) method
[26] Assuming the LTE is established within the plasma the population in different
levels is governed by the Boltzmann distribution
The value of Aji is only known with a precsion in the range of 10 - 30 depending on the
transitions used Some authors believe that in practice the linearity of the plot is an
34
indication for the satisfaction of LTE [39 40] while others think that a straight line can
also be obtained even when the level population is out of LTE [41] Both agree that the
excitation temperature of a species within a plasma in LTE is inversely proportional to
the slope of the Boltzmann plot minus 1119896119879119890119909119888
shown in equation (129) The measurement of
the line intensities is therefore a crucial factor to obtain the optimal temperature
calculations using the BP method For this an intensity calibration of the detection
system must be performed especially when the selected lines extend over a large spectral
range It goes without saying that self-absorbed or self-reversed lines will lead to
inconsistent temperatures
For more reliable results the spectral lines should be well isolated without interference
from other transitions These conditions can be satisfied for transition metals such as iron
or titanium or alkaline earth metals such as calcium for which a large number of
transitions are available in the visible spectral range The elemental metallic trace lines
present in the polymer spectra are the result of contaminations that come from fillers and
additives added to enhance physical properties Their presence facilitates the temperature
calculations especially titanium because the organic elements (C H O and N) do not
have enough lines for such measurements
b Saha-Boltzmann Plot Method
The Boltzmann plot method has the convenience of being relatively simple but it is not
very accurate The energy gap between the upper levels of the two lines is usually small
for the same ionisation degree [42] One way to make it more precise is to significantly
extend the range of 119864119894 This can be done by using both ionic (II) and atomic (I) elements
on the same plot by combining the Boltzmann distribution with the following Saha
equation
119873119890119873119911
119873119911minus1 =2119880119885(119879)119880119885minus1(119879)
2120587119898119890119896119861119879
ℎsup232
exp minus 119864infin119885minus1 minus ∆119864infin119885minus1
119896119861119879 (120)
With 120549119864infin119885minus1 correction of the ionization energy 119864infin119885minus1 119864infin119885minus1 ionisation energy of the lower ionisation stage
35
This method named the Saha-Boltzmann plot method allows a significant extension of
the range of Ei distributing the data from the spectra over a larger range of energy
allowing for a more accurate linear plot
The following calculations are considered for a plasma in LTE therefore we can consider
that the excitation temperature 119879119890119909119888 and the ionisation temperature 119879119894119900119899 are equal The
Boltzmann and Saha equation are then defined by a single temperature value The result
is an equation similar to that of the BP method but with a few corrections
119897119899 119868119894119895119885 120582119894119895119892119894 119860119894119895
lowast
= minus1119896119861119879
119864119894119885lowast + 119897119899
14120587
ℎ1198881198730
1198800(119879) (121)
With 1198730 number of neutral atoms (Z=0) 1198800(119879) partition function for neutral atoms (Z=0) ions and electron values included
The equation is valid for atoms that are both neutral and ionised but in order to plot them
on a same graph there must be some adjustments (designated by ) made to the abscise
(119864119894119885) and the ordinate ( 119897119899 119868119894119895119885 120582119894119895119892119894 119860119894119895
) values in equation (128) There is a likelihood law to
find atoms ionised more than once in a LIBS spectra It is important to note that for
ionised marked species (119885 ge 1) the quantities with the superscript must be replaced by
the following expressions
For the abscise values
119864119894119885lowast = 119864119894119885 + 119864119894119900119899 (122)
With 119864119894119900119899 ionisation energy
For the ordinates
119897119899 119868119894119895119885 120582119894119895119892119894 119860119894119895
lowast
= 119897119899 119868119894119895119885 120582119894119895119892119894 119860119894119895
minus 119911119897119899 2(2120587119898119890119896119861)32
ℎ311987932
119873119890 (123)
119864119894119900119899119864119894119885Obviously for 119885 = 0 (neutral atoms) the Saha-Boltzmann equation becomes
identical to the Boltzmann equation since the last term becomes equal to 0 For ionised
species this term depends on the temperature 119879 therefore an iterative procedure needs
to be used to determine the temperature and plug it into the equation In practice only a
few iterations are needed to converge
36
c Ionic Temperature
The ionic temperature also uses the combination of the Saha and the Boltzmann equation
previously mentioned In this case the temperature can be found for an ionised species of
a given element The use of LTE conditions which states that the ionic and excitation
temperatures are equal along with the transition information of two different ionisation
degrees (119911 = 0 and 119911 = 1) gives the following intensity ratio between ions and neutral
atoms [42 43]
119868119894119900119899119868119886119905119900119898
= 483 times 1015
119873119890 119892119894 119860119894119895
120582119894119895119894119900119899
120582119894119895119892119894 119860119894119895
119886119905119900119898
11987932119894119900119899 119890119909119901minus119864119894119900119899119885 minus 119864119886119905119900119898119885
119896119861119879119894119900119899 (124)
With 119864119894119900119899119885 energy of the upper level of transition for ions 119864119886119905119900119898119885 energy of the upper level of transition for atoms
With a known ionisation energy 119864119894119900119899 and electronic density 119873119890 (measured by Stark
broadening described previously) along with the spectroscopic parameters of both these
transitions the ionic temperature can be calculated
d Molecular Temperature
The plasma is expected to have both ionic and atomic spectra but of polymers (detailed
in Chapter 2) molecular emission is also expected Mostly we see spectral lines emitted
by CN and C2 which can be used to calculate the molecular temperature The theoretical
considerations in Figure 4 show that molecules are created after the atoms and ions ie
their spectral emission should be observed after the ionic and atomic ones as shown by
our experimental results in Chapter 3
The vibrational temperature is determined with CN molecular band head emission present
in organic materials The vibrational temperature is extracted using the method described
in ref [42] Diatomic molecules possess many vibrational levels where molecules in the
upper vibrational state νprimecan decay into lower electronic states νprimeprime They put forth the
correlation between the sum of the band strengths and with the number of molecules in
each respective state as can be seen in Equations (132) and (133)
37
119868(120584prime 120584primeprime)
1205844 120584primeprime
prop 119873120584prime (125)
119868(120584prime 120584primeprime)
1205844 120584prime
prop 119873120584primeprime (126)
With 120584prime vibrational upper electronic state (119888119898minus1) 120584primeprime vibrational lower electronic state (119888119898minus1) 120584 frequency (119888119898minus1) 119873120584prime numbers of molecules present in 120584prime (119888119898minus3) 119873120584primeprime numbers of molecules present in 120584primeprime (119888119898minus3)
If we consider that the LIBS plasma is in local thermodynamic equilibrium it can be
possible to calculate the number densities of an excited molecule by using Equation
(134)
120584119894119895 = 119864119894 minus 119864119895ℎ
1198971198991205824 119868120584prime120584primeprime120584
= 1198621 minus 119866( 120584prime ) ℎ119888
119896119861119879119907119894119887 (127)
With 120582 wavelength of each transition 120584rsquo 119886119899119889 120584rdquo (nm) 119866( 120584prime ) vibrational term value to 120584prime 1198621 constant 119879119907119894119887 vibrational temperature (K) 119868120584prime120584primeprime measured intensity
By plotting lnsum λ4 Iνprimeνprimeprimeνprimeprime with regards to G(νrsquo) the slope provides the determination of
the vibrational temperature The results have been further confirmed by using the
temperature calculation by the spectrum simulation with the LIFBASE software [37] for
temperature ranging from 5000 to 20000 K The comparison showed good agreements
with a typical accuracy of 5-10
4 LOCAL THERMODYNAMIC EQUILIBRIUM The first optical thinness has already been discussed According to the talk presented by
Omenetto at EMSLIBS [45] there are two essential criteria that need to be filled in order
to consider the LTE The criteria are an electronic density minimal requirement
(McWhirter criterion) and the definition of a unique plasma temperature for all species in
the plasma
38
41 ELECTRON DENSITY CRITERION For the population of excited states for the elements in the plasma to be predominately
caused by collisions with electrons and not by radiative processes it requires a minimal
electron density to ensure these collisions The radiative processes explained before such
as photon absorption recombination radiation and spontaneous emission are in this case
negligible This minimal electron density is known as the McWhirter criterion and is
defined as [50]
119899119890 ge 16 times 1012 11987912 (∆119864)3 (128)
With ∆119864 (119890119881) largest gap between 2 adjacent energy levels T (K) plasma temperature
This condition is deduced for hydrogen and hydrogen-like atoms in an optically thin
stationary and homogenous plasma [45] The largest gap for hydrogen is indeed between
the ground state and the first excited energy state and corresponds to 4 eV This is not
always the case for other elements Figure 9 shows that the largest energy gap for oxygen
does not include the ground state In this case the largest gap must be used
Figure 9 Oxygen energy levels [45]
1
2
3
kj ih
E max g max
E min g min
GROUND STATE
ΔE 12 ~ 33 eVΔE 13 ~ 5 eV
ΔE max ~ 10 eV
39
Considering a plasma at 7000 K the required electronic density comes out to
119873119890 = 86 times 1015119888119898minus3 (129)
This is the necessary but not sufficient requirement for the LTE that is typically fulfilled
during the first stages of the plasma lifetime Due to the large 120549119864 often associated with
the lower lying energy states this condition can be difficult to satisfy A solution would
be to use higher excitation levels were ΔE are close enough to allow the equation to hold
the plasma would be in partial LTE
42 TEMPERATURE CRITERION
As explained previously the plasma consists of different particles (atoms ions
molecules hellip) in excited or fundamental states In addition different energy processes
take place within the plasma and can each be characterised by their own temperature
Therefore there is not clear definition of the plasma temperature unless the different
temperatures converge and one can describe the entire plasma with one and unique
temperature Otherwise the notion of plasma temperature would be confusing as it would
not be clear as to lsquowhatrsquo temperature was in question Four different temperatures can be
used to characterise the plasma and are listed below
Kinetic energy (Maxwell-Boltzmann distribution law) electron temperature
This energy is associated the motion of the electrons In the case of plasma it defines the
energy of the electrons that obey the Maxwell distribution law ie the Maxwellian
velocity distribution The interactions involving electrons and other particles are not taken
into consideration here just their free motion between subsequent collisions The
Maxwell-Boltzmann distribution law is characterized by the electron temperature
Internal energy (Boltzmann law) excitation temperature
Elements (atoms ions or molecules) in the plasma have the ability to access higher
energy configurations as the temperature increases The population amongst these excited
configurations obey the Boltzmann law characterised by the excitation temperature
40
Ionisation energy (Saha law) ionic temperature
Saharsquos law is used to describe the population distribution among successive ionisation
degrees within the plasma ie the distribution of the same element in different ionisation
stages In a typical LIBS spectrum and mainly for what concerns us this is limited to
species ionised only once
Radiation energy (Plankrsquos law) radiation temperature
Plankrsquos law describes the spectral radiance distribution from electromagnetic radiation
emitted from a black body ie optically thick plasma
Each one of these processes can attain their own individual equilibrium without being in
equilibrium with the rest However for complete thermal equilibrium (CTE) all the
temperatures must be simultaneously equal defining one and unique plasma temperature
119879119890minus equiv 119879119890119909119888 equiv 119879119894119900119899 equiv 119879119903119886119889 (130)
Complete LTE
For the LIBS plasma the complete thermodynamic equilibrium cannot be attained
because one expects an optically thin plasma As stated the Plank law requires the plasma
to be optically thick at all frequencies [24] Optically thick plasma means the line
intensities are distorted and misleading due to re-absorption of emitted photons within the
plasma The radiative life of the emitting particles and the duration of the laser pulse are
much smaller than the duration of the radiative life of the plasma So the emission is not
due to the photo-excitation mechanism but rather the thermal electron impact excitation
In a typical LIBS plasma in the typical time frame emission from electron collisions are
said to be the rate determining mechanisms dominating the radiative emission These
reasons explain why the radiation temperature is often decoupled from the others
allowing the opportunity to find a temperature that satisfies Maxwell Boltzmann and
Saha laws In this case we cannot talk about CTE but instead we talk about LTE
41
When considering a plasma in LTE 119879119890minus equiv 119879119890119909119888 equiv 119879119894119900119899 meaning the temperature that
depicts the population of atomic and ionic energy levels is the same for the atoms of the
same element in different ionisation stages Light emission collection depends on the
angle aperture of the collection apparatus Even if a plasma is in LTE it takes into
consideration only the mean values of T and Ne but not the spatial decoupling where the
plasma has different temperatures at different spatial positions Panne et al [46] noticed
that the geometrical observation in LIBS setup generated different temperatures and
electronic densities The influence of the collection system must be taken into
consideration when comparing spectral data obtained by different methods
The use of BP method to evaluate the LTE leads to erroneous results [47] due to the lack
of sufficient spectral lines used The ionisation temperature obtained by the Saha law
provides a better estimate for the real plasma properties [48] Milan et al [49] found
through spatially resolved measurements of ablation of a silicon sample that the cooler
regions near the exterior of the plasma affected the excitation temperature more than the
ionic temperature Hence since most temperature evaluations are based on a space
averaging technique the ionisation temperature seems to provide more accurate results
They concluded that 119879119890119909119888 = 119879119894119900119899 on silicon sample after 2 micros Others have taken another
step forward by calculating the vibrational temperature when molecular spectra are
detected Hermann et al [51] deduced that the electronic temperature converged with the
vibrational temperature associated to graphite samples only after 1 micros At this point there
was a thermalisation between the electrons and heavier particles Rusak and al [52] added
the temperature associated with the rotational energy of molecular bands only to notice no
LTE during the first micros of the plasma for power densities lower than 1 (119866119882) frasl 119888119898sup2
They did deduce the equilibrium between the excitation and vibration temperature
however
Whilst some authors like Capitelli et al [4] doubt that there can be a true existence of LTE
in laser induced plasma due to the high imprecision of the partition function values
Simeonsson and al [48] estimated that kinetic equilibrium between electrons and heavier
ions and neutrals was reached only 10 ns after the laser pulse impact while the excited
states needed 50 ns to reach a Boltzmann-like distribution for H C O and Cl Amoruso
and al [6 7] support this hypothesis stating that the electrons could effectively transfer
42
their absorbed energy on to other ions during the laser pulse The time needed for the
transfer is between 10minus10 minus 10minus11 119904 according to [53] much shorter than most laser
pulse durations They conclude that the electron temperature can be assumed to be nearly
the same as the ion temperatures
Finally the state of LTE can be considered as a good approximation for the plasma used
for LIBS measurements generally true for delays greater than 1 micros and over an interval in
the order of 1 micros For polymers the signal intensity is less intense and does not last as
long as that of metals By choosing an inadequate acquisition delay the McWhirter
criterion might be violated as there might not be enough electrons due to the weak
emission signal This hypothesis needs to be backed by proper plasma modelling or time
and spatial resolved plasma detection as it depends very strongly on the properties that
influence the plasma formation ie laser pulse energy pulse duration ambient gas
acquisition gate time etc These parameters need to be accurately detailed to ensure the
reproducibility of the experimental results
43 INTRODUCTION TO CF-LIBS LIBS has the ability to detect the elements present in a sample sometimes at a ppm level
with little or no sample preparation required Other techniques such as ICP-MS have this
ability as well but need time for sample preparation often required to be dissolved into a
liquid state Their main advantage over the LIBS technique is their precision at
quantifying the element concentrations The task of rendering LIBS capable of somewhat
similar quantitative measurements is undergoing
Quantitative analysis can be done in several ways [54] One method to determine the
concentration of each element independently is through the emission lines of accurately
known transition probabilities followed by absolute measurements of the integrated
intensities Another way would be to compare the elemental emission lines relative to the
most abundant element in the sample This method only requires the ratios of the
transition probability of the emission lines Of course as with all information attained
43
from the spectra a greater number of lines provide better results Therefore to increase
the accuracy of these methods a well calibrated broad band spectrum is required
An approach widely used compares the spectra intensity lines with known calibration
standards ie calibration curves As long as the properties of the sample being analysed
and the standard sample matrices are similar this method can be very practical The result
of the matrix effect can be observed when comparing two known identical concentrations
of an element It would be expected to see identical emission intensities but this can be
distorted due to the matrix effect The sensitivity of the measurements are sensitively
dependant on the laser-matter interaction this includes the matrix effects
The use of calibration curves when possible provides promising results when dealing with
homogenous samples ie constant matrix effect [54] However as the sample gets more
complicated for example organic samples the calibration curves are not always easy to
create The notion of a reference sample where all the element concentrations are already
known for polymers can be accepted A problem arises when dealing with more
complicated samples such as vegetables or soil How can one create a reference sample
for an inhomogeneous sample or a sample with unknown matrix Add to this the
complications of varying matrix effects associated to the local in homogeneity of such
samples In this case the reproducibility of LIBS is therefore reduced and the errors
associated with the measurement increase drastically Construction of a calibration curve
is highly complicated and nearly impossible
The notion of Calibration-Free LIBS (CF-LIBS) was proposed by Ciucci et al [55] Such
procedure can in the ideal case provide solution for inhomogeneous sample or those with
unknown matrix The idea behind this method was to go around these matrix effects by
making each measurement self consistent ie avoid the need to compare it with
calibration curves For this method works these are three requirements for the ablation
and the resulted plasma [54]
Stoichiometric ablation
Plasma must be in LTE
Optically thin plasma
44
The last two requirements have already been discussed previously Stoichiometric
ablation means that the composition of the ablated mass is representative of that of the
sample This is the basis of LIBS and other laser ablation techniques in general This
allows to characterize the sample analyzed using the light emitted from the plasma Russo
and al mentioned in their paper in 1991 [56] that stoichiometric ablation existed for laser
power densities greater than 109 119882119888119898sup2 a condition generally satisfied for nanosecond
or shorter duration pulse ablation Borisov and al [57] stated that the degree of
stoichiometric ablation was reduced when the crater depth increased He put forth two
hypotheses for this statement The first imagined that the geometric factors reduced the
power density and the second consisted of shielding and thermal variations within the
crater
Elemental fractionation of the sample was observed with longer laser pulses [2]
Femtosecond ablation reduced this problem and showed an increase in the ablation
efficiency Russo et al 2002 [58] performed nanosecond and femtosecond ablation on
glass samples and did not come to the same conclusion They believed that the pulse
duration alone was not enough to account for fractionation The generated plasma and the
shockwave induced with the plasma could influence it as well The mass removal depends
on the heat conduction of the laser pulse within the sample as well as the recoil pressure
which is a consequence of the shockwaves Shockwaves present in femtosecond laser
ablation are due to the high velocity of the ejected mass
For the CF-LIBS calculations the use of the Boltzmann plot method was first used
(includes the total plasma number density and volume and the experimental geometry)
[54]
119868120484120485 = 119865 119862119904 119860119894119895 119892119894 119890119909119901 minus
119864119894119896119861119879
119880119904(119879) (131)
With 119868120484120485 measured integral line intensity (counts) CS concentration of the emitting species S US(T) partition function of the emitting species F optical efficiency of the collection system
45
Equation (132) requires information either protruding from spectral databases or directly
from the experimental category
Aij gi Eij US (T) rarr spectral database
F CS T rarr experimental data
If 119910 119909119898 119886119899119889 119902119904 are introduced as the following
119910 = 119897119899 119868119894119895
119892119894 119860119894119895 (132)
119909 = 119864119894 (133)
119898 = minus1119896119861119879
(134)
119902119878 = ln 119862119878 119865119880119904(119879) (135)
The Boltzmann equation can be written simply in the form
119910 = 119898119909 + 119902119878 (136)
Where 119898 is associated with the temperature of the plasma and 119902119878 is associated with the
concentration of the emitting species 119878 One spectral line emission produces one point on
the Boltzmann plot diagram This way all the emitting species can be represented in one
diagram If the condition of LTE is fulfilled and the lines are carefully selected to avoid
self-absorption each emitting species should align on parallel lines The same
temperature means the same slope 119898 for all elements These calculations require that the
spectral data contain
At least 2 emission lines from the same species to determine the electronic
temperature
At least 1 emission line with known spectroscopic parameters to calculate the
electronic density
46
The y-intercept given by 119902119878 of each line is proportional to the natural logarithm of its
concentration Once the electronic temperature is calculated the concentration of species
of the corresponding element which sums up the concentrations of both the neutral and
single ionised atoms can be determined The F parameter creates a bit of a problem but is
solved by using the normalisation relation if an internal standard is not known
119862119890 = 1119890
(137)
where the sum of the total element concentration should be 1 Even if in theory this
method can provide very accurate results the LIBS measurements with CF-LIBS are only
at best 3-5 experimentally reproducible [59] and the errors associated with the
probability transitions can go from 10-30 [54] If more spectral lines were used this
could average out the uncertainties linked with the probability transitions and provide
more accurate line plots
Initially CF-LIBS introduced by Ciucci [54] excluded self-absorbed lines However it is
possible to include these lines by using a recursive method This means the use of more
points (more spectral lines) for even more accurate information This method predicts the
intensity of the self-absorbed line The scattering around the best fit line can be reduced
putting forth evidence that it is mainly due to self-absorption effects and not experimental
errors fitting errors or even uncertainties related to transition probabilities
47
5 CONCLUSION
The emission line intensities depend on the plasma properties that are influenced by the
ablation laser pulse (wavelength pulse duration pulse energy) the sample (matrix
effects inhomogeneities) and the ambient gas (vacuum inert air and the pressure) It can
also be related back to the concentration of the elements present within the plasma A
detailed understanding of the laser-induced plasma is the basis of high quality quantitative
measurements with LIBS A thorough knowledge on evaporation ejection of particles
hydrodynamic explosion shock waves plasma initiation and expansion not to forget the
laser-plasma interaction is needed All these parameters can influence the amount and the
composition of the ablated mass
In the following chapters of this thesis we will present the study of such parameters for
the ablation of different polymer samples First we study the plasma formation and
expansion by shadowgraphic measurements under different ablation regimes This is
followed by time-resolved analysis of the spectroscopic plasma emission for the
optimisation of experimental acquisition parameters (local thermodynamic equilibrium
signal-to-noise ratio acquisition gate width etc) We are interested in CF-LIBS because it
is the only method that allows a direct analysis without the use of calibration curves
Before applying this method however certain notions and understanding of the physics
behind the induced plasma especially for organic substances is needed Therefore the
last chapter has for aim to classify and identify various polymers through different
multivariate analysis techniques It emphasises that the work in this thesis is more
qualitative than quantitative The aim behind this reasoning is to be able find an
application for the industrial sorting of plastics with what we already know today In the
future we hope that the additional information presented here of plasmas induced on
polymers will allow us the ability to use calibration free methods to provide more precise
quantitative measurements
48
References
[1] M Baudelet Proprieacuteteacutes physico-chimique du plasma induit par laser en regime nanoseconde et femtoseconde PhD Thesis Universiteacute Claude Bernard-Lyon 1 2007
[2] RE Russo XL Mao JH Yoo and JJ Gonzalez Laser Ablation Laser InducedBreakdown Spectroscopy Elsevier Science Amsterdam Netherlands 2007
[3] A Bogaerts Z Chen R Gijbels A Vertes Laser ablation of copper in different background gases comparative study by numerical modelling and experiments Journal of Analytical Atomic Spectrometry 21 384ndash395 2006
[4] M Capitelli A Casavola G Colonna A De Giacomo Laser-induced plasma expansion theoretical and experimental aspects Spectrochimica Acta Part B 59(2004) 271ndash289
[5] BN Chichkov C Momma S Nolte F yon Alvensleben A Tiinnermann Femtosecond picosecond and nanosecond laser ablation of solids Applied Physics A63 109 (1996)
[6] S Amoruso Modeling of UV pulsed-laser ablation of metallic targets Applied Physics A 69 323ndash332 1999
[7] S Amoruso R Bruzzese N Spinelli and R Velotta Characterization of laser ablation plasmas Journal of physics B 32 R131ndashR172 1999
[8] VN Rai SN Thakur Physics of Plasma in Laser-Induced Breakdown Spectroscopy Laser Induced Breakdown Spectroscopy Elsevier Science Amsterdam Netherlands 2007
[9] S Siano Principles of Laser Cleaning in Conservation Handbook on the Use of Lasers in Conservation and Conservation Science 2007
[10] DA Cremers and LJ Radziemski Handbook of Laser-Induced Breakdown Spectroscopy 2006
[11] B J Garrison and R Srinivasan Laser ablation of organic polymers microscopic models for photochemical and thermal processes Journal of Applied Physics 57 2909 (1985)
[12] H Schmidt J Ihlemann B Wolff-Rottke K Luther and J Troe Ultraviolet laser ablation of polymers spot size pulse duration and plume attenuation effects explained J Appl Phys 83 5458 (1998)
[13] T Lippert M Hauer CR Phipps Fundamentals and applications of polymers designed for laser ablation Appl Phys A 77 259ndash264 (2003)
[14] R Srinivasan B Braren RW Dreyfus L Hadel and DE Seeger Mechanism of the ultraviolet laser ablation of polymethylmethacrylate at 193 and 248 nm
49
laser-induced fluorescence analysis chemical analysis and doping studies Journal of the Optical Society of America B 3785ndash791 1986
[15] M Hashida H Mishima S Tokita and S Sakabe Non-thermal ablation of expanded polytetrafluoroethylene with an intense femtosecond-pulse laser Optics Express Vol17 Issue 15 pp 13116-13121 2009
[16] QWang P Jander C Fricke-Begemann R Noll Comparison of 1064 nm and 266 nm excitation of laser-induced plasmas for several types of plastics and one explosive Spectrochimica Acta Part B 63 1011ndash1015 (2008)
[17] R Srinivasan B Braren KG Casey and M Yeh Ultrafast imaging of ultraviolet laser ablation and etching of polymethylmethacrylate Applied Physics Letters 55 (26)2790ndash2791 1989
[18] A Semerok C Chaleacuteard V Detalle J-L Lacour P Mauchien P Meynadier C Nouvellon B Salleacute P Palianov M Perdrix and G Petite Experimental investigations of laser ablation efficiency of pure metals with femto pico and nanosecond pulses Applied Surface Science 138ndash139311ndash 314 1999
[19] YG Yingling B J Garrison Photochemical ablation of organic solids NuclearInstruments and Methods in Physics Research B 202 188ndash194 (2003)
[20] Sci-Tech Encyclopaedia McGraw-Hill Encyclopaedia of Science and Technology 5thedition The McGraw-Hill Companies Inc
[21] SS Mao F Queacutereacute S Guizard X Mao RE Russo G Petite and P Martin Dynamics of femtosecond laser interactions with dielectrics Appl Phys A 79 1695ndash1709 2004
[22] JM Vadillo and J J Laserna Laser-induced plasma spectrometry truly asurface analytical tool Spectrochimica Acta Part B 59147ndash161 2003
[23] M Corsi G Cristoforetti M Hidalgo D Iriarte S Legnaioli V Palleschi A Salvetti and E Tognoni Temporal and spatial evolution of a laser induced plasma from a steel target Applied Spectroscopy Volume 57 Issue 6 Pages 187A-198A and 591-727 (2002) pp 715-721(7)
[24] AW Miziolek V Palleschi and I Schechter Laser Induced Breakdown Spectroscopy (LIBS) fundamentals and applications Cambridge University Press Cambridge UK (2006)
[25] RD Cowan and GH Dieke Self-Absorption of Spectrum Lines Reviews of Modern Physics Vol 20 Number 2 1948
[26] C Aragoacuten JA Aguilera Characterization of laser induced plasmas by optical emission spectroscopy A review of experiments and methods Spectrochimica Acta Part B 63 (2008) 893ndash916
[27] V Motto-Ros AS Koujelev GR Osinski AE Dudelzak Quantitative multi-elemental laser-induced breakdown spectroscopy using artificial neural networks Journal of the European Optical Society - Rapid Publications 3 08011 (2008)
50
[28] SS Harilal CV Bindhu MS Tillack F Najmabadi and AC Gaeris Internal structure and expansion dynamics of laser ablation plumes into ambient gases Journal of applied physics volume 93 number 5 2003
[29] V Margetic A Pakulev A Stockhaus M Bolshov K Niemax R Hergenroumlder A comparison of nanosecond and femtosecond laser-induced plasma spectroscopy of brass samples Spectrochimica Acta Part B 55_20001771]1785
[30] G Cristoforetti G Lorenzetti S Legnaioli V Palleschi Investigation on the role of air in the dynamical evolution and thermodynamic state of a laser-induced aluminium plasma by spatial- and time-resolved spectroscopy Spectrochimica Acta Part BArticle in Press 2010
[31] Q L Ma V Motto-Ros W Q Lei M Boueri X S Bai L J Zheng H P Zeng and J Yu Temporal and spatial dynamics of laser-induced aluminum plasma in argon background at atmospheric pressure interplay with the ambient gas Accepted Spectrochimica Acta Part B 2010
[32] HR Griem Spectral Line Broadening by Plasmas Academic Press New York and London 1974
[33] E Tognoni G Cristoforetti S Legnaioli V Palleschi A Salvetti M Mueller U Panne I Gornushkin A numerical study of expected accuracy and precision in Calibration-Free Laser-Induced Breakdown Spectroscopy in the assumption of ideal analytical plasma Spectrochimica Acta Part B 62 1287ndash1302 (2007)
[34] J Ashkenazy R Kipper and M Caner Spectroscopic measurements of electron density of capillary plasma based of Stark broadening of hydrogen lines V43 N10Physical Review A 1991
[35] AM El Sherbini H Hegazy ThM El Sherbini Measurement of electron density utilizing the Hα-line from laser produced plasma in air Spectrochimica Acta Part B 61(2006) 532ndash539
[36] NM Shaikh B Rashid S Hafeez Y Jamil and MA Baig Measurement of electron density and temperature of a laser-induced zinc plasma J Phys D Applied Physics 39 (2006) 1384ndash1391
[37] W Lei V Motto-Ros M Boueri Q Ma D Zhang L Zheng H Zeng J Yu Time resolved characterization of laser-induced plasma from fresh potatoes Spectrochimica Acta Part B 64 (2009) 891ndash898
[38] CA Bye and A Scheeline Saha-Boltzmann Statistics for Determination of Electron Temperature and Density in Spark Discharges Using an EchelleCCD System Applied Spectroscopy Volume 47 Number 12 1993
[39] J L Throne Plastic Process Engineering Man Dekker New York (1979)
[40] C Gauthier Deacuteveloppement de la technique de la double impulsion laser pour ameacuteliorer les performances analytiques de lrsquoablation laser coupleacutee agrave la
51
spectromeacutetrie drsquoeacutemission optique (ALSEO) sur solides Applications nucleacuteaires Universiteacute Henri Poincareacute ndash Nancy I 2005
[41] B C Castle K Visser B W Smith and J D Winefordner Level populations in a laser-induced plasma on a lead target Spectrochimica Acta Part B 52 1995ndash2009 1997
[42] SS Harilal Riju C Issac CV Bindhu Pramod Gopinath VPN Nampoori CPG Vallabhan Time resolved study of CN band emission from plasma generated by laser irradiation of graphite Spectrochimica Acta Part A 53 (1997) 1527-1536
[43] O Bartheacutelemy J Margot M Chaker M Sabsabi F Vidal T W Johnston S Laville and B Le Drogoff Influence of the laser parameters on the space and time characteristics of an aluminum laser-induced plasma Spectrochimica Acta Part B 60905ndash914 2005
[44] O Bartheacutelemy J Margot S Laville F Vidal M Chaker B Le Drogoff TW Johnston and M Sabsabi Investigation of the state of local thermodynamic equilibrium of a laser-produced aluminum plasma Applied Spectroscopy 59 (2005) pp 529ndash536
[45] N Omenetto EMSLIBS TALK Rome 2009
[46] U Panne C Haisch M Clara R Niessner Analysis of glass and glass melts during the vitrification process of fly and bottom ashes by laser-induced plasma spectroscopy Part I Normalization and plasma diagnostics Spectrochimica Acta Part B 53 (1998) 1957ndash1968
[47] MC Quintero A Rodero MC Garcia and A Sola Determination of the Excitation Temperature in a Nonthermodynamic-Equilibrium High-Pressure Helium Microwave Plasma Torch Applied Spectroscopy 51 202A-205A and 765-911 (1997)
[48] JB Simeonsson and AW Miziolek Time-resolved emission studies of ArF-laser produced micro-plasmas Vol 32 No 6 APPLIED OPTICS 1993
[49] M Milaacuten and JJ Laserna Diagnostics of silicon plasmas produced by visible nanosecond laser ablation Spectrochimica Acta Part B 56 (2001) pp 275ndash288
[50] G Cristoforetti A De Giacomo M DellAglio S Legnaioli E Tognoni V Palleschi and N Omenetto Local Thermodynamic Equilibrium in Laser-Induced Breakdown Spectroscopy Beyond the McWhirter criterion Spectrochimica Acta Part B 65(2010) 86-95
[51] J Hermann C Boulmer-Leborgne B Dubreuil and IN Mihailescu Influence of irradiation conditions on plasma evolution in laserndashsurface interaction J Appl Phys 74 (1993) pp 3071ndash3079
52
[52] DA Rusak BC Castle BW Smith JD Winefordner Recent trends and the future of laser induced plasma spectroscopy Trends in analytical chemistry vol 17 nos 8+9 1998
[53] JF Ready Effects of High-Power Laser Radiation (Academic New York 1971)
[54] E Tognoni V Palleschi M Corsi G Cristoforetti N Omenetto I Gornushkin B W Smith and J D Winefordner From sample to signal in laser-induced breakdown spectroscopy a complex route to quantitative analysis Laser Induced Breakdown Spectroscopy (LIBS) fundamentals and applications Cambridge University Press Cambridge UK (2006)
[55] A Ciucci M Corsi V Palleschi S Rastelli A Salvetti and E Tognoni New procedure for quantitative elemental analysis by laser-induced plasma spectroscopy Applied Spectroscopy 53 960 1999
[56] WT Chan and RE Russo Study of laserndashmaterial interactions using inductively coupled plasma-atomic emission spectrometry Spectrochimica Acta Part B 46 (1991) pp 1471ndash1486
[57] OV Borisov XL Mao and RE Russo Effects of crater development on fractionation and signal intensity during laser ablation inductively coupled plasma mass spectrometry Spectrochimica Acta Part B Atomic Spectroscopy Volume 55 Issue 11 2000 1693-1704
[58] RE Russo X Mao JJ Gonzalez and SS Mao Femtosecond laser ablation ICP-MS Journal of Analytical Atomic Spectrometry 17 1072ndash1075 2002
[59] DellrsquoAglio M De Giacomo A Gaudiuso R De Pascale O Senesi GS Longo S Laser induced breakdown spectroscopy applications to meteorites chemical analysis and composition profiles Geochimica et Cosmochimica Acta (2010) doi 101016jgca201009018
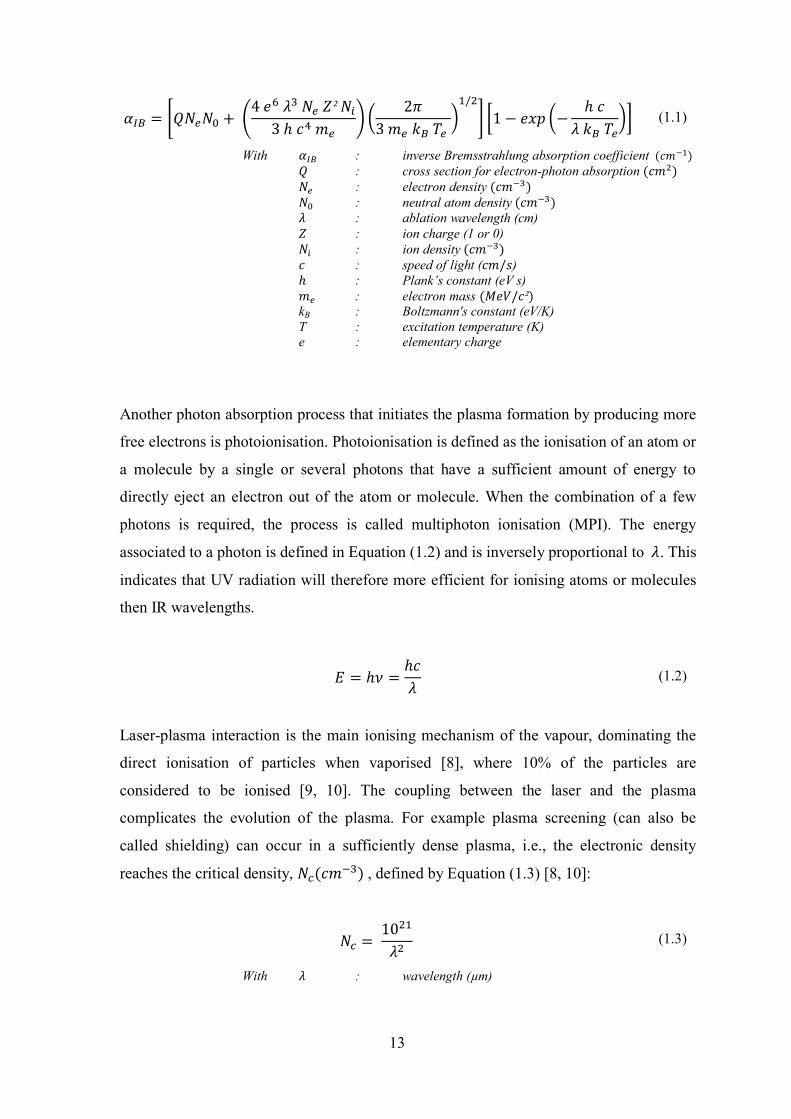
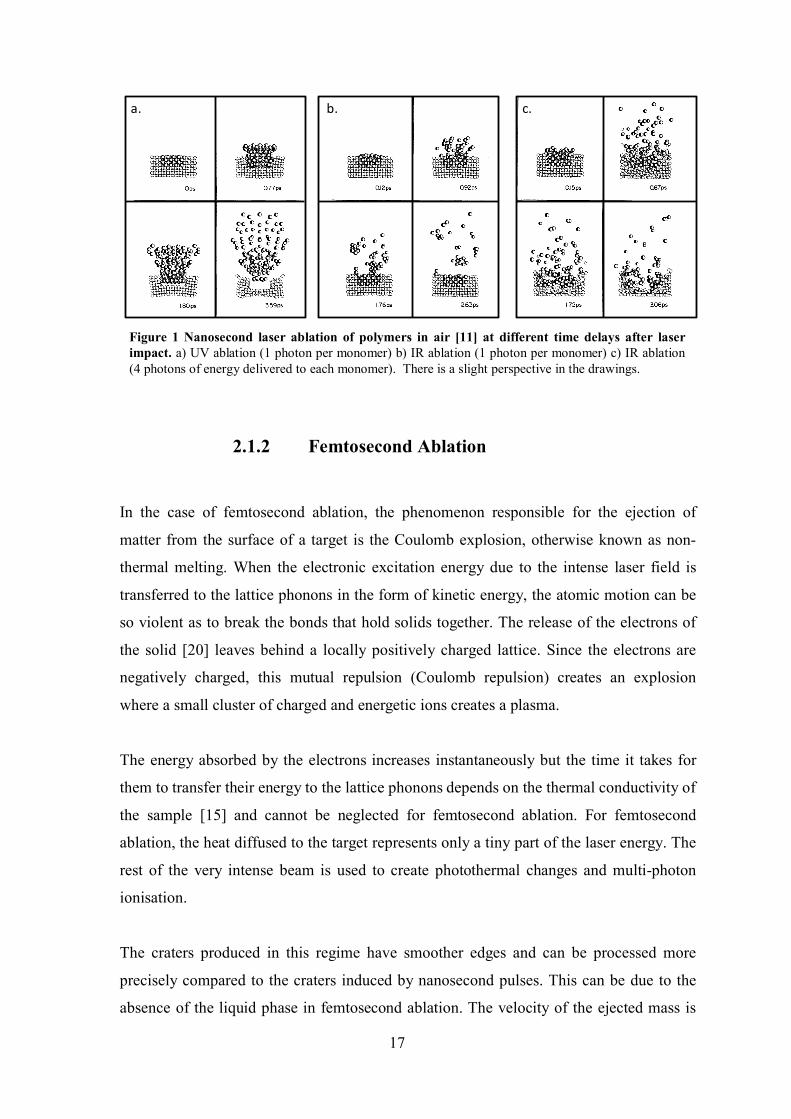
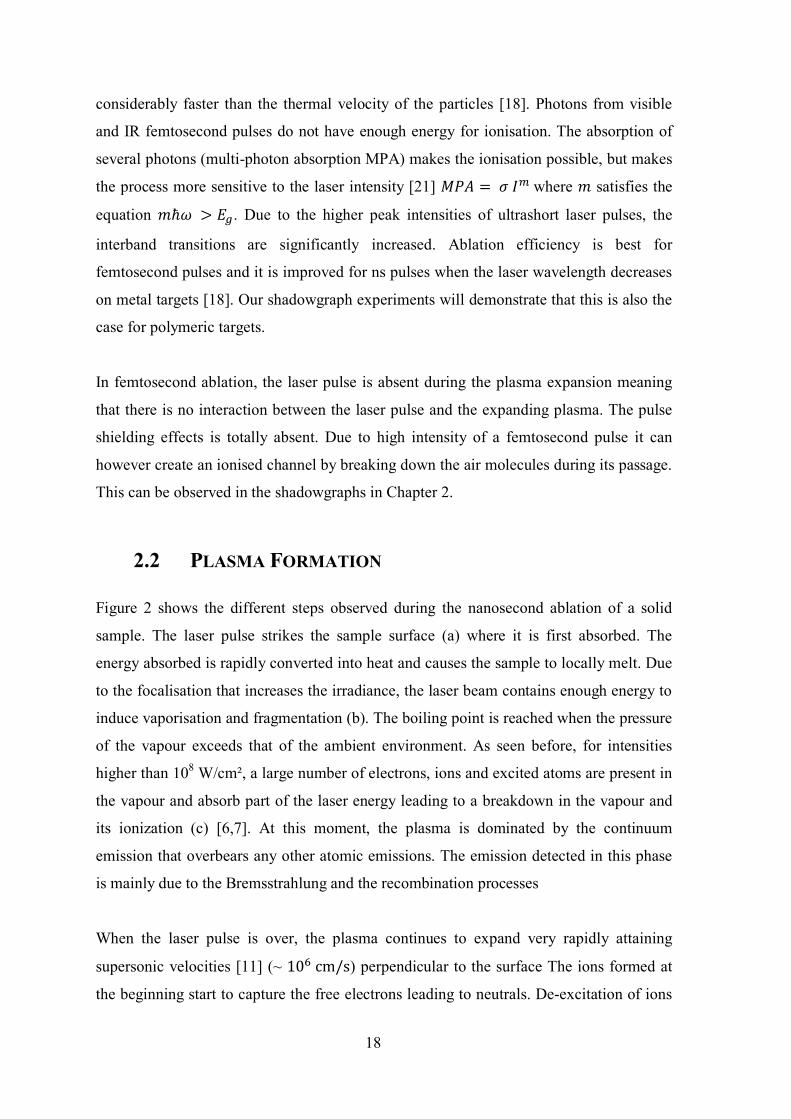
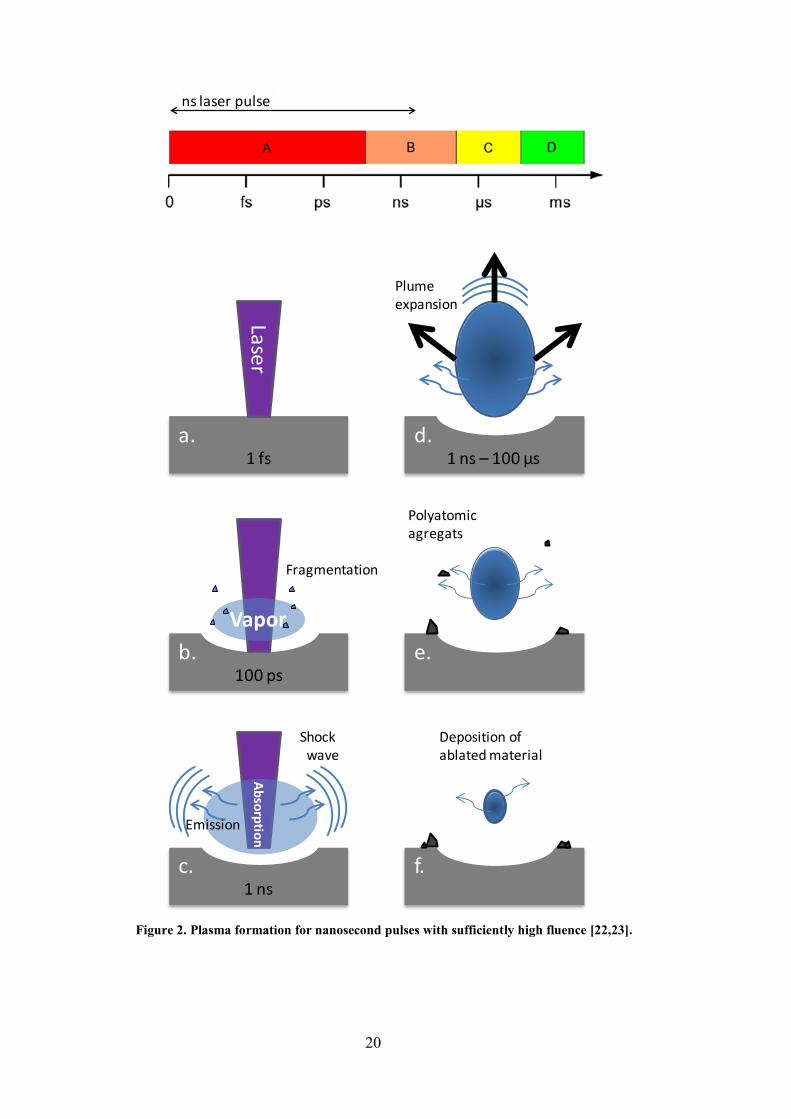
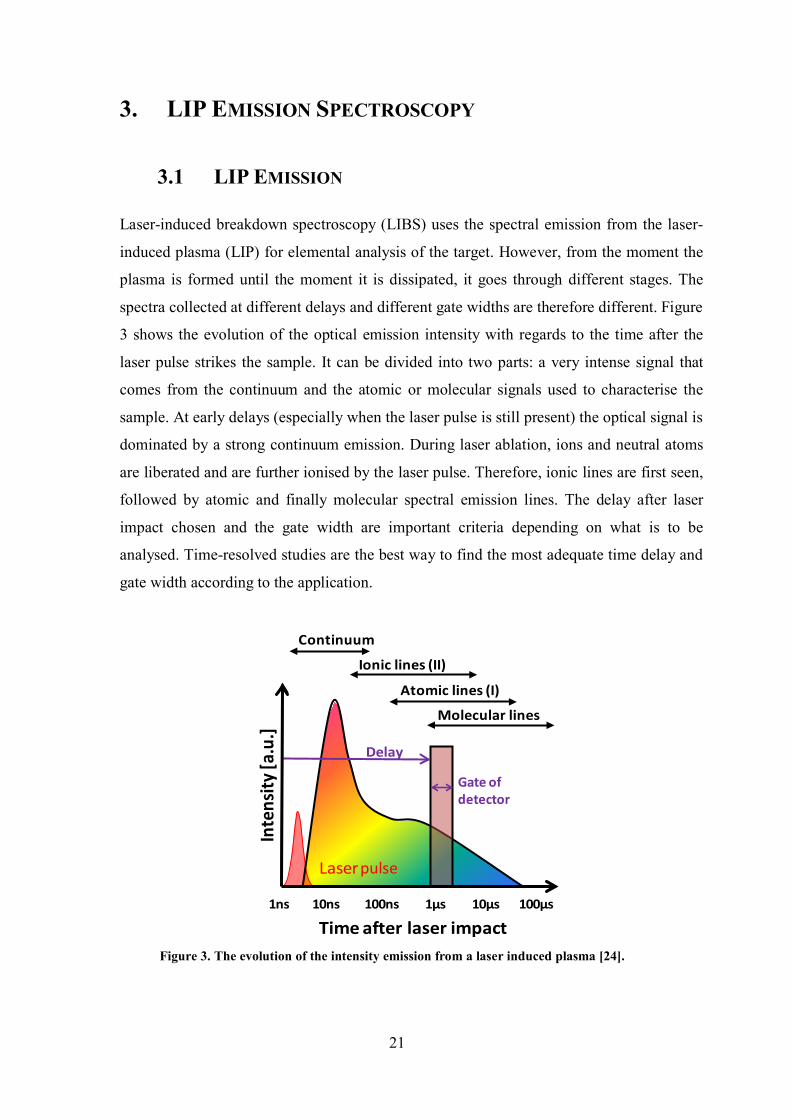
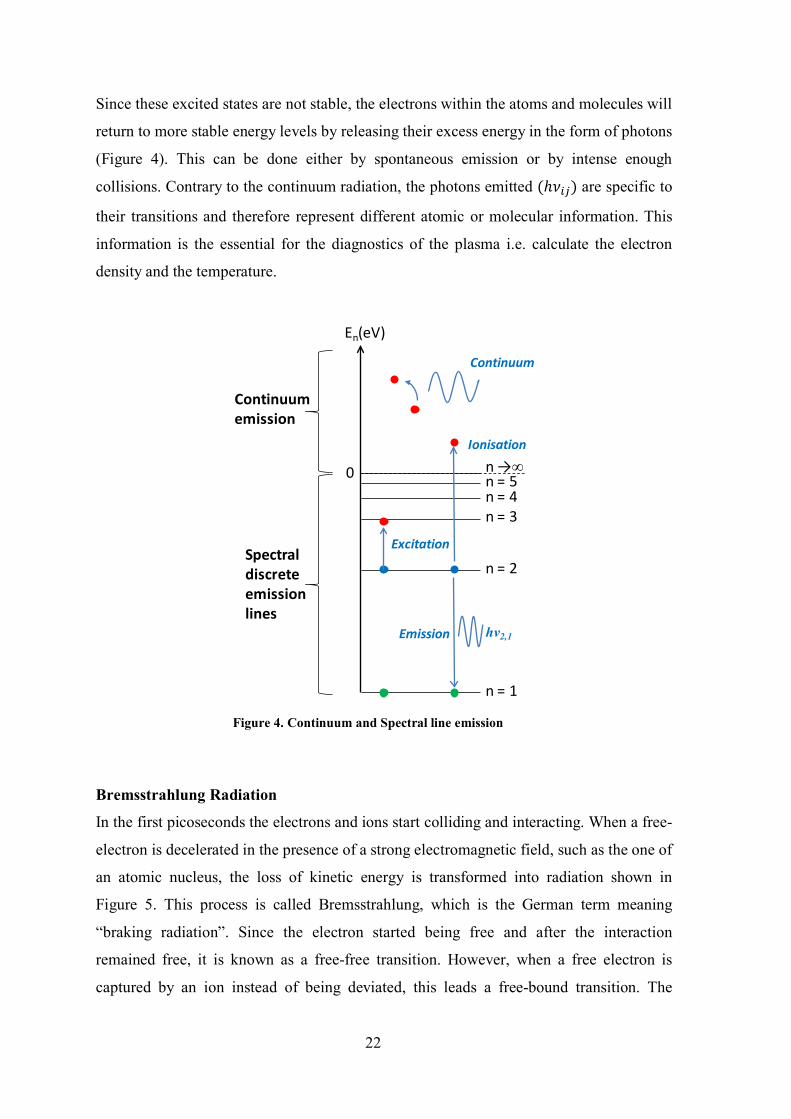
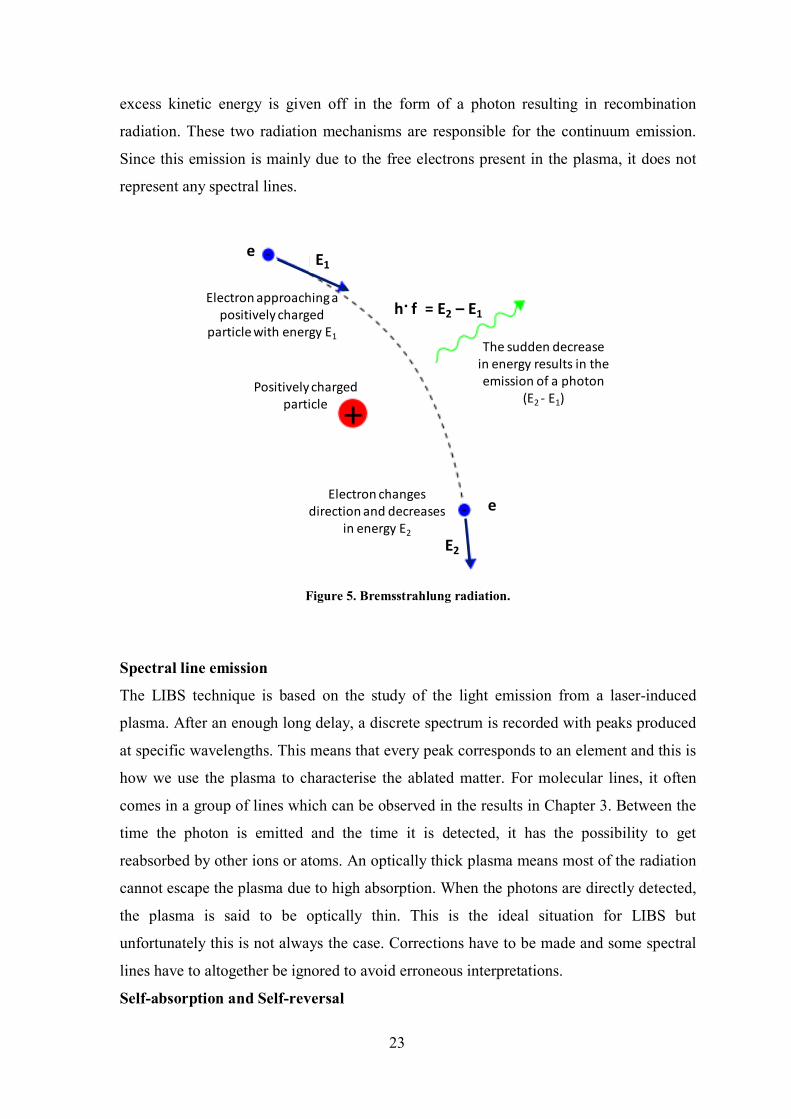
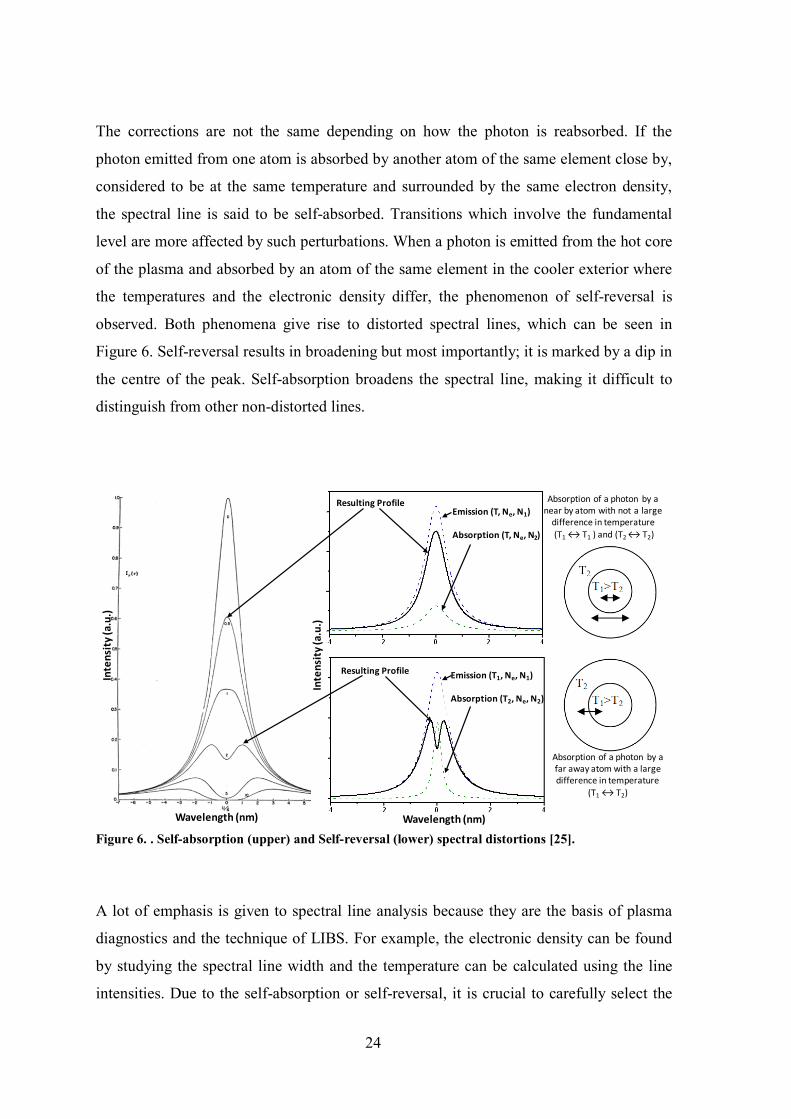
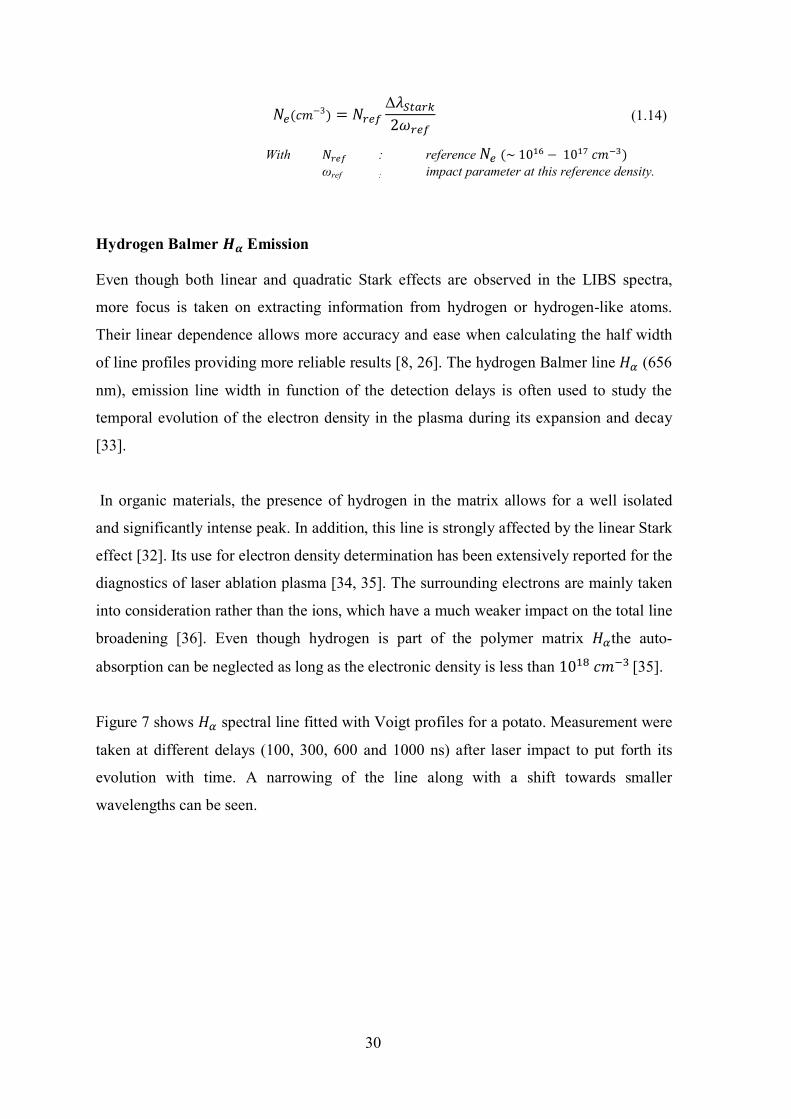
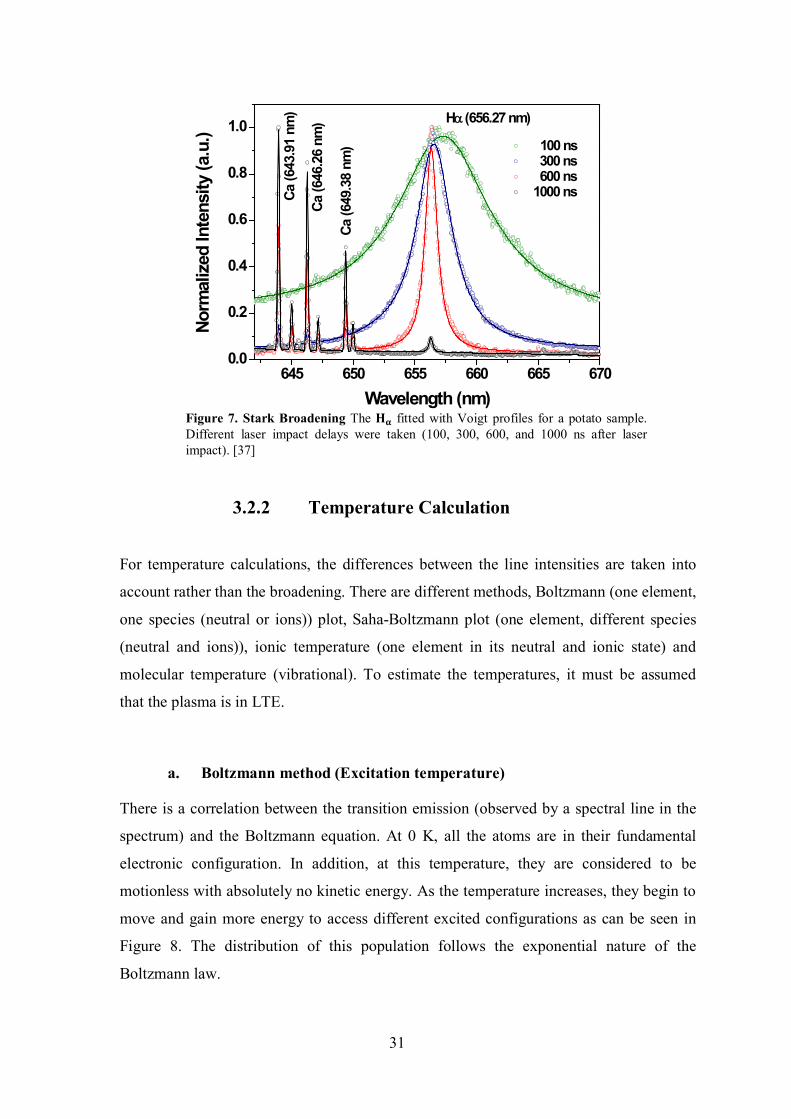
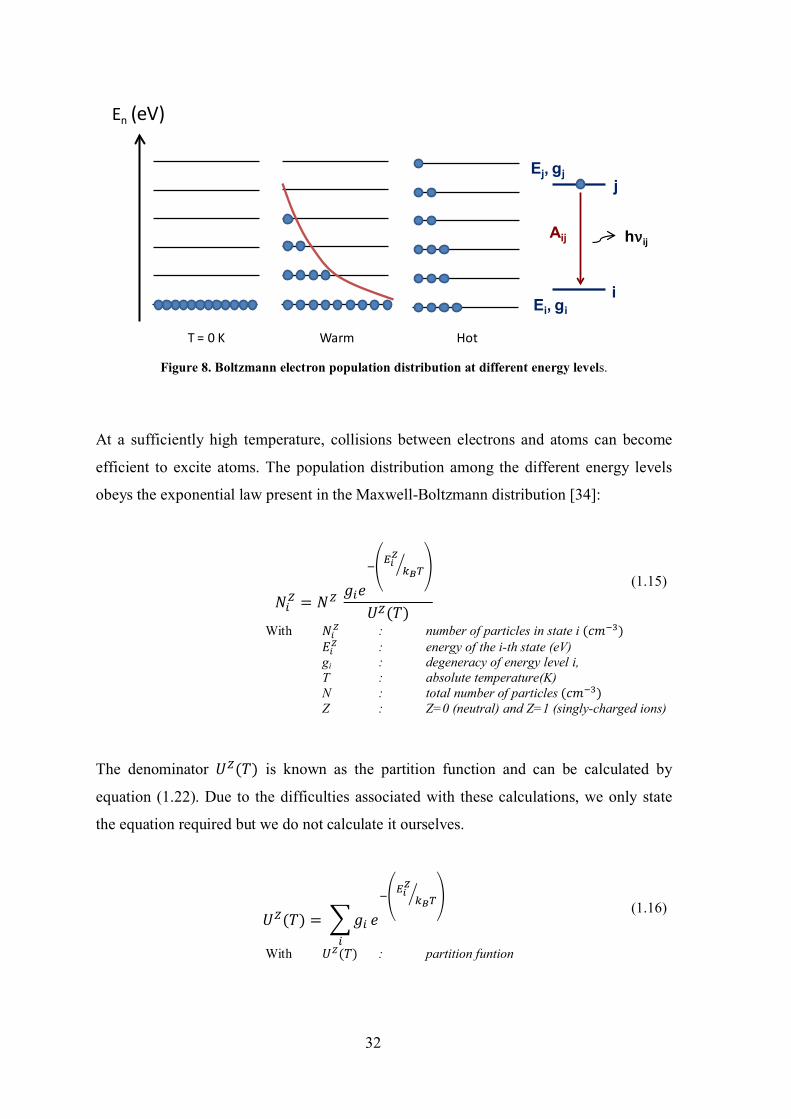
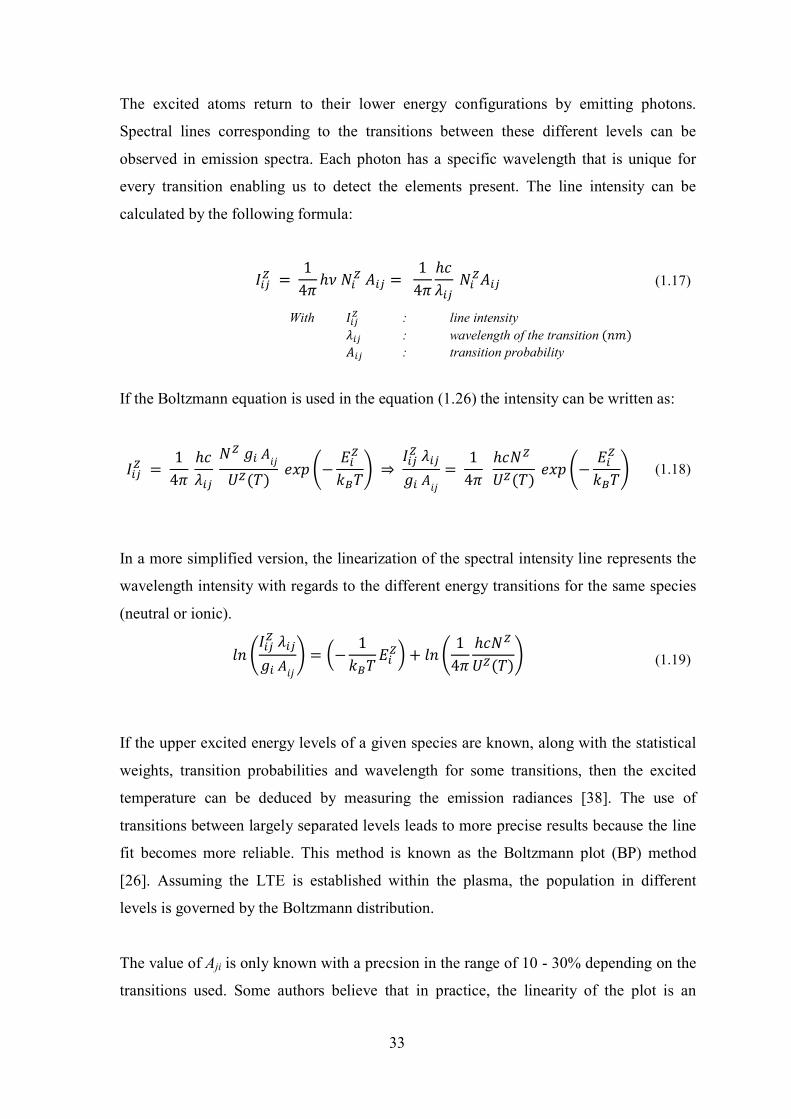
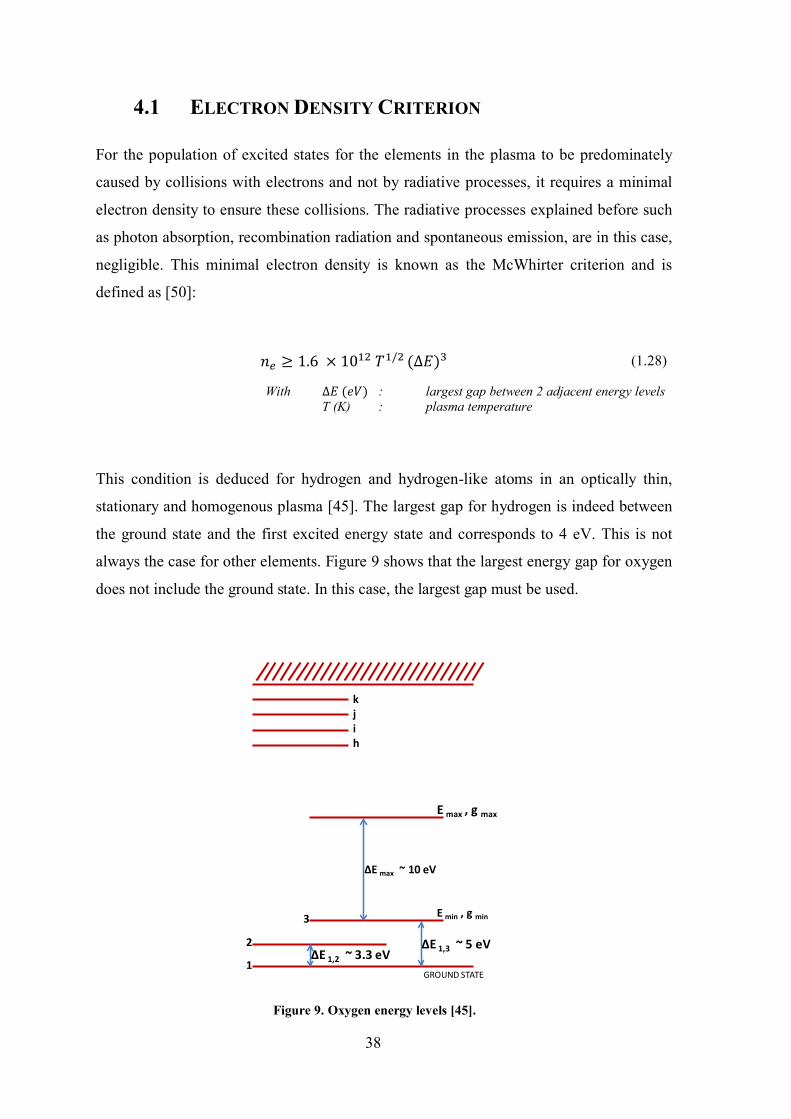
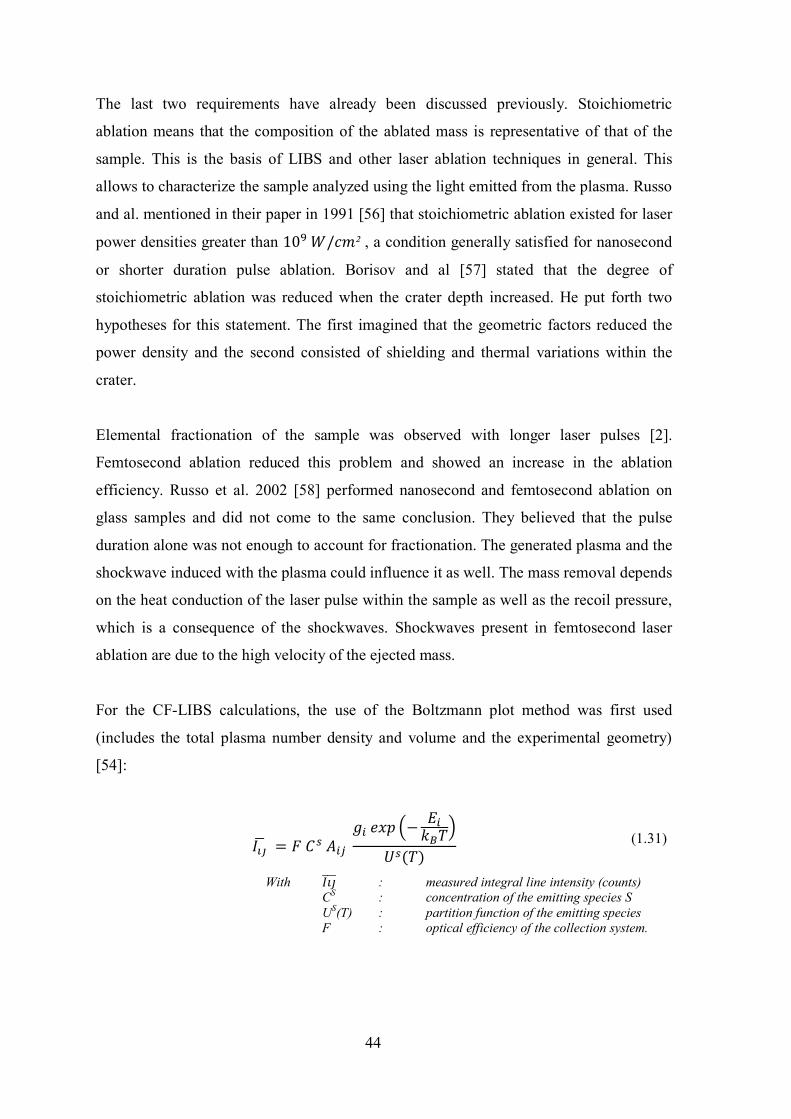
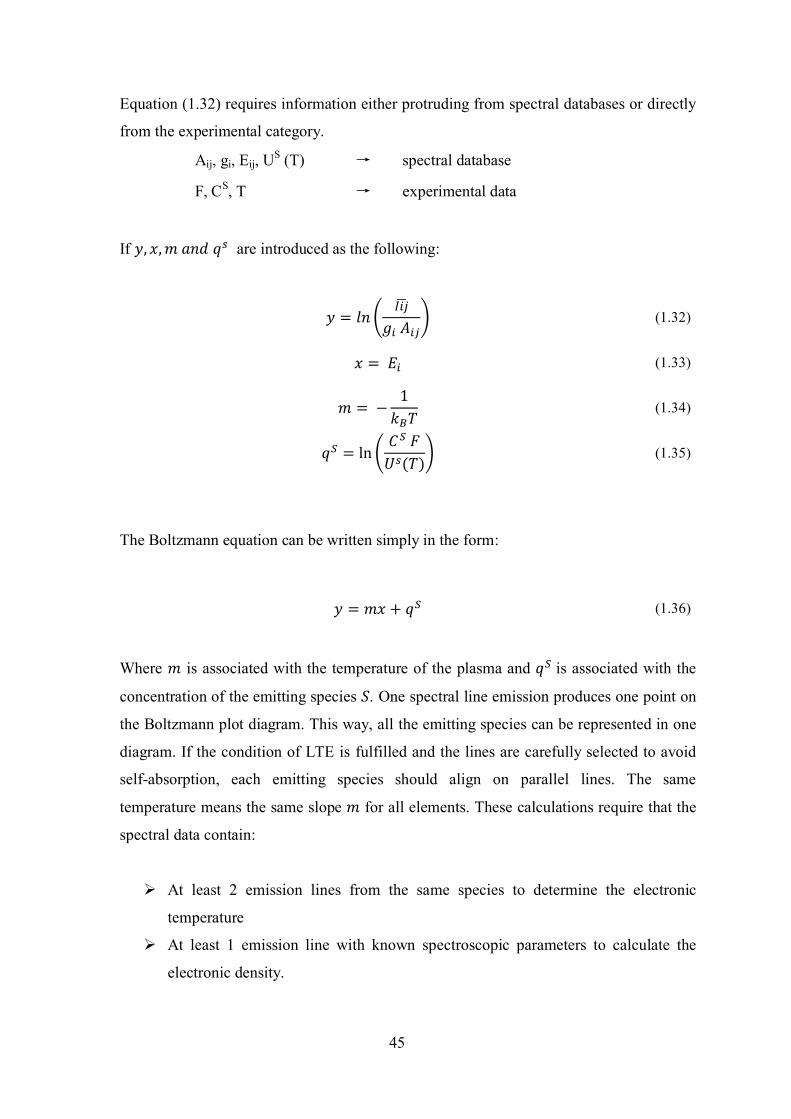