Embed Size (px)
Citation preview
Chap 18-1Statistics for Business and Economics, 6e © 2007 Pearson Education, Inc.
Chapter 18
Introduction to Quality
Statistics for Business and Economics
6th Edition

Statistics for Business and Economics, 6e © 2007 Pearson Education, Inc. Chap 18-2
Chapter Goals
After completing this chapter, you should be able to:
Describe the importance of statistical quality control for process improvement
Define common and assignable causes of variation Explain process variability and the theory of control
charts Construct and interpret control charts for the mean and
standard deviation Obtain and explain measures of process capability Construct and interpret control charts for number of
occurrences

Statistics for Business and Economics, 6e © 2007 Pearson Education, Inc. Chap 18-3
The Importance of Quality
Primary focus is on process improvement Data is needed to monitor the process and to insure the
process is stable with minimum variance Most variation in a process is due to the system, not the
individual Focus on prevention of errors, not detection Identify and correct sources of variation Higher quality costs less
Increased productivity increased sales higher profit

Statistics for Business and Economics, 6e © 2007 Pearson Education, Inc. Chap 18-4
Variation
A system is a number of components that are logically or physically linked to accomplish some purpose
A process is a set of activities operating on a system to transform inputs to outputs
From input to output, managers use statistical tools to monitor and improve the process
Goal is to reduce process variation

Statistics for Business and Economics, 6e © 2007 Pearson Education, Inc. Chap 18-5
Sources of Variation
Common causes of variation also called random or uncontrollable causes of variation causes that are random in occurrence and are inherent in all
processes management, not the workers, are responsible for these causes
Assignable causes of variation also called special causes of variation the result of external sources outside the system these causes can and must be detected, and corrective action
must be taken to remove them from the process failing to do so will increase variation and lower quality
Statistics for Business and Economics, 6e © 2007 Pearson Education, Inc. Chap 18-6
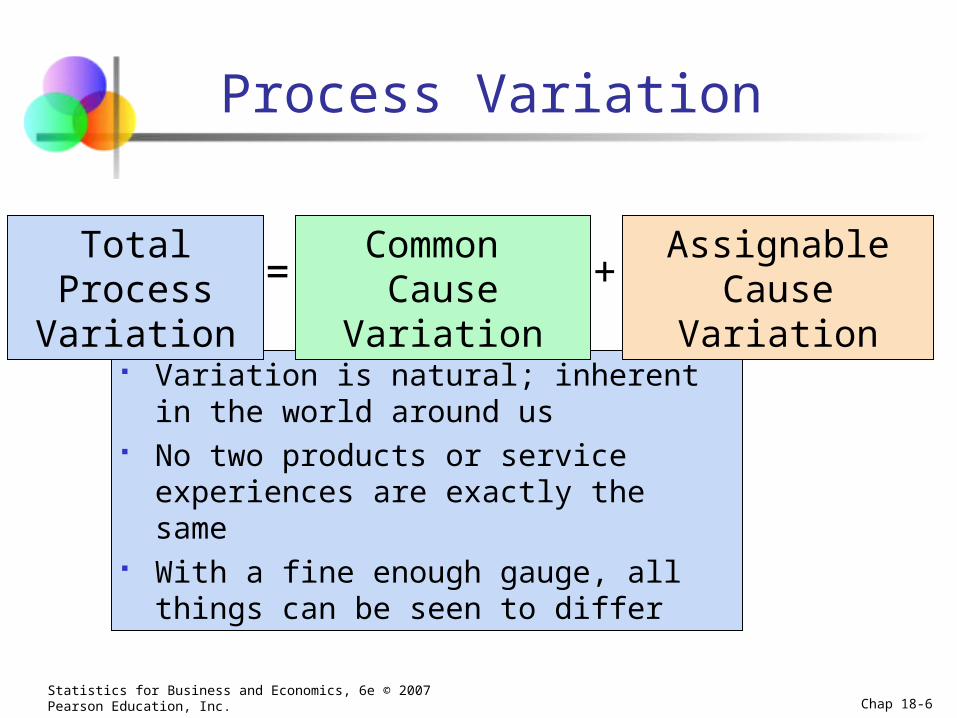
Process Variation
Variation is natural; inherent in the world around us
No two products or service experiences are exactly the same
With a fine enough gauge, all things can be seen to differ
Total Process Variation
Common Cause Variation
Assignable Cause Variation= +
Statistics for Business and Economics, 6e © 2007 Pearson Education, Inc. Chap 18-7
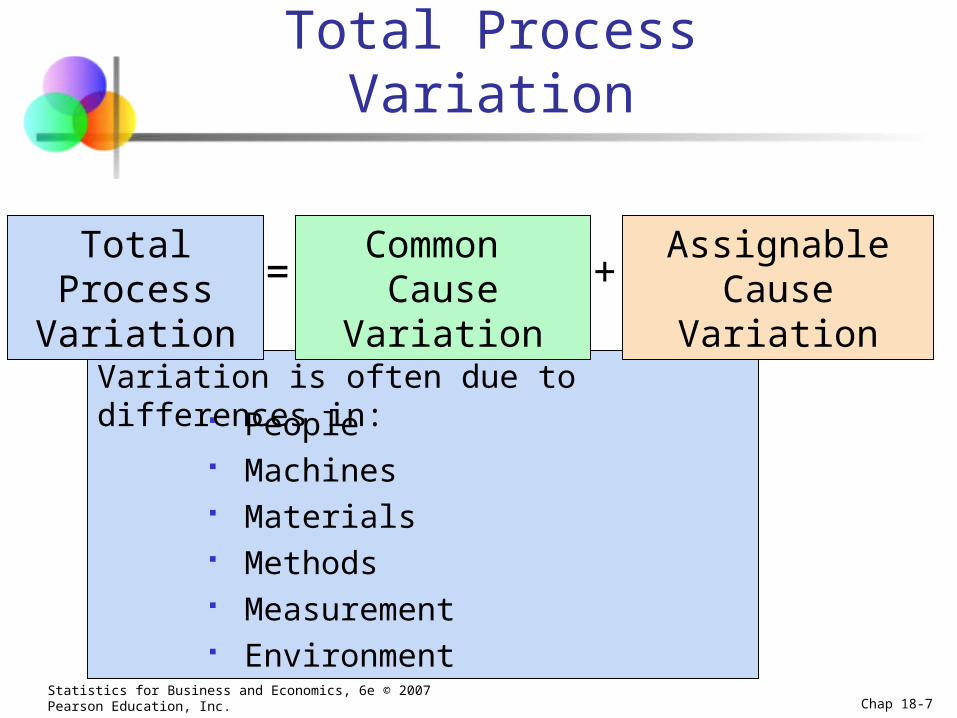
Total Process Variation
Total Process Variation
Common Cause Variation
Assignable Cause Variation= +
People Machines Materials Methods Measurement Environment
Variation is often due to differences in:
Statistics for Business and Economics, 6e © 2007 Pearson Education, Inc. Chap 18-8
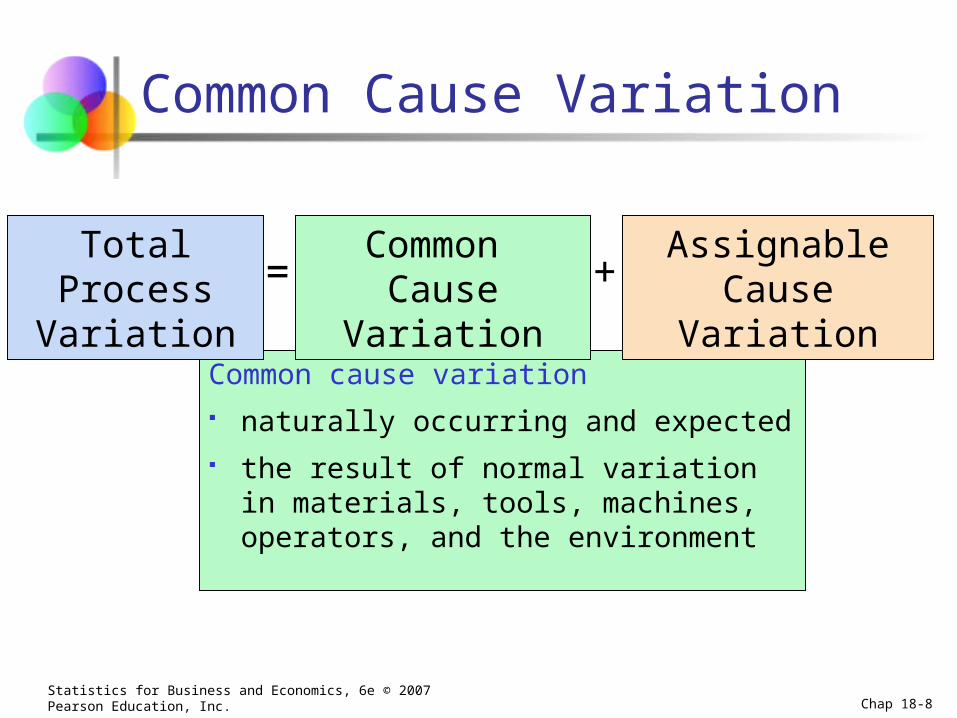
Common Cause Variation
Common cause variation naturally occurring and expected the result of normal variation in
materials, tools, machines, operators, and the environment
Total Process Variation
Common Cause Variation
Assignable Cause Variation= +

Statistics for Business and Economics, 6e © 2007 Pearson Education, Inc. Chap 18-9
Special Cause Variation
Special cause variation abnormal or unexpected variation has an assignable cause variation beyond what is considered
inherent to the process
Total Process Variation
Common Cause Variation
Assignable Cause Variation= +

Statistics for Business and Economics, 6e © 2007 Pearson Education, Inc. Chap 18-10
Stable Process
A process is stable (in-control) if all assignable causes are removed variation results only from common causes

Statistics for Business and Economics, 6e © 2007 Pearson Education, Inc. Chap 18-11
Control Charts
The behavior of a process can be monitored over time Sampling and statistical analysis are used Control charts are used to monitor variation in a
measured value from a process
Control charts indicate when changes in data are due to assignable or common causes

Statistics for Business and Economics, 6e © 2007 Pearson Education, Inc. Chap 18-12
Overview
Process Capability
Tools for Quality Improvement
Control Charts
X-chart for the means-chart for the standard deviationP-chart for proportionsc-chart for number of occurrences

Statistics for Business and Economics, 6e © 2007 Pearson Education, Inc. Chap 18-13
X-chart and s-chart
Used for measured numeric data from a process
Start with at least 20 subgroups of observed values
Subgroups usually contain 3 to 6 observations each
For the process to be in control, both the s-chart and the X-chart must be in control
Statistics for Business and Economics, 6e © 2007 Pearson Education, Inc. Chap 18-14
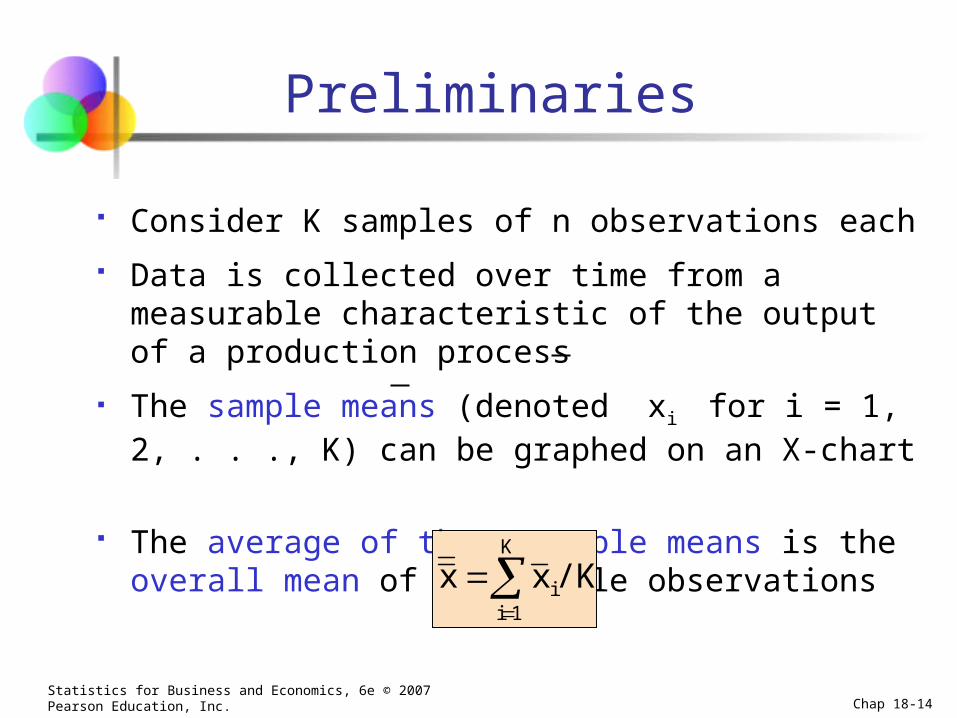
Preliminaries
Consider K samples of n observations each
Data is collected over time from a measurable characteristic of the output of a production process
The sample means (denoted xi for i = 1, 2, . . ., K) can be graphed on an X-chart
The average of these sample means is the overall mean of the sample observations
K
1ii/Kxx

Statistics for Business and Economics, 6e © 2007 Pearson Education, Inc. Chap 18-15
Preliminaries
The sample standard deviations (denoted si for i = 1, 2, . . . ,K) can be graphed on an s-chart
The average sample standard deviation is
The process standard deviation, σ, is the standard deviation of the population from which the samples were drawn, and it must be estimated from sample data
/KssK
1ii
(continued)

Statistics for Business and Economics, 6e © 2007 Pearson Education, Inc. Chap 18-16
Example: Subgroups
Sample measurements:Subgroup measures
Subgroup number
Individual measurements
(subgroup size = 4) Mean, x Std. Dev., s
1
2
3
…
15
12
17
…
17
16
21
…
15
9
18
…
11
15
20
…
14.5
13.0
19.0
…
2.517
3.162
1.826
…Average subgroup
mean =
Average subgroup std. dev. = s x

Statistics for Business and Economics, 6e © 2007 Pearson Education, Inc. Chap 18-17
Estimate of Process Standard Deviation Based on s
An estimate of process standard deviation is
Where s is the average sample standard deviation c4 is a control chart factor which depends on the
sample size, n Control chart factors are found in Table 18.1 or in
Appendix 13 If the population distribution is normal, this estimator
is unbiased
4/csσ ˆ

Statistics for Business and Economics, 6e © 2007 Pearson Education, Inc. Chap 18-18
Factors for Control Charts
n c4 A3 B3 B4
2 .789 2.66 0 3.27
3 .886 1.95 0 2.57
4 .921 1.63 0 2.27
5 .940 1.43 0 2.09
6 .952 1.29 0.03 1.97
7 .959 1.18 0.12 1.88
8 .965 1.10 0.18 1.82
9 .969 1.03 0.24 1.76
10 .973 0.98 0.28 1.72
Selected control chart factors (Table 18.1)

Statistics for Business and Economics, 6e © 2007 Pearson Education, Inc. Chap 18-19
Process Average
Control Charts and Control Limits
UCL = Process Average + 3 Standard Deviations LCL = Process Average – 3 Standard Deviations
UCL
LCL
+3σ
- 3σ
time
A control chart is a time plot of the sequence of sample outcomes
Included is a center line, an upper control limit (UCL) and a lower control limit (LCL)

Statistics for Business and Economics, 6e © 2007 Pearson Education, Inc. Chap 18-20
Control Charts and Control Limits
sAx
)n/(cs3x
n/σ3x
Deviations Standard 3 AverageProcess
3
4
ˆ
The 3-standard-deviation control limits are estimated for an X-chart as follows:
(continued)
Where the value of is given in Table 18.1 or in Appendix 13nc
3A
4
3

Statistics for Business and Economics, 6e © 2007 Pearson Education, Inc. Chap 18-21
X-Chart
The X-chart is a time plot of the sequence of sample means
The center line is
The lower control limit is
The upper control limit is
sAxLCL 3X
xCLX
sAxUCL 3X
Statistics for Business and Economics, 6e © 2007 Pearson Education, Inc. Chap 18-22
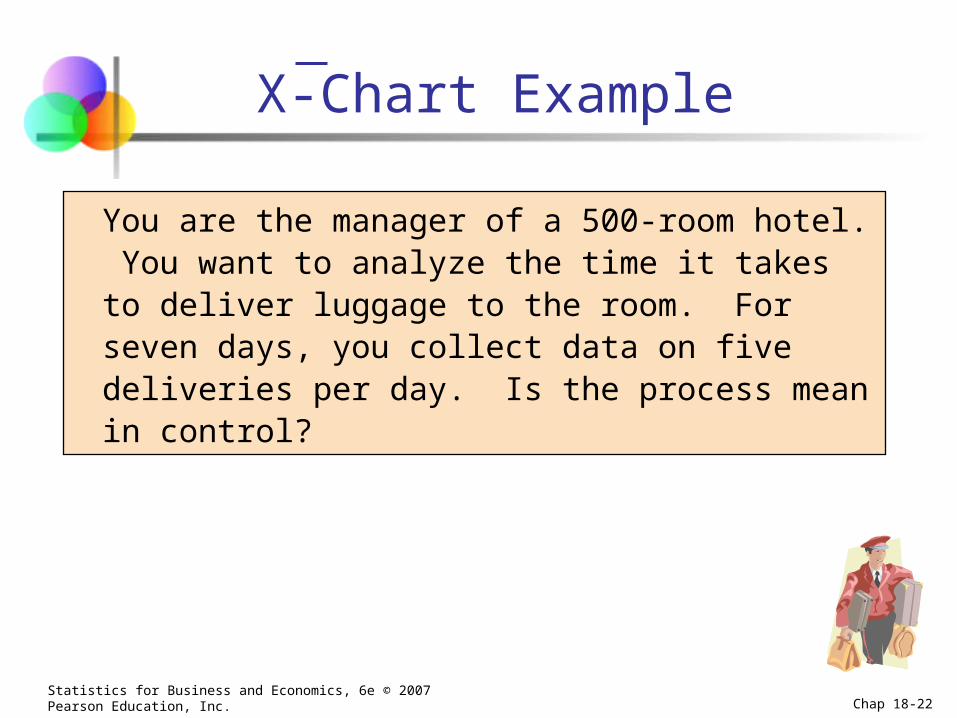
X-Chart Example
You are the manager of a 500-room hotel. You want to analyze the time it takes to deliver luggage to the room. For seven days, you collect data on five deliveries per day. Is the process mean in control?

Statistics for Business and Economics, 6e © 2007 Pearson Education, Inc. Chap 18-23
X-Chart Example: Subgroup Data
Day Subgroup Size
SubgroupMean
Subgroup Std. Dev.
1
2
3
4
5
6
7
5
5
5
5
5
5
5
5.32
6.59
4.89
5.70
4.07
7.34
6.79
1.85
2.27
1.28
1.99
2.61
2.84
2.22
These are the xi values for the 7 subgroups These are the si values
for the 7 subgroups

Statistics for Business and Economics, 6e © 2007 Pearson Education, Inc. Chap 18-24
X-Chart Control Limits Solution
5.8137
6.796.595.32
K
xx i
2.1517
2.222.271.85
K
ss i
2.73751)(1.43)(2.15.813)s(AxLCL
8.88951)(1.43)(2.15.813)s(AxUCL
3X
3X
A3 = 1.43 is from Appendix 13

Statistics for Business and Economics, 6e © 2007 Pearson Education, Inc. Chap 18-25
X-Chart Control Chart Solution
UCL = 8.889
LCL = 2.737
0
24
68
1 2 3 4 5 6 7
Minutes
Day
x = 5.813__
Conclusion: Process mean is in statistical control

Statistics for Business and Economics, 6e © 2007 Pearson Education, Inc. Chap 18-26
s-Chart
The s-chart is a time plot of the sequence of sample standard deviations
The center line on the s-chart is
The lower control limit (for three-standard error limits) is
The upper control limit is
Where the control chart constants B3 and B4 are found in Table 18.1 or Appendix 13
sBLCL 3s
sCL
sBUCL 4s

Statistics for Business and Economics, 6e © 2007 Pearson Education, Inc. Chap 18-27
s-Chart Control Limits Solution
5.8137
6.796.595.32
K
xx i
2.1517
2.222.271.85
K
ss i
0(0)(2.151)sBLCL
4.49651)(2.09)(2.1sBUCL
3 s
4s
B4 and B3 are found in Appendix 13

Statistics for Business and Economics, 6e © 2007 Pearson Education, Inc. Chap 18-28
s-Chart Control Chart Solution
UCL = 4.496
0
2
4
1 2 3 4 5 6 7
Minutes
Day
LCL = 0
s = 2.151_
Conclusion: Variation is in control

Statistics for Business and Economics, 6e © 2007 Pearson Education, Inc. Chap 18-29
Process Average
Control Chart Basics
UCL = Process Average + 3 Standard Deviations LCL = Process Average – 3 Standard Deviations
UCL
LCL
+3σ
- 3σ
Common Cause Variation: range of expected variability
Special Cause Variation: Range of unexpected variability
time

Statistics for Business and Economics, 6e © 2007 Pearson Education, Inc. Chap 18-30
Process Average
Process Variability
UCL = Process Average + 3 Standard Deviations LCL = Process Average – 3 Standard Deviations
UCL
LCL
±3σ → 99.7% of process values should be in this range
time
Special Cause of Variation: A measurement this far from the process average is very unlikely if only expected variation is present

Statistics for Business and Economics, 6e © 2007 Pearson Education, Inc. Chap 18-31
Using Control Charts
Control Charts are used to check for process control
H0: The process is in control i.e., variation is only due to common causes
H1: The process is out of control i.e., assignable cause variation exists
If the process is found to be out of control,
steps should be taken to find and eliminate the
assignable causes of variation

Statistics for Business and Economics, 6e © 2007 Pearson Education, Inc. Chap 18-32
In-control Process
A process is said to be in control when the control chart does not indicate any out-of-control condition Contains only common causes of variation
If the common causes of variation is small, then control chart can be used to monitor the process
If the variation due to common causes is too large, you need to alter the process
Statistics for Business and Economics, 6e © 2007 Pearson Education, Inc. Chap 18-33
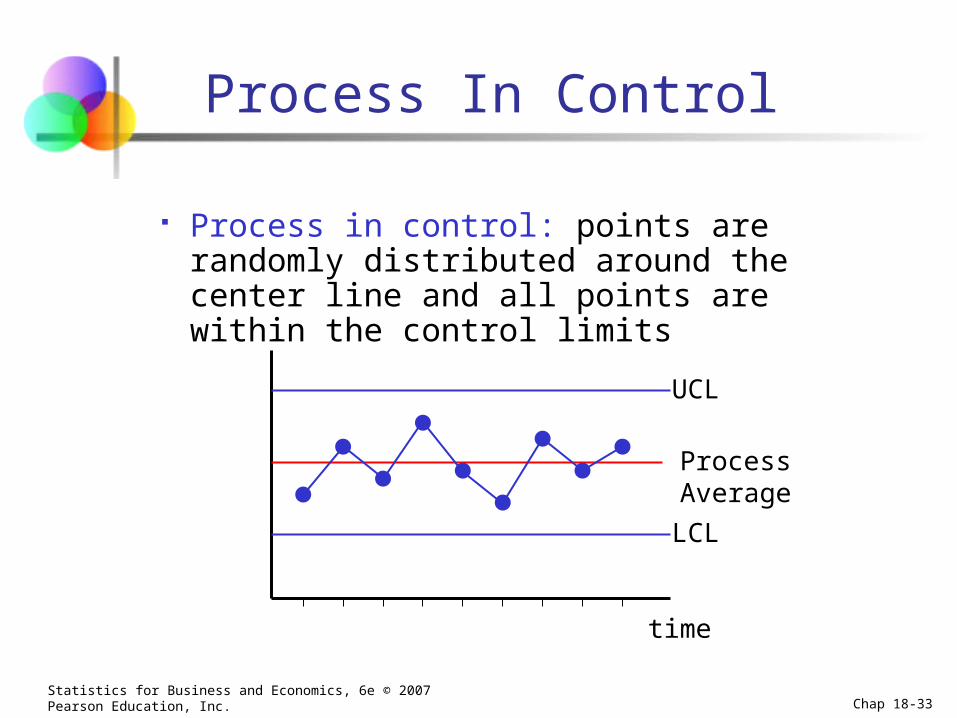
Process In Control
Process in control: points are randomly distributed around the center line and all points are within the control limits
UCL
LCL
time
Process Average

Statistics for Business and Economics, 6e © 2007 Pearson Education, Inc. Chap 18-34
Process Not in Control
Out of control conditions:
One or more points outside control limits
6 or more points in a row moving in the same direction either increasing or decreasing
9 or more points in a row on the same side of the center line

Statistics for Business and Economics, 6e © 2007 Pearson Education, Inc. Chap 18-35
Process Not in Control
One or more points outside control limits
UCL
LCL
Nine or more points in a row on one side of the center line
UCL
LCL
Six or more points moving in the same direction
UCL
LCL
Process Average
Process Average
Process Average
Statistics for Business and Economics, 6e © 2007 Pearson Education, Inc. Chap 18-36
Out-of-control Processes
When the control chart indicates an out-of-control condition (a point outside the control limits or exhibiting trend, for example) Contains both common causes of variation and
assignable causes of variation The assignable causes of variation must be identified
If detrimental to the quality, assignable causes of variation must be removed
If increases quality, assignable causes must be incorporated into the process design

Statistics for Business and Economics, 6e © 2007 Pearson Education, Inc. Chap 18-37
Process Capability
Process capability is the ability of a process to consistently meet specified customer-driven requirements
Specification limits are set by management (in response to customers’ expectations or process needs, for example)
The upper tolerance limit (U) is the largest value that can be obtained and still conform to customers’ expectations
The lower tolerance limit (L) is the smallest value that is still conforming

Statistics for Business and Economics, 6e © 2007 Pearson Education, Inc. Chap 18-38
Capability Indices
A process capability index is an aggregate measure of a process’s ability to meet specification limits
The larger the value, the more capable a process is of meeting requirements

Statistics for Business and Economics, 6e © 2007 Pearson Education, Inc. Chap 18-39
Measures of Process Capability
Process capability is judged by the extent to which
lies between the tolerance limits L and U
Cp Capability Index Appropriate when the sample data are centered between the
tolerance limits, i.e.
The index is
A satisfactory value of this index is usually taken to be one that is at least 1.33 (i.e., the natural rate of tolerance of the process should be no more than 75% of (U – L), the width of the range of acceptable values)
σ3x ˆ
σ6
LUCp ˆ
U)/2(Lx

Statistics for Business and Economics, 6e © 2007 Pearson Education, Inc. Chap 18-40
Measures of Process Capability
Cpk Index Used when the sample data are not centered between
the tolerance limits Allows for the fact that the process is operating closer to
one tolerance limit than the other The Cpk index is
A satisfactory value is at least 1.33
(continued)
σ3
Lx,
σ3
xUMinCpk ˆˆ

Statistics for Business and Economics, 6e © 2007 Pearson Education, Inc. Chap 18-41
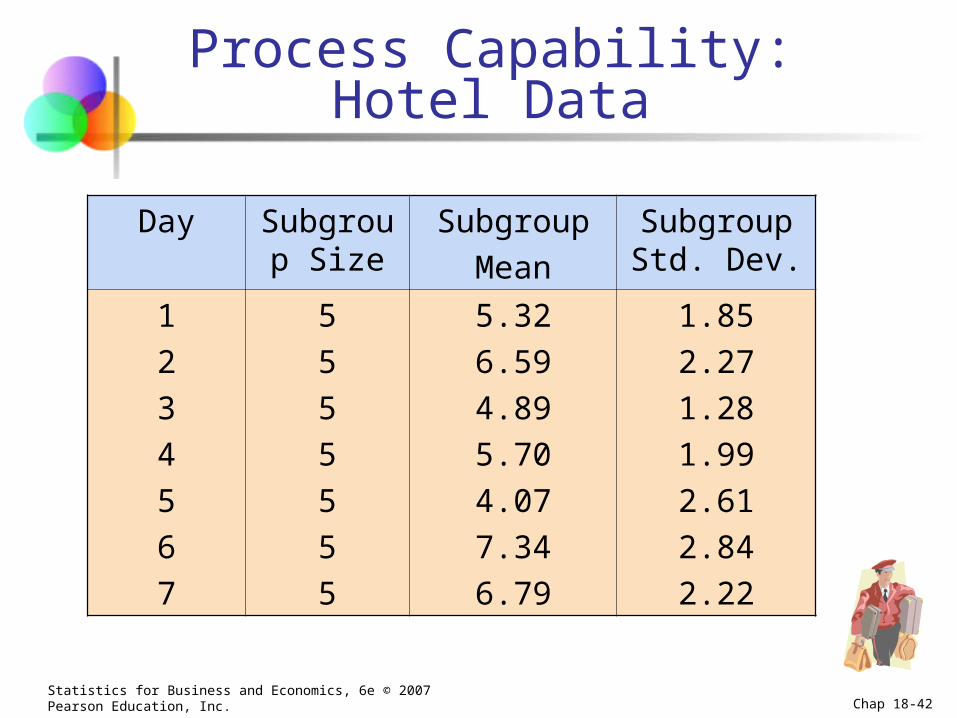
You are the manager of a 500-room hotel. You have instituted tolerance limits that luggage deliveries should be completed within ten minutes or less (U = 10, L = 0). For seven days, you collect data on five deliveries per day. You know from prior analysis that the process is in control. Is the process capable?
Process CapabilityExample
Statistics for Business and Economics, 6e © 2007 Pearson Education, Inc. Chap 18-42
Process Capability:Hotel Data
Day Subgroup Size
Subgroup
Mean
Subgroup Std. Dev.
1
2
3
4
5
6
7
5
5
5
5
5
5
5
5.32
6.59
4.89
5.70
4.07
7.34
6.79
1.85
2.27
1.28
1.99
2.61
2.84
2.22

Statistics for Business and Economics, 6e © 2007 Pearson Education, Inc. Chap 18-43
Process Capability:Hotel Example Solution
0.6100.847,0.610Min
3(2.228)
05.813,
3(2.228)
5.81310Min
σ3
Lx,
σ3
xUMinCpk
ˆˆ
0.940c 2.151s 5.813X 5n 4
2.2880.940
2.151
c
sσ Estimate
4
ˆ
The capability index for the luggage delivery process is less than 1. The upper specification limit is less than 3 standard deviations above the mean.

Statistics for Business and Economics, 6e © 2007 Pearson Education, Inc. Chap 18-44
p-Chart
Control chart for proportions Is an attribute chart
Shows proportion of defective or nonconforming items Example -- Computer chips: Count the number of
defective chips and divide by total chips inspected Chip is either defective or not defective Finding a defective chip can be classified a
“success”
Statistics for Business and Economics, 6e © 2007 Pearson Education, Inc. Chap 18-45
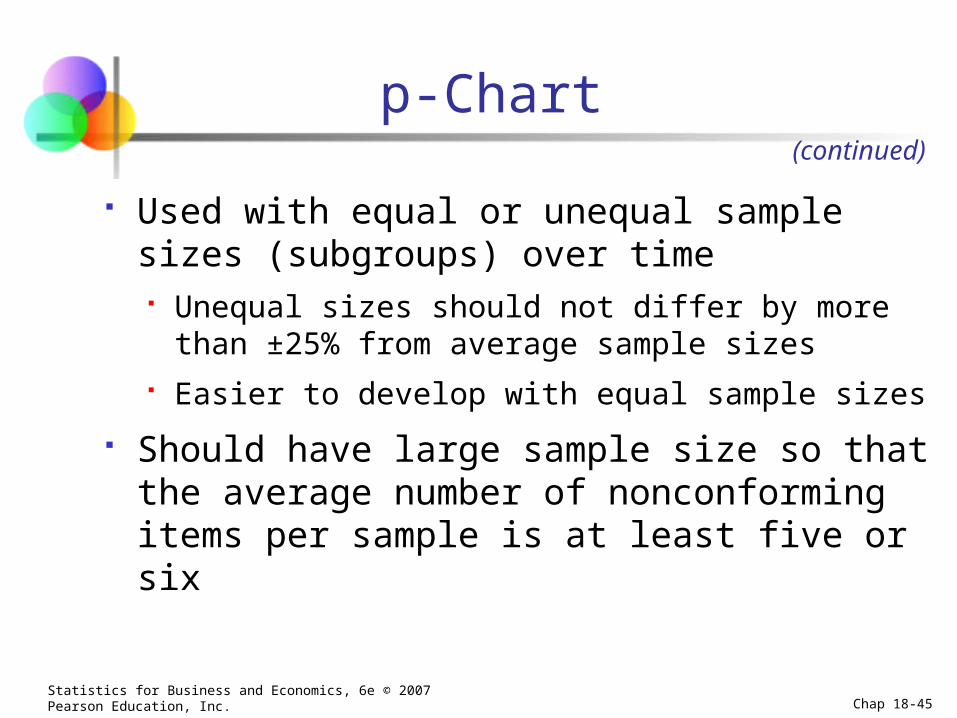
p-Chart
Used with equal or unequal sample sizes (subgroups) over time Unequal sizes should not differ by more than ±25%
from average sample sizes Easier to develop with equal sample sizes
Should have large sample size so that the average number of nonconforming items per sample is at least five or six
(continued)
Statistics for Business and Economics, 6e © 2007 Pearson Education, Inc. Chap 18-46
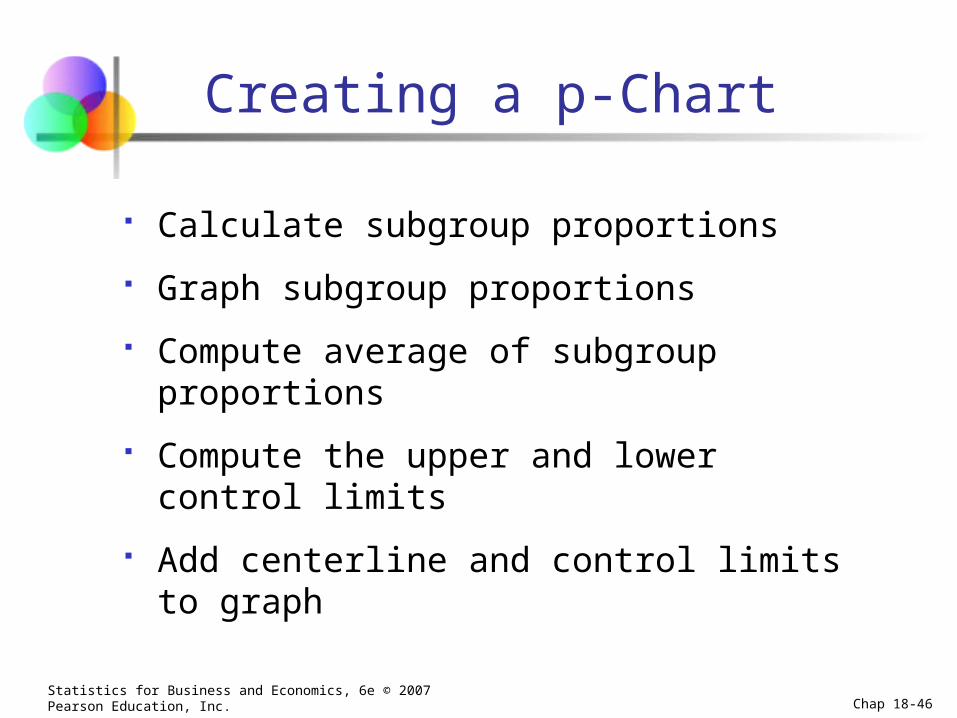
Creating a p-Chart
Calculate subgroup proportions
Graph subgroup proportions
Compute average of subgroup proportions
Compute the upper and lower control limits
Add centerline and control limits to graph

Statistics for Business and Economics, 6e © 2007 Pearson Education, Inc. Chap 18-47
p-Chart Example
Subgroup number, i
Sample size
Number of successes
Sample
Proportion, pi
1
2
3
…
150
150
150
15
12
17
…
.1000
.0800
.1133
…Average sample
proportions = p
Statistics for Business and Economics, 6e © 2007 Pearson Education, Inc. Chap 18-48
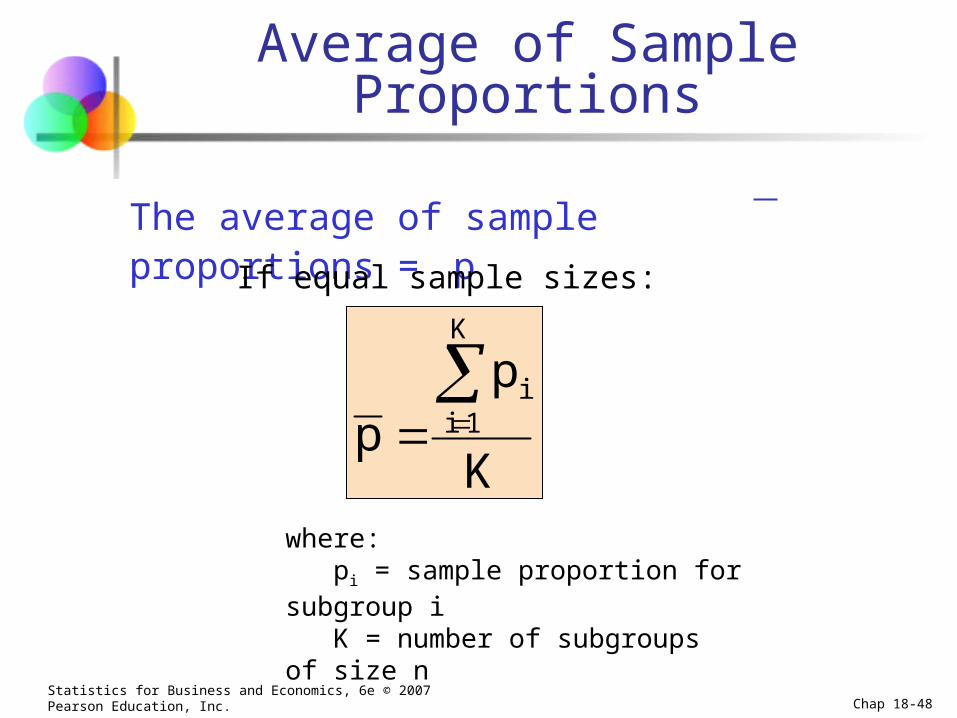
Average of Sample Proportions
The average of sample proportions = p
where: pi = sample proportion for subgroup i K = number of subgroups of size n
If equal sample sizes:
K
pp
K
1ii

Statistics for Business and Economics, 6e © 2007 Pearson Education, Inc. Chap 18-49
Computing Control Limits
The upper and lower control limits for a p-chart are
The standard deviation for the subgroup proportions is
UCL = Average Proportion + 3 Standard Deviations LCL = Average Proportion – 3 Standard Deviations
n
)p)(1p(σp
ˆ

Statistics for Business and Economics, 6e © 2007 Pearson Education, Inc. Chap 18-50
Computing Control Limits
The upper and lower control limits for the p-chart are
(continued)
n
)p(1p3pUCL
n
)p(1p3pLCL
p
p
Proportions are never negative, so if the calculated lower control limit is negative, set LCL = 0

Statistics for Business and Economics, 6e © 2007 Pearson Education, Inc. Chap 18-51
p-Chart Example
You are the manager of a 500-room hotel. You want to achieve the highest level of service. For seven days, you collect data on the readiness of 200 rooms. Is the process in control?

Statistics for Business and Economics, 6e © 2007 Pearson Education, Inc. Chap 18-52
p Chart Example:Hotel Data
# NotDay # Rooms Ready Proportion
1 200 16 0.0802 200 7 0.0353 200 21 0.1054 200 17 0.0855 200 25 0.1256 200 19 0.0957 200 16 0.080

Statistics for Business and Economics, 6e © 2007 Pearson Education, Inc. Chap 18-53
p Chart Control Limits Solution
.08647
.080.035.080
K
pp
K
1ii
.1460200
.0864).0864(13.0864
n
)p(1p3pUCL
.0268200
.0864).0864(13.0864
n
)p(1p3pLCL
p
p

Statistics for Business and Economics, 6e © 2007 Pearson Education, Inc. Chap 18-54
p = .0864
p Chart Control Chart Solution
UCL = .1460
LCL = .02680.00
0.05
0.10
0.15
1 2 3 4 5 6 7
P
Day
Individual points are distributed around p without any pattern. Any improvement in the process must come from reduction of common-cause variation, which is the responsibility of management.
_
_

Statistics for Business and Economics, 6e © 2007 Pearson Education, Inc. Chap 18-55
c-Chart
Control chart for number of defects per item Also a type of attribute chart Shows total number of nonconforming items
per unit examples: number of flaws per pane of
glass
number of errors per page of code
Assume that the size of each sampling unit remains constant

Statistics for Business and Economics, 6e © 2007 Pearson Education, Inc. Chap 18-56
Mean and Standard Deviationfor a c-Chart
The sample mean number of occurrences is
K
cc i
The standard deviation for a c-chart is
cσc ˆ
where: ci = number of successes per item K = number of items sampled

Statistics for Business and Economics, 6e © 2007 Pearson Education, Inc. Chap 18-57
c-Chart Center and Control Limits
c3cUCL
c3cLCL
c
c
The control limits for a c-chart are
cCLc The center line for a c-chart is
The number of occurrences can never be negative, so if the calculated lower control limit is negative, set LCL = 0

Statistics for Business and Economics, 6e © 2007 Pearson Education, Inc. Chap 18-58
Process Control
Determine process control for p-chars and c-charts using the same rules as for X and s-charts
Out of control conditions: One or more points outside control limits
Six or more points moving in the same direction
Nine or more points in a row on one side of the center line

Statistics for Business and Economics, 6e © 2007 Pearson Education, Inc. Chap 18-59
c-Chart Example
A weaving machine makes cloth in a standard width. Random samples of 10 meters of cloth are examined for flaws. Is the process in control?
Sample number 1 2 3 4 5 6 7
Flaws found 2 1 3 0 5 1 0

Statistics for Business and Economics, 6e © 2007 Pearson Education, Inc. Chap 18-60
Constructing the c-Chart
The mean and standard deviation are:
1.71437
0150312
K
cc i
1.30931.7143c
2.2143(1.3093)1.7143c3cLCL
5.6423(1.3093)1.7143c3cUCL
The control limits are:
Note: LCL < 0 so set LCL = 0
Statistics for Business and Economics, 6e © 2007 Pearson Education, Inc. Chap 18-61
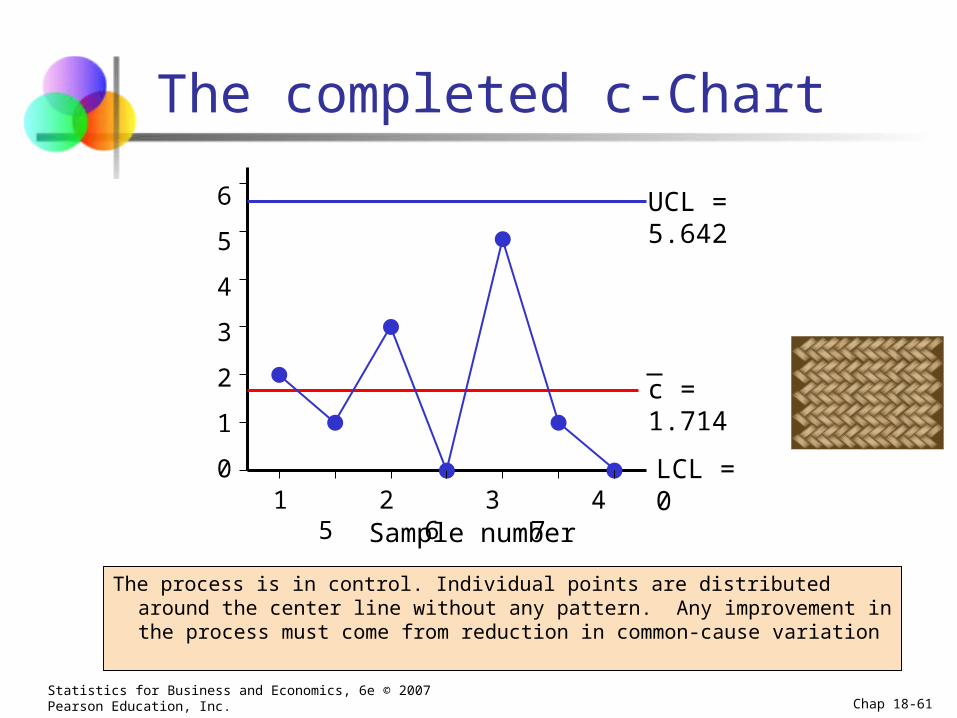
The completed c-Chart
The process is in control. Individual points are distributed around the center line without any pattern. Any improvement in the process must come from reduction in common-cause variation
UCL = 5.642
LCL = 0
Sample number1 2 3 4 5 6 7
c = 1.714
6
5
4
3
2
1
0

Statistics for Business and Economics, 6e © 2007 Pearson Education, Inc. Chap 18-62
Chapter Summary
Reviewed the concept of statistical quality control
Discussed the theory of control charts Common cause variation vs. special cause variation
Constructed and interpreted X and s-charts Obtained and interpreted process capability
measures Constructed and interpreted p-charts Constructed and interpreted c-charts