Embed Size (px)
Citation preview
CHANNELS OF CORRUPTION IN ESTABLISHMENT OF SPECIAL
ECONOMIC ZONES IN UKRAINE
by
Violeta Skrypnykova
A thesis submitted in partial fulfillment of
the requirements for the degree of
MA in Economic Analysis
Kyiv School of Economics
2013
Thesis Supervisor: Professor Olena Nizalova
Approved by _____________________________________________
Head of the KSE Defense Committee, Professor Wolfram Schrettl
____________________________________________
____________________________________________
____________________________________________
Date ___________________________________
Kyiv School of Economics
Abstract
CHANNELS OF CORRUPTION IN ESTABLISHMENT OF SPECIAL
ECONOMIC ZONES OF UKRAINE
by Violeta Skrypnykova
Thesis Supervisor: Professor Olena Nizalova
Special economic zones (SEZ) were established in Ukraine in 1998-2000 period.
We investigated the influence of oligarchs on the government’s decision for
selection of rayons for SEZ program. The research is done on rayon level with
probit regression using Mundlak-Chamberlain approach. The evidence for the
positive effect of oligarchs’ presence in rayons before SEZs establishment on the
selection of treated rayons is found. No evidence is found for the reverse causality
checked whether businessmen were attracted to rayons after SEZs were
established.

To my M om
TABLE OF CONTENTS
Number Page
Chapter 1: INTRODUCTION ........................................................................................ 1
Chapter 2: LITERATURE REVIEW ............................................................................. 8
Chapter 3: METHODOLOGY ..................................................................................... 13
Chapter 4: DATA DESCRIPTION .............................................................................. 19
Chapter 5: EMPIRICAL RESULTS .............................................................................. 22
Chapter 6: CONCLUSION ............................................................................................ 26
WORKS CITED ............................................................................................................... 28
ii
LIST OF FIGURES
Number Page
Figure 1: Map of Ukraine and special economic zones locations .................................. 32
iii
LIST OF TABLES
Number Page
Table 1 Descriptive statistics for 1996-2000 years .......................................................... 33
Table 2 Descriptive statistics for treated and non-treated rayons separately ............ 33
Table 3 Mean wages during 1996-1999 for treated and non-treated rayons ............. 34
Table 4 Mean unemployment rate during 1996-1999 for treated and non-treated rayons ............................................................................................... 34
Table 5 Mean industrial growth rate during 1996-1999 for treated and non-treated rayons ............................................................................................... 35
Table 6 Estimation results for lobbying effect in probit regressions .......................... 36
Table 7 Estimations for marginal effects ........................................................................... 37
Table 8 Estimation results for reverse causality model .................................................. 38

iv
ACKNOWLEDGMENTS
The author wishes to say special words of acknowledgement to people who made
this thesis possible.
Foremost, it is with immense gratitude that I acknowledge the help of my thesis
supervisor Dr. Olena Nizalova. It is an honor to work with this professor. I
especially appreciate the inspiration and motivation she gave for my topic. Her
guidance, continuous support and especially optimistic view highly encouraged me.
It would be hard to coordinate my work without her stimulating suggestions,
recommendations, useful remarks and valuable advice.
Furthermore, I acknowledge the assistance and remarks of other professors and
my classmates from Kyiv School of Economics. A special thanks goes to my
classmate and best friend Nataliia Legka for her support, teamwork and time spent
together.
Last but not least, I am indebted to my family. First, to my mother. She believed in
me and supported me since the first day of my studies in Kyiv School of
Economics. It would be impossible to finish my work and graduate without her
warm care, phone calls and keeping me up. I hope not to disappoint her in future.
At the same time I wish to thank my fiancé Sergii Gorbunov for all his love and
patience and especially for hot lunchboxes prepared for me. My work would feel
much harder without his help in data collection and proof-reading.
I greatly appreciate all people who supported me in my work.
v
GLOSSARY
Special economic zones (SEZs). Designated areas in countries, which possess
special economic regulations that are different from other areas in the same
country.
Free economic zones (FEZs). Special economic zones (SEZs) in which
companies are taxed very lightly or not at all in order to encourage economic
activity.
Territories of priority development (TPDs). Special economic zones (SEZs)
designated in distressed regions in order to create new job places with the help of
special regime of investment activity.
C h a p t e r 1
INTRODUCTION
Special economic zones (SEZs) are commonly referred to as special areas on the
territory of a particular state, which are governed by special, usually privileged legal
regulation of economic activity thus being one of the regional development
instruments. The main purpose of such zones formation is economic development
in terms of direct foreign investments attraction, stimulation of production and
increasing of export, infrastructure development and new jobs formation (OECD,
2009).
However, the reasons for selection of regional areas as for special economic zones
are not always officially stated or at least intuitively logical. Therefore, we followed
the idea to investigate the conditions of establishment of special economic zones
in Ukraine.
The World Atlas of free Zones (2010) distinguishes 1 735 special zones in 133
countries as of 2009. For instance, China alone has 213 free zones under nine
different legal regimes and in 2008 they accounted for around 47 % of the
country’s total exports.
In Ukraine there were two types of special economic zones, which are free
economic zones (FEZs) and territories of priority development (TPDs). According
to Ukrainian legislation, the formers are parts of country’s territory which are
eligible for special legal regime of economic activity treatment; the purpose of
FEZs creation to boost economic activity and attract investments. The latter are
expected to create new jobs by means of special investment activity regime in
2
distressed regions characterized by unfavorable socio-economic and ecologic
environment.
In their turn, free economic zones are divided in such types (FIAS, World Bank,
2008), which are also represented in Ukraine:
1) Free trade zones are usually treated as duty-free areas separated from
national customs territory, where goods may be treated without customs
authorities’ intervention;
2) Exporting processing areas are oriented for export production and linked to
domestic economy in minimal way;
3) Enterprise zones are created for stimulating and revitalizing economic
activity in rural areas via tax incentives and subsidies;
4) Freeports cover larger areas, comprehending touristic-recreational activity,
retail sales and others;
5) Specialized zones may imply free banking zones, free gambling zones,
industrial or logistics parks, airport-based zones, etc.
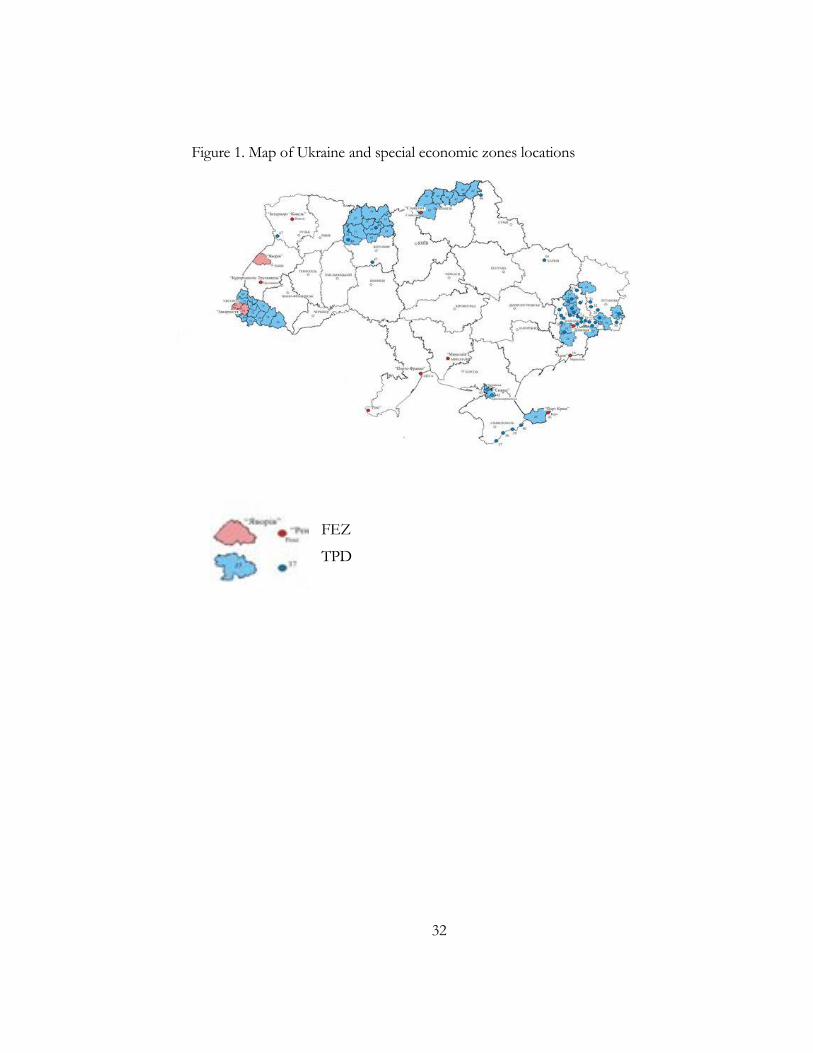
Overall there are 11 FEZs and 9 TPDs, covering more than 10% of the whole
area of Ukraine (see Figure 1). The first special economic zone in Ukraine was
North-Crimean Experimental Economic Zone Syvash in the Autonomous
Republic of Crimea introduced in 1996. It was established as an experiment and
was intended to be shut down in 2001. During the 1998-2000 period another 11
FEZs and 9 more TPDs were established, and they were functioning until
March 2005, after that the Cabinet of Prime-Minister Iuliia Tymoshenko passed
a resolution to shut the zones off.
3
According to the OECD report on investment policy in Ukraine (2011), enterprises
in special economic zones were exempt from VAT tax. By March 2005 there were
680 of them with the amount of foreign capital of USD 2.5 billion. “The cost of
this SEZ tax avoidance and tax evasion represented more than 3% of GDP”
(World Bank, 2010b), which is not surprising given tax preferences to enterprises
and whole industries in SEZs. Unfortunately, Ukrainian government hasn’t
foreseen such negative outcomes when establishing the zones. However, the
government claimed their motives, but didn’t pronounce clear criteria for SEZs
selection. Still, the procedure of SEZs establishment is not transparent and does
not give clear idea how zones were selected (Sarma, 2007). Therefore, the purpose
of this paper is to investigate the background of special economic zones
establishment in Ukraine. The main hypothesis is that lobbying effect of large
businesses owners (referred to as “oligarchs”) is one of the determinants of
government decision for areas selection for special economic zones. At the same
time we control for general socioeconomic characteristics of areas such as wages,
unemployment rate and industrial output growth.
The word “oligarch” is close to the term “business magnate” meaning people who
earned their wealth in big business in particular industry or industries. The specifics
of Ukrainian oligarchs is that they appeared suddenly back in mid-1990’s
(Gorodnichenko et al., 2006) when Ukraine stagnated in transition mostly because
those people had administrative resources for mass privatization of previously
state-owned enterprises. In developed countries in common practice business
magnates are not expected to earn a fortune in few years. Another feature of
Ukrainian oligarchs is considered to be their control of political life in the country
by means of connections to the government in direct or indirect way. Besedina and
Coupe (2012) in their unpublished work show that oligarchs protect their interests
in two ways: either they deal with politicians and help the latter finance their
campaigns in exchange of support in the government promoting favorable laws
4
(such form is usually referred to as lobbying) or they gain seats in the Parliament
themselves and try to pass laws which are convenient for them. The first problem
is that lobbying in Ukraine is not secured in legislation and considered illegal, unlike,
for instance, in the USA, where lobbying is institutionally established and regulated.
The second problem is that Ukrainian politicians are prohibited to run their own
business. Since both forms of lobbying are not legal, we consider oligarch’s control
of the government and protection of their interests as corruption.
Considering all of this information, we suspect that oligarchs could have controlled
the process of establishment of SEZs in convenient for them areas influencing the
government for their own benefit. Hence, in our research we consider corruption
channels in the establishment of SEZs in Ukraine
The motivation behind the research about special economic zones in Ukraine has
several focuses. Firstly, SEZs in Ukraine are not studied widely, though this issue
currently hotly debated in policy circles. Secondly, the weakness of existing studies
on special economic zones in the world is that they do investigate what happens
after the SEZs establishment but do not question the motives and criteria for SEZs
selection. Finally, the process of SEZs establishment in Ukraine is obscure due to
challenging and painful transition period back in 1990s. Moreover, after the
abolishment of special status of zones, the areas themselves lost their benefits, tax
incentives, subsidies and financial grants, which intuitively should have led to a
decrease in overall level of production and economic activity. However, Nizalova
and Vyshnya (2012) in their unpublished research found that it was not actually the
case. They concluded that special zone status forfeiture did not have an effect on
further economic activity of the regions, which gives suggestions and motivation
for further research in that area. One of possible reasons of this result is a short-
run effect when in the long-run impact of the closure of SEZs on firms in the
regions can be different. However, alternative explanations, which can be found in
5
further research, are possible. Another explanation for such a phenomenon could
be lobbying. Investigation of SEZs establishment and its correlation with the
owners of key enterprises in the respective areas and staff of the Cabinet of
Ministers in 2005 allows tracing channels of corruption, because lobbying is not
legal in Ukraine. The hypothetical reason for that is possible rent-seeking of
businessmen: when they have enterprises in some regions, they may want to get
some tax preferences or opportunities for legal tax avoidance, so that they can
lobby politicians to establish the zones in the key areas.
The major point of Ukraine’s SEZs study relevance is that special economic zones
may be reestablished. The current President of Ukraine has engaged the former
Minister of Economic Development Petro Poroshenko to study the possibility of
renewing the law about special economic zones (UNIAN1, 2012). Analysis of the
former situation would be a possibility to predict the effects of potential reform if
it is taken. However, three bills were already passed in summer 2012, introducing
the possibility of investment activity stimulation in prioritized industries with great
tax benefits, though no particular “prioritized” industry is mentioned, which means
that any enterprise owner close to certain official may consider his industry
“prioritized” and ignore the tax regulation, which actually establishes the offshore
jurisdiction within the territory of Ukraine. After that a great probability exists that
SEZs will be reactivated and even more channels of corruption will be open,
negatively affecting the social welfare.
In this paper we investigate the extent of corruption impact on special economic
zones formation. Our hypothesis is that business groups’ owners which are
sometimes called oligarchs in Ukraine could lobby the government in their favor
in order to establish an economic zone with special benefits in the area where their
businesses were located.
6
The number of papers about SEZ is limited; especially it concerns studies of SEZs
formation and SEZs in Ukraine. In theory, establishment of free economic zones
should have positive impact on the economy giving incentives for FDI, increase of
employment and economic growth. Nevertheless, in fact its effect can be
indeterminate, it can have negative externalities due to tax revenue redistribution
diversification and targeting localization of trade and investments (Grubel, 1982),
meaning that by providing preferences to one region government may affect the
other one in an adverse way.
This is performed using regional level (rayon) data. A model is developed indicating
if the rayon was chosen due to positive or negative economic activity (industrial
growth, employment, wages) or due to representatives of businesses from those
regions in Verkhovna Rada or among the major oligarchs of Ukraine. This can be
a test for hypothesis of corruption channel in SEZs. Therefore, our dependent
variable is a binary one controlling whether there was special economic regime in
the rayon, the main independent variable represents the level of oligarchs’
representativeness in rayons and control variables are economic activity
characteristics.
The data for this research is collected in two stages. For the rayon-level the data on
economic activity in Ukrainian rayons are taken from the KSE Data Enclave.
Additionally, information about Ukrainian oligarchs is taken from the Ukrainian
version of Forbes journal (ranking of TOP-100 of the richest people in Ukraine)
and other Ukrainian business media. The research is primarily focused on years
1996-2000. The results show the positive effect of oligarchs representation in
rayons on the SEZs areas selection.
The rest of the paper is structured in the following way: Chapter 2 provides
literature review about the special economic zones; Chapter 3 describes the

7
methodology used in the research; Chapter 4 gives the description of data used;
Chapter 5 gives estimation results and their interpretation; Chapter 6 provides
conclusions.
8
C h a p t e r 2
LITERATURE REVIEW
Theoretically, special economic zones are intended to promote economic growth
in particular regions where these zones are located. Therefore, studies mostly tried
to estimate the real effectiveness of special economic zones, such as impact on
employment level or job creation (Jed and Neumark, 2010; Young and Miyagiwa,
1987), increase in business activity (Hamada, 1974), inflow of FDI (Num and
Radulescu, 2004; Wang, 2010), etc. Devereux and Chen (1995) expanded Hamada’s
(1974) conclusion by including such factors as trade volume and terms of trade
effect. Finally, FEZs may be introduced in order to assist distressed regions
(Nizalov kand Loveridge, 2005).
However, another dimension of FEZs research should be mentioned, which is
geographical one, since free zones vary through the countries, and their features
and effectiveness depend on location and policy run in respective regions. In many
countries, especially in China, the effect of free economic zones is considered as
positive. Wang (2010) estimates the effect of special economic zones on regional
economies in China and provides support for increasing of capital stock and
municipal total factor productivity growth. Meng (2003) estimated large increase in
GDP and technology transfer in Tianjin, China. Positive impact of export
processing zones on the economy is proven for South Asian countries, such as
Bangladesh, India and Sri Lanka (World Bank, 2008). Creation of SEZs may have
positive impact even on human development and reduction of poverty how it was
shown for India case by Aggarwal (2007). On the other hand, Watson (2001)
provided evidence for quite modest effect of special economic zones in Africa. A
9
wide cluster of literature describes special economic zones in USA, often called
enterprise zones, and mainly focuses on the impact of enterprise zone status on
labor markets in the areas. Thus, Busso’s and Kline’s research (2008) found that in
USA special economic zones programs were highly beneficial especially for local
labor markets, while Jed and Neumark (2010) concentrated on California free
enterprise zones and local labor market and found out that the positive effect of
those zones is not obvious; Boarnet and Bogart (1996) concluded that special
economic zone program turned out to be inefficient in New Jersey and didn’t have
any positive effect on total employment. Nevertheless, the results of Ham et al.
(2011) are supportive for Busso and Kline (2008). However, negative or neutral
results of special economic zones programs may be caused by unsound
government policy or lack of comparative advantage like it was shown for Pacific
island states (Hannesson, 2008).
As regards transition countries, which are far more close to Ukraine, Cieślik and
Ryan (2005) suggested that findings for Poland are consistent with previous
findings for other countries: establishment of special economic zones actually
attracts FDI; but the results are not significant if controlling time effect.
Schweinberger (2003) proposes feasible lump-sum taxation and special
employment tax/subsidy in order to have positive impact of SEZs on economy.
Some countries may choose introduction of SEZs in order to recover from
transition crisis (Nyzalova and Vyshnya, 2012) and switch to labor-saving
technologies (Onar, 2007). Ukraine has chosen this instrument as the only
“panacea” to economic crisis (Maksymenko, 2001).
A popular instrument to evaluate the impact of FEZs is cost-benefit analysis
(CBA). This implies a comparison of country’s areas treated and non-treated as
SEZs. Amirahmadi and Wu (1995) concluded that establishment of export-
processing zones in Asia should be supported by rural industrialization and regional
10
development which eventually should result in liberal economic regime through
the whole country. Chen (1993) claimed that SEZs establishment in China may be
a lesson for other countries because it was beneficial to the society from the point
of view of both economic and social welfare: employment and tax revenue
increased, people received new skills by means of technical training and developed
infrastructure such as roads and buildings. Warr (1989) developed a simple
“enclave model” in order to evaluate costs and benefits for four countries and
showed that greatest benefit comes from employment increase. Jayathakamaran
(2003) surveyed the literature on the performance of special economic zone
regarding cost-benefit analysis framework and concluded that previous findings for
Asian countries that establishment of SEZs increases employment and foreign-
exchange earnings are consistent.
The costs are usually observable as the amount of taxes underpaid by enterprises
eligible for tax preferential treatment; however, the benefits are not always that
observable and countable, that is why researches often focus on evaluation of the
impact of such policies trying to address the issue of regional development (review
of Buss 2001).
Even though there is a research interest in SEZs and their impact on the economic
and political environment in the country, there are no studies regarding to the
determinants of SEZs establishment.
There are few empirical studies about special economic zones in Ukraine. Mostly
Ukrainian SEZs were considered theoretically. Maksymenko (2001) argued that the
first SEZ in Ukraine was introduced in order to provide privileges to enterprises
which were not profitable and would never increase government’s revenue. The
same can be assumed for other economic zones promoted after Syvash zone in
Crimea. Aslund (2005) also affirmed that free economic zones were closed down
11
due to huge tax evasion. Tubbin (1999) assumed inefficient FEZs legislation,
government intervention and intensive market regulation, which would definitely
reduce level of FDI in respective regions. The only empirical evidence for positive
impact of FEZs on firms was provided in the preliminary unpublished research by
Nizalova and Vyshnya (2012). They analyzed rayons treated as free economic zones
or territories of priority development and industries treated as preferential in special
economic zones and concluded that in those rayons where SEZs had been
established in selected industries employment had increased by 11.2% and wages
by 8% at the affected enterprises. However, when analyzing the whole
environment, the important finding was that this increase in employment and
wages was mostly a reallocation effect from other industries in the treated rayons
which means quite modest or no beneficial effect of SEZs establishment in the
rayons. Since that time studies about SEZs in Ukraine were not developed and that
is why my interest in the topic is so keen.
In general, there is no research about corruption in special economic zones, but
there is a study by Gorodnichenko et al. (2006) about the oligarchs. The authors
empirically estimated behavior of the oligarchs on a sample of almost 2,000
Ukrainian open joint stock companies. The authors have found empirical
evidence for the hypothesis that oligarchs may have positive impact on
productivity. This may suggest further research whether the presence of
oligarch’s business in the rayon selected for special economic zone was beneficial.
Moreover, this paper motivated the question about the reverse causality between
SEZs creation and businessmen, which is whether rayons selected for special
economic zones could attract oligarchs.
When referring to corruption, Corruption Perception Index is used most
commonly. The alternative source of data on corruption is firm-level data from the
BEEPS report provided by EBRD. The research about cross-regional CPI in
12
Ukraine was made with national surveys by European Research Association and
Kyiv International Institute of Sociology. However, all of these measures do not
reflect the lobbying effect in the government’s decisions.
Summarizing everything written above, first, my research contributes extra piece
to the existing studies about special economic zones in Ukraine, which are not
widespread; and second, it gives a starting point in the literature for studies of the
motivation and criteria for special economic zones creation and areas selection. At
the same time my paper may be applied by both of Ukrainian policy makers and
economic policy researchers. The formers may consider the evidence provided and
revise their policy of regional development especially regarding to the speculations
about the re-establishment of SEZ in Ukraine, and the latters may use the paper as
background motivation for similar research in other countries.
13
C h a p t e r 3
METHODOLOGY
As mentioned above, the amount of literature on the subject is limited since the
topic is quite narrow. Therefore, it is difficult to follow certain particular
methodology, as there are no studies about the determinants of special economic
zones selection. That’s why we will use an ad hoc approach.
The core model is expected to check empirically whether the SEZs were chosen
due to economic activity or due to the lobbying of oligarchs.
We treat special economic zones as both free economic zones and territories of
priority development. Though they are aimed to pursue different objectives, they
are characterized by almost the same tax preferences and prerogatives.
Furthermore, different rayons were selected both as FEZs and TPDs (the number
of districts that were subject to regimes of SEZs and TPD – 41s, the number of
cities that were subject to regimes of FEZs and TPDs – 58).
Oligarchs’ lobby may take place in two forms: either they promote their interests
to the politicians whose campaigns are financed by them or they get elected to
Verkhovna Rada and pass the required laws directly (Besedina and Coupe, 2012)
so that every oligarch having assets in particular area (rayon) could “ask” some
politician or vote himself for establishment of economic zone in the very that rayon
or rayons. Hence, our dependent variable is rayon selected or not for special
economic zone program, and the main independent variable of interest is number
of oligarchs represented (=having assets) in the rayon.
14
At the same time we control for socio-economic characteristics of rayon such as
wages, unemployment rate and industrial output growth. These characteristics
could also influence the decision of the government to introduce special economic
zone in certain rayon.
It’s important to admit that SEZs in Ukraine were established at the end of 1990’s,
in 1998-2000, and at the same time two elections took place in 1998 and 1999 in a
row: Parliamentary elections to Verkhovna Rada and Presidential Elections. There
is a possibility that businessmen could lobby for creation of special economic
zones in preferred areas in change of electorate support guarantees. We consider
this as an important issue and also take it under control in the equation.
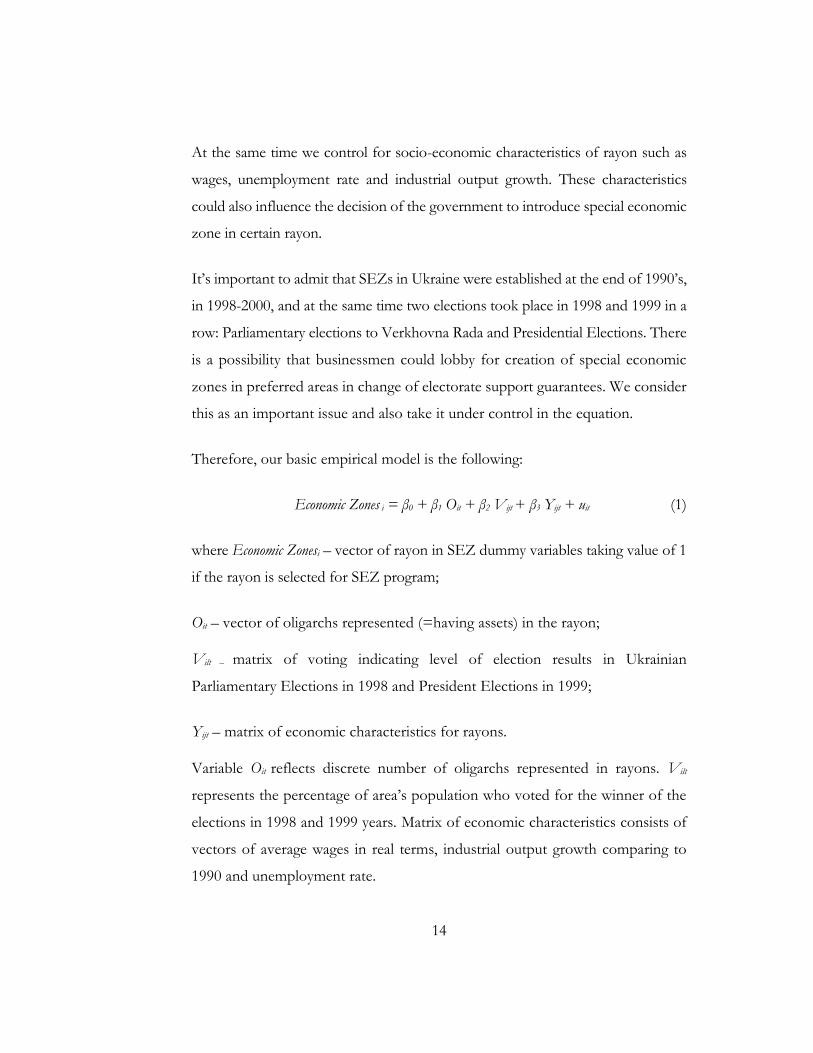
Therefore, our basic empirical model is the following:
Economic Zones i = β0 + β1 Oit + β2 Vijt + β3 Yijt + uit (1)
where Economic Zonesi – vector of rayon in SEZ dummy variables taking value of 1
if the rayon is selected for SEZ program;
Oit – vector of oligarchs represented (=having assets) in the rayon;
Vilt – matrix of voting indicating level of election results in Ukrainian
Parliamentary Elections in 1998 and President Elections in 1999;
Yijt – matrix of economic characteristics for rayons.
Variable Oit reflects discrete number of oligarchs represented in rayons. Vilt
represents the percentage of area’s population who voted for the winner of the
elections in 1998 and 1999 years. Matrix of economic characteristics consists of
vectors of average wages in real terms, industrial output growth comparing to
1990 and unemployment rate.
15
Since we have binary dependent variable, we may use either probit or logit model.
Estimating of fixed or random effect model helps to control unobserved
heterogeneity. In former case it is more appropriate to use logit model, in latter –
probit (Maddala, 1987). We assume that u has a standard normal distribution which
leads us to probit. However, we suspect that rayons may have some unobservable
characteristics referable both to time variant and time independent effects. In either
case it is more advisable to use weights in order to follow the consistency (Xie and
Manski, 1988). In this connection we will use weights for population; but this will
be a problem for estimating effects in the model since obviously weights for rayon’s
population won’t be the same for all observations in a group. At the same time, in
our case it is hard to distinguish between random or fixed effects, because they are
both possible. Random effect model addressing time dependent factors requires
assumption of no correlation between the effects and regressors, but this
assumption may be violated in our case. At the same time rayons differ by time
invariant geographical location, industrial structure, climate etc. Regarding
mentioned above and the fact that there is no command for probit with fixed effect
in Stata we will use Mundlak-Chamberlain approach.
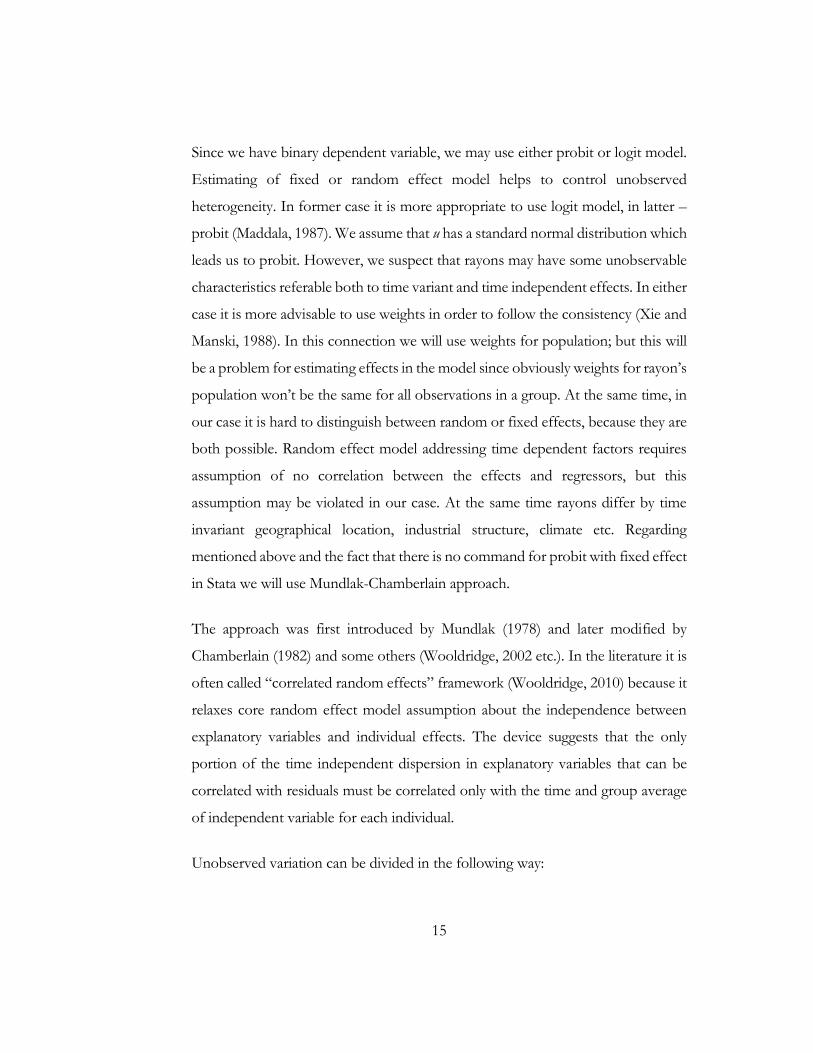
The approach was first introduced by Mundlak (1978) and later modified by
Chamberlain (1982) and some others (Wooldridge, 2002 etc.). In the literature it is
often called “correlated random effects” framework (Wooldridge, 2010) because it
relaxes core random effect model assumption about the independence between
explanatory variables and individual effects. The device suggests that the only
portion of the time independent dispersion in explanatory variables that can be
correlated with residuals must be correlated only with the time and group average
of independent variable for each individual.
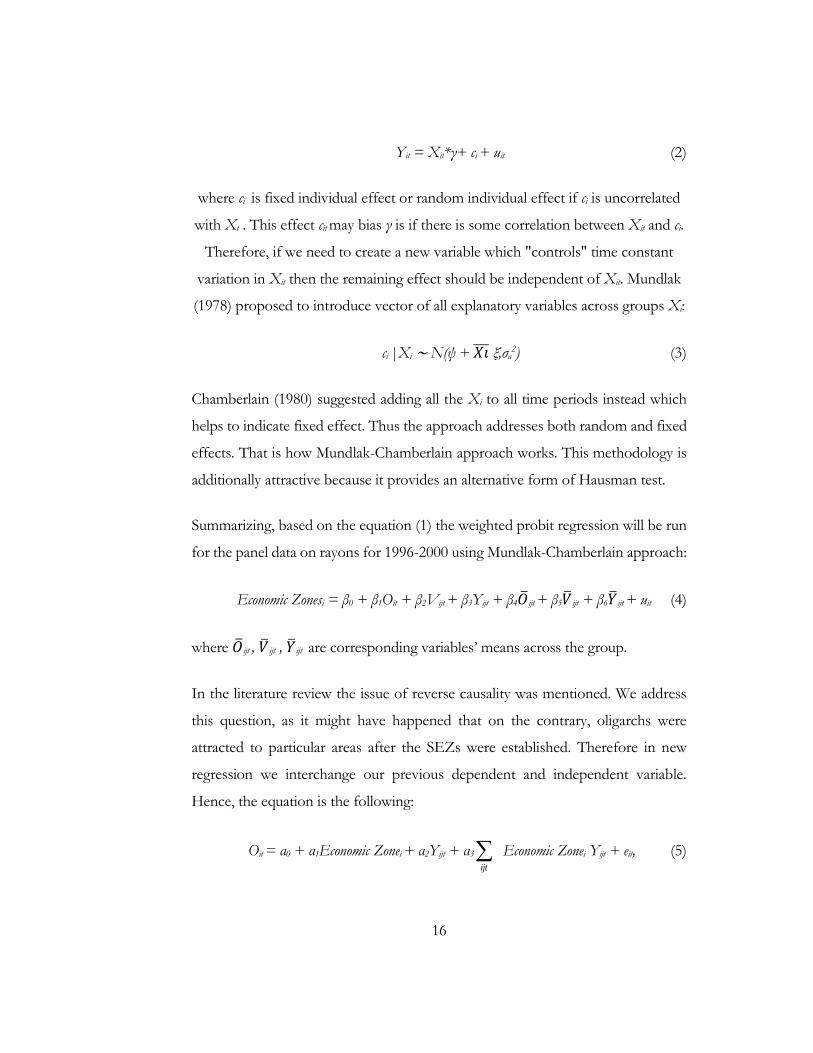
Unobserved variation can be divided in the following way:
16
Yit = Xit*γ+ ci + uit (2)
where ci is fixed individual effect or random individual effect if ci is uncorrelated
with Xt . This effect cit may bias γ is if there is some correlation between Xit and ci.
Therefore, if we need to create a new variable which "controls" time constant
variation in Xit then the remaining effect should be independent of Xit. Mundlak
(1978) proposed to introduce vector of all explanatory variables across groups Xi:
ci |Xi ∼ N(ψ + 𝑋𝑖̅̅̅ ξ,σa2) (3)
Chamberlain (1980) suggested adding all the Xi to all time periods instead which
helps to indicate fixed effect. Thus the approach addresses both random and fixed
effects. That is how Mundlak-Chamberlain approach works. This methodology is
additionally attractive because it provides an alternative form of Hausman test.
Summarizing, based on the equation (1) the weighted probit regression will be run
for the panel data on rayons for 1996-2000 using Mundlak-Chamberlain approach:
Economic Zonesi = β0 + β1Oit + β2Vijt + β3Yijt + β4�̅�ijt + β5�̅�ijt + β6�̅�ijt + uit (4)
where �̅�ijt , �̅�ijt , �̅�ijt are corresponding variables’ means across the group.
In the literature review the issue of reverse causality was mentioned. We address
this question, as it might have happened that on the contrary, oligarchs were
attracted to particular areas after the SEZs were established. Therefore in new
regression we interchange our previous dependent and independent variable.
Hence, the equation is the following:
Oit = α0 + α1Economic Zonei + α2Yijt + α3ijt
Economic Zonei Yijt + eit, (5)
17
Variables used for regression (5) are the same as in equation (1) and described
above, the only difference is that in the regression (5) data used for years after 2000
till 2005 when all the zones were abolished. Similar to the model (4) we control for
socio-economic characteristics Yijt, because businessmen could be attracted to the
rayons by different reasons. For example, they could look for distortions on labor
market in order to hire more people or be motivated by lower wages in the region
because lower wages mean higher profits for the enterprises owners. At the same
time we control for interaction terms between Economic Zonei and Yijt because
businessmen could be attracted to particular rayons even to a greater extent as they
were given tax advantages and the same time had favorable socioeconomic
characteristics. On the one hand, oligarchs could lobby their interests in terms of
rent-seeking and assist in establishment of SEZs in particular areas; on the other
hand, if those areas were not treated equally compared to all other regions of
Ukraine, it means that there were special conditions for business development,
which could enrich certain persons. Since the dependent variable is discrete and
non-negative, we will use Poisson regression.
In the main regression (1.1) we expect the signs for coefficients and for the
marginal effects of main dependent variables to be positive according to our
hypothesis. As regards control variables, the signs for economic characteristics
may be different because of different motivations regarding to the SEZs
establishment. In equation (2) signs are expected dependently on the results in
estimation (1.1). If the hypothesis of lobbying effect fails, we expect the
alternative reverse causality hypothesis to be confirmed by positive sign on the
variable of economic zones. The signs for economic characteristics and
interaction term may be also different because of different possible motivation
of businessmen.
18
Presumably, equations (1.1) and (2) are not simultaneous, since we use different
time intervals for them with hypothesis that due to operating activity in those years
in particular areas usual businessmen could become oligarchs. Still, further research
is possible to give evidence for that.
There are possible econometric problems within the empirical approach. The first
one is the question of reverse causality but we already mentioned it and described
above. We address this possible problem with equation (2). The second possible
problem is omitted variable bias but we also partially address it with the help of
Mundlak-Chamberlain fixed effect approach considering that the portion of
variation is attributed to the time constant unobservable characteristics. The third
possible problem is multicollinearity. We expect it to be suppressed by sufficient
number of observations. Additionally, we adjust standard errors for clustering and
robustness check.
19
C h a p t e r 4
DATA DESCRIPTION
The data that we will use in the research can be divided in several blocks:
1) Information about rayons and FEZs/TPDs. The source of this information
is the web-site of Verkhovna Rada which provides legislation for FEZs and TPDs
establishment and closure.
2) Data about economic activity in rayons for years 1996-2005. It includes
wages, unemployment rate, industrial output growth, fixed capital investments
and population characteristics by rayons. Data was kindly provided by EERC
Data Enclave.
3) Data about oligarchs. It’s collected manually from different sources. First,
the list of TOP-100 Ukraine’s Richest People list was analyzed. This rank is
published in Ukrainian version of Forbes journal. Secondly, information about
biggest business groups in Ukraine was taken from “GVardia” journal. Other
publicly available resources were used for data collection. For the first model the
main criteria for selection of oligarch or business entity was whether a
businessman acquired an asset in rayon before SEZs were established. The
second criterion for selection was the ownership or partnership with a rich
businessman who has networks in Verkhovna Rada. Sometimes it was obvious,
for example, for former Vice Prime-Minister (1997, 2010) Serhiy Tihipko, but in
some cases additional piece of information was needed. Mostly, this information
concerned about businessmen’ funding of some parties.
4) Information about electorate voting on Parliamentary and President
Elections in 1998 and 1999 respectively is extracted from the web-site of Central
Election Committee of Ukraine. There is information about election results for
20
different election districts; this information was compiled manually in order to
make estimations for rayons.
In general there are 490 rayons in Ukraine and 178 cities of republican and oblast
subordination which are also counted as rayons. In total we have 669 areas in
total with annual information. Since we have data for 10 years (1996-2005) than
the total number of raw observations is 6690; but we are mostly interested is on
the equation (1) which implies higher focus on 1996-2000 data (3330 raw
observations). There are 1588 actual observations for the regression.
As mentioned previously, there were established 11 free economic zones 9
territories of priority development in Ukraine with 20 treated zones in sum, which
results in 91 dummies for treated areas (910 values of 1 for ten years).
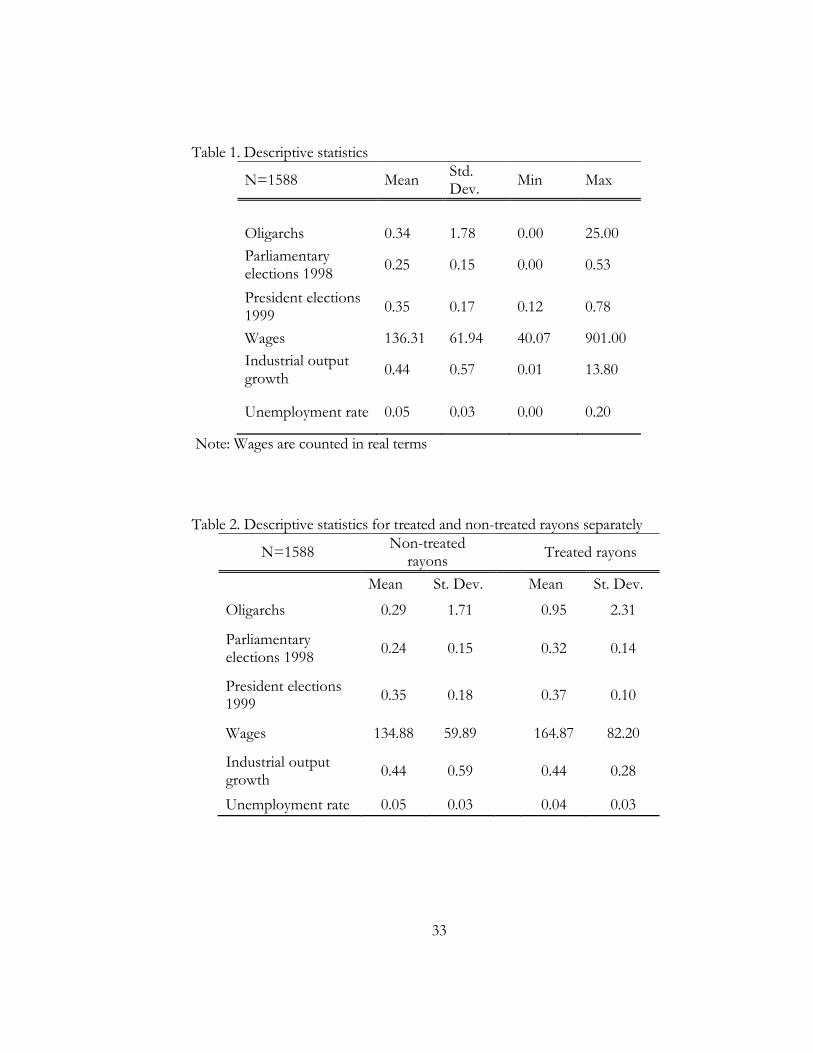
First, let’s consider statistics for the equation (1.1) that is for years 1996-2000
(before SEZs establishment). The summarizing descriptive statistics is given in
Table 1. We can see that on average in 100 rayons there are 34 oligarchs represented
in them. For the time interval 1996-2000 average wages were 136.61 UAH,
industrial output was growing on 44% on average compared to 1990,
unemployment rate was equal 5% on average across the country. In 1998 the
Parliamentary elections outcomes were represented by the average of 25% of
Ukrainian population voting for Communist Party of Ukraine, who won those
elections and gained the majority in the Parliament. In 1999 on average 35% of
Ukrainians voted for the winner of President Elections Leonid Kuchma.
It’s more interesting to compare data separately for special economic zones and
usual areas. We can conclude that in 1996-2000 in treated rayons average wages
were higher by 81% on average , unemployment rate on average was lower (see
Table 2). It is an interesting finding that in rayons where SEZs were established
people on average tended to vote for Communist Party of Ukraine (winner of
21
Parliamentary Elections in Ukraine in 1998). The smaller difference is observable
for the case of President Elections in 1999. Additionally, as it was expected, there
were more oligarchs represented in rayons selected for SEZ program than in usual
regions.
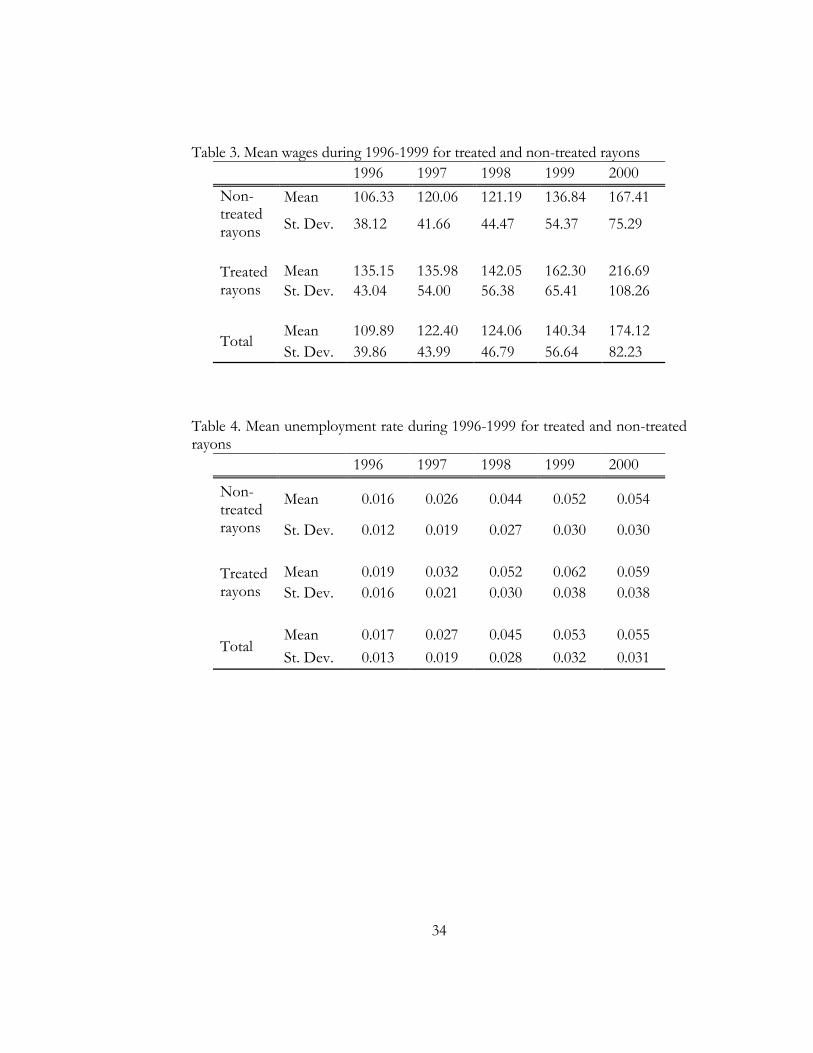
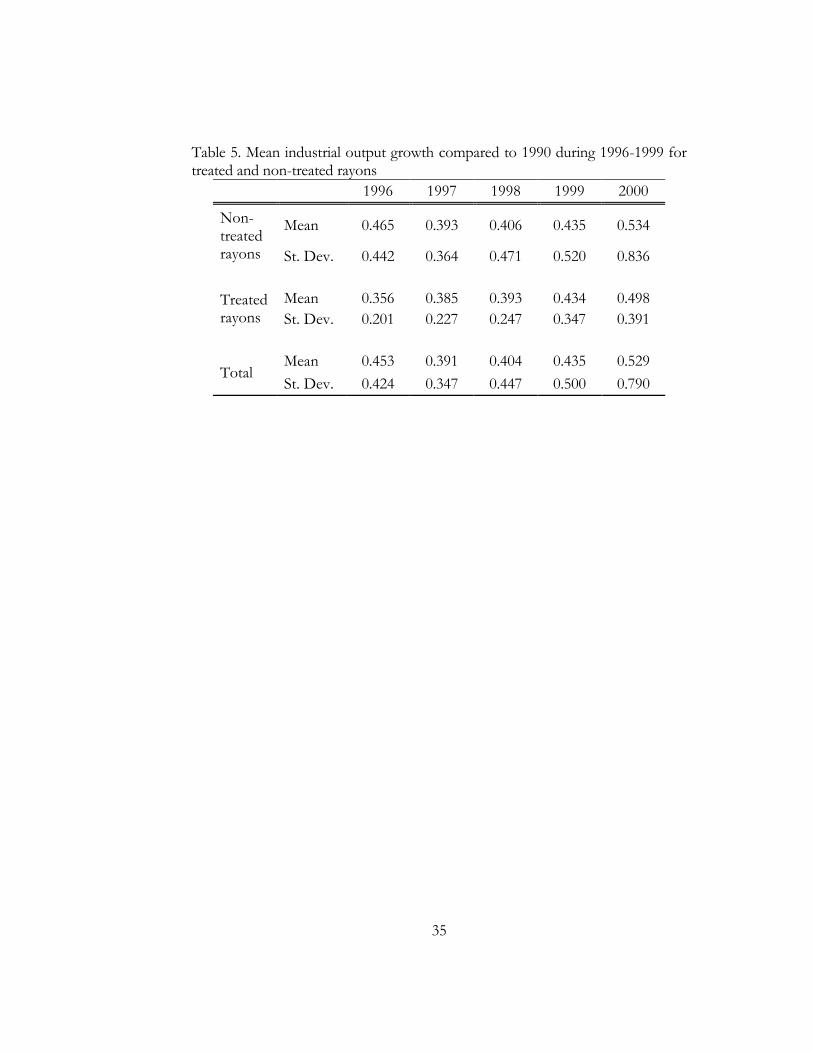
We can track time patterns for socio-economic characteristics when investigating
trends of wages, industrial growth and unemployment rate separately for treated
and non-treated rayons by years (see Tables 3-5).
We can conclude that in treated zones even before SEZs establishment average
wages were significantly higher by 21% on average than in non-treated zones and
even higher than across the whole country (Table 3). As regards unemployment
rate it is also sustainably higher in treated rayons (Table 4). The opposite situation
takes place with industrial output growth rate; it is sustainably lower in treated
zones before the establishment (Table 5).
22
C h a p t e r 5
EMPIRICAL RESULTS
As it was discussed in Chapter 3, dummy of rayons locating in special economic
zones were regressed on the number of oligarchs represented in the area and matrix
of control variables representing rayon’s economic characteristics.
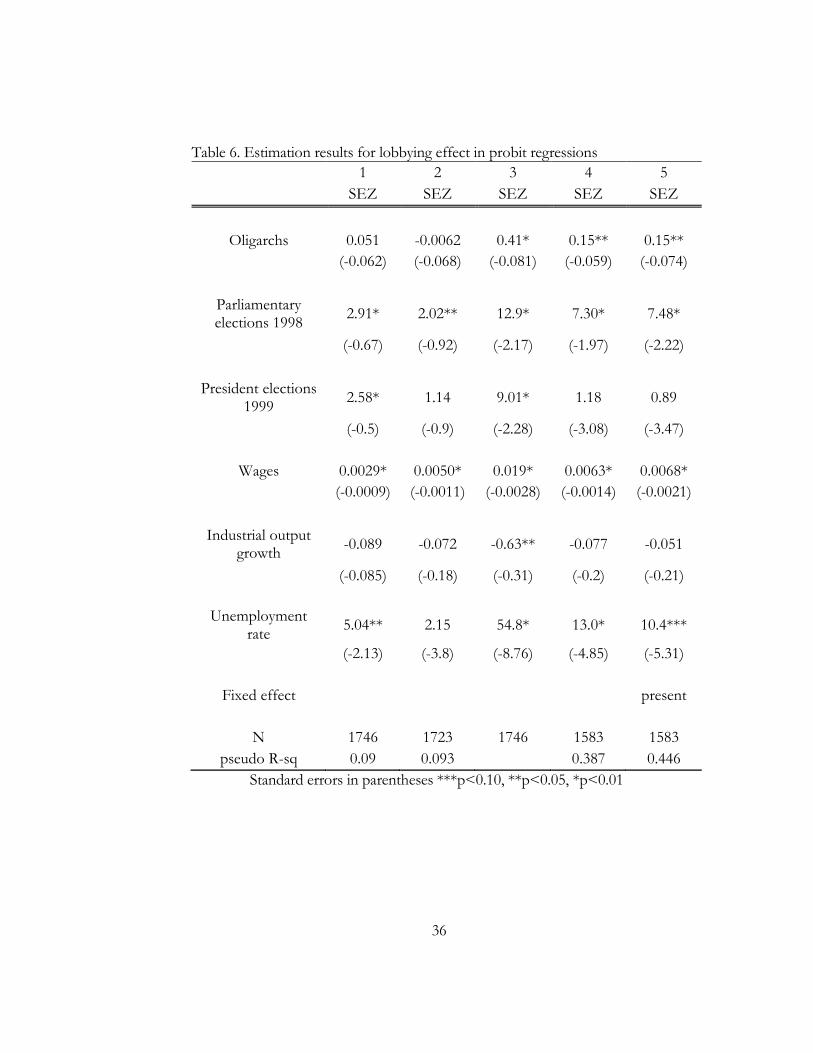
The estimation results of model (1.1) are presented in Table 6.
The model was estimated by several different specifications of probit regression.
First, we run pooled probit without weights. Second, we ran probit weighted by
population. Third, we try pooled probit model with random effect. In the next
models we control for whether oligarch had been represented in the rayon before
SEZ was established there, thus resulting in regressions in columns 4 and 5.
Regression from column 4 from the Table 6 recognizes presence of oligarch in the
area within weighted probit regression. Last regression uses Mundlak-Chamberlain
approach introducing time constant means within the groups for each individual.
As expected, almost in all regressions we received consistent positive sign for main
variables and consistent signs for some controls. Since we’ve got probit model for
binary dependent variable, we cannot interpret and measure the regressions
coefficients directly, we may only assume some latent unobservable and
immeasurable variable which is represented by dummy taking value of 1 if the latent
variable value is higher than zero. However, in the Table 6 we can notice that even
for unobservable variable represented by selection of rayon for SEZ program the
coefficients are significant and have expected signs. This regards to the main
23
variable of interest of oligarchs in the rayons and to the results of the rayons’
populations voting for the Communist Party of Ukraine on Parliamentary
Elections to Verkhovna Rada in 1998. At the same time the coefficients for wages
in the rayon are also positive and significant. The same refers to the unemployment
rate which suggests that politicians in somehow unobservable way could have been
motivated by higher wages and unemployment rate in rayons and especially by
voting distributions and location of oligarchs’ assets there. Though insignificant,
but coefficients on industrial output growth are consistently negative, which is not
counter-intuitive as it is quite reasonable to introduce regional development
incentives in the areas where industrial output growth is lower. Also, has we
assumed before, fixed effect is present within the rayons during given years.
Referring to the goodness-of-fit statistics, for the main equation using Mundlak-
Chamberlain approach, pseudo-R2 is estimated in 45%.
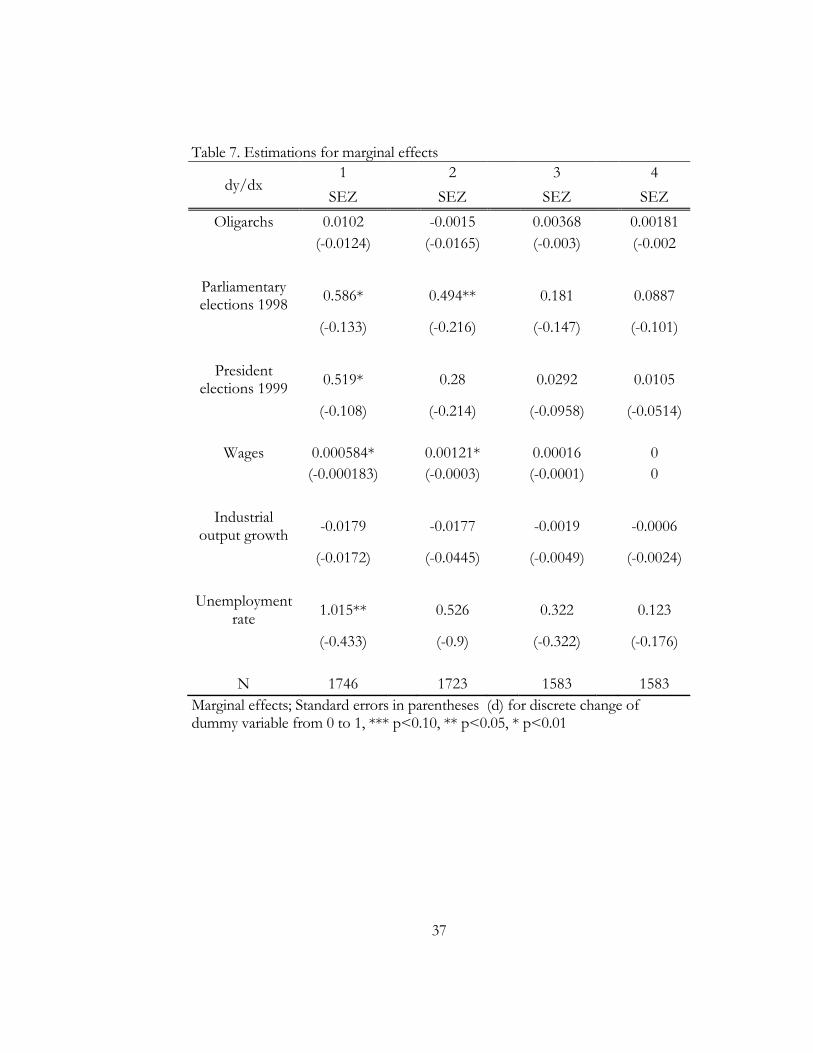
However, these are only suggestions, while we are more interested in marginal
effects measurement and interpretation. Unfortunately, marginal effects estimations
are not very significant in all estimations, but at least they have expected signs (see
Table 7). We can see that accounting for omitted variable bias with Mundlak-
Chamberlain approach decreases the marginal effect for the variable of oligarchs
and makes it even more insignificant which suggest possible endogeneity within the
oligarchs variable. Also some measurement errors are possible. The most relevant
explanation for insignificant marginal effects: different density of oligarchs’ assets
through the rayons meaning that the oligarch who had few enterprises in the area
might had lobbied SEZ establishment there more aggressively than the oligarch
from other rayon having only one firm there.
Still, the coefficients for the voting results in the rayons’ on Parliamentary Elections
are sufficiently high and rather significant to suggest that some form of political
24
corruption by means of bribery of voters in the rayons could have taken place by
means of that the more people in the rayon voted who voted for the Communist
Party of Ukraine in 1998, the conditional probability of that rayon to be selected for
SEZ program increased sufficiently.
The results for all regressions show that the hypothesis of lobbying effect is
allowed. First, presence of oligarch’s business in rayon increased the probability of
SEZ establishment there and at the same time effect of lobbying by electoral
support guarantees is also present. Also, we can see that politicians sustainably
chose rayons with higher wages and higher unemployment for SEZs establishment.
Still, there was a higher probability of SEZ establishment if industrial output
growth was lower comparing to usual rayons.
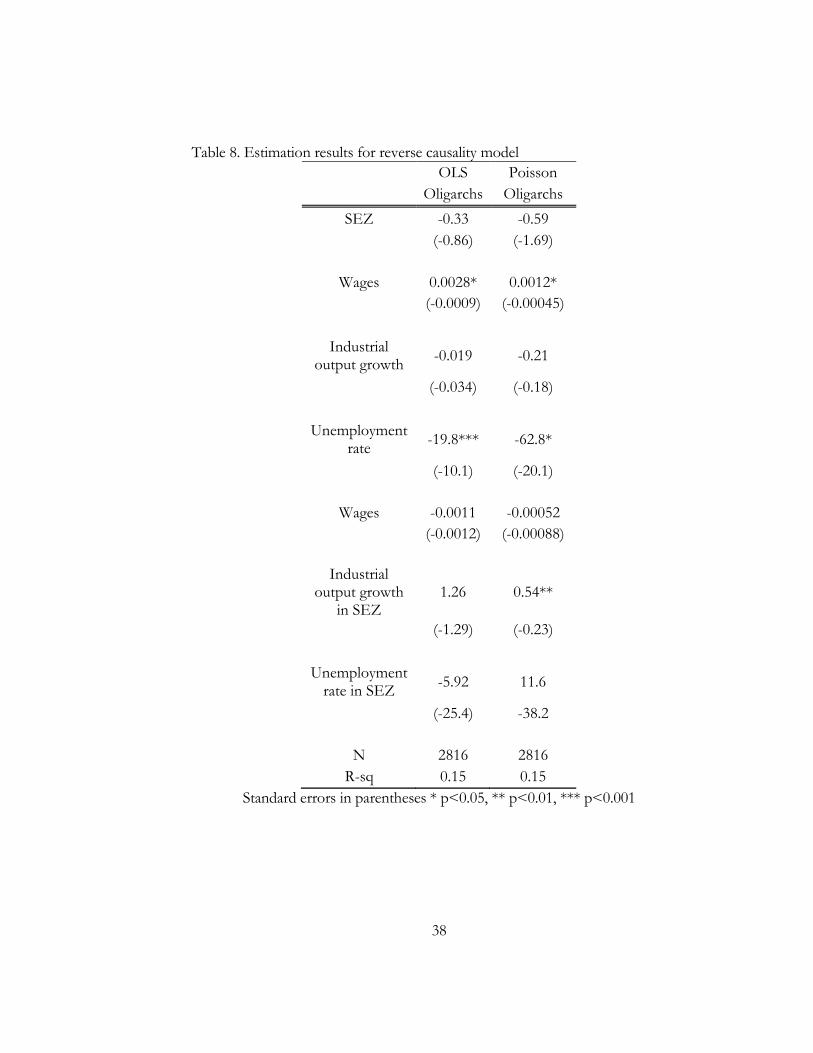
For the regression (2) we run OLS and Poisson. The results for the second model
are presented in Table 8. As we can notice, there is no evidence for reverse causality
we discussed in previous chapters. The coefficients for special economic zones are
insignificant and even negative suggesting that oligarchs were not attracted by the
opportunities and did not come to the areas where SEZ had been already existed,
and it is not contradictory with our expectations. Still, we can see that businessmen
when establishing business in rayons after SEZs were oriented on higher
unemployment, higher wages and higher industrial output growth rate in the rayon.
The coefficient on wages is close to zero though it’s significant, meaning that most
likely oligarchs did not care about mean wages in the areas when locating their
business there. Industrial output growth rate attracted oligarchs only particularly in
rayons in special economic zones, while unemployment rate was more important
criterion and businessmen oriented on it of whatever area status, which is intuitively
logical.
25
Even though the marginal effects are not significant, the main hypothesis about
the lobbying effect for the selection of rayons for special economic zones
establishment in Ukraine is not rejected which applies for presence of corruption
channels and gives motivation for further research.
The alternative hypothesis of reverse causality between oligarchs’ representation in
the rayons and SEZs establishment is not supported. At the same time, we suppose
that there were other issues, which could motivate businessmen to locate their
business in certain areas. These issues may include, but are not limited to
unemployment rate, wages and industrial output growth within the rayons. The
attractiveness of regions with higher unemployment and higher industrial output
growth rate for business establishment does not contradict the intuition.
26
C h a p t e r 6
CONCLUSIONS
In this thesis we analyzed impact of oligarchs on the selection of rayons for
establishment of special economic zones in Ukraine. For the main variables of
interest data was collected manually.
Results received allow not rejecting the hypothesis of oligarchs’ lobby in the
government when establishing special economic zones in Ukraine. We received
evidence of positive effect of oligarchs’ businesses location in rayons on
government’s choice of SEZs locations, which gives reasons to think about
corruption channels. At the same time, the electoral choice of rayon on
Parliamentary and President also had impact on that decision: the more people
in the rayon voted for Communist party of Ukraine on the Parliamentary
elections in 1998, the higher was probability of selection of that rayon for SEZ
program, which also may explained by corruption in the government system.
Controlling socioeconomic characteristics we conclude that unemployment rate
was also an important criterion for SEZs selection. Since probit framework was
employed, marginal effects were analyzed. They are insignificant; it can be
explained by potential endogeneity, measurement errors and clustered standard
errors, but the intuitive explanation for this matter is different density of
oligarchs’ business location across the regions. At the same time marginal effects
depend on other coefficients; that is why it is hard to predict their significance.
With the help of second model and Poisson regression we tried to address the
reverse causality between of oligarchs’ businesses location in rayons and SEZs
establishment but received no strong evidence for that. Positive signs for
significant wages and unemployment rate variables coefficients might motivate
27
oligarchs to locate their business in particular regions. Unemployment is
considered to be more important factor for businessmen.
This paper contributes to the literature about special economic zones and
particularly about SEZs in Ukraine; at the same time, it provides motivation for
further research with different focuses. First, it suggests studying of SEZs
formation conditions and criteria and investigating how transparently they were
established. Second, it may motivate one to make a cost benefit analysis
particularly for Ukrainian SEZs in order to evaluate whether speculations
between socioeconomic welfare and corruption can be beneficial at least for the
state budget. Third, the paper’s framework may be extended by investigating the
density and distribution of oligarchs’ assets in particular rayons. Finally, the
research greenlights analysis of the same issue not within the latent variable
probit framework but employing some observable and measurable variable, like,
for instance, voting of deputies in the parliament for passing the law about each
special economic zone in particular. The results can be used by policymakers
speculating on renovation of SEZ in Ukraine.
28
WORKS CITED
Aggarwal, Aradhna. 2007. Impact of Special Economic Zones on Employment, Poverty and Human Development. Indian Council for Research on International Economic Relations Working Paper No. 194 Akinci, Gokhan and James Crittle. 2008. Special economic Zones performance, Lessons learned, and Implications for Zone development. FIAS, World Bank. Amirahmadi, Hooshang and Weiping Wu. 1995. Export Processing Zones in Asia. Asian Survey, 35, 9 (September): 828-849. Aslund, Anders.2005. The Economic Policy of Ukraine after the Orange Revolution. Eurasian Geography and Economics, 46, 5: 327-353 Besedina, Olena and Tom Coupé. 2012. The Political Economy of Labor Reform in Ukraine: Does Accountability Matter? Unpublished Boarnet, Marlon and William Bogart. 1996. Enterprise Zones and Employment: Evidence from New Jersey. Journal of Urban Economics, 40: 198-215 Buss, Terry. 2001. The effect of state tax incentives on economic growth and firm location decisions: An overview of the literature. Economic Development Quarterly, 15, 1 (February): 90-105 Busso, Matias and Patrick Kline.2008. Do Local Economic Development Programs Work? Evidence From the Federal Empowerment Zone Program. Working Papers 36, Yale University, Department of Economics. Chamberlain, Gary. 1982. Multivariate Regression Models for Panel Data. Journal of Econometrics, 18: 5—46 Chang, Nam and Doina Radulescu. 2004. Do Corporate Tax Concessions Really Matter for the Success of Free Economic Zones? Economic Change and Restructuring, 37, 2: 99-123 Cielik, Andrzej and Ryan, Michael. 2005. Location Determinants of Japanese Multinationals in Poland: Do Special Economic Zones Really Matter for Investment Decisions? Journal of Economic Integration, Center for Economic Integration, Sejong University, 20: 475-496.
29
Devereux, John, and Lein Chen. 1995. Export Zones and Welfare: Another Look. Oxford Economic Papers New Series, 47, 4 (October): 704-713 Demsetz, Harold, and Kenneth Lehn. 1985. The Structure of Corporate Ownership: Causes and Consequences. Journal of Political Economy, 93: 1155-77 Farid, Nada. 2009. Towards Best Practice Guidelines for the Development of Economic Zones. A Contribution to the Ministerial Conference by Working Group 1, OECD Gorodnichenko,Yury, Yegor Grigorenko and Dmytro Ostanin. 2006. Relative property rights in transition economies: Can the oligarchs be productive? EERC Working Paper Series 06-04e, EERC Research Network, Russia and CIS. Grubel, Herbert. 1982. Towards a theory of free economic zones. Review of World Economics (Weltwirtschaftliches Archiv), Springer, 118, 1: 39-61 Ham, John, Charles Swenson, Ayşe İmrohoroğlu, Heonjae Song. 2011. Government programs can improve local labor markets: Evidence from State Enterprise Zones, Federal Empowerment Zones and Federal Enterprise Community Original Research Article. Journal of Public Economics, 95, 7–8 (August): 779-797 Hamada, Koichi. 1974. An economic analysis of the duty-free zone. Journal of International Economics. 4, 3 (August): 225–241 Hannesson, Rognvaldur. 2008. The exclusive economic zone and economic development in the Pacific island countries. Marine Policy, 32: 886–897 Jayanthakumaran, Kankesu. 2003. Benefit–Cost Appraisals of Export Processing Zones: A Survey of the Literature. Development Policy Review, 21, 1 (January): 51–65 Jed, Kolko and David Neumark, 2010. Do some enterprise zones create jobs? Journal of Policy Analysis and Management, 29, 1: 5-38. Maddala, Gangadharrao. 1987. Limited-Dependent Variable Models Using Panel Data. The Journal of Human Resources, 22: 307-338
30
Maksymenko, Serhiy. 2001. Regional Policy in Ukraine: Challenges of Transition Role of the Regions in the Enlarging European Union. Pécs, Centre for Regional Studies. Discussion Papers. Special 132: 124-136. Meng, Guangwe. 2003.The Theory and Practice of Free Economic Zones: A Case Study of Tianjin, People’s Republic of China. Ruprecht-Karls University of Heidelberg Mundlak, Yair. 1978. On the Pooling of Time Series and Cross Section. Econometrica, Vol. 46, No. 1: 69-85 Nizalov, Denys and Scott Loveridge. 2005. Regional Policies and Economic Growth: One New Series. The Review of Regional Studies, 35, 3: 266-290 Nyzalova, Olena and Maria Vyshnya. 2012. “Influence of Economic Zones on Employment and Wage Growth in Ukraine: Reallocation Effect or Alternative Job Market”. Unpublished. Onaran, Özlem. 2007. Jobless Growth in the Central and Eastern European Countries: a Country Specific Panel Data Analysis for the Manufacturing Industry. Vienna University of Economics & B.A. Department of Economics Working Paper #103, March Sarma, Anand. 2007. Help the Rich, Hurt the Poor: Case of Special Economic Zones. Economic and Political Weekly, 42, 21 (May – June): 1900-1902 Schweinberger, Albert. 2003. Special Economic Zones in Developing and/or Transition Economies: a Policy Proposal. Review of International Economics, Wiley Blackwell, 11,4: 619-629 Tubben, Anneli. 1999. Special Economic Zones in Ukraine - A Means of Promoting Investment? Ukraine at the Crossroads: Economic Reforms in International Perspective: 131-137 Wang, Jin. 2010. The Economic Impact of Special Economic Zones: Evidence from Chinese Municipalities. London School of Economics, Job Market Paper Warr, Peter. 1989. Export Processing Zones: The Economics of Enclave Manufacturing. World Bank Research Observer, World Bank Group, 4, 1 (January): 65-88
31
Watson, Peter. 2001. Export Processing Zones: Has Africa Missed the Boat? Not Yet! Africa Region Working Paper Series No. 17. World Bank, Washington, DC. Wooldridge, Jeffrey. 2002. Econometric Analysis of Cross Section and Panel Data. MIT Press: Cambridge, MA. Wooldridge, Jeffrey. 2010. Correlated random effects models with unbalanced panels. Department of Economics, Michigan State University Xie, Yu and Charles Manski. 1988. The Logit Model, the Probit Model, and ResponseBased Samples, Working Paper, University of Wisconsin – Madison. Young, Leslie and Miyagiwa, Kaz.1987. Unemployment and the formation of duty-free zones, Journal of Development Economics, Elsevier, 26, 2 (August): 397-405
32
Figure 1. Map of Ukraine and special economic zones locations
FEZ
TPD
33
Table 1. Descriptive statistics
N=1588 Mean Std. Dev.
Min Max
Oligarchs 0.34 1.78 0.00 25.00
Parliamentary elections 1998
0.25 0.15 0.00 0.53
President elections 1999
0.35 0.17 0.12 0.78
Wages 136.31 61.94 40.07 901.00
Industrial output growth
0.44 0.57 0.01 13.80
Unemployment rate 0.05 0.03 0.00 0.20
Note: Wages are counted in real terms
Table 2. Descriptive statistics for treated and non-treated rayons separately
N=1588 Non-treated
rayons Treated rayons
Mean St. Dev. Mean St. Dev.
Oligarchs 0.29 1.71 0.95 2.31
Parliamentary elections 1998
0.24 0.15 0.32 0.14
President elections 1999
0.35 0.18 0.37 0.10
Wages 134.88 59.89 164.87 82.20
Industrial output growth
0.44 0.59 0.44 0.28
Unemployment rate 0.05 0.03 0.04 0.03
34
Table 3. Mean wages during 1996-1999 for treated and non-treated rayons
1996 1997 1998 1999 2000
Non-treated rayons
Mean 106.33 120.06 121.19 136.84 167.41
St. Dev. 38.12 41.66 44.47 54.37 75.29
Treated rayons
Mean 135.15 135.98 142.05 162.30 216.69
St. Dev. 43.04 54.00 56.38 65.41 108.26
Total Mean 109.89 122.40 124.06 140.34 174.12
St. Dev. 39.86 43.99 46.79 56.64 82.23
Table 4. Mean unemployment rate during 1996-1999 for treated and non-treated rayons
1996 1997 1998 1999 2000
Non-treated rayons
Mean 0.016 0.026 0.044 0.052 0.054
St. Dev. 0.012 0.019 0.027 0.030 0.030
Treated rayons
Mean 0.019 0.032 0.052 0.062 0.059
St. Dev. 0.016 0.021 0.030 0.038 0.038
Total Mean 0.017 0.027 0.045 0.053 0.055
St. Dev. 0.013 0.019 0.028 0.032 0.031
35
Table 5. Mean industrial output growth compared to 1990 during 1996-1999 for treated and non-treated rayons
1996 1997 1998 1999 2000
Non-treated rayons
Mean 0.465 0.393 0.406 0.435 0.534
St. Dev. 0.442 0.364 0.471 0.520 0.836
Treated rayons
Mean 0.356 0.385 0.393 0.434 0.498
St. Dev. 0.201 0.227 0.247 0.347 0.391
Total Mean 0.453 0.391 0.404 0.435 0.529
St. Dev. 0.424 0.347 0.447 0.500 0.790
36
Table 6. Estimation results for lobbying effect in probit regressions
1 2 3 4 5
SEZ SEZ SEZ SEZ SEZ
Oligarchs 0.051 -0.0062 0.41* 0.15** 0.15**
(-0.062) (-0.068) (-0.081) (-0.059) (-0.074)
Parliamentary elections 1998
2.91* 2.02** 12.9* 7.30* 7.48*
(-0.67) (-0.92) (-2.17) (-1.97) (-2.22)
President elections 1999
2.58* 1.14 9.01* 1.18 0.89
(-0.5) (-0.9) (-2.28) (-3.08) (-3.47)
Wages 0.0029* 0.0050* 0.019* 0.0063* 0.0068*
(-0.0009) (-0.0011) (-0.0028) (-0.0014) (-0.0021)
Industrial output growth
-0.089 -0.072 -0.63** -0.077 -0.051
(-0.085) (-0.18) (-0.31) (-0.2) (-0.21)
Unemployment rate
5.04** 2.15 54.8* 13.0* 10.4***
(-2.13) (-3.8) (-8.76) (-4.85) (-5.31)
Fixed effect present
N 1746 1723 1746 1583 1583
pseudo R-sq 0.09 0.093 0.387 0.446
Standard errors in parentheses ***p<0.10, **p<0.05, *p<0.01
37
Table 7. Estimations for marginal effects
dy/dx 1 2 3 4
SEZ SEZ SEZ SEZ
Oligarchs 0.0102 -0.0015 0.00368 0.00181
(-0.0124) (-0.0165) (-0.003) (-0.002
Parliamentary elections 1998
0.586* 0.494** 0.181 0.0887
(-0.133) (-0.216) (-0.147) (-0.101)
President elections 1999
0.519* 0.28 0.0292 0.0105
(-0.108) (-0.214) (-0.0958) (-0.0514)
Wages 0.000584* 0.00121* 0.00016 0
(-0.000183) (-0.0003) (-0.0001) 0
Industrial output growth
-0.0179 -0.0177 -0.0019 -0.0006
(-0.0172) (-0.0445) (-0.0049) (-0.0024)
Unemployment rate
1.015** 0.526 0.322 0.123
(-0.433) (-0.9) (-0.322) (-0.176)
N 1746 1723 1583 1583
Marginal effects; Standard errors in parentheses (d) for discrete change of dummy variable from 0 to 1, *** p<0.10, ** p<0.05, * p<0.01
38
Table 8. Estimation results for reverse causality model
OLS Poisson
Oligarchs Oligarchs
SEZ -0.33 -0.59
(-0.86) (-1.69)
Wages 0.0028* 0.0012*
(-0.0009) (-0.00045)
Industrial output growth
-0.019 -0.21
(-0.034) (-0.18)
Unemployment rate
-19.8*** -62.8*
(-10.1) (-20.1)
Wages -0.0011 -0.00052
(-0.0012) (-0.00088)
Industrial output growth
in SEZ 1.26 0.54**
(-1.29) (-0.23)
Unemployment rate in SEZ
-5.92 11.6
(-25.4) -38.2
N 2816 2816
R-sq 0.15 0.15
Standard errors in parentheses * p<0.05, ** p<0.01, *** p<0.001