Embed Size (px)
Citation preview
NATURAL STREAM - UNIFORM FLOW VER. 3-2007
CLIENT: COUNTY: DATE:
DSN BY: CHK BY: DATE: __________
COMMENTS:
~~ ~~~~~~~~~~ ~~~~~~~~ ~~~~~~~~ ~~~~~~~~~ ~~~~~~~~~ ~~~~~~~~~ ~~~~~~~~~~
(sq mi) -YR DESIGN FLOW = (cfs)
CROSS SECTION
DISTANCE ELEVATION "n" UPSTREAM W.S. DOWNSTREAM W.S.
********* ********* ********* STATION ELEV STATION ELEV
(ft) (ft) (ft) (ft)
CHANNEL SLOPE(%)
(used) (computed)
W.S. EL.
MANNINGS "n"
(used) (computed)
~~~~~~~~~~~~~~~~~~~~~~~~~~~~~~~~~~~~
Q, AVAIL VELOCITY
(cfs) (fps)
0 TOO LOW
Q,DESIRED
0 cfs
AREA p r END DISTS W.S. EL.
(sq ft) (ft) (ft)
~~~~~~~~~~~ ~~~~~~~~~~ ~~~~~~~~ ~~~~~~~~ ~~~~~~~~~ ~~~~~~~~~ ~~~~~~~~~ ~~~~~~~~~~
NOTES
*******
1. PROGRAM STARTS WITH AN ESTIMATED "n" OF 0.04. 2. ENTER UP TO 24 STATIONS PER CROSS SECTION.
PROGRAM COMPUTES THE COMPOSITE "n" FOR THE 3. USE ONLY ELEVATIONS.
SELECTED W.S. ELEV. MANUALLY ENTER THE 4. ENTER "n" FOR EACH STATION. ON INITIAL DATA
COMPUTED "n" AS THE USED "n" TO READ "Q". TO ENTRY, "n" AUTOMATICALLY REPEATS THE VALUE
ALTER "Q" ENTER A REVISED ELEV. AND RECHECK FROM THE PREVIOUS ENTRY. THEREFORE, YOU
"n" USED. NEED ONLY ENTER THE "n" WHERE IT CHANGES.
___________________
0.0
0.1
0.2
0.3
0.4
0.5
0.6
0.7
0.8
0.9
1.0
0 0.5 1 1.5 2 2.5
Ele
va
tio
n
Station
Plotted Cross section
Project/Site Name 0 Prepared by
Watershed Checked by
Tributary
Date 0
ftp://ftp-fc.sc.egov.usda.gov/WI/efh/efh-chapter3.pdf
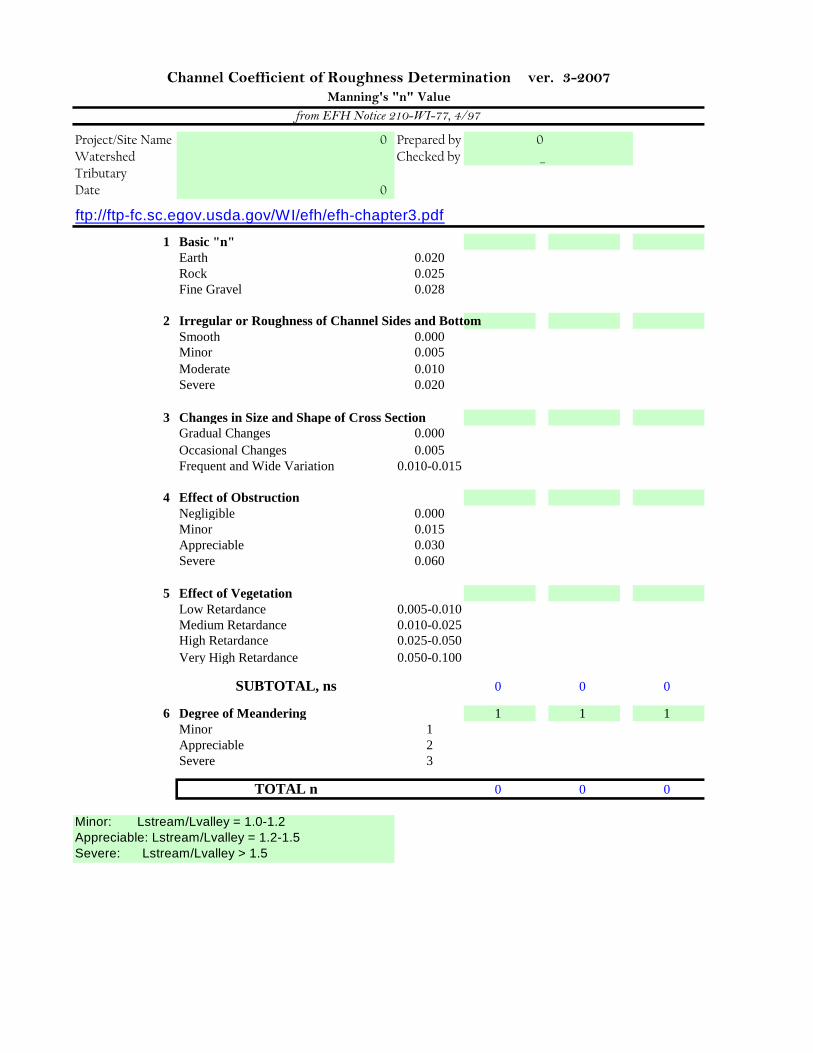
1 Basic "n"
Earth 0.020
Rock 0.025
Fine Gravel 0.028
2 Irregular or Roughness of Channel Sides and Bottom
Smooth 0.000
Minor 0.005
Moderate 0.010
Severe 0.020
3 Changes in Size and Shape of Cross Section
Gradual Changes 0.000
Occasional Changes 0.005
Frequent and Wide Variation 0.010-0.015
4 Effect of Obstruction
Negligible 0.000
Minor 0.015
Appreciable 0.030
Severe 0.060
5 Effect of Vegetation
Low Retardance 0.005-0.010
Medium Retardance 0.010-0.025
High Retardance 0.025-0.050
Very High Retardance 0.050-0.100
SUBTOTAL, ns 0 0 0
6 Degree of Meandering 1 1 1
Minor 1
Appreciable 2
Severe 3
TOTAL n 0 0 0
Channel Coefficient of Roughness Determination ver. 3-2007
Manning's "n" Value
from EFH Notice 210-WI-77, 4/97
Minor: Lstream/Lvalley = 1.0-1.2
Appreciable: Lstream/Lvalley = 1.2-1.5
Severe: Lstream/Lvalley > 1.5
0
_
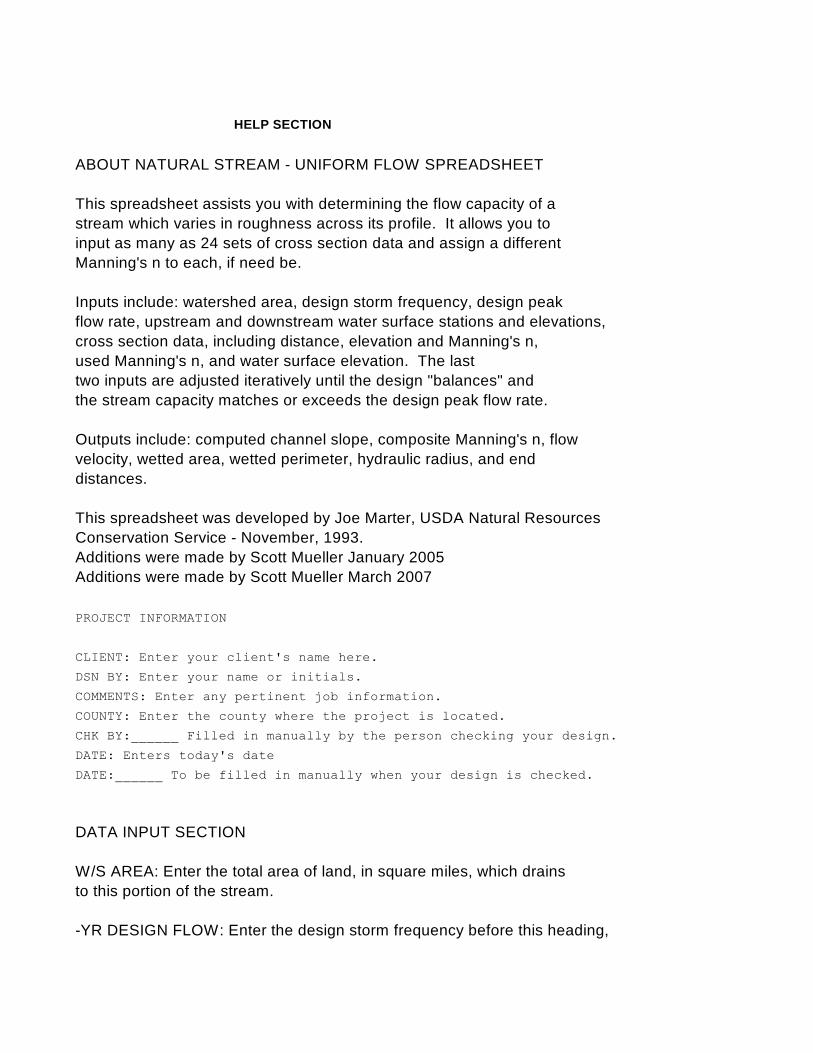
HELP SECTION
ABOUT NATURAL STREAM - UNIFORM FLOW SPREADSHEET
This spreadsheet assists you with determining the flow capacity of a
stream which varies in roughness across its profile. It allows you to
input as many as 24 sets of cross section data and assign a different
Manning's n to each, if need be.
Inputs include: watershed area, design storm frequency, design peak
flow rate, upstream and downstream water surface stations and elevations,
cross section data, including distance, elevation and Manning's n,
used Manning's n, and water surface elevation. The last
two inputs are adjusted iteratively until the design "balances" and
the stream capacity matches or exceeds the design peak flow rate.
Outputs include: computed channel slope, composite Manning's n, flow
velocity, wetted area, wetted perimeter, hydraulic radius, and end
distances.
This spreadsheet was developed by Joe Marter, USDA Natural Resources
Conservation Service - November, 1993.
Additions were made by Scott Mueller January 2005
Additions were made by Scott Mueller March 2007
PROJECT INFORMATION
CLIENT: Enter your client's name here.
DSN BY: Enter your name or initials.
COMMENTS: Enter any pertinent job information.
COUNTY: Enter the county where the project is located.
CHK BY:______ Filled in manually by the person checking your design.
DATE: Enters today's date
DATE:______ To be filled in manually when your design is checked.
DATA INPUT SECTION
W/S AREA: Enter the total area of land, in square miles, which drains
to this portion of the stream.
-YR DESIGN FLOW: Enter the design storm frequency before this heading,
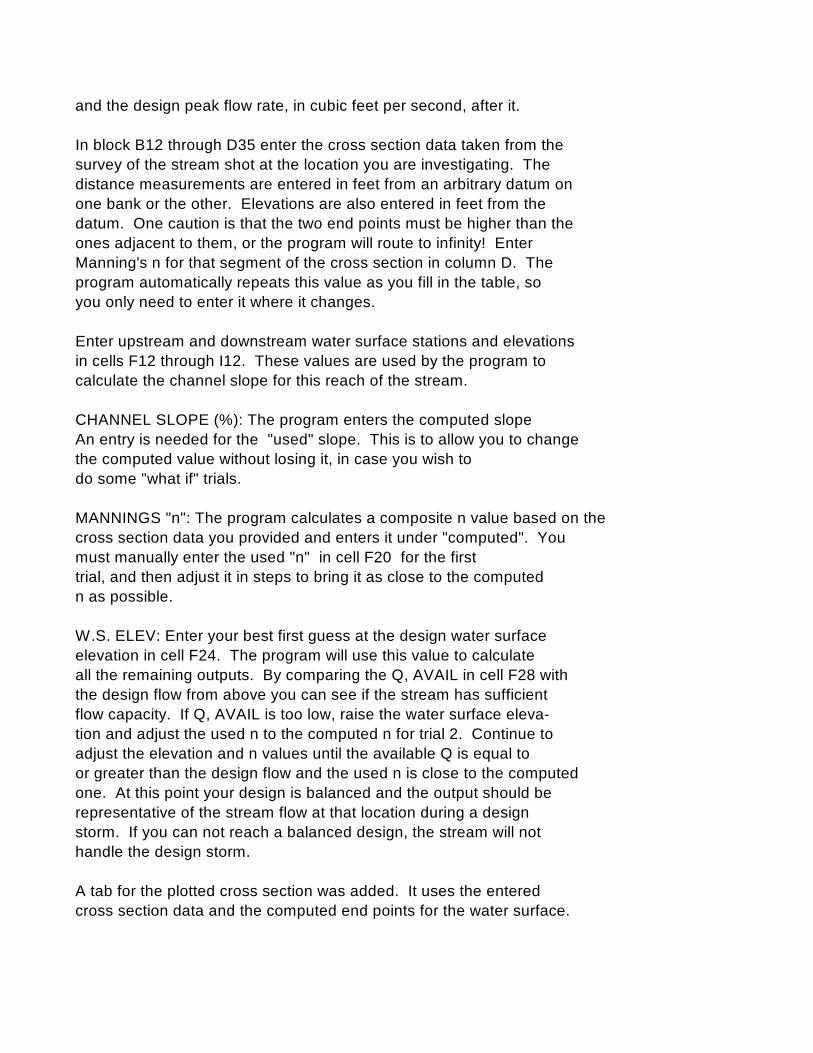
and the design peak flow rate, in cubic feet per second, after it.
In block B12 through D35 enter the cross section data taken from the
survey of the stream shot at the location you are investigating. The
distance measurements are entered in feet from an arbitrary datum on
one bank or the other. Elevations are also entered in feet from the
datum. One caution is that the two end points must be higher than the
ones adjacent to them, or the program will route to infinity! Enter
Manning's n for that segment of the cross section in column D. The
program automatically repeats this value as you fill in the table, so
you only need to enter it where it changes.
Enter upstream and downstream water surface stations and elevations
in cells F12 through I12. These values are used by the program to
calculate the channel slope for this reach of the stream.
CHANNEL SLOPE (%): The program enters the computed slope
An entry is needed for the "used" slope. This is to allow you to change
the computed value without losing it, in case you wish to
do some "what if" trials.
MANNINGS "n": The program calculates a composite n value based on the
cross section data you provided and enters it under "computed". You
must manually enter the used "n" in cell F20 for the first
trial, and then adjust it in steps to bring it as close to the computed
n as possible.
W.S. ELEV: Enter your best first guess at the design water surface
elevation in cell F24. The program will use this value to calculate
all the remaining outputs. By comparing the Q, AVAIL in cell F28 with
the design flow from above you can see if the stream has sufficient
flow capacity. If Q, AVAIL is too low, raise the water surface eleva-
tion and adjust the used n to the computed n for trial 2. Continue to
adjust the elevation and n values until the available Q is equal to
or greater than the design flow and the used n is close to the computed
one. At this point your design is balanced and the output should be
representative of the stream flow at that location during a design
storm. If you can not reach a balanced design, the stream will not
handle the design storm.
A tab for the plotted cross section was added. It uses the entered
cross section data and the computed end points for the water surface.
If you have any questions about this spreadsheet, call Steve Struss
of Wisconsin DATCP at 608/224-4629. Good luck with your designs!
Or the NRCS State Office 608/662-4422
========= ======== ======== ======== ======== ======== ======== ========
========= ======== ======== ======== ======== ======== ======== ========