Embed Size (px)
Citation preview
1410 OPTICS LETTERS / Vol. 35, No. 9 / May 1, 2010
Channel-allocation-adaptive WDM signalobservation based on sequential
ultrafast field sampling
Keiji Okamoto,1,* Fumihiko Ito,1 Makoto Tsubokawa,1 Yohei Sakamaki,2 and Toshikazu Hashimoto2
1NTT Access Network Service Systems Laboratories, NTT Corporation, 1-7-1 Hanabatake, Tsukuba,Ibaraki, Japan 305-0805
2NTT Photonics Laboratories, NTT Corporation, 3-1 Wakamiya, Morinosato, Atsugi, Kanagawa, Japan 243-0198*Corresponding author: [email protected]
Received October 29, 2009; revised March 15, 2010; accepted March 18, 2010;posted March 24, 2010 (Doc. ID 119132); published April 28, 2010
A novel technology for simultaneous WDM signal monitoring is presented based on ultrafast field sampling.Its flexibility regarding channel allocation and/or channel bandwidth is unique and attractive, as is itsultrafast nature. Two- and four-channel WDM signals, with the total bandwidth of 800 GHz, are success-fully discriminated and observed with the proposed scheme. © 2010 Optical Society of America
OCIS codes: 060.2330, 320.7100.
Most of the recently developed transmission systemsemploy dense-WDM where each channel containshigh-speed symbol streams whose rate is often closeto (or over) 100 Gbits/s. Analyzing such signalsraises several difficulties, one of which is due to thelimited bandwidth of electronics, and another comesfrom the requirement to provide elaborate optics toseparate the densely allocated channels. The wave-length allocation, as well as each channel’s band-width, is system dependent, while most optical filtersprovide only a single characteristic designed for aspecific channel allocation. Conventional opticalsampling technologies [1,2] can successfully over-come the bandwidth problem with the assistance ofthe ultrafast optical gate, but they fail to satisfy thewavelength channel discrimination requirement.
In this Letter, we present a novel technique thatcan simultaneously analyze several high-symbol-rateWDM channels. It is based on ultrafast field sam-pling [3,4] and the recently proposed WDM detectiontechnique shown in [5], which presented only a pre-liminary demonstration for two wavelengths. Here,we demonstrate that the proposed technique canadaptively respond to different wavelength allocationschemes and signal bandwidths by tuning the filter-ing parameters.
Consider the WDM signal shown in Fig. 1, whichhas M independent carriers and total bandwidth F.Let b�t� be the total complex electrical field of theWDM signal. If T�1/F, the time sequential samplesof the field in interval T, namely, bS�t�, bS�t+T�,bS�t+2 T�..., completely characterize the WDM sig-nal, according to the sampling theorem. Consider anN-tap finite impulse response (FIR) filter whose re-sponse is given by
a�t� = �n=0
N−1
hnbS�t − nT� = �n=0
N−1
hn exp�− jkn�bS�t − nT�,
�1�
where hn= hn exp�jkn� are the tap coefficients. The
Fourier transformation of Eq. (1) is given by0146-9592/10/091410-3/$15.00 ©
A��� = H���B��� = H�� − k�B���, �2�
where the uppercase letters stand for the Fouriertransform of the corresponding lowercase letters.This FIR filter provides a frequency (wavelength) se-lective function, where hn and k determine the trans-mission profile and the center frequency, respectively.Besides, the number of taps N determines the num-ber of wavelengths that can be demultiplexed withour approach.
To implement the above classical theory, it is nec-essary to acquire the samples of b�t� whose band-width exceeds the capacity of ordinary electrical cir-cuits. For this purpose, we use linear opticalsampling [3,4]. The system setup is shown in Fig. 1.Both the signal and the sampling pulse are dividedinto N tributaries to which mutual delays, T to�N−1�T, are added. Consequently, each tributaryprovides sampled values of the total WDM field. Thesampled data are A/D converted and sent to the off-line processor, which acts as an adaptive FIR filter.As for the dynamic range of the system, the accept-
Fig. 1. (Color online) Schematic view of the system
configuration.2010 Optical Society of America
May 1, 2010 / Vol. 35, No. 9 / OPTICS LETTERS 1411
able power range is determined only by the photo-detector’s acceptability, while the minimum detectionsensitivity is related to the shot-noise level, includingN division loss.
Linear optical sampling is detailed in several pa-pers [3,4]. The optical gate function is provided bythe linear correlation of the signal and samplingpulse. The sampled value bS�nT� is given by
bS�nT� =� b�t�s*�t − nT�dt, �3�
where s�t� is the electrical field of the sampling pulse.Substituting Eq. (4) into Eq. (1) and taking the Fou-rier transform, we obtain
A��� = H�� − k�S*���B���, �4�
which shows that the total field b�t� is also filtered bythe sampling pulse, as well as the designed FIR filter.When the sampling pulse has a flat spectrum withinthe signal bandwidth, that is, the pulse width is suf-ficiently short and Fourier transform limited, S���can be recognized as constant.
The implemented delays T to �N−1�T must bestable, much less than the inverse of the optical fre-quency, since any variation in optical phase is di-rectly transferred to the argument of hn. For this rea-son, we integrated the dividers, delays, and optical90° hybrids on a single silica-waveguide program-mable logic controller (PLC) chip. The number oftributaries was eight. The delays had no tunablefunction such as thermo-optics, and T was fixed at1.25 ps (free spectral range 800 GHz); then the off-sets from the actual delays were compensated by thesoftware as mentioned below. The divider ratios andthe quadrature angles were also digitally correctedby means of the algorithm described in [4]. Althoughthe fabricated device supports only single polariza-tion, it can be expanded to accept arbitrary polariza-tion inputs by introducing the polarization diversityconfiguration [6].
The optical phase of delay nT has an initial varia-tion with respect to the ideal target. Prior to the ex-periment described below, these phase variationswere evaluated by measuring an unmodulated con-tinuous beam with the setup of Fig. 1, and the result-ing values were incorporated into the tap coefficientsof the FIR filter. Once the coefficients are compen-sated, no readjustment would be needed regardless ofthe WDM signal measured. Besides, these variationswere stable throughout the experiment over severaldays with the assistance of the PLC scheme.
The linear optical sampling setup was almost thesame as that described in [3,4], with the exception ofthe addition of the above described PLC circuit. Tosample the field of the total WDM signal, the spec-trum of the sampling pulse must encompass the en-tire WDM spectrum. The commercial passively mode-locked fiber laser used outputs of about 0.5 ps pulseswith a spectral width of about 13 nm. The corre-sponding time–frequency product is 0.81, so the sam-pling pulse has a slightly chirped waveform. We have
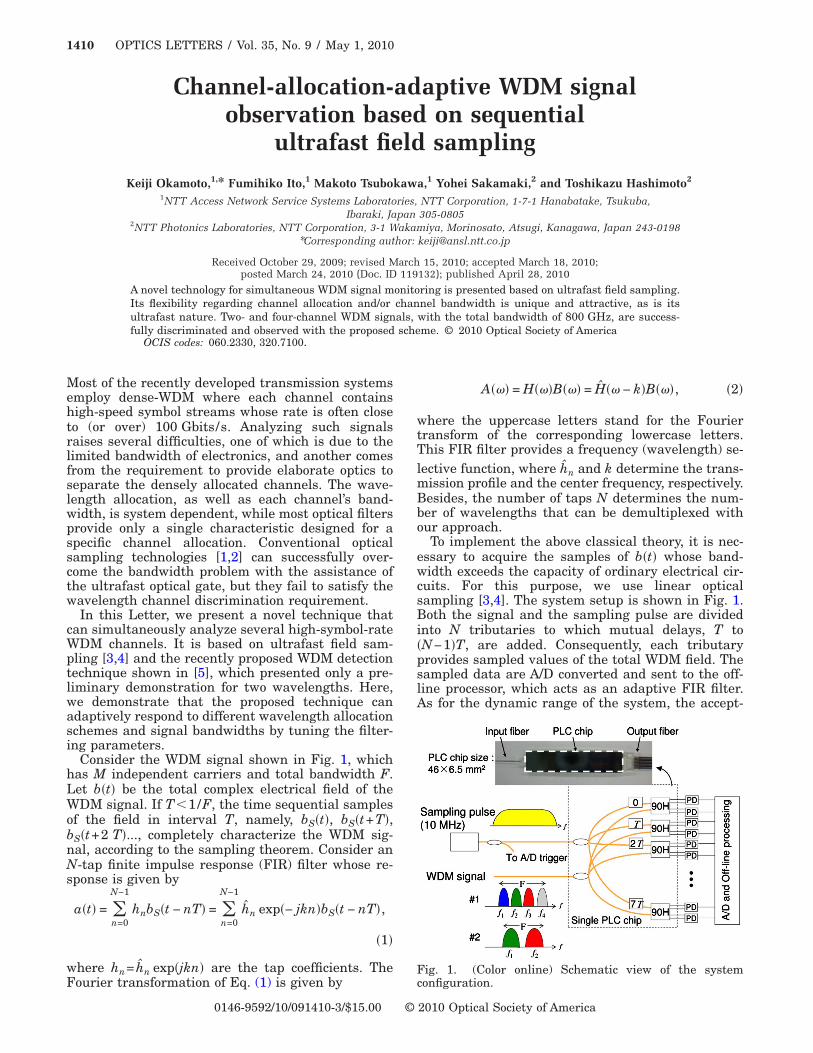
yet to analyze the chirp in detail.The WDM signal was generated by using a super-continuum (SC) light source [7] as shown in Fig. 2.The spectrum of pulses from an actively mode-lockedfiber laser (AMFL) was broadened by an SC fiber.The broadened spectrum was sliced into subcompo-nents and immediately combined again. Two differ-ent spectrum slicers were used, corresponding to twokinds of WDM signal. One was an AWG filter thatprovided a four-channel, 50 GHz bandwidth signalwith 200 GHz interval (signal 1). The other spectrumslicer was composed of two dielectric filters with1 nm �125 GHz� bandwidth. This yielded a two-channel, 125 GHz bandwidth signal with 400 GHzinterval (signal 2). These signals were intensitymodulated with a 223−1 pseudo-random binary se-quence and optically multiplexed to yield 20 and80 Gbit/s streams, respectively. Signals 1 (four chan-nels �20 Gbit/s) and 2 (two channels �80 Gbit/s)were given a relative delay of roughly a half-bit and aone-bit delay, respectively, for each channel by using1 km (27 ps per channel interval) and 200 m (11 psper channel interval) single-mode fibers, respectively,to avoid complete bit synchronization among chan-nels. This dispersion effect more strongly affected therelative delay among the WDM channels than thepulse broadening. These signals were introduced intothe system shown in Fig. 1, together with the sam-pling pulses. The total WDM signal powers were +1and −5 dBm for signal 1 and signal 2, respectively.The average power of the sampling pulses rangedfrom +6 to +8 dBm.
FIR filters with raised-cosine profiles weredesigned. hn values were determined by the impulseresponse of the raised-cosine filter, which is given by
h�t� =sin �f1t + sin ��f1 + 2f2�t
2�f2t
1
1 − �2f2t�2 , �5�
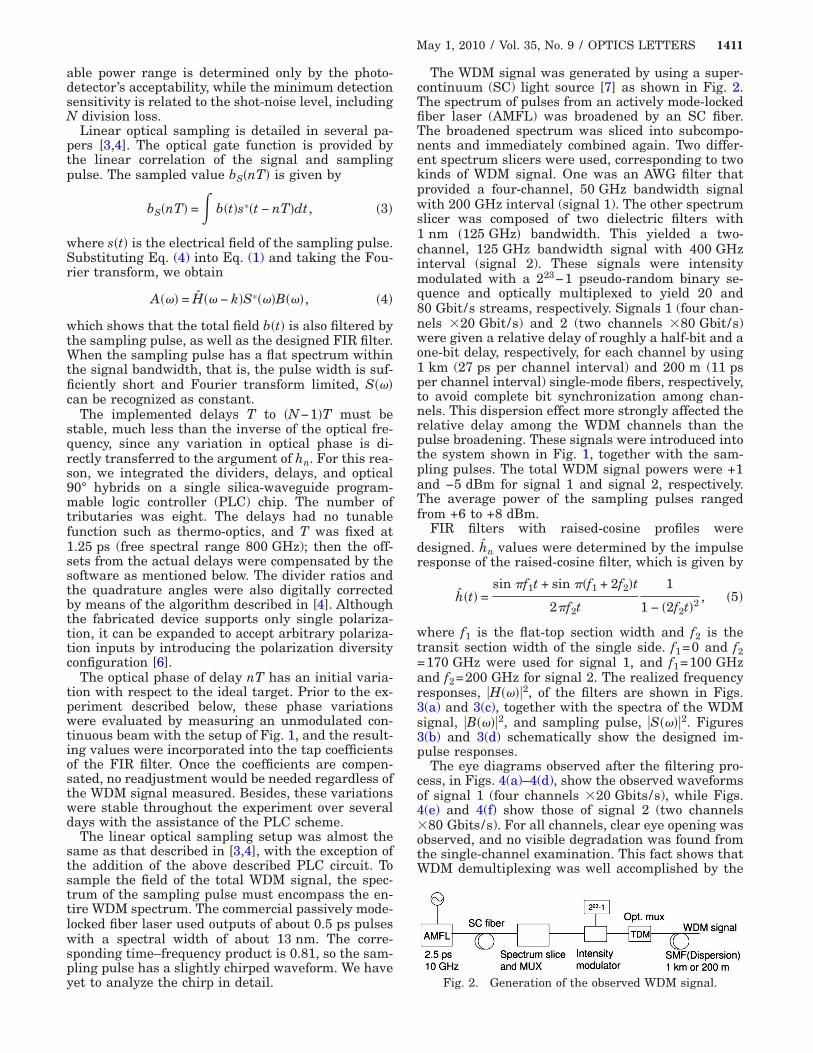
where f1 is the flat-top section width and f2 is thetransit section width of the single side. f1=0 and f2=170 GHz were used for signal 1, and f1=100 GHzand f2=200 GHz for signal 2. The realized frequencyresponses, �H����2, of the filters are shown in Figs.3(a) and 3(c), together with the spectra of the WDMsignal, �B����2, and sampling pulse, �S����2. Figures3(b) and 3(d) schematically show the designed im-pulse responses.
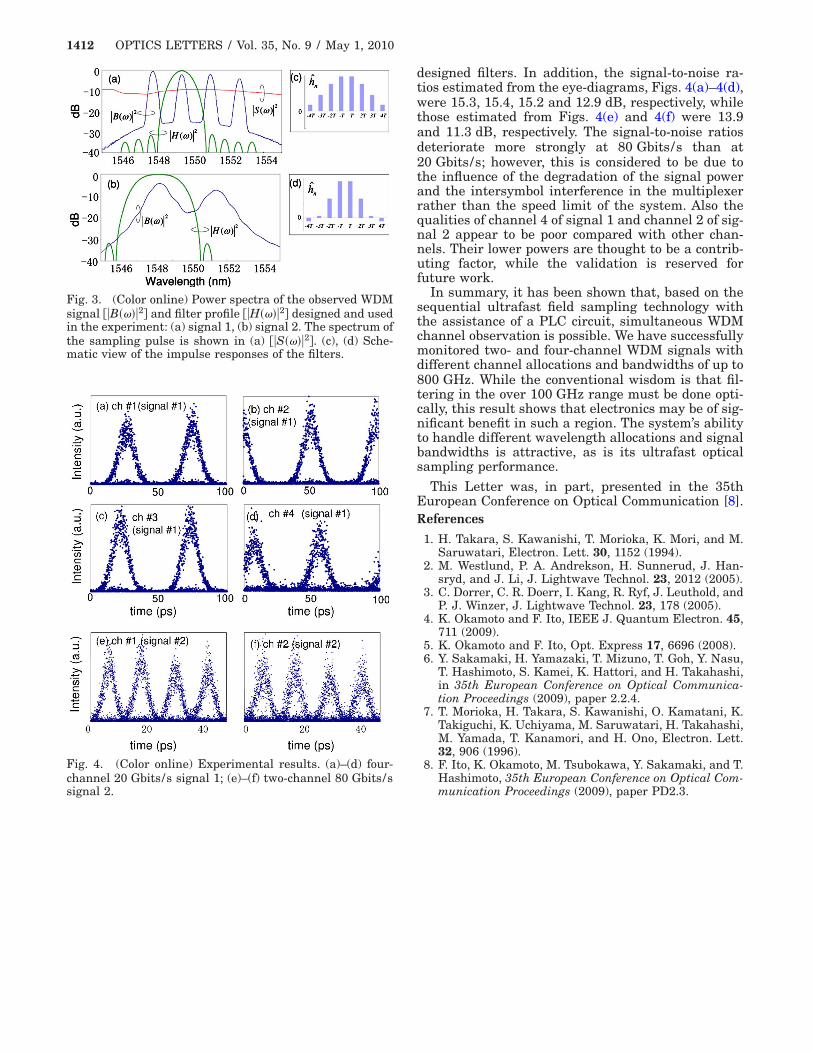
The eye diagrams observed after the filtering pro-cess, in Figs. 4(a)–4(d), show the observed waveformsof signal 1 (four channels �20 Gbits/s), while Figs.4(e) and 4(f) show those of signal 2 (two channels�80 Gbits/s). For all channels, clear eye opening wasobserved, and no visible degradation was found fromthe single-channel examination. This fact shows thatWDM demultiplexing was well accomplished by the
Fig. 2. Generation of the observed WDM signal.
matic view of the impulse responses of the filters.
signal 2.
1412 OPTICS LETTERS / Vol. 35, No. 9 / May 1, 2010
designed filters. In addition, the signal-to-noise ra-tios estimated from the eye-diagrams, Figs. 4(a)–4(d),were 15.3, 15.4, 15.2 and 12.9 dB, respectively, whilethose estimated from Figs. 4(e) and 4(f) were 13.9and 11.3 dB, respectively. The signal-to-noise ratiosdeteriorate more strongly at 80 Gbits/s than at20 Gbits/s; however, this is considered to be due tothe influence of the degradation of the signal powerand the intersymbol interference in the multiplexerrather than the speed limit of the system. Also thequalities of channel 4 of signal 1 and channel 2 of sig-nal 2 appear to be poor compared with other chan-nels. Their lower powers are thought to be a contrib-uting factor, while the validation is reserved forfuture work.
In summary, it has been shown that, based on thesequential ultrafast field sampling technology withthe assistance of a PLC circuit, simultaneous WDMchannel observation is possible. We have successfullymonitored two- and four-channel WDM signals withdifferent channel allocations and bandwidths of up to800 GHz. While the conventional wisdom is that fil-tering in the over 100 GHz range must be done opti-cally, this result shows that electronics may be of sig-nificant benefit in such a region. The system’s abilityto handle different wavelength allocations and signalbandwidths is attractive, as is its ultrafast opticalsampling performance.
This Letter was, in part, presented in the 35thEuropean Conference on Optical Communication [8].References
1. H. Takara, S. Kawanishi, T. Morioka, K. Mori, and M.Saruwatari, Electron. Lett. 30, 1152 (1994).
2. M. Westlund, P. A. Andrekson, H. Sunnerud, J. Han-sryd, and J. Li, J. Lightwave Technol. 23, 2012 (2005).
3. C. Dorrer, C. R. Doerr, I. Kang, R. Ryf, J. Leuthold, andP. J. Winzer, J. Lightwave Technol. 23, 178 (2005).
4. K. Okamoto and F. Ito, IEEE J. Quantum Electron. 45,711 (2009).
5. K. Okamoto and F. Ito, Opt. Express 17, 6696 (2008).6. Y. Sakamaki, H. Yamazaki, T. Mizuno, T. Goh, Y. Nasu,
T. Hashimoto, S. Kamei, K. Hattori, and H. Takahashi,in 35th European Conference on Optical Communica-tion Proceedings (2009), paper 2.2.4.
7. T. Morioka, H. Takara, S. Kawanishi, O. Kamatani, K.Takiguchi, K. Uchiyama, M. Saruwatari, H. Takahashi,M. Yamada, T. Kanamori, and H. Ono, Electron. Lett.32, 906 (1996).
8. F. Ito, K. Okamoto, M. Tsubokawa, Y. Sakamaki, and T.Hashimoto, 35th European Conference on Optical Com-
Fig. 3. (Color online) Power spectra of the observed WDMsignal ��B����2� and filter profile ��H����2� designed and usedin the experiment: (a) signal 1, (b) signal 2. The spectrum ofthe sampling pulse is shown in (a) ��S����2�. (c), (d) Sche-
Fig. 4. (Color online) Experimental results. (a)–(d) four-channel 20 Gbits/s signal 1; (e)–(f) two-channel 80 Gbits/s
munication Proceedings (2009), paper PD2.3.