Embed Size (px)
Citation preview
CILAMCE 2017
Proceedings of the XXXVIII Iberian Latin-American Congress on Computational Methods in Engineering P.O. Faria, R.H. Lopez, L.F.F. Miguel, W.J.S. Gomes, M. Noronha (Editores), ABMEC, Florianópolis, SC, Brazil, November 5-8, 2017.
CHANGING WIND SPEED SCENARIOS AND CONSEQUENCES TO STRUCTURAL DESIGN
Danilo Lima Matias Sarah da Silva Andrade
Débora Maia Silva Thiago Dias dos Santos
Luiz Carlos Marcos Vieira Junior [email protected]
[email protected] [email protected]
[email protected] [email protected]
University of Campinas - UNICAMP 224 Rua Saturnino de Brito, Cidade Universitária Zeferino Vaz, Zip-Code: 13083-889, Campinas, SP, Brazil André Teófilo Beck
[email protected] University of São Paulo - USP
Structural Engineering Department, EESC, Av. Trabalhador São-Carlense, 400. 13566-590 São Carlos, SP, Brazil
Abstract. The ABNT NBR 6123:1988 standard provides design guidelines to determine wind loading on structures. The design wind chart in this standard was developed based on wind speed records documented between 1950 and 1974; hence, it has been outdated for over 40 years. Moreover, there is ample evidence that climate, and wind regimes in particular, has changed in recent years. In this context, this paper presents: (i) an updated design chart for basic wind speeds in Brazil; (ii) a simplified maximum annual wind speeds trend analysis for

Changing Wind Speed Scenarios and Consequences to Structural Design
CILAMCE 2017
Proceedings of the XXXVIII Iberian Latin-American Congress on Computational Methods in Engineering P.O. Faria, R.H. Lopez, L.F.F. Miguel, W.J.S. Gomes, M. Noronha (Editores), ABMEC, Florianópolis, SC, Brazil, November 5-8, 2017.
short (5 years), intermediate (20 years), and long term (100 years); and, finally, (iii) a probabilistic study of the effects of recent changes in wind speed scenarios on the failure probabilities of typical steel moment resisting frames supposedly constructed in different regions of Brazil. The updated design chart for basic wind speeds proposed herein is the result of a large data compilation, which comprises early records presented by Padaratz (1977) and data from multiple airport stations in Brazil and neighbor countries, available through the Wolfram Research Database (2017). The probabilistic model used to construct the design wind speed chart is based in Beck and Corrêa (2013). The simplified maximum annual wind speeds trend analysis is carried out through linear regression of the historical wind speeds records available. The structural reliability analysis of steel moment resisting frames is based on Monte Carlo simulation, and considers imperfections and geometrical and material nonlinearities (GMNIA). Results show that use of an outdated design chart for basic wind speeds can lead to significant economic losses due to structural collapse, especially at center-west and northeast regions, where significant wind speed differences were observed. The wind speed trend analysis shows that annual exceedance probabilities of basic design winds from ABNT NBR 6123:1988 standard, which by definition should be of 2%, can be of up to 14%. These results indicate that greater attention shall be given to the consequences of fast changing wind speed scenarios, and more research shall be carried out on this topic. Keywords: wind speed chart, design wind speed, trend analysis, GMNIA, reliability analysis, wind records, maximal annual wind speed.

D.L. Matias, S.S. Andrade, D.M. Silva, T.D. Santos, L.C.M. Vieira Jr., A.T. Beck
CILAMCE 2017
Proceedings of the XXXVIII Iberian Latin-American Congress on Computational Methods in Engineering P.O. Faria, R.H. Lopez, L.F.F. Miguel, W.J.S. Gomes, M. Noronha (Editores), ABMEC, Florianópolis, SC, Brazil, November 5-8, 2017.
INTRODUCTION
Structural design involves, among various aspects, evaluation of the uncertainties inherent to the loadings acting on a structure during its lifespan. Some loads, such as the self-weight, act permanently on the structure; other loads are occasional or rare events, such as a wind storm or hurricane, which have small probabilities of occurrence. Regardless of the nature of loading, codified structural design involves predefined rules on how to take into account each loading and their combinations; these rules indirectly account for the risk of collapse under pre-determined combinations of events.
Design values of time-variant loads on structures are determined based on a pre-defined mean return period of the load process, which is associated to given probability of occurrence. For instance, the design wind load associated to loss of equilibrium (ultimate limit state) is typically determined from a 50-year mean return period, which corresponds to a probability of 63% of being exceeded during a design life of 50 years. The same design load corresponds to a probability of only 2% of being exceeded in any single year. The design load for service failure modes (e.g., lateral deflection) is defined based on shorter mean return periods; typically, one year.
Wind loading also depends on the actual location where the structure will be constructed. Based on a wind speed chart, the structural engineer determines the basic wind speed (v0) at the location where the structure will be placed. The basic wind speed corresponds to a mean return period of 50 years for the geographical location, and is determined for a flat location, ten meters above ground. This wind speed is adjusted for different heights and considering any irregularities of the actual structure location. Wind speeds are analytically converted into pressure acting on the structure, considering actual height and aerodynamic coefficients. The basic wind speed chart currently used in Brazil is given in design standard ABNT NBR 6123:1988; it is the result of a study carried out by Padaratz (1977), based on data compiled between the years of 1950 and 1974.
There is wide consensus in the scientific community that the weather, hence also wind regimes, have been rapidly changing in recent years (Intergovernmental Panel on Climate Change, IPCC (2013) and Brazilian Panel on Climate Change, PBMC (2013)). Santos et al. (2016) highlighted that at the structural system level, probabilities of collapse can be as high as 0.21% when the wind chart proposed by Padaratz (1977) is used, in comparison to updated wind charts; this probability of collapse is way above acceptable for ultimate limit states.
Beck and Corrêa (2013) also reinforced the necessity of updating the wind speed chart available for the Brazilian territory. The authors also defined a methodology to construct the design wind speed chart based on probabilistic models, database and tools available in the software Wolfram Mathematica (2017). The study of Beck and Corrêa (2013) reports basic wind speeds higher than those proposed by Padaratz (1977) in several regions of the country, especially at the center, north, and northeast regions. Recently, Vallis et al. (2017) reported that a larger updated wind speed database was being reviewed and compiled; this database, however, is still not available for other researchers.
Thus, this paper aims to present: (i) an updated design chart for basic wind speeds in Brazil, using the methodology proposed in Beck and Corrêa (2013); (ii) a simplified maximum annual wind speeds trend analysis for short (5 years), intermediate (20 years), and
Changing Wind Speed Scenarios and Consequences to Structural Design
CILAMCE 2017
Proceedings of the XXXVIII Iberian Latin-American Congress on Computational Methods in Engineering P.O. Faria, R.H. Lopez, L.F.F. Miguel, W.J.S. Gomes, M. Noronha (Editores), ABMEC, Florianópolis, SC, Brazil, November 5-8, 2017.
long term (100 years), to provide basic understanding of possible changing wind speed scenarios; and, finally, (iii) a probabilistic study of the effects of recent changes in wind speed scenarios in failure probabilities for typical steel moment resisting frames, supposedly located in all five regions of Brazil. The probabilistic study considers geometrical and material nonlinear analysis with imperfections (GMNIA).
1. UPDATED BASIC WIND SPEED CHART
1.1 Methodology
The methodology proposed by Beck and Corrêa (2013) is used herein to generate an updated basic wind speed chart; in this section, we summarize this methodology and comment some specifics. Note that Beck and Corrêa (2013) developed their methodology based on what was presented in Padaratz (1977). The authors proposed a new wind chart by combining data reported in Padaratz (1977), relative to the years 1950 to 1975, with data available in Wolfram Mathematica (2017), from 1975 up until 2012.
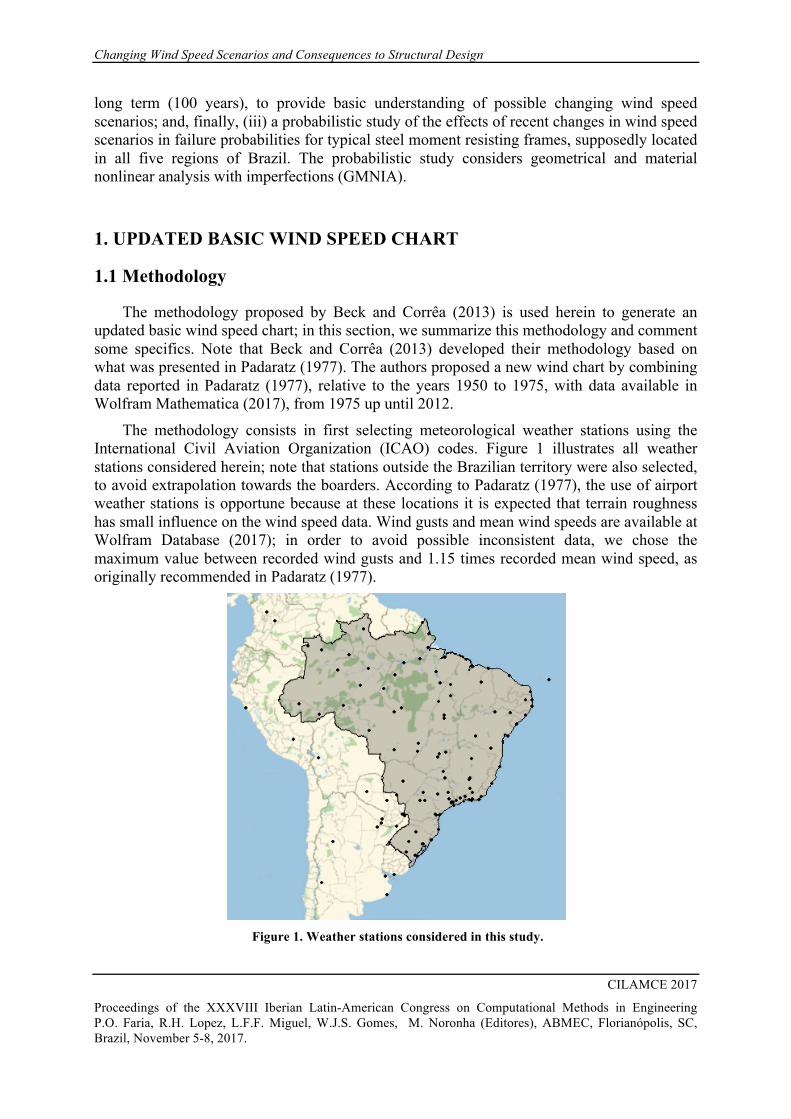
The methodology consists in first selecting meteorological weather stations using the International Civil Aviation Organization (ICAO) codes. Figure 1 illustrates all weather stations considered herein; note that stations outside the Brazilian territory were also selected, to avoid extrapolation towards the boarders. According to Padaratz (1977), the use of airport weather stations is opportune because at these locations it is expected that terrain roughness has small influence on the wind speed data. Wind gusts and mean wind speeds are available at Wolfram Database (2017); in order to avoid possible inconsistent data, we chose the maximum value between recorded wind gusts and 1.15 times recorded mean wind speed, as originally recommended in Padaratz (1977).
Figure 1. Weather stations considered in this study.

D.L. Matias, S.S. Andrade, D.M. Silva, T.D. Santos, L.C.M. Vieira Jr., A.T. Beck
CILAMCE 2017
Proceedings of the XXXVIII Iberian Latin-American Congress on Computational Methods in Engineering P.O. Faria, R.H. Lopez, L.F.F. Miguel, W.J.S. Gomes, M. Noronha (Editores), ABMEC, Florianópolis, SC, Brazil, November 5-8, 2017.
The data available from each weather station were fitted to Gumbel distributions (Generalized Extreme Value distribution Type-I), as recommended in Beck and Corrêa (2013); for each station the parameters µ (location parameter) e α (scale parameter) were determined. To check for inconsistent data, a Kolmogorov-Smirnov test was performed; once a 5% significance level was reached, the data was carefully examined and checked for inconsistences. The collected data corresponds to the annual maximum wind speed distribution, from which the wind speed with a mean return period of 50 years, also known as basic wind speed, is determined. Beck and Corrêa (2013) show that the characteristic maximum for the 50-year extreme value distribution corresponds to the tail probability of 2% of the annual maximum wind speed distribution. Finally, the basic wind speed calculated for each weather station was used to determine a fourth order polynomial surface that includes cross-terms and yields a best fit to the compiled data, as shown in Figure 2.
1.2 Results and discussions
The updated wind speed chart proposed herein, Figure 2, is quite similar to the wind speed chart proposed in Beck and Côrrea (2013), with some considerable differences in the northwest region. Although we considered weather station in neighboring countries, the polynomial surface does provide a very good fit in the northwest region. The lack of weather stations in the northwest region may lead to the differences encountered. On the other hand, ongoing research is studying the possibility to use Kriging or Gaussian process regression instead of polynomial regression. For the other regions of the country, when comparing the new proposed basic wind speed chart to the chart proposed in ABNT NBR 6123:1988, one can easily realize an increase in wind speeds in the Northeast, North and Center-West regions of the country. As discussed in Santos et al. (2016), the use of lower basic speeds in structural design can lead to non-acceptable probabilities of structural collapse.
The design wind speeds proposed in ABNT NBR 6123:1988 should, by definition, correspond to an annual probability of exceedance of 2%. When these design wind speeds are compared with statistics compiled in this paper, it is found out that they actually correspond to probabilities of up to 14% to 16% of being exceeded, as illustrated in Figure 3. Putting these results in a different perspective, the wind speeds with an annual probability of exceedance of 14% actually correspond to a mean return period of 7 years, instead of the customary 50 years!

Changing Wind Speed Scenarios and Consequences to Structural Design
CILAMCE 2017
Proceedings of the XXXVIII Iberian Latin-American Congress on Computational Methods in Engineering P.O. Faria, R.H. Lopez, L.F.F. Miguel, W.J.S. Gomes, M. Noronha (Editores), ABMEC, Florianópolis, SC, Brazil, November 5-8, 2017.
Figure 2. Updated basic wind speed chart for the Brazilian territory, dataset from 1950 to 2016.
Figure 3. Probabilities of wind speeds proposed in ABNT NBR 6123:1988 being exceed in a single year.

D.L. Matias, S.S. Andrade, D.M. Silva, T.D. Santos, L.C.M. Vieira Jr., A.T. Beck
CILAMCE 2017
Proceedings of the XXXVIII Iberian Latin-American Congress on Computational Methods in Engineering P.O. Faria, R.H. Lopez, L.F.F. Miguel, W.J.S. Gomes, M. Noronha (Editores), ABMEC, Florianópolis, SC, Brazil, November 5-8, 2017.
2. WIND TREND ANALYSIS
2.1 Methodology
For each weather station of the dataset, linear regression was performed on the annual maximum wind speed records. The linear regression represents the trend of the mean of the annual maximum wind speed records over the years. Figure 4 illustrates the results obtained for the SBMO station (Maceió): the trend observed in this Figure is typical, and was observed for 69 of the 98 studied weather stations. The 29 weather stations that do not show trend similar to the trend depicted in Figure 4 are weather stations in which data have been recently made available and, in fact, more than half of these weather stations depict a small negative slope, close to a horizontal line. Thus, weather stations with positive slope have greater impact on the trend analysis discussed herein.
The linear regression performed is very simple, but it makes the case for the importance of investigating changing wind speed scenarios. The trend analyses shown in the IPCC (2013) follow exponential growth curves, instead of linear, which actually lead to larger wind speeds in the extrapolations.
Figure 4. Example of linear fit showing mean trend of maximum annual wind speeds
for SBMO station (Maceió).
2.2 Results and discussions The linear trend of annual maximum wind speeds is extrapolated for periods of 10, 50 and 100 years, from 2016, leading to the mean wind change charts illustrated in Figure 5. In this figure it can be observed that wind speeds tend to increase in most regions of Brazil; very few weather stations show a negative slope in the linear regression. The authors acknowledge that better forecasting techniques are available, other than a simple linear regression; however, the trend analysis presented herein clearly shows that further studies shall be carried

Changing Wind Speed Scenarios and Consequences to Structural Design
CILAMCE 2017
Proceedings of the XXXVIII Iberian Latin-American Congress on Computational Methods in Engineering P.O. Faria, R.H. Lopez, L.F.F. Miguel, W.J.S. Gomes, M. Noronha (Editores), ABMEC, Florianópolis, SC, Brazil, November 5-8, 2017.
out in order to safely design structures that are supposed to withstand changing wind loads during their lifetimes. a) 10 years;
b) 50 years;
c) 100 years;
Figure 5. Simplified trend analysis charts of maximum annual winds speeds for extrapolation of 10 (a); 50 (b) and 100 (c) years, from 2016.
3. STRUCTURAL RELIABILITY ANALYSIS
In order to understand the impact of using the outdated wind charts of ABNT NBR 6123:1988 to design structures, which are supposed to face the winds of the current database, reliability analyses of typical industrial steel frames were carried out. The same specifications are used to design frames supposedly located in different geographical locations; hence, the actual designs consider different basic wind speeds. The steel frame is 7.32 meters tall, with a
D.L. Matias, S.S. Andrade, D.M. Silva, T.D. Santos, L.C.M. Vieira Jr., A.T. Beck
CILAMCE 2017
Proceedings of the XXXVIII Iberian Latin-American Congress on Computational Methods in Engineering P.O. Faria, R.H. Lopez, L.F.F. Miguel, W.J.S. Gomes, M. Noronha (Editores), ABMEC, Florianópolis, SC, Brazil, November 5-8, 2017.
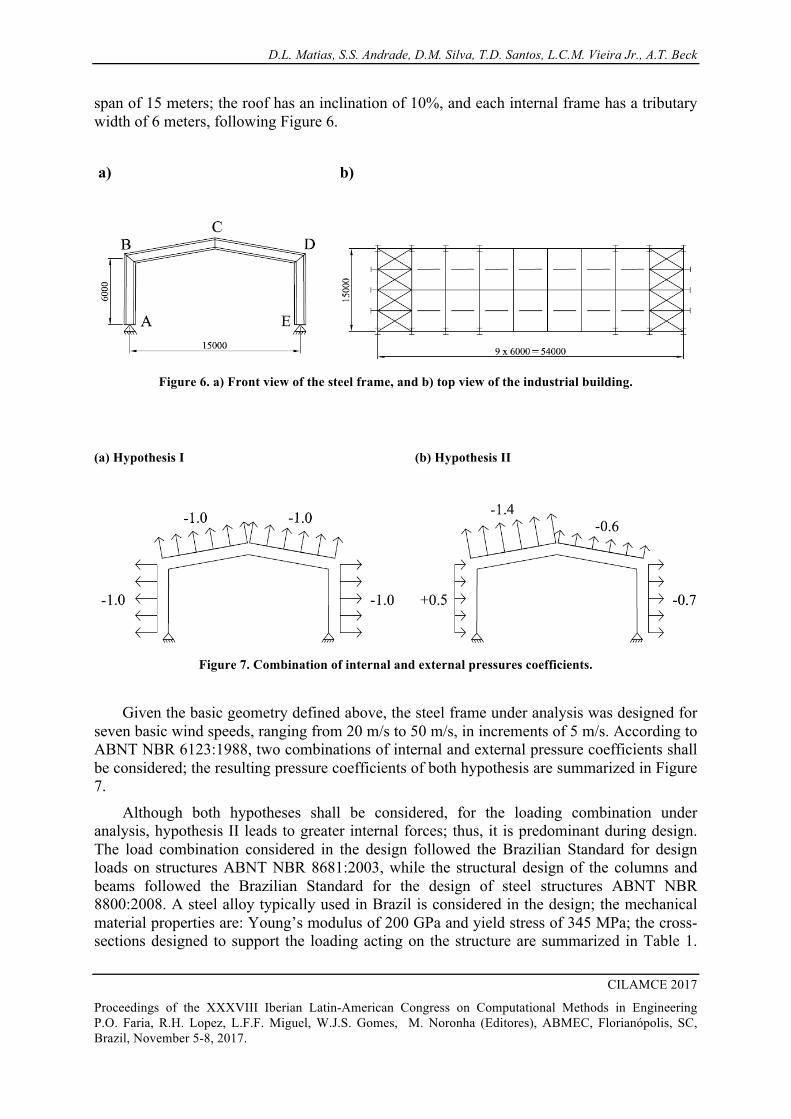
span of 15 meters; the roof has an inclination of 10%, and each internal frame has a tributary width of 6 meters, following Figure 6.
Figure 6. a) Front view of the steel frame, and b) top view of the industrial building.
Figure 7. Combination of internal and external pressures coefficients.
Given the basic geometry defined above, the steel frame under analysis was designed for seven basic wind speeds, ranging from 20 m/s to 50 m/s, in increments of 5 m/s. According to ABNT NBR 6123:1988, two combinations of internal and external pressure coefficients shall be considered; the resulting pressure coefficients of both hypothesis are summarized in Figure 7.
Although both hypotheses shall be considered, for the loading combination under analysis, hypothesis II leads to greater internal forces; thus, it is predominant during design. The load combination considered in the design followed the Brazilian Standard for design loads on structures ABNT NBR 8681:2003, while the structural design of the columns and beams followed the Brazilian Standard for the design of steel structures ABNT NBR 8800:2008. A steel alloy typically used in Brazil is considered in the design; the mechanical material properties are: Young’s modulus of 200 GPa and yield stress of 345 MPa; the cross-sections designed to support the loading acting on the structure are summarized in Table 1.
a) b)
(a) Hypothesis I (b) Hypothesis II

Changing Wind Speed Scenarios and Consequences to Structural Design
CILAMCE 2017
Proceedings of the XXXVIII Iberian Latin-American Congress on Computational Methods in Engineering P.O. Faria, R.H. Lopez, L.F.F. Miguel, W.J.S. Gomes, M. Noronha (Editores), ABMEC, Florianópolis, SC, Brazil, November 5-8, 2017.
Design of the structural system considered herein is controlled by the service limit state, related to vertical displacements. Lateral loading (service limit state) only controls the designs for basic wind speeds of 45 m/s and 50 m/s; this explains why only for these cases the column and/or beams cross-sections change (Table 1).
Table 1. Cross-sections designed to support dead and wind load.
Basic wind speed (v0, m/s)
Columns
(elements A-B and D-E)
Beams
(elements B-C and C-D)
20 W310x38.7 W310x32.7 25 W310x38.7 W310x32.7 30 W310x38.7 W310x32.7 35 W310x38.7 W310x32.7 40 W310x38.7 W310x32.7 45 W310x38.7 W310x38.7 50 W360x57.8 W310x44.5
The steel frames were supposed to be located in eleven Brazilian regions, for which random 50-year extreme wind speeds are illustrated in Table 2. The frames were designed using ABNT NBR 6123:1988 design charts for each geographical location. However, the reliability analyses are performed considering random wind speeds obtained from the Padaratz (1977) and from the current database. Extreme wind data from both datasets are shown in Table 2. The steel frame designs shown in Table 1 are obtained using basic (nominal) wind speeds, characteristic values of material strengths, and using partial factors on load and resistance. The reliability analysis is performed with unitary partial factors, and considering random values of material strengths and loads. Table 3 summarizes the data of other random variables considered in the reliability problem, such as Young´s modulus, yield stress and dead load.

D.L. Matias, S.S. Andrade, D.M. Silva, T.D. Santos, L.C.M. Vieira Jr., A.T. Beck
CILAMCE 2017
Proceedings of the XXXVIII Iberian Latin-American Congress on Computational Methods in Engineering P.O. Faria, R.H. Lopez, L.F.F. Miguel, W.J.S. Gomes, M. Noronha (Editores), ABMEC, Florianópolis, SC, Brazil, November 5-8, 2017.
Table 2. Parameters of 50-year and 1-year maximum wind speeds (random variables).
Region ICAO code Location
Gumbel parameters, Padaratz (1977), dataset
from 1950 to 1974
Gumbel parameters, dataset from 1950 to
2016
µ (m/s)
α (m/s)
µ (m/s)
α (m/s)
50-year
return period
1-year
return period
50-year
return period
1-year
return period
Southeast
SBSP São Paulo - SP 35.04 20.63 3.69 37.22 21.32 4.07
SBKP Campinas - SP 42.80 25.42 4.46 42.81 23.52 4.95
SBRJ Rio de Janeiro - RJ 36.13 18.79 4.44 38.01 19.17 4.83
SBBH Belo
Horizonte - MG
25.40 15.85 2.45 36.85 13.84 5.90
Central-West
SBBR Brasília - DF 35.25 19.43 4.06 38.28 19.91 4.71
SBCY Cuiabá - MT 28.02 17.52 2.69 40.20 19.37 5.34
North SBMN Manaus - AM 34.49 18.05 4.21 37.16 17.90 4.94
South SBPA Porto Alegre
- RS 37.91 25.52 3.18 44.80 22.38 5.75
SBFL Florianópolis - SC 40.50 24.10 4.20 43.03 23.02 5.13
Northeast SBNT Natal - RN 19.72 14.07 1.45 35.18 16.55 4.77
SBCI Carolina - MA 18.02 13.31 1.21 29.50 9.57 5.11

Changing Wind Speed Scenarios and Consequences to Structural Design
CILAMCE 2017
Proceedings of the XXXVIII Iberian Latin-American Congress on Computational Methods in Engineering P.O. Faria, R.H. Lopez, L.F.F. Miguel, W.J.S. Gomes, M. Noronha (Editores), ABMEC, Florianópolis, SC, Brazil, November 5-8, 2017.
Table 3. Parameters of random variables.
Random Variable
Probability Distribution
Nominal Value (Nom)
Bias (µ/Nom)
Coefficient of Variation (σ/µ) Reference
Young’s Modulus (E) Normal 200 GPa 0.987 0.076 Hess et al.
(2002) Yield Stress
(Fy) Lognormal 345 MPa 1.110 0.068 Hess et al. (2002)
Dead Load (D) Normal 2.7 kN/m 1.000 0.090 Nowak and Collins (2012)
Wind Speed (V)
Extreme Type I u + 0.577/α 1.000 1.282
(uα+0.577) Nowak and
Collins (2012)
The structural analysis was performed considering geometrical and material nonlinearities, and geometrical imperfections (GMNIA), using the structural analysis software MASTAN2 (McGuire et al., 2000). All out-of-plane buckling and displacements were restrained. The second-order analyses were performed using a predictor-corrector (mid-point Runge-Kutta) solution scheme, and applying the factored loads in 5% increments, until the frames were fully loaded. The structural systems were considered at failure when the number and position of developed plastic hinges lead to unstable mechanisms. Monte Carlo simulation was used in the reliability analysis, with 105 realizations, for each weather station being studied. Hence, failure probabilities smaller than 10-5 could not be evaluated.
Results of the reliability analyses are shown in Figure 8, which compares failure probabilities calculated from the full wind speed dataset and from the Padaratz (1977) dataset. Note that when the updated dataset is used, failure probabilities increase dramatically. As an example, we can discuss results for SBPA: a weather station located in Porto Alegre, RS. Using Padaratz (1977) information, the probability of failure is smaller than 10-5 (shown as a zero in Figure 8, for simplicity), while for the updated dataset, the probability of failure increases to 19.5x10⁻⁴. Note also that these results do not consider any extrapolation of wind speeds in time.

D.L. Matias, S.S. Andrade, D.M. Silva, T.D. Santos, L.C.M. Vieira Jr., A.T. Beck
CILAMCE 2017
Proceedings of the XXXVIII Iberian Latin-American Congress on Computational Methods in Engineering P.O. Faria, R.H. Lopez, L.F.F. Miguel, W.J.S. Gomes, M. Noronha (Editores), ABMEC, Florianópolis, SC, Brazil, November 5-8, 2017.
Figure 8. Failure probabilities for steel frames at different geographical locations
(corresponding to weather stations as shown).
The impact of changing winds was also considered in service limit states. ABNT NBR
8800:2008 states that the limit horizontal displacement shall be equal to the column height divided by 300, which yields 20 mm in our example. The lateral displacement limit is defined for a load factor of 0.3 applied to the wind load; this load factor indirectly reduces the design wind defined for a 50-year return period, for a design (or checking) wind speed corresponding to a return period of one year. Correspondingly, for the service limit states, the annual maximum wind speed distributions are used in the reliability analyses.
Figure 9 compares de complementary cumulative distribution functions (P[Y≥y]) of lateral frame displacements (y), for the Padaratz (1977) dataset and for the current dataset, for the São Paulo airport station (SBSP). Since y=20mm is the allowable displacement for the service limit state, Figure 9 also shows the failure probabilities for the two datasets. It is noted that predicted lateral displacements, and resulting failure probabilities, are considerably different for the two datasets.

Changing Wind Speed Scenarios and Consequences to Structural Design
CILAMCE 2017
Proceedings of the XXXVIII Iberian Latin-American Congress on Computational Methods in Engineering P.O. Faria, R.H. Lopez, L.F.F. Miguel, W.J.S. Gomes, M. Noronha (Editores), ABMEC, Florianópolis, SC, Brazil, November 5-8, 2017.
Figure 9. Horizontal displacement (y) complementary CDF (P[Y≥y]) for SBSP Airport Station.
Failure probabilities for service limit states were also computed for a total of 11 weather
stations, as shown in Figure 10. These are the same stations for which the ultimate failure probabilities were computed, as shown in Figure 8. In Figure 10 it is first observed that failure probabilities are rather high, which is not unusual for reversible service limit states. It is also observed that failure probabilities are generally, but not always, larger for the updated datasets. The few weather stations for which failure probabilities decreased, with the updated dataset (SBKP, SBPA, SBFL), also experienced significant reduction in location parameter (µ). Hence, it is observed that change in wind scenarios, reflected in the updated database, is more significant for ultimate than for service limit states. The impact of changing winds is significant, however, and should be more relevant for comfort (vibration) limit states in high buildings (not considered herein). It is usual for structural engineers to consider the displacement limit of H/300 overly conservative, but it is observed herein that there are large probabilities of exceedance associated to this limit. The authors suggest that further studies shall be carried out on this topic and that code task groups open this topic for discussion.

D.L. Matias, S.S. Andrade, D.M. Silva, T.D. Santos, L.C.M. Vieira Jr., A.T. Beck
CILAMCE 2017
Proceedings of the XXXVIII Iberian Latin-American Congress on Computational Methods in Engineering P.O. Faria, R.H. Lopez, L.F.F. Miguel, W.J.S. Gomes, M. Noronha (Editores), ABMEC, Florianópolis, SC, Brazil, November 5-8, 2017.
Figure 10. Failure probabilities for service limit state (lateral displacements)
for different datasets and selected weather stations.
4. CONCLUSION
An updated design chart for basic wind speeds in Brazil, based on Beck and Corrêa (2013), was proposed in this paper. A simplified trend analysis was carried and results shows that, especially at center-west and northeast regions, the probabilities of recorded speeds to exceed those given in the standard are up to 14% to 16%. The trend analysis indicates that greater attention shall be given to the consequences of a fast changing wind speed scenarios and more research shall be carried out on this topic. The Monte-Carlo analysis clearly shows that use of an outdated design chart for basic wind speeds can lead to economic losses due to structural collapse or excessive displacements. Further research shall be carried out to include more wind speed data to the already available Wolfram (2017) database. The authors also recognize that Gaussian process regressions can lead to more accurate wind speed design charts, and this shall be object of future research.

Changing Wind Speed Scenarios and Consequences to Structural Design
CILAMCE 2017
Proceedings of the XXXVIII Iberian Latin-American Congress on Computational Methods in Engineering P.O. Faria, R.H. Lopez, L.F.F. Miguel, W.J.S. Gomes, M. Noronha (Editores), ABMEC, Florianópolis, SC, Brazil, November 5-8, 2017.
ACKNOWLEDGEMENTS
The authors acknowledge CNPq (National Council for Research and Development), PIBIC/UNICAMP (Institutional Scientific Initiation Scholarship Program), and São Paulo Research Foundation (FAPESP) for funding this research (grant #2015/14497-0).
REFERENCES
ABNT. NBR 8800: Projeto de estruturas de aço e de estruturas mistas de aço e concreto de edifícios. Associação Brasileira de Normas Técnicas, 2008.
ABNT. NBR 6123: Forças devidas ao vento em edificações. Associação Brasileira de Normas Técnicas, 1988.
BECK, A.T., CORRÊA, M.R.S. New design chart for basic wind speeds in Brazil. Latin American Journal of Solids and Structures, v. 10, p. 707-723, 2013.
BLESSMANN, J. Considerações sobre alguns tópicos para uma norma de vento. 2.ed. ampliada. Porto Alegre, Editora da Universidade Federal do Rio Grande do Sul, 1979, 64p.
BLESSMANN, J. Intervalo de tempo para cálculo da velocidade básica do vento. 2.ed. ampliada. Porto Alegre, Editora da Universidade Federal do Rio Grande do Sul, 1979, 49p.
GUMBEL, E.J. Statistics of Extremes. Columbia University, Dover Publications, INC, USA, Mineola, New York. HESS, P. E. et al. Uncertainties in material and geometric strength and load variables. Naval Engineers Journal, v. 114, n. 2, p. 139-165, 2002. ISSN 0028-1425.
International Panel, I. P. C. C. The Fifth Assessment Report (AR5) of the United Nations Intergovernmental Panel on Climate Change (IPCC), Climate Change 2013: The Physical Science Basis, IPCC WGI AR5. Tech. rep., Intergov. Panel on Climate Change (IPCC), 2013. MCGUIRE, W.; ZIEMIAN, R. D. Mastan2, version 3.5, 2000.
NOWAK, A. S.; COLLINS, K. R. Reliability of structures. CRC Press, 2012. PADARATZ, I. J. Velocidade básica do vento no Brasil. Brasil, Porto Alegre, RS: UFRGS, 1977 (Dissertação de Mestrado). PBMC, 2013: Executive Summary: Impacts, Vulnerability and Adaptation to Climate Change. Contribution from Grupo de Trabalho 2 (GT2 – acronym for the Working Group 2) to the Primeiro Relatório de Avaliação Nacional sobre Mudança Climáticas (RAN1) of the Painel Brasileiro de Mudanças Climáticas (PBMC). [Assad, E.D., Magalhães, A. R. (eds.)]. COPPE. Universidade Federal do Rio de Janeiro, Rio de Janeiro, RJ, Brasil, 28 pp.
SANTOS, T.D., SIQUEIRA, G.H., VIEIRA JUNIOR, L.C.M. A stochastic approach for the wind load effect on steel structures. Revista Escola de Minas, Ouro Preto, nº 69 (2), p. 137-145, 2016. VALLIS, M. B., LOREDO-SOUZA, A. M., WATRIN, L. C. A review of Brazilian wind data. The 13th Americas Conference on Wind Engineering (13ACWE), Gainsville, Florida, USA, May 21-24, 2017.
WOLFRAM Research, Inc., 2017. Mathematica, 11.0 Version, Champaign, IL.


![GKN Hybrid Power - MathWorks · GKN Hybrid Power - Background ... Gyrodrive enabled bus. Engine Torque (top chart), Engine Speed (2nd chart) ... Av = 9.1 kph. 16 [MATLAB EXPO 2014]](https://img.pdfslide.us/doc/110x75/5b91e7f909d3f25e788c858c/gkn-hybrid-power-mathworks-gkn-hybrid-power-background-gyrodrive-enabled.jpg)