Embed Size (px)
Citation preview
CHANGING TRADE SCENARIO IN AGRICULTURE AND
ITS IMPLICATIONS FOR THE INDIAN ECONOMY
Thesis Submitted to the
BAN GALORE UNIVERSITY, BAN GALORE
FOR THE A WARD OF THE DEGREE OF
DOCTOR OF PHILOSOPHY
IN ECONOMICS
By
DEEPIKA MG
Under the Supervision of
Professor R S Deshpande
NAGARBHAVI, BANGALORE 560 072
2004

DECLARATION
I declare that this thesis titled "Changing Trade Scenario in Agriculture and its Implications
for the Indian Economy" is the result of my own work and that it has not been submitted
previously, either wholly or in part, to this University or any other University for any Degree
or Diploma. Due acknowledgements have been made wherever anything has been borrowed
trom other sources.
Date: ,. - 5 - 2..t'flit
~ Deepika M G
Doctoral Fellow ADRT Unit
INSTITUTE FOR SOCIAL AND ECONOMIC CHANGE Nagarbhavi, Bangalore-560 072, India

CERTIFICATE
I hereby certify that the present thesis titled "Changing Trade Scenario in Agriculture and its
Implications for the Indian Economy" incorporates the result of the independent research by
Yls. Deepika M G, Doctoral Fellow, Agricultural Development and Rural Transformation
Unit, Institute for Social and Economic Change, Bangalore, and is carried out under my
guidance and supervision.
I also certify that it has not previously formed the basis for the award of any Degree,
Diploma or Fellowship of the University of Bangalore or any other University.
Date: 0 S - 0 5 - 2.00 4
A~~ ~ R S Desbpande
Professor and Head Agricultural Development and Rural Transformation Unit
INSTITUTE FOR SOCIAL AND ECONOMIC CHANGE Nagarbhavi, Bangalore-560 072, INDIA

'lTum/(j to,
Prof 'V 5\1 iJ{ao, Proj N S S Narayana, Prof. ;l6du{ jtziz, Prof Samar 1( rDatta, Prof 5\1 Cj01Jinda iJ{ao, <Dr. 'j{asfieem Nouroz, rDr. iJ{oopa Cfianda, Prof ;lravlnd Panagariya, rDr. 'Vive/t5\1oortfiy, Prof. Sfiasfian/ta (Bfiide, Prof 5\1 iJ{Narayana, 511s. rB P 'Vani, rDr. 5\1adfiesfiwaran S, rDr. 5\1eena/(jfii'R..(!jeev and Prof iJ{ Cj rDesalfor tfieir cnticisms and suggestions at different stages oj tfie tfiesis work,
Prof S Cjlrulppa andProf Cj 'V Josfiijor directing me towardS researcfi.
'llie rvirector. <Prof Cjopa{1( 1(f1de/tod~ Li6rary and ;ldmlnistrative Staff at IS'ECjor a{{ needed riefp and cooperation.
5\1r. 1(risfina Cfiandran and ',l,tr. Satisri 1(amatfi jor tfie computer aruf tecfinica{ support.
I(SS:J( 'Western 'Rgglona{ Centre, 5\1um6ai jor tfie visiting jeffowsfiip, Li6rary Staff at ICjlrv<J? 5\1um6ai, 'EXI:I1 rBan/t5\1um6al and o'l1um6ai Vniversity jar tfie data support.
;lsfizsfi, 1(sfiama, (Puma, rDU/tfil, Lija, Prasfi06fi andJrr.usfiijor sfiaringfriend{y academic discussions.
Sndelll, 5\1adfiu, Satya, Cjandfian, Nantu, rDeeptfii, 5\1ini, Cjagan, Cjeetfiu, Pattu, <Tunga, and ar{ otfier jrierufs at IS'ECjor 6elng my jnends In neea, Indeed.
5\1y Parents, Papanna, ;lunty (~rs. rDesfipande) and tfie rest oj my fami{y jar 6eing my p,lrars of morae support.
5\1] supervISor Prof 1(S <Desripande jor guiding me to sfiape my tfiesis .. .. and many a times .... my Cife.

CONTENTS
Page No.
Declaration
Certificate Acknowledgements Contents
... I - III
List of Figures and Tables IV - VI
Chapter 1: Introduction 1-30 1.1 Introduction 1-2 1.2 Review of Literature 2-21
1.2.1 Definition and Methods of Measuring Protection 2-9 1.2.1.1 The Nominal Protection Coefficient 2-5 1.2.1.2 The Effective Protection Coefficient 5-7 1.2.1.3 Producer and Consumer Subsidy 7-8
Equivalents 1.2.1.4 The Aggregate Measurement of Support 8-8 1.2.1.5 Assumptions and Problems in the 8-9
Measurement of Protection 1.2.2 Empirical Studies on Protection to Indian 9-13
Agriculture 1.2.3 Agricultural Trade Scenario in India and the 13-15
Relationship between Domestic and World Prices of Agricultural commodities
j .2.4 Interhnkages among the Sectors and Impact of 15-21 Trade Policy Changes to Agriculture and Other Sectors of the Economy
L3 Research Issues 21-24
l..l Objectives of the Study 24-25 1.5 Methodology 25-29 1.6 Limitations of the Study 30-30
Chapter 2: Trade Policy Scenario and Liberalisation of Agricultural 31-67 Trade
2.1 Introduction 31-31 2.2 An Overview of Phases of Trade Policy in India 32-33 2.3 Export Promotion and Import Liberalisatiol1 Measures 33-34 2.4 Liberalisation of Agricultural Trade 35-51
2.4.1 Removal of QRs on Agricultural Imports and 36-45 Exports
l.
2.4.2 Changes in Tariff Rates on Agriculture 45-51
2.4.2.1 Refonns in Tariff Policy in India 47-47
2.4.2.2 A Brief Review of the Tariff Policy in 47-49 India
2.4.2.3 Principles Governing the Fixation of 49-51 Tariff Rate
2.4.2.4 Recommendations of the Working 51-51 Group on Tariffs (2001)
2.5 Compatability of India's Agricultural Trade Policy to the 51-55 AoA vis-a-vis Policies of some of the Major Trading Partners of India
2.6 Agricultural Policy Scenario in some of the Major Trading 55-63 Partners of India 2.6.1 Tariff Rates and Peaks among India's Trade 56-57
Partners 2.6.2 Domestic Support and Trade Distorting Subsidies 57-61
in Agriculture 2.6.3 Other Non-Tariff Barriers Faced by India 61-63
2.7 Conclusions 63-64
Chapter 3: Nominal Protection and Tariff Rates in Agriculture in 68-98 India
3.1 Introduction 68-69 3.2 Protection in Agriculture seen through the Nominal 69-80
Protection Coefficients 3.3 Protection in Agriculture throu~h the Tariffs 81-90
3.3.1 Recommendations of the Working Group on 84-85 Tariffs
3.3.2 Unifonn Tariff vis Non-Unifonn Tariff 86-88 3.3.3 The Relation between Rates of Protection and the 88-90
Scheduled Tariffs and the Implications of Protection for Agriculture under the Unifonn Tariff Policy
3.4 Conclusions 91-92
Chapter 4: Factors Influencing Trade and the Relation between 99-126 Domestic and World Prices in Agriculture in India 4.1 Introduction 99-100 4.2 Changll1g Trade Pattern in Agriculture 100-105 4.3 Factors Influencing Agricultural Trade in India 105-112 4.4 Stability in and the Relationship between Domestic and 112-117
World Prices of Agricultural Commodities

4.5 Effectiveness of the Price Policy vis External Trade in 117-120 Reducing Domestic Price Volatility
4.6 Conclusions 120-121
Chapter 5: Changing Scenario in Agricultural Trade and its 127-144 Implications for Macro Economic Variables in India 5.1 Introduction 127-129 5.2 Trends in Merchandise and Agricultural Trade in India 129-132 5.3 Agricultural Trade and Trade Balance of India 132-134 5.4 Agricultural Trade and Gross Domestic Product 134-139 5.5 Agricultural Trade, Terms of Trade and Inflation 140-143 5.6 Conclusions 143-144
Chapter 6: Overview and Conclusions 145-159 6.1 Introduction 145-146 6.2 Trade policy and Liberalisation of Agricultural Trade 146-149 6.3 Nominal Protection and Tariff Rates in Agriculture 149-152 6.4 Factors Influencing Agricultural Trade in India 152-153 6.5 Domestic and World Prices: Stability and Interdependence 153-154 6.6 Relationship between Agricultural Trade and Some 154-155
Macroeconomic Variables in India 6.6 Overview and Policy Implications 155-159
References and Selected BibliographY 160-174
iii
FIGURES AND TABLES Figures
Title
2.1 Composition of Domestic Support in OECD Countries (in %)
A3.1 Trends in Nominal Protection Coefficients and Domestic and World Prices of Agricultural Commodities
5.1
5.2
5.3
5.4 5.5 5.6
5.7
Tables
2.1 2.2
2.3
2.4 2.5
2.6 2.7
2.8
2.9
2.10
2.11
3.1
Trends in Merchandise Exports and Imports of India (at Constant Prices, 1981-82 = 100) Trends in Agricultural Exports and Imports of India (at Constant Prices, 1981-82 = 100) Trends in Non-Agricultural Exports and Imports of India (at Constant Prices, 1981-82 = 100) Share of Agriculture in GDP of India Growth Rates in Agricultural GDP and GDP of India Growth Rates in GDP in Non-Agricultural Sectors and GDP of India Trends in Agricultural Exports and Terms of Trade in Agriculture
Changes in Licensing of Agricultural Commodities (in %) Trade Policy Changes and Current Status (of Imports) of Major Agricultural Commodities Trade Policy Changes and Current Status (of Exports) of Major TrFlrlf"rI A o-r1rllltllr~ 1 rnTnn1nnltlPc _. - - - -0----------- -~--~-.~~ ...........
Average Tariff on Agricultural Commodities (in %) India's Current Status, Possible Threats and Likely Issues for Further Negotiations on Agriculture in the WTO Tariff Rates in some of the Major Trading Partners of India Total Aggregate Measurement of Support Commitment and Current Status of Support in some of the Member Countries of WTO Composition of Domestic Support in OECD Countries 1995-98 (in %) Composition of Producer Subsidy Equivalents in some of the Developed Countries of the World Country-wise Value of Export Subsidies and the Products benefiting from Subsidies in Major Subsidising Countries of the World Sanitary and Phytosanitary Measures faced by Indian Exports
Nominal Protection Coefficients under Exportable Hypothcsis (for the ycar 1999)
l.V
Page
59 95
130
131
132
139 139 139
142
37 38
39
46 53
57 58
58
60
61
62
71

3.2 Nominal Protection Coefficients under Importable Hypothesis (for the 72 year 1999)
3.3 Change in Market Share in Commodities with Export Liberalisation 76 during thc 90s.
3.4 Change in Market Share in Commodities with Import Liberalisation 76 during thc 90s
3.5 Changc in NPCs for Commodities with Change in Export Policy 77 3.6 Change in NPCs for Commodities with Change in Import Policy 77 3.7 India's Share in World Exports and Imports of Major Traded 79
Agricultural commodities 3.8 Nominal Protection Coefficients before and after 1991 Liberalisation 80 3.9 Nominal Rates of Protection (NRPs) and the Scheduled Tariff Rates 82 3.10 Correlation between NRP and Tariff Rates 83 3.11 Combinations of Tariffs and Exchange Rate that provide Equal 85
Protection 3.12 Effective Rates of Protection based on Scheduled Tariffs and Price 89
Differences
4.1 Composition of Agricultural Exports of India 101 4.2 Composition of Agricultural Imports of India 102
4.3 Compound Growth Rates in Exports of Major Traded Agricultural 103 Commodities in India
4.4 Compound Growth Rates in Imports of Major Traded Agricultural 104 Commodities in India
4.5 Results of the Export Function (for the years 1980-90 and 1990-99) 107 4.6 Regression Results of the Import function (for the years 1980-90 108
and 1990-99) 4.7 Coefficient of Variation in Adjusted Domestic and World Prices 114 . ~ Coefficient of Variation in Trade and lJomesllc Pnces 116 '"+.0
4.9 Relationship between Domestic and World Prices 120
5.1 Simple Growth Rates in Agricultural Trade, Non-agricultural Trade 130 and Merchandise Trade of India
5.2 Contribution of Net Agricultural Exports to Non-agricultural Imports 133 5.3 Trade Balance ofIndia 134 5.4 Simple Growth Rates in Agricultural GOP and GOP of India and 135
Share of Agriculture in GOP of India 5.5 Result of Causality Test for Agricultural Exports and Ab'licultural 136
GOP of India 5.6 Simple Growth Ratcs GOP, Prices, Capital Formation, Fertiliser and 137
Electricity Consumption in India 5.7 Index Numbers of Wholesale Prices of Agricultural Commodities 138
Rclative to Manufacturing products (Base 1981-82 = 100)
v

Appendix Tables
A2.l Major Trade Policy Announcements since 1990 65 A2.2 Tariff Rates for Major Traded Agricultural Commodities in India 67 A3.l Markets and Ports Chosen for the Price Adjustments for Analysis of
the Nominal Protection in Agricultural Commodities 93 A4.l Compound Growth Rates in Trade and Other Related Variables of 122
Selected Agricultural Commodities A4.2 India's share in World Imports and Exports of Agricultural Commodities 126
vi
1.1 Introduction
Chapter I
Introduction
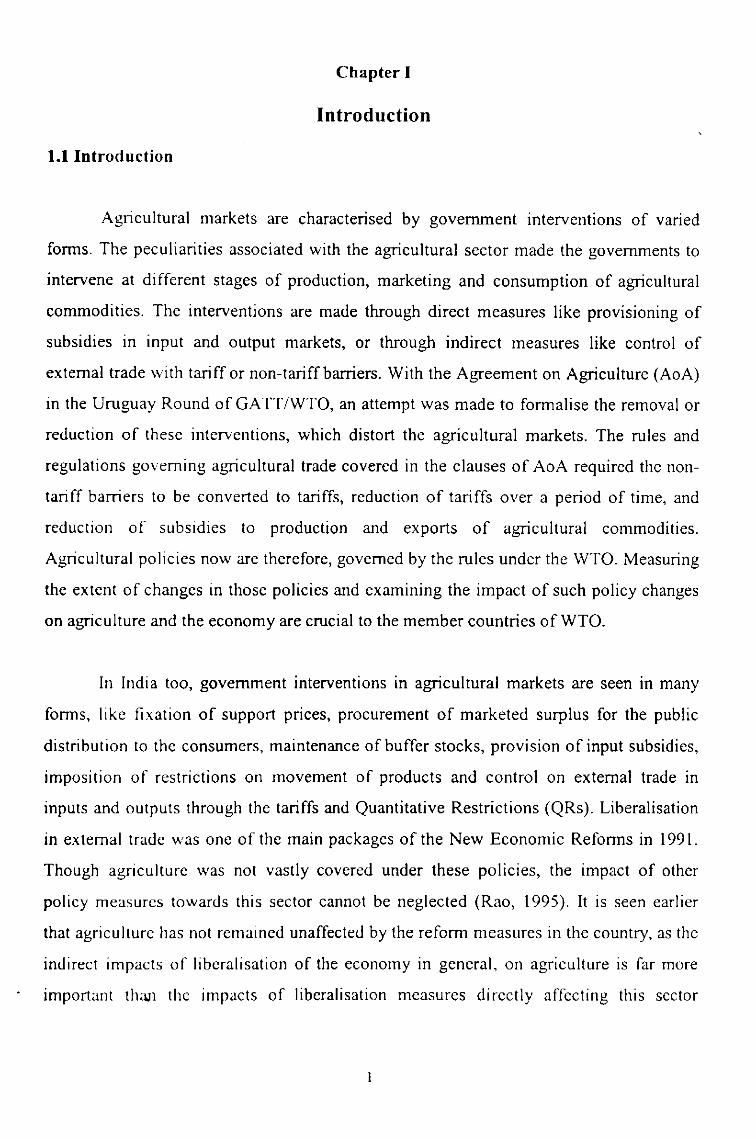
Agricultural markets are characterised by government interventions of varied
forms. The peculiarities associated with the agricultural sector made the governments to
intervene at different stages of production, marketing and consumption of agricultural
commodities. The interventions are made through direct measures like provisioning of
subsidies in input and output markets, or through indirect measures like control of
external trade with tariff or non-tariff barriers. With the Agreement on Agriculture (AoA)
in the Uruguay Round of GA TT /WTO, an attempt was made to formalise the removal or
reduction of thesc interventions, which distort the agricultural markets. The rules and
regulations governing agricultural trade covered in the clauses of AoA required the non
tariff barriers to be converted to tariffs, reduction of tariffs over a period of time, and
reduction of subsidies to production and exports of agricultural commodities.
Agricultural policies now are therefore, governed by the rules under the WTO. Measuring
the extent of changes in those policies and examining the impact of such policy changes
on agriculture and the economy are crucial to the member countries ofWTO.
In India too, government interventions in agricultural markets are seen in many
forms, like fixation of support prices, procurement of marketed surplus for the public
distribution to the consumers, maintenance of buffer stocks, provision of input subsidics,
imposition of restrictions on movement of products and control on external trade in
inputs and outputs through the tariffs and Quantitative Restrictions (QRs). Liberalisation
in external trade was one of the main packages of the New Economic Reforms in 1991.
Though agriculture was not vastly covered under these policies, the impact of other
policy measures towards this sector cannot be neglected (Rao, 1995). It is seen earlier
that agriculturc has not remained unaffected by the reform measures in the country, as the
indirect impacts of liberalisation of the economy in general, on agriculture is far more
important than the impacts of liberalisation measures directly affecting this sector
(Parikh, et.al,. 1995). In addition, there were measures towards liberalisation in external
trade in agriculture from mid nineties, to meet the internal requirements, and in the late
nineties, to meet the requirements under the WTO. These measures have direct impact on
trade in agriculture. Thus, given the nature of liberalisation and that of agriculture in
India, the impact of liberalisation policies at different phases, on different agricultural
commodities would be quite varied. The impact of such changes would also be felt at a
macro level on related variables like the trade balance, the terms of trade, the level of
prices and growth in agriculture and in the economy. Examining the changes in
incentives/protection given to agricultural commodities and analysing the implications of
liberalisation measures for agricultural sector and the economy in general, are relevant in
this context.
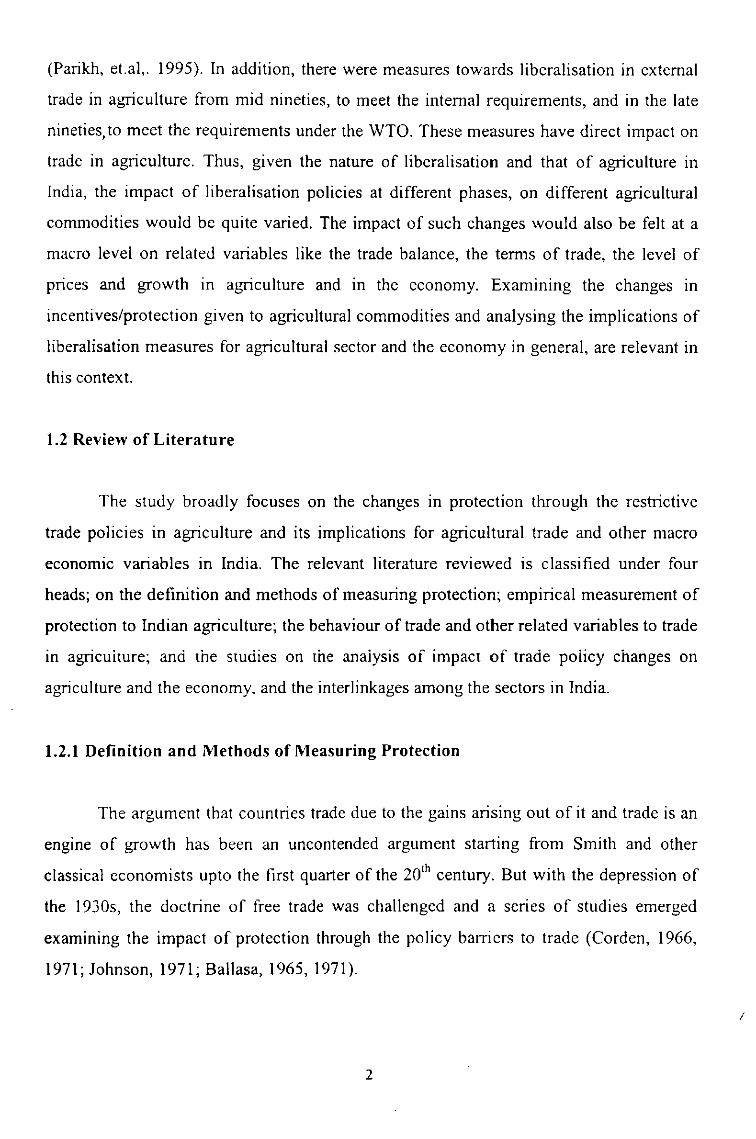
1.2 Review of Literature
The study broadly focuses on the changes in protection through the restrictive
trade policies in agriculture and its implications for agricultural trade and other macro
economic variables in India. The relevant literature reviewed is classified under four
heads; on the definition and methods of measuring protection; empirical measurement of
protection to Indian agriculture; the behaviour of trade and other related variables to trade
in agricuiture; and the studies on the anaiysis of impact of trade poiicy changes on
agricul ture and the economy, and the interlink ages among the sectors in India.
1.2.1 Definition and Methods of Measuring Protection
The argument that countries trade due to the gains arising out of it and trade is an
engine of growth has been an uncontended argument starting from Smith and other
classical economists up to the first quarter of the 20th century. But with the depression of
the 1930s, the doctrine of free trade was challenged and a series of studies emerged
examining the impact of protection through the policy barriers to trade (Corden, 1966,
1971; Johnson, 1971; Bal1asa, 1965, 1971).
2
I

Corden (1971) sees protection as the difference in the domestic and border prices,
which he treats, as cquivalent to that of the tariffs. The concept of Nominal Protection
was defined by Corden in terms of the ad valorem tariffs. Johnson (1971) gives a wider
definition by defining protection as any government measures that increases the
proportion of the nation's resources devoted to the production of a commodity or a group
of related commodities. It is seen as an attempt to increase the output of an industry by
restricting the trading opportunities existing in the nation and the rest of the world.
Protection to inputs would alter the total protection to that of the output, which is
seen through the concept of effective protection. Ballasa (1971) defines Effective
Protection as the percentage excess of domestic value added obtained by introduction of
tariffs and other protective measures on the product and its inputs. While the nominal rate
of protection affects the consumer's choice, the effective rate of protection indicates the
effects on the processing activity of tariffs on inputs and thus, affects the producer's
choice.
Empirically, the nominal protection can be measured through the ad valorem
tariff rates or by obtaining the tariff equivalent through the price differences. Since the
difference between domestic and border price is interpreted as tariff, the ad valorem tariff
would have mdicated the protection given to the commodity. But in reality, a commodity
though is restricted through tariffs, may not be restricted only through tariffs. At times,
trade may be restricted through the non-tariff barriers and tariffs might be redundant.
Thus. ad valorem tariffs do not show the whole of protection component (Scandizzo and
Bruce. 1980).
The multiplicity of protection measures used simultaneously makes the
measurement of protection complex. Empirically, tariffs in any country do not show thc
whole component of protection. Some kind of non-tariff measures prevail like that of
quantitative restrictions through licensing or the control over domestic production of
outputs and inputs or through the exchange control or technical barriers. UNCT AD
(1994) uses a classification of over 100 trade measures-including tariffs classificd mainly
3

as tariff measures, para-tariff measures, pnce control measures, finance measures,
automatic licensing measures, quantity control measures, monopolistic measures and
technical measures (Laird Samuel, 1997). The combined incidence of all these rates are
to be taken in measuring protection.
Deardorff and Stem (1984) have mentioned of two approaches, Trade Coverage
Ratio and Frequency Coverage Ratio to measure the Non Tariff Barriers (NTBs) (Laird
Samuel, 1997). The percentage of trade subject to NTBs for a country j at a desired level
of product aggregation is given by the Trade Coverage Ratio:
Where if an NTB is applied to the tariff line item i, the dummy variable Di takes
the value of one and zero otherwise; Vi is the value of imports in item i; t is the year of
measurement of the NTB; and T is the year of import weights. A problem for
interpretation of this measure arises from the endogenity of the import value weights. At
an extreme, if an NTB is so restrictive that it precludes all imports of item i, from country
j, the weight T will be zero and in consequence the trade coverage ratio will be
downward biased. The problem with this measu!'e-is that it just records the presence or
absence of an NTB. It does not give an indication of the restrictiveness of the trade
policy.
Another procedure, which avoids the problem of endogenity of import weights, is
the frequency ratio. This approach accounts only for the presence or absence of an NTB,
without indicating the value of the imports covered. The Frequency Coverage Ratio
shows the percentage of import transactions covered by a selected group of NTBs for an
exporting country. It is calculated as:
F = r~(/)itM" )]"'100 " l ~M. "
4

Where D; once again reflects the presence of an NTB on the tariff line item, M;
(also a dummy variable) and t is the year of measurement of the NTB. Unlike the
coverage ratio, however, the frequency ratio does not reflect the relative value of the
affected products and thus cannot give any indication of the importance of the NTBs.
These measures can only show the extent of prevalence ofNTBs and not its intensity.
There are other methods, which measure the extent of protection to the
commodity, sector or the economy. These are the Nominal and Effective Protection
Coefficients, the Producer and Consumer Subsidy Equivalents (Scandizzo and Bruce,
1980) and the Aggregate Measure of Support (AMS) under the WTO (Goyal, 2000).
1.2.1.1 The Nominal Protection Coefficient
The Nominal Protection Coefficient (NPC) of any commodity is defined as the
ratio of its domestic price to its border price. This technique has been used by Baldwin
(1975), Bhagwati and Srinivasan (1975) and Roningen and Yeats (1976). With the
inherent assumption that the domestic price is distorted and the border price is a free
trade price, the difference in these two prices shows the amount of total protection
--thruug.t~ the ta.riff (iJld th~ iion-tariffballiers in the output 111arket.
Where,
NPC=Pdi
, I{i
NPCi = Nominal Protection Coefficient of commodity i
Pdi = domestic price of commodity i
Pbi = border price of commodity i with the border price being its
foreign price times the official rate of exchange.
The Nominal Rate of Protection (NRP) can be obtained through percentage
difference bctween the domestic and border prices.
5

Pd -Pb" NRP=' , , P b'
)( :100
Where NRPi = Nominal Rate of Protection for commodity i
An NPC greater than one would mean that the commodity under consideration is
protected, whereas an NPC less than one would mean that the commodity is taxed.
1.2.1.2 The Effective Protection Co-efficient
Effective Protection Coefficient (EPC) is the ratio of the value added expressed in
domestic market prices to value added expressed in border prices. Value added is defined
as the value of the output at any point in the production distribution process III any
period, less the value of the purchased inputs in the same period.
* Pd , - L (aij Pd)
EPC=--~)~"'~----, k
Y·rnere,
Pb' - L (aijPbj ) i:1
EPC, = Effective protection coefficient in the ith activity or output
Gij = quantity of the jth input used to produce one unit of the ith
output
Pd'(J) = domestic price of output/input for the ith output or j'h input
Pb;(j) = border price of the outputlinput for the ith output or jth input
J = I ..... k = all traded inputs.
EPC > I would mean that, at the existing official exchange rate, production
measures provide positive incentives to produce the commodity or carry out the activity
6

under consideration, and EPC <I indicates that protective measures discrimmate against
the commodity in question. An EPC < • signifies an absolute loss of foreign exchange to
the economy. If the protection on inputs is the same as the final output, the effective
protection is equal to nominal protection. If the tariff on the final product is greater than
that of the intermediate inputs, then the effective protection is greater than nominal
protection. The opposite holds good if the tariff on the intermediate inputs is greater than
the tariff on the final product. In measuring the effective protection the treatment of non
traded intermediate inputs is important and introduces some complication into the
calculation of effective rates.
1.2.1.3 Producer and Consumer Subsidy Equivalents
The Producer and Consumer Subsidy Equivalents are extensively used to measure
the government policies by the OECD studies (Laird Samuel, 1997). The Producer
Subsidy Equivalents measure the transfers that are a result of government policies to
producers by tracing the direct and indirect government expenditures to producers or by
imputing the effects of policies by calculating the difference between actual domestic
prices and what they would have been in the absence of trade interventions. Its advantage
over the nominal protection is that it captures both the transfers from government
expenuitures as weil as ihe iransfers from price distortions.
PSE = Q (Pd-Pw * X) + D + I
Where,
Q = Quantity produced,
Pd and Pw = Domestic and World Prices,
X = Exchange rate,
D = Direct payments on production,
I = Indirect transfers through government policies such as input subsidies, marketing assistance, or exchange rate distortions.
7

A related concept Consumer Subsidy Equivalent (CSE) is the value of transfers,
resulting from government intervention through net implicit tax imposed on consumers
by agricultural support measures and by consumer subsidies. In essence, these are similar
to the measurement of effective protection rates but includes the impact of all other
measures of intervention, which may not be reflected in changes in the domestic prices of
inputs and outputs compared to their international prices. The advantages of this method
are that it looks at the various specific measures of intervention and tries to quantify their
impact on producers and consumers. The disadvantage of this method is that, the impacts
of substantial changes in policies or of simultaneous changes in protection in a number of
commodities or a number of countries cannot be assessed using this approach (Parikh, et,.
al 1988).
1.2.1.4 The Aggregate Measurement of Support
The concept of Aggregate Measurement of Support (AMS) originated with the
Agreement on Agriculture (AoA) in the WTO. The amount of total subsidies, subject to
reduction commitments in agriculture sector is to be measured in tenns of AMS. AMS is
measured under two heads, product specific support and non-product specific support.
The product specific support is computed through the gap between the domestic price and
the externai reference price muitipiied by the quantIty ot productIOn. Although AMS is
computed on a product-by-product basis, the commitments for reductions apply to
aggregate amount. This allows countries' flexibility to shift support from one product to
another, though they are required to keep within ceiling limits. The Non-product specific
domestic subsidies are added to the total subsidies calculated through the product basis
(Goyal, 2000).
1.2.1.5 Assumptions and Problems in the Measurement of Protection
In calculating the protection coefficient through the price wedge technique there
lies an inherent assumption that the domestic price is relatively distorted as against the
world price. There are a number of problems connected in obtaining such coefficients.
8

First question that can be asked is how can the border prices be free trade price and hence
taken as the reference prices? Scandizzo and Bruce (1980) argue that from a global point
of view the international or border price may not be an appropriate reference price.
Looked at it from the point of individual country, however, it is irrelevant that some
international border prices may be monopsonistic, dumped or distorted ones. What
matters is whether or not they are true and lasting trading options. If they are then one can
take the border prices for measuring the distortions. If they are not, then appropriate price
would be valuing the commodities at border priced opportunity costs.
1.2.2 Empirical Studies on Protection to Indian Agriculture
There are quite a few studies on the empirical measurement of protection on
agriculture commodities in India (Gulati, Hanson and Pursell, 1989; Pursell and Gupta,
1997; Gulati, and Sharma, 1994, 1997; Gulati and Sharma 1991; Datta, et.a!, 2001).
These studies, in estimating the protection coefficients differ in choosing of commodities,
time periods and the adjustments made on prices.
The NPCs are obtained as the ratio of domestic price to that of the world price
after adjusting to the freight, domestic transportation and the marketing margins. The
representative OOlllt:slic price chosen is generaiiy the whoiesaie price or the procurement
price (if the commodity is largely procured) prevailing in the major market in a major
producing state. The representative world price is the leading market price of a
comparable variety of the competing country. The treatment of NPC under importable
and exportable hypothesis is met by adjusting the prices to transportation costs. Under
importable hypothesis the reference price is the c.i.f price in the domestic port which
includes the prices of the commodity plus the international freight charges, the port
clearance charges, domestic transportation and the traders' margins. Under exportable
hypothesis, the relevant border price is obtained after deducting the domestic
transportation from the domestic market place to the port from the f.o.b price since these
costs would have been incurred for the domestic producer to make his product exportable
(Gulati, et al,. 1994). Purscll and Gupta (1997) while estimating the EPC for selected
9

agricultural commodities consider three major inputs that go into the production, i.e.,
fertiliser, seeds and machinery. They estimate the EPC for each crop for individual state
in India. A weighted average of the state level indicators has then been calculated using
total value added at observed market prices in the total production of the crop in each
state.
Gulati, Hanson and Pursell (1989) examine the NPCs and EPCs for wheat, rice,
groundnut and cotton for the years 1980-81 to 1986-87. Gulati and Sharma (1997)
estimate them for a set of cereals, oilseeds, cotton and sugarcane for the years from 1983-
84 to 1993-94. Gulati, et. al (1994) examine for 13 major commodities for looking into
the export competitiveness from 1980-81 to 1992-93. Pursell and Gupta (1997) examine
the NPC and EPC for sugarcane for the years 1981-88.The other set of estimates that are
available are Datta (2001) for rice for the years 1994-95, and 1998-99 and Datta and
Gupta (2001) for sugar for the years 1990, 1994 and 1995.
Examining the protection coefficients on a commodity basis, it was seen that
NPCs of rice and cotton were less than unity in all time periods. Rice was, therefore taxed
for the producers in India seen in terms of NPCs. Gulati, Hanson and Pursell (1989)
found that even wheat has been disprotected along with rice and cotton. The EPC for
',;:heat, rice aTId cotton were less than (ht: (;orresponuing I,,?es. This is because the
tradable inputs used in these crops were protected, while the crops themselves were
disprotected. NPC for groundnuts showed much more than one indicating high
protection. It is found that groundnuts have a higher EPe than NPC because the
protection of groundnuts exceeds the protection to inputs. Similarly, the NPC for sugar,
rubber and edible oils were found to be more than one (Gulati and Sharma, 1991).
The extended study on protection by Gulati et al,. (1994) measures the NPCs for
few cereals and horticultural products for the years from 1980-81 to 1992-93. The
purpose of the study was however, to examine the price competitiveness than the
protection to the commodities. In this study it was seen that the export competitiveness of
rice has improved after 1986-87. The NPC under the importable hypothesis for wheat
10

showed that it is not an efficient export crop but it is capable of competing with that of
imports since NPC under importable hypothesis is also less than unity. NPCs of sorgum
and maize were also more than one. Among the horticultural products banana, grapes,
sapota and lychee turned out to be highly competitive and so is the case with onion and
tomato with NPC much less than unity. NPCs of Mango and potato were near to one and
that of apple more than one.
Gulati and Shanna (1991) examine the nature and extent of government
intervention in product markets. The study shows that food grains were subject to
significant intervention owing to their sensitive nature in the economy. The interventions
are in the fonn of procurement by the government, maintenance of buffer stocks, etc.
There has been an increase in the amount of subsidy provided for foodcrops in the early
nineties as in the eighties. The degree of intervention in foodgrain market is seen through
procurement of foodgrians, stocks, PDS offtake and the government imports. The study
also examines whether domestic profitability is in line with effective incentives using the
panel data on effective indicators and domestic profitability across the states, with the
fixed component model. The results showed that the crops that are internationally more
competitive and less protected are crops with low profitability, which is not a good signal
for resource allocation in the economy.
There are a few studies, which tried to examine the protection for agriculture
sector as a whole. These studies have emerged to examine the compatibility of India's
agricultural support policy to the Agreement on Agriculture (AoA) under the WTO.
Under the AoA the total support to agriculture is captured through the Aggregate
Measurement of Support. The estimates obtained by Gulati and Shanna (1994) based on
support prices reveal that product specific AMS for India (for 17 products out of 22 total
products for which India maintains market support programs) works out to be negative
to the tune of (-) Rs. 242 billion. This fonns (-) 27.74% of total value of agricultural
protection (excluding forestry and fishery). Non-product specific AMS works out to be
Rs46 billion, 5.24% of total value of agricultural production. By adding these two one
11

gets total AMS which stands at (-) Rs. 196 billion which fonns (-) 22.5 % of the value of
agricultural output during the base period 1986-87 to 1988-89.
According to the Ministry of Commerce, Govt of India, product specific AMS
during 1988-89 is Rs (-) 242.42 billion. Ministry's estimate reveals that product
specific support fonns 17.4% of the total value of agricultural production. The
difference arises because the ministry's estimate includes animal husbandry and
forcstry in the total value of agricultural production while support on the components of
agriculture has not been included (Gulati and Shanna, 1994). But both estimates show
that Indian agriculture is taxed. The AMS calculated by Gulati reveals that in almost all
cases, in most of thc years the product specific support to Indian agriculture is negative,
the range is quite wide from about -10% - 70%. The non-product specific support is of
course positive and varies from about I to 10%. If one adds the product specific and
non-product speci fic supports as the tenn Aggregate in AMS suggests, then Indian
agriculture in most cases is having negative support or implicit taxation.
Thus, from the existing studies on protection coefficients, we see that some of the
agricultural commodities in India are taxed, whereas some others are protected. However,
these coefficients are available for a limited set of commodities and for a period up to the
early nineties. It would be interesting to examine the changes in these in the later period
whtll JJJulOli UI [lit:: puiicy changes in agricuiture have taken piace. Aiso, if extended lor
larger number of commodities an intercomparison of these across commodities would
also be helpful in revealing the diversified nature ofpolieies across the commodities.
After examining the literature on protection towards agriculture in India we see
that the studies are silent on protection to agriculture through the tariff rates. Some
studies show that there is lack of economic criteria in fixing of tariff rates and the purpose
of tanffs was to protect industries for industrialisation (Desai, 1970). Gang and Pandey
(1998) examine the nominal protection through the tariffs in tenns of ex-ante and ex-post
tariffs, I.e., as the published or statutory tariff rate or as the realised tariff rate which is the
amount of the import duty actually collected divided by the value of imports. The study
shows that there IS a weak link between the ex-ante and the ex-post tariffs on a major set
12

of traded agricultural commodities in India, which shows the problem of exemptions and
that of tariff accounting in India.
1.2.3 Agricultural Trade Scenario in India and the Relationship between Domestic
and World Prices
Trade in agriculture in India has largely depended on residuals. India exported if
surplus existed and imported during deficits. Therefore, agricultural trade in India is
expected to be highly fluctuating. Panchamukhi (1986) examines the behaviour of trade
in agricultural commodities and its relation to other important macro economic variables.
The study shows that trade in agriculture in India is subj ect to vast fluctuations as
compared to the trade in non-agricultural sectors in India. On drawing the relationship
between exportslimports of agriculture with select macro variables like GDP, total
exports, agricultural production, and total imports, it is seen there is a significant negative
correlation between agricultural exports and imports, but there was no significant
relatlOnship of trade with any other variable. However, since the early nineties the
importance of agriculture as an export earner in the economy has increased. Datta, et, al
(2001) examine the changes in the composition and direction of India's agricultural trade
in the reforms period classifying the time period 1986 to 1991 as pre-reform and 1992-97
as post reforri't years. It is seen that India has achieved a sharp change in the composition
of her exports but India has been able to achieve only marginal increase in the share of
exportables, whose relative unit value is increasing or remaining constant during the post
reform period. India has significantly increased the share of items whose relative unit
value IS less than unity and that too is declining in the post reforms period. Similarly, in
the case of imports, India has stopped importing a large number of primary commodities
while moving in the direction of value added and processed agricultural products. But
this study has the limitation of considering the time period from 1991 onwards as the
liberalisation period for agriculture. Since it is also seen through the review of policies
that liberalisation policies have not directly been directly applicable to agricultural
commodities, attributing the changes in trade to the policies would be misleading. We do
not come across any studies trying to examine the determinants of trade in agriculture.
13

One study by Kumar and Mittal (1995) examine the determinants of tea trade in India
through an export function where export is taken as the function of share of India's
production to world production, share of consumption to production, world demand, unit
price in dollars and the exchange rate. Here no variable seemed to have explained the
exports of tea from India.
Prices playa larger role in Iiberalised trade scenario. The relationship between the
domestic and world prices is expected to be more significant in such a situation. Some
studies have looked into the movements in the domestic and world prices of agricultural
commodities and the mechanisms to reduce the price fluctuations under prevailing policy
situations. Nayyar and Sen (1994) make a comparison between the domestic wholesale
price index and indices of average unit values in international trade in agriculture for a set
of importables and exportables for the period from 1960-61 to 1990-91. The comparisons
show that the divergence between border and domestic price movements has increased in
the late eighties and early nineties and is much more marked for importables than for
exportables. The study also examines the domestic and world price differences for some
of the traded agricultural commodities in India. Through the comparison, it is seen that
world market in agricultural commodities is less stable than the Indian domestic market
and hence with the Iiberalisation, the volatility in world prices would be transmitted to
domestic prices. However, the comparison oi prices wouid be more meaningful when the
pnces are adjusted for the exchange rate, inflation and time series properties.
Srinivasan and Jha (2000) analyse the effects of liberalising food grain trade on
domestic price stability using a multi-market equilibrium model in which the direction of
trade is determined endogenously and world prices are sensitive to the amount traded by
India. The study examines, the effect of liberalising external trade in two major food
grams nce and wheat, on their domestic price variability in the absence of any
government intervention. It then considers the case where the government operates the
price band stabilisation schemes to stabilise domestic prices. They use a dynamic
stochastic simulation modcl with a multi-market equilibrium approach where prices,
consumption, production, trade and stocks of rice and wheat arc all determined
14

simultaneously. Their results show that contrary to popular belief, freeing of trade by
India leads to greater price stability even though world prices are more volatile.
1.2.4 Interlinkages among the Sectors and Impact of Trade Policy Changes on Agriculture and other Sectors of the Economy
The analytical models on examining the linkages among the sectors in India by
Subramaniam (1993), Parikh, et, al (1995), Storm (1997) show that the outward
orientation of the economy including that of the agricultural sector would lead to higher
growth of the economy. However, the views on outward orientation leading towards
growth are divided. On the superiority of the export-promotion strategy over inward
looking strategies, Ballasa (1990) is of the view that inward oriented strategy of
development is likely to permit rapid economic expansion initially. However, it will
eventually run into difficulties as the limitation of domestic markets leads to shifts into
new activities that do not conform to the country's resource endowment and circumscribe
the possibilities for the exploitation of economies of scale. Another problem that is
pointed with continued inward orientation is the emergence of foreign-exchange
bottleneck, and the inability of the economic structure to respond adequately to changes
in the pattern of domestic and international demand. This may lead to a widening current
account deficit and financing difficulties in the subsequent stages of industrialisation
(J alan, 2001). Other group of economists including Raj (1986), Chakravarty (1987), and
Bhaduri (1993) argue that though the constraint on industrial growth is basically on the
demand side, they urged the adoption of an alternative, agriculture-led industrialisation
strategy, which is based on internal rather than external demand. This, it is argued, is best
achieved by a large-scale program of public investment in irrigation and other
agriculture-related infrastructure. They believed that outward orientation would lead to
highly skewed distribution of incomes and this would also lead to generating more
demand for consumer goods among the higher income groups, and at the same time
would lead to larger deficit on the BoPs current account, making the economy as a whole
much more vulnerable to the vicissitudes in world trade. There is another view, which
holds the importance of 'initial conditions' in determining the pace of growth
(Kindleberger, 1980) saying that open trade policy alone is not sufficient in promoting
15

growth. These conditions include differing resource endowments, the opportunities in
international trade, the stock of technical knowledge, the prevailing economic and social
links and so on.
The literature on examining the impacts of liberalisation policies on economies
has largely relied upon the use of Partial and General equilibrium models, where there are
a set of behavioural equations on the supply and demand of different commodities and a
set of market clearing equations, obtaining the equilibrium price and quantities. The
partial equilibrium models can be in many forms and they are differentiated on the basis
of their structural characteristics. Major structural differences between models are in four
areas, in terms of the a) commodity coverage, b) country coverage, c) temporal properties
and d) the 'partiality' of their partial equilibrium. One of the crucial aspects of the partial
equilibrium models is the way in which they represent the trade policies. The most
popular approach has been to express the aggregate effect of policy as a tariff equivalent
or the wedge between the domestic and world prices. Another approach is to estimate the
value of producer subsidy or consumer subsidy equivalents (Blandford, 1990).
There are quite a few models built to examine the impact of liberalisation on
agricultural trade in India. Mention may be made of general equilibrium models by
Subramaniam (i 993), Parikh, et,. aI., (19Y5) and the partIal multi - market model by
Gulati and Kelly (1999).
Subramaniam (1993) examines the impact of agricultural liberalisation for India
through the Computable General Equilibrium model using the Social Accounting Matrix.
Three sets of scenarios are used to examine the possibilities of changes in the world
economic scenario. The first set considers different scenarios for trade liberalisation in
India with and without higher world agricultural prices. This comprises of liberalisation
of agricultural trade in India, liberalisation of trade in all commodities in India and
liberalisation of world agricultural trade. The model has 17 commodity sectors and uses
an econometrically estimated supply model for agriculture, which is disaggregated into
rice, wheat, coarse cereals and other crops. Its key features are: a) trade quotas are
16

imposed in some sectors, b) wages adjust partially to food prices in the medium run and
are detennined by market-clearing in the long run, and c) it incorporates an
econometrically estimated system of equations describing rice and wheat procurement.
The base year for the model is 1983-84. The results show that restrictions and tariffs on
agricultural trade represent only a small burden on agriculture and that the main source of
taxation of agriculture is the protection to the non-agricultural sectors. Direct effects on
agriculture are small and general equilibrium effects are large. When liberalisation is
extended to processed commodities, such as edible oils, sugar and processed food, the
impact of those policy changes on agriculture is seen to be adverse because the decrease
in prices (derived demand) from these sectors outweighs the positive influence of
liberalisation on rice and wheat prices. Because of non-agricultural expansion and lower
food prices, real incomes increase for all groups, though in the long run, these gains are
smaller and become negligible for large farmers. When non-agricultural trade is also
liberalised, the major impact on agriculture is through the 26 percent devaluation required
to maintain external balance, which results in substantially higher prices for rice and
wheat, but has little effect on prices of coarse cereals (trade in which is insignificant) and
other crops where the effect of devaluation and liberalisation of imports work in opposite
directions. Higher world food prices, it is shown have little impact if India's trade is not
Iiberalised, which is not surprising given the small trade shares before liberalisation.
Wnen india's agricuiturai trade is hberalised, the increase in GDP is smaller with higher
world agricultural prices in the medium run because of the link between food prices and
the wages.
Parikh, et, al (1995) examine the impacts of trade Iiberalisation for India with an
applied general equilibrium model with nine agricultural sectors, one non-tradable
nonagricultural sector and one tradable non-agriculture sector with five rural and five
urban expenditure classes. Here too different scenarios are generated in the model. It is a
sequential general equilibrium model in which an equilibrium price vector is computed
for each year in succession. A number of behavioural equations relating to the demand
and supply have been econometrically estimated with data from the period 1950-51 to
1973-75. The base run is the Business As Usual scenario in which past policy regimes
17

continue. A change in the policy may be introduced by changing values of some
parameters and/or by altering the specification of some function. The results are
examined sequentially, the effects of trade liberalisation to different sectors. The impacts
are seen due to trade liberalisation in agricultural sector, non-agricultural sector and also
due to other measures. The results are discussed for three years, 1995, 1998 and 2000.
The results show that when both agricultural sectors are liberalised, economic growth as
measured by real GDP rises by about 4.5% above the reference run in the year 2000. One
striking result is that Non-agricultural Trade liberalisation (NTL) has more growth
inducing effect than Agricultural Trade Liberalisation (ATL). Thus agricultural GDP
increase due to ATL is only about 0.9% in the year 2000 while it is 4.3 percent due to
NTL. The study shows that given the initial condition distortion in many of the
agricultural sector is lower in magnitude than the distortions in the non-agricultural
sector, the price changes due to ATL are smaller in magnitude than those due to NTL and
hence the observed GDP effects of reforms in agricultural and non-agricultural sectors.
Prices in sectors which have positive protection rates in reference run are reduced with
liberalisation and prices in sectors which have negative protection are increased. The only
exception to this general rule is the case of rice where the prices decline even after
removal of nominal protection in NTL. The terms of trade shifts in favour of agriculture
in all scenarios. Liberalisation of both agriculture and non-agriculture together has
favourable effeci on ompm of ail seClors in 2000.
Mishra and Rao (2003) examme whether the trade policy and devaluation of
rupee have helped in raising agricultural exports and how the changes in the trade policy
introduced during the nineties have influenced the domestic intersectoral terms of trade
through which the impact of macro policies such as monetary, exchange rate and trade
are transmitted to the agricultural sector. It was seen that the lower tariff regime initiated
in the process of economic reforms in 1991 among others, while reducing the relative
prices of manufacturing, has influenced the terms of trade in favour of agriculture and has
raised private investment in agriculture. These have helped in increasing the aggregate
crop output over the period and this along with the devaluation of the rupee has helped in
raising the agricultural exports.
18

There are quite a few studies, which have focused on the impact of policies
specifically on some of the major traded agricultural commodities. Gulati and Kelly
(1999) measure the efficiency gains of liberalising trade in agriculture on rice, wheat,
pulses, sugar, oilseeds and cotton. To analyse such changes supply and demand models
are specified. Demand system is divided into three groups, urban demand, rural demand
and foreign demand. Foreign demand is treated as a residual after estimating the domestic
demand and supply equations. Each supply equation represents a supply function, which
depends on the crops' own price, price of the substitute crops and price of inputs.
Similarly, the demand depends on its own price, prices of other commodities and on
income. Solving these equations for policy variables, changes in supply, urban demand
and rural demand is obtained. The foreign demand component is estimated as a residual,
after estimating the supply and demand systems. The model simulates the impact of
unilateral trade Iiberalisation on selected crops by calculating the effects of replacing the
prices of wheat, pulses edible oils and cotton with border price equivalents. In addition to
the impact of commodity/crop output price Iiberalisation, the impact of increases in the
prices of irrigation water and fertiliser have also been simulated. This is to ascertain
whether and to what extent the estimated changes in production and exports remain
sustainable if input prices are raised along with output price adjustments. The results are
pn::senleu unuer four aitemative scenarios, first, reducing excess demand or nce and
aligning the domestic prices of wheat, pulses, oilseeds and cotton with their border price
equivalents; second, scenario I plus 50 percent increase in irrigation water charges, third,
Scenario II plus 29 percent increase in fertiliser prices (reducing fertiliser subsidy to
farmers by 50 percent and the fourth scenario has scenario II plus 58 percent increase in
fertiliser price (reducing fertiliser subsidy to farmers by 100 percent, which means raising
fertiliser prices to their border price equivalents. In most of the scenarios it is seen that
there is substantial increases in the production of wheat, cotton and rice and declining
production of oilseeds and sugarcane. However, the decline in oilseed production seems
to be smaller relative to the price cut and the correspondingly large benefit to edible oil
consumers. It seemed unlikely that trade Iiberalisation would require very large
production adjustments. In most scenarios the increased supply coupled with reduced
19

consumption of rice, wheat, sugar and cotton leads to an increase in the export volumes
of these commodities. The export volumes of these commodities remain sustainable even
with an increase in prices of inputs.
Mehta (2000) estimates the likely increase in India's imports due to the removal
of QRs of all items of imports as per the requirement under the WTD. The likely increase
in India's import due to removal of QRs has been estimated by using an econometric
model. The model has been defined by an import function wherein the import of a
commodity group is a function of total imports, import price of the commodity group,
tariff rate of the importing country, index of QRs for the commodity group. The
projections have been done separately for more than 50 commodity groups defined by
different chapters of HS classification. Among the agricultural commodities the results
show that India's imports are likely to shoot up for chemical fertilisers, vegetable textile
fibers, coffee. tea and spices.
Chand and lha (2001) examine the impact of liberalisation in agriculture on
producer surplus, consumer surplus and net social welfare in the case of all major crops
grown in the country like rice, wheat, maize, sorghum, few edible oils, pulses, cotton and
jute. They examine the price transmission due to liberalisation, i.e., the transmission in
ihe worid price to ihat of the domestic whoiesaie price and to that of the farm ievei prices.
This is examined in two scenarios. The first scenario assumes that domestic prices in the
country would be adjusted to the c.i.f or fo.b prices of importables/exportables received
or paid by the country through trade taking into account the internal cost of moving
produce between a producing area and the port. The second scenario assumes that the
country would receive international prices for exports and it would also be paying
international prices for imports. The impact of trade liberalisation is then studied by
adj usting domestic prices to international prices. In the case of rice it is seen that the
domestic price increases by 29 percent if traded at the international prices and 2.4 percent
if traded at the f.o.b prices. Corresponding to these changes the farm level price increases
by 2.5 percent and 29.5 percent if the reference price is fo.b price and international
reference price. A similar analysis is done for other commodities. The welfare analysis
20

through the difference in the producer and consumer's surplus is done by obtaining the
elasticity of demand and supply of the selected commodities along with the price
transmission between the wholesale and farm level prices. The net social gain turns out to
be positive in the case of rice, sorghum, mustard and arhar. In the case of wheat and
soyabean there seems to be a net loss in the welfare.
From the review of above models we see that there is consensus among the
results, in showing that liberalisation in non-agricultural trade is more effective in
increasing trade and growth in the agricultural sector than liberalisation in agricultural
sector. Liberalisation in agricultural sector too is effective in increasing the GDP in
agriculture. The relationship between trade and GDP in agriculture is indirect through the
terms of trade effects. However, there are certain limitations in forecasts of such models.
Since the agricultural economy is in a total transition the forecasts are made on the basis
of data before the structural break in the economy. The forecasts are made on the basis of
the reference scenario, which is ex-ante for an ex-post situation. Similarly, capturing the
policies using the indices like the protection coefficients or subsidy equivalents based on
prices may lead to misleading results due to the imperfections in the agricultural markets
even after complete liberalisation through the policies.
i.3 Research issues
It is largely claimed that with the introduction of the New Economic Reforms in
1991, much of the reforms in trade and other sectors were initiated and hence the period
after 1991 is generally taken as the post-liberalisation or the liberalisation period. But
since agriculture was the sector addressed much later for liberalisation in India and
elsewhere, especially under multilateral organisations like WTO, it is essential to deal
with Iiberalisation in agriculture separately. As the process of liberalisation in agricultural
trade is not seen as a package for the sector in totality, the study tries to examine all the
major traded commodities individually in terms of changes in their trade policy status.
21

We see from the above review that the analysis on the impact of liberalisation
would require measurement of trade distortions at the first step. Measuring distortions
through trade policies has been done through protection coefficients (nominal or
effective) or producer and consumer subsidy equivalents to capture the distortions in the
output or input markets. Since the tariff rates in the case of imports and export subsidies
in case of exports are not very suitable to represent policies, these coefficients are used as
appropriate alternatives to obtain the tariff/subsidy equivalent to agriculture commodities.
We see through the revIew that some studies have already measured the
protection to agricultural commodities through the nominal and effective protection
coefficients. They are examined for period up to the early nineties. However, it would be
interesting to extend the study to the later period when many policy changes in
agriculture are introduced.
Since protection coefficient is a ratio of domestic and border prices, each of which
would depend on large number of factors, it is essential to examine as to what extent
these coefficients reflect trade policies and to what extent they are sensitive to policy
changes. We attempt answering this by measuring Nominal Protection Coefficients
(NPCs) that are widely used to measure protection in the output sector, for select
agrio.;uilurai commodities in india and by relating them to their trade poiicies at a pomt of
time and changes in them over a period of time and other policies that can have an impact
on trade, which we review descriptively. At the same time, we examine whether the
impact of liberalisation on trade in agricultural commodities is reflected on the protection
coefficients.
From the review we also see that the analysis of protection in agriculture in India
has been silent of the protection through tariff rates which are more important in the post
QR regime. Protection in the absence of any non-tari ff barrier, is seen through the tariff
rates. Hitherto, tariffs in agriculture in India played an insignificant role with the
existence of quantitative restrictions. Most of the tariff lines in agriCUlture were subject to
either prohibition, restriction through quota licensing or canalisation of commodities.
22

Nevertheless, imports of agricultural commodities in India were subject to three types of
customs tariffs, the basic or the standard duty, the additional duty and special additional
duty. Of the three, the basic duty constituted the protective part of the duty. With the new
trade regime under the WTO, there is a need to revise the tariff rates. The Working Group
on the Customs Tariffs (200 I) was appointed to revise the structure of customs tariff in
India. The report comes out with the recommendation of a unifonn rate of duty of as low
as 20 percent on all commodities so that it solves the administrative difficulties and the
problem of negative protection. It also suggests for the deletion of all exemptions, which
lead to corruption and administrative hassles. It would, therefore be interesting to
examine the implications of levying a low unifonn tariff for Indian economy in general
and agricultural commodities specifically.
The trends in agriculture trade show that there is some notable increase in the
trade volume in agriculture since late eighties, which have contributed to foreign
exchange earnings of the economy. It is essential to examine what factors have led to the
change and whether such an outcome is sustainable. We make an attempt here to examine
the factors that detennined trade in agriculture in India in two decades of eighties and
nineties so that changes in them are captured. Trade policies in India are diversified
towards agriculture commodities and hence the behaviour of agriculture commodities
with respect to dl fferent vanables affecting trade would differ. We classify the
commodities into restricted and freely traded and examine the relationship between trade
and related variables in the two decades of eighties and nineties. It is also believed that
world prices of agricultural commodities are more volatile in nature than the domestic
prices and hence with the opening of trade in agricultural commodities, the volatility
would be transmitted to domestic prices. It is essential to examine if this hypothesis holds
good for most of the traded agricultural commodities in India, when the prices are
ad) usted to exchange rate, inflation and the time series propertics. Since trade has been
used as one of the tools to regulate domestic prices in case of many commodities, we try
to examine the linkages between the two for those sct of commodities.
23

From the studies analysing the interlinkages in the sector we see that the linkages
between agriculture and non-agricultural sector is strong. Liberalising trade in agriculture
would lead to higher growth in the sector as well as in the economy. It is also seen that
the indirect impact of policies like devaluation is stronger than the direct impact of
liberalising agriculture per se. The impact of liberalisation on the prices of agricultural
commodities seemed to be varied . .r is claimed that the prices of commodities which
have positive protection rates in reference run are reduced with liberalisation and prices
in sectors which have negative protection are increased. Since India has already
completed a decade of economic refonns, it would be interesting to observe as to how
trade in agriculture and other macro economic variables are showing the growth pattern
and the linkages among them are established in the refonn period are seen against the
earlier period.
1.4 Objectives of the Study /
1. To review the trade policies of India, specifically relating to trade in agriculture
and examine the nature and extent of liberalisation in agriculture trade.
2. To critically revIew the methods of measunng protective trade policies in
agriculture and measure the nominai protection for select agnculture commodities
in India for different time periods; to examine the relationship between trade
policies and protection coefficients and the effectiveness of those coefficients in
reflecting trade policies; to observe if changes in trade policies towards
hberalisation in agriculture is reflected on those coefficients; and to examine the
relationship between the scheduled tariffs in agriculture and protection
coefficients and the implications of levying a low unifonn tariff on agricultural
commodities in India.
3. To examine the trends in domestic and world prices, fluctuations in them and the
relationship between the two, of the chosen agricultural commodities.
24

4. To identify the changes in trade pattern in agriculture in the nineties as against
eighties and causes for such changes, if any, and its impact on domestic prices;
and to examine the linkages between agricultural trade and some of the macro
economic variables in India.
1.5 Methodology
For exammmg the policy scenano m trade and the nature and extent of
liberalisation in agricultural trade, we limit the analysis to the major instruments of trade
policies, the changes in licensing or removal of QRs and the changes in tariff rates. Since
many policy changes in trade were introduced from early nineties, the general export
promotion and import liberalisation measures which have an indirect impact on
agricultural trade were dealt briefly. The percentage change of the free items as against
the restricted categories in the ITC HS classification of exports and imports are examined
for agricultural items which is covered in the first 24 chapters. Secondly, we compute the
simple average of tariff rates for all agricultural lines over the time period and observe
the changing trend in them to examine the liberalisation through tariff reduction. The
compatability of India's trade policy with the Agreement on Agriculture is examined
under some of the main clauses of the AoA. The trade polices of major trading partners
of lmiia in the deveioped worid is reviewed to examine the trade strategies adopted by
them, especially for meeting the requirements under the WTO.
To obtain the distortions through trade in agricultural output markets, nominal
protection coefficients are measured for select major traded agricultural items.
Commodities from all groups are chosen, like rice and wheat from cereals, coffee and tea
from baverages, major horticultural items, edible oilseeds and their products, sugar,
cashew, jute, rubber, cotton and tobacco for the period from 1980 to 1999. In analysing
the nominal protection through the coefficients we use the methodology adopted in the
earlier studies (Gulati, Hanson and Pursell, 1989; Gulati, et.al. 1994; Gulati and Kelly,
1999; Datta, et, al. 2000) of obtaining the coefficients through the difference in
25

representative domestic and border prices after making adjustments for freight, domestic
transportation, marketing margins and port clearance charges.
The representative domestic price for the commodities chosen is the Whole Sale
Price (WSP) in the major marketing centre of the largest producing state in India as given
in the Agricultural Prices in India, published by the Ministry of Agriculture, Govt. of
India. The representative reference prices are the leading market prices obtained from the
IM.F Financial Statistical Yearbooks for whichever available or they are the fo.b unit
values obtained from the FAO Trade statistics on the value and quantity of trade. The
treatment of NPC under importable and exportable hypothesis is met by adjusting the
prices to transportation costs. The relevant reference price for an importable commodity
is the landing cost in the domestic port, which includes the prices of the commodity plus
the international freight and the port clearance charges plus domestic transportation and
the traders' margins. In the case of exportable the relevant border price is obtained after
deducting the domestic transportation from the domestic market place to the port from
the fo.b price since these costs would have been incurred for the domestic producer to
make his product exportable. The freight charges are obtained from the FAO trade
yearbooks. Marketing margins are assumed to be five percent of the fo.b value of the
commodity referring to earlier studies. The truck rates and the port clearance charges are
obtained through personai imerviews with the traders and the freight forwarding
agencies. Once the NPCs are obtained, we express them as percentage of world prices to
obtain the Nominal Rates of Protection (NRP).
We then deal with certain issues on measurement of trade policies and the impact
of policies on agricultural commodities in India. Since protection coefficient is a ratio of
domestic and border prices, each of which would depend on large number of factors, it is
essential to examine as to what extent these coefficients reflect the trade policies and to
what extent they are sensitive to policy changes. We attempt answering this by measuring
Nominal Protection Coefficients (NPCs) that are widely used to measure protection in the
output sector, for select agricultural commodities in India and by relating them to their
trade policies and other policies having an impact on trade at a point of time and changes
26
in them over a period of time. At the same time we examine the impact of liberalisation
on trade in agricultural commodities reflecting on the protection coefficients.
It is mentioned earlier that though agriculture was sidelined during the reforms in
the early nineties, reforms in other sectors like monetary or exchange rate have positive
impact on trade in agriculture, which lead to changes in agricultural prices
(Subramaniam, 1993, Parikh, et ai., 1995, Mishra and Rao, 2003). It is thus believed that,
with liberalisation there is a tendency for the domestic prices to move towards the world
prices. 'The prices of commodities which have positive protection rates in the pre
liberalisation period are reduced with Iiberalisation and prices of those commodities
which have negative protection or disprotection are increased" (Parikh, et ai., 1995, p.
21). In addition, there are quite a few cases of changes in trade policies since the mid
nineties, which are expected to have a direct impact on trade in agriculture. We first
observe whether the changes in the policies pertaining to trade in agriculture directly or
indirectly are felt on the quantity of trade in agriculture and then examine the sensitivity
of protection coefficients to those policies which have had positive impact on agricultural
trade.
The next objective deals with the protection to agriculture commodities through
the tariff rates. Here we try to examme If there was any scientific criterion in fixing of
tariff rates, and whether the tariffs in agriculture were sensitive to prices of agricultural
commoditics. We then discuss in detail as to what are the recommendations of the
Working Group on Tariffs (2001) appointed by the Government of India to reform the
tariff structure in India and whether a uniform tariff is preferred over a non- uniform
tariff for the Indian economy. To examine the implications of levying a uniform tariff for
India and its implications for Indian agricultural commodities we compare the desired
rates of protection seen through the effective protection coefficients with a 20 percent
effective tari ff.
The changes in the trade pattern in agriculture is examined through the changes in
the commodity composition of exports and imports in the two decades of eighties and the
27

nineties and the growth rates in major traded agricultural commodities of India for those
periods. The causes for changes in the trade pattern is observed through the elasticities of
exports and imports of agricultural commodities with respect to three important variables
linked to trade, i.e., domestic production, the domestic and world prices and world
imports representing the world demand in the case of exports and domestic production
and relative prices in the case of imports. We also make a disaggregated analysis by
comparison of growth rates in trade with the related variables of select commodities.
It is also seen earlier that, world pnces of agricultural commodities are more
fluctuating than domestic prices in India and hence with the opening up of trade the
volatility of world prices would be transmitted to domestic prices (Nayyar and Sen,
1994). We examine whether this argument holds good to most of the traded agricultural
commodities in India when prices are adjusted for the exchange rate, inflation and time
series properties. We also examine whether the control of trade has led to larger
fluctuations in trade and therefore, less fluctuation in prices as seen against the
commodities, which are freely traded. Here, we classify the chosen major traded
agricultural commodities in India into two groups. One set of commodities are the food
or the basic items like rice, wheat, sugar, edible oils, etc which are largely controlled by
the government. The other set of commodities are commercial crops like cashew, coffee,
tea, spices, rubber, tobacco, etc the trade of which is reiativeiy free. Here we make an
attempt to examine the stability in domestic and world prices and the relationship
betwccn world prices and domestic prices. The world prices are converted from dollar to
rupee terms with the real exchange rates obtained from RBI yearbooks. The domestic and
world price series are def1ated using the Wholesale Price Indices with 1990 base obtained
from International Financial Statistics published by the lJ'vlF. To take care of the time
series nature of the data we obtain the residuals of the series through the following
equation:
DP,=a. + ~t+ lI,
WP, = a. I + ~ II + v I
28
Where,
DP, = Domestic price of the chosen commodity
WP t = World price of the chosen commodity
t = time period
The error terms Ut and Vt are obtained through the difference in the actual and
estimated DPs and WPs. The stabilitylinstability in the domestic and world prices are
obtained through the coefficient of variations in the absolute Ut and Vt.
The relationship between the world price and domestic price is examined through
u, =y 0 +y\v,+z,
Where, Ut is the error term of the domestic prices and Vt is the error term of world prices.
The relationship between external trade and growth has been largely established
in the theoretical and empirical literature in international trade. Similarly, given the
nature of macroeconomic variables one can try to examine the linkages between trade in
agriculture and some of the important variables like trade balance, terms of trade, and
level of prices. The study however, limits the analysis to the comparison of trends and
growth rates of those variables.
1.6 Limitations of the Study
The study in the process is faced by both methodological and data constraints.
The studies analysing the impact of liberalisation on sectors and the economics rely
largely on analytical models, which may be partial or general in nature. Such studies are
highly time and resource consuming. This study depends largely on a disaggregate
analysis which are static in nature, choosing only those variables that are closely related
to trade in agriculture, thus neglecting the general equilibrium and dynamic effects in the
economy.
29

Trade policies pertaining to agriculture may be in varied forms. There are
different types of tariff and non-tariff barriers in India and faced by India, due to both
domestic and external policies affecting trade in agriculture. For looking into changes in
policies pertaining to agricultural commodities we consider the most prominent policy
change, i.e the shifting of commodities to the OGL under the ITC HS Classification of
exports and imports. Other technical barriers or the policies effecting trade in agriculture
in India due to policy changes in other trading partners of India are discussed in a limited
manner due to the vastness of the topic.
The study also faces certain constraints on data in the measurement of protection
to agriculture commodities. The data on prices of agriculture commodities are a
limitation due to the fact that commodities are not perfectly homogenous though
approximately adjusted to the quality. Similarly, in choosing the world reference price we
choose the price of one country with which India's trade is the largest if India has been
consistently trading, if not the price prevailing in the largest exporting country of the
world is chosen. However, India has been trading with many countries of the world,
which are not taken into consideration. Similarly, in computing the protection through
tari ff rates, we take into account the standard rates as given in the tariff schedule
published after the yearly budget. However. the rates can be subject to alteration from
time to time and some commodities can also be subject to exemptions for certain period
of time, which is difficult to be accounted.
30
Chapter II
Trade Policy and Liberalisation of Agricultural Trade in India
2.1 Introduction
In the context of liberalisation policies, trade liberalisation assumes a special
significance. This has heralded a basic policy change in the Indian economy from a
protectionist to more liberal trading policies. It was observed that no systematic analysis
has been attempted for agriculture sector separately. This provokes need for such an
analysis. Here, we analyse the nature of trade liberalisation in India, in general and more
specifically, trade in agriculture through review of policies with the reforms in early
nineties. The review of policies also acts as a background in analysing the implications/
likely implications of reforms for the sector and the economy in general.
The scenario of liberalisation needs to be analysed under three heads, through
general and agriculture specific export promotion and import liberalisation measures,
changes in licensing of agricultural exports and imports for major traded agricultural
commodities and changes in tariff rates on those commodities. The changes in licensing
is observed through the transfer of commodities from restricted licensing list to that of
Open General License list as stated in the ITC HS Classification of Exports and Imports.
We compute the simple average of tariff rates for all agricultural lines over the time
period and observe the changing trend. The compatibility of India's trade policy with the
Agreement on Agriculture under certain important clauses is also examined. The trade
policies of major trading partners of India in the developed world are reviewed to
examine the barriers India is facing for its export markets.
31

2.2 An Overview of Phases of Trade Policy in India
Trade Policy in India has evolved through different phases with long-term
structural adjustment programs and short-term measures combating transitional crisis.
The period of fifties witnessed quantitative restrictions on imports and exports of large
number of commodities; in the second phase in the sixties export subsidisation was
introduced for export promotion continuing the quantitative restrictions on imports; and
the third phase from late eighties witnessed both import liberalisation and export
promotion with greater intensity.
Trade policy scenario during early fifties, with initiation of planning, witnessed
quantitative restrictions on large number of commodities mainly to combat balance of
payments crisis due to heavy industrialisation. The objective was that of inducing growth
through import substitution, which was expected, would then promote exports. This,
however, led to heavy taxation for exports. Therefore, to offset the negative effects the
QR regime was imposing on exports, export subsidisation was introduced in early sixties.
The Rupee was devalued by 57.5 percent in 1966 along with other set of measures
relating to liberalisation. It was soon realised that export promotion with high import
restrictions, was no more effective. But the successive droughts and prevailing political
probkrns abandoned the hesiram step towards iiberaiisation. Import premia rose, and
export subsidy was reinstated and augmented. The economy faced severe exogenous
shocks; the Bangladesh war in 1971, collapsing of the Bretton Woods fixed exchange rate
regime and the oil shock of 1973. In this period import policy became increasingly
restrictive and complex. A revival of export promotional measures which started gaining
momentum in the late seventies resulted in three official committees to look into the
various aspects of trade policy, the Alexander Committee (1978), Dagli Committee
(1979) and Tandon Committee (1980) (Sen, 2000). The recommcndations offered by
these three official committees were incorporatcd in the subsequent long-term import and
export policy of 1985-86 to 1990-91. During March 1990, there were some changes in
this EXIM policy framework due to changes in political regimes. But the general theme
of liberalisation of imports, especially of capital goods and raw materials, continued to be
32

one of the components. Export encouragement on one side and import relaxation on the
other formed the main theme of policy changes. Further, the trade policy that was earlier
characterised only by short-term policies to combat exigencies was turned into a long
term consistent policy (Deshpande and Thippaiah, 2000).
2_3 Export Promotion and Import Liberalisation Measures
From the review of trade policies we see that a senous move towards
liberalisation of trade in India began in late eighties with incorporations of
recommendations of the three official committees. Many steps were introduced to
promote exports. More important among these were budgetary concessions covering
import licenses, input prices, freight credit for working capital, direct cash assistance to
exporters and lastly the duty drawbacks which exempted the exporting units from the
payment of indirect taxes. While these measures can be described as direct methods to
promote exports, there were also other indirect measures like the exemption from MRTP
licensing or the industrial licensing to export units. Among other policy measures,
devaluation of rupee, reduction in cash margins of imports, introduction of EXIM Scrips,
Export Promotion Capital Goods Scheme (EPCG), Special Import License Scheme,
relaxation in export control marked important steps.
In case of imports, Long Term Import Export (L TMX) policy measures from
early nineties sought to liberalise on a priority basis imports of capital goods and raw
materials by shifting these to OGL list and also through tariff reduction. With gradual
dismantling of import barriers, the emphasis on export promotion during the nineties
received relatively a greater attention than in earlier L TMX announcements.
Nevertheless, for imports, trade policy in India has also been subject to short run
adjustments to combat critical external payments situation. Measures to tackle foreign
exchange crisis included cut in the value of free foreign exchange component of
supplementary licenses issued to major industries, charging of higher cash margins and
higher interest rates for financing imports of capital goods. Special import licenses,
permitting imports from restricted list and of 18 selected durables from the negative list,
33
were allowed to certain categories of privileged export houses. Moves to strengthen
liberalisation measures in economy were marked in budget of 1992-93 which introduced
simplification of import licensing procedures by scrapping multiple list of imports
including those of limited permissible. Customs duties were slashed in 1993-94, which
reduced the peak average duty from lID percent to 85 percent. Pressures from both
domestic and external sources have initiated the short run deviations form the LTMX
policy of 1992-97. Thus indigenous inputs were excluded from the computation of value
addition for export obligations of the EOUs/EPZs units, a step devised to encourage the
use of indigenous inputs by the latter. Later in June 1993, countervailing duties were
imposed on a range of products, on the grounds that it would create a level playing field
for both the importer and the domestic manufacturer of such goods (Sen and Das, 1992).
The conclusion of Uruguay Round of GATT in 1994 leading to WTO forced
extensive liberalisation of trade in goods and services. Export promotion became
inevitable with anticipation of forced import liberalisation. Export Processing Zones were
created. Removal of quantitative restrictions in three consecutive years from 1999
covered large number of items including from agriculture sector thus forcing in for
liberalisation through easing of licensing system. Promotion of agricultural exports also
took a centre stage.
Thus, on analysing policies towards the trade sector in India one can notice
certain tendencies in earlier phases of liberalisation. Import liberalisation was highly
inclined to export promotion leading to bias in liberalisation of certain items only.
Liberalisation planned through long-term measures had short run deviations to tackle the
foreign exchange crises. Liberalisation in early nineties was sector and commodity
specific moving from capital goods to industrialised consumer goods, sidelining the
agricultural sector unlike in later nineties when liberalisation was a force from the WTO
to a larger extent leading towards more comprehensive liberalisation measures.
34

2.4 Liberalisation of Agricultural Trade
The peculiarities associated with agricultural sector kept the policy makers away
from liberalising agricultural sector equitable to that of other sectors. In the earlier phase
of liberalisation i.e., shifting of commodities to OGL, agriculture commodities had hardly
appeared in the list. The policy of extension of Exim Scrips to agriculture in 1991
included only traditional agricultural export items. For agriculture specifically, some
notable liberalisation attempts were made from mid nineties. The policies were more
targeted towards agricultural sector only since the 1999 exim policy.
The granting of EOU status to units in agriculture and allied products in 1992-97
exim policy, decanalisation, shifting of commodities from restricted, prohibited lists to
free list at different phases especially from 1994, etc are prominent ones to mention
specifically for agricultural commodities. The amendments of Exim policy made during
April 200 I gave importance to agricultural sector through creation of Agricultural Export
zones wherein the state governments could identifY product specific zones. The Exim
Policy Schemes like Duty Exemption Scheme and Export Promotion Capital Goods
Scheme were being made applicable to the agricultural sector. Import duties on capital
goods to be used in agriculture were lowered and credit availability for exports was
illl;n::alit:u. Tht: measures liberalizing expons included reduction in products subject to
state-trading, relaxation of export quotas, and the abolition of Minimum Export Prices
(MEPs). Income tax exemptions for profits from agricultural exports were provided.
The EXIM Policy 2002-07, has given more importance to agriculture, especially
for exports. With sluggish growth in exports and rising imports, liberalisation of
agricultural exports was an inevitable outcome. Export restrictions like registration and
packaging requirements were removed on butter, pulses, wheat and wheat products,
groundnut oil, cashew and coarse grains. Restrictions on export of all cultivated varieties
of seed, except jute and onion were also removed. The creation of agricultural export
zones which was initiated earlier was modulated and 20 agricultural export zones were
notified covering many exportable items. For the identified potential sectors, indicative
35
,eR~R'I'. '3~NI:ALORE ,SECL _ Ib ... __ --
,<:c. No_T1:L---· 3 . 8 . (IS

sector wise strategies were laid down based on detailed strategy paper by Export
Promotion Councils, Commodity Boards and other Industry associations. The policy
empowered state governments with new schemes like ASIDE (Assistance to States for
Infrastructure Development and Exports) and State Level Export Promotion Committee
(SLEPC). Thus, importance towards agriculture has been increasing with recent exim
polices. The growing concern for infrastructure and entrusting of powers to state
governments in decision making on issues relating to external trade is a positive step
towards development of agricultural trade sector in India (The detailed list of liberalised
Trade policy measures from 1991 is given in Appendix Table A2.1).
2.4.1 Changes in Quantitative Restrictions on Agricultural Imports and Exports
Most of the restrictions on trade in agricultural commodities in India till recently
have been through imposition of Quantitative Restrictions (QRs). There were some
instances of removal of QRs on agricultural commodities as a part of reform process
starting form early nineties. It was done only on a few commodities to begin with. But it
turned out to be obligatory with WTO panel's ruling that India should remove QRs before
March 2001 on those set of commodities on which the QRs were retained as protection
towards consumer goods.
The stages in the removal of QRs is examined through reviewing policy status of
commodities in ITC HS Classification of Exports and Imports of various years published
by the Ministry of Commerce. The ITC HS classification has four broad lists classified
on the basis of status of licensing of agricultural commodities; the prohibited list, the
restricted list, the canalised list and the free list. The changes in the licensing for
agricultural commodities from mid nineties show that most of the agricultural
commodities were put under the free list in recent exim policy amendments. The
percentage of free items had increased from 22 percent in 1995-96 to 58 percent in 2000
and further to 75 percent in April 2002 (Table 2.1). In case of licensing of imports
majority of commodities were freed in the years 2000 and 2001 as per the obligations
under the WTO. Quantitative restrictions on 416 agricu ltural goods at HS six-digit level
36

have been removed in order to implement a WTO panel decision. The authorities noted
that in order to protect the interests of farmers, appropriate tariff protection would be
provided. Hence, tariffs were increased in 37.5 percent of the cases in which QRs were
removed. Consequently, government of India undertook several measures to safeguard
against imports. These include restricting the imports of agricultural commodities like
wheat, rice, maize and urea through designated state trading enterprises, issuing import
permits by ministry of agriculture after an import risk analysis based on scientific
principles and in accordance with WTO agreement on Sanitary and Phytosanitary
measures for import of all primary products of plant and animal origin.
Table 2.1: Changes in Licensing of Agricultural Commodities (in %)
Year Free Prohibited Restricted Canalised
1995-96 20 5 65 10
1997-98 27 3 60 10
1998-99 31 3 54 12
2000-01 58 3 37 2
2002-03 75 1 22 2
Nole: Commodities al 6-digit level o/ITC HS classification 0/ Exports and Imports Source: Computed/rom ITC HS Classification a/Exports and imports, (1995, 1997); Goyal, (/998,2000.
2002)
Other than items like live animals, fish, meat of bovine animals, products of
animal origin, live trees and plants which are either prohibited or restricted to health,
hygiene or other reasons most of the agricultural commodities are now freely importable.
Thus, India meets WTO requirement of phasing of QRs on imports other than on some
items where the QRs are maintained through prohibitions or restriction as consumer
goods for health and hygiene. or food security reasons as allowed in the WTO.
37
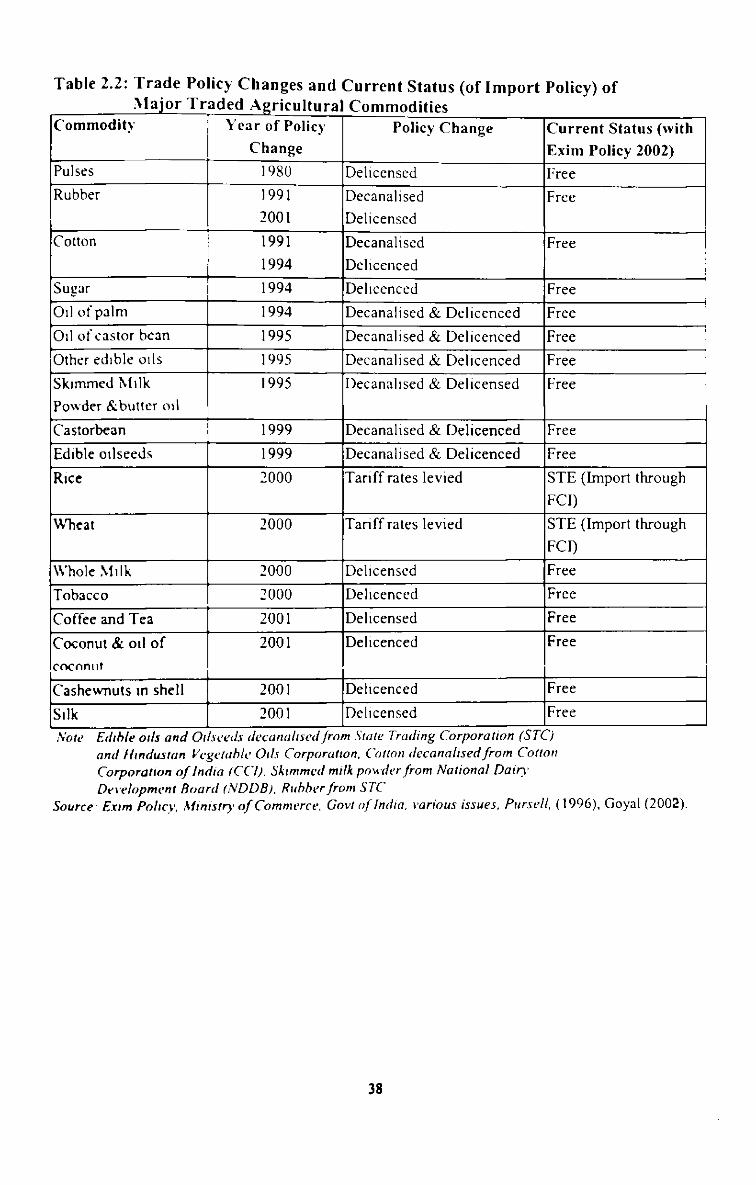
Table 2.2: Trade Policy Changes and Current Status (of Import Policy) of 'I' T d d A . aJor ra e . ,gncultural Commodities
Commodity Yea r of Policy Policy Change Current Status (with Change Exim Policy 2002)
Pulses 1980 Dehccnsed Free Rubber 1991 Decanalised Free
2001 Delieensed
Cotton 1991 Deeanal iscd Free
1994 Dehcenced
Sugar 1994 Deheenced Free
OIl of palm 1994 Decanalised & Deliccnced Free
OIl of castor bean 1995 Decanalised & Delicenced Free
IOther edible oils 1995 Decanalised & Delieeneed Free
Skimmed Milk 1995 Decanalised & Delieensed Free
Powder & butter Oil
Castorbean 1999 Deeanalised & Delicenced Free
Edible ollseeds 1999 Decanalised & Delicenced Free
Rice 2000 Tariff rates levied STE (Import through
FCI)
""'heat 2000 Tariff rates levied STE (Import through
FCI)
Whole \IIIk 2000 Delieensed Free
Tobacco 2000 Dehcenced Free
Coffee and Tea 2001 Dehcensed Free
Coconut & 011 of 2001 Dehcenced Free
coconl!t
Cashewnuts In shell 2001 Dehceneed Free
SIlk 2001 Delicensed Free
No/., Edlhle OIls and O/iI .... d, d"c(/1wits"d fmm ,\/(J/e Tr(J{bng CorporatIOn (STC) and Hindus/on V"gclllhl .. O,/J Corpora/IOn, COltOIl decanollsedfrom COltOIl Corpora/IOn of IndIO (Cel). Skimmed mtlk powder from National Dairy Dn·t'iopment Boord (NDDBi, Ruhher from STC
Source E.nm POlICY, MinIStry of Cornman'. Go,,/ of India . .-arious issues, Pursel/, (1996), Goyal (2002).
38

Table 2.3: Trade Policy Changes and Current Status (of Export Policy) of Major Traded Agricultural Commodities
Commodit)· Year of Policy Change Current Status(with Exim Policy Policy 2002) Chan!(e
Sugar 1991 Decanalisation Free Subject to QR SUbject to QR notified by DGFT
Reg. Cum allocation by APEDA \hlk and Milk 1992 Decanalised Free Products For skimmed milk Quantitative
ceilings as may be notified by the DGFT, RegistratIOn cum allocation from APEDA.
RIce 199 .. MEP on basmati Free abolished Registration with APEDA All common varIety put Under OGL
,Wheat 1994 and Qrs removed on Free 2002 Durum wheat
Qrs and packaging restrictions removed on all varieties of
, wheat Rapeseed 1995 Delicensed Free
5 un flowerseed 1995 Delicensed Free
OIl of 1998 Dehcensed Free castorbean Oil of sovabean 1998 Delicensed Free Oil of 1998 Delieensed Free sunflower OIl of 1998 Delicensed Free Rapeseed OIl of palm 1998 Dcliccnscd Free Groundnut 011 1998, Delieensed, Free
2002 Removal of packagIng restrIctIon
OIl of coconut 199X Delicensed Free Sovabcan 20()2 Deliccnscd Free Castorbcan 2002 Dcllccnscd Free Palm Kernel No change Free Groundnut No change Free Coconut No change Free Cofke No change Free
Regulated hy the Coffee board
39

ITea No change Free
I Regulated by the tea Board
'Cashewnuts No change Free Registration with Cashew Export Ipromotion council.
Raw cotton No change Free Controlled by the textile commissioner on registration, allocation, quantity and quality
Cotton yam No change Free Quantitative ceiling as may be notified by the govt.
Tobacco No change Free Regulated by the Tobacco Board
Onions No change Canalised through NAFED, KAPPEC, MSAMB, etc. Subject to MEP fixed by NAFED.
SpIces No change Free cess of .5% Source. Ex"" Policy. Mmlstry a/Commerce. GOV! o/IndIG. Various Issues. Pursell (1996).
Goyal (200ft)
Tables 2.2 and 2.3 present the trade policy changes and current policy status of
exports and imports of select agricultural commodities in India. Looking into changes in
policy status in some major traded agricultural commodities, notable ones are the
removal of QRs on exports of rice in 1994, decanalisation of sugar and milk in 1991 and
1992. In the later stages freeing of exports of all edible oilseeds in 1995 and edible oils in
1998 were prominent. For imports freeing of edible oils in 1994/95 through decanalising
and delicensing was quite prominent. For imports there were some policy changes in
pulses, sugar, rubber and cotton in the initial stages. Rest of the commodities were
liberalised in the later years with the removal of QRs under the WTO obligations. The
trade policy changes in agricultural commodities and their current status is dealt with
some detail below.
Rice
Exports and imports of rice were restricted through quantitative restrictions till the
mid-nineties. Exports of basmati variety were made totally free since the MEP restriction
was removed in 1994. Until 19')2 exports of common rice were subject to canalisation,
minimum export price and export quotas. Restriction on exports of common variety of
40

rice were somewhat relaxed during 1992 by allowing it for private trade, but the exports
were not significant, as India's export price was not competitive against the world price
(Chand 2002). A major step towards liberalisation of rice occurred in 1994 with the
shifting of this item to OGL. The only restriction that was prevalent was the registration
requirement with APEDA, which was abolished in 2002 exim policy. Imports of this item
were controlled through state trading enterprise. Imports of common varieties with 50
percentage or more broken were allowed freely from 1999. Imports of other varieties of
rice are still under the control of FCI and would require the Phyto Sanitary Certificate
and the Agriculture Permit certificate.
Wheat
Exports of wheat were more restricted compared to that of rice. Exports of durum
variety of wheat were liberalised in 1994. Other varieties of wheat exports were
controlled through minimum export price and the QRs from DGFT from time to time.
But since 1997 export restrictions were to some extent relaxed and exports were allowed
against license but subject to DGFTs QR regulation whenever required. In the import side
wheat imports were restricted through canalisation. In 1999 March, this restriction was
relaxed and imports by roller flourmills for milling purpose were allowed. Now Imports
of wheat directly for consumption continue to be under the state trading enterprise.
Coffee
Coffee is an important item in the export baskct of agricultural commodities in
India. Exports of coffee were never subject to any kind of quota licensing. Imports were
restricted as part of consumer goods restrictions until 2001 as per the WTO agreements.
Import licensing has been lifted from roasted coffee in bulk packaging from 1995.
Exports of coffee are regulated by the Coffee Board in India. There are two separate
auction markets, one for the export of coffee and the other for the domestic coffee, and
they are controlled through the periodic imposition of quantitative cei lings. The effect of
separation of two markets and the allocation of supplies to them has been to keep
domestic coffee prices below export prices (Pursell, 1996).
41

Tea
Tea, like coffee is another major item of export and was traded freely. Imports
were restricted as part of consumer goods restrictions until 2001 as per the WTO
agreements. Tea Board is able to influence exports through its general regulatory powers
over the industry.
Cashew
Exports of cashewnuts from India were free and were promoted by the cashew
Export Promotion Council. Imports of cashewnuts was regulated as a consumer good till
it was freed in 2001 as a part of the removal of QRs for the WTO.
Sligar
Sugar exports in India has been highly controlled through quantitative restrictions.
Exports 0 f sugar were Canalised through FCI till 1991. It was then decanalised but was
restricted through licensing. Now exports of sugar are free. The requirement of
registration cum allocation certificate from APEDA has been abolished since 2002 Exim
policy. Imports of sugar were freed since 1994 with the removal of restricted licensing.
Edihle Oils alld Oi/seeds
Much of the exports from this sector from India are in the form of oi1cakes other
than groundnuts, where there is notable amount of trade in shelled groundnuts. India
imports many edIble oils especially, the oil of palm. Exports of edible oils and oilseed
were canalised through the STC and other parastatal organisation. First measure of
liberalisation came in 1995 when soyabean and rapeseed were liberalised by removing
the quantitative ceilings on them. Export control on other seeds continued till 2002.
Imports were restricted for a longer time till they were liberalised in 1999 with other set
of commodities as per the WTO requirements. The exports of oi1cakes were free though
there were some restrictions through registration for export contracts. This was abolished
in 1995. The edible oil exports were freed in 1998. There was some control over
groundnut oil exports. Exports were not allowed in packages above five kgs. This was
42

also relaxed in 2002 exim policy. Imports of edible oils were canalised through the STC
throughout the 1980s (Pursell 1996). In march 1994, palmolin oil was moved to OGL and
in 1995 followed by other edible oils other than RBD palm and coconut oil. Coconut oil
imports were freed in 2001.
Onion
Onion is highly restricted in terms of its export policy. Exports of onions are
canalised through many agencies like NAFED, KAPPEC, etc. Imports were under the
restricted list but was freed in 200 I.
Potato
Exports of potato were in the free list but timely ceilings prevailed from the
DGFT. Potato imports continue to be restricted as consumer goods. QRs on this was not
lifted along with the removal ofQRs on other commodities as per the WTO obligation.
Spices
Spice exports are free other than the cess of five percent. Imports of spices were
banned as part of general ban on consumer goods imports. This restriction was removed
ginger and some other spices.
RlIbber
Rubber being an importable item, the imports were canalised and exports were
free. But there has been no considerable exports of rubber since domestic prices were
above the world prices inspite of being free in terms of its exports. Before 1991 rubber
imports were canalised by State Trading Corporation (STC). As part of 1991 reforms
STC's import monopoly was abolished but imports by the private sector were subject to
licensing.
43

Colton
Cotton export is traditionally subject to quotas announced by the commissioner of
textiles. Since these quotas were misused there were attempts made to abolish them but
were not materialised (Pursell, 1996). These quotas were to vary with the cotton harvest
but they were a small percentage of total production. Before 1991 cotton import was
canalised by the Cotton Corporation of India (CCI). CCI's import monopoly was
abolished during the 1991 refonns but import was subject to licensing. In 1994 however,
cotton imports were freed from licensing. Cotton has been a competing item of Indian
agricultural exports. It has remained below unity for almost all the years.
Jute
Exports of jute and jute products are free from any restrictions. One major jute
product (Carpet backing) was subject to export <;ontrols which was abolished in 1991
(Pursell, 1996). Before 1991 jute import was canalised by the Jute Corporation of India.
The 1991192 refonn package removed this import monopoly but import could only be
made with an Eximscrip license. In 1992 this restriction was also removed.
Tobacco
The expon of flue cured virginia tobacco, the iargest grown and exported vanety
of tobacco in India was subject to minimum export prices set by the Tobacco Board. In
addition, it is possible that exports may be constrained indirectly by some of the Tobacco
Board's regulatory activities like that of annual production targets, the supervision of
tobacco auction system and the registration of exporters. The restriction on the import of
tobacco was removed in the year 2000 as per the WTO requirement.
The review of export and import policies shows that most of the major traded
agricultural commodities are now freed in tenns of licensing. But the Secretary Report of
India's Trade Policy Review by the WTO (2002) shows that inspite of many liberalisation
measures India's agricultural exports face several constraints that arise from con flicting
domestic policies relating to production, storage, distribution, food security, and pricing
44

concerns. There is lack of adequate post-harvest infrastructure like refrigerated transport,
storage, and packaging, and of adequate facilities at airports, seaports, etc. In addition
exports of agricultural goods as compared to their import policies are more adhoc in
nature. The Ministry of Commerce, through the Director General of Foreign Trade,
notifies the imposition or elimination of these restrictions when pertinent (which can be
changed several times in a year). These measures are put in place (or removed) with a
view to maximise agricultural export earnings, while ensuring an adequate supply of
essential commodities (particularly for mass consumption) to the domestic consumers at
reasonable prices.
2.4.2 Changes in Tariff Rates on Agriculture
Liberalisation policies, as mentioned earlier, are examined through the changes in
non-tariff and tariff barriers. For examining the changes in the tariffs for agricultural
sector, simple average unweighted tariffs for the agricultural sector as a whole covering
the first 24 chapters under the ITC HS classification for the years 1986, 1992, 1996, 2000
and 2002 is calculated. The tariff rates under the tariff schedule consists of the basic duty
levied under the statutory provisions for the sake of protection of domestic industry,
auxiliary duty which was existing till the year 1993 collected for revenue purpose,
pft[eftiltial alta Juty fur preferential areas, ihe additional duties for offsetIing (he excise
duties levied on similar products produced within the country and the special additional
duty which is equal to the sales tax inside the country. The simple averages of the tariff
rates at the 6-digit level are taken into account. Basic and auxiliary duties are considered
for the years 1986 and 1992. There were no auxiliary duties for the years 1996, 2000 and
2002. However, a surcharge of 10 percent of the basic duty was existing in the period
2000.
Table 2.4 shows that there has been a drastic reduction in the tariff rates for
agricultural commodities in the year 1996, which was slightly raised in the year 2000 and
again reduced in the year 2002. In the AoA in the WTO 1986-88 has been the base year
for calculation for the reduction in tariffs after converting the non-tari ff barriers into the
45

tariffs to the extent of 24 percent in 10 years. Looking Into the scheduled customs tanffs
the basic and the auxiliary rates have not differed for the years 1986. 1987 and 1988.
Hence the average remains the same for these years. Anyhow consIdering only the tan ff
rates the reduction has been much more than required in the WTO. Taking 1986 as the
base. there has been a 22 percent reduction taking the year 1992. 77 percent in 1996. 70
percent in 2000 and 74 percent in 2002. There has also been a reduction in the maximum
tariff for sensitive items. Anyhow in the process of tariftication the non-tanff barriers are
to be first converted into tariffs and then reduced by 24 percent. The process of
conversion of non-tariff barriers to that of tariffs are to be done through the representatIve
domestic and world price differences. The study conducted earlier by Gulati. et al (199~)
shows that the product specific support calculated through the price differences is
negative, hence our reduction in the scheduled tari ffs has been much more than required
even if India would have committed to the tarriffication program of tari ff reduction.
Table 2.4: Avera!!:e Tariff on Agricultural Commodities (in %) Year 1986 1992 1996 2000 2002
Basic + Basic + Basic Basic + Basic auxiliary auxiliary duty surcharge duty duty duty on basic
duty of 10%
Simple average 148.58 114.73 37.2 43.72 37.43 (unweighted) Peak Tariff 150 115 50 38.5 30 :--Jotc: • Tariffs (standard and auxiliary) are considered for commodities at 6 dIgit level • The auxiliary duty lVas at 50% of the value of the commodity in the years 1986 and 1992. • Auxiliary duty was not existent in the year 1996, 2000 and 2002. There was a surcharge on baSIC duty
for the year 2000 at 10% of the baSIC duty. Source: Directorate of Publications. Customs and Central Excise, New Delhi ( J 986.
1992, 1996), Goyal Anm (2000. 20(2).
As a result of additional bindings taken by India in the WTO. share of tariff lines
that are bound has increased to 72 percent, new bindings were made primarily in textiles
and clothing; India also renegotiated bindings in some of the agricultural items. The
average (final) bound rate is 50.6 percent. higher than the applied MFN rate: this gap
provided ample scope for applied rates to be raised recently on a few agricultural
products. Tariffs on agricultural products are ad m/orem with two exceptions. and range
46

from 0-210 percent, with the highest tariffs (i.e. tariffs above 50%) borne by beverages
and spirits, oil seeds, fats, edible oils and their products, and grains.
2.4.2.1 Reforms in Tariff Policy in India
Hitherto, tariffs in Agriculture in India played an insignificant role with the
existence of quantitative restrictions. Most of the tariff lines in agriculture were subject to
either prohibition, restriction through quota licensing or canalisation of commodities.
Nevertheless, imports of agricultural commodities in India were subject to three types of
customs tariffs, the basic duty, the additional duty and the special additional duty.
Anyhow, of the three, the basic duty constituted the protective part of the duty. Since the
basic duty was a statutory rate and could not be altered easily, the government was
empowered with the authority to exempt or alter. the basic duty through a notification
issued under the section 25 of the Customs Tariff Act of 1962. But the basic duty as
appearing in the tariff schedule is not the actual rates applicable. The study by Gang and
Pandey (1998) shows the week link between the scheduled and the actual tariff by
comparing the scheduled rate to that of the collection rate or the realised rate. This is
mainly due to the periodic exemptions granted from time to time by the government,
leading to the problem of accounting the actual rates applicable to imported items. In
addilion 1O lhis, lhe protection that shouid be extended to agncultural commodities in the
absence of quantitative restrictions would be different than in its presence. The basis of
fixation of the tariffs under such conditions has been highly debated. In this context, we
discuss briefly the Tariff policy in India and the recent developments that are taking place
to revive the stmcture of Customs Tariff in India.
2.4.2.2 A Brief Review of the Tariff Policy in India
Desai, (1970) examInes the history of tariff policy and the process of tariff
fixation in India through an examination of thc working of the Indian Tariff Boards and
the Tariff Commission. The study concludes that there was an inadequate formulation of
the economic criteria for determining whether protection should be granted or continued
47

and also what the level and duration of that protection should be. The study examines that
the reduction of the commission to virtually a routine, cost calculating body was
inevitable especially in the light of the fact that the whole range of industries could get
automatic protection ITom QRs which were worked out on the principle of indigenous
availability under which no imports were allowed as along as there was indigenous
output, regardless of costs.
The history of Tariff policy in India dates back to the Report of the First Indian
Fiscal Commission in 1921-22. Until 1916, the motivation of customs duties in India was
raising of revenue. The purpose of First Fiscal Commission inquiry in 1921-22 was to set
out explicitly the outlines of scheme of protection for the industrial development of the
country. Anyhow the commission made an emphatic distinction between revenue duties
and protective duties- a distinction which persists, .to this date in the recommendations of
the Indian Tariff Commission. The scheme of protection served as the basis of fifty-one
inquiries conducted by the Indian Tariff Boards during 1923-39. In effect, they resulted
in varying degrees of protection to the iron and steel, cotton textiles, sugar, paper,
matches, salt, sericulture, magnesium chloride and gold thread industries. In assessing the
application of protective tariffs during the inter-war period, the report of the Fiscal
Commission (1949-50) states that these were restricted to well established industries and
even in the case of these mc1ustnes, the tnple tormula as a rule was rigidly interpreted.
Anyhow, in the later years it was seen that the trend was towards less rigor. Before
recommending protection to an industry, the tariff Boards during 1946-50 were required
to ensure that the industry is established and conducted on sound lines and that the
industry is able to compete with a desirable period of time. Beginning ITom 1952, the
Indian Tariff Commission has followed the set of criteria further reformulated by the
second fiscal commission.
I. Defence and other strategic industries should be established and maintained whatever
the cost.
2. The tari ff Commission will merely decide the form, magnitude and conditions of
protection in the case of "key and basic industries" included in the plans; and the fact
48

of their inclusion in the plans automatically qualifies them from protection and other
forms of assistance
3. The remaining industries should be considered for protection on the basis of the
following considerations.
a. the industry will develop sufficiently over a period of time and will successfully carry
without protection
b. The probable cost of such protection or assistance to the community is not excessive.
2.4.2.3 Principles Governing the Fixation of Tariff Rate
The procedure for determining the magnitude of protective tariffs consisted in
computing the difference between the foreign price and the comparable domestic price of
similar items for the period over which the recommended tariffs are supposed to last.
Anyhow, choosing the representative c.i.f. price and the domestic price has been tricky.
The methods followed by the tariff commission in recommending the protective tariffs
are:
I. The Commission tries to estimate the fair selling price of the item under consideration
for the period during which protection would be operative. For this purpose it picks
up a representative units or units, the probable costs of which would serve as a basis
of cosling the items to be protected.
2. In estimating the probable costs, the Commission almost always tries to guess the
future scale of operation of the unit, the assumption being that the average cost will
vary with the variation in the scale. The Commission also shows some awareness of
possible variations in average cost resulting from increased efficiency due to
assimilation of better techniques or skills, or saving of raw matcrials, etc.
3. When the expansion plan of the representative unit or units cannot be foreseen, the
commission proceeds on the basis of the actual costs of the unit or units. If the cost
data are not available. the commission builds up its own cost estimates.
4. The cost estimates are adj usted for anticipated changes in the material and wage costs
and other charges such as repairs and maintenance as we" as fuel, power and packing
charges.
49

5. In most cases, the cost estimates are adjusted upwards by further additions of
allowances on account of consumer prejudice against the local product, unforeseen
contingencies, etc.
6. Finally, the estimate of fair selling price is arrived at by allowing a suitable rate of
profit,
7. The price thus estimated must be made comparable to the selling pnce of the
competing import item. Quite often this implies supplementary additions of transport
costs and special distribution charges, and
8. In making its final recommendations of the quantum of protection, the commission
recommendcd special assistance measures or a suitable alternative to protective tariff.
As far as the duration of protection is concerned, in the absence of any definite
criterion, the inter-war tariff boards recommended protection for periods varying from 3
to 15 years. Further the period since 1952 during which the tariff commission has been
operative is increasingly characterised by planned industrial allocations of both capacity
and inputs so that the role of the tariff commission itself in determining the initiation or
economic survival of any industry has become steadily irrelevant. Since 1957,
quantitative restrictions are used increasingly to bloster the planned industrial allocations;
the latter, in tum are determined by bodies other than the Tariff commission (such as the
Plaru-,ing Coulmission and the several interdcpartulental C0111lllittees-- overseeing
licensing). Thus, the tariff commission was reduced to a position in which few industries
care to apply for protection. However, with the initiation of planned industrial growth in
1951 and increasingly rigid import control in 1957 the Indian Tariff Commission was left
with very little initiative in the implementation of its functions.
Of latc an autonomous Tariff Commission under the Department of Industrial
Policy and Promotion in the Ministry of Industry (at present part of the Ministry of
Commerce and Industry) was created in 1997 and subsequently reformed. The role of the
Commission is to advise the govcrnment regarding tariffs and all tariff-related issues,
taking into account the interest of various sectors including producers, traders, and
consumers as well as India's international commitments. Moreover, from time to time, ,
50

the Government appoints independent ad hoc groups to advise it on trade and trade
related policies (WTO, 2002).
2.4.2.4 Recommendations of the Working Group on Tariffs (2001)
With the new trade regime under the WTO, the government of India felt the need
to revise the tariff rates. The Working Group on the Customs Tariffs (2001) was thus
appointed to revise the structure of customs tari ff. The report comes out with the
following recommendations; the tariffs are to be fixed on the basis of effective protection
rather than the nominal protection. It considered the role of exchange rate and non
tradable services in determining the overall protection. It recommended for a low uniform
rate of duty on all commodities and the deletion of all exemptions, so that it solves the
administrative difficulties and the problem of negative protection. (This is discussed in
detail in the next chapter).
2.5 Compatibility of India's Agricultural Trade Policy to the AoA vis-a-vis the Policies of some Major Trade Partners of India
For looking into the compatibility ofIndia's Trade policy with the Agreement on
Agriculture (AoA) in the WTO we consider the main clauses of AoA, the Market Access
Domestic Support and Export Subsidies with a special reference to the Market Access
Clause since many policy changes in India have be introduced in this area. Tariffication,
tariff reduction and provision of market opportunities are the main provisions under the
Market Access. Non-tariff barriers are to be converted into tariffs. The new tariffs
resulting from 'tariffication' and the applied tariffs are to be brought down to reasonable
levels with the process starting in 1995. The developed countries were to cut their
agricultural tariffs by an average of 36 percent over 6 years while developing countries
are committed to reduce by 24 percent in 10 years. The rules also require that tariff on a
particular product be cut at least by 15 percent by developed countries and 10 percent by
developing countries. The agreement also requires the members to provide current access
of 3 percent of domestic consumption and to establish a minimum tariff quota where
current access is less than 3 percent. Expecting the possibility of high bound rates, which
51

would prohibit trade, minimum access facilitating through the tariff rate quota was
maintained. Nevertheless, there are certain exceptions provided under the Market access
clause like the possibility of taking special safeguard action, and provisions that allow
"special treatment" for certain products. Under special safeguard provisions, a WTO
member can impose additional duty in excess of that committed in its national schedule
on the imports of an agricultural product which is designed in its schedule with the
symbol "SSG" and whose volume of imports during any year exceeds a trigger level. The
third type of protection is available only for a primary agricultural product which is the
predominant staple in the traditional diet of a developing country member. Under the
Domestic Support Clause members are to reduce their total support seen through the
Aggregate Measurement of Support by 30 percent (for developed countries) and 14
percent (for developing countries) with the base period 1986-88 within 10 years and 6
years respectively. Similalry, under Export subsidies the developed and developing
countries are to reduce the export subsidies by 36 percent and 24 percent and the
subsidised exports by 21 percent and 14 percent respectively.
In the Uruguay Round, India has agreed to make adjustment in tariff rates for
3373 commodities I Commodity groups at 6 digit HS level. In case of agriculture though
India did not commit for the tarrification program of reducing the tariff rates, India
committed for binding of (,7) lines under AoA at 6 digit of HS Classification. A large
number of committed lines belong to Commodity groups like edible vegetables, animal
or vegetable fats or oi Is; meat and edible meat, etc. (Gulati, et.al, 1999). In the case of
:V1FN tariff rates, the rcduction in tariffs has been a part of the internal reforms program
than to meet the WTO requirements. India has bound 81 percent of the agricultural tariff
lines at three levels, 100 percent for primary products, ISO for processcd products and
300 percent for edible oils. In most of the cases the existing tariff rates are much lower
than bound rates. A study conducted by Gulati, et.al (1999) out of 673 commodities
analysed falling under agriculture and allied, taking 1999 MFN Tariff rates, the
difference between the UR and MFN rate was 50 percent and above, for 82.6 percent of
commodities numbcnng 556.
52

Domestic support in India continues to be provided mainly through support prices
for final goods, and input subsidies mainly for fertiliser, water, electricity and credit. In
the 1986-88 base period for the determination of commitments under the Agreement on
Agriculture, India's Aggregate Measure of Support (AMS) was below the 10 percent de
minimus level. Therefore, India has no total AMS reduction commitmcnt under the
Agreement. India is only required to make regular annual notifications to the WTO on its
domestic AMS, and on its direct export subsidies. India's current trade policy status, the
possible threats from the trading partners in the world and the issues that would crop up
in further negotiations on Agriculture are explained briefly in Table 2.5 below.
Table 2.5: India's Current Status, Possible Threats and Likely Issues for Further Negotiations on Agriculture m the WTO
Clauses Requirements India's Status Possible threats and
likely Issues during
further negotiations
Market Access Convert non-tariff Tarrification was not Though India has
barriers into tariffs and applicable to India since substantially reduced
then reduce tariff by agricultural products tariff rates on
36% simple average for were covered under agriculture, tariff rate in
developed countries and QRs. Only ceiling India IS one of the
24% for developing bindings were to be highest in the world.
'.':ith J ~ubrr.itted.
ITUmmum reductIOn of Since tariffs are most
15% and 10% for each India has bound almost transparent of trade
tariff hne respectively. all the agricultural items policies, India would
at dIfferent levels. have pressure from
Allow for a 5% tariff trading partners to
rate quota with reduced Agricultural tariffs are reduce the MFN and
rates. reduced substantially as bound tariffs in the near
a part of Internal future.
reforms and not due to
WTO Comrmtment.
Since India has not gone
for tarri fication
program, prOVISions
53

Domestic Support
Export Subsidies
under the
safeguards
Special
cannot be
used and hence will
have to provide
minimum access for all
commodities if required.
Tariff Rate quotas for
some commodities are
under negotiations.
Reduce Aggregate In the 1986-88 base Enough scope to provide
Measure of Support by periods for domestic support in any
30% and 14% from the determination of
base period (1986-88)· commitments under the
form to agriculture.
There are no possible
threats to reduce the within 10 and 6 years Agreement
respectively. Agriculture,
on
India's current level of
Reduce export subsidies
by 36% and 24% and
Aggregate Measurement subsidies granted to
of Support (AMS) for agriculture.
each product was below
the 10% de rrummus It IS a budgetary
level. Therefore, India constraint for India to
has no total AMS reach the de-minimus
reduction commitment level of 10% of
under the Agreement.
India does not provide
for any kind of export
domestic production.
It is therefore wise for
developing
including
countries
India to
bargain for reduction in
domestic support In
developed countries.
Export subsidies in EU,
US and Brazil are
subSIdised exports by 21 subsidies that are subject largely provided for
and 14% for developed to
and developIng commitments.
countfles respectIvely.
Three forms of subsidies
54
reduction commodities on which
India has potential for
exports.
Since export subsidies

I are subj ect to reduction
commitments, (i)
disposal of stocks at
prIces below the
domestic market prIce;
(ii) subsidies financed
through a levy on the
product or inputs, (iii)
subsidies that reduce the
cost of marketing
exports
have an immediate
impact on
competitiveness
export
than
other measures of
support for developing
countries like India, they
are to be negotiated for
complete eliminations,
specifically In those
countries.
2.6 Agricultural Policy Scenario in Some of the Major Trading Partners of India
Policy Scenario in the trading partners of India would play an equally important
role as much as that of the policies in India for its export perfonnance. The developed
countries being the prime markets for the agricultural products of the developing
countries, and also they being the largest providers of subsidies to agriculture are the
focus of disputes in the WTO. Thus, in the political game it would be on India's interests
to see that the policies adopted by its trading partners do not obstruct its agricultural
markets in ihe ueveloped couniries at least within the framework of the WTO or India too
follow the strategies adopted by developed countries for protecting agriculture.
Here, an attempt is made to review the policies favouring or constraining India's
agricultural exports in the world markets. Since India's agricultural markets are
widespread across the countries, it is difficult to review the policies of all trading partners
of India. We, therefore, focus only on the trade policies of some of the leading players of
the world through the review of policies submitted by the Secretariat of WTO in various
years.
55
2.6.1 Tariff Rates and Peaks among India's Trade Partners
Seen in terms of average tariff rate, the tariff rates of trading partners of India is
lower to that of average tariff in India (Table 2.6). But mainly due to tariff escalation or
differentiated tariff, reduction protection through tariff continues to exist to a large extent
in developed countries. Despite generally low average MFN (Most Favoured Nations)
import duties, the tariff structure in many industrialised countries still contain tariff above
100 percent. These tariff peaks (tariff Peaks are generally defined by UNCT AD and the
WTO as duty rates that exceed 15 percent. The European Union (EU) defines it as the
rates triple the average) are often concentrated in products that are of export interest to
developing countries including major staple food products such as sugar, cereals, fish,
tobacco, fruits and vegetables, etc. Secondly, tariff peaks are the products with highest
protection in the Quad (Canada, EU, Japan and US), and therefore, have the greatest
impact on exports to quad markets (Govt of India, 1999). Most developing countries
enjoy preferential access to Quad markets, either through unilateral schemes such as the
GSP (Generalised System of Preferences) or through free trade agreements such as
NAFT A (North Atlantic Free Trade Area) or EU Association agreements. Though
existing schemes grant significant preferences to developing countries, preferences are
concentrated in products that already enjoy low tariffs (between 0 and 15 percent) rather
than on t~riff peaks So these preferential ::;chenles offer liill~ protection againsi tariff
peaks in the Quad except in the EU. It is therefore, in the interest of developing countries
including India to insist on the reduction of those peak tariffs.
56
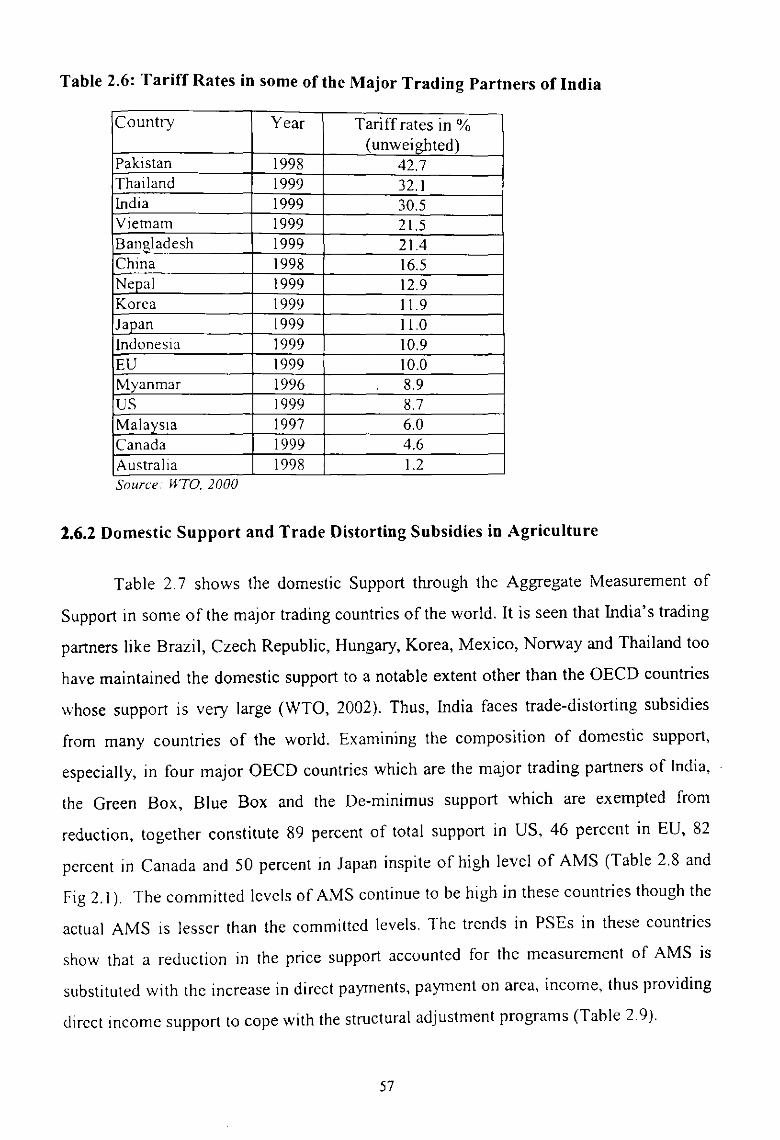
Table 2.6: Tariff Rates in some of the Major Trading Partners of India
Country Year Tariff rates in % (unweighted)
Pakistan 1998 42.7 Thailand 1999 32.1 India 1999 30.5 Viernam 1999 21.5 Bangladesh 1999 214 China 1998 16.5 Nepal 1999 12.9 Korea 1999 11.9 Japan 1999 11.0 IndonesIa 1999 10.9 EU 1999 10.0 Myanmar 1996 8.9 US 1999 8.7 Malavsla 1997 6.0 Canada 1999 4.6 AustralIa 1998 1.2 Source H TO. 2000
1.6.2 Domestic Support and Trade Distorting Subsidies in Agriculture
Table 2.7 shows the domestic Support through the Aggregate Measurement of
Support in some of the major trading countries of the world. It is seen that India's trading
partners like Brazil, Czech Republic, Hungary, Korea, Mexico, Norway and Thailand too
have maintained the domestic support to a notable extent other than the OECD countries
whose support is very large (WTO, 2002). Thus, India faces trade-distorting subsidies
from many countries of the world. Examining the composition of domestic support,
especially, in four major OECD countries which are the major trading partners of India,
the Green Box, Blue Box and the De-minimus support which are exempted from
reduction, together constitute 89 percent of total support in US, 46 percent in EU, 82
percent in Canada and 50 percent in Japan inspite of high level of AMS (Table 2.8 and
Fig 2.1). The committed levels of AMS continue to be high in these countries though the
actual AMS is lesser than the committed levels. The trends in PSEs in these countries
show that a reduction in the price support accounted for the measurement of AMS is
substituted with the increase in direct payments, payment on area, income, thus providing
direct IOcome support to cope with the structural adjustment programs (Table 2.9).
57

Table 2.7: Total Aggregate Measurement of Support Commitment and Current Status of Support in some of the Member Countries of WTO
Member Currency 1995 1998 Commitment Current Commitment Current Level AMS Level Al\IS
Australia AUD 570 151 511 NA million
Brazil USD million 1039 295 997 NA Canada CAD 5197 777 4659 NA
million Columbia USD million 392 581 377 NA Czech CZK million 16447 1152 14746 1013 Republic EU ECU billion 78670 50030 71760 NA Hungary HUF million 40851 .20949 36625 NA Jaoan Yen billion 4801 3508 4304 NA Korea, Rep KRW billion 2183 2075 1952 1563 of Mexico Mex dollar 28622 1365 27469 NA
million Norway NOK 13834 9786 12403 10886
million Slovak SKK million 12253 7111 \0985 7710 Republic Switzerland CHF million 5143 4287 4611 3273 ThaIland THB million 21816 15773 20887 16402 US USD million 23083 6214 20695 NA Venezuela USD million 1287 542 1235 NA SOl/rce: WTO secretanat. 2000. Dzakosavas. Dlmltrls (2003).
Table 2.8 Composition of Domestic Support in OECD Countries 1995-98 (in %)
Tot AMS Green Box Blue Box De Minimums
Canada 18 50 0 32
EU 54 22 23 I
Japan 50 48 2 0
US 12 83 3 2
OECD 42 45 II 2
Source: Diakosavas. Dimitris (2003)
58

Fig 2.1 Composition of Domestic SUpport in OECD Countries 1995-98 (in %)
Canada
50% j.TotAMS
I.Green Box
ODe Minimus
Japan
1 !48% 50% I
I
Source: Diakosavas, Dimitri, (2003)
us
2%--,
83%
EU
59
.TotAMS
• Green Box
• Blue Box
ODe Minimus
• Tot AMS
• Green Box
• Blue Box
• 0 De Minimus

Table 2.9 Composition of Producer Subsidy Equivalent in some of the Developed Countries of the World
Country 1986-88 1989-94 1995-00 Canada Market price support and output payments 66 67 62 Pavrnents on area/ammals, historical entitlements, and income 17 17 28 Payments on mputs 16 14 10 MIscellaneous payments 2 1 0 Elf Market price support and output pavrnents 91 81 64 Pa)ments on area/ammals, hIStorical entitlements, and income 3 10 26 Pa,ments on mputs 6 8 11 MIscellaneous payments 0 0 0 Japan Market price support and output payments 93 94 94 Pa,ments on area./ammals, histOrical entitlements, and income 0 0 0 Pavrnents on mputs 7 6 6 MIscellaneous pa,ments 0 0 0 l:S :'1arket price support and output payments 53 54 53 Payments on area.amrnals, historical entitlements, and income 29 22 24 Pa,ments on mputs 18 24 23 MIscellaneous pa,ments 0 0 0
OECD Market prIce support and output payments 82 81 72
Payments on areafamrnals, historical entitlements, and income 8 8 17 Pavrnents on mputs 10 II 12 MIscellaneous pa,ments 0 0 0 Source GECD. PS£;CSE dalahase 2000. Dwkosavas. D,m'lrls (2003).
Similarly, many trade partners of India provide large amount of export subsidies.
It is seen that EU is the largest provider of export subsidies followed by USA, Brazil,
:Vlexico, Canada, Switzerland and Hungary (Table 2.10). The products benefiting from
the subsidies in the EU which is the largest provider of subsidy, followed by US and
Brazil are mainly dairy products, live animals, fruits and vegetables and sugar which are
potential export items for India. Since export subsidies have an immediate impact on
export competitiveness than other measures of support for developing countries like India
and hence are to be negotiated for complete eliminations. Some commodities of larger
export interest to India like rice, cereal preparations though covered by export subsidy
measures in few other countries like Indonesia, Columbia, Venezuela, etc, the amount of
subsidy is low in those countries and hence would not be highly damaging to the export
interest of India.
60

Table 2.10: Country-wise Value of Export Subsidies and the Products benefiting from S b 'd' . M . U Sl les ID alor Subsidising Countries of the World
Country Base (US Final (US Main Products benefiting billion $) billion $) from Subsidies
EU 13.6 8.42 Bovine meat, wheat, coarse grams, butter and other milk products.
, USA 1.17 0.75 Live animals, wheat, bovine meat and cheese
Brazil 0,94 0.71 Sugar, fruits and vegetables
Mexico 0.73 0.55 Sugar and cereal preparations
Canada 0.52 0.33 Wheat and coarse grains
Switzerland 0.44 0.28 Dairy products
Hungary 0.42 0.27 Poultry meat, pig meat, wheat and fruits and vegetables
: Columbia 0.38 0.29 Rice, cotton, fruits and vegetables
S Africa 0.23 0.15 Fruits and vegetables, cereal preparations, and bovine meat
Czech Republic 0.23 0.15 Dairy products and fruits and vegetables.
Romania 0.19 0.14 Cereal preparations, sugar, bovine meat and frultS and vegetables
Australia 0.10 0.07 Dairy products
Venezuela 0.04 0.03 Rice and coarse grains
Indonesia 0.03 0.02 Rice
Source. Sharma, Ami, 2003
2.6.3 Other ;'lion-Tariff Barriers Faced by India
Non-Tariff Barriers (NTBs) are in many forms. UNCTAD (1994) examines the
NTBs imposed by the US, EU and Japan applicable to India. To mention a few important
ones the NTBs are in the form of tariff quota, seasonal tariff low rates, seasonal tariff
high rates and import monitoring largely prevalent in US; import license, bilateral quota
and regulation for environmental protection in EU, quotas for sensitive products and
product characteristic requirements to protect human health, non-automatic license, in
Japan. It is seen that NTBs in US, EU and Japan are mostly for agricultural items (Gov!.
of India, Ministry of Commerce, 1999). To state some of them related to agriculture, in
the case of Non-Basmati Rice in Indonesia, the permitted agency to import license seeks
61
,

25 percent broken rice from countries such as Thailand, China, Vietnam, etc, but it seeks
15 percent broken rice from India. In the case of spices there is absence of quality
standards and assessment systems in most of the countries. For fresh fruits, rules are very
stringent in US. Inlports require USDA clearance, which is given only after detailed test
including inspection of areas where items are produced.
Table 2.11: Sanitary and Phytosanitary Measures faced by Indian Exports
. Year Imposing Nation Export Item Reasons Cited for Prohibiting Entry
1995 Germany Tea Pesticide Residue 1995 US Fresh or Frozen Filth, decomposed
Shrimps content and presence of salmonella
1996 US Fruits and Vegetables Does not confirm to health standards set by the US
1997 US Shrimps Caught with turtle excluding devices
1996 EU Cooked Shrimps Usage of benzoic acid ! as an additive , 1989 EU Milk Usage of milk
harmone
I 1999 EU Groundnuts Presence of afflotoxin
(Carcinogenic
I element) ! 1983 UAE and Saudi Buffalomeat Presence of
" ...... h~ ... ~~ .... 1 _1 _____
I , ..... .... v~u.
Source.· Govt of India (1997) Banik NlIanjan (2001) An AnalysIs of India's Exports during the 1990s, EPW, November J
In addition, many Indian exports are facing blockade through the Sanitary and
Phytosanitary measures some of which are shown in Table 2.11. These measures, in
addition to the support covered under the AMS, Green Box and Blue boxes, indirectly act
as trade barriers if not hannonised in a scientific manner. If some of them are genuine
there are many cases where countries are setting their health standards at a level higher
than what is prescribed internationally. The quarantine and other phyto sanitary
requirements have resulted in a practical ban on imports of Indian mangoes, grapes, etc
into US. Items like Litchis find great difficulty in reaching the developed country markets
on the ground that they use dangerous pesticides and insecticides. As mentioned above
multiplicity of products and other standards is a major challenge faced by Indian exports.
62

Though international efforts have been made to hannonise standards across the board a
lot has yet to be achieved. (Chaturvedi and Nagpal, 2003).
2.7 Conclusions
The review of trade policies of India, specifically relating to agriculture shows that
policies towards liberalisation in agricultural sector through the removal of QRs have
been implemented in mid or late nineties to meet the requirements of the WTO. The
Export promotional measures like the extension of Export Promotion Capital Goods
(EPCG) scheme to agriCUlture, creation of Export processing zones, etc too came in the
later stages. Though there were some instances of removal of QRs on exports and imports
from mid nineties, major policy change in this direction came in the late nineties to meet
the requirements under the WTO. But it is also seen that export policies are more adhoc
in nature as compared to the import policies. India has not been obligated under the
tariffication program for the reduction of tariffs, tariffs in agriculture have been
substantially reduced as a part of the internal refonns program. On looking into the
compatibility of India's trade policy to the rules under the WTO, it is seen that India
meets all requirements of WTO under the Market Access, Domestic Support and Export
Subsidy clauses. The problem for India however, lies with negotiating for reduction in
suppon given by deveioped trading partners ot IndIa. It is seen that most of the tariff
peaks in the EU, US, Japan and Canada are on products of export interest to developing
countries like on cereals, sugar, fish, tobacco, fruits and vegetables. Examining the
composition of domestic support, especially in four major OECD countries which are
major trading partners of India, it is seen that inspite of a high level of AMS, the Green
Box, Blue Box and the De-minimus support together constitute a high percentage of total
support in these countries. The trends in the Producer Subsidy Equivalents (PSEs) also
show that the reduction in the price support accounted for the measurement of AMS is
substituted with the increasc in direct payments to cope with the structural adjustment
programs. In addition, the support through Sanitary and Phytosanitary measures, which
are not harnlOniscd in a scientific manner act as indirect barriers on exports to developing
country products. It is therefore, in the interests of the developing countries to be strategic
63

In implementing the policies according to the WTO rules. It is also essential for
developing countries including India to form more trade unions and associations so that
distorting policies in the developed countries could be effectively fought against. It would
also be appropriate to negotiate for proper monitoring of trade policies of the member
countries of the WTO.
64

Appendix Table A2.1: Major Trade Policy Announcements Since 1990
Year
1990-91
1990-91 July August
1991-92 EXIM POLICY
Dec 1991
Feb 1992
Nov 1992
1992-93
1993-94
: 1995-96
Changes in Policy
Extension of REP licenses list to cover items under limited permissible and Canalised list; identification of Export trading houses and provision of additional licenses; introduction of new category of State trading houses for exports with exemplary performances.
Introduction of EXIM Scrips to replace REP, abolition of supplementary licenses except in the case of small scale sector; enlarging of the scope of export services, extension of Export processing zones (EPZs) and Export Processing Units (EPUs) to several sectors of the economy.
Abolition of Cash Margin for 100% EOUs and for Units III FTZ/EPZs against imports for own consumption when exports are to GCA.
Cash Margin in Imports cut to 50%
All Cash Margins on Imports to higher than Capital goods removed; Change in import licensing by replacing a large part of administrative licensing of imports by import entitlements linked to export earnings. EXIM Scrips were made tradable and premium on the Scrips set by market.
Actual Users condition removed for EXIM Scrips for permissible non-OGL Capital Goods imports without any value limit.
Special Import Licenses granted to select Exporters. Partial Convertibility of the Rupee was announced; Introduction of Liberalised Exchange Rate Management System (LERMS) where exports and recipients of inward remittances were allowed to exchange 60% of foreign exchange at market rate and remaining 40% at administered rate.
Full Convertibility of the Rupee on the trade account was announced. Simplification of SIL Scheme.
Abolition of Export Taxes and Streamlining of the Export Subsidies.
65

1996-97
1997-2000
April 2000
April 2001
EXIM POLICY 2002-07
Encouragemen~ to Export Houses and Star Trading Houses by exempting them from paYIng the Mmlmum Alternative Tax of the Union Government.
Streamlining of the Export Promotion Capital Goods scheme (EPCG). Value-based: advance licensing scheme discontinued, a new simplified passbook scheme' introduced.
The SIL facility extended to domestic capital goods suppliers. Additional SIL announced for small-scale industries to explore new markets.
Setting up of Special Economic Zones treated as being outside the customs territory of the country. SEZ at Piparar (Gujarat) and Tuticorin (Tamil Nadu). Involvement of State Governments in Export Promotion Efforts. Steps towards E-Cornmerce.
Creation of Agricultural Export Zones identified by the state governments I
Tariff Policy revised. Within the bound rates, the customs duties have been enhanced I
on tea, coffee, copra, coconut and desiccated coconut from 35% to 70% and on crude I'
and refined edible oils, the rates range from 45% to 75% / 85%. Import of primary products of plant and animal origin are made Subject to 'Bio· Security and Sanitary and Phyto-Sanitary Permit'. The EXIM Policy schemes like Duty Exemption Scheme and the Export Promotion Capital Goods Scheme are being made applicable to the agro sector as well .
Export restrictions like registration and packaging rt:ljuiremenlsare being removed on butter, pulses, wheat, groundnut oil, cashew and coarse grains like barley, maize, bajra, ragi and jowar. Restrictions on export of all cultivated varieties of seed, except jute and onion are I removed. Notification of 20 agri-export zones covering many exportable items. The conditions of registration of contract with APEDA (Agriculture and Processed food Export Development Authority) for export of non-bas mati rice removed. Provision of export subsidies like the transport subsidy for export of fruits, vegetables floriculture, poultry and dairy products which is allowed under the ab'Teement on agriculture. I Special powers to the States granted with new schemes like ASIDE (Assistance to I States for Infrastructure development and Exports) and the state level export. promotion committee (SLEPC).
SOllrce. I. Sunanda Sen and Upendra Das .R. (1992). "import Llberali"allOn as a Tool of Economic Policy in India since Mid-e(ghties·. Economic and Political Weeklv. March [
2. Res€ITe Bank of India Bulletinsfor .-anolls yeaTs and EXIM policy Papers. Variolls Statements about EXIM Polin·. /vlinistry of Commerce. GOV! of Ind/G. New Deihl
66

Table A2.2: Tariff Rates for Major Traded Agricultural Commodities in India (in 0 Yo)
Commodity 1986 1996 2002 Basic Auxil Prefere Basic Prefere- Basic Prefere-
iary -ntial ntial ntial Rice Free 0 0 Free --- 70 ---Wheat Free 0 0 Free --- 100 ---Coffee 100 50 100% 10 1O%less 100 100%
less less Tea 100 50 100%le 10 10%less 100 100%
ss less Sugar refined 100 50 --- 50 --- 100 ---Cashe""TIuts 200 50 190 50 40 30 ---Coconuts 200 50 190 50 40 70 60 Castor seeds 60 50 30 50 40 30 20 Edible 60 50 50 50 40 30 20 Oilseeds Palm kernel 60 50 50 50 40 30 20 Oil of 200 50 190 50 40 100 90 Coconuts Castor oil 200 50 190 50 40 100 90 Oilof 200 50 190 35 25 45 35 Soya bean Oil of 200 50 190 50 40 100 90 sunflower Oilof 200 50 190 35 25 /5 65 Rapeseed Oil of 200 50 190 50 40 100 90 Groundnu!s Oil of Palm 200 50 190 50 40 100 90 Cotton carded 60 50 --- 50 --- 30 ---or ('omh~d
Tobacco 100 50 --- 50 --- 30 - --
Silk, raw, yam 50 50 --- 50 ---- 30 ---
Onions 100 50 90 10 10 30 20 Milk 60 50 --- 40 --- 30 ---
Source: Directorate of Publications, Customs and Central Excise, New Delhi (1986, 1996), Goyal Arun (2002)
67

Chapter III
Nominal Protection and Tariff Rates in Agriculture in India
3.1 Introduction
Trade policies pertaining to agricultural sector in India have been changing either due to
the domestic economic reforms or to meet the multilateral requirements as laid in the
Agreement on Agriculture in the WTO. Agricultural trade policies being largely
diversified in nature, quantifying the extent of policies distorting trade in agriculture and
the changes in them is a problem much debated. We come across a few measures in the
literature, like the Nominal and Effective Protection Coefficients, the Producer and
Consumer Subsidy Equivalents, and the Aggregate Measurement of Support which are
used to capture the extent of protection in agriculture. It is assumed that these measures
capture the changes in policies that would be reflected in prices and thereby, assuming
perfect competition in the markets they attribute the difference in domestic and border
prices to restrictive trade policies.
Here, certain Issues on measurement of indicators of trade policies and their
impact on agricultural commodities in India are dealt. Since protection coefficient is a
ratio of domestic and border prices, each of which would depend on large number of
factors. it is essential to examine as to what extent these coefficients reflect the trade
policies and to what extent they are sensitive to policy changes. We attempt answering
this by measuring Nominal Protection Coefficients (NPCs) that are widely used to
measure protection in the output sector for select agricultural commodities in India, and
by relating them to their trade policies and other policies that can have an impact on trade
in agriculture. At the same time, we examine the impact of liberalisation on trade in
agricultural commodities reflecting on the protection coefficients.
It is mentioned carlier that though agriculture was sidelincd during the reforms in
the early ninetIes, reforms in other sectors like monetary or exchange rate have positive
impact on trade in agriculture, especially the exports, which leads to changes in
68

agricultural prices (Parikh, et, ai, 1995, Subramaniam, 1993, Mishra and Rao, 2003). It is
claimed that with liberalisation there is a tendency for the domestic prices to move
towards the world prices. "The prices of commodities which have positive protection
rates in the pre-liberalisation period are reduced with liberalisation and prices of those
commodities which have negative protection or disprotection are increased" (Parikh, et
al, 1995, p. 21). In addition there are quite a few cases of changes in trade policies since
the mid nineties, which are expected to have a direct impact on trade in agriculture. We
first observe whether the changes in the policies pertaining to trade in agriculture directly
or indirectly are felt on the quantity of trade in agriculture and then examine the
sensitivity of protection coefficients to those policies which have had positive impact on
agricultural trade.
The second part of the chapter deals with the protection to agriculture
commodities through the tariff rates. Here, we try to examine if there was any scientific
criterion in fixing of tariff rates, by examining the relationship between the nominal rates
of protection and the tariff rates as given in the customs tariff schedule for select
agricultural commodities in India. We examine to what extent the nominal and effective
rates of protection as seen through the scheduled tariff are related to the nominal and
effective rates measured through the price differences which shows us the desired rate of
protection to thuse wmmodities. We then discuss in detaii as to what are the
recommendations of the Working Group on Tariffs (2001) appointed by the Government
of India to reform the tariff structure in India; is a Uniform Tariff preferred over a non
um form tan ff theoretically and empirically to Indian conditions; and what are the
implications of levying a uniform tariff for India and agricultural commodities
SpCCl fically.
3.2 Protection to Agriculture seen through the Nominal Protection Coefficients
The nominal protection for select agricultural commodities in India for the period
from 1980 to 1999 are measured through the price wedge technique and the tariff rates as
given in the Customs Tariff Schedule of India. The protection coefficients arc obtained as
69
the ratio of domestic pnce to that of the world pnce after adjusting to the freight,
domestic transportation and the marketing margins. The representative domestic price
chosen is the annual average whole Sale Price (WSP) quoted in Agricultural Prices in
India published by the Ministry of Agriculture. The representative world prices are the
leading market prices obtained from the IMF Financial Statistical Yearbooks for
whichever available or they are the f.o.b unit values obtained from the FAO statistics on
the value and quantity of trade.
The treatment of NPC under importable and exportable hypothesis is met by
adjusting the prices to transportation costs. Under importable hypothesis the reference
price is the c.i.f price (which includes the prices of the commodity plus the international
freight charges) plus the port clearance charges, domestic transportation and the traders'
margins. Under exportable hypothesis, the relevant border price is obtained after
deducting the domestic transportation from the domestic market place to the port from
the f.o.b price since these costs would have been incurred for the domestic producer to
make his product exportable. The freight charges are obtained from the FAO trade
yearbooks. Marketing margins are assumed to be five percent of the f.o.b value of the
commodity referring to earlier studies. The truck rates and the port clearance charges are
obtained from personal interviews with the freight forwarding agencies. The prices
chosen and the adjustmenls maue are given in the appendix tabie A3. i.
70

Table 3.1: Nominal Protection Coefficients under Exportable Hypothesis (fOT 1999)
Commodities/year NPC Potato 0.30 Oil of sesame 0.39 Tobacco 0.41
Banana 0.42
Groundnuts 0.55
Sesame seed 0.60
Rapeseed/mustard 0.63
Omon 0.75
Cotton 0.84
Cashew nut 1.04
Pepper 1.07
Jute 1.18
Rice 1.24
Oil of groundnuts 1.26
Oil oflinseed 1.26
Tea 1.42
Coffee 1.43
Cake of rapeseed 1.50
Cake of groundnuts 1.52
Apple 1.56
Wheat 1.84
Oli oi rapeseed 1.94
Sugar 2.18
Rubber 2.25
Linseed 3.21
Cake of coconuts 4.08
Soyabean 1.75
Cake of soyabean 1.90
Oil of soya bean 2.31
h method Note. NPCs are Computed wllh the help of the data men//Oned In t e ology
71
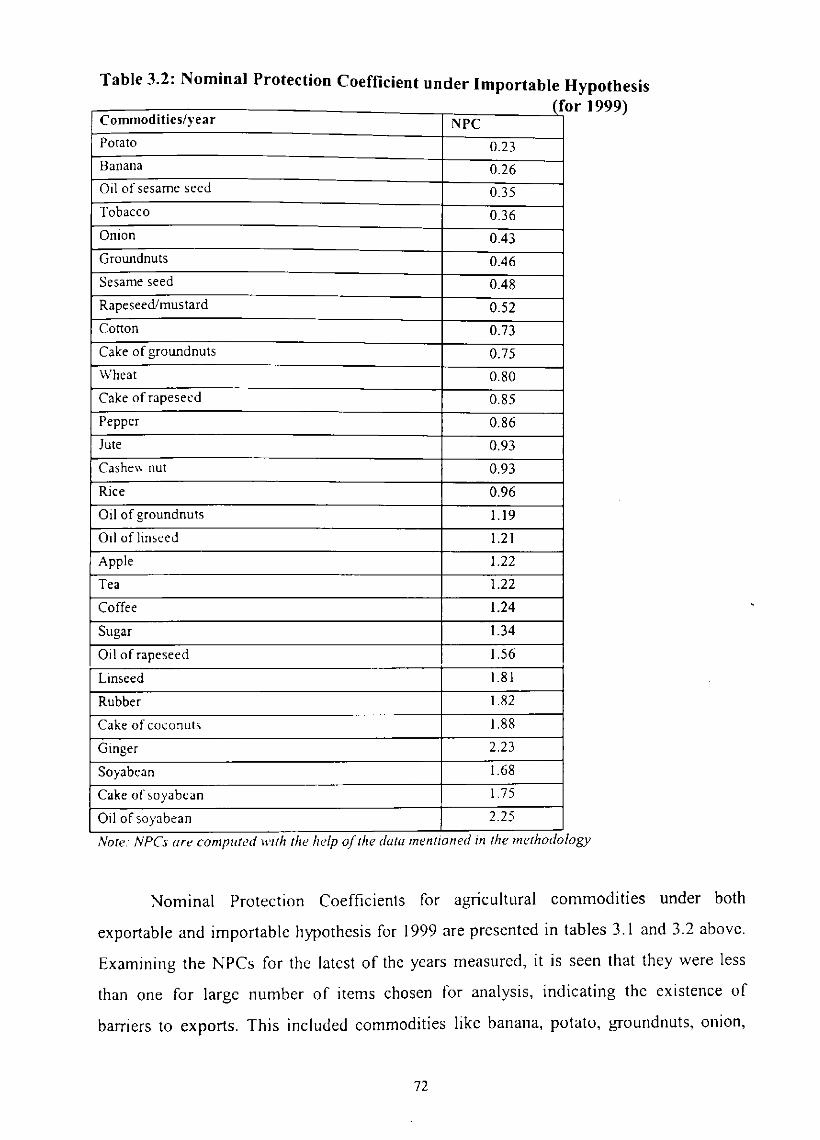
Table 3.2: Nominal Protection Coefficient under Importable Hypothesis or 1999) (f
Commodities/year NPC Potato 0.23 Banana 0.26 Oil of sesame seed 0.35
Tobacco 0.36
Onion 0.43
Groundnuts 0.46
Sesame seed 0.48
Rapeseed/mustard 0.52
Cotton 0.73
Cake of groundnuts 0.75
Wheat 0.80
Cake of rapeseed 0.85
Pepper 0.86
Jute 0.93
Cashew nut 0.93
Rice 0.96
Oil of groundnuts 1.19
OIl of Itnseed 1.21
Apple 1.22
Tea 1.22
Coffee 1.24
Sugar 1.34
Oil of rapeseed 1.56
Linseed 1.81
Rubber 1.82
Cake of coconuts 1.88
Gmger 2.23
Soyabean 1.68
Cake of ,oyabean 1.75
Oil of soya bean 2.25
Note.· NPCs are compllted with the help 0/ the dara mentIOned III the methodology
Nominal Protection Coefficients for agricultural commodities under both
exportable and importable hypothesis for 1999 are presented in tables 3.1 and 3.2 above.
Examining the NPCs for the latest of the years measured, it is seen that they were less
than one for large number of items chosen for analysis, indicating the existence of
barriers to exports. This included commodities like banana, potato, groundnuts, onion,
72

and a few more items like tobacco, cotton, and a few oilcakes. The immediate conclusion
that is generally drawn here is that with the complete removal of trade barriers, there is
scope for the expansion of exports of these commodities which would allow the domestic
prices to move towards the world prices. These set of commodities are therefore,
considered as exportables. It is to be noted here that NPC less than one does not rule out
the existence of import restrictions, but that would be of lesser relevance since higher
world prices would act as a natural protection to domestically produced commodity.
Similarly, the results show that there are import restrictions for commodities like edible
oils, apple, tea, coffee, sugar, rubber and ginger where NPC is more than one and hence
are considered importables. Yet, for certain other set of commodities like rice, wheat,
cashew nut, pepper, jute, cake of groundnuts and rapeseed, where the NPC is close to
one, or where they are more than one under exportable hypothesis and less than one
under importable hypothesis, the results remain silent of the existence of either export
restriction or import restriction, considering them neither as exportables or as
importables.
Commodities with NrC Commodities with NrC Commodities with NrC less than one under less than one under more than one under both Exportable and Importable Hypothesis the hypotheses Importable Hypothesis but more than one under
Exportable Hypothesis
Potato R,ce Oil of groundnuts Oil of sesameseed Wheat Oil of linseed Tobacco Cashewnut Oli of rapeseed
Banana Pepper Oli of soyabean Groundnuts Jute Soyabean
Sesame seed Cake of groundnuts Cake of soya bean Rapeseed/mustard Cake of rapeseed Apple Omon Tea Colton Coffee
Sugar Soyabean Linseed Rubber Ginger
The review of trade policies for these set of commodities shows us that
quantitative restrictions through quota licensing acted as a direct barrier to many of the
73

agricultural commodities during that time. It is also seen that there were other barriers
like canalisation of trade through different state and parastatal agencies and domestic
restrictions which can also act as trade barriers directly or indirectly (dealt in second
chapter). Nonetheless, we come across certain exceptions, where distortions cannot be
attributed to any policy barrier. For example, it is seen in the case of bananas that NPC is
much less than one, though the commodity has been promoted largely for exports. The
barrier to trade such commodities seems to be largely in terms of infrastructure, where it
can be implicit due to non-provisioning by the government. This would also be applicable
to other set of commodities, especially exportables, where barriers from infrastructure
can co-exist with the presence of other barriers to trade. The limitations of assumptions of
perfect competition, of perfect information and homogeneity of commodities (though the
commodities are approximately adjusted for quality in the analysis) remain.
On the basis of the protection coefficients, which also show the pnce
competitiveness of the agricultural commodities, one can predict as to what would be the
likely scenario in exports and imports with the removal of trade barriers. From the
review of policies and the information on the market situations we anticipate that there
would not be a drastic change in the export scenario though some changes in imports is
expected. Imports of edible oils, rubber and sugar is likely to increase with the opening
up uf trade in those commodities. Coffee and tea markets in India wouid not be affected
due to imports to a large extent for the reason that India produces the best quality of these
products, which cannot be largely substituted. But in the case of exports, as mentioned
earlier, for some commodities like the horticultural items, the barrier lies with
infrastructure. For some other commodities like sesame and rapeseed/mustard, the export
market exists in the form of processed products like edible oils in which India does not
possess the price competitiveness. Rather India is also a large importer of edible oils.
CornnlOdity like onion and potato being essential items is subject to adhoc export policies
looking into the supply and demand situations. This also holds good with other
commodities like common varieties of rice in which India's NPC is ncar to unity. The
export policy of these commodities is likely to be SUbject to similar state even in the
future, since they are not forced for change under the WTO.
74

Since some policy changes in agricultural exports and imports are observed from
the mid nineties and also that the liberalisation measures introduced with the new
economic reforms in 1991 can have indirect impacts on trade in agriculture, we examine
as to what extent NPCs are sensitive to policy changes. For doing so we first understand
the policies, which have direct or indirect impact on trade in agriculture leading to the
changes in the protection coefficients. We understand from the review of trade policies
that agriculture was sidelined for direct measures of liberalisation during the new
economic reforms in the nineties. The removal of QRs on imports and exports were
applicable only to limited number of agricultural commodities. There were some notable
changes in the policy from mid-nineties like the removal of QRs on exports of rice in
1994, decanalisation of sugar and milk in 1991 and 1992 and later freeing of exports of
all edible oilseeds in 1995 and edible oils in 1998. Similarly, in the case of imports,
freeing of edible oils in 1994/95 through decanalising and delicensing and some policy
changes in sugar, rubber and cotton in the early 1990s were prominent. Rest of the
commodities were liberalised in the later years with the removal of QRs under the WTO
obligations from 1999 to 2001. The impact of such policy changes is expected to have a
direct impact on trade and prices.
Huwt:vt:r, it is also slaled earlier that the impact of iiberaiisation in other sectors
like liberalisation in exchange rate or liberalisation in manufacturing sector is largely felt
on agricultural sector (Parikh, et.al, 1995, Subramaniam, 1993, Mishra and Rao 2003).
Here our attempt is to examine whether the policy changes introduced in the
liberalisation measures in 1991 is felt on the nominal protection coefficients of the
chosen agricultural commodities. This is expected to a larger extent in the case of
exportables SInce liberalisation measures in 1991 were largely export promotive
measures. We do a similar analysis for those commodities where there were direct trade
IIberalisation measures in the nineties as mentioned above. We try to test this, by first
examining if there is any change in market shares in exports or imports due to
liberalisation for those set of commodities and then by making a comparison of average
NPCs before and after 1991 liberalisation. Similar analysis is carried out for those
75

commodities where there were changes in policies in terms of the removal of quantitative
restrictions.
We first deal with the commodities which had direct policy changes in the early
or mid nineties like rice, sugar, groundnuts in the case of exported items and sugar, edible
oils, cotton, rubber and jute in the case of importables. The pre and post liberalisation
phases are classified on the basis of the changes in the licensing of exports and imports.
The changes in the market share in the commodities with export/import liberalisation
during the early or mid nineties and the changes in the NPCs for commodities with
change in export/import policy are presented in Tables 3.3 to 3.6.
Table 3.3: Change in Market Share in Commodities with Export Liberalisation d h N' . unng t e, metles
Commodities Year India's Year India's share in share in world world
eXDorts ex~orts
Rice 1981-94 4.22 1995-99 16.25
Sugar 1981-91 116 1992-99 1.08 Groundnuts 1981-91 3.50 1992-99 12.21
SOllree Computedfrom FA 0 trade StaIISIICS, wwwfao.org
Table 3.4: Change in Market Share in Commodities with Import Liberalisation during the Nineties
Commodities Year India's Year India's share in share in world world
Imports Imports
Sugar 1981-94 381 1995-99 2.08
all of groundnuts 1981-94 0.00 1995-99 0.00
Oil of rapeseed 1981-94 0.65 1995-99 7.83
0,1 of linseed 1981-94 0.49 1995-99 0.13
Conon 1981-90 0.14 1991-99 0.92
Rubber 1981-90 0.95 1991-99 0.40
Jute 1981-90 5.74 1991-99 16.82
Source Compuled from" A 0 lrade slall.1 tiCS, ,,,,wjao.org
76

Table 3.5 Change in NPCs for Commodities with Change in Export policy
Commodity NPC before the Year of Policy NPC after the policy change change policy change (from 1981 upto the year of change in policy) Average SO Average SO NPC NPC
Rice 1.14 0.28 1994 1.06 0.13
Sugar 2.78 0.95 1991 1.53 0.31
Groundnuts 0.61 0.18 1995 0.56 0.05 Rapeseed 0.90 0.39 1995 0.56 0.06 Linseed 4.0 I 1.53 1995 2.99 0.75 Sesameseed 0.80 0.13 1995 0.62 0.08 Note: Types of po hey changes are explamed m chapter 11.
Table 3.6: Change in NPCs for Commodities with Change in Import policy
Commodity NPC before the Year of Policy NPC after the policy change change policy change (from 1981 upto the year of change in policY) Average SO Average SO NPC NPC
Sugar 1.53 048 1995 1.08 0.17 Oil of groundnuts 2.11 0.64 1995 1.21 0.09 Oil of rapeseed 2.15 0.58 1995 1.35 0.14 0,1 of lm,pt:'n !.88 I) 69 !995 1.19 0.06
Oil of sesame seed 0.60 0.16 1995 0.33 0.04 Cotton 0.69 0.14 1991 0.66 0.16 Rubber 108 0.30 1991 1.12 0.46 Jute 0.98 0.26 1991 0.91 0.30 ~ote: Types of pohcy changes are explamed In chapter 11.
Commodities with Increasing share in exports Commodities with increasing share in imports in the nineties in the nineties
Rice Cashewnut
Groundnuts Oil of palm
Scsameseed Oil of rapeseed
Cake of rapeseed Pepper
Cotton Cotton Jute
Ginger
77
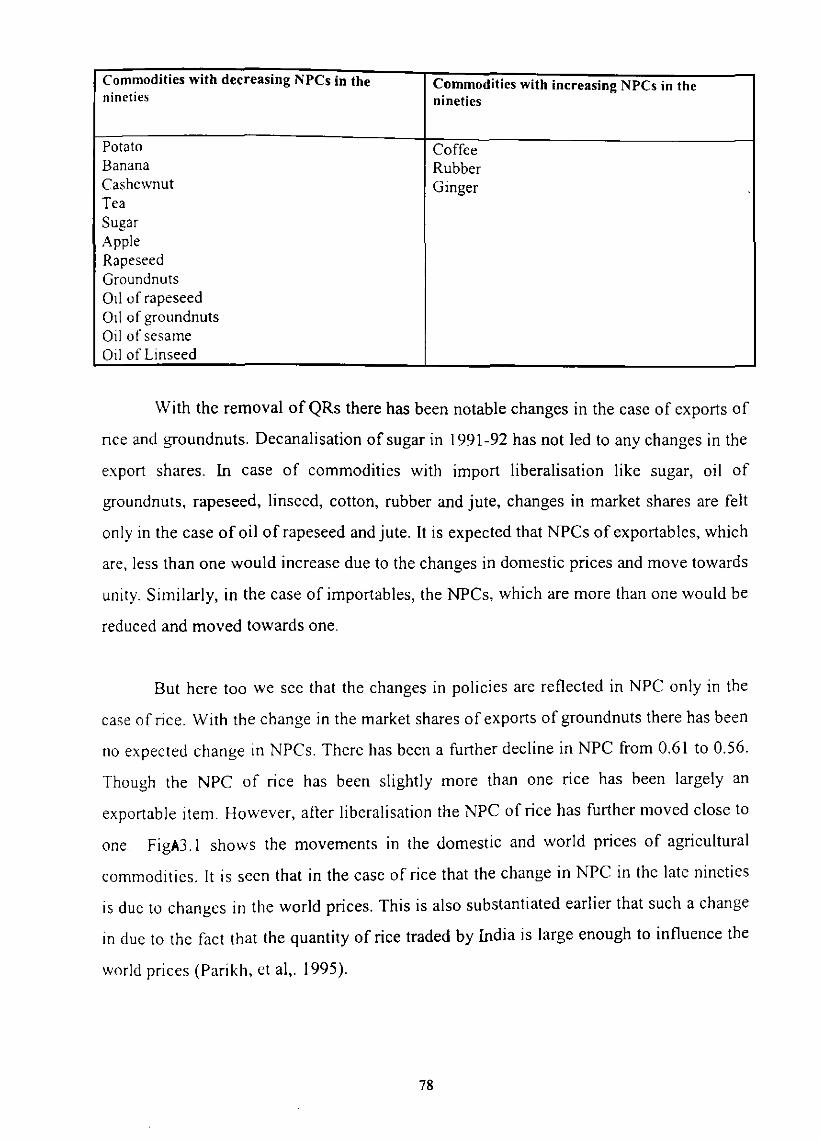
Commodities with decreasing NPCs in the Commodities with increasing NPCs in the nineties nineties
Potato Coffee Banana Rubber Cashewnut Ginger Tea Sugar Apple Rapeseed Groundnuts 011 of rapeseed 011 of groundnuts 011 of sesame Oil of Linseed
With the removal of QRs there has been notable changes in the case of exports of
nee and groundnuts. Deeanalisation of sugar in 1991-92 has not led to any changes in the
export shares. In case of commodities with import liberalisation like sugar, oil of
groundnuts, rapeseed, linseed, cotton, rubber and jute, changes in market shares are felt
only in the case of oil of rapeseed and jute. It is expected that NPCs of exportables, which
are, less than one would increase due to the changes in domestic prices and move towards
unity. Similarly, in the case of importables, the NPCs, which are more than one would be
reduced and moved towards one.
But here too we see that the changes in polieies are reflected in NPC only in the
case of rice. With the change in the market shares of exports of groundnuts there has been
no expected change in NPCs. There has been a further decline in NPC from 0.61 to 0.56.
Though the NPC of rice has been slightly more than one rice has been largely an
exportable i tern. However, after liberalisation the NPC of rice has further moved close to
one. FigA3.l shows the movements in the domestic and world prices of agricultural
commodities. [t is seen that in the case of rice that the change in NPC in the late nineties
is due to changes in the world prices. This is also substantiated earlier that such a change
in due to the fact that the quantity of rice traded by India is large enough to influence the
world prices (Parikh, ct al,. 1995).
78
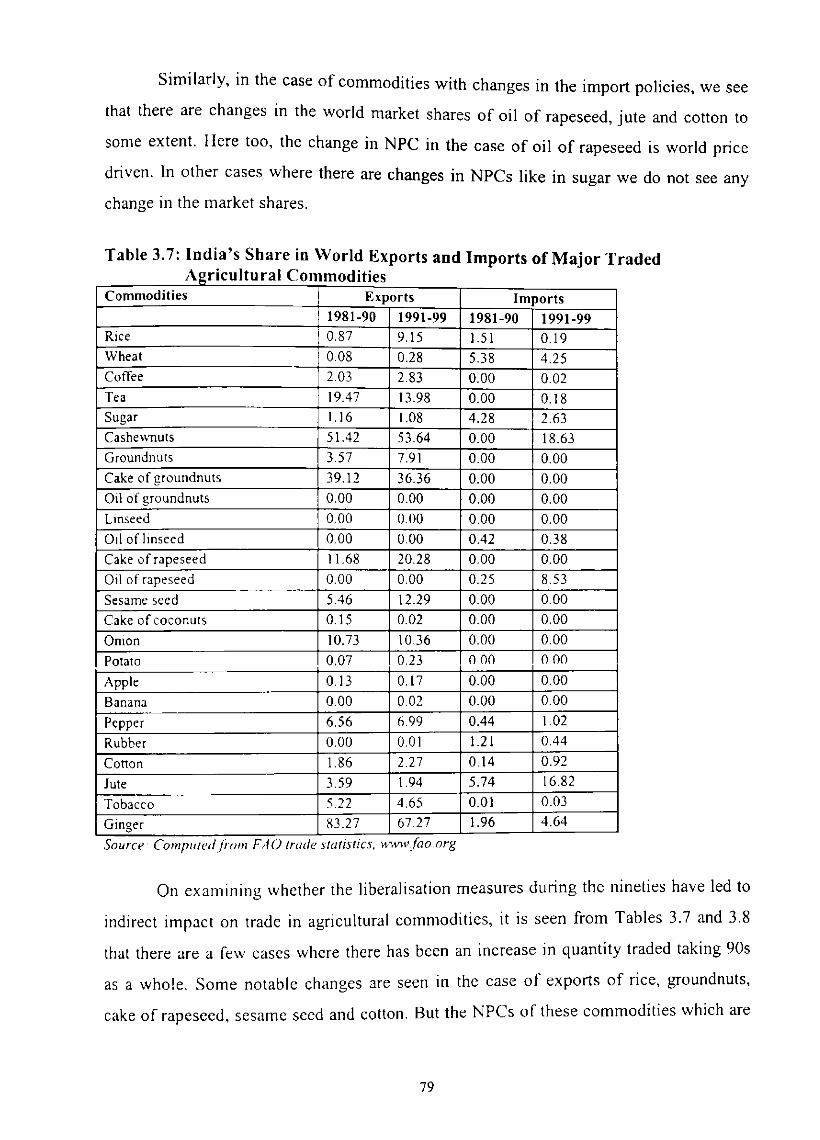
Similarly, in the case of commod'( . h h " .. lies Wit c anges In the Import policies, we see
that there are changes in the world market shares of 01'1 of d . d rapesee , J ute an cotton to
some extent. Here too, the change in NPC in the case of oil of rapeseed is world price
driven. In other cases where there are changes in NPCs like in sugar we do not see any
ehange in the market shares.
Table 3,7: India's Share in World Exports and Imports of MaJ'or Traded A ' I \gncu tural Commodities
Commodities Exports Imports 1981-90 1991-99 1981-90 1991-99
Rice 0.87 9.15 1.51 0.19 Wheat 0.08 0.28 5.38 4.25 Coffee 2.03 2.83 0.00 0.02 Tea 19.47 13.98 0.00 0.18 Sugar 1.16 1.08 4.28 2.63 CashemlUts 51.42 53.64 0.00 18.63 Groundnuts 3.57 7.91 0.00 0.00 Cake of groundnuts 39.12 36.36 0.00 0.00 Oil of groundnuts 0.00 0.00 0.00 0.00 Linseed 0.00 0.00 0.00 0.00 Od of 1mseed 000 000 0.42 0.38 Cake of rapeseed 11.68 20.28 0.00 0.00
Oil of rapeseed 0.00 0.00 0.25 8.53
Sesame seed 5.46 12.29 000 0.00
Cake of coconuts 0.15 0.02 0.00 0.00
Oman 10.73 10.36 0.00 0.00
Potato 0.07 0.23 000 000
Appie 0.13 0.17 0.00 0.00
Banana 0.00 0.02 0.00 0.00
Pepper 6.56 6.99 0.44 102
Rubber 0.00 0.01 1.21 0.44
Cotton 1.86 2.27 0.14 0.92
Jute 3.59 1.94 5.74 16.82
Tobacco 5.22 4.65 0.01 0.03
Ginger 83.27 67.27 1.96 4.64
Source Compuledfrom FAO trade sllltlsliCS. ,,"vwfao.org
On examining whether the liberalisation measures during the nineties have led to
indirect impact on trade in agricultural commodities, it is seen from Tables 3.7 and 3.8
that there are a few cases where there has been an increase in quantity traded taking 90s
as a whole. Some notable changes are seen in the case of exports of rice, groundnuts,
cake of rapeseed, sesame seed and cotton. But the NPCs of these commodities which are
79

expected to move towards unity have not moved in the required direction. Similarly, we
see some notable changes in the NPCs of potato 01'1 of sesam b d d , e, anana, an rapesee,
which are not related to the quantity of trade in those commodities.
Table 3.8: Nominal Protection Coefficients before and after 1991 Liberalisation
Commodities 1981-90 1991-99 Average SD Average SD
Rice 1.18 0.30 1.04 0.12 Wheat 1.81 0.33 1.24 0.33 Coffee 146 0.99 2.06 1.03 Tea 1.67 0.36 1.14 0.16 Sugar 2.78 0.95 1.53 0.27 CaShe\\llUts 1.15 0.12 1.10 0.10 Groundnuts 0.63 0.21 0.56 0.08 Cake of groundnuts 1.58 0.43 1.42 0.19 Oil of groundnuts 2.19 0.77 1.42 0.38 Linseed 4.37 1.69 3.05 0.56 Oil of linseed 2.14 0.42 1.63 0.38 Rapeseedmustard 1.00 0.43 0.61 0.09 Cake of rapeseed 1.27 0.39 0.96 0.26 Oil of rapeseed 2.96 0.83 1.95 0.55 Sesameseed 0.84 0.14 0.66 0.09 OIl of sesame seed 0.77 0.14 0.41 0.09
Cake of coconuts 3.67 0.74 2.54 0.86
Onion 0.84 0.09 0.78 0.33
Potato 0.93 0.33 0.45 0.13
Apple 2.03 0.36 1.63 0.25
Banana 051 0.44 0.33 0.10
Pepper 1.04 0.08 1.03 0.11
Rubber 128 0.34 1.34 0.58
Cotton 0.77 0.18 0.77 0.18
Jute 1.81 1.67 1.14 0.31
Tobacco 0.30 0.06 0.40 0.04
Soyabean 0.92 0.15 1.27 0.36
Cake of soyabean 0.97 0.06 1.19 0.34
Oil of soyabean 1.33 0.62 2.50 1.42
Note' NPCs are compllled »1117 the help o(the data mentIOned In the methodology
Thus we see on the one hand that the impact of policy changes on agricultural
exports and imports are limited as there is no integration in domestic and world prices
seen along with the change in world market shares and also that NPC as an indicator of
policy changes cannot be used in a dynamic sense.
80

3.3 Protection to Agriculture seen through Tariff Rates
Protection in the output sector which is the nominal rate of protection, in the
absence of any kinds of non-tariff barriers, can be seen through the tariff rates as given in
the tari ff schedule. The procedure for determining the magnitude of protective tariff
consisted in computing the difference between the foreign price and the comparable
domestIc pnce of simIlar items.
In a!,>TIcuiture in India, most of the tariff lines were subject to either prohibition
or restrictIOn through quota licensing or canalisation of commodities till very recently.
~e\"erthless. imports of agricultural commodities in India, either within the quota or in
some cases which are not subject to quotas are subject to three types of customs tariffs.
These are, the basic or the standard duty, the additional duty and the special additional
duty. The basic duty of customs which is the protective part of the duty is applied on the
\alue of the goods and is a scheduled rate. Additional duty offsets the excise duty and
the Special Additional /)/In' offsets the sales tax. In addition to these, there are
preferential duties applicable to preferential areas. However, with the prevalence of QRs
on large number of commodities, it is essential to examine as to what extent the tariff
rates were sensitive to price changes and hence could be used as a representative of trade
tari ff schedule of India and the rates of protection measured through the domestic and
world price differences al1er making the necessary adjustments.
81

Table 3.9 Nominal Rates of Protection (NRPs) and the Scheduled Tariff Rates
n %) (i Commodities 1980-89 average 1990-99 average
NRP TARIFF NRP TARIFF Std Std
RICe -13.57 0 -19.44 0 Wheat -1236 0 43.3 0 Coffee -0.18 100 90.52 41 Tea 41.19 100 -0.26 41 Sugar 72.79 60 7.09 49 Cashew nuts 103 140 -0.35 86.5 Groundnuts -49.34 60 -53.33 56 Lmseed 126.47 60 92.5 56 Rapeseed mustard -16.76 60 -48.78 56 Sesame seed -8.91 60 -48.04 56 all of groundnuts 116.71 172 53.28 82.5
Oil of hnseed 93.98 172 44.7 82.5
Oil of rapeseed 120.30 172 66.32 67.5
Oil of sesame seed -32.54 172 -61.26 82.5
Cake of groundnuts -14.63 60 -19.14 56
Cake of coconuts 71.31 60 39.73 56
Cake rapesecdlmustard -29.28 60 -38.85 56
all of soyabean 146 172 74 82.5
Ornons -45.43 92 -64.1 43.85
PotalO -42.34 92 -66.55 43.85
Apple 28.84 158 19.35 82
Banana -73.17 158 -74.81 80
Pepper -7.39 100 -13.84 64
GInger 89.95 100 37.04 64
Rubber 7.83 88 1191 63
Cotton -32.55 40 ·34.5 46.5
Jute -5.42 88 -9.29 63
Tobacco -74.01 100 -64.85 64
Note: Tariff rates are standard dulles as given In the Working Schedule 011 ellS toms Tariffs
82

Table 310' Correlation between NRP d T 'frR , an an ates Commodity Correlation
Rice
Wheat
Coffee
Tea
Sugar
Cashew
Groundnuts
LlOsced
Rapeseed
Sesame seed
Cake of groundnuts
Cake of coconuts
Cake of rapeseed
- -.. NOle :. :">Ignilicanl at 1"10 level
." Significant at 5% level
Coefficient
-----
----.
0.131
0.499
0.394
0.411
0.343
0.432
0.355
0.423
0.255
0.148
0.138
Commodity
Oil of groundnuts
Oil of linseed
Oil of rapeseed
Oil of sesame
Onion
Potato
Apple
Oil of soyabean
Banana
Pepper
Ginger
Rubber
Cotton
Jute
Tobacco
Correlation Coefficient
0.724"
0.518 ""
0.569"
0.779"
0.469""
0.480*-
0.466"-
0.658-
0.438
0.412
0.143
-0.415
0.065
0.095
-0.312
On analysing the relationship between the Nominal Rates of Protection (NRPs)
and the tariff rates for the chosen commodities (Tables 3.9 and 3.10) we see that there
exists no relationship between the two for most of the commodities. This is evident from
table 3.9 that NRPs for many agricultural commodities are negative whereas tariff rates
which exist in the tariff schedule are very high. Even where the NRPs are positive the
tariff rates are much higher than required. The tariff rates for these commodities are also
subject to more changes than for other commodities. The exception to this is edible oils,
where we observe the correlatIOn coefficient significant for this group of commodities.
The import of these commodities are under the parastatal agencies and trade within the
quota allotted to them was controlled through the tariff rates. Thus, it is seen that tariff
83

rates were largely ineffective instruments of trade policy towards agricultural
commodities.
With the removal of QRs in the WTO regime, tariff rate as instrument of trade
policy plays an important role. India, having one of the highest weighted average tariff
rates in the world faces immense pressure for the reduction of these rates. India's
weighted average tariff as seen for 1999 was exceeded only by Pakistan and Cameroon.
All our Asian neighbours such as Sri Lanka, Bangladesh and Nepal as well as China have
lower weighted average tariffs than India (Working Group on Tariffs, 2001). As noted in
Virmani (2001), "This creates the problem of import diversion and smuggling. The fact
that India has some form of free trade arrangement with several of its neighbours means
that it becomes profitable to import many items into these countries and then export them
to India".
3.3.1 Recommendations oftbe Working Group on Tariffs, 2001
The Working Group on Customs Tariffs (2001) was appointed by the
Government of India to revise the structure of customs tariff. In examining the issue of
customs duty reform the report makes several departures. It considers for the first time
the role of the exchange rate. both nominal and real. and the cost of non-tradahle
services in determining the overall protection. To this extent it considers the analysis of
customs duty reform within a macroeconomic framework.
It is shown that at any point III time, the different combinations of average
customs tariffs and exchange rate can give the same level of protection. The following
illustration shows the combinations of weighted average tariff rates and exchange rate
that would have given the same level of protection. considering a domestically produced
item that costs Rs. 50 and the same item is available in global market for $1, the domestic
producer of this item will have a protection of Rs. 6.12 (56.12 - 50) no matter which
tariff-exchanoe rate combination in columns 1& 2 of table 3.11 would prevail. o
84

Table 3.11: Combin.ations of Tariffs and Exchange Rate that Provide Equal ProtectIOn
Combination Exchange Rate ("!o) Wtd. avg tariff ("!o) Rs price of imported
item per $ of US price 1 43.33 29.5 Rs.56.12
2 44.89 25 Rs56.12
3 46.76 20 Rs 56.12
4 48.88 15 Rs 56.12
or til It: r Source Rep t of e 0 king Group on Cllstoms Tariff (200 1)
Secondly, it recommends that effective protection, instead of the nominal
protection be considered in arriving at the tariff rates. The effective protection that the
producer gets on his process of value addition depends on the value added proportion,
the average import tari ffs on the inputs used and the tariff on the output. The effective
protection rate is seen to be inversely related to the proportion of value added by the
producer and the average tariff rate on inputs used by the producer.
The Working Group (2001) recommends for the lower tariff rates for the reason
that higher tariffs reduce the competitiveness of the Indian economy. Higher tariffs are
inefflClent as they bias the overall economic system against exports. This is because a
depreciated exchange rate at the prevai ling domestic prices gives equal incentives to
exports and import substitution while a higher tariff gives more incentive for import
substitution as against the exports. The group also recommends for the phasing out of
various exemptions, while giving sufficient time for producers to adjust. The other
important recommendation was to target a uniform rate of import duty on all imports by
2004-05. This implied raising all tariff rates currently below 20 percent to 20 percent by
2004-05 while at the same time bringing down the peak rate to 20 percent. (The Peak
rate of 20 percent on maximum number of tariff lines has now been introduced in the
2004-05 budget). In thIS context we discuss below the theoretical arguments for uniform
tariff as against the non- uniform tariff and then the advantages or disadvantages of
levying of unifoml tariff for Indian economy.
85

3.3.2 Uniform Tariff vIs Non Uniform Tariff
The theoretical argument for uniform tariffs include the political economy
considerations, administrative convenience, and reduction of smuggling and corruption
in customs; whereas, arguments against uniformity includes promotion of strategic or
infant industries, revenue or balance of payments considerations and the uti lity of tariffs
as a negotiating tool at the WTO. It is believed that the non-uniform tariffs provide
scope for political lobbying leading to inefficient tariffs movmg away from welfare
maximising trade policies which can be avoided with levying of uniform tariffs.
Secondly, the problem of classification of goods, which is essential for a differentiated
tariff, is the most cumbersome to the customs department. Uniform tariff rules out such
a situation and allows for transparency and administrative simplicity, which also lowers
the administrative costs of trading. The advantages with the non-uniform tariff on the
other hand is that if a country is a large importer of a product then it can impose tariffs at
different levels to exploit the monopsony power it has. The infant industry argument
claims that the optimum tariff structure would not be uniform because protection would
be accorded only to specific industries affected by market failure or externalities but
would not be warranted for other industnes (Tarr, 2002).
But it is claimed that the advantages of low uniform tariff outweighs the
disadvantages it has and therefore, beneficial, especially for a developing country. Since
the developing countries do not possess the monopsony power on many products and
balance of payment problem is more a macroeconomic problem which can be attached
through direct tools like reducing domestic expenditure and expenditure switching
through depreciation of exchange rate, raising the domestic price of tradables in relation
to non-tradables thereby encounge exports and discourage imports. It is claimed that
differentiated tariff protection in support of infant or restructuring industries is typically
ineffective at addressing the alleged market failure problem. (Tarr, 2002)
On discussing the desirable structure of tariffs for Indian economy by the
Working Group on Tariffs (2001) there were two options, one of going for a single
uniform tariff and secondly of a tired tariff structure. It was felt that having a single
86

uniform tariff was a better measure than going for a tired structure for the following
reasons.
The possibilities of classifying the tired structure consisted at the broadest level
two categories of goods, producer goods and consumer goods. Producer goods could
further be classified into intermediate and capital goods. An intermediate good is one
that is transformed in some way in the process of being used for production into some
other form or shape. By definition therefore, an intermediate good is not finished or final
as it can and will be used by another producer to produce another intermediate good, a
capital good or a consumer good. The intermediate good can also be raw material. Since
both capital and intermediate goods are used in the production of other goods the tariff
rates on both are in general equally important in determining the effective protection in
the user industries. There is no logical reason for splitting up producer goods into two or
more categories. Consumer goods on the other hand are used only by individuals for
their consumption. Though both consumer goods and capital goods are finished, the
latter are an input into production of goods and services, while the former are not.
In practice, however, it is seen that such a strict application of the definition
becomes difficult in India, as there will be capital goods that are also commonly
classified as consumer goods. Many such dual use Items are used In commercial and
industrial offices and services. In addition to the problem of dual use there is also the
problem of drawing a line between the final finished consumer good and its sub
assemblies. This was demonstrated by examining the Input-output table for the economy.
The 115 sector Input Output (10) Table for the Indian economy shows that it is
not possible to define a set of sectors (A) whose output is used in the production of other
sectors (B) but which do not usc the output of B. Each of 115 goods and services directly
or indirectly enters into the production of every other good or service. It is therefore,
impossible to break up the set of intermediate goods into two or more tires in any rational
manner. The 10 table also shows that at this level of disaggregation all 98 goods are used
as intermediate inputs out of which 60 are consumer goods. But as a practical matter, it is
87
possible to select only a few important consumer goods for the purpose of having a
distinct tariff. In addition, the differential tariff can give rise to anamolies where the tariff
on the producers input is higher than on his output. It is impossible to devise a system in
which every single producer has an input tariff rate lower than the output tariff.
Therefore, the Group recommended that the optimal best tariff structure IS a
uniform import duty on all imports. This would also mean that the effective protection
for all producers is equal to single uniform tariff. Such a system of uniform tariff also
eliminates the possibility of negative protection as well as high rates of protection. In
addition such a system is neutral, promotes efficiency and competitiveness and
eliminates all administrative complexities and legal disputes about classification.
3.3.3 The Relation between Rates of Protection and the Scheduled Tariffs and the Implications of Uniform Tariff Policy for Agriculture in India
Here we discuss as to what is the desired effective rate of protection for some of
the major traded agricultural commodities seen through the effective rates measured as
the difference in the domestic and world prices in the output and the inputs along with the
input output coefficients. The difference between the effective rates (seen through
Jifference ill pri<.:es) and ine existing effective tariffs shows us the amount of protectIOn
towards agricultural commodities in India. Secondly, the divergence of the desired rates
of protection from the 20 percent effective tariffs shows us as to what extent the
commodities would gain or lose the protection with the introduction of 20 percent
uniform tariffpoJicy.
We measure the effective rates based on 2003-04 tariff rates, using the input
coefficients for the main tradable inputs like seeds, fertiliser and electricity from the Input
Output table for 1993-94. However, there is the limitation of not considering the non
tradable inputs in measuring the effective rates. Effective rates based on the difference in
average international price and representative domestic price is borrowed from the
literature. The effective rates based on scheduled tariffs are measured using the following
formulae:
88

Where,
• li-Layl}
ERP = j=1 ,
ti = tariff rate for commodity i,
aij = input-output coefficient
tJ = tari ff rate on / input.
Table 3.12: Effective Rates of Protection based on Scheduled Tariffs and Price Differences
! Product Effective Tariffs based on Effective Rates of Protection % ; tariff rates as given in tariff (1995-96 to 2000-01)
schedule for 2003 I , Rice 82.1 -35.66
Wheat I 58.5 -40.10 Jowar I 51.03 6.63 Bajra 53.52 -8.56 Maize 83.33 -13.61 Barley -7.5 -12.01 Gram 5.47 -22.79 Tur 8 , 13.15 Groundnut 30 16.31 Rapescedi),fustard 30 22.55 Soyabean 30 -10.66 Sunflower 30 -18.10 Groundnut oil 152.2 ".97 Rapeseed/Mustard oil 130 74.61
. Sovabean oil 63.33 48.61 Sunflower oil 130.0 68.55
; Coconut oil 212.85 70.73
Raw cotton 8.14 -37.69 Sugar 182.17 26.21 Tobacco 30 9.34 Skimmed Ylilk 30 ; 61.28
Butter 63.3 5381 , -;"ote: EJJectn'e Tariffs are measured usmg the 2003-04 tariff rates
EfFecti\'e rates based on average illfernalional price are borral.ed from Sharma Ani!, 2003
Column 3 of Table 3.12 shows the desired effective rates of protection to some of
the major traded agricultural commodities as seen through the price differences.
However, most of the commodities show the effective rates to be negative which implies
89

, ,
, t , t I •
taxation on the production of those commodities. So levying a tariff of any rate would not
make much any difference to protection on those items. Effective rates are negative for
rice, wheat, coarse cereals, sunflower and soyabean and cotton. Even for commodities
where the ERPs are positive, a comparison of effective tariffs (existing in 2003 when the
peak tariff was 30 percent) and effective rates shows that effective tariffs are higher than
the rates of protection. The peak tariff was, however higher in the earlier years. Thus
these commodities enjoyed additional protection till very recently.
The introduction of uniform tariff of 20 percent on the other hand would lead to
effective tariff of 20 percent too. The commodities that would be affected by introduction
of such policies are only edible oils. This would be more effective in the case of rapeseed
and coconut oil since their effective rates are above 70 percent. Other commodities like
sunflower oil, milk products and sugar to a lesser extent would be affected. The loss or
gain in protection with the introduction of such a policy however would be effective only
with the complete elimination of the quantitative restriction. Secondly, the introduction of
tari ff also would lead to the change in prices of those commodities leading to the change
in protection. Such dynamic effects are not captured in this analysis.
Thus, it is seen that most of the agricultural commodities would not be affected
with the introduction of uniform tariff and overall agriculture in India would be
beneficial. Other than the general advantages of imposing a uniform tariff, like avoiding
of smuggling, better tariff administration and lesser lobbying of large and influential
industries there are special advantages that would be gained by agriculture sector in
India. As it is seen earlier agriculture in the developing countries, including India is
biased with high protection to the manufacturing sector leading to the adverse terms of
trade for agriculture (Gulati and Pursell, 1991). An introduction of low uniform tariff on
the other hand would reduce the tariff rates on manufacturing. This would lead to
favourable terms of trade to agriculture with the lower input prices due to the reduced
protection in manufacturing.
90
3.4 Conclusions
To examine the market distortions in the agricultural sector through the trade
policy, we measure the nominal protection for select agricultural commodities in India
through the price wedge technique and the tariff rates in the tariff schedule. We see that
1\ l'Cs are less than one for a set of commodities like potato, tobacco, banana, groundnuts,
rapeseedimustard, onion and cotton indicating export barriers to trade. Similarly, the
NPCs were more than one for most of the edible oils, rubber, sugar, apple, coffee and tea
showing the existence of import restrictions. A few commodities like wheat, cashewnut,
pepper, jute and some edible oiIcakes have NPCs less than one under importable
hypothesis but more than one under exportable hypothesis due to the transportation and
marketing margins. The review of trade policies for these set of commodities shows us
that quantitative restrictions through quota licensing acted as a direct barrier to many
agricultural commodities during that period. Therefore, the immediate conclusion that is
generally drawn is that with the opening of trade in agriculture, exports of those
commodities with NPCs less than one would increase and the imports of those with NPCs
more than one is likely to be higher. But with the information on the existing policies and
the nature of export markets, we anticipate that there would not be a drastic change in the
export scenario though some change in imports of some commodities is expected. This is
due to the reason that barriers through other than that of restrictive policies like
infrastructure coexist and for some commodities the export policies would continue to be
adhoc to meet the domestic requirements. Examining the changes in the trade policies,
which can have direct and indirect impact on trade in agriculture, and their relationship
with the NPCs, we see that there exists no relationship between the two. Trade policies
were also ineffective to the extent to bring about price integration between the domestic
and world prices other than to some extent in the case of rice.
On analysing the protection through tariff rates, it was secn that with the
prevalence of QRs, tariffs were ineffective instruments of trade policy. Tariff rates in
agriculture were not sensititve to price changes seen through the nominal rates of
protection and the price differences. However, with the removal of QRs in the WTO
regime, tariffrate as an instrument of trade policy plays an important role. The Working
91

-
Group on Customs Tariff (2001) which was appointed by the government of India
recommended for a low uniform tariff for various reasons. We examine the implications
for protection in agricultural commodities on levying a low uniform tariff of 20 percent.
On comparing a 20 percent effective tariff with the desired tariff rate measured through
effective rates of protection on agricultural commodities, it is seen that most of the
commodities other than edible oils would not be effected, since the effective tariff rates
were either negative or less than 20 percent. In addition the introduction of a low uniform
tariff would lead to gain in the terms of trade for agriculture through reduced price for
inputs due to the reduced tariff in manufacturing sector.
92

Appendix
Table A3.1: Markets and Ports Chosen for the Price Adj ustments for Analysis of the Nominal Protection in Agricultural Commodities
Commodity Domestic price at World Price at Domestic Port (and variety)
Rice Nellore Thailand Chennai (Fine)
Wheat Ludhiana USA Mumbai (Farm Mexican Red)
Coffee Coimbotore Brazil Chennai (Plantation)
Tea Coimbotore (Rose) Srilanka Chennai
Sugar Kanpur Brazil Calcutta (M-30)
Cashewnuts Quilon Ivory Coast Cochin (Raw kernel)
Coconuts Cochin Indonesia Cochin (Huskcd)
Cake of Cohin Indonesia Cochin Coconuts (NM) Oil of Cohin Indonesia Cochin Coconuts (Ready) Groundnuts Hyderabad Argentina Kakinada
(Pods) Cake of Hyderabad Argentina Kakinada groundnuts (NM) Oil of Hyderabad Argentina Kakinada groundnuts (NM) Linseed Kanpur USA Laicutta
(Bold) Oil of linseed Kanpur USA Calcutta
(NM) Sesame seed Madras China Chennai
(Chermai, Black) Cake of Madras China Chennai Sesame (Expeller) Oil of sesame Madras China Chennai
(Chcrmai Agmark) Rapeseed! Rohtak Germany Kandla Mustard (FAQ) Cake of Rohtak Germany Kandla Rapeseed (FAQ) Oil of Delhi Germany Kandla
Rapeseed! (Papri) Mustard
93

Onion Bombay Nether- Mumbai INasik Variety) Land
Potato Kanpur Nether- Kanpur lDe~i) Land
Apple Delhi USA Calcutta lDelicious)
Banana Bombay Equador Mumbai (Khandesh)
Pepper Cochin Singapore Cochin (Ungarbled)
Ginger Calicut China Calicut (dry)
Rubber Kottayam Thailand Cochin (R.M 345)
Cotton Bombay Malaysia Mumbai lDesi)
Jute Calcutta Bangladesh Calcutta (W-5)
Tobacco Bombay USA Mumbai (Flue Virginia)
94

Fig A3.1: Trends in Nominal Protection Coefficients and Domestic and World Prices of Agricultural Commodities
NPC 1o, R;co .;l. "'- -' , -. " .
1.50 1 ~\'" '001 ~ ::::=V~-:~;_ 0.00
1970 1975 1980 1985 1990 1995
NPC for Wheat
~~~ 1 . ::~. .~ :~~~~,' .... t=
1910 1975 1980 1985 '':1YJ 1995
NPC -for Coffe e -~
400 =l I
::k;::I\1_ OOO~
1970 1975 ~980 '<J8':; F'r 19'J5 L-_
NPC for Tea
~~~f . ~;j ~.~~ f .... \z·~Y&i?1 000 I !
1970 1975 1080 108S 1"'_1'_' 1')95
300 2.50
200 • . 50 • . 00
0.50 000
NPC for Sugar
r.... .. ... ~ .. I tI ~ ! "-'"' \.
W
. . ... 1970 1975 1980 1985 1990 1995
-
DP AND WP OF RICE
1990 1995
--
DP and WP of Wheat 'l.. 800 :<
I a '0 600 0 400 • ,~ .. 200 &. 0 $C C
a 1970 1975 1980 1985 1990 1995
~- WP ___ OP] Year
OP & WP OF COFFEE
1970 1975 1980 1985 1990 1995
---+-DP ____ WPI YEAR
DP AND WP OF TEA
1970 1975 1980 1985 1990 1995 e--+---Occp-___ ---''-'-w=pl YEAR
2000 DPANDWPOFSUG!'R ~
~ ::t.¥·;ii==-r 1970 1975 1980 1985 1990 1995
-+- DP __ WPI YEAR
95

NPC for Cashew
::l~ '-'~ 100 ~ ...... \.vl 07sJG::: 050' ,'; ::: '- . - '-' ... ,'- ',-":'"
i~ 1970 '975 1980 1985 1990 1995
NPC for Groundnuts
:::r . I ~.~~=~~ ..
1970 1975 1980 1985 1990 1995
NPC for Rapeseed Cake
2.50 ,-------------------------
2.00 ~ . ~.. ~ 1.50~·' .. -IT:···· ~
~.~~j~~~~~ 197() 1975 1'180 l'J!3S 1:)90 1'J0S
NPC for Rapeseed Oil
1978 1975 1980 1985 1990 1995
NPC for Linseed Oil
~::~--.~ ~ ;:: j?0\A.:,~ 1970 1975 1980 1985 1990 1995
DP ANDWP OF CASHEW
~ __ ~~'970 1975 1980 1985 1990 1995 -+-OP -~WP I YEAR
DP AND WP OF GROUNCt\lVT S
-;.. 5000
I ; 4000
.. ,J.!>!>'#§ z 3000
'" 2000 .. Q 1000
0 1970 1975 1980 1985 1990 1995
-+- DP -----.=-W P YEAR
~ DP AND W P OF CAKE OF RAPESEED
S 600 T------------.
l:~L~ f------- 1970 1975 1980 1985 1990 1995 ~ DP ____ \VP YEAR
C'j.,. DP AND WP OF OIL OF RAPESEED
~~~~~ ... ~ ~ ~~ ~ ... .... i;j.:3 ~ 1000 = tw..::d:::'= . o _..,----- - I
1970 ;C,75 1980 1985 ~990 1995
-+-OP- _WP YEAR
DP AND WP OF LINsen
"- 2000 3-
::~~ Q Z
'" .. Q
1970 1975 1980 1985 1990 1995
-+-WP __ DPI YEAR
96

NPC for Apple
:::j1. ~~s;Bt; ... o 50 __ V .. ---'-'-----'---'-
" .' . ". '.
ooot-------------------------__ ~ 1970 1975 1980 ',185 1~1~IO 1995
NPC for Banana
150 j '""~ ~ i 050 ~~=~ .. {;;, ~ ~ .... -,
000 .~
1970 , 975 1880 1 'Zl8S 1 !J90 1985
NPC for Potato
250 r.1 A=--':-------------,
2.00 Jf.\.. . 1SO '\i'I: ... ~ ---rI:' 1 00 t-~+_____. .. P.+f__k-_::c__::c_-,2..c::..j o SO ....... r \l ~ ':: .': ,::: .. -.'It.
~ "'<' ..... " •. ' 0.00 L-__________ ~_'_'.~;....l
197C 1975 198(: 1S-le5 19SJO 1995
NPC for Onions
1970 1975 1980 11)85 1000 10~5
NPC for Pepper
1970 1975 1980 1985 1990 1995
Of' AND WP OF APPLE
2500 l~~~~~~~§~~~~i ~~~o~ r~.· ..' .. ' . ~ ~ ::f??£% 1970 1975 1980 1985 1990 1995
I-~~---+-OP ~Wp-~ YEAR
DP AND WP OF BANANA
;~l~ 1970 1975 1980 1985 1990 1995
~DP ___ vip YEAR
DP AND WP OF POT ATO
1500 ,-----------------------,.
~'000 t----------~~
~ 500 +----------------,~~~~ o
o ... ~~~~ 1970 1975 1980 1985 1990 1995
-+- DP ___ WP YEAR
DP AM) 'NP OF ONION
-+-OP ---wPl YEAR
97
DP AND WP OF PEPPER
1980 1985 1990 1995
YEAR

NPC for Jute
1970 1975 1980 1985 1990 1995
NPC for Rubber
19701975 19110 1985 19901995
NPC for Cotton 1 .50 ,-----------:-----,.;;::;
1 . 00 r-.z4t.---:----::;:~~____i"l:-';~
O. 50 +---'<-.:.:--.J~'-------:-='r---:::1 0.00 .1-________ "'-
1970 1975 1980 1985 1990 1995
1.00 0.80 u 'oU
NPC for Tobacco
040~==~==~~i;~~~~~~~!i1 020 f o 00 L... _____________ ~
1970 1975 1980 1985 1990 1995
DP ANDWP ('oF JUTE'.
) 1500
j... ~ I
~ 1000 r-.-. ---------~------~-tr--~~-1 Q. 5(l() _ ~
o ....... ,.~ . o 1970
-+- DP -_ \'·/P I YEAR
DP AND WP OF RUBBER
'4. 6000
;~:E· ~ ~ ~~~~'. .. ·~d:,*rr;.p = o 1000 _n.~ .------...:....
o 19FI . --i5 1980 1985 1990 '995
-.--DP -~i,.'p·1 YEAR
DP AND WP OF COTTON c_ ~ '> 1 '.. ~ ~ 6000 •
~ 4000 .;><; : ,.,.;-
~ 200: :., !~~'!!~
"'-~ Q
" 0( .. Q
1970 1975 1980 1985 1990 1995
-.-DP _WPj YEAR
DP AND WP OF TOBACCO
1970 1975 1~--'50 '965 1990 19~5
---+-DP -e-WP YEAR
98
Chapter IV
Factors Influencing Trade and the Relationship between Domestic and World Prices in Agriculture
4.1 Introduction
Trade in many agricultural commodities in India has depended largely on residuals.
Exports were allowed if surplus existed and imports were resorted to when shortages
were acute. Thus, trade has been used as one of the tools to regulate the domestic prices
for agricultural commodities for reasons like food security and protection to domestic
producers or industries.
We have seen earlier that liberalisation policies had limited impact on trade in
agricultural commodities. Nevertheless, the contribution of agriculture to the total trade
of India and its importance to the export earnings of the economy has increased since the
nineties. Similarly, trade being one of the tools to regulate the domestic prices of
agricultural commodities, the impact of changes in the quantity of trade in agricultural
commodities is immediately and directly seen on the domestic and world prices (if the
volume of trade is large enough to influence the world markets) of those commodities. As
trade policies are diversified across commodities, the relationship of trade with the
factors determining them would also be varied. An attempt is made here to examine the
changes in trade pattern in agricultural commodities, its causes and its linkages to the
domestic and world prices of agricultural commodities in India.
The changes in trade pattern in agriculture is examined through changes in the
commodity composition of exports and imports in the decade of nineties as against the
eighties and growth rates in major traded agricultural commodities in India for those
periods. The causes for changes in the trade pattern is observed through the elasticities of
exports and imports of agricultural commodities with respect to three important variables
linked to trade, i.e., domestic production, the relativc price (domestic price in relation to
99

world price) and world imports representing the world demand in the case of exports and
domestic production and relative price in the case of imports.
It is also seen earlier that world pnces of agricultural commodities are more
fluctuating than domestic prices in India and hence with the opening up of trade the
volatility of world prices would be transmitted to domestic prices (Nayyar and Sen,
1994). We examine whether this hypothesis holds good to most of the traded agricultural
commodities in India. As mentioned above, since trade policies towards agricultural
commodities in India are diversified, we test another hypothesis, whether the control of
trade in India has led to larger fluctuations in trade and therefore, less fluctuation in
prices as seen against the commodities that are freely traded. Here, we classify the
selected agricultural commodities in India into two groups. One set of commodities is the
food or the basic items like rice, wheat, sugar and edible oils. The other set of
commodities are commercial crops like cashew, coffee, tea, spices, rubber, tobacco and
jute the trade of which is relatively free. We then try to analyse the role of price policy as
against the role of external trade in reducing the volatility in domestic prices.
4.2 Changing Trade Pattern in Agriculture in India
Changes In lnt: traue paiiem in agricuimre are seen through the changes in the
commodity composition in exports and imports and the changes in the growth rates of
some of the major traded agricultural commodities in India. Tables 4.1 and 4.2 present
the commodity composition of agricultural exports and imports taking the average figures
for the decades of eighties and the nineties. Rice, oilcakes, tea, cashewnuts, coffee,
cotton, tobacco, groundnuts are some of the major exported commodities from India.
There are a few processed horticultural items, which have entered the export basket of
India in the nineties though they do not rank in the top list of commodities but have
contributed to the increase in the foreign exchange earnings from agricultural exports.
Rice has emerged as the highest export eamer in the nineties in the place of tea.
SImilarly, edible oilcakes have better ranking in the nineties.
100

Table 4.1 Composition of Agricultural Exports of India
Commodity Exports (in %to Rank Exports (in % to Rank 000 US$) Total 000 US$) Total Average Agri Average Agri 1980-89 Trade 1990-99 Trade
Total Agricultural Exports 17298324.6 31819696.0 of India
, ~illed paddy rice 220019.8 1.27 2 779365.6 2.45 1 I Cake of soyabeans 102725.0 0.59 8 528041.1 1.66 2
Tea 501060.2 2.90 1 394975.3 1.24 3 Cashe\\TIuts shelled 199260.2 1.15 4 342416.8 1.08 4 Coffee green 182513.4 1.06 5 269092.1 0.85 5 Cotton lint 117862.2 0.68 7 160262.5 0.50 6 Oil of castorbeans 58300.0 0.34 11 122428.0 0.38 7 Tobacco leaves 132550.3 0.77 6 120136.9 0.38 8 Buffalo meat 40810.5 0.24 12 110383.4 0.35 9 Pepper 87092.7 0.50 9 89893.4 0.28 10 Cake of rapeseed 17618.8 0.10 21 79411.8 0.25 11 Sugar refined 32231.1 0.19 15 59102.9 0.19 12 Beef and ,eal 726.3 0.00 96 58992.5 0.19 13 Coffee extracts 12554.9 0.07 26 53784.1 0.17 14 Onions dry 40530.3 0.23 14 53237.5 0.17 15 Groundnuts shelled 23024.7 0.13 17 52363.8 0.16 16 Cake of groundnuts 40563.3 0.23 13 49709.5 0.16 17 Sesame seed 16609.5 0.10 22 47495.9 0.15 18 Wheat 11367.2 0.07 31 38269.4 0.12 19 Pimento allspice 10262.0 0.06 33 37132.6 0.12 20 Flour of wheat 268.6 000 126 31433.9 0.10 21
. Spices n e s 22876.0 0.13 18 29412.1 0.09 22 ; Cake of rice bran 31685.3 0.18 16 25917.6 0.08 23
Sugar centnfugal 3468.7 0.02 55 25212.3 0.08 24 , ~olasses 5354.7 0.03 43 22137.9 0.07 25 I ~1ijtton and 1an1b 17831.9 A'A ~A 10'ln,ol C A A£ " V.IV LV J OJ7~ • .J V.VV LV
Pulses nes 696.3 0.00 99 18288.8 0.06 27
Walnuts 6049.7 003 42 17910.4 0.06 28
Anise Badian fennel 9750.8 0.06 34 16938.8 0.05 29
Tobacco products n e s 12744.8 0.07 25 15899.3 0.05 30
~angoes 14342.8 0.08 24 14302.5 0.04 31
~lango Pulp 11048.2 0.06 32 14086.8 0.04 32
Computed from FAa trade StatIstIcs, www.fao.org
In the case of imports, edible oils, wheat, cotton, breakfast cereals, rubber, jute are
some of the major imported items both in the eighties and in the nineties. Cashewnut
import which was insigni ficant in the eighties was an important import item in the
nineties. Similarly, the importance of cotton as an import item has increased. Rice, which
was an Important import item in the eighties was imported in insignificant amount in the
nineties. Thus, we see from the commodity composition of exports and imports that there
101

has been no major change in the ranking of the commodities in the import and export
baskets and trade in agriculture continued to follow the traditional pattern than in
exceptional cases.
T bl 42 C a e . f ompoSltlOD 0 Agricultural Imports of India Commodity Imports (in % to Rank Imports (in %to Rank
000 US$) Total 000 US$) Total Average Agri Average Agri 1980·89 Trade 1990 99 Trade
Total agricultural Imports 1522432.90 2158111.88 of India Oil of palm 244976.50 16.09 1 513344.63 23.79 1 Sugar refined 82392.70 5.41 4 131543.75 6.10 2 Cashew nuts shelled 2.00 0.00 116 114326.88 5.30 3 \\'heat 181933.70 11.95 3 110803.75 5.13 4 Cottonlmt 10145.50 0.67 20 83436.25 3.87 5 Pulses nes 18001.90 U8 14 80206.13 3.72 6 Oil of sunflower seed 3164.60 0.21 31 76219.63 3.53 7 Chickpeas 24460.60 1.61 12 69722.25 3.23 8 Cashew nuts 36262.80 238 10 64260.75 2.98 9 all of soyabeans 189842.20 12.47 2 60044.13 2.78 10 Peas dry 31168.90 2.05 11 49175.25 2.28 11 Almonds 11973.60 0.79 19 48334.88 2.24 12 all of rapeseed 80655.20 5.30 5 31858.75 1.48 13 Dates 17779.00 1.17 16 31201.00 1.45 14 BeanslBroad beans dry 59539.00 3.91 6 25505.50 1.18 15 Breakfast cereals 9320.80 0.61 21 21277.38 0.99 16 Compound feed 451.00 0.03 64 20140.50 0.93 17 R:..:bbe:- r:.1t""':':-::l1 dry 39441.90 2.59 0 10(),)"C{\ A 00 '0
0 , 07JV,JV V.OO '0
Lentil 5 14641.40 0.96 17 17641.13 0.82 19 Jute 7079.40 0.47 24 14516.25 0.67 20 Food prep. 2776.80 0.18 33 12643.38 0.59 21 Almonds shelled 475.70 0.03 63 9266.88 0.43 22
, Oil of cotton seed 1096.20 0.D7 46 7982.00 0.37 23 Sugar centrifugal Raw 2779.50 0.18 32 7802.43 0.36 24
, Natural rubber 5465.70 0.36 27 7657.25 0.35 25 i Raisins 6103.70 0.40 25 7332.88 0.34 26
Milled paddy rice 43829.60 2.88 7 6461.38 0.30 27 PistachiOS 755.80 0.05 51 6438.00 0.30 28
Oil of vegetable origin 7329.30 0.48 23 5502.00 0.25 29
Flax fiber raw 8302.50 0.55 22 4372.00 0.2(1 30 Baverages 2156.20 0.14 37 4089.00 0.19 31 Pepper 1179.40 0.08 44 4008.50 0.19 32 Computed rrom FAO trade StatistIcs. WW\y.ra~J.org
102

Tables 4.3 and 4.4 present the compound growth rates of the relevant export and
import items obtained through the semi log model.
Table 4.3 Compound Growth Rates in Exports of Major Traded Agricultural Commodities in India
Commodities/year 1980-90 1990-99
Rice 8.84 56.32
Wheat 45.74 -62.96
CofTee 2.50 8.78
Tea -1.24 -0.60
Sugar -37.62 -12.55
Cashew 4.48 5.32
Groundnuts -2.67 36.70
Cake of groundnuts -6.78 -21.80
Cake of rapeseed 33.90 -8.18
Sesame seed 24.92 5.45
Cake of sesame -4.60 -59.15
Cake of soya bean 29.21 10.03
Cake of sunflower 21.24 -50.21
Tobacco -5.49 6.04
Cotton lint -6.57 -20.69
Jute -8.06 2.65
Onions 4.53 -0.99
Potato -10.25 26.49
Apple 307 4.21
Banana 22.93 35.63
Rubber -12.03 63.57
Pepper 5.18 4.53
Ginger 0.63 3.99
Compuled from F AO Trade Statistics, \ ... \\1\\ .fal),org
103

Table 4.4 Compound Growth Rates in Imports of Major Traded Agricultural Commodities in India
Commodities/year 1980 90
RIce 36.50
I Wheat -24.84
I Sugar 1.72
Linseed 0.42
Linseed oil 18.99
Rapeseed/mustard oil -33.25
Oil of soyabean -25.81
Cotton lint 35.52
Jute -1.80
Rubber 25.51
Ginger -20.51
Tobacco 13.74
Computed from FAO Trade StatistICS, \\'\\w.fao org
Commodities with high or moderate export growth in the nineties
RIce, Groundnuts, Tobacco, Cake of Soyabean, Potato, Banana, Ginger, Cashew and Pepper
Commodities with high or moderate import growth in the nineties
Wheat, Sugar, EdIble OIls, Jute, GInger, Tobacco
1990-99
-28.02
119.45
200.D3
-19.39
-18.72
55.58
89.15
65.81
22.10
-4.72
15.51
43.56
Commodities with declining growth in exports in nineties
Onions, Tea, Wheat, Cake of Groundnuts, Cake of rapeseed, Cake of sesame, Cotton
Commodities with declining import growth in nineties
Rice, Rubber and Linseed oil
It is seen that traditional items of exports like tea, pepper, cashew along with
onions, wheat and cotton have shown moderate or low growth in the nineties as against
the eighties. Commodities like rice, groundnuts, tobacco, potato, banana and edible
104

oilcakes showed high growth in the nineties. Similarly, imports of wheat, sugar, edible
oils, jute, ginger and tobacco showed high growth rates (in some of the cases growth rates
show very high figures largely due to the fluctuations in the data) and Imports of rice.
rubber and linseed oil showed a declining growth. But it is seen that the commodities
which showed better performance in the nineties were of lower values and those like tea.
pepper and cashew of higher values have showed poor performance among the exported
items which would not be favorable in the long run. if the trend continues. It is also seen
earlier that India has been able to achieve only marginal increase in the share of
exportables, whose relative unit value is increasing or has remained constant during the
post reform period. India has significantly increased the share of items whose relative
unit value is less than unity and that too is declining in the post reforms period. Similarly,
in the case of imports, India has stopped importing a large number of primary
commoditics while moving in the direction of value added and processed agricultural
products (Datta, et. al,. 2001).
Though the contributing commodities for larger export earnings in the nineties are
only a few, i.e., rice, groundnuts and oilcakes, there are changes in growth rates of
exports and imports of most of the traded agricultural items in India. Given the
diversified nature of agricultural commodities and diversified policies towards them, we
examme the factors influencing trade in different agricultural commodities traded hv - - ,
India.
4.3 Factors Influencing Agricultural Trade in India
To examine the factors responsible for the changes in the trade performance of
agricultural commodities we specify the export and import functions for two decades by
choosing some of the important variables effecting exports and imports in agriculture.
We come across somc studies on examining the determinants of agricultural exports and
imports in India, (Kumar and Mittal, 1995, Mehta Rajesh, 2000) using the double log
model. We take the variables domestic production. the relative price, (the ratio of
domestic price to the world price) and the world imports for the period from 1980-89 and
105

1990- 99. We do not consider the policy variable since the policy changes in most of the
agricultural commodities are introduced in the late nineties and hence there is no
sufficient time series for the period after the introduction of the new policy. We also do
not consider the tariff rates as we see in the earlier chapter that tariffs were ineffective
instruments of trade policy in agriculture. We test for the trend in variables through the
ADF unit root test and make the series stationary wherever the series is not stationary.
log £'1 = loga + ~, log P'I + ~2 10gRP'1 + ~J 10gW/il +u it
Where,
and
Where,
E" Export of commodity i from India
P,t Production of commodity i in India
RP i , = Ratio of domestic price to world price adjusted to transportation and other
margms
WI" = World imports of commodity i
log/'I = loga +~, 10g?'1 +~, 10gRPit +uu
I,t = Import of commodity i to India
P" = Production of commodity i in India
RP" = Ratio of Domestic Price to World Price for Commodity i adjusted for
transportation and other margins.
It is expected in the export function that production and world imports have
positive relation with exports and RP is expected to have a negative relation, similarly, in
the import function production is expected to have a negative relationship and RP is
expected to have a positive relationship.
•
106

Table 4.5: Results of the Export Function (for the years 1980-90 and 1990-99)
Commodity Time Production RP World Imp R2 Period
Rice 1980-90 10.82 -9.66** -14.34 0.27 1990-99 25.39 * -0.007 -1.76*** 0.96
Wheat 1980-90 0.78 I -8.12 -18.57 0.69 1990-99 -24.78** -8.52 -2.56 0.47
Coffee 1980-90 0.56* 10.14** -0.31 0.84 1990-99 0.41 ** I -0.32 1.31 0.85
Tea 1980-90 1.34 I -0.02 -1.11 I 0.19 1990-99 3.18 I -0.87 0.75 I 0.37
Sugar 1980-90 1.44 -1.77 -11.6 I 0.51 1990-99 2.37 I -10.59 0.64 10.06
Cashew 1980-90 0.23 10.03 0.54** I 0.81 1990-99 1.07 -0.86 -0.13 I 0.73
Apple I 1980-90 2.38 -0.48 -9.25 I 0.48 I 1990-99 -2.99 0.89** 4.27 I 0.43
Banana I 1980-90 3.39 1.88* -4.73 10.84 I 1990-99 5.93* 0.40 -1.38 10.80
Potato I 1980-90 -2.57 -1.45* -0.21 10.68 I 1990-99 3.22 -0.96 0.82 I 0.61
Onion 1980-90 0.48 -0.03 1.47** 10.47 I 1990-99 0.07 -0.59 0.11 10.29
Pepper 1980-90 0.77· -0.25 0.55 I 0.88 I 1990-99 0.56 -0.50 -0.59 I 0.10
Ginger 1980-90 -0.39 0.04 0.07 0.09 1990-99 -4.18 -1.21 4.50 0.75
Jute 1980-90 1.48 -0.59 2.09 0.51 1990-99 2.14** -0.91 3.24** 0.77
Rubber I 1980-90 -3.55 2.73 8.38 0.56 1990-99 12.63· -3.96** -1.73 0.92
Cotton 1980-90 -3.78 -0.02 -0.52 0.34 1990-99 -4.45 -3.44*** -6.14 0.53
Tobacco 1980-90 1.47*' 0.12 9.88*' 0.53 I 1990-99 -0.06 -0.18 1.60 0.42
107

Groundnuts I 1980-90 10.92 I -0.92 I -0.73 I 0.42 I 1990-99 I -1.67 I -3.57 I 5.28 10.60
Groundnut L 1980-90 I -0.05 I 1.26* I -0.43 I 0.86 Cake I 1990-99 I 6.34* I 2.59** I -2.04 I 0.93
Rapeseed Cake I 1980-90 I 2.46 I -1. 96 10.24 10.76 I 1990-99 I -2.04 I -2.90* I -0.53 10.86
Cake of Sesame I 1980-90 I -0.03 I -1.16 10.27 I 0.21 I 1990-99 I -1.44 I -2.91 12.70 I 0.42
Note*- sIgnIficant at 1 % level, **- sIgnIficant at 5% level, ***= sIgnIficant at 10% level.
Table 4.6: Regression Results ofthe Import function (for the years 1980-90 and 1990-99)
Commodity Time Production RP R'
Rice 1980-90 10.76 -0.88 0.46 1990·99 -55.62*** -2.14 0.68
Wheat 1980-90 -4.07 I 2.88 0.13 1990-99 17.14*** 7.55 0.29
Sugar 1980-90 -7.17 10.49 0.35 I 1990-99 -17.76 7.13 0.44
Jute I 1980-90 10.77 2.27 0.33 1990-99 1-0.86 0.96*** 0.62
Rubber ' OQA ("Hi i ~ , 9" 1 r 1 n" J.-'vv-/v ... , 1.U 1 v.:>:>
1990-99 -2.96* 1.51** -0.52
Cotton 1980-90 I 31.04* 20.79** 0.76 1990-99 I 13.26** 4.74** 0.58
Ginger 1980-90 I -3.06 0.92 0.25 1990-99 I 8.34** -0.33 0.34
Rapeseed oil 1980-90 I -2.71 1.81 0.35 1990-99 I -1.22 -1.90 0.08
Linseed 1980-90 I -0.95 0.13 0.13 1990-99 I -1.33 -0.18 0.44
Linseed oil 1980-90 0.42 1.00 0.36 1990-99 2.25 1.78 0.44
Sesame seed 1980-90 -0.01 0.14 0.91 1990-99 0.12 0.06 0.74
. - 0 Note: *= sIgnIfIcant at I % level, **- sIgnIficant at 5 Yo level, *** sIgnIficant at 10% level.
108

It is expected that commodities like rice, wheat, sugar, edible oils, onions, potato
would be largely driven by domestic supply conditions and would be insensitive to the
relative price and world imports. Whereas, for other set of commodities trade of which is
relatively free we expect the exportslimports to be sensitive to the prices and the world
import variables. The results of export and import functions for the two decades are
shown in Tables 4.5 and 4.6. However, we do not get significant results in all the cases.
The results show us that production has emerged significant in the case of rice,
wheat, coffee, banana, pepper, jute, rubber, and tobacco and groundnut cake. However, in
the case of wheat though it has emerged significant it is not with an expected sign. There
are no significant results in the case of wheat, sugar, onion and potato with respect to
domestic production. Also a strict comparison of elasticities across the periods becomes
difficult since in very few cases there are significant results in both time periods.
Relative price on the other hand has emerged significant in the case of rice,
coffee, apple, banana, potato, rubber, cotton, groundnut cake and rapeseed cake in the
export functions and jute, rubber and co:ton in the case of import functions. Here too in
the case of coffee, apple and banana they are not with the expected signs. Even freely
traded items like coffee, tea, pepper, tobacco and groundnuts do not show significant
resulb lor relalive prices. Similarly, world imports-are significaut only-ill the case of jute,
tobacco, cashew and onion and not in those cases where we had expected like in coffee,
tea, rubber, cotton, tobacco and groundnuts.
Since we are able to draw limited inference from this analysis, we try to make a
disaggregated analysis in observing the behaviour of trade through the growth rates and a
comparison of growth in trade with growth rates of some of the important variables that
are linked to trade in agriculture.
109

Through the analysis of growth rates we see the linkages between agricultural
exports and imports (taken in quantity terms) and its related variables like domestic
production, domestic price in constant terms, rest of the world exports and world imports
of respected commodities (also seen in quantitites). This is presented in Appendix Table
A4.1. Here too the relationship among trade and other related variables can be separated
on the basis of the nature of the commodities. Of the commodities, which showed a high
growth in exports, rice, banana and potato showed a high growth in production too.
Though the production of rice for the period of nineties as a whole did not show a high
growth rate, the export surge in 1995 was largely due to the favourable production and
stock conditions in the late eighties and the early nineties (Chand 20m). Imports during
the same period had drastically declined. Fortunately external demand during the time
was favourable with the world import growth showing a high growth of 8.34 percent.
Inspite of the increase in production, freeing of exports allowed for a slower growth in
the domestic availability. This allowed for domestic prices to grow at a higher rate in the
nIneties, the growth of which was negative in the eighties.
The situation in wheat has been different. There has been decline in the growth of
production of wheat in the nineties as compared to that of the eighties. Export showed a
negative growth in this period. Imports showed a high growth of above eighty percent
(Growth rates here show high figures due to sharp tluctuations in the data). Wheat being
the most prominent food crop domestic availability of these items is made to be stable
and therefore, the domestic prices are not allowed to grow at a faster rate. Studies done
earlier also showed that export of wheat were of a very transitory nature and their
disposal as exports necessitated huge imports presumably to stabilise domestic prices to
meet domestic requirements. The trend in exports and imports of wheat reveals that one
or two years of good harvest resulted in a piling up of the wheat stock, which led the
country to pursue large exports. This was followed by large imports (Chand, 2001). Sugar
is both an importable and exportable item in the set of traded agricultural commodities.
Sugar showed a slower growth in the nineties with the falling exports and high imports.
l\everthless, slow growth in production in sugar was accompanied by an increase in
demand. Domestic price of sugar is however, controlled by allowing for larger imports.
110

Imports of edible oils are considered a burden to the foreign exchange of the
economy. After huge imports in the mid eighties to meet the deficit demand situations
India took several measures to attain self-sufficiency through an import substitution
strategy in edible oils. These measures included the launching of a technology mission on
oilseeds in the mid 1980s and market intervention operations in the late 1980s to ensure
attractive prices to producers. This boosted India's edible oil production to some extent
since the late eighties. But this was short lived and India had to resort to huge imports
following low production growth since the mid nineties. This growing import dependence
and stagnation in domestic oilseed production is often attributed to trade liberalisation in
response to WTO obligations and the adverse impact on producers. But in a liberalised
economic environment domestic production of edible oilseeds and oil started to fall due
to the steep decline in prices (Chand. .. ,}; 200 I). It is also believed that the policy of
import liberalisation would adversely impact the oilseed sector and Indian producers. It is
claimed that world prices of rapeseed-mustard are low because US and Europe provide
large direct and indirect subsidies to the producers due to which world prices are not an
appropriate yardstick for comparison with Indian prices. Though some input subsidies are
gIven to producers in IndIa, input subsidies given for oilseeds are very small. Oilseed
production in India receives less than one fourth of the input subsidy for rice (Chand,
i 999).
For other commercial crops like groundnuts, tobacco, cashew and pepper it is
seen through the growth rate analYSIS that domestic production was stagnant or had a low
growth. However, the exports of these commodities were favourable. This led to highcr
growth in the domestic prices in most of the cases. Similarly, for commodities with low
export growth like onions, tea, wheat, oilcakes and cotton there were clear fall in
production growth. It can also be seen that for those essential items like wheat, the import
growth was very high not allowing for the domestic prices to grow at a faster rate when
compared to those commodities that are more freely traded. Thus, it is seen that exports
and imports of many agricultural commodities are domestic supply driven rather than the
III

external factors. Trade IS used as a tool to control the domestic prices of agricultural
commodities in India.
-'A Stabili~' in and the Relationship between the Domestic and World Prices of Agricultural Commodities
One of the immediate impacts of liberalisation is the changes in domestic and
world prices. generally transmission of world prices to domestic prices. (or vice versa if
the home country is large enough to influence the world markets) moving towards the
integration of the two. The studies conducted earlier on the behaviour of domestic and
world prices and on the relationship between the two shows that the world prices of
agricultural commodities are highly fluctuating in nature and hence with the opening up
of Indian agncultural trade the volatility of world prices would be transmitted to domestic
prices (Nayyar and Sen 199-'). They make a comparison between the domestic and world
price indices classifying the commodities as importables and exportables and showed that
the world market in agricultural commodities is less stable than the Indian domestic
market. Secondly. it was seen that domestic price of both importables and exportables
have increased faster than border prices, with liberalisation. A comparison of domestic
and world prices were also made for some of the major traded agricultural commodities
and was found that the world prices of most of the commodities are more fluctuating than
the domestic prices. Another study states that the recent experience with raw cotton,
edible oils, pulses and wheat shows that the freeing of trade or an increased linkage with
the world market has increased plice instability in the domestic market (Acharya, 2001).
Such an analysis. however, needs a careful empirical investigation. The
comparison betwecn domestic and world prices would be meaningful only when the
prices are adjusted for the quality of the products, exchange rate, inflation and the time
series nature of prices. We examine here whether this hypothesis holds good to major
traded agricultural commodities in India, i.e. are the world prices more volatile than thc
domestic prices so that if there is complete elimination of restrictions on the movements
of commodities, the volatility is transmitted. Since the domestic prices are largely
112

controlled through the price policy in India, it is assumed that volatility in domestic
prices is controlled especially in the nineties after restructuring of the price policy.
We see in the first section of this chapter that trade has been insensitive to the
movements in the domestic and border prices seen relatively. But we also see later
through the comparison of growth rates that domestic prices are influenced by the
quantity of trade and hence are subject to fluctuations with the changes in the quantity of
trade. We try to examine whether the prices of commodities that are largely traded are
subject to more fluctuations than of those that are controlled. Secondly, we also examine
whether the changes in the quantity of trade show the changes in the relation between
domestic and world prices.
Before making any compansons of the prices, the prices are adjusted for the
quality of the products, exchange rate, inflation and for their time series nature. The
world prices are converted from dollar to rupee terms with the real exchange rates
obtained from RBI yearbooks. The domestic and world price series are deflated using the
\Vholesale Price Indices with 1990 base obtained from International Financial Statistics
published by the IMF. To take care of the time series nature of the data we obtain the
residuals of the series through the following equation:
Where,
Dp'=-a+~ t+u,
WP, =u, + p,t +v,
DP, = Domestic price of the chosen commodity
WP, = World price of the chosen commodity
t = time period
113
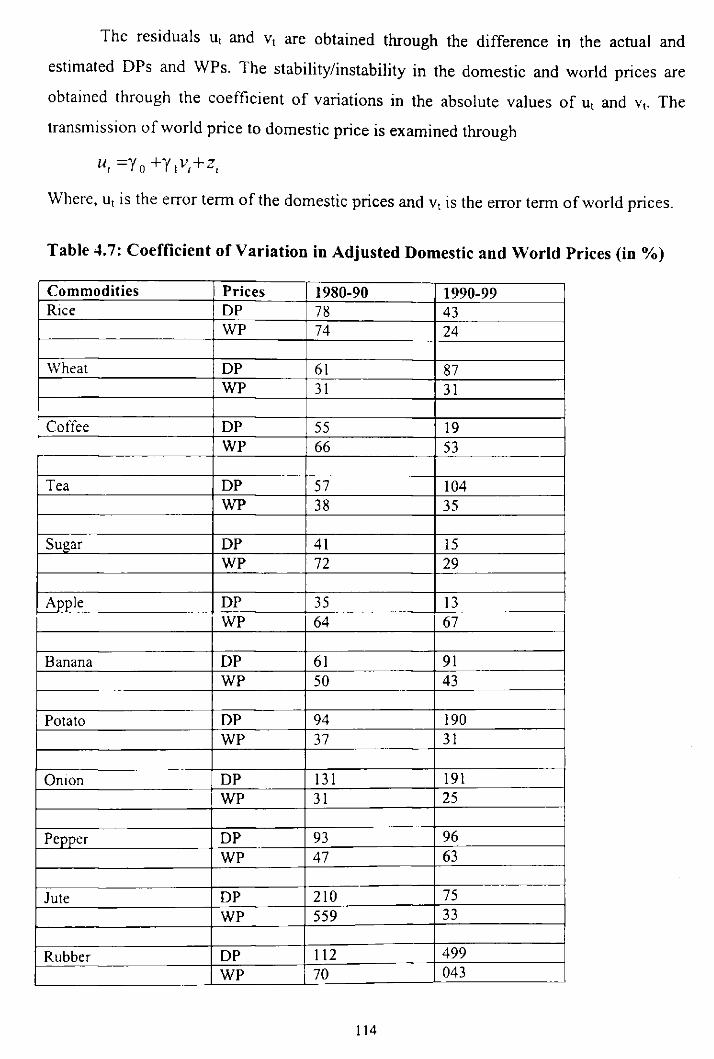
The residuals Ut and Vt are obtained through the difference in the actual and
estimated DPs and WPs. The stability/instability in the domestic and world prices are
obtained through the coefficient of variations in the absolute values of Ut and Vt. The
transmission of world price to domestic price is examined through
U, =Yo +YjV,+Zi
Where, Ut is the error term of the domestic prices and Vt is the error term of world prices.
Table 4.7: Coefficient or Variation in Adjusted Domestic and World Prices (in %)
Commodities Prices 1980-90 1990-99 Rice DP 78 43
WP 74 24
Wheat DP 61 87 WP 31 31
. Coffee DP 55 19 WP 66 53
Tea DP 57 104 WP 38 35
Sugar DP 41 15 WP 72 29
Apple DP 35 13 WP 64 67
Banana DP 61 91 WP 50 43
Potato DP 94 190 WP 37 31
Onton DP 131 191 WP 31 25
Pepper DP 93 96 WP 47 63
Jute DP 210 75 WP 559 33
Rubber DP 112 499 WP 70 043
114

Cotton DP 460 302 WP 59 38
Tobacco DP 15 28 WP 13 26
Groundnuts DP 424 40 WP 30 16
Cake of groundnuts DP 22 I I WP 53 37
Cake of rapeseed DP 69 49 WP 148 59
Oilofrapeseed DP 94 91 WP 48 34
Linseed DP 649 239 WP 1072 64
011 of Linseed DP 881 236 WP 30 29
Sesame seed DP 63 34 WP 27 31
; Cake of ,esame seed DP 49 259 WP 26 37
Soy-abean DP i04 5<}
WP 32 26
. Cake of Soya bean DP 54 68
WP 43 36
Oil of Soyabean DP 69 53 WP 32 29
The coefficients of variation (CV) in adjusted domestic and world pnces of
agricultural commodities for the two decades show that domestic prices are more
unstable than world prices for most of the commodities chosen other than :or coffee,
sugar, apple, potato, rapeseed and rice for both the decades (Table 4.7). Thus, the
argument that world prices are more unstable than domestic prices for commodities
traded by India or that which have the potential for trade do not hold good in most of the
liS

cases. But a careful observation reveals that other than in the case of rice and sugar the
commodities that are having higher coefficient of variation in world prices than the
domestic prices are those commodities like coffee, potato, and oilcakes which would not
be a matter of great concern for food security of India, even if the volatility is transmitted.
The shocks of fluctuations can be absorbed in such cases. In the case of rice since India is
having a large share in the world market, it is seen earlier that India is a price maker
rather than price taker (Parikh, et, al 1995).
Table 4.8: Coefficient of Variation in Trade and Adjusted Domestic Prices for the Period 1980 99 (in %) - 0
Commodity CV in Trade CV in DP Rice 211 63 Vv'heat 153 74 Coffee 45 66 Tea 13 82 Sugar 118 41 Cashew 32 80 Apple 84 39 Banana 152 107 Potato 112 61 Omon 53 131 Pepper 31 103 Ginger 124 64 Jute 102 162 Rubber 92 375
Cotton 104 724 Tobacco 27 161 Groundnuts 95 196 Cake of Groundnuts 66 60 Cake of Rapeseed 128 138 Oil of Rapeseed 113 152 Linseed 85 924 Ot! of Linseed 95 581 Sesarneseed 43 63 Cake of Scsameseed 96 49 Cake of Soya bean 102 75 Oil of Soyabean 145 88
ndo Note: CoefficIents of i'anatlOn III Trade are of exports for largely exported lIems a if imports for imported ones.
116

Also examining the stability in trade across the commodities, Table 4.8 shows
that CV s in trade of those commodities that are largely controlled for food security
reasons like rice, wheat, sugar, edible oils, are higher than of those commodities which
are relatively free like coffee, tea, banana, Jute, etc. The exception is seen prominently in
the case of onions. Similarly, the CVs in adjusted domestic prices of those corrunodities
are lesser than of other commodities. Making comparisons of CVs between eighties and
nineties, it is seen that variations in both domestic and world prices have been reduced
notably in the nineties. As one of the objectives of the revised price policy in the nineties
is to ensure stable prices to agricultural commodities one can attribute the reduction in
price instability to the price policy. We probe into this issue with little more detail.
4.5 Effectiveness of the Price Policy vIs External Trade in Reducing Domestic Price Volatility
One of the objectives of the agricultural price policy in India is to ensure better
and stable prices to farmers across the regions and commodities. If one view that is
largely prevailing in India is that the price policy would be effective in the control of
prices in the domestic market, the other view holds that such a system in India is
ineffective. Rather liberalising trade in agricultural commodities would be more effective
iii reducing pri.;;.:: Dudualions Uha and Srinivasan, 2003). On the basis of the analysis of
prices for two decades, the price policy and the trend in external trade, we try to examine
which of the two policies are more efficient in achieving the desired objective.
On examining the coefficients of variation (CV) in adjusted domestic and world
prices between eighties and nineties it is seen that variations in both domestic and world
prices have been reduced notably in the nineties other than in tea and tobacco. Since the
price policies were effectively introduced since the nineties and also that there has been
increase in the quantity of trade in some of the commodities, it is difficult to examine as
to which of the two has been more effective in leading to such an outcome.
117
The role of price policy till the end of seventies had been to subserve the national
objective of making food available to consumers at reasonable prices. While until the mid
sixties, the instruments of price policy comprised of regulating the activities of private
trade, imports and distribution of cereals at below market prices, after the mid sixties, the
price policy was assigned a positive role for augmenting the availability of food by
increasing domestic production. Agricultural Price Commission (APC) was set up in
1965, to advise the government on a regular basis for evolving a balanced and integrated
price structure. The policy framework was modified in 1980 when the balance between
the demand and supply of foodgrains was in sight. The emphasis of the policy, as
reflected in the revised terms of reference of APC, which was later, renamed the
Commission for Agricultural Costs and Prices (CACP) shifted from maximising
production to developing a production pattern consistent with the overall needs of the
economy. Maintaining stability in prices leading to stability in incomes was one among
the targets set. The policy was reviewed in 1986 when a long term perspective for the
agricultural price policy was presented to the parliament. Thus, it was emphasised that
the policy should seck to build into the system the major factors which in the long run
influences the prices of agricultural commodities making the farm scctor more vibrant,
productive and cost effective. The policy was again subjcct to rigorous review for an
effective functioning after a program of economic reforms was launched in 1991
(Acharya, 200i).
The instruments of the policy included the assurance of minimum support prices
for certain commodities, selective market intervention for some other commodities,
purchases of some commodities by public or co-operative agencies at market prices
dUling the peak am val period, open market sales by public agencies at fixed prices,
buffer stocking of rice and whcat, prucurement lcvy on rice mills and sugar facturies and
the distributiun uf subsidiscd foodt,'Tains and sugar in limited quantities under the PDS.
24 commodities are covered under the Minimum Support Program. These include paddy,
wheat, jowar, bajra, maize, ragi, barley, t,'Tam, tur, mung, urad, groundnut and other
edible oilseeds, copra, cotton, jute, virginia flue cured (VFC) tubacco and sugarcane
which together account for 82 percent of gross cropped arca and 72 percent of the total
118

value of crop output in the country. Other commodities like omon, potato, gmger,
chillies, pepper, castor seeds and some fruits are included under the Market Intervention
Scheme (MIS) (Acharya, 2001). However, of these programs, the Minimum Support
Program through procurement, especially for rice, wheat and a few other cereals has been
more regular and reasonably covered across the regions. But on reviewing the
effectiveness of price policy in case of some of the important agricultural commodities it
is seen that procurement or minimum support price has not been effective in two most
important items rice and wheat to which the MSP is widely covered.
Since 1991-92, in the case of wheat, the government has been announcing only
the Minimum Support Prices. By implication since then all the purchases made by public
agencies have been in the nature of price support operations. It is gencrally believed that
though the quantum of procurement and support purchases have been generally
increasing, the share of direct government intervention in the total marketed surplus of
rice and wheat has not increased. Out of the incremental marketed surplus of rice and
whcat, the share of the private sector has been considerably more than that of public
agencies (Acharya, 200 I).
Thus, attributing the reduction in price instability in the nineties to price policy
would not be meaningful. On examining the impact of trade on price volatility, it is seen
that there has been an increase in the quantity of trade in those commodities of whieh the
CV of domestic priccs have declined in the 90s like rice, sugar, jutc, cotton, groundnuts,
edible oils and oilcakes. Though it is examined that the CV in trade of those commodities
that are largely controlled for food security reasons like rice, wheat, sugar, edible oils,
have larger CV than those which are relatively free like coffee, tea, banana, Jute, etc and
CV in domestic prices of those commoditics are lesser than of other commodities. It is
thus seen that opening of extcrnal trade is more effective in reducing price volatility than
the price policies.
In addition Table 4.9 shows that an increasc in the quantity of trade has led to
larger transmission of prices. World prices are significant in lice, tea, banana, onion,
119

I
pepper, cotton and tobacco, which have larger share in the world market (Table A4.2)
and have larger export growth in the nineties with the exception of cotton. There is
significant relationship between the domestic and world prices in the nineties in the case
of rice, tea, cashew, banana, pepper, rubber and cake of sesameseed.
Table 4.9: Relationship between Domestic and World Prices of Major Traded . C Agricultural ommodities
Commodities 1980-90 ,. 1991-99 ?
WP R$ WP RI , RIce .334 .112 .685** .470
Wheat -.594** .353 -.299 .089 Coffee .313 .098 -.318 .101 Tea .570" .325 .913' .834 Sugar -.338 .150 -.556 .309 Cashew .954' .824 .986' .892
~ Apple .724' .524 -,303 .092 i Banana -.127 .016 .839* .703 I Potato .276 .076 -,125 .016 , Onion .677" .458 .521*** .27l
Pepper .959* .920 .985* .969 Jute -.561'" .315 -.117 .014 Rubber -.460 .212 .805* .648 Cotton -.163 .027 .592*** .350 Tobacco .272 .002 -.624 .389 Groundnuts .240 .058 -.349 .121 Cake of groundnuts .634** .402 .417 .174 Cake of rapeseed .347 .120 .161 .026 Oii of rapeseed .085 .007 . i 70 .029
Linseed .939 .002 -.560 .256 Oil of Linseed .771' .595 -.272 .074 Sesameseed .421'" .595 -.185 .034 Cake of Sesame seed .030 .001 -.709* , .503 Soya bean -.001 .000 .316 .100 Cake of Soya bean .598'* .347 .382 .146 OIl of Soya bean .731' .535 -.806 .649 NOle: '~Slgmficanl at 1 % level, •• ~ slgmficant at 5% level, "'- slgmficant at 10% level
4,6 Conclusions
On examining the changes in trade pattern of agricultural commodities, it was
seen that there has been no major change in the ranking of the commodities in the import
and export baskets and trade in agriculture in the nineties continues to follow the
120

traditional pattern than in exceptional cases. But on examining the growth rate in exports
and imports in the two periods we see the changes in the growth in trade of commodities
in the nineties as against the eighties. On trying to examine the causes for those changes
through the analysis of determinants of trade in agriculture with the export and import
functions we do not get the expected results in many cases. On comparing the growth
rates of those variables independently we see that high export growth in commodities like
rice, potato and banana were accompanied by good growth in production. It is also seen
that the domestic prices of those basic items are not allowed to grow at a faster rate.
Whereas. for commercial crops like groundnuts, tobacco, cashew and pepper the
domestic prices have grown at a faster rate. It is also seen through the comparison of
growth rates that an increase in exports is accompanied by a decline in import growth and
vice versa. Therefore, one can see that agricultural trade in India was largely supply
driven. However, of certain set of exportable commodities like rice, tea, sugar, cashew,
onion and rubber one can also see a threat to the export markets since the rest of the
world exports are growing at a faster rate.
The analysis of volatility in domestic and world prices through the coefficient of
variation in domestic and world prices adjusted for exchange rates, inflation and time
series nature of the prices shows that domestic prices of most of the agricultural
......................... ,..... --1: .. : __ ,-,UlIHIIUUIUC;::' are mort fluctuating than ihe worid prices. However, the instabIlity in
nineties has reduced as compared to the eighties in case of many agricultural
commodities. As the price policy of the nineties has not been effective in the nineties as
seen through the earlier studies and that the quantity of trade in those commodities has
increased especially with the commodities where the coefficient of variation in domestic
prices have declined, one can see that external trade is more useful in reducing price
instability in the domestic agricultural markets in India.
121

Appendix
Table A4.1: Compound Growth Rates in Trade and other Related Variables of Selected Agricultural Commodities
Rice
Year 1980-90 1990-99 Production 3.71 2.97 Exports 8.84 56.32
, Imports 36.50 -28.02 I \\' orld Imports 0.34 8.34
Rest of the world Exports 1.47 7.30 Domestic Price -0.84 4.37
Wheat
Year 1980-90 1990-99 Production 4.24 3.67 Exports 45.74 -62.96 Imports -24.84 85.67 World Imports -2.05 0.47 Rest of the World Exports 0.66 0.50 Domest]c Price -0.06 1.91
Coffee
Year 1980-90 1990-99 Production 1.35 6.76 Exports 2.50 8.78 World Imports 2.33 0.49 Rest of the World Exports 2.48 -0.58 Domest]c Price 12.94 -2.42
Tea
Year 1980-90 1990-99
Production 2.30 2.04
Exports -1.29 -0.60
World Imports 3.29 0.89
Rest of the World Exports 3.74 2.31
Domestic Price 3.77 3.44
Sugar
Year 1980-90 1990-99
Production 7.14 3.70
Exports -3762 -12.55
Imports 1.72 200.03
World Imports 2.56 3.07
Rest of the World Exports 2.25 5.17
Domestic Price -3.68 0.12
122

Cashew
Year 1980-90 1990-99 ProductIOn 4.87 4.22 EXDorts 4.49 5.32 World Imports 4.60 16.11 Rest of the World Exports 0.40 9.88 Domestic Pnce 1.96 3.42
Apple
Year 1980-90 1990-99 ProductIOn 3.59 2.33 EXDorts 307 4.21 World ImDorts 0.54 4.15 Rest of the World Exports 1.24 2.59 Domestlc Pnce 409 0.19
Banana
Year 1980-90 1990-99 Productlon 5.07 7.52 EXDorts 22.94 35.63 World Imports 7.59 4.52 Rest of the World Exports 2.64 5.07 Domestlc Price 1.93 10.52
Potato
Year 1980-90 1990-99 ProductIOn 5.58 4.88 Exports -10.25 26.49 World Imports 4.46 0.49 Rest of the World Exports 406 0.14 Domestlc Pnce ·]03 1.12
Onion
Year 1980·90 1990·99 Productlon 2.41 3.85 Exports 4.53 ·0.99 World Imports 3.34 5. I 5 Rest of the World Exports 2.73 6. I 8 DomestIC Pnce 1.97 1.75
Pepper
Year 1980·90 1990·99 ProductIOn 6.55 3.21 Exports 4.67 4.53 World Imports 10.24 18.67 Rest of the World Exports 1.97 0.92
DomestIC Pnce 8.47 18.19
123

Ginger
Year 1980-90 1990-99 ProductIOn 6.81 5.76 Exports 0.63 3.99 Imports -20.51 15.51 World Imports 6.88 7.55 Rest of the World Exports -20.51 15.51 Domestic Price 1.13 3.43
Jute
Year 1980-90 1990-99 Production 1.33 2.32 Exports -8.06 2.65 Imports -1.81 22.10 World Imports -3.62 -0.76 Rest of the World Exports -155 1.73 Domestic Pnce 2.39 -2.54
Rubber
Year 1980-90 1990-99 Production 7.12 7.84 Exports -12.04 63.57 Imports 25.52 -4.72 World Imports 3.14 2.85 Rest of the World Exports 2.68 3.57 Domestlc Price -1.94 2.97
Cotton
Year 1980-90 1990-99 Production 2.78 2.35 Exports -6.58 -20.69 Imports 34.67 65.81 World Imports 1.85 0.97 Domestic Price -1.60 3.57
Tobacco
Year 1980-90 1990-99
Production -0.33 2.21
Exports -5.50 6.04
World Imports -0.03 3.69
! Rest of the World Exports 0.54 2.87
. Domestic Price -1.15 2.96
124
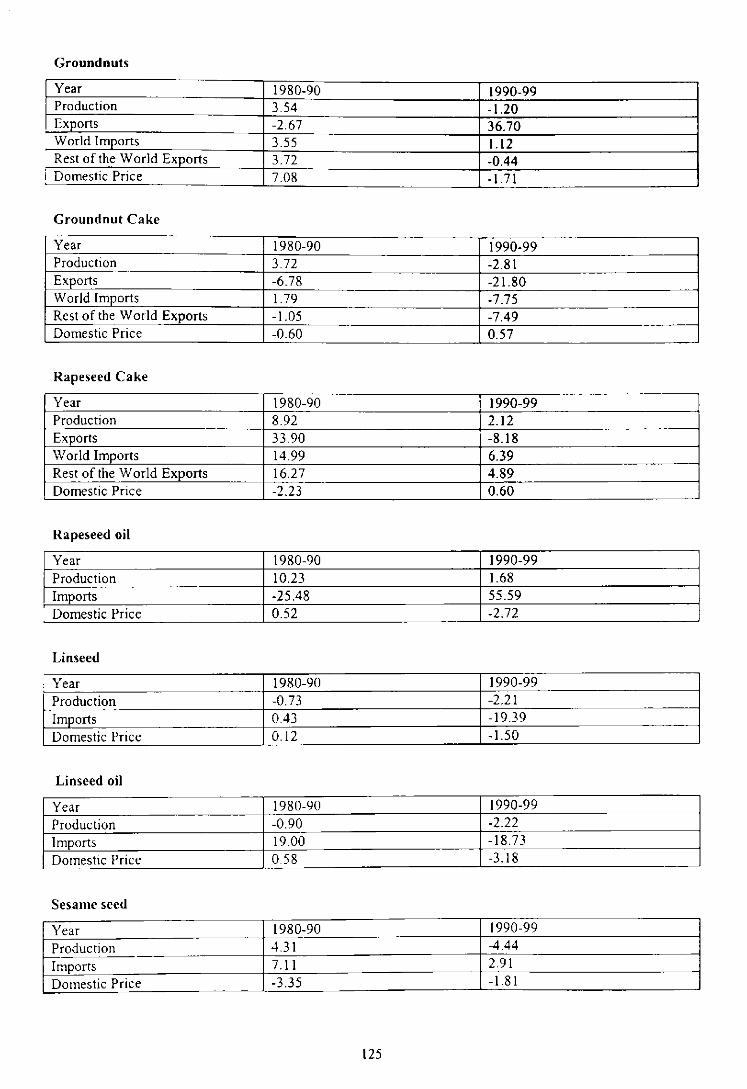
Groundnuts
Year 1980-90 1990-99 Production 3.54 -1.20
I Exports -2.67 36.70 World Imports 3.55 1.12 Rest of the World Exports 3.72 -0.44
i Domestic Price 7.08 -1.71
Groundnut Cake
Year 1980-90 1990-99 Production 3.72 -2.81 Exports -6.78 -21.80 World Imports 1.79 -7.75 Rest of the World Exports -1.05 -7.49 Domestic Price -0.60 0.57
Rapeseed Cake
Year 1980-90 1990-99 Production 8.92 2.12 Exports 33.90 -8.18 World Imports 14.99 6.39 Rest of the World Exports 16.27 4.89 Domestic Price -2.23 0.60
Rapeseed oil
Year 1980-90 1990-99 Production 10.23 1.68 Imports -25.48 55.59 Domestic Price 0.52 -2.72
Linseed
, Year 1980-90 1990-99 Production -0.73 -2.21 Imports 0.43 -19.39 Domestic Price 0.12 -1.50
Linseed oil
Year 1980-90 1990-99
Production -0.90 -2.22 Imports 19.00 -18.73 Domestic Price 0.58 -3.18
Sesame seed
Year 1980-90 1990-99
Production 4.3 I -4.44
Imports 7.11 2.91
Domestic Price -3.35 -1.81
125

Cake of Sesame
Year 1980-90 1990-99 Production 4.60 -5.06 Exports -4.61 -59.15 World [mports 15. 11 -18.88 Rest of the World Exports 12.45 -15.06 Domestic Price 0.21 2.26 World Price 6.65 14.16
Table A4.2: India's Share in World Imports and Exports of Agricultural Commodities (in %)
1980 1990 1999 Commodities I E I E I Rice 0.02 3.93 0.62 7.88 0.01 Wheat 0.58 0.19 0.07 0.11 1.\3 Coffee 0.00 2.12 000 1.80 0.00 Tea 0.00 28.72 0.00 21.41 0.21 Sugar 1.47 0.97 0.10 0.01 3.03 Cashe,,"uts 0.00 46.90 0.00 59.17 1.26 Apple 0.00 0.13 0.00 0.05 0.05 Banana 0.00 0.00 0.00 0.00 0.00 Potato 0.01 0.23 0.00 0.03 0.00 Oman 0.00 6.71 0.00 7.93 0.00 Pepper 0.13 18.42 0.52 15.50 1.10 Ginger 1.04 35.78 1.21 11.52 2.77 Groundnuts 0.00 0.00 0.00 1.61 0.00 Groundnut cake 0.00 40.85 0.00 12.59 0.00 Rapeseed cake 0.0\ 0.59 0.00 11.76 0.00 Rapeseed oil 18.86 0.00 0.16 0.00 9.76 Co,..,. ....... " ~,.1~_ " ""
,., ('"., A AA 1.94 0.00 .......... ~ .......... \,..Ul'l,· .... V.VV J.J . .J,," v.vv
Sunflower oil 0.00 0.00 0.00 0.00 9.18
Sovabean oil 20.33 0.00 1.15 0.00 6.83
Palm 011 16.84 0.00 5.50 0.00 18.76
Linseed oil 0.07 0.00 0.58 0.03 0.24
Jute 0.94 1.27 7.97 4.61 36.83
Rubber 0.02 0.00 1.06 0.00 0.28
Cotton 0.00 2.09 0.00 5.38 3.96
Tobacco 000 2.12 0.00 0.81 0.00 Source. Compuled from FAO slallstlcs. ",,,,,,.(ao.org Note: I ~ share of India in world Imports, E ~ share of India in world Exports
126
E 11.14 0.00 2.69 14.57 0.02 60.26 0.08 0.06 0.23 4.87 14.39 6.08 7.50 0.70 2.05 0.03 0.00 0.00 0.00 0.00 0.01 2.00 0.0\ 0.19 1.06
Chapter V
Changing Scenario in Agricultural Trade and its Implications for Macro Economic Variables in India
5.1 Introduction
India has very little share in the world trade of agricultural commodities as a whole.
Looking at the latest figures, the share of India's agricultural exports and imports in world
trade is just 1.2 percent and 0.7 percent respectively (FAO, 2002). But the contribution of
agriculture to total trade of India and its importance to the export earnings of the
economy has increased since the nineties. From a net importer in the early sixties, India
has emerged as a surplus trader in agriculture in later periods. Since, agriculture is an
important sector in the Indian economy, which provides employment to a large section of
population, the changes in policies towards trade in this sector can have a large bearing
on its own and other sectors of the economy. The studies on analysing such linkages
among the economic variables in India by Subramaniam (1993), Parikh, et, al (1995),
Stonn (1997) show that the outward orientation of the economy including agricultural
sector would lead to higher growth of the economy. However, the views on outward
orientation leading towards growth are varied.
The debate originating III the mid 1980s in response to the adoption of New
Economic Policy focussed on foreign trade policy and industrialisation (Stonn, 1997).
Ahluwalia (1985, 1991), Bhagwati (1988), Dhar (1989) and Joshi and Little (1987),
claimed that the more restrictive policies followed in relation to the private sector were
largely responsible for the demand deficiency and the stagnation in manufacturing since
mid 1960s. These authors attributed the marked acceleration in economic growth,
particularly industrial growth during the 19805 to the new policy pointing in particular to
the move towards greater outward orientation.
On the superiority of the export-promotion strategy over inward-looking
strategies, Ballasa (1990) is of the view that inward oriented strategy of development is
127

likely to permit rapid economic expansion initially. However, it will eventually run into
difficulties as the limitation of domestic markets leads to shifts into new activities that do
not suit the country's resource endowment, where economies of scale are not exploited.
Another problem that is pointed with continued inward orientation is the emergence of
foreign-exchange bottleneck, and the inability of the economic structure to respond
adequately to changes in the pattern of domestic and international demand. This may lead
to widening current-account deficit and financing difficulties in the subsequent stages of
industrialisation (Jalan, 2001)
Other group of economists including Raj (1986), Chakravarty (1987), and Bhaduri
(1993) took a less favourable view of the new economic policy. Arguing that the
constraint on industrial growth is basically on the demand side, these authors held that the
new policy was designed to exploit the already highly skewed distribution of incomes.
This would generate more demand for consumer goods among the higher income groups,
and at the same time would lead to larger deficit on the BoPs current account, making the
economy as a whole much more vulnerable to the risks involved in world trade. Instead,
they urged the adoption of an alternative, agriculture-led industrialisation strategy, which
is based on internal rather than external demand. It is argued that this can be done by
large-scale program of public investment in irrigation and other agriculture-related
in[raslruc[ure.
Another view holds the importance of 'initial conditions' in determining the pace
of growth (Kindleberger, 1980) claiming that liberal trade policy alone is not sufficient in
promoting growth, but it is important in influencing the eventual outcome. These
conditions include differing resource endowments, the opportunities in international
trade, the stock of technical knowledge, the prevailing economic and social links and so
on.
To substantiate with some of the empirical evidences, it is shown that
liberalisation in the agricultural sector alone is not sufficient to achieve a higher growth,
rather opening the non-agricultural sector would lead to higher growth in the sector and
128

the economy. This is seen through an applied general equilibrium model (Parikh, et, al
1995). One of the striking results seen is that Non-agricultural Trade liberalisation (NTL)
has more growth inducing effect than Agricultural Trade Liberalisation (ATL). The
agricultural GDP increase due to ATL is only about 0.9 percent in the year 2000 while it
is 4.3 percent due to NTL.
Keeping the above arguments in background, an attempt IS made to link the
behaviour of trade in agricultural and non-agricultural sectors with certain macro
economic variables such as GDP in agriculture and in the economy, the level of prices,
the terms of trade for agriculture and the trade balance in the light of changing policies in
trade towards agriculture and non-agricultural sectors in India. We probe into this issue,
by first examining the trends in agricultural exports and imports through simple growth
rate analysis and then by relating them to the growth in the above mentioned macro
economic variables in the economy. The importance of agriculture to the trade balance of
the economy is examined through the contribution of surplus generated in agriculture to
the non-agricultural import bills of the economy. We then examine the relationship
between trade and growth in agriculture and of the economy through the linkages it has
with other variables.
The trends in India's total, agricultural and non-agricultural exports and imports are
shown in constant prices in figures 5.1 to 5.3. It is seen that trade scenario in India both in
the agricultural and non-agricultural sectors have been changing since the nineties.
However, some notable changes in movements in merchandise exports and imports were
observed since eighties itself, much before the introduction of economic reforms of 1991.
It is observed that liberalisation in capital goods made imports to grow at a faster rate in
1980s than the exports (Table 5.1). The burden of imports was much higher to the
economy since it needed sufficient time for exports to be reaped through export
promotional measures as recommended by the export promotional councils in the
eighties.
129

Fig 5.1: Trends in Merchandise Exports and Imports of India (at Constant Prices 1981-82= 1 00)
Merchandise Exports and Imports of India (at
70000 Constant Prices)
60000
'" 50000 ..--'" 40000 A a ~ 30000 .:. u
'" 20000 <>: 10000 .5 0
Year I -+- MO ______ MI
Note: ME= merchandise exports, MI= Merchandise Imports. Series are deflated using the WPI, 1981- 82=100
Source: RBI (2003) Handbook o/Statistics o/the Indian Economy
Table 5.1: Simple Growth Rates in Agricultural Trade, Non-Agricultural Trade and Merchandise Trade of India
Year AE AI ME MI NAE NAI 1981-82 8.33 74.74 11.96 4.37 13.19 2.16 1982-83 -5.77 -11.65 7.51 0.13 11.84 0.75 1983-84 1.46 51.23 3.22 3.01 3.69 0.74 1984-85 10.84 -33.76 12.89 1.65 13.43 4.14 1985-86 -1.61 14.62 -11.15 9.88 -13.65 9.66 1986-87 4.77 -19.25 8.01 -3.40 8.97 -2.65 1987-88 10.28 9.67 16.32 2.29 18.05 2.00 1988-89 -1.88 38.66 20.13 18.13 26.04 17.27 1989-90 26.34 -2.75 27.30 16.51 27.50 17.46 1990-91 14.93 -21.06 6.66 10.83 4.94 12.13 1991-92 15.33 7.78 1904 -2.55 19.88 -2.84 1992-93 4.53 76.79 10.76 20.34 12.12 18.53 1993-94 28.28 -25.32 19.90 6.46 18.19 7.96 1994-95 -5.18 130.13 6.92 11.02 9.59 7.10 1995-96 42.38 -7.87 19.47 26.63 15.08 2906 1996-97 1260 5.56 5.04 6.47 3.25 6.51 1997-98 -3.58 26.72 - 4.45 5.87 6.52 4.82 1998-99 -2.16 57.38 1.95 9.78 2.90 6.89
1999-00 -9.57 6.29 9.71 16.47 13.98 17.37 Note. AE=Agncultural Exports, AI=AgnculturaIImports, ME- MerchandIse Exports, MI= Merchandise
Imports. NAE=Non-agricultural Exports, NAI=Non-agricultural Imports Source: Computed from the data obtmned from Ministry 0/ Agriculture (2003). Agricultural Statistics at a Glance. RBI (2003). and Handbook a/Statistics o/the Indian Economy.
It is seen from Table 5.1 that the boost to exports came only in 1989-90 when
India's merchandise exports grew by 26 percent seen in constant terms than the previous
130

year, which was highest in the decade. But this growth in exports seen in 1987 to 1990
was not a sustained growth. The decade of 1991 began with the economic crisis. Export
growth declined, foreign exchange reserves fell to a low of I billion $, industrial growth
collapsed to a negative of 1.3 percent, inflation was soaring above 16 percent in August
1991, high fiscal deficits, economic growth was plunging to less than 1 percent in 1991-
92. This led to stabilisation measures with wide ranging reforms in foreign trade and
other macroeconomic policies like that of fiscal policy, industrial policy, the exchange
rate, foreign investment, the tax system, capital markets, and the public sector. However,
the rewards to these reforms were quite swift. Overall economic growth revived to 5.3
percent in 1992-93 and accelerated thereafter. Industrial revival took a little longer but
growth accelerated to 9.3 percent by 1993-94. Foreign investment rose rapidly from a
negligible base to over $4 billion by 1993-94, foreign currency reserves recovered then
onwards (Acharya, 200 I). The later part of nineties again saw the exports to be stagnant.
Fig 5.2: Trends in Agricultural Exports and Imports of India (at Constant Prices 1981·82= 1 00)
r----------------------Agrlcu Itural Exports and Imports of India (at Constant I
Prices)
on 10000 ~--.
! 8000 +------------:::=---===-;i~"!:!:::~ e 6000 (,) on
'" oS
4000
Note. Ai:> Agricultural Exports, AI - Agriclliturallmpnrts. Series are deflated using the WPI, 1981·82=100
SOl/ree· RBI (2003) Handbook of Statistics of tlte I"dian F:COIWInY
131

Fig 5.3: Trends in Non-Agricultural Exports and Imports ofIndia (at Constant prices, 1981-82= 100)
., .. ~
0 ~
u ., CI: c:
Non-Agricultural Exports and 1m ports of India (at
Constant Prices) 60000 50000 --40000 ~
30000 / ~ 20000 10000
0
Year l-+-NAE __ NAI
Note. NAE= Non Agricultural Exports. NAI= Non Agricultural Imports. Series are deflated using the WPI. 1981-82=100
Source. RBI (2003) Handbook 0/ Statistics 0/ the Indian Economy
The trends in agricultural exports and imports too showed a similar picture. There
has been notable performance of exports in agricultural commodities in 1987-88 and
1989-90 though the major shift came in 1994, which is largely contributed by the exports
of rice in the same year. But the main contrasting feature of agricultural trade as against
the non-agricultural trade is that an increase in export growth is accompanied by sharp
decline in import growth, which is not the o;ase in the non-agricultural trade sector. This
has helped to the foreign exchange earnings of the economy since the surplus in the
agricultural sector contributes to the non-agricultural imports.
5.3 Agricultural Trade and Trade Balance of India
The growing non-agricultural exports at a consistent rate than the agricultural
exports make the contribution from agriculture seen as percentage of agricultural exports
to total exports insignificant. The share of agricultural exports to that of total exports of
India has reduced from 31 percent in 1980-81 to 17 percent in 1999-00. However, Table
5.2 shows that the contribution from agricultural exports to the net non-agricultural
import hills has increased since the nineties. This was as high as 56.8 percent in 1991-92,
68.3 percent in 1993-94 and 40 percent in 1995-96. The surplus generated in agricultural
132

trade would help in enhancing non-agricultural imports which would promote growth in
all sectors of the economy.
Table 5.2: Contribution of Net Agricultural Exports to Non-Agricultural Imports of India
Year Contribution of Agricultural Trade surplus to Non-
Agricultural Import bills (in %)
1981-82 14.7 1982-83 13.7 1983-84 12.1 1984-85 5.4 1985-86 8.0 1986-87 15.7 1987-88 11.3 1988-89 3.7 1989-90 25.6 1990-91 25.0 1991-92 56.8 1992-93 30.2 1993-94 68.3 1994-95 41.9 1995-96 39.2 1996-97 40.3 1997 -98 15.7 1998-99 20.8
Source: Computed from the data obtained from RBI (2003) Handbook of Statistics of the Indian Economy
The trade balance of India, which is the difference in the total export and import
bills, has always been negative ranging from -\ percent to -4.5 percent of the GDP since
the eighties (Table 5.3). Though the net agricultural exports have contributed notably to
the non-agricultural import bills from the late eighties, the impact of agricultural trade on
the trade balance of the country is seen minutely. Even when the agricultural export
growth has been very high in the period from 1993-94 to \997-98, the trade balance of
the country still continued to be negative largely due to the non-agricultural import bills.
Nonetheless, the importance of agricultural exports to that of the economy is to be seen in
terms of the linkages it creates with other sectors, which leads towards higher growth in
the economy.
133

:
Table 5.3: Trade Balance of India
Year Trade balance of Trade balance as % India (in Rs crores) ofGDP
1980-81 -5838.44 -4.49 1981-82 -5801.65 -3.82 1982-83 -5489.38 -3.24 1983-84 -6060.75 -3.05 1984-85 -5390.52 -2.42 1985-86 -8763.1 -3.51 1986-87 -7643.81 -2.75 1987-88 -6570.08 -2.08 1988-89 -8003.72 -2.11 1989-90 -7669.93 -1.75 1990-91 -10635.2 -2.08 1991-92 -3809.03 -0.65 1992-93 -9686.27 -1.44 1993-94 -3349.62 -0.43 1994-95 -7296.55 -0.80 1995-96 -16324.8 -1.52 1996-97 -20102.6 -1.62 1997-98 -24075.7 -1.73 1998-99 -38578.7 -2.41
1999-00 -55675.1 -3.16 SOl/ree Computed from the data obtamedfrom RBI, Handbook of Statistics a/the Indian Economy (2003).
5.4 Agricultural Trade and Gross Domestic Product
In this section an attempt is made to examine the relationship between trade and
Gross Domestic Product in agriculture and the causation between the two. It is observed
from Table 5.1 that trade in both agricultural and non-agricultural sectors showed high
growth in the nineties. On examining the growth in GDP presented in Table 5.4, it is seen
that the high growth in exports was preceded by a higher growth in the economy in the
prevIous years.
134

Table 5.4: Simple Growth Rates in Agricultural GOP, Non agricultural GOP and GOP of India, and Share of Agriculture in GOP of India
Year Growth Growth in Growth % share of inGDPA GDPNA in GDPI agriculture
in GDPI 1981-82 5.61 6.17 5.97 3564 1982-83 -0.52 5.04 3.06 34,40 1983-84 10.29 6.32 7.68 35.23 1984-85 1,44 5.87 4.31 34.26 1985-86 0.69 6,42 4.45 33.03 1986-87 -0.61 6.77 4.33 31,46 1987-88 -1.39 6.22 3.83 29.88 1988-89 16.81 7.78 10.47 31.59 1989-90 0.74 9,46 6.70 29.83 1990-91 4.43 6.05 5.57 29.50 1991-92 -1.85 2.62 1.30 28.59 1992-93 6.22 4.68 5.12 28.88 1993-94 4.10 6.64 5.90 28.39 1994-95 5.08 8.12 7.25 27.82 1995-96 -1.13 10.61 7.34 25.62 1996-97 10.10 7.06 7.84 26.16 1997-98 -2.82 7,49 4.79 24.26
1998-99 6.87 6.39 6.51 24.34
1999-00 -0.11 8.05 6.07 22.92 Note: GDPA- Gross Domestic Product from Agnculture, GDPNA = Gross Domestic
Product from Non-agricultural Sectors, GDP/= Gross Domestic Product of India
In the agricultural sector in 1989-90, export growth was high with 21 percent
increase than the previous year. This was mainly due to the oilseed revolution when India
attained a comfortahle position_jn_Jh~production of edible oils, whkh was also opened up
for exports. Agriculture GDP in 1989-90 had increased by 25 percent. The import bills on
agriculture went down during the same period since edible oils constituted a large share
in the total ab'11Culture imports of India. The later break came in 1995 with a sharp
increase in rice trade, which was preceded by very high growth in rice production in the
previous year. Similarly, high growth in merchandise exports in the years 1984-85
(12.89%),1989-90 (27.3%),1993-94 (19.9%) and in 1995-96 (19.47%) was preceded by
high growth in GDP in the previous years. Thus, one side causation from GDP to exports
is clearly established looking even at the simple growth rates.
Similarly for agriculture, the policy front was favourable for such an outcome.
With the new economic reforms in 1991, though there were no major policy changes
135

relating directly to agriculture during this period there were some incentives through
policies started in 1992 when Export Oriented Unit (EOU) status was given to exporting
units in agriculture. This was applicable to horticulture and floriculture products. The
exports of these commodities performed well and the total agricultural exports shot up by
28 percent in 1993 -94.
At the same time, it is claimed that the reforms created favourable conditions to
agriculture through trade policy reforms and devaluation of the rupee (Mishra and Rao,
2003). This has helped in reducing protection to manufacturing, eliminating thereby anti
agricultural bias and improving the terms of trade to agriculture. The economy wide
reforms seem to have helped the agricultural sector because of increasing business
transactions between the agricultural sector and rest of the economy over the years.
Rupee was devalued by 24 percent in July 1991 as part of the initial phase of the
stabilisation program. The rupee was further depreciated by 13 percent in 1998-99 over
1997 -98. However, depreciation in the year 1998-99 has not helped the agricultural
exports since it showed a negative growth in the late nineties. As increase in exports with
devaluation is demand-pull in nature. But here it is seen through the earlier experience
that supply factors have played a greater role in enhancing agricultural exports than the
demand and hence attributing the increase in exports in the nineties to devaluation has
lesser significance than to that of growth in the agncultural production in the economy.
Table 5.5: Result of the Causality Test for Agricultural Exports and Agricultural GDP of India
Granger Causality Test Lag: 1
Null Hypothesis:
GDPA does not Cause AE AE does not Cause GDPA
• Significant at 5% level, •• significant at 10% level
Obs F-Statistic
19 3.56* 3.14**
On examining whcther GOP in Agriculture is also influenced by agricultural
exports, wc find a similar picture in the growth analysis. A higher growth in GOP is
accompanied by higher growth in exports in agricultural sector. This is also substantiated
by the results of Granger Causality Test using one lag. As shown in Table 5.5 we reject
the null hypothesis that Gross Domestic Product in Agriculture (GDPA) does not cause
136

Agricultural Exports (AE) and AE does not cause GDP A accepting a two-way causation
between GDP and Exports in agriculture.
In fact, the variables influencing GDP in agriculture in India are many. Therefore,
the role of exports in the growth of the economy needs to be examined carefully. Since
the exports influence the GDP in agriculture through the price mechanism and the
Influence of non-price factors seems to have larger influence on agricultural GDP, it is
essential to examine the importance of these variables in analysing the relationship
between trade and growth. A Simple comparison of Growth rates in Table 5.6 shows high
growth in GDP has been accompanied by the high growth in prices, capital formation and
fertiliser consumption during the same period. Growth in capital formation in agriculture
was favourable from the period 1990-91 to the period 1995-96. This also holds true for
fertilizer and electricity consumption. Likewise, in the later nineties in 1997-98 and 1999-
00 the growth in capital formation was negative, the period that also showed bad
performance of agricultural exports and the GDP in agriculture.
Table 5,6: Simple Growtb Rates of GDP, Prices, Capital Formation, Fertiliser and EI t"t cr' I d' ec rlcuy onsumpllOnm n la
. -Year GOPA AE PIA CFA FC EC 1981-82 561 8.33 lU2 -108 9.94 2.25 --1982-83 -0 52 -5.77 7.00 3.20 5.34 9.61 .. _ .. ~}-84 10.29 1.46 1028 1.35 20.69 234
1984-85 1.44 10.84 6.78 1.51 6.49 14.95 ___ 1985-86 0.69 -1.61 000 -5.46 3.20 11.74 1986-87 -0.61 4.77 8.73 -3.00 2.01 25.71 .. ~,
1987-88 -1.39 10.28 1168 4.27 1.61 19.77 -1988-89 16.81 -1.88 4.58 3.27 25.67 1023 1989-90 0.74 26.34 2.50 ·906 4.78 13.31
..
1990-91 4.43 14.93 12.80 22.29 8.45 14.22 . --
1991-92 -185 15.33 1784 ·8.84 1.44 16.36 1992-93 6.22 4.53 7.80 7.86 .4.50 8.14 --1993·94 4.10 28.28 681 -5.53 1.74 11.69 1994-95 508 -5.18 12.75 10.07 9.68 12.16
_.' 1995-96 -ID 42.38 7.42 539 2.30 8.10
1996·97 10.10 12.60 7.89 360 3.11 -1.99 --
1997-98 -2.82 ·358 366 -0.17 13.13 8.61 "-1998·99 687 -2.16 8.82 -4.50 3.76 6.48 --
1999-00 -0.11 -9.57 270 14.62 - --NOIe: GDPA ~ Gron Doml.'<t/c Product III AKrlCII/tllrl.', AE- Agricultural Exports, CFA = Capital
Formation in AKricullure. PIA = Price Index ill Awiculrure, FC ~ Fertiliser COlIslimptioll, EC =
Electricit)' COII.Hlmption, Source, Ministry tlf AKriculture, (100.?), AWicultura/ Statis/i", <II a Ghura "lid RBI (200.1) Halldbook of
Stati.tic., of Illdiall Ectlllomy
137

There are a few studies substantiating this argument. It was seen that when the
period of eighties was characterised by a very significant acceleration in agricultural
output to 3.19 percent per annum compared with only 2.19 percent during the earlier
period, the consolidation of green revolution and its spread to all parts of India was
primarily responsible for this acceleration. But growth has experienced a notable
deceleration from 3.19 percent per annum to 1.96 percent during the post-reform period
of the nineties due to the fall in capital formation and investment in agriculture (Bhalla,
2002). Similarly, Desai and Namboodri (2000) examine the impact of price and non
price factors on the output of agriculture in the pre and post reform period and the
implications of reforms to government expenditure in agriculture. The study shows that
the barter terms of trade in post reform period have become more favourable for
agriculture but there is no improvement in the growth or the non-price factors in
agriculture. The reasons attributed for the low performance of the non-price factors is the
uncertain policy environment for the non-price factors by the government. Examining the
supply response of agricultural commodities it is seen that among the non-price factors in
the case of foodgrains, electricity use is the most important followed by rainfall, technical
change and lastly the institutional factor of farmers' speed of adjustment. But in the case
of non-food grains it is this institutional factor which is most important followed by total
capital stock in agriculture, electricity consumption, rainfall and lastly tcchnical change.
Also on examining the importance of ab'11Culture in the growth of the economy, it
IS seen that though the share of agriculture in the total GDP of India is declining, the
importance of agnculturc in contributing to growth has not diminished. The share of
agriculture 111 India's GDP has declined from 35 percent in 1980-01 to 22 percent in
1999-00 which is shown in figure 5.4. But it is also seen from figures 5.5 and 5.6 that the
movements 111 growth of agricultural GDP and growth of GDP in India are showing the
same patterns than the growth of GOP in non agricultural sectors and the b'fowth of the
GDP in India. The growth of GDP in India in the late nineties has declined though there
has been an increase in growth in the GOP of non-agricultural sectors due to the negative
growth 111 the agricultural sector. This can be largely attributed to the demand pull effects
of agncultural sector 111 enhancing growth in the economy.
138

Fig 5.4: Sbare of Agriculture in GOP of India
• •
40 35 30 25 20 '5 '0
5 o
Share of Agriculture in GOP of India
~ 0/ ~ ~ ~ ~ 0/ ~ ~ ~ , ~ # ~ , ~ ~ ~ , ~ L,~ __ ""'~ .... C?l ..... C!> yelr ..... '?J "Q) ,,<?l "_"'''' ___ ---"
Source: RBI. 2003. Handbook of StatistIcs of the Indian Economy
Fig 5.5: Growtb Rates in Agricultural GDP (GOPA) and GOP ofIndia (GOPI)
Growth Rates In Agricultural GOP and GOP of India
3000
2000 ~ • '000 .5
000
"9..~ ~<f'
Year
Source: RfJI, 2003. Handbook of Statistics of the Indian Economy
Fig 5.6: Growth Kates in GUP in Non-Agricultural Sectors (GDPNA) and GOP of
,~
'c: I-I
India (GOPf) ._--"'-'---,
Growth Ralas in GOP In Non-agrlcultural.oClor. and
20.00
15.00
10.00
5.00
0.00
GDP in India
Year [' ~ GD~ .• GDPNA Source: RBI. 2003, /famlhook ofStllliSllCS of fhe Indillll Economy
139

I
5.5 Agricultural Trade, Terms of Trade and Inflation
It is seen earlier that the impact of monetary, exchange rate and agricultural prices
on the growth is captured through the terms of trade. It is claimed that if the growth in the
1980s is triggered by the technology and potential created mostly by public investment,
the growth of the nineties is contributed by the macro policies captured by favourable
terms of trade to agriculture and private investment in Indian agriculture (Mishra and
Rao, 2004). As mentioned before, this is expected for the reason that lower relative prices
of manufacturing encourage the agricultural sector for higher purchases from the
manufacturing seclor.
Table 5.7: Index Numbers of Wholesale Prices of Agricultural Commodities Relative to Manufactured Products (Base 1981-82 = 100)
Year Price Index Price Index of Agricultural Of agricultural Manufactured Price Index as %
Products Products of manufacturing
I 1982-83 10.7.30. 10.3.50. \03.70. I 1983-84 121.40. 10.9.80. \\0..60. lJ98-l-85 129.20. 117.50. 1 \0.0.0.
1985-86 129.10. 124.40 103.78 1986-87 142.Ro. 129.20. 110.53
,,-- --1987·78 161.80. 138.50. 116.82 _. -_.
i 1988-89 170..90. 151.60. 112.73
! 1989-90. .. _-
174.40. 16860. 103.44 - - --- .,.,'" ..... '" i03.48 ; 1 (\('\f"l n1 1 ("In .,,(\
J77V~7J £ ';10.':>V lOL..OU .-
, 1991-92 236.80. 20.3.40. 116.42
1992·9_, 255.50. 225.60. 113.25 - .. _-1993-94 271.40. 243.20. 111.60._ ._-1994-95 30.4.78 282.36 10.7.94 - -1995-96 33o..R4 30.6.19 10.8.0.5 - -
331.72 ---loin 1996-97 337.62 -
341.21 101.81 1997 -98 347,39 . -- -- -- ._---1998·99 362.59 382.31 94.84
-1999-0.0. 372.36 386.93 96.23 , --
38159 399.33 95.56 . 20.0.0.-0.1 -- ---Source.' (;0>"1. of !rullC/. EconomIc Survey. 2001
140
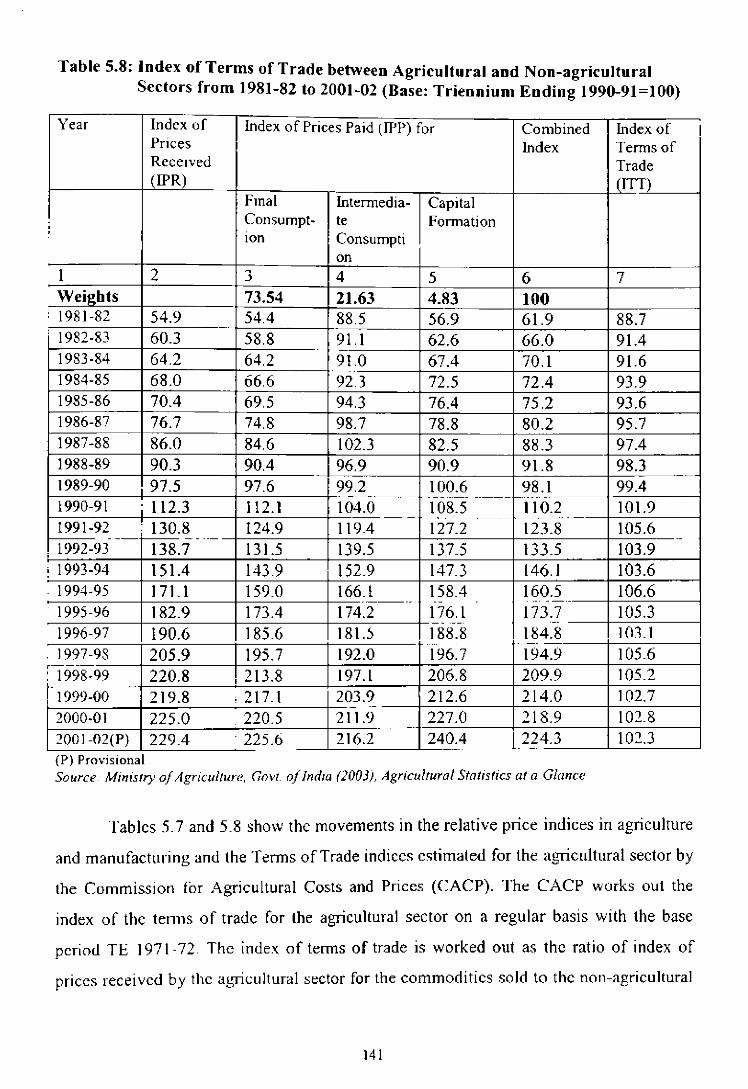
:
,
Table 5.8: Index of Terms of Trade between Agricultural and Non-agricultural Sectors from 1981-82 to 2001-02 (Base: Triennium Ending 1990-91=100)
Year Index of Index of Prices Paid (WP) for Combined Index of Prices Index Terms of Received Trade (IPR) (ITT)
Fma1 Intermedia- Capital Consumpt- te Formation lOn Consumpti
on 1 2 3 4 5 6 7 Weigbts 73.54 21.63 4.83 100 1981-82 54.9 54A 88.5 56.9 61.9 88.7 1982-83 60.3 58.8 91.1 62.6 66.0 91.4 1983-84 64.2 64.2 91.0 67A 70.1 91.6 1984-85 68.0 66.6 92.3 72.5 72.4 93.9 1985-86 70A 69.5 94.3 76A 75.2 93.6 1986-87 76.7 74.8 98.7 78.8 80.2 95.7 1987-88 86.0 84.6 102.3 82.5 88.3 97A 1988-89 90.3 90A 96.9 90.9 91.8 98.3 1989-90 97.5 97.6 99.2 100.6 98.1 99A 1990-91 i 112.3 112.1 104.0 108.5 110.2 101.9 1991-92 : 130.8 124.9 119.4 127.2 123.8 105.6
- .-1992-93 138.7 131.5 139.5 137.5 133.5 103.9
! 1993-94 151A 143.9 \52.9 147.3 146.1 103.6 . 1994-95 171.1 159.0 166.1 158.4 160.5 106.6 .. __ .. . - .. _. __ .-. 1995-96 182.9 173A 174.2 176.1 173.7 105.3 - . __ . ._- -
1996-97 190.6 185.6 181.) 188.8 184.8 101.1 ..... . _ .
1997-98 205.9 \95.7 192.0 196.7 194.9 105.6 r·----
: 1998-99 220.8 , 213.8 197.1 206.8 209.9 105.2 -1999-00 219.8 , 217.\ 203.9 212.6 2[4.0 102.7
.-
2000-01 225.0 .220.5 211.9 227.0 2[ 8.9 102.8 . . _ .
2001-02(P} 229A . 2h6 216.2 240.4 l2~4.3 \02.3 (P) ProvISional Source. Minislry 0/ Agrlcultllre, (;'wt a/india (2003). Agricultural Sfalisfics af a Glance
Tables 5.7 and 5.8 show the movements in the relative price indices in agriculture
and manufacturing and the Tcnns of Trade indices cstimated for the agricultural sector by
the Commission for Agricultural Costs and Prices (CACP). Tht: CACP works out the
index of the tetlllS of trade for the agricultural sector on a regular basis with the base
period TE 1971·72 The index of terms of trade is worked out as the ratio of index of
prices received by the ab'licultura[ sector for the commodities sold to the non-agricultural
141
I
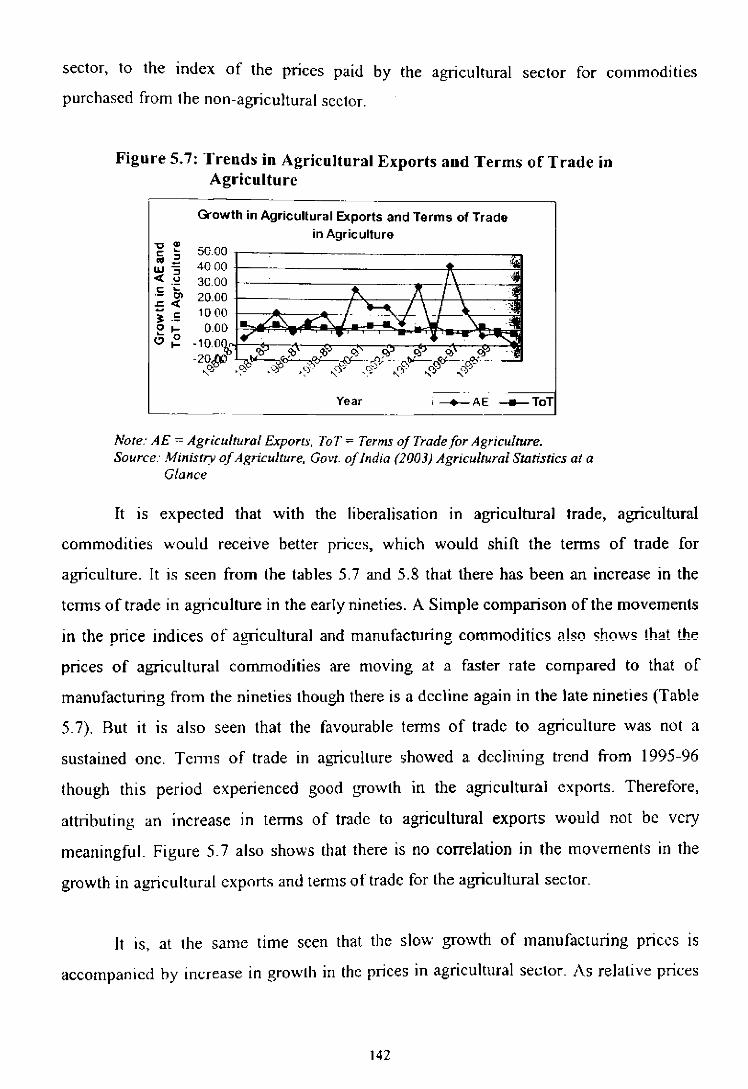
sector, to the index of the pnces paid by the agricultural sector for commodities
purchased from the non-agricultural sector.
Figure 5.7; Trends in Agricultural Exports and Terms of Trade in Agriculture
Q-owth in Agricultural Exports and Terms of Trade
50.00 4000 3C.00 20.00 1000
0.00 -100~
I ..
I .....
in Agriculture
~
1\
" ](, I \ T ....... / \ I ~
./ .. , ¥'~ I -~7·V \-. ., • --- .---<So ~ \ 1i' q, !l> !l> !l>' 5?i
-20UJ ~ ~ .~ 0 0 ~ ~ 0 0 co~~-----::c,~ :u;c
..
,
"'" "
Year , __ AE __ ToT
Note: AE = Agricultural Exports. ToT = Terms of Trade for Agriculture. Source: Ministry of Agriculture, Govt. of india (2003) Agricultural Statistics at a
Glance
It is expected that with the liberalisation in agricultural trade, agricultural
commodities would receive better prices, which would shift the terms of trade for
agriculture. It is seen from the tables 5.7 and 5.8 that there has been an increase in the
tcrms of trade in agriculture in the early nineties. A Simple comparison of the movements
in the price indices of agricultural and manuiacnll1nQ' commodities 11lsQ ~hnws !ha! the ~ ~ .... -
prices of agricultural commodities are moving at a faster rate compared to that of
manufacturing from the nineties though there is a dccline again in the late nineties (Table
5.7). Rut it is also seen that the favourable terms of trade to agriculture was not a
sustained onc. TcnTIS of trade in agriculture showed a dcclining trend from 1995-96
though this period experienced good !,'Towth in the agricultural exports. Therefore,
attributing an increase in tenns of trade to agricultural exports would not be very
meaningful. Figure 5.7 also shows that there is no correlation in the movements ill the
growth in agricultural exports and tenns of trade for the ab'1icultural sector.
It is, at the same time seen that the slow growth of manufacturing pnccs IS
accompanied hy increase in growth in the prices in agricultural sector. As relative prices
142

for manufacturing decreased, gross terms of trade became favourable for agricultural
sector. This is for the reason that the lower relative prices of manufacturing encourages
the agricultural sector for higher purchases from the manufacturing sector. This
favourable terms of trade to agriculture playa positive role in influencing the aggregate
crop output over the period (Mishra and Rao, 2003).
If such a situation of increasing terms of trade to agriculture is favourable to
agriculture, it is also to be noted that the increase in the prices of agricultural
commodities has been highly inflationary in nature. In the years 1991-92, 1994-95 and
1995-96 when the index of prices of agricultural commodities was very high, the rate of
inflation was at double digit at 13.5 percent and 12.5 percent in the initial two years and
8.7 percent in the later year. Again in the year 1998 when there was an unexpected flare
up in food prices, especially onions and potatoes, it led to an increase in the inflation rate.
By November 1998 the CPI (IW) had risen by an unprecedented 20 percent (from a year
ago) and the food component of the index was 25 percent higher. The political discomfort
from this sudden spike in vegetable prices was very considerable and disturbed various
administrative efforts to counter the unexpected supply shortfalls in commodities in
which the govemment did not normally command any capacity to manage supply
(Acharya, 2001).
5.6 Conclusions
Since agriculture is an important sector of the Indian economy, the changes in
trade scenario in agriculture would have larger implications on growth and other macro
economic variables of the economy. However, the impact of trade in agriculture on its
growth is not generally direct. The importance of external trade lies with the linkages it
has with other sectors of the economy like the terms of trade. level of prices, trade
balance, etc which act as a mechanism to enhance growth in the economy. Examining the
impact of agricultural trade on the trade balance of the economy we see that though the
impact of agricultural export on the total trade balance is minimal, it is essential to note
the surplus foreign exchange eamings it generates to the non-agricultural imports. We see
143

that this contribution has increased smce the nineties. On trying to examine the
relationship between exports and growth in GOP in agriculture we see that there is a t"o
way causation between the two seen through the trends in simple growth rates also
through the results of the Granger Causality Test. The causality from growth to exports 1 s
clearly established even by looking at the simple growth rates in those variables. An
increase in export growth is preceded by a favourable growth in GDP in agriculture. But
establishing the causality from exports to growth seems to be difficult since the variables
affecting the growth in agriculture are many. Considering other factors like the capital
formation, fertiliser consumption along with the movement in prices, we see that the
growth in these variables too moved in the same direction along with exports and GDP in
agriculture. The period of early nineties and mid nineties were favourable for all as
against the late nineties, which showed a declining growth in prices, capital formation,
exports and the GOP. Hence, separating the impact caused by trade through prices from
other non-price factors seems to be difficult. Similarly, the terms of trade has shifted in
favour of agriculture in the nineties which seems to playa greater role in inducing the
growth in the sector and in the economy as evident from earlier studies. However,
attributing this situation for ah'licultural exports may not be appropriate since the tenns of
trade was largely influenced by the declining prices in manufacturing.
\44

Chapter VI
Overview and Conclusions 6.1 Introduction
Policies pertaining to trade in agriculture in India and elsewhere in the world have
been moving from a regulatory interventionist to a more liberal and open economic
framework. Due to typical characteristics associated with agriculture and food security
reasons, the governments have intervened largely in the agricultural markets. The
interventions are in the form of direct support to production, consumption or distribution
of agricultural commodities or through indirect measures like control of external trade
through the tariff and non-tariff barriers. A formal attempt towards liberalising
agriculture in a multilateral setup was made with the Agreement on Agriculture (AoA) in
the WTO in the mid nineties. Clauses which covered the types of distortions under the
Agreement were many, the Market Access, Domestic Support and Export Subsidies
being the most pertinent ones.
Following the signing orthe AoA in the WTO, India with many other countries of
the world faces the challenge of removing restrictions on trade through tariff and non
tariff barriers. Apart from this there are internal compulsions for revisiting the
formulated need to he compatible to the regulations ofWTO. The changes in the policies
introduced would have large implications for the at,'licullural sector in India and for the
economy, in general.
Through the rcview of policies and relevant literaturc, the broad objective of the.
study was set to examine the changes in ah'Ticultural trade policy and its implications for
agricultural sector and othcr related macro economic variables in India. The detailcd
objectives included examining the nature and extent of libcralisation in agricultural
commodities in India; examining the restrictivenss of trade policy t1uough the nominal
protection coefficients for ah'Ticultural commodities and their relationship with the major
instrumellts of trade policy; analy~ing the implications of levying a low unifonn tariff for
agricultural commodities as recommended by the Working Group on Tariffs (2001);
)45

observing the changes in trade pattern in agriculture and causes for such changes and its
impact on domestic prices; to examine the trend in domestic and world prices,
fluctuations in them and the relationship between the two; and to examine the
implications of changes in agricultural trade for some of the macro economic variables in
India.
6.2 Trade Policy and Liberalisation of Agricu [tural Trade
From the review of trade policies, we saw that a serious move towards export
promotion and import liberalisation in India began in the eighties with incorporation of
recommendations of the three official committees, the Alexander Committee (1978)
Dagli Committee (1979), and the Tandon Committee (1980). However, with the New
Economic Refornls in 1991 many steps were introduced to promote exports. More
important among these were budgetary concessions covering import licenses, input
prices, freight credit for working capital, direct cash assistance to exporters and the duty
drawbacks which exempted the exporting units from the payment of the indirect taxes. In
addition, there were other indirect measures like the exemption from MRTP licensing or
the industrial licensing to export units. Among other policy measures, devaluation of
rupee, reduction in cash margins of imports, introduction of EXIM Scrips, Export
Promotion Capitai Goods Scheme (EPCG), Spcciai import Llccnse Scheme, relaxahon in
export control marked important stcps.
Examming liberalisation in agricultural trade per se, it was seen that thc
liberahsation measures were not directly applicable to ab'licultural sector till very
recently. In the earlier phase of liberalisation i.c., granting of Open General License
status to cOlllmodities, agricultural commodities had hardly appeared in the list. Though
the policy of extension of Exim Scrips to agriculture in 1991 was introduced, it included
only tr<lditional agricultural export items. For agriculture speci fically, some notable
liberalisation attempts werc made from mid nineties. The policies towards agricultural
sector spcci fically, were targeted only since Exim Policy 2001 like through creation of
Agricultural Export Zones, Schemes like Duty Exemption Scheme and Export Promotion
t46
Capital Goods Scheme, lowering of import duties on capital goods to be used in
agriculture, increasing the credit availability for agricultural exports, relaxation of export
quotas, and the abolition of :v1inimum Export Prices (MEPs).
Since the removal of Quantitative Restrictions (QRs) was a significant step in
liberalisation in agriculture trade, the issue was dealt separately in detail for all major
traded agricultural commodities in India. It was seen that, earlier in the nineties, there
were a few cases of liberalistion through the removal of QRs, which were largely
considered to be a part of internal refonTIs program. Exports of rice, edible oils, oilseeds,
and imports of jute, pulses, cotton, rubber are some of the examples to mention. The later
part of removal of QRs on agricultural imports in the years 1999-2001 was framed to
meet the reqUIrements of WTO covering large number of commodities. With the removal
of QRs on a major bulk of agricultural items since 1999, India enters into a new regime
of agricultural trade policy wherein the impacts are more unpredictable with the policy
changes unlike in the earlier phases. The review of export policy on the other hand,
shows us that export policies on many agricultural commodities are adhoc in nature as
compared to import policies. Fixations of quotas are subject to large periodic tluctuations
especially for basic items like rice, wheat, coarse cereals, sugar, etc.
Exanlimng the changes In the tanll rates over the years, it was sccn that the
average tariff in agriculture has drastically declined over the years. The bindings on tariff
lines were also revised on many commodities as a future safeguard against import risk.
However, the tariffreduction was accomplished to meet the internal requiremcnts than as
an obligation under the WTO. Hut on reviewing the tariff policy in India and criteria of
fixing the tariff rates in agriculture, we notice that tariffs were highly ineffective
instruments of trade policy. With the removal of quantitative restrictions, as tariff is the
only viable instrument of trade policy, the need for revising the tariff rates in a scientific
manner was felt. An autonomous Tariff Commission under the Department of Industrial
Policy and Promotion in the Ministry of Industry (at present part of the Ministry of
Commcrec and Industry) was created in 1997 and subsequently refonned. Later the
Working Group on the Customs Tariffs (2001) was appointed to revise the structure of
147

customs tariff. The report recommends that the tariffs are to be fixed on the basis of
effecti ve protection rather than the nominal protection. It considers the role of exchange
rate and non-tradable services in determining the overall protection. It also recommends
for a uniform rate of duty of as low as 20 percent on all commodities and the deletion of
all exemptions so that it solves the administrative difficulties and the problem of negative
protection.
Reviewing the compatibility of India's trade policy to the requirements under
certain important clauses of AoA under WTO, we see that India has largely met the
requirements under the Market Access. Domestic Support and Export Subsidy clauses. In
the case of tariffs, though India has not committed itself for tariff reduction programme,
the tariff rates on agriculture are substantially reduced as part of the internal reform
programme. Since, the tariff negotiations under the WTO are incomplete, and tariff being
the most transparent of the trade policies, India would have the pressure from the trading
partners to reduce the :Y1FN and bound tariffs in the near future. Domestic Support in
India, seen through the Aggregate Measurement of Support taking the 1986-88 base
period, was below the 10 percent de minimus level. Therefore, India has no total A.\1S
reduction commitment under the Agreement but is required to make regular annual
notifications to the WTO on its domestic AMS, and on its direct export subsidies.
Policy scenario in the trading partners of India would play an equally important
role as much as that of policies III India for its export perfomlancc. Obstructions to
India's exports from the trading partners are seen in the form of tariff barriers, domestic
subsidies, export subsidies and other technical barriers to trade. We see that the
developed countries adopt certain strategies like tali ff escalation and tari ff peaks which
are often concentrated in products that are of export interesllo developing countries. Also
thc trends in Producer Subsidy Equivalents (PSEs) in these countries show that a
rcduction in the price support accounted for the measurement of AMS is substituted with
the Increase indirect payments, payment on area, income, thus providing direct income
support to cope with the structural adjustment programmc. Similarly, in the case of
export subSIdies, the products benefiting form the subsidics in the EU which is the largest
148

provider of subsidy, followed by US and Brazil are mainly dairy products, live animals,
fruits and vegetables and sugar which are potential export items for India. This is a matter
of larger concern since export subsidies have an immediate impact on export
competiti veness than other measures of support for developing countries like India.
Therefore, they are to be negotiated for complete eliminations, specifically in those
countries. In addition, many Indian exports are facing blockade through the Sanitary and
Phytosanitary measures.
6.3 Nominal Protection and Tariff Rates in Agriculture
Policies distorting agricultural trade being largely diversified in nature, measuring
the extent of distortions to trade in agriculture is much debated. The review on the
measures of protection shows us that Kominal and Effective Protection Coefficients,
Producer and Consumer Subsidy Equivalents and Aggregate Measurement of Support are
used to capture the extent of protection in commodities and sectors. We noted from the
review of literature that some studies have already measured protection coefficients for
select agricultural commodities upto the period of early nineties. But as larger policy
changes in agriculture have taken place since the mid nineties the study was extended to
the later time periods covering large number of commodities.
Examining the I"PCs for the latest period, it is seen that the coefficients were less
than one for large number of items indicating the existence of export barriers. This
included commodities like banana, potato, groundnuts, onion, tobacco, cotton and a few
oilcakes. The review of policies also shows us that these set of commodities were
restricted through quota licensing, the amount of quota varying from time to time.
However for some commodities like banana, there is a barrier through infrastructure, ,
which is not provisioned by governments in some countries as against others. Similarly,
those importables which were restricted for imports showed NPCs more than one like for
edible oils, apple, tea, coffee, sugar, rubber and ginger. Yet for certain other commodities
like rice. wheat. cashewnut, pepper, jute and cake of groundnuts the NPCs are more than
one under exportable hypothesis and less than onc under importable hypothesis and hence
149

would neither be considered an exportable or importable. On the basis of the protection
coefficients, which also show the price competitiveness of the agricultural commodities,
one can predict as to what would be the likely scenario in exports and imports with the
removal of trade barriers. From the review of policies and the infonnation on the market
situations, we anticipate that there would not be a drastic change in the export scenario
though some changes in imports is expected. Imports of edible oils, rubber and sugar is
likely to increase with the opening up of trade in those commodities. coffee and tea
markets in India would not be affected to a large extent due to the reason that India
produces the best quality of these products, which cannot be largely substituted. But in
the case of exports, as mentioned earlier, for some commodities like the horticultural
items, the barrier lies with infrastructure. For some other commodities like sesame and
rapeseedimustard, the export market exists in the form of processed products like edible
oils in which India does not possess the price competitiveness. Rather India is also a large
importer of edible oils. Commodity like onion and potato being essential items is subject
to adhoc export policies looking into the supply and demand situations. This also holds
good with other commodities like common varieties of rice in which India's NPC is near
to unity. Thc cxport policy of these commoditics is likcly to hc subject to similar state
evcn in the future, since they arc not forced for change under the WTO.
\Ve then try to examine whether changes in the trade policies have led to changes
In thc protection coefficients of those agricultural commodities. The liberalisation
policies, which can have an impact on trade, can be direct like the rcmoval of quantitative
restrictions or indirect like devaluation or other monetary and fiscal policies. But we see
that there exists no relationship between the changes in the NPCs and changes in the
trade policies. [n the process we also see that trade policies were ineffective to the extent
to bring ahout price integration between the domestic and world prices other than in the
case of rice.
Examining the role of protection to agriculture through tariff rates we try to
examine the relationship between the rates of protection seen through the price
differences and the tariff rates as given in the tariff schedules. It was seen that thcre
150

exists no relationship between the two for most of the commodities. The exception to
this was edible oils, where we observed the correlation coefficient significant for this
group of commodities. This was due to the fact that the imports of these commodities
are under the parastatal agencies and trade within the quota allotted to them was
controlled through the tari ff rates. But largely it was seen that tari ff rates were highly
ineffective instruments of trade policy in agriculture. Now with the removal of
quantitative restrictions, tariffs occupy an important place as an instrument of trade
policy. The need for revising the tariffs in a scientific manner was therefore felt. The
Working Group on Customs Tariff (200 I) was thus appointed to restructure the Customs
Tariff Policy in India.
On discussing the desirable structure of tariffs for Indian economy by the
Working Group on Tariffs (2001) there were two options, i.e., single uniform tariff or a
tired tari ff structure. It was felt that having a single uniform tariff was a better measure
than going for a three tired structure. The classification of commodities into producer or
consumer goods and further into intermediate and capital goods had its own difficulties
due to the definitional problems. The strict application of such definitions was thought to
be problematic. The I 15 sector Input Output Table for the Indian economy shows that it
is not possible to define a set of sectors (A) whose output is used in the production of
other sectors IB) but which do not use the output of B. Each of liS goods and servIces
dIrectly or indirectly enters into the production of every other good or service. It is
therefore, Impossible to break up the set of intermediate goods into two or more tires in
any rational manner. The 10 tab Ie also shows that at this level of disagb'Tegation all 98
goods are used as intermediate inputs out of which 60 are consumer goods. But as a
practical matter, it is possible to select only a few important consumer goods for the
purpose of having a distinct tariff. In addition. the differential tariff can give rise to
anomalies where the tariff on the producers input is higher than on his output. It is
impossible to devise a system in which every single producer has an input tariff rate
lower than the output tari ff Therefore, it was recommended that the optimal best tariff
structure is a uni form imporl duty on all imports. This would also mean that the effective
protection for all producers is equal to single uniform tariff Such a system eliminates
151

the possibility of negative protection as well as high rates of protection. In addition such
a system is neutral, promotes efficiency and competitiveness and eliminates all
administrative hassles and legal disputes about classification.
On comparing a 20 percent effective tariff with the desired tariff rate measured
through effective rates of protection on agricultural commodities it was seen that
protection to most of the commodities other than edible oils would not be affected since
the effective tariff rates were either negative or less than 20 percent. Other than the
general advantages of imposing a uniform tariff, like avoiding of smuggling, better tariff
administration and lesser lobbying of large and influential industries, there are special
advantages that would be gained by agriculture sector in developing countries and India
in particular. Agriculture in the developing countries is biased with high protection to
the manufacturing sector leading to the adverse terms of trade. Such a bias would now
be offset and terms of trade shifted in favour of agriculture.
6.4 Factors InOuencing Trade in Agriculture in India
We see from our analysis that liberalisation policies had limited impact on trade
In agricultural commodities. Nevertheless, the contribution of agriculture to the total
trade of India and its importance to the export earnings of the economy have increased
since the nineties. It was therefore, essential to examine the causes for such changes in
trade pattern in agricultural commodities in India. Since trade policies are diversified
across commodities, the relationship of trade with the factors determining them would be
varied. Similarly, trade being one of the tools to regulate the domestic prices of
agricultural commodities, the changes in trade pattern would have influenced the
domestic and world prices (if the volume of trade is large enough to influence the world
markets) with changes in the quantity of trade. Therefore, an attempt was made to
examine the changes in trade pattern in agricultural commodities, its causes and its
linkages to the domestic and world prices of agricultural commodities in India.
152

We first try to examine the causes for those changes through the analysis of
detenninants of trade in agriculture with the export and import functions where export is
the function of domestic production, relative prices (ratio of domestic price to world
price) and the world imports and import is a function of domestic production and world
imports. But we do not get significant results in most of the cases. On comparing the
growth rates of those variables independently we see clearly that trade in most of the
commodities are domestic supply driven. Whereas, for commercial crops like
groundnuts, tobacco, cashew and pepper the domestic prices have grown at a faster rate
with a moderate or high growth in exports when not accompanied by high production
growth. It is also seen through the comparison of growth rates that an increase in exports
is accompanied by a decline in import grov,,1h and vice versa. Therefore, one can see that
agricultural trade in India was largely domestic supply driven.
6.5 Domestic and World Prices: Stability and Interdependence
The studies conducted earlier on the behaviour of domestic and world prices and
on the relationship between the two show that the world prices of ab'Ticultural
commodities are highly fluctuating in nature and henec with the opening up of Indian
agricultural trade the volatility of world prices would be transmitted to domestic prices
(1';ilyyar iind Sell j 994). it is ~lso siaieu mal the recent experience \vith raw cotton, edibie
oils, pulses and wheat show that the freeing of trade or an inercased linkage with the
world market has increased price instability in the domestic market (Acharya, 200 l).
However, the comparison betwccn domestic and world prices would be meaningful only
when the prices are adjusted for thc quality of the products, exchange rate, inflation and
the time series nature of prices. We examine here whether this hypothesis holds good to
major traded agricultural commodities in India, i.e. are the world prices more volatile
than the domestic prices so that, if therc is complete elimination of restrictions on the
movements of commodities, the volatility is transmitted. Since the domestic prices are
largely controlled through the price policy in India, it is assumed that volatility in
domestic prices is controlled especially in the nineties after the restructuring of the price
policy.
15.1

The coefficients of variation III domestic and world pnces of agricultural
commodities adjusted for trend for the two decades show that domestic prices are more
unstable than world prices for most of the commodities chosen other than for coffee,
sugar, apple, potato, rapeseed and rice seen for both the decades. Thus, the argument that
world prices are more unstable than domestic prices for commodities traded by India or
that which have the potential for trade do not hold good in most of the cases. But a
careful observation reveals that other than in the case of rice and sugar the commodities
that are having higher coefficient of variation in world prices are those commodities like
coffee, potato, and oilcakes, which would not be a matter of great concern for food
security even if the volatility is transmitted. The shocks of fluctuations can be absorbed in
such cases. Even in the case of rice, India's share in the world market is large enough to
influence the world market prices rather than being influenced. A comparison of the
coefficient of variation in the adjusted domestic prices in the eighties and the nineties
shows that instability in nineties has reduced as compared to the eighties in ease of many
agricultural commodities. As the price policy of the nineties has not been effective in the
nineties as seen through the earlier studies and that the quantity of trade in those
commodities has increased especially with the commodities where the coefficient of
variation in domestic prices have declined, one can see that external trade is more useful
in reducing price instability in the domestic agricultural markets in Lidia.
6.6 Relationship between Agricultural Trade and some Macroeconomic Variables in India
Since agriculture is an important sector of the Indian economy, in terms of the
population dependent on it, the changes in trade scenario in agriculture would have larger
implications on growth in output and other macro economic variables of the economy.
However, the impact of trade in agriculture on its growth is not generally direct. The
importance of external trade lies with the linkages it has with other sectors of the
economy like the terms of trade, level of prices, trade balance, etc which act as a
mechanism to enhance growth in the economy. On examining the impact of agricultural
trade on the trade balance of the economy, we see that though the impact of agncuitural
154
export on the total trade balance is minutely felt, it is essential to note the surp Ius foreign
exchange earnings it generates to the non-agricultural imports. On trying to examine the
relationship between agricultural exports and growth in GOP in agriculture it is seen that
there is a two way causation between the two seen through the trends in simple growth
rates and also through the results of the Granger Causality Test. The causality from
growth to exports is clearly established even by looking at the simple growth rates in
those variables. An increase in export growth is preceded by a favourable growth in GOP
in agriculture. But establishing the causality from exports to growth seems to be difficult
since the variables affecting the growth in agriculture are many. Considering other factors
like the capital formation, fertiliser consumption along with the movement in prices, we
see that the grov.'th in these variables too moved in the same direction along with exports
and GOP in agriculture. The period of early nineties and mid nineties were favourable for
all as against the late nineties, which showed a declining growth in prices, capital
formation, exports and the GOP. Hence, separating the impact caused by trade through
prices from other non-price factors seems to be difficult. Similarly, the terms of trade has
shifted in favour of agriculture in the nineties which seems to playa greater role in
inducing the t,'Towth in the sector and in the economy as evident from earlier studies.
However, attributing this situation for agricultural exports may not be appropriate since
the terms of trade was largely influenced by the declining prices in manufacturing.
6.7 Overview and Policy Implications
1. Though tradc libcralisation assumed a special signifiance in the context of economic
n:forrns in the late eighties and early nineties in India, they were not directly made
applicable to the at,'Ticultural sector due to its unique characteristics. We come across
some instances of policy changes through the removal of quantitative restrictions on a
few items of agJicultural exports and imports since the mid nineties. But these were
introduced to meet the internal requirements of domestic supply and demand
situations. Now with the removal of QRs on imports of large set of agricultural
commodities since the late nineties. India enters into a new regime of a!,'licultural
trade policy. But the export policy of some of the agricultural commodities which arc
basic and essential continue to be ad hoc in nature largely for food security reasons.
155

With widespread import liberalisation measures, promotion of exports in other
agricultural commodities in which India has price competitiveness is now inevitable.
2. With the Agreement on Agriculture (AoA) under the WTO, trade policies are to be
governed by the rules under the AoA. On examining the compatibility of trade
policies in agriculture to the AoA it is seen that India has largely met the
requirements of AoA under the Market Access, Domestic Support and Export
Subsidy clauses. In addition, the reduction in average tariff rate in agriculture was the
outcome of internal reforms, as India has not committed for the tariffication program
in the WTO.
3. The trade policies towards agriculture in trading partners of India would play an
equally important role in the export performance of agricultural commodities form
India. It is seen that the policies in the developed countries are being restructured
more strategically to retain the support towards agriculture. It is however, a
budgetary constraint for India and other developing countries to adopt a similar
strategy as in those countries. It is therefore, wise for developing countries including
India to oppose the support measures that are retained in a strategic manner. Since
much of the support in the developed countries is retained through the exemption
categories iike the Green and Biue Hoxes, it is essentlal to revIse the limits in
subsidies under these categories. As the export subsidies are directly applicable to the
export performance of developing countries they arc to be bargained for complete
eliminations. There is a need for clear harmonisation of standards regarding thc
Sanitary and Plry10Sanitary measures and other technical barriers to trade in
3!,'licuitural commodities. It would also be in the interest of India to join hands with
other developing countries to form more unions and trading agreements to have a
better bargain in international forums.
4. Analysis of nominal protection for major traded commodities shows that Nominal
Protection Coefficients (NPC) indicated the export and import barriers to trade
largely through the quantitative restrictions. A review of trade policies on those
156
commodities shows that though quantitative restrictions acted as a mam barrier
towards trade in agriculture for certain set of commodities the barrier to export is seen
through infrastructural bottlenecks which acts as an indirect barrier to trade in
agricultural commodities. From the information on the policies and the market
situations we anticipate that there would not be a drastic change in the export scenario
though some changes in imports is expected. Imports of edible oils, rubber and sugar
is likely to increase with the opening up of trade in those commodities.
5. On trying to examine the relationship between changes in trade policies and that of
NPCs, it is seen that there exists no relationship between the two. Protection
coefficient as an indicator of trade policy cannot be used in a dynamic sense. There
also exists no relationship between the rate of protection and tariff rates in agriCUlture.
The significance of tariff as a tool to regulate trade has now increased with the QRs
on agricultural commodities. Tariffs now turn out to be the only viable instrument to
regulate trade under the WTO. Therefore, there is a need to revise the tariffs in a
scientific manner.
6. The Working Group on Tariffs (2001) recommends for a low uniform tariff on all
commodities, which avoids the problem of classification, anomalies and
administrative difficuities. Un making a companson or elfective rates seen through
the price differences with the 20% uniform tariff, it is seen that protection to
agriculture would not be worse off with the introduction of such a policy. Only a tew
commodities like edible oils, milk products and sugar would be affected. But
agriculture sector, in gt:neral would gain. [t is seen that agricultural sector is biased
with high protection to manufacturing, leading to adverse terms of trade towards the
agriculture sector. An introduction of low uniform tariff on thc other hand would
reduce the tari ff rates on manufacturing. This would lead to favourable terms of trade
to agriculture due to reduced price of inputs from the manufacturing sector.
7. On examining the factors influencing trade in agricultural commodities, it is seen thaI
Iraut: in agriculture is largely domestic supply driven especially for many
157

commodities like rice, wheat, sugar, edible oils, which are the basic food items. Trade
is used as an instrument to regulate the domestic prices in those commodities.
Therefore, the domestic prices of these commodities have grown at a slower rate than
other commercial crops, the trade of which is relatively free. It is also seen that the
Iiberalisation policies through the removal of QRs were not effective, since it had no
impact on the domestic and world prices leading towards integration. Similarly,
indirect measures like devaluation, fiscal and other monetary policies too had limited
impact on increasing the export earnings of the economy.
8. The earlier stated argument that world prices are more fluctuating than domestic
priccs, and therefore. with the opening up of trade the volatility in the world prices
would be transmitted to domestic prices does not hold good. Examining the
coefficient of variation in the domestic and world prices adjusted for exchange rate,
inflation and the trend shows that the domestic prices are more fluctuating than world
prices. Hence there is no fear of volatility being transmitted to the domestic prices in
opening up of trade. It is also seen that the coefficient of variation in prices of many
commodities have declined in the nineties as against the eighties. This is largely seen
for commodities, which have shown an increase in the quantity of trade in the
nineties. As it is seen that price policy has not been effectively implemented and that
there has been an increase in trade voiume of those commodities whieh showed a
decline in the coefficient of variation in domestic priees in the nineties one can see
that external trade is more useful in reducing price instability in thc domestic
agricultural markets in India.
9. Since agriculture is an important sector of the Indian economy, the changes in trade
scenario in a!,'Iiculture have larger implications on growth and other macro economic
variablcs of the cconomy. Though the importance of agricultural trade in contributing
to the trade balance of the economy is not largely felt, the increasing importance of
the agricultural surplus to non-ah'licultural imports would have an indirect impact on
the scclor. On trying to examine the relationship between a!,'Iicultural exports and
h'TOwth in agriculture in India we see a two-way causation between these two

variables using the Granger Causality Test .. The causality from growth to exports is
clearly established even by looking at the simple growth rates in those variables. An
increase in export growth is preceded by a favourable growth in GOP in agriculture.
But establishing the causality from exports to growth seems to be difficult since the
variables affecting the growth in agriculture are many. The role of non-price factors
like investment, capital formation, etc in agriculture too seems to have occupied an
importance place in determining the growth in the sector.
159

References and Selected Bibliograpby
Acharya, S S (200 I), "Domestic Agricultural Marketing Policies, Incentives and Integration" in Acharya, S Sand D P Chaudhuri (eds) Indian Agricultural Policies at the Crossroads, Rawat Publications, New Delhi.
Acharya, Shankar (2001), "Macro Economic Management in the Nineties", Unpublished Draft, ICRJAR, New Delhi.
Ahluwalia, Montek Singh (1985), Industrial Growth in India: Stagnation since MidSixties, Oxford University Press, Delhi.
Ahluwalia, Montek Singh (1991), Productivity and Growth in Indian Manufacturing, Oxford University Press, Delhi.
Ahluwalia, Montek Singh (1995), "]\;ew Economic Policy and Agriculture: Some Reflections", Indian Journal of Agricultural Economics, Vol. 51, No.3.
Aksoy, M A (1991), "The Indian Trade Regime", Policy Research Working Paper No.989, The World Bank.
Anderson J.E and J.P Neary (1994), "Measuring the Restrictiveness of Trade Policy", World Bank Economic Review, 8: 151-169.
Anderson K and Rod Tyres (1990), "How Developing Countries Could Gain from Agricultural Trade Liberalisation in the Uruguay Round'!" in Ian Goldin and Odin Knudsen (ed), Agricultural Trade Libera/is"t;oll: Implications jor Developing COllntries, OECD, Paris and World Bank, Washington.
Baldwin R E (1975), Foreign Trade Regimes alld Economic Development, The Phinlpin~s, j~ew York, l'BER
Baldwin, R E (l970), Non- Tariff Distortions in International hade, Brookings Institution, Washington.
Baldwin, R.E (\ 992), ';Measurable Dynamic Gains from Trade", Journal of Political FCOIWIIl}', 100: 162-174.
Baldwin, R.E (1989), "Measuring Non-Tariff Trade Policies," NBER Working Paper
No.2978.
Ballasa B (1965), "Trade Liberalisation and Revealed Comparative Advantage" Mallcfl<'sll'r School of Economic and Social Studies, Vol. 3,1\0.2, May.
Ballasa, Bela (1971), "Effective Protection in Developing Counlrie>;" in, Ahagwati, J N et.al (eds), Trade, Balal/ce of Paymellls and GroW"', Papers in International Economics in Honour of Charles P. Kinde\berger, :\'orth Holland, Amsterdam.
160

Ballasa, Bela (1989), Comparative Advantage. Trade Policy and Economic Development, New York: Harvester, Wheatsheaf.
Ballasa Bela (\ 990), "Outward Orientation", in Chenery H., and Srinivasan T N (ed), Handbook of Development Economics, VoL 2, Amsterdam, North Holland.
Basevi, G (1971), "Aggregation Problems in Measurement of Effective Protection" in Herbert G. Grubel and Harry G. Johnson (eds) Effective Tariff Protection, GAIT and Graduate Institute of International Studies, Geneva.
Berkum, Siemen van and Hans van Meijl (2000) "The Application of Trade and Growth Theories to Agriculture: A Survey", The Australian Journal of Agriculture and Resource Economics, Vol 44, No.4.
Bernard Hoekman, Aditya Mattoo and Philip English (2002), Development Trade and the ltTO: A Handbook. The World Bank, Washington.
Bhadhuri, Ami! (1993), Alternative Development Strategies and the Rural Sector, in A Singh and H Tabatabai (eds), The World Economic Crisis and Agriculture in the Third World ill the 1980s: nle Changing Role of Agriculture ill Economic Development, International Labour Organisation, Geneva.
Bhagwati, lagadish (1965), "On the Equivalence of Tariffs and Quotas". In Trade, Growth and Balance of Payments: Essays in Honour of Gottfried Haberler, edited by R.E Baldwin et.al Amsterdam: North Holland.
Bhagwati, lagadish (\ 988 a), Protectionism, Cambridge, Massachusetts: MIT press.
Bhagwati, lagadish (1988 b), "Poverty and Public Policy", World Development, 16,
539-556.
Bhagv/ati, lagadish and T.N Srinivasan (1975), Foreign Trade Regimes alld F.conomic Developmelll. India, :-.Jt:w York, NBER
Bhagwati, Jagadish and T.N Srinivasan (1993), I"dia's Economic Reform, Report Submitted to the Government ofindia.
Shalla, G. S. (1995), "Globalisation and Agricultural Policy in India", Illdian Journal of Agricultural ECO/lOmics, VoL 50, No. I.
Shalla, G S (2002), "The National Legacy in India: Evolution of Afo.'1icultural Policy sinet: the Sixties" in I:lhalla, G S, J L Racine and F Landy (eds) Agriculture awl the WorM Trade Orgallisation: Indian alUl French Perspectives, Editiuns de la
'vIaisun, Paris.
Bharadwaj, R, Sujan Hajra and :-iishita Rajt: (1998), The Impact of Urugua~ Round 0.11
Growth Qlld SIn/Clllr!: of Illdian ECOllomy, Department of Economic AnalySIS and Policy, Reserve Bank oflndia, Mumbai.
161

Bhattacharya, Band A.K Sengupta (Ed) (1994), Trade in Agriculture: The Uruguay Round and After, Indian Institute of Foreign Trade, New Delhi.
Blake, A T, A J Rayner and G V Reed (1999), "A Computable General Equilibrium Analysis of Agricultural Liberalisation: The Uruguay Round and Common Agricultural Policy Reforrn",Journal of Agricultural Economics, Vol. 50, No.3
Blandford, David (1990), "Global Partial Equilibrium Models and the Analysis of Agricultural Trade Liberalisation" in Goldin Ian and Odin Knudsen (eds) Agricultural Trade Liberalisation Implications for Developing Countries. OECD, Paris.
Bond, M.E (1987), "An Econometric Study of Primary Commodity Exports from Developing Countries of the World" IMF StajfPapers 34 (June) 191-227.
Brando, Antonio and Will Martin (1993), Implications of Agricultural Trade Liberalisation for the Developing Countries, World Bank Working paper, WPS 1116, Washington.
Chakravarty, S (1987), Development Planning. The Indiall Experience, Clarendon, Oxford.
Chand. Ramesh (2001), "Wheat Exports: Little Gain", Economic and Political Weekly, Vol 36, No 25.
Chand, Ramesh and Dayanatha lha (2001), "Trade Liberalisation, Agricultural Prices and Net Social Welfare", in S S Acharya and D P Chaudhri (cds.) Indian Agricultural Policies at the Crossroads. Rawat Publications, New Delhi.
Chand, Ramesh and Tewari S.C (1991), "Growth and Instability of Agricultural Exports and Imports of Agri..:ultural Commodities" Indiml Journal of Agricultural Economics, Vol. 46, No 2.
Chaturvedi, Sachin and Gunjan Nagpal (2003) "WTO and Product Related Environmental standards: Emerging Issues and Policy Options", t;col/omic alld Political Weekly, Vol 38, No. I.
Corden, W.M (1966), "The Structure of the Tarill' System and the Effective Tariff Rate", Journal of Political Economy, 74:221-237.
Corden, W. M (1971), Die Theory 4 Protection. Oxford, Clarendon Press.
Cummings, 1 T (1975), "The Supply Response of Indian Famlcrs in the Post Independence Period - Major Cereals amI Cash Crop~" Indian Journal of' Agricullural E,'OIlOlllics, Vol. 30.
Dandekar, V. M (1994), indian Ecollomy- Vol. I, Agriculture, Sage Publications, New DelhI.
162

Dantwala, M. L (1986), "Strategy of Agriculture Development since Independence" in M. L. Dantwala (ed), Indian Agricultural Development Since Independence, A Collection of Essays, Oxford and IBH Publishing Co. Pvt. Ltd., New Delhi.
Datta, Samar K (2001), "How to Judge Global Competitiveness ofindian Agribusiness: Methodological Issues and Lessons for India" in Samar K Datta and Satish Y Deodhar (ed.), Impact of WTO Agreements on Indian Agriculture, CMA, liMA, Ahmedabad.
Datta, Samar K (2001), "Problems and Prospects of India's Rice Trade in a WTO Regime" in Samar K Datta and Satish Y Deodhar (ed.), Impact of WTO Agreements on Indian Agriculture, CMA, lIMA, Ahmedabad.
Datta, Samar K and Satish Y Deodhar (2001), Impact of WTO Agreements on Indian Agriculture, CMA, lIMA, Ahmedabad.
Datta, Samar K, K B Gupta (2001), "Global Competitiveness and Future of Indian Sugar Industry" in Samar K Datt.a and Satish Y Deodhar (ed.), Impact of WTO Agreements on Indian Agriculture, CMA, lIMA., Ahmedabad.
Datta, Samar K, Milindo Chakrabarti and Madalasa Gandhi (2001), "Composition of India's Agri-Exports: Changes in the Post-reforms Period" in Samar K Datta and Satish Y Deodhar (ed.), Impact of WTO Agreements on Indian Agriculture. CUA, lIMA, Ahmedabad.
Datta, Samar K., Milindo Chakrabarti, S ChattcIjcc and Madalasa Gandhi (200 I), "Composition of India's Agri-Imports: Changes in the post-reforms period" in Samar K Datta and Satish Y Dcodhar (cd.), Impact of WTO Agreements On Indian Agriculture, CMA, liMA, Ahmedabad.
Deardorff, A. V and R.\1 Stem (1984), "Methods of Measuring Non-Tariff Barriers", Institute of Public Policy Studies Discussion Paper No. 203, University of Michigan, June.
Desai, Bhupat M and N V Namboodri (200 I), Famlcr's Response, Prices and Government Expcnditure, Analysis under WTO Framework for Developing Agriculture in Samar K Datlil and Satish Y Deodhar (ed.), Impact of wro Agreemellts 011 Indian Agriculture, CMA, lIMA, Ahmedabad.
Desai, Padma (1970), Tariff Protection and Industrialisation: A Study of Indian tariff Commissions at Work; 1946-1965, Hindusthan Publishing Corporation.
Dcshpande, R Sand P Thippaiah (2000), Impact of Removal of Quantitative Restrictions on Import of Agricultural Produce, Report submitted to the Ministry of Agriculture, Govt. of India, ISEC, Hangalore.
Dhar, P N (\ 989), Constraillts 011 Growth: Reflectiolls 011 the Indian Experience, mimco, Institute of Economic Growth, Delhi.
163

Diakosavas, D and C Kirkpatrick (1990), "The Effects of Trade and Exchange Rate Policies on Production Incentives in Agriculture", FAD Economic and Social Development Paper, ]\;0. 96, FAO, Rome.
Diakosavas, Dimitris (2003), The Uruguay Round Agreement on Agriculture in Practice: How Open are OECD MarketsT in Merlinda D Ingco (ed) Trade alld the WTD, The World Bank.
Dixit, P and V Roningen (1989), "Quantitative Implications of Creating an Agricultural Free Trade Area between the US and the Canada", Canadian Journal of Agricultural Economics, 37: 1023-1033.
Dixit, P and V. Roningen (1990), "Assessing the Implications of Freer Agricultural Trade." Food Policy 15: 67-75.
FAO (1983), Expanding Agricultural Commodity Trade Among Developing Countries, FAD Economic and Social Development Paper, 29, Rome.
FAO (1993), Conference on Agriculture Towards 2010, 27th Session, 6 -25 November.
FAO, Statistical databases: http!: w",w.fao.orglstatisticall.
Feenstra, R.C, ed. (1988), Empirical Methods for International Trade, Cambridge, Massachusetts: MIT Press.
Finger, J Michael and Ludger Schuknecht (2001), "Market Access Advances and Retreats: The Uruguay Round and Beyond" in Bernard Hoekman and Will Manin (ed.) VIC>!eloping Countries and the IVTO A Pro-activeAgenda, Blackwell Publishers, Oxford, U K.
Gang, I N and Pandey M (1998), """'hat Was Protected? Measuring India's Tariff Barriers, 1968-1997" TIle Indian Economic Review, Vol. 33, No.2.
Goldar, RN and Saleem II.N (1993), Study ali1ldia's TariffSlruelwe' E/foct olTariIT Prolection on Domestic l1ldustries, NIPFP, New Delhi
Goldar, B.N and Saleem II.N (1992), Effective Rales of Protection of indian Industries NIPFP, New Delhi
Goldin Ian and Dominique van dcr Mensbrugghc (1995)," The Uruguay Round: An Assessment of Economywide and Agricultural Reforms" in Will ~1artin and L Alan Winters (eds) The Untgtwy RO/lIld alld Developing Ecollomies, World Bank di~~ussion Papers, The World Bank, Washington.
Goldin, I and O. Knudsen (I990), Agricultural Trade Liberalisation: III/plicalions jor Del/e/oping Countries, Palis and Washington, D.C, OEeD and World Bank.
t64

Goldin, Ian, 0 Knudsen and Dominique van der Mensbrugghe (1993), Trade Liberalisation: Global Economic Implications, OECD and World Bank, Paris and Washington.
Government of India (1978), Report on the Import and Export Policies (Alexander Committee), :-.lew Delhi.
Government of India (1979), Report of the Committee on Controls and Subsidies (Dagli Committee), New Delhi.
Government of India (1980), Report of the Committee on Export Strategy (Tandon Committee), New Delhi.
Government of India (1986, 1992, 1996), Directorate of Publications, Customs and Excise, Working Schedule on Customs Tariffi in India, Ne'>v Delhi
Government of India (1992), EXL\-! Policy, 1992-1997, Ministry of Commerce, New Delhi.
Government of India (1997) EXIlt1 Policy, 1997-2002, Ministry of Commerce, New Delhi.
Government of India (1999), Ministry of Commerce, Custom Tariff of India, 1999-2000.
Government of India (1999), Non-Tariff Barriers Faced by India, Preliminary Report, Ministry of Commerce, Economic Division.
Government of India (200 I) Indian ECOllOmic Survey 2000·2001, Akalank Publications, New Delhi.
Government of India (200 I) Report of the Working Group OIl Customs Tariff.
Government of India (2003), Ministry of Agriculture, Agricultural Statistics at a (jlallcl:, :-.Jew Delhi.
Government of India, Ministry of Agriculture, Agricultural Prices ill llldia, Various Issues, l\ew Delhi.
Government of India, Ministry of Conunerce (1993), A Profile of India's Agricultural Exports, New Delhi.
Government of India, Ministry of Commerce, (1991), Statement on Trade Policy, ElS, eMIL, Bombay.
Government of India, Minisny of Commerce, Statement 011 Trade Policy (1991), EIS, CMIE. Bombay
165

Government of India (2000), Central Statistical Organisation, Ministry of Statistics and Programme Implementation, Input-Output Transactions Table 1993-94. New Delhi
Goyal, Arun (2000), Easy Reference to Customs Tariffs, ABS publishers, New Delhi.
Goyal, Arun (\998), Easy Reference to Customs Tariffs, ABS publishers, New Delhi.
Goyal, Arun (2000), WTO in the New Millennium, :vrYIRD. World Trade Centre, Bombay and Academy of Business Studies, )lew Delhi.
Greene, William H (1993), Econometric Analysis, Macmillan Publishing Company.
Grossman G M and Helpman E (1991), Innovation and Growth in the Global Economy, MIT Press, Cambridge.
Grubel, H.G and H.G 10hnson (1991), Effective Tariff Protection. Geneva: GAIT and Graduate Institute oflntemational Studies.
Gujarati, Damodar N (I988), Basic Econometrics, McGraw-HilI International Edition.
Gulati, Ashok , James Hanson and Garry Pursell (1989), ·'Effective Incentives in Indian Agriculture", Policy Planning and Research Working Paper No.332 (Trade Policy Division), The World Bank.
Gulati, Ashok and A N Sharma (1992), "Subsidising Agriculture: A Cross Country View", Economic and Political Weekly, Vol. 27, No. 39, September 26.
Gulati, Ashok and Anil Sharma (1994), "Agriculture under GAlT: What it Holds for India", Economic and Political Weekly, Vol. 29, No.2!).
Gulati, Ashok. Anil Sharma and Deepali S Kohli (i 996), "Self Sufficiency and Allocalive Efficiency - Casc of Edible Oils, Ecollomic and Political Weekly, 'lo1.31, No. 45.
Gulati, Ashok and Anil Sharma (1997), "Freeing Trade in Agriculture: Implications tor Resource Use Efficiency and Cropping Pattern Changes", Economic and Political Weekly, Vol. ]2,1\0. 52.
Gulati. Ashok and Garry Pursell (1991), "Trade Policies Incentives and Resource Allocation in Indian Agriculture", The World Bank, Washington, (mimeo)
Gulati. Ashok and Sharma P.K (1991), "Government Interventions in Agricultural Markets: ~ature, Impact and Implications" Journal of Indian schoof ofPolilica! Economy, Vol. 3, No 2.
Gulati, Ashok and Shashanka fihide (1995), Wllat do the Refol111S have for Al,'liculturc?" Economi,· and Political Weekly, Vol. 30,1\0. 18.
166

Gulati, Ashok. Anil Shanna. Kailash C Sharma, Shipra Das and Vandana Chabra (1994), Export Competitiveness 0/ Selected Agricultural Commodities, NCAER, New Delhi.
Gulati, Ashok and Tim Kelley (1999), Trade Liberalisation and Indian Agriculture -Cropping Pattern Changes GIld Efficiency Gains in Semi-Arid Tropics, Oxford University Press, New Delhi.
Gulati, Ashok, Rajesh Mehta and Sudha Narayanan (1999), "From Marakesh to Seattle - Indian Agriculture in a Globalising world", Economic and Political Weekly, Vol. 34, No. 41.
Habeck, M, DJ Brown and P Abotta (1988), "Sources of Export Earnings Instability: The Role of Agriculture", Journal 0/ Agricultural Economics, Vo1.39, No.1, January.
Hajra, Sujan (1994), "Implications of the Uruguay Round for Indian Agriculture" Reserve Bank o/India OccasionJI Paper, VoU5, No.3, September.
Hathaway, Dale E and Melinda D Ingco (1995), "Agricultural Liberalisation and the Cruguay Round" in Will Martin and L Alan Winters (eds.) 17le Unlguay Round and the Developing Economies, World Bank Discussion Papers, The World Bank, Washington.
Helpman, E and P R Krugman (1985), Market Strncture and Foreign Trade: Increasillg Returns, Imperfect Competition, and the imemational Economy, MIT Press, Cambridge.
Hdpman, E and P R Krugman (1989), Trade Policy and Markel Structure, Cambridge, MasachusselS, \fIT Press.
llillman S Jimmye (1978), NOli-Tariff Agricultural Trade Barriers. University of Nebraksa Press. London.
International Monetary Fund (2000), IlIlernational Financial Stlltistics. IMF. Washington
Islam Nurul (1992), Agricultural Trade between Del'elopillg Countries: Pallerns alld Fulure Possibilities, IFPRI, Washington.
Jai Knshna and M S Rao (1967), "Dynamics of Acreage Allocation for Wheat in UP: A Study of Supply Response". Indian Jourllul a/Agricultural £conomics, Vo1.22.
Jalan. 13lmal (1991). India's Economic Crisis: The Way Ahead, Oxford University 1'n:s5, Delhi.
Johnson. /I G (1971), "Effective Protection and General Equilibrium Theory", III
Jhonson, H G, Aspects a/Theory o/Tariff.~, Allen and Unwin, London.
167

Joshi, V and IMD Little (1987) "Indian Macroeconomic Policies", Economic and Political Weekly, Vol. 22, No.9.
Josling, Tim and Stefan Tangennann (1999), "Implementation of the WTO Agreement on Agriculture and Developments for the Next Round Negotiations", European Review of Agricultural Economics, Vol. 26. No.3.
Kahlon, A. S (1986), "Agricultural Price Policy and Tenns of Trade" in M. L. Dantwala (ed) Indian Agricultural Development Since Independence, A Collection of Essays, Oxford and IBH Publishing Co. Pvt. Ltd., New Delhi.
Kalirajan, K and J C Flinn (1981), "Allocative Efficiency and Supply Response in Irrigated Rice Production" Indian Journal of Agricultural Economics, Vol. 36, No.2.
Kalirajan, K P, G Mythili and U Shankar (ed.), (2001), Accelerating Growth Through Globalisation of Indian Agriculture, Macmillan, New Delhi.
Kelkar, Vijay Lakshman (1977), "Evaluation of India's Trade Policies", Economic and Political Weekly, Vol. 21, No.25.
Kindleberger, C P (1980), "Government Policies and Changing Shares In World Trade", American Economic Review, Vol. 70, No.2.
Kumar, Krishna T and Ashok Mittal (1995), "Prospects for International Trade in Agricultural Commodities by Developing Countries, Some Lessons from Experience with Tea Trade of India, Sri lanka and Kenya" Paper presented at the 31" Annual Conference ofindian Econometric Society, NIBM Pune.
Krueger, A., M Schiff and A. Valdes (1-)98), "Agriculhlral Incentives in Developing CountrIes: Measuring the Effects of Sectoral and Economywide Policies" World Bank Economic Review 2:225-271.
Kurvila, Anil (200 I), Freer Agricultural Trade in India - Impact on Agricultural Growth Poverty and Prices, Ph. D Dissertation submitted to the Department of Agricultural Economics, Tamil Nadu Agricultural University, Coimbotore.
Laird, Samuel (1997), "Quantif'ying Commercial Policies" in Francois Joseph and Rener! A, Applied Methods for Trade Policy Analysis, Cambridge University Press, U K.
Leamer, E (1990), "The Structure and Effects of Tariff and Non-Tariff Barriers in 1983" in The Political Economy of International Trade, edited by Ronald W Jones and Anne 0 Krugger, Basil Backwell, Cambridge.
Leamer, E and R.M Stem (1970), Quantitative International Economics, Alley and Bacon, Boston.
168

Leith, J. C (1971), The Effect of Tariffs on Production, Consumption and Trade: A Revised Analysis' American Economic Review. 61, March.
Liard. Sand A. Yeats (1990), Quantitative Methods for Trade Barrier Analysis, Macmillan, London ..
Medhora, R (1989), "Effects of Exchange Rate Variability on Trade: A Survey", Economic and Political Weekly, Vol 24, No.ll.
Mehta. Rajesh (2000), "Removal of QRs and Impact on lndia's Import", Economic and Political Weekly, Vol. 35, ]\;0. 19.
Mishra V Nand M Govinda Rao (2003), 'Trade Policy, Agricultural Growth and Rural Poor: Indian Experience, 1978-79 to 1999-2000" Economic and Political Weekly, Vol. 37, No.43.
Yfishra. J.P (1998), "The WTO and Policy Obligation for Indian Agriculture", Political EcollOmy Journal of India, Vol.7. Issues 3-4.
Mitchell, 0.0 and Ingo, M.D and Duncan R.C (1997), The World Food Outlook, Cambridge University Press, Cambridge.
Mukherjee, Neela (1985) "Indices of India's Invisible Trade, 1951-80", Economic and Political Weekly, Vol. 20, No.5.
Nalk Gopal and Sudhir Kumar Jain (1999), "Growth, Stability and Acreage Response of Agricultural crops: Likely Impact of WTO Regime" in Datta Samar K and Sathish Y Deodhar (eds) Impact 0/ WTO Agreements on Indian Agriculture, l!y! Ahmedabad.
Nainan. K :-,; (19871. "Edible Oilseeds, (jrowth :mrl A rea Re~pom~" Economic fwd Politi"," Weeki)·, Vo137. No.20.
Nayyar. Deepak and Abhijit Sen (1994), "International Trade and Agricultural Sector in India" in G. S. Bhalla edited Ecol/omic Uberalisation and India, ISlD, New lklhi.
Nouro:.:, I-Iashcem (2002), Protectioll in Mam4acturing, Me Millan, New Delhi.
Nilanjan, Banik (200 I), "An Analysi~ of lndia's Exports during the 1990s", Economic WId Polilical Weeklv, VoUo. No. 44.
OEeD (1987), Naliunal Policies allli Agricultural Trade, Paris.
OEeD (1994 j, Agricullllral Policies, Alarkets and Trade: Monitoring am/ Out/ook, Paris.
Pal, SUfcsh (1992),"Agricultural Exports of lndia: Issues of Growth and Instability", Indiall Journal 0/ Agricultural ECOl1omics, Vol.4 7,1\0.2.
169

Panchamukhi, V.R (1978), India's Trade Policy, Concept Publishing House, New Delhi.
Panchamukhi, V. R (1986), "Trade in Agricultural Commodities-Analysis of the period 1960 - 1985" in M. L. Dantwala . (ed), Indian Agricultural Development Since bldependence, A Collection of Essays, Oxford and IBH Publishing Co. Pvt. Ltd., New Delhi.
Panchamukhi, V. R (1994), "Recent Developments in Trade Theory and Practice". The Indiall Economic Journal, Vol. 41, No.3.
Parikh, Kirit S, Gunther Fisher, Klaus Frohberg and Odd Gulbrandsen (1988), Towards Free Trade in Agriculture, Martinus NijhoffPublishers, Boston.
Parikh, Kirit S, Shikha .Jha, P.V Srinivasan (1993), Economic Reforms and Agricultural Policy", Economic and Political Weekly, Vol 38, No. 29.
Parikh, Kirit S, N S S Narayana, Manoj Panda and Ganesh Kumar (1995), Strategies for Agricultural Trade liberalisation: Consequences for Growth, Welfare and Distribwioll. IGIDR, Mumbai.
Parikh, Kirit S, N.S.s Narayana, Manoj Panda and Ganesh Kumar (1997), Agricultural Trade liberalisation: Growth, Welfare and Large Country Effects, Agricultural Economics, Vol. 17.
Porter, :Vlichel E (1990), The Competitive Advantage o.fNatiolls, The Macmillan Press Limited, London.
Pursell, Garry (1996), Indian Trade Policies Since the 1991 Reforms. The World Bank: International Trade Division, mime".
Pmsdl, Garry and Ashok Gulati (1995), "Liberalising Indian A,,'liculture: An Agenda fl." Reform" in Robert Cassen (ed) India: The Future of Economic RejiJmls, OUP, New Delhi.
Pursell, Garry and Neil Rogcr (1985), Manual jor Incentives all/i Comparative Adv(llltage Studies, TIlc World Bank, Washington.
Pursell, Garry and Anju Gupta (1997), "Trade Policies and Incentives in Indian Agriculture: :Vlethodoloh'Y, Background Statistics, Protection and Incentive Indicators Sugar (llld Sugarcane." Backgruund Paper No. TIle World Bank
Radhakrishna Rand C. Ravi, (1990), Foud Delllwui Projectiolls for Illdia, Center for Economic amI Social Stlldies, Hyderabad (mimeo).
Raj, K ;-J (1986), New Economic Policy, Oxford University Press.
170

Ranade, Ajit and Mahendra S. Dev (1997), "Agriculture and Rural Development -Stocks, Subsidies and Food Security" in Kirit S. Parikh edited India Developmenl Reporl 1997, IGIDR, OUP.
Rao, C. H. Hanumantha (1995), "New Economic Policy and Indian Agriculture", Indian Journal of Agricultural Economics, Vol. 50, No.3.
Rao. V. M (1996), "Agricultural Development With a Human Face - Experience and Prospects", Economic and Political Weeklv, Vol. 31, No 26.
Rao, V.M. and R S Deshpande (1981;,), "Agricultural Production - Pace and Pattern of growth". In Dantwala, '. (eds) . Indian Agricultural Development Since Independence, A Collection of Essays, Oxford and IBH Publishing Co. Pvt. Ltd .• Kew Delhi.
Reddy, Rathna V and K Badri Narayanan (1992), "Trade Experience of Indian Agriculture: Behaviour of Net Export Supply Functions for Dominant Commodities", Indian journal of Agricultural Economics, Vo1.47, No. I. JanMarch.
Resen'e Bank ofindia (2003), Handbook of Slat is tics of the Indian Economy, Mumbai.
Romeo, M Bautista (1995), "Trade Policy Reform and Agriculture in Developing Countries". in S P Gupta, Garry Pursell and John Nash ("dS) Trade Policy Refonns, [CRlER, Mac Millan, India.
Roningen, V 0 (1997), Multi Market. Multi-Region Partial Equilibrium Modelling, in Francois, J and Keneth A Reinert (cds), Applied klethods jor Trade Policy Analvsis. A Handbook. Cambrid!;e University Press, Cambridge.
RoninRen. V. 0 and A Yeats (1976), "Neln Tariff Distortions of International Trarle: Some Preliminary Empirical Evidence" Weltwirtschaftiches archive.
Roningen, V 0, J Sullivan, and P Dixit (1991), Documentation of the Static World Policv Silllulalion fSWUPSIAIj iHodel Building Framework, Staff Rep0l1 No. AGES, 915 \: Economic Research Service, U.S. Dcpt. of. Agriculture. Washington.
Samuelson, P A (1948), "International Trade and Equalisation of Factor Prices", £collomic Journal, Vol 5S.
Sandesara, J.C (1994), "Restrictive Trade Policies in India, 1969-91: Experience of Control and Agenda for Further Work", Emno",;c {[lid Polilical Weekly. Vol. 29. No. 32.
Sarkar, Prabiljit (1995), "Indian Economy Since 1991, Trade Price and Exchang" Rute Behaviour", Economic {[mi Political Weekly, May 20.
171

Scandizzo, P.L (1989), "Measures of Protection: Methodology, Economic Interpretation and Policy Relevance", FAO Economic and Social Development Paper 84, Rome.
Scandizzo, P.L and C Bruce (1980), "Methodologies for Measuring Agricultural Price Intervention Effects", World Bank Staff Working Paper No. 394, The World Bank, Washington D.C, USA.
Sen, Abhijit (1992) "Economic Liberalisation and Agriculture In India", Social Scientist, Vol 20, No II.
Sen, Abhijit (1996), "Agriculture and Economic Liberalisation: The Indian Outlook" in Peter Robb (edited) Meanings of Agriculture: Essays in South Asian History and Economics.
Sen, Sunanda (1982), "From Import Substitution to Export Promotion: Policy Planning in India's Foreign Trade Sector, Economic and Political Weekly, VoL 17, No.14.
Sen, Sunanda and Hiranya Mukhopadhyay (1994), "Devaluation. Liberalisation and Structural Linkages between India's Foreign Trade and National Income", Economic and Political Weekly, Vol. 29, No. 36.
Sen, Sunanda and R. Upendra Das (1992), "Import Liberalisation as a Tool of Economic policy in India Since Mid-Eighties", Economic and Political Weekly, Vol. 27, No. 12.
Sen, Sl.lnanda (2000). Trade and Dependence: Essays 011 the Indian Ecollomy, Sage Publications, New Delhi.
Sharma, Anil (2002), Issues and Options in Market Access (or India, A Paper for Ihe Ministry of Commerce, NCAER, I\'ew Delhi.
Sharma, Anil (2002), "Agricultural Exp0l1 Subsidy Reform Imperatives" A Paper for the Ministry of Commerce, NCAER, New Delhi.
Singh Ajit (1992), Fxporl of AKricullural Commodities -:WOO A. D A Perspective, Wiley Estern Ltd.
Singh, Gurdev and S R Asokan (2000), "Impact uf WTO on Indian Edible oilseeds Sector" in Samar K Datta and Satish Y Deodhar (ed.), Impact of WTO Agreemell/S 011 llldilln Agriculture, elviA, lIMA, Ahmedabad.
Singh. Manmohan (1995), "Inaugural Address", I"dian Journal of Agricultural Economics, Vol. 50, No. I.
Singh,O P, G S Singh and S Kumar, (1995), "Trends in Rapeseed-:Vlustard Production and its Supply Response in Different Regions of ep" Agricultural Sill/ation ill
Illdia, Vol. 52, NO.6.
172

Srinivasan, P V and Shikha Jha (200 I), "Liberalised Trade and Domestic Price Stability: The case of Rice and Wheat in India", Joumal of Development Economics, Vol. 65.
Srinivasan, T. N (1996), "Post-Uruguay Round: Issues for Asian Developing Countries", Asia Development Review, Vol. I, No. I.
Stewart, Frances and Ejaz, Ghani (1986), "Trade Strategies for Development", ECOllOmic and Political Weekly, Vol. 31, No. 34.
Storm, Servaas (1997), "Domestic Constraints on Export Led Growth: A Case Study of India" Journal of Development Economics Vol. 52.
Subramaniam, Shankar (1993), Agricultural Trade Liberalisation and Illdia, Development Centre Studies, OECD, Paris.
Tarr, David G (2002), "Arguments for and Against Unifonn Tariffs" in Bernard Hoekman, Aditya Mattoo and Philip English (cJS), Development Trade and rhe ~fTO: A Halldbook. The World Bank, Washington.
The International Agricultural Trade Research Consortium (1994), "Bringing Agriculture into the GAIT, The Uruguay Round Agreement on Agriculture: An Evaluation" Commissioned Paper :>roo 9.
The International Agricultural Trade Research Consortium (\997), "Bringing Agriculture into the GAIT, The Uruguay Round Agreement on Agriculture: An Evaluation" Commissiolled Paper No. 12, IA TRC.
Tyagi D S (1974), Farmers' Response to Agricultural Prices In !lIdia: A Study On Decision Makin~. Heritage Publishers.
Tyres, Rand K And",rson (1992), Disarray in the World Food Markets.' A Quantitative Assessment.
CNCTAD (1993), A User's Manual for Trains (Trade Analysis and Infonnation System), UNCTADIDMS/I Geneva, United "ations.
CNCTAD (1994), Directory of Import Regimes, Part 1, ,Monitoring Import Regimes, lJNCTADIDMSf2 (Part 1 )/Rev.l, New York, United States.
l;nited Stales Dept of Agriculture (1986), World Commodity Markets Govemment IlIIervelllion and Multilateral Policy Reform, USDA.
Vinnani, Arvind (2001), "India's 1990-91 Crisis: Refonns, Myths and Paradoxes" Planninl! Commission, Working Paper, December, 200 I.
Vousdcn, N (1990), The Economics of Trade Protection, Cambridge: Cambridge University Press.
173

Webb, A.1, M.Lopez, and R Penn. (1990), Estimates of Producer and Consumer Subsidy Equivalents: Government Intervention in Agriculture, 1982-87, Slalistical Bulletin No.803, Economic Research Service, C nited States Dept of Agriculture, Washington D,C
Wilson, J E (200 I), "Testing Agricultural Market Integration: Further Conceptual and Empirical Considerations Using Indian Wholesale Prices", in S S Acharya and D P Chaudhri (ed.) Indian Agricultural Policies at the Crossroads. Rawat Publications, New Delhi.
WTO (1999) India-Quantitative Restrictions on Imports of Agricultural Textile and Industrial Products: Report of the Appellate Body, WTtDS90/AB/R, August 23.
WTO, Trade Policy Review-lilrious Countries, Various Years, WTO, Geneva, www.wto,org.
174