Embed Size (px)
Citation preview

The Science & Business of Biopharmaceuticals
INTERNATIONALINTERNATIONAL
Bio
Ph
arm
Intern
atio
nal
OC
TO
BER 2
015
G
lyco
syla
tion
I Sin
gle
-Use
Syste
ms I FD
A C
on
troversie
s V
olu
me 2
8 N
um
ber 1
0
October 2015
Volume 28 Number 10
CHANGING
THE CULTURE
OF CELL CULTURE
ANALYTICAL TECHNIQUES
DYNAMIC LIGHT SCATTERING
FOR NON-DESTRUCTIVE,
RAPID ANALYSIS OF
VIRUS-LIKE PARTICLES
PEER-REVIEWED
APPLICATIONS OF SURFACE
PLASMON RESONANCE FOR
DETECTION OF BISPECIFIC
ANTIBODY ACTIVITY
METHOD TRANSFER
ANALYTICAL
METHOD TRANSFER
CONDITIONS
www.biopharminternational.com
ES685438_BP1015_cv1.pgs 10.06.2015 02:09 ADV blackyellowmagentacyan

PHARMACEUTICAL n HEALTH SCIENCES n FOOD n ENVIRONMENTAL n CHEMICAL MATERIALS
©2015 Waters Corporation. Waters, ACQUITY QDa and The Science of What’s Possible are registered trademarks of Waters Corporation.
Gain confidence in glycan, peptide, and
oligonucleotide analysis with mass detection.
ES685067_BP1015_CV2_FP.pgs 10.05.2015 23:39 ADV blackyellowmagentacyan

INTERNATIONAL
BioPharmThe Science & Business of Biopharmaceuticals
EDITORIALEditorial Director Rita Peters [email protected] Editor Agnes Shanley [email protected] Editor Susan Haigney [email protected] Editor Randi Hernandez [email protected] Science Editor Adeline Siew, PhD [email protected] Director Dan Ward [email protected] Editors Jill Wechsler, Jim Miller, Eric Langer, Anurag Rathore, Jerold Martin, Simon Chalk, and Cynthia A. Challener, PhD Correspondent Sean Milmo (Europe, [email protected]) ADVERTISING
Publisher Mike Tracey [email protected]/Mid-West Sales Manager Steve Hermer [email protected] Coast Sales Manager Scott Vail [email protected] Sales Manager Chris Lawson [email protected] Sales Manager Wayne Blow [email protected] List Rentals Tamara Phillips [email protected] 877-652-5295 ext. 121/ [email protected] Outside US, UK, direct dial: 281-419-5725. Ext. 121 PRODUCTION Production Manager Jesse Singer [email protected] AUDIENCE DEVELOPmENT Audience Development Rochelle Ballou [email protected]
UBm LIfE SCIENCES
Joe Loggia, Chief Executive Officer Tom Ehardt, Executive Vice-President, Life Sciences Georgiann DeCenzo, Executive Vice-President Chris DeMoulin, Executive Vice-President Rebecca Evangelou, Executive Vice-President, Business Systems Julie Molleston, Executive Vice-President, Human Resources Mike Alic, Executive Vice-President, Strategy & Business Development Tracy Harris, Sr Vice-President Dave Esola, Vice-President, General Manager Pharm/Science Group Michael Bernstein, Vice-President, Legal Francis Heid, Vice-President, Media Operations Adele Hartwick, Vice-President, Treasurer & Controller
UBm AmERICAS
Simon Foster, Chief Executive Officer Brian Field, Chief Operating Officer Margaret Kohler, Chief Financial Officer
UBm PLC
Tim Cobbold, Chief Executive Officer Andrew Crow, Group Operations Director Robert Gray, Chief Financial Officer Dame Helen, Alexander Chairman
© 2015 Advanstar Communications Inc. All rights reserved. No part of this publication may be reproduced or transmitted in any form or by any means, electronic or mechanical including by photocopy, recording, or information storage and retrieval without permission in writing from the publisher. Authorization to photocopy items for internal/educational or personal use, or the internal/educational or personal use of specific clients is granted by Advanstar Communications Inc. for libraries and other users registered with the Copyright Clearance Center, 222 Rosewood Dr. Danvers, MA 01923, 978-750-8400 fax 978-646-8700 or visit http://www.copyright.com online. For uses beyond those listed above, please direct your written request to Permission Dept. fax 440-756-5255 or email: [email protected].
UBM Life Sciences provides certain customer contact data (such as customers’ names, addresses, phone numbers, and e-mail addresses) to third parties who wish to promote relevant products, services, and other opportunities that may be of interest to you. If you do not want UBM Life Sciences to make your contact information available to third parties for marketing purposes, simply call toll-free 866-529-2922 between the hours of 7:30 a.m. and 5 p.m. CST and a customer service representative will assist you in removing your name from UBM Life Sciences’ lists. Outside the U.S., please phone 218-740-6477.
BioPharm International does not verify any claims or other information appearing in any of the advertisements contained in the publication, and cannot take responsibility for any losses or other damages incurred by readers in reliance of such content.
BioPharm International welcomes unsolicited articles, manuscripts, photographs, illustrations, and other materials but cannot be held responsible for their safekeeping or return.
To subscribe, call toll-free 888-527-7008. Outside the U.S. call 218-740-6477.
EDITORIAL ADVISORY BOARDBioPharm International’s Editorial Advisory Board comprises distinguished specialists involved in the biologic manufacture of therapeutic drugs, diagnostics, and vaccines. Members serve as a sounding board for the editors and advise them on biotechnology trends, identify potential authors, and review manuscripts submitted for publication.
K. A. Ajit-Simh President, Shiba Associates
Rory Budihandojo Director, Quality and EHS Audit
Boehringer-Ingelheim
Edward G. Calamai Managing Partner
Pharmaceutical Manufacturing
and Compliance Associates, LLC
Suggy S. Chrai President and CEO
The Chrai Associates
Leonard J. Goren Global Leader, Human Identity
Division, GE Healthcare
Uwe Gottschalk Vice-President,
Chief Technology Officer,
Pharma/Biotech
Lonza AG
Fiona M. Greer Global Director,
BioPharma Services Development
SGS Life Science Services
Rajesh K. Gupta Vaccinnologist and Microbiologist
Jean F. Huxsoll Senior Director, Quality
Product Supply Biotech
Bayer Healthcare Pharmaceuticals
Denny Kraichely Associate Director
Johnson & Johnson
Stephan O. Krause Principal Scientist, Analytical
Biochemistry, MedImmune, Inc.
Steven S. Kuwahara Principal Consultant
GXP BioTechnology LLC
Eric S. Langer President and Managing Partner
BioPlan Associates, Inc.
Howard L. Levine President
BioProcess Technology Consultants
Herb Lutz Principal Consulting Engineer
EMD Millipore Corporation
Jerold Martin Independent Consultant
Hans-Peter Meyer Lecturer, University of Applied Sciences
and Arts Western Switzerland,
Institute of Life Technologies.
K. John Morrow President, Newport Biotech
David Radspinner Global Head of Sales—Bioproduction
Thermo Fisher Scientific
Tom Ransohoff Vice-President and Senior Consultant
BioProcess Technology Consultants
Anurag Rathore Biotech CMC Consultant
Faculty Member, Indian Institute of
Technology
Susan J. Schniepp Fellow
Regulatory Compliance Associates, Inc.
Tim Schofield Managing Director
Arlenda, USA
Paula Shadle Principal Consultant,
Shadle Consulting
Alexander F. Sito President,
BioValidation
Michiel E. Ultee Principal
Ulteemit BioConsulting
Thomas J. Vanden Boom Vice-President, Global Biologics R&D
Hospira, Inc.
Krish Venkat CSO
AnVen Research
Steven Walfish Principal Statistician
BD
Gary Walsh Professor
Department of Chemical and
Environmental Sciences and Materials
and Surface Science Institute
University of Limerick, Ireland
ES684984_BP1015_003.pgs 10.05.2015 23:08 ADV blackyellowmagentacyan

4 BioPharm International www.biopharminternational.com October 2015
Contents
BioPharmINTERNATIONAL
BioPharm International integrates the science and business of
biopharmaceutical research, development, and manufacturing. We provide practical,
peer-reviewed technical solutions to enable biopharmaceutical professionals
to perform their jobs more effectively.
COLUMNS AND DEPARTMENTS
BioPharm International ISSN 1542-166X (print); ISSN 1939-1862 (digital) is published monthly by UBM Life Sciences 131 W. First Street, Duluth, MN 55802-2065. Subscription rates: $76 for one year in the United States and Possessions; $103 for one year in Canada and Mexico; all other countries $146 for one year. Single copies (prepaid only): $8 in the United States; $10 all other countries. Back issues, if available: $21 in the United States, $26 all other countries. Add $6.75 per order for shipping and handling. Periodicals postage paid at Duluth, MN 55806, and additional mailing offices. Postmaster Please send address changes to BioPharm International, PO Box 6128, Duluth, MN 55806-6128, USA. PUBLICATIONS MAIL AGREEMENT NO. 40612608, Return Undeliverable Canadian Addresses to: IMEX Global Solutions, P. O. Box 25542, London, ON N6C 6B2, CANADA. Canadian GST number: R-124213133RT001. Printed in U.S.A.
BioPharm International is selectively abstracted or indexed in: • Biological Sciences Database (Cambridge Scientifc Abstracts) • Biotechnology and Bioengineering Database (Cambridge Scientifc Abstracts) • Biotechnology Citation Index (ISI/Thomson Scientifc) • Chemical Abstracts (CAS) • Science Citation Index Expanded (ISI/Thomson Scientifc) • Web of Science (ISI/Thomson Scientifc)
Cover: Rafe Swan/Getty Images; Dan Ward
6 Guest Editorial In the development of biopharmaceuticals and pharmaceuticals, the line is blurring. Alice Till
8 Regulatory Beat Manufacturers challenge details in new policies designed to promote access to important therapies. Jill Wechsler
10 Perspectives on Outsourcing Despite emergence of biologics, small-molecule APIs benefit from industry growth. Jim Miller
54 Analytical Best Practices An approach to small-model generation and calibrating small-scale models to reliably predict performance at scale is presented. Thomas A. Little
60 Troubleshooting The author explores a dual-supplier sourcing strategy for single-use products. Chad Atwell
65 New Technology Showcase
66 Biologics Pipeline Update
66 Ad Index
Upstream processing
Changing the Culture of Cell Culture: Applying Best Practices and Authentication to Ensure Scientific ReproducibilityLeonard P. Freedman, Mark C. Gibson, and Richard M. NeveTaking immediate steps to address
misidentified and contaminated cultured
cell lines will improve the reproducibility
of preclinical research. 14
method transfer
Analytical Method Transfer Conditions Used by Global Biologics ManufacturersStephan O. KrauseThe author presents the results of a
survey of biologics manufacturers
to evaluate how these manufacturers
transfer analytical methods. 22
glycosylation
A Review of Glycan Analysis RequirementsJennifer FournierThe author explores the basic
rationale and requirements for
standardized glycan analysis. 32
peer-reviewed
Applications of Surface Plasmon Resonance for Detection of Bispecific Antibody ActivityRobert KarlssonThe use of surface plasmon
resonance in the characterization
of bispecific antibodies is discussed. 38
analytical techniqUes: dynamic light scattering
Dynamic Light Scattering for Non-Destructive, Rapid Analysis of Virus-Like ParticlesCynthia A. ChallenerDynamic light scattering techniques
can monitor viruses and virus-like
particles in their native state. 46
global biopharma markets
Market Access in ChinaMichael J. KuchenreutherChina’s emergence as a significant
commercial market is forcing
manufacturers to re-evaluate
their overall business model. 50
Volume 28 Number 10 October 2015
fEATURES
ES684752_BP1015_004.pgs 10.05.2015 20:42 ADV blackyellowmagentacyan

for biopharma
builtBiotherapeutic protein characterization demands reproducible, robust and reliable instruments.
Introducing Thermo Scientifc™ Vanquish™ Flex UHPLC System, designed purposely for
biopharmaceutical workflows; charge-variant profiling, aggregation analysis, peptide mapping and
glycan characterization. Built with engineering excellence, we deliver all the pieces to meet your
requirements.
• Enjoy chromatography • thermoscientific.com/BuiltForBiopharma
© 2015 Thermo Fisher Scientific Inc. All rights reserved. All trademarks are the property of Thermo Fisher Scientific and its subsidiaries
QVQLKQSGPG CONFIDENCE LVQPSQSLSI TCTVSGFSLT NYGVHWVRQS
PGKGLEWLGV IWSGGNTDYN TPFTSRLSIN INTACT KDNSKSQVFF
KMNSLQSNDT AIYYCARALT YYDYEFAYWG QGTLVTVSAA STKGPSVFPL
SIMPLICITY APSSKSTSGG TAALGCLVKD YFPEPVTVSW PERFORMANCE
NSGALTSGVH TFPAVLQSSG LYSLSSVVTV PSSSLGTQTY ICNVNHKPSN
TKVDKRVEPK SPKSCDKTHT VERSATILITY CPPCPAPELL GGPSVFLFPP
KPKDTLMISR TPEVTCVVVD VSHEDPEVKF NWYVDGVEVH NAKTKPREEQ
YNSTYRVVSV AGGREGATES LTVLHQDWLN GKEYKCKVSN KALPAPIEKT
ISKAKGQPRE PQVYTLPPSR DELTKNQVSL WORKFLOWS TCLVKGFYPS
DIAVEWESNG QPENNYKTTP PVLDSDGSFF LYSKLTVDKS RWQQGNVFSC
GLYCANS SVMHEALHNH YTQKSLSLSP GK DILLTQSPVI
LSVSPGERVS FSCRASQSIG TNIHWYQQRT NGSPRLLIKY VARIANTS
ASESISGIPS RFSGSGSGTD FTLSINSVES EDIADYYCQQ NNNWPTTFGA
GTKLELKRTV AAPSVFIFPP PEPTIDE MAP SDEQLKSGTA SVVCLLNNFY
PREAKVQWKV DNALQSGNSQ ESVTEQDSKD STYSLSSTLT LSKADYEKHK
VYACEVTHQG LSSPVTKSFN RGA VANQUISH FLEX UHPLC
ES685054_BP1015_005_FP.pgs 10.05.2015 23:39 ADV blackyellowmagentacyan

6 BioPharm International www.biopharminternational.com October 2015
Guest Editorial
In the
development of
biopharmaceuticals
and pharmaceuticals,
the line is blurring.
Evolving to Meet Industry Changes
Like any other discipline, the pharmaceutical science industry is not
immune to change. In recent years it has seen company consolida-
tions, expansions, and mergers; limited/declining research funding;
and a decreasing pool of workforce talent. The nature of our industry has
shifted, and the growing interest in biotechnology has led to a metamorpho-
sis. Pharmaceutical companies continue to diversify into biologics through
acquisitions of biotechnology companies, in-licensing of products, academic-
industry partnerships, and R&D alliances.
A decade ago, a clear distinction was made between biopharmaceuticals
and pharmaceuticals based on their origin and method of manufacture. Since
then, however, various industry business reports, including those supported by
the Pharmaceutical Research and Manufacturers Association (PhRMA), have
asserted that with the metamorphosis of the industry noted above, driven in
part by the adoption of significant technological advances, “pharmaceutical”
and “biopharmaceutical” are essentially synonymous, signaling that the lines
between large and small molecules, chemical entities and biologically derived
therapeutic drug products, and also between large and small companies are
rapidly disappearing, which is—in fact—reflected in and across the PhRMA
and the Biotechnology Industry Organization memberships.
As of 2011, consistent with these industry trends, nearly 50% of American
Association of Pharmaceutical Scientists (AAPS) members are now affiliated
with small biopharmaceutical/pharmaceutical companies, contract research
organizations, or consultancies, with many of these pharmaceutical scientists
having, or expected to have in the future, overlapping responsibilities for the
discovery, development, and manufacturing of both small and large chemical
and biologically derived molecules, as do those members affiliated with large
biopharmaceutical/pharmaceutical companies, regulatory agencies, and uni-
versities. With the acceptance of biosimilars, pharmaceutical scientists affili-
ated with both brand and generic-drug companies, large and small, are likely
to have overlapping responsibilities for large and small molecules. Though
details may differ, the overarching principles, processes, and challenges of
academic pharmaceutical research, industrial drug development and manu-
facturing, and regulatory review, approval, and oversight of new therapeutic
products are not significantly different for large and small molecules.
AAPS meetings evolve to meet industry changesAAPS is working to merge its National Biotechnology Conference and its
Annual Meeting beginning in 2018 to provide a forum for all pharmaceuti-
cal scientists to work together to advance the field and facilitate the discovery,
development, and approval of new medicines. The programming for this sin-
gle meeting will be designed to leverage the diverse expertise of its members
to provide opportunities for sharing of cutting-edge science, building on the
commonalities between large and small molecules, as well as for furthering
the understanding of unique differences.
As the pharmaceutical industry changes, the association must change as
well if it is to remain relevant. The new combined meeting is a response to one
key aspect of the evolving industry and consequently the professional needs of
our members; other changing needs have been and will continue to be identi-
fied and addressed through the dynamic strategic planning and management
processes initiated this past year. AAPS is playing an important part in advanc-
ing the capacity of pharmaceutical scientists to develop products and therapies
that improve global health. ◆
Alice Till, PhD, is the 2015 president of the
American Association of Pharmaceutical Scientists.
ES684129_BP1015_006.pgs 10.02.2015 01:05 ADV blackyellowmagentacyan

A healthier world.Delivered.
Tt80% of our top clients work with
us in more than one business unit.
T R U S T
Because you created it when no one else could…
Because you know it has the potential to change everything…
Because you need to scale it up by millions while keeping it
safe for millions…
And because you believe medical hopes deserve to become realities…
You believe tomorrow’s breakthroughs should never have to wait
in yesterday’s supply chain.
They don’t have to anymore.
We are Patheon, and we bring to bear 40 years of experience and
expertise from development to manufacturing. Global reach.
An unrelenting dedication to quality and innovation. And a supply chain
solution designed to simplify complexity and speed up the process.
So bring us your brilliant discoveries. Your small molecules and biologics.
Your most complex approvals and manufacturing impossibilities.
And we’ll work towards a day when the medicines people need will
be waiting for them.
The world is waiting.
Let’s make the world healthy...together.
+1 866.PATHEON
www.patheon.com
800Drugs manufactured
or developed
ES685053_BP1015_007_FP.pgs 10.05.2015 23:39 ADV blackyellowmagentacyan

8 BioPharm International www.biopharminternational.com October 2015
Regulatory Beat
Vis
ion
so
fA
me
ric
A/J
oe
so
hm
/Ge
tt
y i
mA
Ge
s
FDA officials have been busy addressing
some difficult drug regulatory issues impor-
tant to biopharma manufacturing, market-
ing, and R&D. In July 2015, the regulators rolled
out a much-discussed proposal for how companies
should collect and submit data to measure the
quality and reliability of manufacturing systems,
only to meet strong objections from industry (1, 2).
FDA followed the metrics program with a highly
controversial plan for naming biosimilars and
innovator biotech therapies, which continues to
divide innovator and generic firms (3, 4).
A stated goal of these and related FDA poli-
cies is to facilitate patient access to needed medi-
cines, a process that involves preventing and
reducing critical drug shortages. The FDA Safety &
Innovation Act (FDASIA) of 2012 addressed short-
ages—in addition to providing FDA authority to
collect additional manufacturing data for its met-
rics program—by enabling the agency to require
early manufacturer notification of expected supply
disruptions for life-saving medicines. FDA issued a
final rule in July 2015 that addresses shortages by
requiring a broad range of companies to provide
advance (six months) notification of an event
likely to cause a “meaningful disruption”
in the supply of critical medicines (5).
Biotech manufacturers had protested
extending the initiative to vaccines
and other biologics, and generic-drug
makers complained that even a five-
day notification requirement may be a
burden, but those concerns did not stop
FDA from implementing what it consid-
ers a practical early notification policy.
Slightly different bioSimilar nameSMuch more contentious is FDA’s pro-
posal for addressing the hot-button
issue of how to identify biosimilars
related to innovator products. Biosimilar mak-
ers and payers want their new products to carry
the same proprietary names as reference drugs
to encourage prescribing and reimbursement;
brand companies argue that different names are
necessary to prevent inadvertent substitution
and confusion regarding adverse events.
FDA appears to lean towards the “ensure
safety” camp by establishing a new biosimilar
naming policy that adds a unique, four-digit suf-
fix to a “core” name for all biotech therapies (3).
This approach aims to prevent erroneous
prescribing and dispensing of biosimilar and
reference products and to facilitate tracking of
postmarketing safety issues, a process that FDA
says can’t rely on national drug code numbers
(NDC) because many biologics are administered
in hospitals and clinics. Biosimilar advocates
fear that even slightly different names will dis-
courage product uptake, but analysts note that
the similar core names will permit brands and
biosimilars to be grouped together on health
system databases, which will encourage their use.
While innovators may support FDA’s
approach for differentiating biosimilar names,
they are up in arms about the agency’s unex-
pected related proposal for adding suffixes to all
biotech therapies, including those already on
the market. To start what is sure to be a lengthy
process of revising product names retroactively,
FDA issued a proposed rule that specifically
applies the new naming policy to six licensed
biologics facing near-term competition from
biosimilars (6). Requiring new names for old
products has never occurred before, says Gillian
Woollett of Avalere Health, noting that sig-
nificant database and software changes may be
needed to accommodate the new system.
Still unclear is how FDA will apply the new
naming policy to biosimilars that achieve
“interchangeable” status, which applies to a
FDA Faces Controversy Over Quality Metrics and BiosimilarsManufacturers challenge details in new policies designed to promote access to important therapies.
Jill Wechsler
is BioPharm International’s
Washington editor, Chevy Chase,
md, 301.656.4634,
ES683161_BP1015_008.pgs 10.01.2015 20:36 ADV blackyellowmagentacyan

October 2015 www.biopharminternational.com BioPharm International 9
regulatory beat
drug that can be substituted by
the pharmacist without prescriber
permission; while this may be the
case for most conventional gener-
ics, biosimilars may be approved
as similar. One option is to permit
the same suffixes for these prod-
ucts, and FDA seeks comments on
this issue, as well as its broader
naming policy.
go SloW With metriCS Both brand and generic-drug firms
are troubled by FDA’s plan for col-
lecting data on a range of measures
for the reliability and quality of
drug-production operations and
resulting products. After three years
of workshops and white papers on
developing quality metrics, FDA
finally spelled out its program in
a draft Request for Quality Metrics
guidance document (1). Janet
Woodcock, director of the Center
for Drug Evaluation and Research
(CDER), opened an Aug. 24, 2015
public meeting to discuss the plan
by suggesting that the proposed
metrics are what “any manufac-
turer would want to know” and
that FDA had worked hard to
keep the new data collection ini-
tiative manageable and useful.
The guidance outlines a number
of data points that CDER and the
Center for Biologics Evaluation
and Research (CBER) believe will
help field inspectors assess the
ability of an operation to reliably
produce high-quality medicines;
firms with good reports may merit
less frequent plant inspections and
reduced reporting of post-approval
manufacturing changes.
Somewhat surprising after such
extensive FDA-industry collabo-
ration were the many objections
raised by manufacturers about the
metrics proposal being too broad,
unclear, and moving towards man-
datory implementation too quickly.
Industry reps stated at the August
2015 meeting that gathering and
reporting the data will be costly
and time-consuming and voiced
fears about the program generating
“report-card” listings and superficial
comparisons open to misinterpre-
tation by patients and payers.
Genentech V ice -P re s ident
Diane Hagerty, representing
the International Society for
Pharmaceutical Engineering (ISPE),
advised FDA to phase in the initia-
tive, starting with higher risk facil-
ities and products, and to drop
for now a measure for on-time
completion of annual product
reviews. Camille Jackson, director
for science & regulatory advocacy
at the Pharmaceutical Research
and Manufacturers of America
(PhRMA), questioned FDA’s use
of guidance, as opposed to more
formal notice-and-comment rule-
making, to provide sufficient
authority for the agency to require
metrics reporting in advance
of inspections. Similarly, David
Gaugh, senior vice-president
of the Generic Pharmaceutical
Association (GPhA), speculated
whether FDA can require metrics
reporting by foreign companies,
a limitation that he said could
encourage US firms to shift drug
production overseas.
Excipient makers objected to
the idea of collecting metrics on
“high risk” excipients, while API
producers raised a host of ques-
tions about providing quality mea-
sures on products made for many
drug companies. Non-prescription
drug firms want to limit ini-
tial metrics to high-risk medi-
cines, as opposed to hand creams.
And Gil Roth, president of the
Pharma & Biopharma Outsourcing
Association, voiced uncertainties
about how contract manufactur-
ers can submit data on a facility
making drugs for multiple clients.
Richard Johnson, president of the
Parenteral Drug Association (PDA),
optimistically described the FDA
proposal as “a good place to start,”
but cited challenges in assessing
the “quality culture” at compa-
nies—potentially the next phase
for the program, but now appar-
ently on the back burner.
All these objections clearly dis-
appointed FDA officials, who said
they sought an objective list of
measures that companies already
collect internally and that could
be assessed easily by field inspec-
tors. FDA believes the program will
assist in inspection scheduling and
in efforts to avoid supply disrup-
tions. But staffers acknowledged
the need to clarify terms, how data
will be used, and reporting rela-
tionships for contractors and sup-
pliers. Issuing final guidance “is a
high priority,” said Russell Wesdyk,
acting director of the Office of
Surveillance in CDER’s Office of
Pharmaceutical Quality, but FDA
extended its comment period
through November 2015, and no
one expects any revisions until
2016, at the earliest.
referenCeS 1. FDA, Draft Guidance, Request for Quality
Metrics (CDER, CBER, July 2015), www.
fda.gov/downloads/Drugs/
GuidanceComplianceRegulatory
Information/Guidances/UCM455957.
pdf, accessed Sept. 9, 2015.
2. J. Wechsler, “Industry Responds to FDA
Metrics Program,” PharmTech.com, Aug.
24, 2015, www.pharmtech.com/
industry-responds-fda-metrics-program,
accessed Sept. 9, 2015.
3. FDA, Draft Guidance, Nonproprietary
Naming of Biological Products (CDER,
CBER, August 2015), www.fda.gov/
downloads/Drugs/
GuidanceComplianceRegulatory
Information/Guidances/UCM459987,
accessed Sept. 9, 2015.
4. R. Hernandez, “FDA Releases Guidance
on Biosimilar Nomenclature, Requests
Comments on Interchangeable Product
Naming,” PharmTech.com, Aug. 27,
2015, www.pharmtech.com/fda-
releases-guidance-biosimilar-
nomenclature-requests-comments-
interchangeable-product-naming-0,
accessed Sept. 9, 205.
5. FDA, Federal Register, 80 (130), July 8,
2015, www.gpo.gov/fdsys/pkg/
FR-2015-07-08/pdf/2015-16659.pdf,
accessed Sept. 9, 2015.
6. FDA, Federal Register, 80 (167), August
28, 2015, www.gpo.gov/fdsys/pkg/
FR-2015-08-28/pdf/2015-21382.pdf,
accessed Sept. 9, 2015. ◆
ES683176_BP1015_009.pgs 10.01.2015 20:36 ADV blackyellowmagentacyan

10 BioPharm International www.biopharminternational.com October 2015
Perspectives on Outsourcing
Do
n F
ar
ra
ll
/Ge
tt
y I
ma
Ge
s
It has been the general consensus among
bio/pharmaceutical industry participants,
investors, and observers that small-mole-
cule drugs are becoming obsolete as the indus-
try focuses on biologics. To paraphrase what
Mark Twain allegedly said about his own situ-
ation, reports of the death of small-molecule
drugs are greatly exaggerated.
Small-molecule pharmaceuticals accounted
for 82% of all new drug application (NDA)
approvals in 2014 and 60% of all new molecu-
lar entities. Further, they represent two-thirds
of the drug-development pipeline. While
there can be no doubt that the number and
share of large-molecule therapeutics is increas-
ing, small-molecule drugs are an important
and highly effective component of the bio/
pharmaceutical portfolio. Many of the most
important drugs introduced in recent years,
including kinase inhibitors such as Gleevec
and anti-retroviral products such as Sovaldi,
are small molecules.
Smal l molecules have some consider-
able advantages over large molecules. They
can be engineered to deliver a
strong therapeutic effect with a
small dose, often below 10 mgs
and even into micrograms. The
smaller amounts of API, combined
with the maturity of chemical
manufacturing technology, typi-
cally translate into a lower cost
of goods relative to efficacy ver-
sus large-molecule therapeutics.
Analytical technology for small
molecules is highly refined, ensur-
ing quality, efficacy, and repro-
ducibility.
Further, small molecules can
be formulated into orally deliv-
ered dose forms, which offer
better compliance and a lower cost of admin-
istration than injectables, the principal deliv-
ery route for large molecules. There is a vast
amount of formulation expertise and experi-
ence with small-molecule drugs, enabling
highly controlled formulations that can be
delivered to specific sites and released over
specific time periods.
Clinical trials involving small-molecule
therapeutics are often simpler and less expen-
sive than those involving large-molecule
drugs. Process development and manufac-
ture of clinical-trial materials for small mol-
ecules are typically much less expensive for
small-molecule candidates. Clinical supplies
for small molecules must be handled carefully,
but they often don’t require the cold chain
assurance of large molecules, which makes
shipment and storage of clinical supplies
costly. Further, procuring comparators for bio-
pharmaceutical candidates (i.e., drugs already
on the market) can be extremely expensive.
Outstanding perfOrmanceSmall-molecule therapeutics have partici-
pated fully in the explosion of drug develop-
ment activity of the past few years, which has
been fueled by record amounts of fundraising
and spending for research and development.
clinical trials involving
small-molecule therapeutics
are often simpler and
less expensive.
Small-Molecule API CMOs Are ThrivingDespite emergence of biologics, small-molecule APIs benefit from industry growth.
Jim Miller is president of pharmsource
information services, inc., and publisher
of Bio/Pharmaceutical Outsourcing Report,
tel. 703.383.4903, twitter@
Jimpharmsource,
www.pharmsource.com.
ES683169_BP1015_010.pgs 10.01.2015 20:36 ADV blackyellowmagentacyan

Few things in life areabsolutely free...
Giving you unbridled freedom to
chase your wildest viral clearance
goals, we guarantee they’ll be met
or we repeat the study for FREE.
Contact us to find out how we can
guarantee our viral clearance services.
www.EurofinsLancasterLabs.com
...Except our viral clearance guarantee.
Leading experts in:
Chemistry
Biochemistry
Microbiology
Molecular &Cell Biology
Virology
Global Services:
Method Development/Optimization
Validation/Qualification/Transfer
Product Release Testing
Stability Storage & Testing
Raw Materials Testing
Impurities & Residuals Testing
Characterization
Cell Banking
Cell Line Characterization
Viral Clearance
Bioassays
Professional Scientific Services
ES685064_BP1015_011_FP.pgs 10.05.2015 23:40 ADV blackyellowmagentacyan

12 BioPharm International www.biopharminternational.com October 2015
al
l F
IGU
re
s a
re
Co
Ur
te
sy
oF
tH
e a
Ut
Ho
r.
perspectives on Outsourcing
Contract manufacturing revenues
of publicly-traded Òpure-playÓ
small-molecule contract manufac-
turing organizations (CMOs) grew
15% in the first half of 2015, with
some companies enjoying growth
in excess of 20% (see Figure 1).
Within the small-molecule API
world, certain segments appear
to be especial ly strong, nota-
bly controlled drugs and highly
potent APIs (i.e., cytotoxics, hor-
mones, and very low-dose com-
pounds). These products require
specialized facilities that protect
operators from exposure to the
chemical and, as with controlled
drugs, may have to meet special
regulatory requirements.
Demand for capacity to man-
ufacture high-potency products
has been so strong that CMOs
with the capability have been
expanding it while those lacking
the capability have been adding
it. CMOs that have recently com-
pleted or announced expansions
include SAFC, Johnson-Matthey,
Cambrex, Carbogen-Amcis, and
Novasep.
On Sept . 1, 2 015, Fa reva
(Luxembourg) announced that it
is acquiring an API manufactur-
ing site in La VallŽe, France from
Merck and will invest €25 mil-
lion ($28.3 million) to build two
units at the site with occupational
exposure band 4 (OEB 4) contain-
ment. Fareva already has high-
containment API manufacturing
capability at its facility in Feucht,
Germany, but needs to expand its
capacity to meet market demand.
m&a activityFurther speaking to the attractive-
ness of the small-molecule API
space has been acquisition activ-
ity. There have been a number
of significant deals with prices
equating to multiples of two or
more times the acquired compa-
nyÕs revenues.
I n M a rc h 2 015 , Pat he on
acquired Irix (Florence, SC), a
mid-size API manufacturer with
development and commercial
capabi l it ies . The acquisit ion
added small-molecule capabili-
t ies to PatheonÕs offer ings in
la rge -molecu le API and dos -
age forms. In July 2015, AMRI
announced it would acquire
Gadea Pharmaceut ica l Group
(Valladolid, Spain), a specialist in
hormone and steroid APIs. That
followed its 2014 acquisition of
Cedarburg Laboratories (Grafton,
WI), which has controlled and
h igh-potenc y d r ug capabi l i -
ties. Also, Siegfried (Zofingen,
Switzerland) announced in May
2015 that it will acquire the API
business of BASF, giving it three
additional manufacturing sites
and considerable greater scale and
presence in the industry.
The level of business, acquisi-
t ion, and capita l investment
activity in the small-molecule API
market shows that the industry
is taking full advantage of all of
the technologies in its tool box to
address the opportunities being
revealed by the increased under-
standing of disease processes.
New therapies like antibody drug
conjugates are marrying the spe-
cif ic capabilit ies of large and
small molecules to delivery highly
effective drugs to specific sites,
and the technology is expanding
beyond its initial focus on deliv-
ering cytotoxic compounds to
broader applications.
In t imes l ike these, when
investment activity reaches fren-
zied levels, investors and execu-
tives can be distracted by fads or
the latest technologies no mat-
ter how untested they might be.
Small-molecule APIs have per-
formed well and cost effectively
for patients and pharmaceuti-
cal companies for decades and
there is every reason to believe
that small-molecule API CMOs
will participate in the bio/phar-
maceutical industryÕs success for
decades to come. ◆
Figure 1: Growth in custom manufacturing revenues of small-molecule aPI
contract manufacturing organizations (Cmos) in the frst half of 2015.
0% 5% 10% 15% 20% 25% 30% 35%
PCAS
Dottikon
AMRI
Wuxi
Bachem
Siegfried
Sm
all-m
ole
cule
API C
MO
s
Percentage of growth
Cambrex
demand for capacity
to manufacture
high-potency
products has
been strong.
ES683177_BP1015_012.pgs 10.01.2015 20:37 ADV blackyellowmagentacyan

Learn more at www.ham-info.com/1026
Incyte Measures Viable Cell Density in Real Time
Incyte is insensitive to media changes, microcarriers,
dead cells and floating debris. It can be used to monitor
changes in cell physiology, cellular respiration, viral infection
timing, automated harvesting and much more.
Co-Worker || Amy S. || 11:16 AM
Are you working again this weekend?
Nope! I left Incyte in charge! : )Sent 11:24 AM
Automate Process Adjustment
© 2015 Hamilton Company. All rights reserved.
1-888-525-2123www.hamiltoncompany.com
PLATINUM
ELECTRODES
ELECTRIC
FIELDS
VIABLE
CELLS
POLARIZE
DEAD CELLS HAVE DAMAGED
MEMBRANES AND
DO NOT POLARIZE
ES685126_BP1015_013_FP.pgs 10.06.2015 00:17 ADV blackyellowmagentacyan

14 BioPharm International www.biopharminternational.com October 2015
Ra
fe
Sw
an
/Ge
tt
y Im
aG
eS
; D
an
wa
RD
Irreproducible preclinical research
is a global, expensive, and well-
recognized problem that con-
tributes to delays and increased
costs of drug discovery (1, 2). One
published study conservatively esti-
mated the total prevalence of irrepro-
ducible preclinical research to exceed
50% with a cost of $28 billion per
year in the United States alone (3),
while other researchers have estimated
that an astounding 85% of biomedi-
cal research is wasted as a result of
correctable problems (4). Excluding
scientific misconduct, which is not a
major source of irreproducibility (5),
lack of reproducibility typically results
from cumulative errors or flaws in one
or more of the following, non-discrete
categories of the research and pub-
lication process: biological reagents
and reference materials, study design,
laboratory protocols, and data analy-
sis and reporting (3). Although each
contributes to a systemic problem
that requires extensive changes in the
overall scientific culture milieu, tak-
ing immediate steps to address bio-
logical reagent issues—specifically the
use of cultured cell lines—is a rela-
tively straightforward fix that will
improve the credibility, reproducibil-
Changing the Culture of Cell Culture:
Applying Best Practices and Authentication
to Ensure Scientific ReproducibilityLeonard P. Freedman, Mark C. Gibson, and
Richard M. Neve
Taking immediate steps
to address misidentified and
contaminated cultured cell lines will improve the
reproducibility of preclinical
research.
Leonard P. Freedman is president,
Global Biological Standards Institute;
Mark C. Gibson is policy research
analyst, Global Biological Standards
Institute; and Richard M. Neve is senior
research scientist, Gilead Sciences, Inc.
Upstream Processing
ES684750_BP1015_014.pgs 10.05.2015 20:42 ADV blackyellowmagentacyan

Introducing a next generation, chemically-deÀned CHO fed-batch media platform from SAFC. Developed
across a range of widely used industrial CHO cell lines, this newest portfolio media delivers exceptional
titers and economic efÀciencies. Adaptation is simple. Celebrate performance and accelerate your
bio-development process.
Celebrate! Request your complimentary sample at
sigma-aldrich.com/CHOperformance
Cat. Nos: 14366C, 24366C, 24367C, 24368C
EX-CELL® ADVANCED™ CHO FED-BATCH SYSTEM
CELL CULTURE
PERFORMANCE
©2015 Sigma-Aldrich Co. LLC. All rights reserved. Sigma-Aldrich, SAFC, and EX-CELL are trademarks of Sigma-Aldrich Co. LLC, registered in the US and other countries.
NEXT GENERATION MEDIA PLATFORM
ES685085_BP1015_015_FP.pgs 10.05.2015 23:40 ADV blackyellowmagentacyan

16 BioPharm International www.biopharminternational.com October 2015
ity, and translation of preclinical
research. It will also make more
efficient use of scarce biomedical
research resources.
Immortalized cancer cell lines
isolated from various human and
other mammalian tissues have
been used for decades across mul-
tiple areas of biomedical research
(6). Their use is central to most
drug-discovery projects, from
initial target validation studies,
through clinical candidate selec-
tion, to subsequent translational
studies (7). It is essential for drug-
discovery scientists to have rou-
tine access to a wide variety of
high-quality, well-characterized,
and contaminant-free mamma-
lian cell lines. For these applica-
tions, accurate determination of
species, sex, and tissue of origin
(i.e., identity) is crucial to inter-
pretation, validity, and transla-
tion of research results (8). Cell
lines are cultured, passaged, and
processed in and among labora-
tories with widely varying quality
control (QC) procedures, while
sharing cell lines is endemic—
particularly in academia. For
these reasons, misidentification
errors, including intraspecies (most
commonly by HeLa cells [9]) and
interspecies (nonhuman) cross-
contamination, as well as label-
ing and cell naming errors, occur
frequently and can persist for years
(10). Changes in the genotype and
phenotype of cells (i.e., drift) as a result
of over-passaging of cell lines or poor
culture technique continue to be persis-
tent problems (11).
Microbial contamination of
continuous cell cultures by a wide
variety of microorganisms is also
problematic in cell culture labora-
tories worldwide, particularly by
mycoplasma. The latter can be dif-
ficult to detect, grow to high den-
sities without adverse effect on
cell morphology, and can impact
a wide variety of cell functions,
including changing response to
Upstream Processing
Table I: Factors affecting reproducibility of cell-based research.
Observation Possible Cause(s)
Changes in cell viability
• Cells were stored or cryopreserved incorrectly• Cells thawed incorrectly• Freezing/thawing media incorrect• Freezing media components expired• Cells overstressed during preservation• Too few cells frozen• Faulty incubator (water, temperature, etc.)
• Changes in cell growth rates • Changes in morphology/attachment
• Growth media and components incorrect• Media components expired• Poor quality serum• Poor culture technique (e.g., over-trypsinization)• Cells allowed to grow to confluency• Cells passaged too long• Cells contaminated (e.g., mycoplasma)• Cells cross-contaminated or misidentified• Poor quality culture vessels • Faulty incubator (water, temperature, etc.)
Altered response to therapeutics
• Growth media and components incorrect• Cells passaged too long• Cells contaminated (e.g., mycoplasma)• Cells cross-contaminated or misidentified• Poor quality therapeutic reagents
Genomic changes• Cells passaged too long• Cells contaminated (e.g., mycoplasma)• Cells cross-contaminated or misidentified
Contamination by microorganisms
• Poor cell culture technique• Contaminated laminar flow hood• Contaminated incubator• Contaminated cell culture reagents or consumables
Cross-contamination by other cell lines• Poor cell culture technique• Human error
ES684753_BP1015_016.pgs 10.05.2015 20:42 ADV blackyellowmagentacyan

October 2015 www.biopharminternational.com BioPharm International 17
therapeutics (12). Commercial tests
are available to detect the most
common forms of mycoplasma,
but no affordable test exists to
detect all Mollicute species.
Although multiple organizations
(e.g., National Institutes of Health
[NIH]) promote or recommend best
practices for handling biospecimens
and other biologicals, including
cell lines (7, 13), none are univer-
sally followed by a majority of bio-
medical researchers. Expanding the
development and use of best prac-
tices and consensus-based standards
for obtaining and maintaining
authenticated and contaminant-
free cell lines should also include
smaller repositories, otherwise
biological materials in the public
domain will likely become compro-
mised over time (8). Table I summa-
rizes factors that can contribute to
irreproducible cell-based research.
USE And CoSt of mISIdEntIfIEd And ContAmInAtEd CEll lInESHow widespread is the problem?
One key review examined the prev-
alence of contaminated cell lines
from 1968 to 2007 and reported
combined cell line misidentifica-
tion and contamination rates rang-
ing from 18% to 36%, with only a
small improvement over time (14).
A more recent estimate places the
cross-contamination rate at 20%
(15). While intraspecies contami-
nation receives the majority of
attention, approximately 6% of cell
cultures are thought to be affected
by interspecies cross-contamina-
tion (16). To complicate matters, a
study of more than 200 biomedi-
cal papers found that only 43% of
cell lines could be unambiguously
identified by their description
(e.g., authors provided a name and
source for the line such as a reposi-
tory) (17). This type of problem—
coupled with journal-imposed
space limitations—is symptomatic
of a widespread lack of consensus
on the level of detail required to
allow adequate documentation of
materials and methods in the lit-
erature to facilitate external replica-
tion of study results.
A search of NIH RePORTER iden-
tified 9000 projects and sub-proj-
ects that use cell lines at a total
estimated taxpayer expenditure
of $3.7 billion. If 18–36% of these
research projects use misidentified
or contaminated cell lines, poten-
tially $660 million to $1.33 bil-
lion in research dollars could be
affected. Based on two well-known
misidentified cell lines, HEp-2 and
INT 407, more than 7000 articles
have been published that may
have inappropriately used one or
both cell lines at a total estimated
cost of more than $700 million
(15). Estimates of the prevalence
of mycoplasma contamination
of cell cultures vary widely, from
15% to as high as 35% (12, 18).
An assessment of mycoplasma con-
tamination in the National Center
for Biotechnology Information
Sequence Read Archive conser-
vatively found that 11% of proj-
ects were contaminated (19).
Upstream Processing
Figure 1: Timeline of key events in cell line-based research and authentication.
1952: HeLa is the frst derived human cancer cell line
1950s: Lack of cell culture reagents and equipment leads to cross-contamination
1962: American Type Culture Collec-tion (ATCC, founded in 1925) tasked to be animal cell-line repository
1980-present: Multiple reports of intraspecies and interspecies contamination
1981: Walter Nelson-Rees identifes interspecies contamination
1990s: Short tandem repeat (STR) profling becomes standard for forensic testing
1993: 4-locus STR system described
1996: 6-locus STR with amelogenin system described
1999: 10-locus STR with amelogenin system described
2001: The International Single Nucleotide Polymorphism (SNP) Map Working Group provides a map of 1.4 million cadidate SNPs
2010: International Journal of Cancer
requires cell-line authentication for publication
2014: NIH announces plans to enhance reproducibility
2015: Nature and related journals strengthen policy on reporting of cell-line authentication
1966: Stanley Gartler identifedintraspecies cross-contamination byisoenzyme analysis
1984: Sir Alec Jeffries describes variable number tandem repeats (VNTRs) as a DNA fngerprinting test
1991: First report using STRs for DNA fngerprinting
1995: European DNA profling group (EDNAP) harmonization of STR loci begins
1995–1999: National DNA databases established in UK, US, Holland, Germany, Finland, Austria, and Norway
2007: Open letter by Roland Nardone to Michael Leavitt, Secretary, US Department of Health and Human Services, outlined widespread cases of cross-contamination and urged action on education and compliance
2012: Publication of ATCC's "ASN-0002 -Authentication of Human Cell Lines: Standardization of STR Profling"
1959: National Cancer Institute (NCI) proposes standardized collection of animal cell lines to prevent cross-contamination and misidentifcation
1952
1959
1962
1966
1981
1984
1991
1995
1999
2001
2007
2010
2012
2014
2015
2015: NIH revises grant instructions to include “authentication of key biological and/or chemical resources”
AL
L F
IGU
RE
S A
RE
CO
UR
TE
SY
OF
TH
E A
UT
HO
RS
.
ES685334_BP1015_017.pgs 10.06.2015 00:58 ADV blackyellowmagentacyan

18 BioPharm International www.biopharminternational.com October 2015
Upstream Processing
The authors estimated that hun-
dreds of millions of dollars of
N IH- funded r e s ea r ch u s ing
continuous cell lines had been
potentially affected.
Although cell lines contami-
nated with mycoplasma or other
microorganism constitute an
ongoing and expensive concern
in cell banks and cell culture labs
around the world, the remainder
of this paper focuses primarily
on misidentification and intra-
species cross-contamination of
human cell lines used in preclini-
cal biomedical research.
AUthEntICAtIon IS thE SolUtIonThe identity of a cell line (i.e.,
authentication) can be deter-
mined by comparing the genetic
s ignature (prof i l ing or f in -
gerprinting) with established
databases (e.g., American Type
Culture Collection [ATCC] in
USA, Japanese Collect ion of
Research Bioresources [JCRB]
in Japan, Deutsche Sammlung
v o n M i k r o o r g a n i s m e n u n d
Z e l l k u l t u r e n [ D S M Z ] i n
Germany) to discover misiden-
tif ied cells (20). It is impor-
tant to emphasize, however,
that profiling comprises only
one component of understand-
ing the complex molecular and
phenotypic properties of a cell
line, which is not a uniform,
clonal population (8). To fully
characterize a cell line requires
detailed genomic, proteomic,
and phenotypic analyses, which
remains implausible and costly
for most cell banks, let alone
typical research laboratories. For
this reason, cell line authentica-
tion and QC measures such as
mycoplasma detection constitute
an essential first step to estab-
lish and maintain the integrity
of cell cultures and to enhance
reproducibility of results using
cultured cel l s . An American
National Standards Inst i tute
(ANS I ) - a c c r ed i t ed , l ow-co s t
(approximately $150 fee for ser-
vice or $15–30 in-house) stan-
dard for cell line authentication
based on short tandem repeat
(STR) profiling has been available
for several years (21). Figure 1
provides a timeline of key events
in cell line-based research and
authentication.
Another DNA profiling test
of cell-line identity uses single
nucleotide polymorphism (SNP)
variations between members of
the same species within a specific
locus, which are conserved dur-
ing evolution (10, 22). Although
commercial kits are becoming
available, at present there is no
ANSI-approved standard or cen-
Table II: Comparison of short tandem repeat (STR) and single nucleotide polymorphism (SNP) techniques as methods
for DNA profiling. Adapted from (8).
Attribute STR SNP
Application Assess sample identity Assess sample identity
Level of discrimination a,b 2.82 × 10⁻¹⁹ 1.0 × 10⁻¹⁸
Number of loci for discrimination 16 48
Number of alleles per locus Multiple Biallelic
Detection of cross-contamination Yes (2–10%) Yes (2–10%)
Detection with degraded DNA Yes Yes
Sex determination Yes Yes
Ethnicity determination No Yes
Multiplexing Yes Yes
Commercially available reagents Yes Yes
Fee-for-service testing Yes Yes
Databases of cell line profiles Yes Yes
Cost per sample (in laboratory) $15–30 $6
a STR: www.promega.com/products/pm/genetic-identity/population-statistics/power-of-discrimination/.b SNP: http://agenabio.com/products/panels/sample-id/.
ES684755_BP1015_018.pgs 10.05.2015 20:42 ADV blackyellowmagentacyan

Eppendorf®, the Eppendorf logo, BioBlu®, epMotion®, and Vacufuge® are registered trademarks of Eppendorf AG, Germany.
U.S. Design Patents are listed on www.eppendorf.com/ip
Of ers may vary by country. All rights reserved, including graphics and images. Copyright © 2015 by Eppendorf AG.
More great of ers for your cell biology processes — now save up to 30 %!
Our new limited of ers enable you to:
> Convert your existing bioprocess
system to advanced single-use
technology: with BioBlu® Single-
use Vessels and adaptor kits
> Automate your pipetting: with
epMotion® 5070 and 5075 liquid
handling stations
> Concentrate your samples in a
quick, ef cient, and gentle manner
using the Concentrator plus*
(*U.S./CAN: Vacufuge® plus)
> Go green and save on ultra-low tem-
perature freezers! Choice of various
models between 101 L and 725 L
www.eppendorf.com/advantage
New Promotion Sept. 1 – Dec. 31, 2015
Take Good Care of Your Cells
ES685065_BP1015_019_FP.pgs 10.05.2015 23:39 ADV blackyellowmagentacyan

20 BioPharm International www.biopharminternational.com October 2015
tralized, online database for SNP-
based cell line authentication.
Table II compares and contrasts
the pros and cons of STR and
SNP profiling assays.
Despite the widespread avail-
ability of the STR standard and its
low cost, there is little evidence
that authentication is routinely
used in the life sciences—particu-
larly among academic research-
ers (23). One widely cited survey
reported that only one-third
of laboratories tested their cell
lines for identity (24). A Nature
Cell Biology editorial reported
that only 19% of papers using
cell lines published in the lat-
ter months of 2013 conducted
(or at least reported conducting)
cell- l ine authentication (25).
Although the International Cell
Line Authentication Committee
(ICLAC) online database of Cross-
contaminated or Misidentified
Cell Lines is widely considered
to be the “go-to” reference in
the field (26), less than half of
the respondents from a 2014
Sigma-Aldrich survey were famil-
iar with the database, and only
11% searched the database during
2013 (27).
Many scientists remain unaware
or unconvinced of the need to
carefully establish and maintain
cell cultures, and many do not
authenticate their cell lines often
enough or at all (8). More wor-
rying is a lack of understanding
of how to interpret DNA profil-
ing results. The current status
quo entails a de facto honor sys-
tem that assumes all scientists
use proper cell culture practices
and authenticate their cells lines,
as well as a pervasive presump-
tion that misidentified or con-
taminated cells is a problem
“for others” or is inconsequen-
tial for the final conclusions.
This culture persists because
most scientific journals—with
few exceptions—do not require
authentication as a condition of
acceptance of research for pub-
lication (8). Merely reporting
or attesting that cell lines were
authenticated or checked against
a database of misidentified or
cross-contaminated database is
not sufficient. To date, compli-
ance levels and the impact of
reporting guidelines to improve
study reproducibility have been
disappointing (28), but multi-
disciplinary efforts continue to
promote transparency, openness,
self-correction, and reproducibil-
ity in science reporting (29, 30).
Although expanding the com-
mercial availability of inexpen-
sive assays and fee-for-service
providers will help make authen-
t i c a t i o n m o r e u n i v e r s a l , a
systematic approach with com-
mitment by all key stakeholders
that embraces the importance of
targeted training and education
is needed. At present, there is lit-
tle or no standardized training
on cell-culture best practices and
authentication in basic biological
research groups, although these
do exist in GLP and GMP labs.
ImPRovInG AwAREnESS And tRAInInGTo effect meaningful change,
enhancing the reproducibility
and translation of biomedical
research using best practices for
cultured cell lines and authenti-
cation must build upon ongoing
multi-stakeholder efforts to raise
awareness of the issues and solu-
tions (6). The Global Biological
S t a n d a r d s I n s t i t u t e ( G B S I )
#authenticate campaign (www.
gbsi .org/authenticate) faci l i -
tates this kind of engagement
(31). NIH’s proposed Principles
and Guidelines for Reporting
Preclinical Research, which were
developed and are endorsed by
many journals and research soci-
eties, recommend establishing
best practice guidelines for cell
lines, such as the need to authen-
ticate cell lines, report the source
of the cell lines, and communi-
cate their mycoplasma contami-
nation status (32). More recently,
NIH announced clarifications
to their expectations from the
scientific community regarding
the rigor of research proposed
in grant applications, as well as
additions to the review criteria
used to evaluate proposals; these
clarifications were developed in
an attempt to enhance reproduc-
ibility (33). Notably, the latter
changes, which will take effect in
early 2016, include expectations
for authentication of key biologi-
cal and/or chemical resources,
such as cell lines, antibodies, and
other biologics.
Additional systematic changes
are needed beyond raising aware-
ness, expanding use of reporting
guidelines, and revising proposal
preparation and review criteria.
Development, implementation,
and dedicated funding to support
Upstream Processing
despite the
widespread
availability of short
tandem repeat
profiling and its
low cost, there is
little evidence that
authentication is
routinely used in the
life sciences.
ES684757_BP1015_020.pgs 10.05.2015 20:42 ADV blackyellowmagentacyan
October 2015 www.biopharminternational.com BioPharm International 21
Upstream Processing
targeted training and education
is absolutely essential. Toward
that end, in 2014 NIH launched
an extramural grant initiative,
“Training Modules to Enhance
Data Reproducibility (R25)” (34).
Understanding existing barri-
ers that prevent implementation
of universal cell authentication is
central to changing this state of
affairs. GBSI conducted an online
survey to determine why cell
authentication and the STR stan-
dard specifically is not used more
broadly, the results of which will
be shared in 2015. As a central
component of a broader educa-
tional program to improve the
credibility, reproducibility, and
translation of the life-science
research, GBSI is developing
an exportable “active learning”
training module to reduce cell
line misidentification, mislabel-
ing, and contamination errors.
ConClUSIonTargeted training, education,
and access to reliable and afford-
able assays are crucial to change
the culture of cell authentica-
tion. In conjunction with effec-
tive policies and expanded use
of standards and best practices
for cell culturing and authentica-
tion, knowledge of why and how
often to perform cell authenti-
cation will improve; hundreds
of millions of dollars in annual
research expenditures will be
used more efficiently; and the
translation of discoveries from
bench to clinical trial to bed-
side diagnostics and therapies
will be accelerated. Considering
the billions of dollars spent on
cell-based research each year,
expanded awareness and adop-
tion of authentication proto-
cols through targeted training is
a relatively inexpensive way to
considerably increase our annual
return on biomedical research
investment.
REfEREnCES 1. C.G. Begley and J.P. Ioannidis, Circ.
Res. 116, pp. 116–126 (2015).
2. F.S. Collins, L.A. Tabak, Nature 505,
pp. 612–613 (2014).
3. L.P. Freedman et al., PLoS Biol.
13:e1002165 (2015).
4. I. Chalmers and P. Glasziou, Lancet
374, pp. 86–89 (2009).
5. W. Gunn, Nature 505, pp. 483
(2014).
6. J.R. Lorsch et al., Science 346, pp.
1452–1453 (2014).
7. J.D. Wrigley et al., Drug Discov. Today
19, pp. 1518–1529 (2014).
8. L.P. Freedman et al., Nat. Meth. 12,
pp. 493–497 (2015).
9. D.A. Kniss and T.L. Summerfield,
Reprod. Sci. 1933719114522518
[doi] (2014).
10. M. Yu et al., Nature 520, pp. 307-311
(2015).
11. A. Capes-Davis et al., Int. J. Cancer
132, pp. 2510–2519 (2013).
12. S. Rottem et al.,“Contamination of
Tissue Cultures by Mycoplasmas,” in
Biomedical Tissue Culture, L.
Ceccherini-Nelli, Ed. (INTECHOPEN,
Rijeka, Croatia, DOI: 10.5772/51518,
2012), pp. 35–58.
13. R.J. Geraghty et al., Br. J. Cancer
10.1038/bjc.2014.166 [doi] (2014).
14. P. Hughes et al., Biotechniques 43,
pp. 575, 577–578, 581–572 passim
(2007).
15. J. Neimark, Science 347, pp. 938–
940 (2015).
16. W.G. Dirks and H.G. Drexler, Methods
Mol. Biol. 946, pp. 27–38 (2013).
17. N.A. Vasilevsky et al., PeerJ 1:e148
(2013).
18. V. Marx. Nat. Meth. 11, pp. 483–488
(2014).
19. A.O. Olarerin-George and J.B.
Hogenesch, bioRxiv, Cold Spring
Harbor Laboratory, pp. 1–24 (2014).
20. Y.A. Reid, Methods Mol. Biol. 731, pp.
35–43 (2011).
21. ATCC/SDO. ASN-0002: Authentication
of Human Cell Lines: Standardization
of STR Profiling, ATCC-Standards
Development Organization (SDO),
Manassas, Virginia, USA (2012).
22. F. Castro et al., Int. J. Cancer 132,
pp. 308–314 (2013).
23. L.K. Riley and B.A. Bauer,
“Authentication and Quality Control
Guidelines for Human Transplantable
Tumors and Cell Lines,” presentation at
FELASA 2013 (Barcelona, Spain, 2013).
24. G.C. Buehring et al., In Vitro Cell Dev.
Biol. Anim. 40, pp. 211–215 (2004).
25. Editors of Nature, “An update on data
reporting standards,” Nat. Cell Biol.
16, pp. 385–385 (2014).
26. ICLAC, “Database of Cross-Contaminated
or Misidentified Cell Lines,” http://iclac.
org/databases/cross-contaminations/,
accessed Aug. 12, 2015.
27. Sigma-Aldrich, “The Second Annual
State of Translational Research: 2014
Survey Report,” pp. 1–32 (St. Louis,
Missouri, USA, 2014).
28. D. Baker et al., PLoS Biol.
12:e1001756 (2014).
29. B.A. Nosek et al., Science, 348, pp.
1422–1425 (2015).
30. B. Alberts et al., Science, 348, pp.
1420–1422 (2015).
31. GBSI, “#authenticate,” www.gbsi.org/
authenticate, accessed Aug. 12, 2015.
32. NIH, “Principles and Guidelines for
Reporting Preclinical Research,” www.
nih.gov/about/reporting-preclinical-
research.htm, accessed Aug. 12, 2015.
33. NIH, “Enhancing Reproducibility
through Rigor and Transparency,”
http://grants.nih.gov/grants/guide/
notice-files/NOT-OD-15-103.html,
accessed Aug. 12, 2015.
34. NIH, “Training Modules to Enhance
Data Reproducibility (R25),” http://
grants.nih.gov/grants/guide/rfa-files/
RFA-GM-15-006.html, accessed Aug.
12, 2015. ◆
many scientists
remain unaware or
unconvinced of the
need to carefully
establish and
maintain cell cultures,
and many do not
authenticate their cell
lines often enough or
at all.
ES684756_BP1015_021.pgs 10.05.2015 20:42 ADV blackyellowmagentacyan

22 BioPharm International www.biopharminternational.com October 2015
Although guidance can be
found in ava i lab le bes t
practice documents (1–3),
limited information exists
about how exactly larger biological
manufacturers are transferring analyt-
ical methods. The author conducted
this brief survey of how manufactur-
ers transfer analytical methods as it
was expected that a significant varia-
tion exists. Specifically, the preferred
pre- and post-licensure analytical
method transfer (AMT) options for
the execution model, sample size, and
acceptance criteria were surveyed. A
total of eight large pharma/biotech
manufacturers, representing the three
major regulatory regions of the United
States, the European Union (EU),
and Asia, provided answers. All eight
manufacturers have global operations,
multiple commercial biological prod-
ucts, and more than 3000 employees.
This survey was intended to evalu-
ate how these manufacturers handle
internal versus external AMTs as well
as pre- and post-licensure AMTs.
The manufacturers’ representatives
were contacted directly by the author
via a detailed email survey request
and instructions. At total of 15 manu-
facturers were contacted and eight
responded with complete answers.
Subject matter experts, responsible for
AMTs, typically answered the survey
questions. Only one email response
was received from each of the eight
participants.
Description of AMtsAMTs may occur at any point in a
method and product lifecycle. An
AMT transfer may be associated with
transfer of the entire manufacturing
process during product development,
may occur after product licensure,
and/or may be a portion of a larger
technology transfer process. Or, an
AMT may be required to implement
the use of a new laboratory for qual-
ity-control release and/or stability
testing, either within or outside the
company (e.g., contract laboratory).
Using Parenteral Drug Association
(PDA) Technical Report (TR) 57 as the
reference point for AMT models, exe-
cution matrices, sample size calcu-
lations, and acceptance criteria, the
following options and conditions
were provided so that each manufac-
turer’s information could be part of
the evaluation (1). Most of the sur-
veyed manufacturers follow TR 57 for
AMT execution matrices and sample-
size calculations. The strategy used for
AMTs can vary, and several possible
options, per PDA TR 57, are described
as follows:
A. Co-validation—Sending and receiv-
ing laboratories participate in the
analytical method validation study
execution. This may be used early
in the lifecycle of a test method
when appropriate.
B. Comparative study—AMT study
performed concurrently by send-
ing and receiving laboratories.
Acceptance cr i ter ia determine
the equivalence of the two labo-
ratories. Historical and validation
data may be used when appropri-
ate for parts of the method trans-
fer study. The sending laboratory
typically has collected a signifi-
cant amount of historical data for
test method performance results
in addition to test results for the
samples to be tested at the receiv-
ing laboratory. Acceptance criteria
are typically set based on relevant
Analytical Method transfer conditions Used by Global Biologics Manufacturers
Stephan O. Krause
The author presents the
results of a survey of biologics
manufacturers to evaluate how
these manufacturers
transfer analytical methods.
Stephan O. Krause, AstraZeneca
Biologics, frederick, MD, UsA
Method transfer
ES685804_BP1015_022.pgs 10.07.2015 01:03 ADV blackyellowmagentacyan

Be a superhero. You can with our unmatched
chromatography portfolio.
Learn more about our new
Chromabolt® prepacked columns at:
Process scale chromatography can be challenging –
even for a superhero. But with the broadest portfolio
of chromatography resins, columns, and unparalleled
Whether you’re tackling higher and higher titers, racing
the clock, or conquering bottlenecks, we can help
you be the superhero.
Affinity. Ion Exchange. Reversed Phase. Expertise.
Your cape is waiting at
EMD Millipore is a division of Merck KGaA, Darmstadt, Germany
EMD Millipore, the M logo and Chromabolt are registered trademarks of Merck KGaA, Darmstadt, Germany. © 2015 EMD Millipore Corporation, Billerica, MA USA. All rights reserved. PS-SBU-13-09113. 2/2015
www.emdmillipore.com/Chromabolt
www.emdmillipore.com/chromatography
support from EMD Millipore, you can make it happen.
ES686507_BP1015_A23_FP.pgs 10.09.2015 00:55 ADV blackyellowmagentacyan

24 BioPharm International www.biopharminternational.com October 2015
product or material speci-
fications with consideration
of the previous validation/
qualification studies and/or
recent routine quality control
(QC) testing data. See the fol-
lowing B-1 and B-2 options:
B-1. F ixed AMT execut ion
matrix—The fixed AMT
execution matrix does
n o t i n t e g r a t e k n o w n
test method result vari-
ation and has therefore
an identical set of com-
parative data generated
between both laboratories
for each method transfer
executed. A fixed execu-
tion matrix can be more
advantageous when trans-
ferring multiple products
to/from multiple loca-
tions.
B-2. V a r i a b l e e x e c u t i o n
matrix—The variable exe-
cution matrix does con-
sider test method result
variation and may require
a larger data comparison
set for highly variable
test methods. A variable
execution matrix may be
advantageous when trans-
ferring bioassays with a
relatively high degree of
test-result variation.
C. Performance verif ication—
The receiving laboratory may
already perform the method
for a similar product or for
another type of sample for the
same product. In this case, a
formal method transfer may
not be required. Any reduced
prospective study considered
should be properly justified.
D. Waiver—The receiving labora-
tory may already perform the
method for a similar product
or for another type of sample
for the same product. In this
case, a transfer may be waived.
Any waived study should be
properly justified using avail-
able data.
B e s i d e s A M T o p t i o n s
A–D, PDA TR 57 p rov ide s
recommendations to use an
intermediate prec i s ion- type
AMT execut ion matr ix and
detailed instructions for risk-
based acceptance criteria. In
addition, for the option of using
a variable execution matrix,
sample-size calculations and a
detailed AMT example are given.
Although the AMT process is
conceptually similar for pre-
and post-validation transfers as
well as for internal vs. external
transfers, PDA TR 57, as well
as other available guidance by
the International Society for
Pharmaceut ica l Engineer ing
(ISPE) and the US Pharmacopeial
Method transfer
Clinical trial DS/DP Commercial DS/DP
Survey participant
number: 1–8
Internal AMT
To/from
CMO AMT
Internal AMT
To/from
CMO AMT
To in-country
release lab
AMT
Comments
1All (A–D)
are allowed
All (A–D) are
allowed
All (A–D)
are allowed
All (A–D) are
allowed
All (A–D) are
allowed
AMT model used depends on receiving
units (RU) capability and experience,
whether method has been previously
validated, number of RUs and other
project requirements.
2 B B B and C B B
Most AMTs use B. Some individual co-
validation (Model C) AMTs have been
used.
3 A and B B A and B B B
4 A and B A and B A and B A and B A and B A and B are most common approaches.
5 B B B B B
6 A or B B or C A or B A or B B
7 A, B, C C, DA, B, C
and DC, D C, D
All transfer models are practiced as
applicable.
8 B B B B B
Table I: Which typical AMT model do you use (A, B, C, or D)? DS is drug substance. DP is drug product. AMT is analytical
method transfer.
ES685810_BP1015_024.pgs 10.07.2015 01:03 ADV blackyellowmagentacyan

�bzena adds GMP manufacturing capabiliƟ es.
Composite CHO™ to produce high
expressing cell lines for manufacture
Composite Protein™ technology for
deimmunisaƟ on of therapeuƟ c proteins
�omposite ,uman �nƟ bodyΡ technology
to humanise and deimmunise anƟ bodies
iTope and TCED™ to idenƟ fy d cell epitopes
using a proprietary database and algorithm
EpiScreen™ for ex vivo assessment of the
immunogenicity of biopharmaceuƟ cals
Sa
n D
ieg
o,
USA
Cambridge, UK
Coventry, UK
ThioBridge™ for the generaƟ on of more
homogeneous anƟ body drug conjugates
TheraPEG™, CyPEG™ and HiPEG™ for
linking polymers to therapeuƟ c proteins to
edžtend their duraƟ on of acƟ on
PolyPEG™ a low viscosity polymer to
make it easier to manufacture and inject
long acƟ ng therapeuƟ c proteins
GMP manufacturing that specializes in single-use
technology for the producƟ on of biopharmaceuƟ cals
for Phase I and Phase II clinical trials
Process development focuses on improving
yield at each stage of development by
opƟ mizing each step in the process
Biosimilar cell line development in CHO,
NS0 and SP2/0 including enhanced PQA
dhe �bzena group has undergone a signiĮ cant transformaƟ on in past few years following
the acƋuisiƟ on of �nƟ tope in ϮϬϭϯ and PaciĮ cGMP in ϮϬϭϱ. �ringing together these
companies allows �bzena to support customers projects seamlessly from lead selecƟ on
through to GMP manufacturing for clinical trials.
Start your project today. Visit www.abzena.com
EŽǁ�ĞŶĂďůŝŶŐ�ďĞƩ�Ğƌ�ďŝŽƉŚĂƌŵĂĐĞƵƟ�ĐĂůƐ�ĨƌŽŵ�ŵŽƌĞ�ůŽĐĂƟ�ŽŶƐ�
R&D site for developing and synthesing
conjugaƟ on and P�GylaƟ on reagents
ES685083_BP1015_025_FP.pgs 10.05.2015 23:40 ADV blackyellowmagentacyan

26 BioPharm International www.biopharminternational.com October 2015
Convent ion (USP) , i s more
focused on post-validation AMT.
sUrvey QUestionsBecause limited specific guidance
exists for pre-validation AMTs,
and they may not be visible to the
chemistry, manufacturing, and con-
trols (CMC) assessors, the survey
questions were posed to manufac-
turers to understand the variation
among manufacturers frequently
transferring analytical methods. A
total of five possible AMT cases that
include pre- and post-validation
transfer stages and possible sending
units (SU) and receiving units (RU)
were evaluated for the preferred
AMT model use. To ensure that
the data can be fully evaluated and
compared, the questions were also
provided in tabular format. Survey
results for the four questions are
summarized in Tables I–V.
The questions were as follows:
1. Which different model, sample
size(s), and/or acceptance cri-
teria do you use for:
a. Clinical vs. commercial AMT
studies?
b. Internal vs. external (to/
from contract manufactur-
ing organization [CMO]) AMT
studies?
c. To/from CMO vs. in-country
batch release lab AMT studies?
(In-country batch release lab
= non-US regulatory-approved
labs to release commercial
product into their respective
countries/regions).
2. What are the total number of
samples/replicates tested by
both labs, SU and RU? Are you
using a fixed AMT execution
matrix (e.g., n=6, n=12, n=18,
n=24, or n=36 at each site, SU
and RU) or a variable execu-
tion matrix (calculated sam-
ple size which considers test
method variation?
3. Was an intermediate precision-
type comparison used (at least
two critical variation factors
selected)?
4. What is the acceptance crite-
rion for RU used: fixed or risk
based (e.g., fixed: ≤ 1.0 SD dif-
ference between SU and RU;
risk based: calculated primarily
by considering specification
and process capability and
maximum acceptable result
drift from SU to RU and result
variation at RU)?
Results for preferred use of
AMT model(s) were somewhat
surprising in that two of the
eight manufacturers make use
of all or most of the available
models regardless of the stage of
product development. Six of the
Method transfer
Survey participant
number: 1–8Clinical trial DS/DP Commercial DS/DP Comments
Internal AMT
To/from
CMO AMT
Internal AMT
To/from
CMO AMT
To in-country
release lab
AMT
1 B-1 B-1B-1 and
B-2B-1 and B-2 B-1 and B-2
Procedure allows for use variable
execution matrix.
2 B-1 B-1 B-1 B-1 B-1
Bioassay can use B1 (6, 18 for pre-,
post-validation, respectively) or B2
(variable).
3 B-1 B-1B-1 and
B-2B-1 and B-2 B-1 and B-2
4 B-1 B-1 B-2 B-2 B-2
5 B-2 B-2 B-2 B-2 B-2
6 B-1 B-1 B-1 B-1 B-1
7B-1 and
B-2B-1 and B-2
B-1 and
B-2B-1 and B-2 B-1 and B-2
B-1 for all AMTs, B-2 for bioassay
and ELISA methods. The number
of replicates is based on method
complexity and variation.
8B-1 and
B-2B-1 and B-2
B-1 and
B-2B-1 and B-2 B-1 and B-2
Fixed AMT sample size for a particular
method but variable AMT sample size
among different methods
Table II: Which typical execution matrix do you use when using model B (B-1 or B-2)? DS is drug substance. DP is drug
product. AMT is analytical method transfer.
ES685808_BP1015_026.pgs 10.07.2015 01:03 ADV blackyellowmagentacyan

October 2015 www.biopharminternational.com BioPharm International 27
Method transfer
eight limit the model options
to only two, with two of the six
using only model B for any of
the five possible AMT cases. All
manufacturers use model B, and
this option is by far the most
often used model. As the author
expected that option B would be
the most frequently used option,
the question of whether the fixed
(B-1) or variable (B-2) compari-
son models were used was there-
fore further evaluated, and the
results are shown in Table II.
Six of the eight manufacturers
stated that they use fixed execu-
tion matrices for pre-validation
AMTs, which offer the advan-
tage that the SU and RU always
know how much testing is to be
planned and executed regardless
of product-type and/or product
experience. A lot of the master
plan’s and AMT protocol’s con-
tent can thus be readily copied
to reduce the master plan and
protocol generation time. For
post-validation AMTs, this ratio
changes in favor of using a vari-
able execution matrix for three
manufacturers. This change to a
more rigorous AMT planning and
execution process can be justi-
fied, as the investment of more
rigorous AMT process steps is
commensurable with the product
development stage(s). The bio-
logical product is more valuable
at the commercialization stage(s)
as both successful clinical and
product/process validation stud-
ies were completed. Overall, the
results show significant variation
among the eight survey partici-
pants with all four cases (only
B-1; only B-2; only B-1 and B-2;
and B-1 changing to B-2 for post-
validation AMTs) represented.
An appropriate sample size can
be determined using the risk-
based approach outlined in PDA
TR 57. Based on the sample size
n, the study plan should ide-
ally be designed so that at least
two independent factors (e.g.,
analysts and/or days) known to
(potentially) impact test method
results are investigated during
the transfer. Statistical equiva-
lence testing is usually performed
to confirm that the transfer study
results are acceptable and fall
within preset limits.
Results for sample size varied
significantly in that the typical
AMT sample sizes can range from
a minimum of n=3 to as much
as n=24. Two of the manufac-
turers surveyed use n=24 for all
post-validation AMTs regardless
of whether methods are trans-
ferred internally or externally.
Survey participant:
1–8Clinical trial DS/DP Commercial DS/DP Comments
Internal AMT
To/from
CMO AMT
Internal AMT
To/from
CMO AMT
To in-country
release lab
AMT
1
Phase-
appropriate
AMT design
Phase-
appropriate
AMT design
Minimum of
n= 6
Minimum of
n=6
Minimum of
n=6
2 n=6 n=6 n=18 n=18 n=18Bioassay can use B1 (n=18) or B2
(variable n=6-18+).
3A: n=24
B: n=12B: n=12
A: n=24
B: n=12B: n=12 B: n=12
For model A, n=24 is used. For model
B, n=12 is used.
4 n=6 n=6 n=24 n=24 n=24
Typically, n=6 for clinical and n=24
(4x6) for commercial are used but n
can also be variable and risk based.
5 n=12 n=12 n=12-24 n = 12-24 n = 12-24
A fxed sample size of n=12 is used for
clinical DS/DP. For commercial DS/DP
AMT, sample size is calculated based
on analytical and process capability.
6 n=6 n=6 n=24 n=24 n=24
7 n=6–12 n=3–6 n=6 n=3–6 n=3–6
8 n = 12-24 n = 12-24 n = 12-24 n = 12-24 n = 12-24 n is calculated based on method and
process capability.
Table III: Which typical sample size(s) do you use (6, 12, 18, 24…)? DS is drug substance. DP is drug product. AMT is
analytical method transfer.
ES685806_BP1015_027.pgs 10.07.2015 01:03 ADV blackyellowmagentacyan

28 BioPharm International www.biopharminternational.com October 2015
Most of the manufacturers sur-
veyed tend to increase the sam-
ple size for post-validation AMTs,
which again can be explained by
the increase in “product value”
and the level of confidence in
the AMT results for late-stage/
commercial products.
In an intermediate precision
matrix study, at least two inde-
pendent factors (e.g., analysts
and/or days) are deliberately
varied to better estimate routine
testing conditions. Intermediate
precision at the RU could be eval-
uated from this data set; how-
ever, when a more detailed result
interpretation is desired at the
RU, a more extensive set-up may
produce test result variation that
is more representative of the
variation that typically occurs
with routine testing. Only one
manufacturer surveyed indicated
that it might use repeatability-
type precision for pre-validation
AMTs. All manufacturers sur-
veyed use at least two inde-
pendent variation factors for
post-validation AMTs.
For post -va l idat ion AMTs,
more than half of the AMT
acceptance criteria are risk based
and calculated primarily by con-
sidering specifications and pro-
cess capability and the maximum
acceptable result drift (from SU
to RU) and result variation at RU.
The survey suggests further that
some manufacturers integrate
more risk-based acceptance crite-
ria for post-validation AMTs.
It is the author’s experience
that a large data set for the prod-
uct- and method-specific perfor-
mance capabilities may not exist
prior to method validation. The
potentially large level of uncer-
tainty in the required method
performance as well as product/
process capability in early prod-
uct development stages can lead
to setting fixed acceptance crite-
ria. In late-stage, post-validation
stages, ideally, the maximum
acceptable differences between
laboratories for the method per-
formance characteristics of quan-
titative methods such as accuracy
Method transfer
Survey participant
number: 1–8Clinical trial DS/DP Commercial DS/DP Comments
Internal AMT
To/from
CMO AMT
Internal AMT
To/from
CMO AMT
To in-country
release lab
AMT
1
Phase-
appropriate
AMT
design
Phase-
appropriate
AMT design
Yes Yes YesIntermediate precision design is used for
quantitative, product-specifc methods.
2 Yes Yes Yes Yes Yes Intermediate precision design is used.
3 Yes Yes Yes Yes Yes
4 Yes Yes Yes Yes YesDirect transfer is also allowed
(repeatability study only).
5 Yes Yes Yes Yes Yes Minimum of 2 factors are used.
6 Yes Yes Yes Yes Yes
7 Yes Yes Yes Yes Yes
Acceptance criteria are based on
sending units intermediate precision
and method development history.
8 Yes Yes Yes Yes Yes
Table IV: Which intermediate precision matrix do you use for AMT model B? DS is drug substance. DP is drug product. AMT is
analytical method transfer.
it is the author’s
experience that a
large data set for the
product- and method-
specific performance
capabilities may not
exist prior to method
validation.
ES685809_BP1015_028.pgs 10.07.2015 01:03 ADV blackyellowmagentacyan

October 2015 www.biopharminternational.com BioPharm International 29
Method transfer
and intermediate precision are estimated based
on product-specific historical data with respect
to the specifications. Other approaches—such
as setting the acceptance criteria based on pre-
vious validation/qualification studies and/or
recent routine QC testing data with respect
to the relevant product or material specifica-
tions—may also be used. When using fixed
acceptance criteria such as a standard devi-
ation-based limit for the maximum allowed
difference between SU and RU, recent SU his-
torical, product-specific data are usually not
considered. Each approach has its advantage(s).
The risk-based approach in PDA TR 57 evaluates
risks to both patient and manufacturer.
Figure 1 highlights the two primary sources
to be considered to set risk-based acceptance
criteria for analytical method performance. To
be truly risk-based, from a patient and data-
continuity perspective, investigators should use
the product specifications and existing knowl-
edge of product and process capabilities (1).
Typically, in early-stage product development,
the specifications and product/process perfor-
mance can be estimated from historical data
of similar products. In late-/commercial-stage
product development, more product-specific
historical data exist so that product-specific,
risk-based acceptance criteria can be set using
product-specific specifications and process/prod-
uct capabilities.
The AMT acceptance criteria should be set
to balance patient and manufacturer’s expecta-
tions. First, if a high level of method capability
is desired within the given specifications and
expected process capability, setting tight accep-
tance criteria may be appropriate. Fulfilling the
second driver—which involves setting proto-
col acceptance criteria ranges wide enough to
ensure successful AMT completion—may be in
direct opposition with the expectations of the
patient. Acceptance criteria may be set unsuit-
ably wide to assure that all criteria are readily
passed. The method performance may therefore
be considered validated, compliant, and accept-
able, although the actual method performance
may not be suitable with respect to specifica-
tions and/or overall process capability expecta-
tions. It is therefore important to set risk-based
and balanced acceptance criteria intended to
satisfy both drivers as much as possible (1).
Uncertainty and test-result variation result
in risks to patient and firm. This relationship
should be understood and used to set acceptance
criteria to ensure the continued suitability for use of the
analytical method following an AMT. Simplified, the
relationship of the primary variation sources are shown
in Equation 1. As specifications are for the observed man-
ufacturing process variation, we should therefore control
result drifting and variation at RU through risk-based
acceptance criteria.
Figure 1: Risk-based AMT protocol acceptance criteria (1).
RegulatoryRequirements
Consider Typeof
Specifcations
One-SidedSpecifcations(NMT, NLT, LT)
Two-SidedSpecifcations
(Range)
Historical Datafrom this
Product and Process
Knowledgefrom SimilarProduct and
Process
ExistingKnowledge
Specifcations
AcceptanceCriteria
HistoricalMethod
Performance
AL
L F
IGU
RE
S A
RE
CO
UR
TE
SY
OF
TH
E A
UT
HO
R
ES685807_BP1015_029.pgs 10.07.2015 01:03 ADV blackyellowmagentacyan

30 BioPharm International www.biopharminternational.com October 2015
(Eq. 1)
The demonstration of equiva-
lence in average test results (accu-
racy and/or matching) and similar
precision (intermediate precision)
performance between the labora-
tories is of primary interest in the
evaluation of quantitative meth-
ods. A comparison of additional
validation characteristics (such
as quantitation or detection lim-
its) may be considered for par-
ticular method types. Statistical
tests can be used to demonstrate
equivalence between laboratories.
Equivalence testing by two one-
sided t-tests (TOST) is generally
applicable in most cases (1). The
TOST results are statistically sat-
isfactory and AMT results pass if
the confidence interval for the
difference in means between the
two laboratories falls within an
acceptable interval [-Θ, + Θ]. The
interval should define the largest
difference that could be accepted
between the laboratories while not
significantly impacting the suit-
ability of the transfered analytical
method (1).
conclUsionIn summary, the survey results pro-
vide valuable insight into how large
biologics manufacturers are trans-
ferring analytical methods in dif-
ferent situations. Some significant
variation was observed among the
eight manufacturers, specifically
in the use of AMT models, sample
size, and setting of acceptance cri-
teria. Analytical method transfers
are becoming more important as
biological products transfers are
occurring more frequently and
increasingly more globally. More
practical global guidance could
help to harmonize current method
transfer practices. This again would
ensure that product approval could
occur faster which is in the interest
of all stakeholders.
references 1. Krause et al., PDA Technical Report
57, “Analytical Method Validation
and Transfer for Biotechnology
Products” (PDA, 2012).
2. International Society for
Pharmaceutical Engineering, Good
Practice Guide: Technology Transfer
(ISPE, Tampa, FL, 2003).
3. USP, General Chapter <1224>
“Analytical Method Transfer,” USP
35 (US Pharmacopeial Convention,
Rockville, MD, 2012). ◆
Method transfer
Survey participant
number: 1–8Clinical trial DS/DP Commercial DS/DP Comments
Internal AMT
To/from
CMO AMT
Internal AMT
To/from
CMO AMT
To in-country
release lab
AMT
1Generally
fxed
Generally
fxedBoth Both Both
Procedures allow for use of both.
Justifcation for use of fxed or risk
based is required.
2 Fixed Fixed Risk based Risk based Risk based
3 Both Both Both Both BothBioassay is only AMT which has risk
based ACs.
4 Fixed Fixed Risk based Risk based Risk based
For clinical, fxed (but based on the
number of n used) in the study is most
common approach. For commercial,
ACs based on specifcation or tightest
release limit, method variability.
5 Risk based Risk based Risk based Risk based Risk based
Risk-based ACs with respect to
specifcation, known variability of both
process and test method.
6 Fixed Fixed Fixed Fixed Fixed
Fixed acceptance criterion (NMT 1.0
SD) for maximum difference between
SU-RU is set from SU performance.
7 Fixed Fixed Fixed Fixed FixedFixed acceptance criteria are used for
most of the AMTs.
8 Risk based Risk based Risk based Risk based Risk based
Table V: Which acceptance criteria do you use (i.e., fxed or risk based)? DS is drug substance. DP is drug product. AMT is
analytical method transfer. ACs is acceptance criteria.
[ σ mfg process observed ]2 =
[ σ analytical method ]2
+
[ σ mfg process actual ]2
ES685805_BP1015_030.pgs 10.07.2015 01:03 ADV blackyellowmagentacyan

Register for free at www.biopharminternational.com/bp/Automated
Automated De Novo Identification and Profiling of
Disulfide Bonds in Biotherapeutics Including Analysis
of Disulfide Bond Scrambling in Monoclonal Antibodies
LIVE WEBCAST: Tuesday, November 3, 2015 at 11am – 12pm EST
EVENT OVERVIEW:
This webinar will highlight the latest instrumentation and
software used to automatically detect and analyze disulfde
bonds in biotherapeutics, including monoclonal antibod-
ies. Application of a new liquid chromatography–matrix-as-
sisted laser desorption/ionization time of fight (TOF)/TOF
(LC–MALDI-TOF/TOF) approach, coupled with the latest
advances in software, will automatically detect, analyze,
and report—in a de novo fashion—the presence of disul-
fde bonds within a monoclonal antibody. This workfow:
n Is less time consuming; only one LC run is necessary, not
two with comparison
n Can detect, analyze, and report disulfde bonds with no
previous knowledge of their whereabouts within the
biotherapeutics.
n Can detect, analyze, and report disulfde bond scrambling
in a fast, efcient and automated fashion.
A case study showing automated detection of native and
scrambled disulfde bonds in a monoclonal antibody will be
presented.
Who Should Attend:
n Lab Directors, lab managers, and lab personnel involved in
antibody and recombinant protein analysis/characterization
at pharmaceutical, biotech, and CRO/CMO companies.
For questions contact Kristen Moore at
Key Learning Objectives:
n How the latest high resolution MALDI-
TOF/TOF systems can be used to analyze
disulfde bonds in your biotherapeutics
including monoclonal antibodies.
n Learn about implementing the latest
workfow for MALDI-TOF/TOF MS for
reducing analysis time when analyzing
disulfde bonds in therapeutic proteins
including easier access to information
about scrambled bonds.
n See the latest software for automated,
de novo, detection of disulfde bonds in
biotherapeutics..
Presenter
JASON S. WOOD. PhD
Market Area Manager
Biopharmaceuticals
Moderator
KRISTEN MOORE
Multimedia Producer
BioPharm
International
Sponsored by Presented by
ES685068_BP1015_031_FP.pgs 10.05.2015 23:39 ADV blackyellowmagentacyan

32 BioPharm International www.biopharminternational.com October 2015
Ca
llis
ta
im
ag
es
/ge
tt
y im
ag
es
More than two-thirds of
recombinant biopharma-
ceutical products on the
market are glycoproteins,
and every stage of their manufacture is
carefully monitored and tested to ensure
consistency in quality, safety, and effec-
tiveness (1). Of the various aspects of
biopharmaceutical production (such as
yield, protein folding, and post-trans-
lational modifications), the host cell’s
biosynthesis of attached oligosaccharides
(glycans) is often the most difficult to
control. Selected expression systems and
even slight changes in process conditions
can alter the synthesis of glycans and
as a consequence, the physicochemical
properties (e.g., serum half-life), safety,
efficacy, and immunogenicity of the
end product. Regulatory agencies world-
wide require state-of-the-art glycan anal-
yses and the demands placed on these
methods have steadily increased as bet-
ter technologies have been developed.
Ultimately, robust, information-rich, and
reproducible methods for glycan analysis
must be included in regulatory filings
for glycoprotein-based biotherapeutics to
ensure accuracy and consistency. Method
simplification and standardization will
provide additional assurance that the gly-
can-analysis methods used are transferra-
ble between testing sites both within and
outside (e.g., contract research organiza-
tions) of the organization, ensuring better
quality and efficiency in manufacturing.
Glycans face new scrutinyBy 2008, the biotechnology company
Genzyme had developed and marketed
a review of Glycan analysis requirements
Jennifer Fournier
The author explores
the basic rationale and
requirements for standardized
glycan analysis.
Jennifer Fournier is product marketing
manager, consumables business
unit-asr, at waters corporation.
Glycosylation
ES684993_BP1015_032.pgs 10.05.2015 23:09 ADV blackyellowmagentacyan

October 2015 www.biopharminternational.com BioPharm International 33
the drug Myozyme (alglucosidase
alfa) for the treatment of Pompe
disease, a rare and progressively
debilitating disorder characterized
by deficiency of lysosomal enzyme
alpha-glucosidase (GAA). The com-
pany was preparing to expand the
targeted treatment population from
primarily children to adults. Its
160-L production facility was work-
ing at capacity, so $53 million was
invested to build a 2000-L facility
for Myozyme in Allston, MA (2).
The company was ready to launch,
but FDA rejected Genzyme’s appli-
cation to sell the drug from the
2000-L plant. According to regu-
lators, the version made in the
2000-L tank was no longer the
same drug as the one produced
in the 160-L tank. FDA argued
that the differences in glycosyl-
ation—specifically in this case, the
composition of mannose-6-phos-
phate—meant that the drug was
no longer the biological equivalent
of the original material produced
in the 160-L bioreactor, and may
in fact introduce unknown clinical
variables. Genzyme argued that it
had already conducted a clinical
trial on the larger batch material,
demonstrating safety and effective-
ness. Ultimately, Genzyme had to
market the product from the larger
bioreactor under a different name.
The incident was a watershed
moment in the biopharmaceutical
industry, marking the emergence
of new challenges (1). First, regula-
tory authorities were beginning to
scrutinize the glycan structures of
biopharmaceutical products more
carefully based on established tech-
nical guidelines (e.g., ICH Q5E, ICH
Q6B, and FDA’s Guidance for Industry,
PAT—A Framework for Innovative
Phar maceut i ca l De ve lopment ,
Manufa c t u r ing , and Q u a l i t y
Assurance), yet there remained
inconsistencies in how FDA, the
European Medicines Agency (EMA),
and Japanese regulators determined
what is “biosimilar”. Second, prod-
ucts with complex glycosylation pat-
terns have the potential to easily fall
out of specification with changes
in biomanufacturing processes and
scale-up, so to meet the new regula-
tory demands, manufacturers had to
start carefully characterizing prod-
uct glycosylation and its relation to
the biological and clinical activity of
a medication, and begin monitoring
relevant glycan characteristics dur-
ing production (3, 4, 5).
In the years following FDA’s deci-
sion on Myozyme, the attention
given to glycan structure in bio-
pharmaceuticals has only increased,
reflecting improvement in analyti-
cal technology and a greater under-
standing of the role these structures
play in the physical characteristics,
stability, biological activity, and
the clinical safety and effective-
ness of a drug (6, 7). The technical
guidelines for characterizing and
monitoring glycans have changed
little since 2008; manufactur-
ers refer mainly to International
Conference on Harmonization
(ICH) documents Q5E and Q6B
(3, 4). These documents list the
following recommendations on
characterizing glycans:
“For glycoproteins, the carbo-
hydrate content (neutral sugars,
amino sugars, and sialic acids) is
determined. In addition, the struc-
ture of the carbohydrate chains,
the oligosaccharide pattern (anten-
nary profile), and the glycosylation
site(s) of the polypeptide chain is
analyzed, to the extent possible.”
Other guidelines exist, set-
t ing expectat ions for glycan
analysis, such as FDA’s Guidance
fo r Indust r y, Immunogenic i t y
Assessment for Therapeutic Protein
Products, and EMA’s 2007 mono-
graph on the characterization of
Glycosylation
Table I: Common sample preparation methods in glycan analysis.
Sample preparation Description Application
PNGase F Peptide-N-glycosidase FRelease of N-glycan chain except those
with (∝1,3)-linked core fucoseRelease of complex, hybrid, and
oligomannose N-glycans
PNGase A Peptide-N-glycosidase ARelease of N-glycan chain containing
(∝1,3)-linked core fucoseRelease of complex, hybrid, and
oligomannose N-glycans
ProteolysisThe use of a protease to generate peptides
(including glycopeptides) from a glycoproteinThe peptides are often analyzed to investigate
glycosylation sites and occupancy
Alkaline beta elimination/hydrazinolysis
Chemical cleavage of O-linked glycans from polypeptide chains
Primarily used in the analysis of O-linked glycans
PermethylationThe methylation of oligosaccharide hydroxyl groups to make glycans more amenable to
mass spectrometric (MS) analysis
MS-based characterization of glycans including linkage analysis
Amine/glycosylamine labeling
Modification of glycans to facilitate fluorescence detection
Detection of glycans and glycopeptides when native detection is not available. Increases options for chromatographic separation methods. May also enhance MS analysis
ES684985_BP1015_033.pgs 10.05.2015 23:08 ADV blackyellowmagentacyan

34 BioPharm International www.biopharminternational.com October 2015
monoclonal antibodies (8). The
monograph says the following
on glycans:
“Glycan structures should be
characterized, and particular atten-
tion should be paid to their degree
of mannosylation, galactosylation,
fucosylation, and sialylation. The
distribution of the main glycan
structures present (often G0, G1,
and G2) should be determined.”
These documents, however,
present few details on how to set
specification limits on glycans,
or recommend technologies and
procedures for consistent analyti-
cal results. The consequences for
this long-standing ambiguity are
that manufacturers and regulators
sometimes end up with different
ideas as to what constitutes a nec-
essary specification for a glycan
structure. Furthermore, compa-
nies submit reports to regulatory
authorities with widely different
analytical approaches. Procedures
may vary even within the same
organization, potentially leading
to inconsistent results, analytical
testing failures, and ultimately,
regulatory delays.
Quality by DesiGn vs. Quality in practiceIn 2002, in response to an increas-
ing burden on FDA of regulating
product manufacturing, and a
perception among companies that
regulatory requirements were lim-
iting flexibility in process optimi-
zation, FDA implemented changes
through its Pharmaceutical cGMP
21st Century Initiative and the
release of FDA’s process analyti-
cal technology guidance (PAT) (5).
The new approach placed greater
responsibility on the manufac-
turers to monitor quality control
through timely measurements and
corrections during processing.
Around the same time, ICH
published two guidance docu-
ments: ICH Q8 Pharmaceutical
Development (7), ICH Q9 Quality
Risk Management (8), and ICH
Q10 Quality Systems Approach to
Pharmaceutical cGMP Regulations (9,
10, 11). These documents helped
to further define current scientific
and risk-based approaches to phar-
maceutical quality control.
The concept of quality by design
(QbD) was incorporated into FDA
review in 2004, which together
with the aforementioned guidelines,
emphasized a greater understanding
of the product and its manufactur-
ing process, and designing quality
control into the process, rather than
testing it after the fact (12). This
approach is particularly well-suited
to glycan analysis, which is typi-
cally associated with a complex set
of critical quality attributes (CQAs)
(such as sialylation, antennary
structure, or glycan structure het-
erogeneity) that are important to
the biological or clinical activity of
the drug. The CQAs must be identi-
fied, measured during process devel-
opment, and maintained within
required parameters (i.e., the design
space) during production.
In the case of glycans, the mea-
surement itself may introduce
uncertainty and risk, due to a high
variability of outcomes when char-
acterizing oligosaccharide chains.
An interlaboratory study present-
ing 11 industrial, regulatory, and
academic labs with the same set
of four released N-glycans demon-
strated that results were not consis-
tent between the laboratories when
Glycosylation
Table II: Common separation methods in glycan analysis.
Separation method Description Application
HPAECHigh-pH anion-exchange
chromatography
Liquid chromatographic separation of
negatively charged (acidic) molecules
carried out at high pH
Separation, identification, and quantification of glycans and glycopeptides. Analysis of
monosaccharide and/or sialic acid composition. Often coupled with pulsed amperometric detection
(PAD) for detection of underivatized molecules
HPCE/CZE
High-performance capillary electrophoresis/capillary-
zone electrophoresis
Separation of molecules by charge using an electric field in a narrow capillary channel
Separation, identification, and quantification of charged glycans. Analysis and quantification of
sialylation
HILIC
Hydrophilic-interaction, high-performance liquid
chromatography
A variation of high-performance liquid chromatography (HPLC) that separates
molecules using a hydrophilic stationary phase and an organic-yet-water-miscible
liquid phase
Separation, identification, and quantification of glycans and glycopeptides
WAX–HPLC
Weak-anion exchange–high-performance liquid
chromatography
Separates anionic molecules based on their degree of charge
Separation, identification, and quantification of glycans and glycopeptides
RP–HPLC
Reverse-phase–high-performance liquid chromatography
Separates molecules on the basis of differences in the strength of their interaction
with a hydrophobic stationary phase
Separation, identification, and quantification of glycans and glycopeptides
ES684990_BP1015_034.pgs 10.05.2015 23:09 ADV blackyellowmagentacyan

ON-DEMAND WEBCAST (originally aired September 15, 2015)
Register for free at www.biopharminternational.com/bp/contamination
Controlling Contamination in
Biopharmaceutical Manufacturing
EVENT OVERVIEW:
Contaminants can have serious impact on in a biopharma-
ceutical manufacturing processes, facilities, drug products,
and ultimately, patients. These contaminants can include
prions, viruses, mycoplasma, and bacteria, as well as those
utilized in production such media additives. Manufacturers
must assess the risk of contamination in raw materials, the
potential for introduction during the manufacturing pro-
cess, the implications of a contamination event on drug
products and patients, and potential for drug shortages.
In this webcast, experts will review the sources of contami-
nation, regulations and guidance documents on the control
of potential contaminants in raw materials, and best prac-
tices to guard against the introduction of contaminants in
the manufacturing process. The challenges of detecting
contaminants, including mycoplasma, assay development,
and testing practices will be discussed.
Key Learning Objectives:
n Review sources of contamination in biopharmaceutical
raw materials and manufacturing
n Understand regulatory and technical documents that
provide guidance for raw materials quality
n Learn about the challenges of detecting mycoplasma
For questions contact Sara Barschdorf at [email protected]
Who Should Attend:
n Regulatory personnel
n Quality control/Quality assurance
n Product development scientists
n Process Development scientists
n Manufacturing engineers
Presenters:
Raymond Nims
Senior Consultant
RMC Pharmaceutical
Solutions, Inc.
Nataliya Afonina
President
Principal Consultant
AN Biologics Consulting
Aude Sanchez
Microbiology Project Leader
SGS Life Science Services
France
Moderator:
Rita Peters
Editorial Director
BioPharm International
Presented by Sponsored by
ES685066_BP1015_035_FP.pgs 10.05.2015 23:39 ADV blackyellowmagentacyan

36 BioPharm International www.biopharminternational.com October 2015
Glycosylation
comparing analyses of sialylation
and antennary structure (13). This
particular study did not address
the potentially added variability
caused by sample preparation. The
variability in outcomes may be
due in part to the availability of
numerous analytical approaches
and differences between labs as
to the selection of approach and
limitations of available equipment.
Inconsistent levels of training and
expertise in glycan analysis may
also have had an impact.
basic reQuirements for stanDarDizeD protocols of Glycan analysisThe establishment of a robust pro-
tocol for glycan analysis can help
extract the maximum benefit from
QbD practice; give manufacturers
greater control over product quality
and comparability between batches
and process modifications; and
ensure consistency and quality in reg-
ulatory submissions. Such a protocol
should have the following features.
Well-characterized
reference standards
A selection of known glycopro-
teins, glycopeptides, released gly-
cans, and monosaccharides will
help calibrate and validate any sys-
tem of glycoprofiling used in the
initial characterization of the prod-
uct or monitoring of the manufac-
turing process.
Well-characterized
sample standards
Isolated product with a known
clinical safety and efficacy profile
provides a reference point for com-
paring glycan structure of batch
products under different process
conditions and times.
Comprehensive identification
of critical glycan attributes
Structural features of glycans have
been linked to circulating half-life
of the glycoprotein in the blood
(sialylation); placental transport
(galactosylation); antibody-depen-
dent cell-mediated cytotoxicity
(core fucosylation); and a wide
range of effector functions, bio-
availability, and safety character-
istics (14, 15). Critical attributes
may include:
• Antennaryprofile
• Sia lylat ion state, including
degree and linkage type (∝2-3
vs. ∝2-6)
• Site-specific glycosylation pro-
files and occupancy
• Fucosylation
• Galactosylation
• N-acetyl-lactosaminerepeats
• Highmannoseresiduescomposi-
tion
• Absenceofimmunogenicelements
such as N-glycolylneuraminic
acid (Neu5Gc), deacetylated
N-acetylneuraminic acid (Neu5Ac),
and Gal∝(1-3)Gal.
Variations in these CQAs intro-
duced by manufacturing can orig-
inate from selection of cell line,
bioreactor conditions such as nutri-
ent levels, pH or oxygen content, as
well as inadvertent modifications
during downstream purification.
Table III: Common detection methods in glycan analysis.
Detection method Description Application
PADPulsed amperometric
detectionPermits detection without fouling
electrodes
Detection of non-derivatized glycans (most sugars do not absorb UV).
Frequently linked to high-pH anion-exchange chromatography (HPAEC)
FD Fluoresence detectionSelective fluorescent labeling and
detection, which may use derivatizing agents
For the analysis of derivatized glycans and glycopeptides when native
detection does not offer sufficient sensitivity. Increases options for
chromatographic separation methods. May also enhance mass spectrometric
(MS) analysis
ESI–MSElectrospray ionization–
mass spectrometry
Mass measurement of gas-phase ionized molecular species, where
ions are generated by applying a high voltage to a liquid to create an aerosol, with little fragmentation of molecules. Can be directly integrated with liquid
chromatography
Mass mapping of glycans and glycopeptides (including non-
derivatized) for identification of sequence, antennary pattern,
modifications, and heterogeneity, etc.
MALDI–TOF MS
Matrix-assisted laser desorption ionization–
time-of-flight mass spectrometry
Mass measurement of gas-phase ionized molecular species, where ions are generated by embedding molecules in a solid matrix, and releasing them as
ions via laser ablation
Mass mapping of glycans and glycopeptides (including non-
derivatized) for identification of sequence, antennary pattern,
modifications, and heterogeneity, etc.
ES684992_BP1015_036.pgs 10.05.2015 23:09 ADV blackyellowmagentacyan

October 2015 www.biopharminternational.com BioPharm International 37
Glycosylation
Establishment of ranges
of acceptable variation in
complex glycosylation patterns
Many glycoproteins, par t icu-
larly those with multiple glyco-
sylation sites, do not exist as a
single species, but as a mixture of
glycoforms. The natural complex-
ity and heterogeneity of glycan
structures can have important
functional relevance for a pro-
tein, and even minor, low-abun-
dance glycoform species can be
crucial. For clinical purposes,
each product may have a differ-
ent tolerance or requirement for
glycoform distribution. In par-
ticular, clarity on the extent to
which low-abundance glycoforms
should be identified and moni-
tored is essential.
Adherence to best practices
in sample preparation
Selecting the most appropriate
method from the wide range of
published and commercial sample
preparation methods can be daunt-
ing. For example, purification of
glycans after release from protein
may be performed by solvent pre-
cipitation, solid-phase extraction,
or size-exclusion, hydrophobic-
interaction, or hydrophilic-inter-
action chromatography. Some
methods may lead to a non-stoi-
chiometric recovery of oligosaccha-
rides, skewing the results of glycan
profiling. Recent developments in
sample preparation have allowed
for a reduction in preparation
times and improved quantitative
yields of both high- and low-abun-
dance glycoforms (16).
Selection of glycoanalysis
technologies, methods, and strategy
There is a wide array of technolo-
gies that can be applied to glycan
analysis (see Tables I–III). A series
of detailed optimal workf lows
and best practices would help
to harmonize analytical proce-
dures between and within orga-
nizations that submit regulatory
reports. Workflows would cover
initial characterization through
to routine monitoring and quality
control. Considerations should be
made with respect to the simplic-
ity and time of analysis, as long
as the required levels of accuracy
and reproducibility are not com-
promised.
The use of or thogonal and
complementa r y met hods of
analysis help compensate for sys-
tematic errors in measurement.
These methods typically isolate
molecules and their fragments
based on different physical prop-
erties (e.g., high-performance
capillary electrophoresis [HPCE]
vs. hydrophilic interaction liq-
uid chromatography [HILIC]) or
analytical treatment (e.g., electro-
spray ionization–mass spectrom-
etry [ESI–MS] vs. matrix-assisted
la ser desor pt ion/ion i zat ion–
time-of-flight mass spectrometry
[MALDI–TOF–MS]), and are com-
pared to compensate for potential
bias introduced by each analytical
method.
conclusionPharmaceutical regulatory agen-
cies worldwide have laid out the
general principles of quality con-
trol and risk management in bio-
pharmaceutical manufacturing.
Of the many CQAs that require
consideration, the variation of the
N-linked and O-linked glycosyl-
ation profiles of biotherapeutic
glycoproteins is one of the most
complex to assess. Currently, there
are numerous methods used to
elucidate these structures with
varying degrees of accuracy and
precision. In addition, the use of
these somewhat disparate meth-
odologies makes it not always pos-
sible to directly compare results
between laboratories. To meet
regulatory requirements for con-
sistent process and quality con-
trol, it would be beneficial to
establish more specific and stan-
dardized guidelines for glycan
analysis performance with respect
to reproducibility, accuracy, and
sensitivity for the characterization
and routine monitoring of critical
glycoforms, including those of low
abundance. While such guidelines
are within purview of national
regulatory bodies and interna-
tional consensus organizations
(such as ICH), no such guidelines
have been released to date. The
requirements for glycan analy-
sis described in this article could
address many of the issues related
to process and quality control in
glycoprotein manufacturing.
references 1. G. Walsh, Nature Biotech. 28 (9), pp.
917–924 (2010).
2. G. Mack, Nature Biotech. 26 (6), pp.
592 (2008).
3. ICH, Q5E Specifications: Test
Procedures and Acceptance Criteria for
Biotechnological/Biological Products,
EMA Document CPMP/ICH/5721/03
(Geneva, 2003).
4. ICH Q6B Specifications: Test Procedures
and Acceptance Criteria for
Biotechnological/Biological Products,
EMA Document CPMP/ICH/365/96
(Geneva, 1999).
5. FDA, Guidance for Industry, PAT—A
Framework for Innovative
Pharmaceutical Development,
Manufacturing, and Quality Assurance
(Rockville, MD, Sept. 2004).
6. R. Jefferis, Biotechnol. Prog. 21, pp.
11–16 (2005).
7. S.A. Brooks, Mol. Biotechnol. 28 (3), pp.
241–255 (2004).
8. EMA, Guideline on Development,
Production, Characterization and
Specifications for Monoclonal Antibodies
and Related Products, EMEA/CHMP/
BWP/157653/2007 (London, 2007).
9. FDA, Guidance for Industry, Q8
Pharmaceutical Development (Rockville,
MD, May 2006).
10. FDA, Guidance for Industry, Q9 Quality
Risk Management, (Rockville, MD, June
2006).
11. A.S. Rathore, A. Sharma, and D. Chillin,
BioPharm Int. 19, pp. 48–57 (2006).
12. A.S. Rathore, Trends Biotechnol. 27 (9),
pp. 546–553 (2009).
13. S. Thobhani et al., Glycobiology, 19 (3),
pp. 201–211 (2009).
14. T. Kibe et al., J. Clin. Biochem. Nutr. 21
(1), pp. 57–63 (1996).
15. A. Okazaki et al., J. Mol. Biol. 336 (5),
pp. 1239–1249 (2004).
16. M.A. Lauber et al., Anal. Chem. 87 (10),
pp. 5401–5409 (2015). ◆
ES684991_BP1015_037.pgs 10.05.2015 23:09 ADV blackyellowmagentacyan

38 BioPharm International www.biopharminternational.com October 2015
Advanced ant ibody eng i -
neer ing has resu lted in
the ability to manufacture
new recombinant bispecific
ant ibodies suitable for therapeu-
tic use. FDA has approved a bispe-
cif ic antibody—Amgen’s Blincyto
( bl inatumomab) —for the t reat-
ment of refractory B-cell precursor
acute lymphoblastic leukemia (ALL).
Blincyto targets cell surface proteins
CD19 and CD3 simultaneously, help-
ing to put T cells within reach of
the targeted cancer cell with the
goal of allowing the T cells to inject
toxins into cancer cells, prompting
cell death (1). Bispecific antibodies,
thus, have the potential to improve
cytolytic effects in cancer therapy.
Bispecific antibodies are also con-
sidered an effective platform for the
delivery of therapeutic antibodies
across the blood-brain barrier (2).
This suggests that in certain cases,
bispecif ic antibodies may have a
clinical advantage over monospecific
antibodies.
Dur ing development and qual-
ity control, a range of analytical
technologies are used to character-
ize biotherapeutic drugs, including
methods to analyze their structural
integrity and activity. Target/ligand
binding is an essential critical qual-
ity attr ibute (CQA) that needs to
be monitored. The enzyme-linked
immunosorbent assay (ELISA) is
often used to assess ligand binding;
ABSTRACTBiotherapeutic antibodies are still the largest growing class of medicines and are
used globally to treat a wide range of diseases such as cancer, asthma, and rheumatoid arthritis. Compared to traditional small-molecule drugs, their structures are complex, and they may assert their effects by binding to more than one target molecule. To date, the majority of monoclonal antibodies (mAbs) have generally
targeted a particular antigen; however, there are several additional antibody formats currently in the development pipelines of pharmaceutical and biotech companies.
One of these promising groups of antibodies is called bispecifics, where one antibody can simultaneously bind to two targets.
applications of Surface Plasmon Resonance for detection of bispecific
antibody activityRobert Karlsson
Robert Karlsson is senior staff scientist of
protein analysis applications at ge healthcare’s
life Sciences business.
PEER-REVIEWED
article submitted: may 21, 2015.
article accepted: July 27, 2015
AG
SA
ND
RE
W/ IS
TO
CK
/GE
TT
Y I
MA
GE
S P
LU
S/G
ET
TY
IM
AG
ES
Peer-Reviewed
ES685016_BP1015_038.pgs 10.05.2015 23:27 ADV blackyellowmagentacyan

October 2015 www.biopharminternational.com BioPharm International 39
however, it is an indirect method and the
output is limited to end-point data. By
contrast, label-free technologies such as
surface plasmon resonance (SPR) and bio-
layer interferometry allow users to follow
the dynamics of the interactions so that
binding and dissociation events can be
directly measured. SPR is a direct binding
technique that can measure sequential
binding events and is a key part of any
analytical toolbox, enabling the examina-
tion of dual-target specificities in a bispe-
cific antibody within a single assay.
In the early phases of development (3),
the focus is on the drug substance and the
assumed mechanism of action. Early bio-
therapeutic development is typically target
based (4), and for a therapeutic antibody,
the mechanism of action includes target
binding, but may also include Fc receptor
and complement binding. A lead substance
shall elicit the desired functional response
of the target molecule, have adequate bio-
availability and biodistribution, and is
evaluated from a toxicity perspective.
As the lead candidate enters late-stage
development, several CQAs have been
established (i.e., properties essential for
clinical safety and efficacy), including data
on how it interacts with target proteins.
See Figure 1 for a sample of the interaction
properties that may affect binding activity
and concentration of a bispecific antibody.
Important manufacturing CQAs related
to protein integrity, homogeneity, pres-
ence of host-cell proteins, host-cell DNA,
and/or substances released from process or
package material, can be identified using
risk assessments. Risk can be assessed by
comparing test results with previous expe-
rience, knowledge, and through the use
of control procedures. While CQA analy-
sis is typically performed in a core ana-
lytical lab, there are also other in-process
controls that allow a manufacturer to
steer the process toward a product with
known quality. For each step in the manu-
facturing process, critical process parameters
(CPPs) that can affect CQAs are identified (5).
Temperature, pH, cell density, and con-
centrations of nutrients and metabolites
are typical CPPs during cell culture, while
other CPPs are important during purifica-
tion. Controlling these parameters can
define the quality of the product. Test pro-
cedures and acceptance criteria for CQA
analysis have been described in regulatory
guidelines for biotechnological/biological
products (6, 7).
Late-stage development starts with set
up and validation of analytical methods
and with securing reagents (8–10) for the
analytical program. A broad range (50–60
variants) of different analytical technolo-
gies may be used for CQA analysis (11).
Mass spectrometry (MS) can be used to
establish the identity of the drug (primary
sequence) and for detection of size-distri-
bution profiles linked to post-translational
modifications such as glycosylation (12).
MS is further used in combination with
high-performance l iquid chromatogra-
phy (HPLC) and other chromatographic
methods to detect and localize amino acid
modifications (13). Chromatography tech-
niques are broadly used for detection and
isolation of charge and size variants (14).
Sodium dodecyl sulfate polyacrylamide gel
electrophoresis (SDS–PAGE) and Western
blotting demonstrate protein integrity and
in the case of antibodies, the presence of
heavy-heavy-light, heavy-light, or light
(HHL-, HL- or L-, respectively) chains can
easily be detected (15). ELISA and SPR are
commonly used for in-vitro confirmation
of biological activity by measuring interac-
tions with antigens, receptor, Fc-receptors,
or other binding proteins (11, 13). Cell- or AL
L F
IGU
RE
S A
RE
CO
UR
TE
SY
OF
TH
E A
UT
HO
R.
Peer-Reviewed
Figure 1: Changes of critical quality attributes,
such as high-order structure, amino acid
modifications, glycosylation, and stability might
impact binding activity and concentration.
ES685017_BP1015_039.pgs 10.05.2015 23:27 ADV blackyellowmagentacyan

40 BioPharm International www.biopharminternational.com October 2015
animal-based bioassays can also be used to
provide information about the complete
function of a biotherapeutic drug.
Process development for chemist ry,
manufacturing, and controls (CMC) (15)
includes selection of a cell line for pro-
tein expression, development of the cul-
ture process, and purification of the drug
substance, while formulation includes
selection of excipients for the final drug
product. During process development, the
goals are to obtain high product yield
and a good process economy; to ensure
that properties related to initial CQAs
are maintained; and to secure that the
process itself is well controlled and has
low impurity levels. Formulations ensure
that the final product has proper stability,
administration properties, and pharma-
cokinetic profile. Throughout all steps of
late development, initial CQAs are moni-
tored and possible new CQAs are evalu-
ated. Before transfer to manufacturing,
the complete list of CQAs will be estab-
lished, along with methods for their con-
trol. Manufacturing and quality control
helps ensure the supply of a consistent
quality product to the market. CQAs are
determined using the “best” knowledge
at a given time; they may later have to be
revised based on the results of accumu-
lated clinical data.
Manufactur ing t imel ines extending
over decades present both challenges and
opportunities. A major challenge is to
maintain a high and consistent product
quality, as manufacturing and analyti-
cal technologies evolve, and material and
reagents become obsolete. The opportu-
nity lies in improvements that simplify
processes and make them more reliable
and/or more economic. The demonstra-
tion of comparability does not necessarily
mean that the quality attributes of the
pre-change and post-change products are
identical, but based on results and existing
product knowledge, it should be possible
to predict that any differences in quality
attributes have no adverse impact on the
safety or efficacy of the drug product (16).
Manufacturing changes may be frequent
and approval times for changed products
can be lengthy (17).
In this article, the use of SPR in the
characterization of bispecific antibodies—
including understanding mode of action;
defining specific target binding and over-
all antibody activity; and control of their
therapeutic development—are discussed.
The applicabil ity of SPR in validating
potential bispecific molecules for quality
and in monitoring multiple binding sites
is also discussed.
SPR analySiS iS focuSed on ligand binding
Ligand-binding assays are key for char-
acterization of biotherapeutic medicines.
SPR and ELISA are extensively used in
ligand-binding assays. SPR analysis has
been used for antibody characterization
for more than 20 years. The sample read-
out from an SPR system such as Biacore
(GE Healthcare) is related to molecu-
lar mass and any binding event can be
detected without the use of labels (Figure
2). The readout is continuous, which
Peer-Reviewed
Figure 2: Sample surface plasmon resonance (SPR) readout (ÒsensorgramÓ) that shows binding
(association) and dissociation of an analyte interacting with a surface-bound molecule.
Time
Resp
on
se (
RU
)
ass
oci
ati
on
disso
ciation
ES685422_BP1015_040.pgs 10.06.2015 01:51 ADV blackyellowmagentacyan

October 2015 www.biopharminternational.com BioPharm International 41
allows for the quality control of the entire
binding event and provides opportuni-
ties for data analysis based on binding
responses obtained at one or several spe-
cific time points (report point analysis)
or by comparing and even fitting entire
binding curves for determinat ion of
kinetic and affinity parameters. SPR sys-
tems can deliver a direct binding assay
focused on relevant interactions and can
provide information on binding activities
and detect even very weak interactions
(18, 19).
Characterization of binding events is
essential for confirmation of CQAs, plays
a vital role in forced degradation studies,
and can either complement or form the
basis for potency assays. Binding assays
reflect the molecular mechanism of action
and can be developed into such potency
assays.
TaRgeT bindingAntibodies, cytokines, and hormones typi-
cally interact with their receptors. While
cytokines and hormones retain their natu-
ral sequence and folding, antibody thera-
peutics are engineered to interact with
target molecules (including antigens, Fc
receptors, and complement factors) based
on their intended mechanism of action.
The focus in this section is on the primary
target molecule.
Binding properties can vary consider-
ably with estimated dissociation half-lives
from 50 seconds (including interferon
2α to IFNAR [20]) to 12 hours (VEGF to
bevacizumab [21]). There are currently
several antibody formats in development,
with a particular focus on bispecific anti-
bodies, where two distinct target func-
tionalities are combined in one molecule.
This provides a single biotherapeutic with
the ability to target more than one effec-
tor function, improving the chance of
overcoming or slowing the progression
of the disease. More than 20 bispecific
antibodies are currently in clinical tri-
als (22). There are two main categories of
bispecifics, immunoglobulin G (IgG)-like
bispecific antibodies, and small bispecif-
ics. IgG-like bispecifics have a conserved
immunoglobulin-constant domain that
demonstrate properties of Fc, while smaller
bispecifics often lack Fc functionality.
Small bispecifics can potentially reach
more hidden targets, but the lack of Fc
functionality may result in shorter half-
lives and thus, introduce a new balance
between half-life and efficacy. In certain
cases, pegylation may be used to increase
the half-life of these smaller contructs
(23). SPR has been used for successful
characterization of a number of differ-
ent bispecifics, including in the following
examples:
Peer-Reviewed
Figure 3: Assay setup for kinetic analysis of a bispecific construct that has been pre-incubated
with antigen A. A = Antigen 1, B = Antigen 2, = Bispecific antibody.
Bispecifcantibodysaturated
with antigen A
A
AA
A A
A
A A
A
B B B
A
BB B
Antigen atsaturating
concentration
ES685022_BP1015_041.pgs 10.05.2015 23:28 ADV blackyellowmagentacyan

42 BioPharm International www.biopharminternational.com October 2015
• Bridge T-cell and target-cell receptors (24)
• Bridge Factor IXa and Factor X (FIXa
and FX) binding to mimic the natural
function of factor FVIII (25)
• Combine VEGF and Ang-2 functional-
ities to reduce the formation of blood
vessels in cancer tissue (26).
Target binding is clearly an essential
critical attribute and has to be controlled
during development and later in quality
control (QC) for batch-to-batch consis-
tency. While release assays traditionally
are based on bioassays, ligand-binding
assays (21, 27) can be considered when
the mechanism(s) of action is/are defined.
Although kinetic data are useful for in-
process character ization and batch-to-
batch comparisons, release assays require
that the ligand-binding assays produce a
product concentration that ref lects the
pharmacological activity (potency assay).
Release assays are often based on rela-
tive comparisons and parallel line/parallel
logistic analyses with defined conditions
for equivalence (28).
In one example, the dual specificity
assay for Roche’s VEGF-Ang2 CrossMab (19)
was developed into a potency assay (26).
VEGF was immobilized to the sensor sur-
face, followed by CrossMab and angio-
tensin injections. In this way, individual
binding events of VEGF-CrossMab and
CrossMab-angiotensin were measured, as
well as the change in binding of angio-
tension with increasing concentrations of
CrossMab. Two response values related to
the individual binding events of VEGF-
CrossMab (R1) and CrossMab-angiotensin
(R2) were obtained. The R2 value that
reflects the entire interaction was plotted
versus the logarithm of the concentration
of the CrossMab. The assay was tested using
CrossMabs with known deviation in con-
centration values including stressed samples,
and was shown to have excellent linear-
ity, precision, and accuracy in the range of
60–140% of the nominal concentration.
In another example, a zybody with
f ive specif icit ies was investigated (23).
Multivalent molecules, with additional
peptides providing functional binding
sites to the C- and N-terminii of both
the heavy and light chains, were added
to adalimumab, trastuzumab, and cetux-
imab. These zybodies were shown to have
increased tumor inhibition and showed
improved efficacy in a tumor xenograft
model. When different “modular recog-
nition domains” (MRDs) were fused to
different chain positions of trastuzumab
and analyzed for their binding efficiency
using SPR, it was found that fusion of the
C-terminus of the light chain resulted in
lower binding than at any other potential
fusion position analyzed in the study.
analyTical challengeS wiTh biSPecificS
CrossMab and zybody analyses demon-
strate that several specif icit ies in one
molecule can be measured in sequence.
However, the f irst binding event may
result in a biased selection of antibod-
ies that are avai lable for the second
interaction, as antibody molecules with
impaired activity may not bind or else
bind with lower stability. Therefore, it is
important to determine the fraction of
active molecules available for interactions.
Calibration-free concentration analysis
can potentially be used to determine the
activity of the separate binding sites. This
involves the immobilization or capture of
the different antigens, followed by cali-
bration-free concentration analysis (CFCA)
analysis. Because bispecific molecules are
used as analytes, the ratio of CFCA concen-
Peer-Reviewed
Figure 4: Calibration-free concentration
analysis (CFCA) is based on initial binding
rates. If binding rates are flow-rate-dependent
(left pane), then CFCA is possible. When
binding rates are flow-rate-independent (right
panel), CFCA is not possible. RU=response.
50
RU
30s 30s
100 μL/min
10 μL/min
ES685024_BP1015_042.pgs 10.05.2015 23:28 ADV blackyellowmagentacyan
October 2015 www.biopharminternational.com BioPharm International 43
trations can directly provide information
about the integrity of the bispecific molecule.
Another assay set up that may prove
useful for analysis of bispecifics is illus-
trated in Figure 3. The bispecific in this
example was exposed to two different
antigens using a dual-injection protocol.
In the first step, the solution from the left
tube containing the bispecific antibody
saturated with antigen A was injected.
Once exposed to surface-bound antigen
B, the bispecific antibody bound via the
corresponding binding site. Antigen A
at high concentration was then injected
from the second tube, and dissociation of
the antibody from antigen B was moni-
tored in the presence of excess antigen
A. This ensures that the observed dis-
sociat ion is related to the antibody’s
interaction with antigen B. This type of
experiment can be used to understand
if and how the binding of one antigen
affects the binding of a second antigen.
fc-RecePToR bindingFc-γ receptors are expressed on different cell
types and can be activating (FcγRI, FcγRIIa
and FcγRIIIa), inhibitory (FcγRIIb), or with-
out effect (FcγRIIIb) in antibody-dependent
cellular cytotoxicity (ADCC). The mecha-
nism of action for several anti-cancer anti-
bodies involves ADCC, where the interaction
with the FcγRIIIa receptor present on natural
killer cells may be of particular importance.
SPR analysis is widely used in research where
antibodies are either designed for improved
interaction with Fc-γ receptors (29) or for the
elimination of immune effector functions
when non-immunostimulatory mAbs are
developed (30).
Bispecifics with combined target and
Fc receptor functionalit ies to improve
effector functions include HER2/neu anti-
bodies that were combined with F(ab’)
s directed to Fcγ receptors (31) or with
FcαRI to trigger an F(ab’) directed towards
the IgA Fc receptor CD89 (32).
calibRaTion-fRee concenTRaTion analySiS foR RaPid, abSoluTe, and RelaTive concenTRaTion meaSuRemenTSConcentration analysis based on ligand
binding typically requires a standard prep-
aration with known active concentration.
A standard preparation may not always be
available, however, as is the case when a pro-
tein is expressed for the first time or when
concentration data for the standard reflects
the total protein concentration and not the
active concentration. In such circumstances,
SPR analysis can be used for the direct assess-
ment of the active concentration. This tech-
nique was first described in 1993, but has
been further refined with modern numeri-
cal integration tools for data analysis (33,
34). The CFCA method illustrated in Figure
4 provides a good estimate of the absolute
binding concentration, provided that the
diffusion coefficient of the analyte is known
and the observed binding rate is flow-rate-
dependent. There are small remaining uncer-
tainties related to the conversion of the SPR
signal to surface concentration units. All
of these uncertainties will cancel out when
CFCA is considered as a relative concentra-
tion method rather than an absolute concen-
tration method.
Using CFCA as a relative concentration
method is an excellent tool for comparing
concentration data, and may be particularly
useful for reagent characterization and as
a complement to kinetic analysis. This is
especially true when changes in the interac-
tion can be related to changes in the active
concentration. The use of CFCA for analyz-
ing chromatography fractions and to guide
purification efforts have been described
(35). Considering that relative concentra-
tion data are easy to obtain with CFCA, it
may also be used to complement and sup-
port potency assays.
SummaRyThe lifespan of an approved, branded bio-
therapeutic agent can reach more than
20 –30 years. During this time, a manufac-
turer must develop and deliver a product
with consistent quality. To support this
process, regulatory authorities such as FDA
and the European Medicines Agency have
issued guidelines aimed at securing safety
and efficacy of biotherapeutic medicines.
Ant ibodies, cy tok ines, and hormones
assert their actions through interactions
with their target molecules, and ligand-
binding assays are highly relevant for the
characterization of these drugs.
Peer-Reviewed
ES685025_BP1015_043.pgs 10.05.2015 23:28 ADV blackyellowmagentacyan

44 BioPharm International www.biopharminternational.com October 2015
Peer-Reviewed
Label-free technologies such as SPR can
be used in cell culture, purification, and
formulation workflows for the determina-
tion of antibody concentration and for
kinetic analysis of drug-target interactions.
SPR measures interactions directly and
is capable of measuring sequential bind-
ing events. This enables the analysis of
dual-target specificities for a bispecific
antibody in a single assay set up. SPR has
already been applied as a potency assay for
bispecific antibodies, and the use of CFCA
introduces novel opportunities to assess
the activity of separate binding sites for
bispecific and multispecific antibodies.
Bispecific and multispecific antibodies
constitute a growing area of biotherapeu-
tics. Improving the assessment and under-
standing of multiple binding sites will be
important to understanding their mecha-
nisms of action, to determine their opti-
mal configuration, and for quality control
in manufacturing. SPR, therefore, has an
important role in the ongoing develop-
ment of bispecific antibodies.
RefeRenceS 1. Amgen, “Amgen Receives FDA Breakthrough
Therapy Designation For Investigational BiTE
Antibody Blinatumomab In Acute Lymphoblastic
Leukemia,” Press Release, July 1, 2014.
2. Y.J. Yu et al., Sci. Transl. Med. 6 (261),
261ra154 (2014).
3. H.H. Shih, “Discovery Process for Antibody-
Based Therapeutics,” in Development of
Antibody-Based Therapeutics, M.A. Tabrizi et al.
Eds. (Springer Science+Business Media, New
York, NY, 2012), pp. 9–32.
4. D.C. Swinney and J. Anthony, Nat. Rev.Drug
Discov. 24, pp. 507–519 (2011).
5. M. Mitchell, BioPharm Int. 12 (26), pp. 38–47
(2013).
6. ICH, Q6B Specifications: Test Procedures and
Acceptance Criteria for Biotechnological/
Biological Products, Step 4 version (September
1999).
7. FDA, Guidance for Industry, Bioanalytical
Method Validation (Rockville, MD, May 2001).
8. D.M. O’Hara et al., AAPS J. 14 (2), pp. 316–
328 (2012).
9. R.F. Staack, et al., Bioanalysis 3 (5), pp. 523–
534 (2011).
10. M. Federici et al., Biologicals 41, pp. 131–147
(2013).
11. A. Beck et al., Trends in Analytical Chemistry
48, pp. 1–10 (2013).
12. J. Visser et al., BioDrugs 27 (5), pp. 495–507
(2013).
13. L.C. Santora et al., Anal. Biochem. 299 (2), pp.
119–129 (2001).
14. GE Healthcare, “Analysis of Therapeutic
Antibodies using Amersham WB System,”
application note 291140-27 AA (Sept. 2014).
15. S.D. Jones, P. Seymour, and H.L. Levine,
Contract Pharma, April 20I0.
16. ICH, Q5E Comparability of Biotechnological/
Biological Products, Step 5 version (June
2005).
17. C.K. Schneider, Ann. Rheum. Dis. 72 (3), pp.
315–318 (2013).
18. FDA, Guidance for Industry: Scientific
Considerations in Demonstrating Biosimilarity to
a Reference Product (Rockville, MD, Apr. 2015).
19. C. Gassner et al., J. Pharm Biomed Anal. 102,
pp. 144–149 (2014).
20. C. Dhalluin et al., Bioconjugate Chem. 16 (3),
pp. 518–527 (2005).
21. N. Papadopoulos et al., Angiogenesis 15 (2),
pp. 171–185 (2012).
22. I. Spasevska, BioSciences Master Reviews.
Department of Biology, University of Lyon
(January 2014), http://biologie.ens-lyon.fr/
ressources/bibliographies/m1-12-13-biosci-
reviews-spasevska-i-1c-m.xml, accessed on
Sept. 22, 2015.
23. D.W. LaFleur et al., mAbs 5 (2), pp. 208–18
(2013).
24. P.A. Moore et al., Blood 117 (17), pp. 4542–
4551 (2011).
25. T. Kitazawa et al., Nat. Med. 18 (10), pp.
1570–1574 (2012).
26. W. Schaefer et al., Proc. Natl. Acad. Sci. USA
108 (27), pp. 11187–11192 (2011).
27. N. Rieder et al., BioProcess Int. 8 (6), pp.
33–42, (June 2011).
28. USP, USP General Chapter <1032>,
“Development and Design of Biological Assays,”
USP 35–NF 30:162 (US Pharmacopeial
Convention, Rockville, MD, 2010), pp. 1–36.
29. X.R. Jiang et al., Nat. Rev. Drug. Discov. 10 (2),
pp. 101–110 (2011).
30. O. Vafa et al., Methods 65 (1), pp. 114–126
(2014).
31. B. Stockmeyer et al., Cancer Res. 57 (4), pp.
696–701 (1997).
32. T. Valerius et al., Blood 90 (11), pp. 4485–
4492 (Dec. 1, 1997).
33. R. Karlsson et al., J. Immuno. Methods 166 (1),
pp. 75–84 (1993).
34. E. Pol, J. Vis. Exp. 37, pp. 1746 (2010).
35. GE Healthcare, “Accurate Comparability
Assessment of a Biosimilar Interferon in
Process Development,” application note
29-1154–78 AC (2014). ◆
ES685023_BP1015_044.pgs 10.05.2015 23:28 ADV blackyellowmagentacyan
Built for BiopharmaState-of-the-Art UHPLC for Characterizing Biotherapeutics
ON-DEMAND WEBCAST (Originally aired September 24, 2015)
Register for free at www.biopharminternational.com/bp/built
EVENT OVERVIEW:
When developing biotherapeutics, the characterization of
proteins is required to obtain information on the molecule’s
attributes. The analytical tools to achieve this goal consist of
a range of chromatographic techniques, such as reversed-
phase, ion-exchange, and size-exclusion chromatography.
Each of these techniques provides complementary informa-
tion on the protein. Five types of analysis are common for
all biotherapeutics: analysis of hydrophobicity and charge
variants, quantitation of aggregates and fragments, peptide
mapping, and glycan profling.
In this webinar, we will discuss the development of liquid
chromatography methods that are optimized to meet the
requirements of modern biotherapeutics characterization
laboratories. Emphasis will be given in guiding the selec-
tion of the proper column characteristics and instrument
settings.
Who Should Attend:
n Laboratory scientists
n Laboratory managers
n Directors of analytical departments in the
biopharmaceutical industry
For questions contact Kristen Moore at
Key Learning Objectives:
n The advanced features of
the newest generation
of biocompatible ultra-
high performance liquid
chromatography (UHPLC) systems
n Choosing the proper columns for
protein characterization
n How to optimize HPLC for protein
therapeutics
Presenter
MAURO DE PRA, PhD,
Senior Solution Specialist
HPLC
Thermo Fisher Scientifc
Moderator
RANDI HERNANDEZ
Senior Editor
BioPharm International
Sponsored by Presented by
ES685055_BP1015_045_FP.pgs 10.05.2015 23:39 ADV blackyellowmagentacyan

46 BioPharm International www.biopharminternational.com October 2015
Sc
ien
ce
Ph
oto
Lib
ra
ry
- a
nD
rZ
eJ W
oJc
icK
i/G
et
ty
im
aG
eS
Ef fective analysis of v iruses
and virus-like particles (VLPs)
is crucial for the development
of vaccines and drugs. VLPs
are designed to mimic the activity of
viruses via viral surface proteins, but
they lack the infectious genetic mate-
rial of viruses. Detection of VLPs can
be a challenging task, and any detec-
tion method must be able to differen-
tiate virus and VLP particles—which
range from tens to hundreds of nm—
from proteins. In addit ion, many
sample preparation techniques have
the potential to impact the structure
and properties of virus particles and
VLPs.
As a non-invasive method, dynamic
light scattering (DLS) offers many
advantages over more t radit ional
approaches such as mic roscopy,
which often require manipulations
that can alter the particles, accord-
ing to Sophia Kenrick, an applica-
tion scientist with Wyatt Technology.
“DLS provides the hydrodynamic size
of molecules and particles in solu-
tion and consequently can measure
the size of viruses and VLPs in their
native state,” she adds.
Dynamic Light Scattering for Non-Destructive, Rapid
Analysis of Virus-Like ParticlesCynthia A. Challener
Dynamic light scattering
techniques can monitor viruses
and virus-like particles in their
native state.
Cynthia A.Challener, PhD,
is a contributing editor to
BioPharm International.
Analytical Techniques: Dynamic Light Scattering
ES684130_BP1015_046.pgs 10.02.2015 01:06 ADV blackyellowmagentacyan

October 2015 www.biopharminternational.com BioPharm International 47
The chALLeNge of The NATiVe eNViRoNmeNTCharacterizing viruses and virus-
like particles in their native envi-
ronments is difficult, particularly
when it comes to identification
of crucial traits that are relevant
to API development, production,
and targeted applications. Particle
size and morphology and the
interactions that influence their
self-assembly behavior, reactivity,
and stability must be evaluated
in the presence of many other
types of molecules, according to
Yuanming Zhang, chief appli-
cation scientist for Brookhaven
Instruments.
Determining the structures of
virus particles and VLPs includes
quantifying the total particle size,
heterogeneity, and aggregate con-
tent in a final formulation solu-
tion, according to Kenrick, and all
these aspects can be investigated
with DLS. In batch mode (i.e.,
with an unfractionated sample)
DLS provides an average hydro-
dynamic size for a given sample
and some information about the
size distribution. The DLS data
can also be analyzed to deter-
mine if other species are pres-
ent in solution in addition to the
VLPs. DLS reveals the sizes of
multiple species in the solution
as long as there is approximately
a f ive-fold d i f ference in the
hydrodynamic radii of the spe-
cies. “Larger species may be con-
taminants or aggregates formed
during the purification or for-
mulation of the VLP. Researchers
are very concerned about these
aggregate species and want to find
the formulation that minimizes
their appearance and promotes
the overall stability of the VLP,”
Kenrick says.
“Non-invasive and label-free
analytical techniques are highly
preferable in order to minimize
the disturbances/stresses induced
on the particles by sample prep-
aration and analysis,” observes
Zhang. The best methods are
also suitable for routine analysis
of virus particles and VLPs for
quality control (QC) purposes at
various stages of the manufactur-
ing process (upstream and down-
stream) and can be implemented
in flexible platforms suitable for
diverse field requirements.
NoN-DeSTRucTiVe AND fLexibLeThe non-invasive nature of DLS
enables it to be f lexibly imple-
mented either in f low-through
mode for in-line characteriza-
tion or in batch-mode for offline
analysis. “By taking advantage
of the technological advances
in lasers, photon-detectors, and
fiber optics, DLS analyses can be
performed even with a hand-held
device, a versatile measurement
format for monitoring manufac-
turing processes and performing
product quality control analyses,”
says Zhang.
In addition, DLS measurements
are rapid—typically requir ing
less than 30 seconds—which
allows researchers to measure
the effects of a large number of
formulat ion, processing, and
environmental condit ions on
the size, conformation, and sta-
bility of VLPs quickly and effi-
ciently, according to Kenrick. In
particular, she notes that with
a plate-based DLS instrument,
all of these conditions may be
arrayed in a 96-, 384-, or 1536-
well plate and scanned in a sin-
gle, automated experiment. The
amount of sample needed for a
typical DLS analysis is also quite
small, 20–50 µL for typical 384-
well plates or as low as 1 µL for
cuvette-based instruments.
uSefuL iNfoRmATioN“DLS is appealing as an analyti-
cal technique because it covers a
very wide range of particle sizes in
a single measurement (~0.1 nm–
1 μm). In the size range of virus
and virus-like particles, DLS is
very sensitive and can detect par-
ticles at weight fractions in the
parts-per-million (ppm) range,”
Zhang comments.
DLS measures the time-depen-
dent fluctuation in scattered light
intensity caused by the Brownian
motion of particles in solution,
such as virus and virus-like par-
ticles. The pattern of fluctuations
is quantified using an autocor-
relation analysis. This autocor-
relation function is then fitted to
provide the quantitative informa-
tion on particle diffusivity (diffu-
sion coefficient).
At a sufficiently low-particle
concentration, particles diffuse
independently from each other,
and each par t ic le’s hydrody-
namic radius (Rh) can be calcu-
lated from its diffusivity using
Analytical Techniques: Dynamic Light Scattering
As a non-invasive method, dynamic light
scattering (DLS) offers many advantages
over more traditional approaches such
as microscopy, which often require
manipulations that can alter the particle.
ES684128_BP1015_047.pgs 10.02.2015 01:05 ADV blackyellowmagentacyan

48 BioPharm International www.biopharminternational.com October 2015
the Stokes−Einstein equation.
At higher part icle concentra-
tions, particle-particle interac-
tions (electrostatic, van de Waals,
hydrogen bonding, hydrophobic
forces, etc.) influence the diffu-
sion behavior of the particles.
The sum of these effects can be
determined from the concentra-
tion dependence of the particle
diffusivity and is quantified by
the diffusion interaction param-
eter kD. A positive value for k
D
reflects net repulsive interactions
between particles, which are gen-
erally favorable for a formulation,
while a negative value indicates
a net attractive force, which can
lead to aggregation.
Batch DLS can also be used
to quantify trends as a function
of time, temperature, and con-
centrat ion. Researchers of ten
quantify the thermal stability
of proteins and VLPs by measur-
ing the temperature at which
they unfold or aggregate, and
then try to identify conditions
to delay this behavior, according
to Kenrick. Through use of DLS,
these behaviors can be observed
as an overa l l si ze change, a
change in the polydispersity of
the sample, or the appearance of
a second large species.
To complement batch analysis,
DLS can also be combined with a
fractionation technique, such as
size-exclusion chromatography
or field-flow fractionation, and
multi-angle light scattering (SEC–
MALS or FFF–MALS) to provide
information about the conforma-
tion of a VLP. In this situation,
the MALS analysis can provide
the molar mass and root mean
square radius (RMS radius or Rg)
of the VLP, and DLS can simul-
taneously provide the hydrody-
namic size. The combination of
Rh and Rg can then be used to
determine the shape of the VLP
(i.e., rod-l ike, hollow sphere,
filled sphere).
muLTiPLe APPLicATioNS Because virus and VLPs are typi-
cally much larger than the rest
of the assay ingredients, it is pos-
sible through use of DLS to pick
up signals arising from very small
populations of virus and VLPs
among highly concentrated assay
ingredients, including buffer
chemicals and nutrient proteins,
according to Zhang. He notes,
however, that the diffusion char-
acteristics of virus and VLPs can
be significantly skewed and even
completely overshadowed in the
presence of a few impurities of
larger sizes.
During sample preparation,
proper care must be exercised to
remove impurities like cells/cell
fragments and dust contaminants
to perform a valid DLS assay of
virus and VLPs. Such sample prep-
aration can typically be readily
achieved with centrifugation and
filtration tools available in an ana-
lytical lab, Zhang explains.
With proper sample prepa-
ration, DLS is appropriate for
measuring the size, conforma-
tion, and thermal and colloidal
stability of purified VLPs, and
is particularly useful for qual-
ity assessment. Some examples
include the comparison of mul-
tiple lots of a VLP production,
understanding changes in size
and aggregate content after stress
testing, and ensuring a uniform
sample d ist r ibut ion pr ior to
analysis with another technique,
according to Kenrick. “DLS is
most appropriate for this type
of analysis because the measure-
ment is fast, non-destructive, and
can be multiplexed using a plate-
based instrument,” she adds.
DLS cannot, however, quan-
tify the sizes of aggregated par-
ticles with radii greater than ~5
µm; these large sizes require a
different characterization tech-
nique. DLS also cannot be used
to count particles, although com-
plementary light scattering tech-
niques, such as SEC–MALS and
FFF–MALS, can provide particle
density values.
eNhANcemeNTS iN DLSNew developments in DLS tech-
nology are expanding its applica-
bility. The availability of multiple
DLS detection angles on a single
measurement platform—forward
(~15°) and backscatter (~173°), in
addition to the standard 90°—
allows practitioners to choose
a desired detection angle with
the click of a mouse. “Enabling
e x plorat ion of t he a ng u la r
dependence of scattering from
typical Mie scatterers, such as
viruses and VLPs, makes it much
more convenient to optimize
DLS-detection conditions for tar-
geted particles,” says Zhang.
Microrheology, in which probe
particles of known sizes are used
to determine the v iscoelast ic
behavior of liquids containing
virus and virus-like particles, is
a technique now possible using
DLS. “Compared to conventional
viscometry and rheometry tech-
niques, microrheology covers a
much broader range of dynamic
frequencies/shear rates (~10-3 to
~107 s-1), and only a very small
amount of sample is needed. As
a result, microrheology enables
rheological studies on biological
samples that previously were not
possible due to the limited mate-
rial availability,” Zhang observes.
For Kenrick, the adoption of
DLS for high-throughput analysis
using plate readers is an impor-
tant development that expands
the capabilities of this method
for viruses and VLPs. The latest
device from Wyatt, for example,
can use standard 96-, 384-, or
1536-well plates, does not require
any liquid handling during the
measurement, and provides no
opportunity for cross-contami-
nation once the plate has been
Analytical Techniques: Dynamic Light Scattering
ES684126_BP1015_048.pgs 10.02.2015 01:05 ADV blackyellowmagentacyan

October 2015 www.biopharminternational.com BioPharm International 49
Contract Testing Laboratories Update
Contract testing laboratories serving the biopharmaceutical industry have reported facility and service upgrades. The following
information was reported in company news releases.
SGS Facility Achieves Biosafety Level 2 Compliance
SGS Life Science Services announced on Sept. 9, 2015 that the company’s facility in Fairfield, NJ, has been upgraded to
be Biosafety Level 2 compliant, according to the Centers for Disease Control and Prevention (CDC) guidelines. SGS reports
that the company invested in facilities and training of the laboratory staff to handle virulent organisms for the purposes of
microbiological testing, chemical and raw material testing, and stability testing of pharmaceutical materials. The facility
can support development programs in vaccines against pathogens such as poliovirus, rotavirus, influenza A, and hepatitis
A, B and C, also drugs against bacteria, which are increasingly becoming antibiotic resistant, such as methicillin-resistant
Staphylococcus aureus (MRSA), NDM-1 Escherichia coli and Clostridium difficile. SGS reports that it has seen an increase in
demand for services related to pathogens covered by the CDC guidelines, such as Legionella and Burkholderia cepacia.
ABR Launches Bovine Polyomavirus Testing Service
ABR, the services division of VMRD, announced in August 2015 the availability of a testing service that can detect the presence
of bovine polyomavirus (BPyV) in animal origin products, master virus seeds, and other sample types. The infectivity assay can
detect viable BPyV in three weeks or less, with increased specificity and sensitivity compared with other assays on the market,
without using non-infectivity assays such as PCR, according to a company press statement. ABR reports that its BPyV assay
employs proprietary testing methods and an antibody based detection strategy that results in sensitivity of 1 virion. The virus
can be detected by immunofluorescence, and cytopathic effect. ABR also offers many other virus assays, as well as testing for
mycoplasma, bacteria, fungi, and endotoxins.
Analytical Techniques: Dynamic Light Scattering
loaded into the detector. With
the capability to heat samples to
85 °C, the system also expands
the temperature range for which
VLP unfolding and aggregation
can be evaluated using DLS,
according to Kenrick. The ability
to take pictures of each well after
completion of a DLS analysis
also allows users to observe any
bubble formation or precipitation
that may have occurred during
long time-course or high-temper-
ature experiments and eliminate
those test results.
oRThogoNAL meThoDS comPLemeNT DLS The essential limitation of DLS, or
light scattering in general, is that
it does not distinguish the chem-
ical nature of the scatterers. In
addition, particle-size distribution
calculated from the measured par-
ticles diffusivity determined using
DLS ref lects only a scattering
intensity-weighted ensemble aver-
age over particles in the detection
volume of a DLS measurement,
according to Zhang. “From time
to time, these limitations pres-
ent challenges in terms of the
interpretation of DLS results.
Therefore, cross-validation of DLS
assays is strongly recommended
using analytical techniques that
are orthogonal to DLS, such as
spect roscopy, microscopy, or
chromatography,” he comments.
Kenrick agrees that DLS alone
is not sufficient to quantify the
range of si zes and molecular
weights present in a VLP solu-
tion. For example, the presence
of doublets and t r iplets w i l l
increase the average radius mea-
sured by batch DLS, but these
aggregates will not be resolved
as sepa rate populat ions . For
this type of analysis, a fraction-
at ion technique, such as SEC
or FFF, is required to separate
the different sizes and quantify
them indiv idually. This sepa-
ration process is then coupled
with MALS to prov ide molar
mass, root-mean-square radius,
and particle-number density, as
applicable, in addit ion to the
hydrodynamic size from DLS.
“For these analyses, we recom-
mend that DLS detection occur
in the same measurement volume
as the MALS detection so that the
sample is not diluted by travel-
ing from one detector to another,
which can lead to broadening of
eluting peaks,” Kenrick notes.
“Dilution can break up revers-
ible associations, so by avoiding
dilution, researchers ensure that
the size they obtain using DLS
corresponds to the exact spe-
cies for which they determined
the molar mass and size using
MALS,” she adds. Limiting the
dilution effect is also crucial for
ensuring an adequate DLS signal
during an SEC or FFF separation
because DLS is generally less sen-
sitive than MALS. ◆
ES684127_BP1015_049.pgs 10.02.2015 01:05 ADV blackyellowmagentacyan

50 BioPharm International www.biopharminternational.com October 2015
Sh
i Z
he
ng
/ e
ye
em
/ge
tt
y im
ag
eS
Many pharmaceutical manu-
facturers consider China as
one of the most important
strategic markets for future
growth. It’s the second largest market in
the world after the United States. More
importantly, China currently accounts for
less than 3% of global revenue for most
major pharmaceutical companies, leav-
ing significant opportunity for expansion
and growth (1). China is more willing to
support biomedical research than other
countries, and its healthcare system is
characterized by expanding coverage and
access, as well as a higher prevalence of
chronic disease. China’s emergence as a
significant commercial market coincides
with changes in the global landscape that
are forcing manufacturers to re-evaluate
their overall business model.
Manufacturers, however, have struggled
to realize this market’s true potential to
date, because China’s market is highly
complex and fragmented. Multiple, con-
flicting regulations concerning market
approval requirements, market access/drug
procurement, and pricing have under-
mined the growth opportunity China
presents.
In recent years, the Chinese govern-
ment has been focused on simultaneously
improving the quality of healthcare, relax-
ing certain regulatory policies, and allow-
ing market forces to drive healthcare and
pricing reform. This article presents an
overview of some of these recent market
dynamics and discusses their potential
impact on global pharmaceutical man-
ufacturers, exploring new and existing
opportunities for growth in China.
CHINA’S HEALTH AND PHARMACEUTICAL MARKET OVERVIEWBy the turn of the century, Chinese
citizens had become increasingly dis-
satisfied with a healthcare system that
Market Access in ChinaMichael J. Kuchenreuther
China’s emergence as
a significant commercial
market is forcing
manufacturers to re-evaluate
their overall business model.
Michael J. Kuchenreuther, PhD, is a
research analyst for Numerof & Associates.
Global Biopharma Markets
ES683165_BP1015_050.pgs 10.01.2015 20:36 ADV blackyellowmagentacyan

October 2015 www.biopharminternational.com BioPharm International 51
suffered from chronic govern-
ment underfunding, urban and
rural inequalities, and overpriced,
low-quality products and services.
Much of the population was with-
out access to medical care (2).
Spurred by these social and eco-
nomic challenges, China began
planning for healthcare reform.
Plans for reform have largely
focused on healthcare coverage,
access, and pharmaceutical expen-
diture (Table I).
Due in part to these reform
efforts, China’s healthcare mar-
ket is seeing strong growth as
health spending continues to
advance. With rising per capita
incomes, China’s increasingly
affluent consumers are demand-
ing the latest in medical treat-
ment and services (5). At the
same time, changing diets and an
ageing population are increasing
the incidence of cancer, heart,
diabetes and other chronic dis-
eases. For instance, according to
the World Health Organization
(WHO), there are an estimated
3.07 million new cancer cases
annually in China—21.8% of the
global total (6). WHO also esti-
mates that approximately 230
million and 114 million Chinese
currently suffer from cardiovas-
cular disease and diabetes, respec-
tively (7, 8).
Against this backdrop, it’s not
surprising that the Chinese gov-
ernment expects healthcare spend-
ing to surpass $1.3 trillion by the
end of this decade (9). The afore-
mentioned market dynamics—the
emergence of China’s middle class,
increased coverage and access, and
the chronic disease burden of the
country’s rapidly aging workforce—
clearly create significant opportuni-
ties for pharmaceutical and medical
device manufacturers. In fact,
China, already the world’s second
largest pharmaceutical market, is
projected to reach spending levels
of $155–185 billion by 2018 (10).
In addition to opportunities
for increasing product sales, the
recent growth and future pros-
pects of China’s healthcare market
have also attracted infrastructure
investment from major multina-
tional pharmaceutical companies.
More than half of the top 20
global pharmaceutical firms have
built R&D facilit ies in China
and, together with smaller firms,
are taking advantage of China’s
sizeable skilled workforce (4).
Manufacturers’ interest in making
these infrastructure investments is
spurred by the country’s require-
ment for at least some domes-
tic clinical testing before drug
approval, as well as China’s will-
ingness to invest in life and medi-
cal sciences research. China is
currently the world’s second-high-
est investor in R&D and is poised
to overtake the US in R&D spend-
ing by 2023 (11).
While pharmaceutical and bio-
tech companies continue to view
China as an attractive market,
regulatory issues and other hur-
dles continue to serve as obsta-
cles. China offers poor intellectual
property (IP) protection, and the
drug application timeline is the
longest of all Asian countries.
Consequently, innovation contin-
ues to stagger in China compared
to other parts of the world, and
more than 80% of the market is
comprised of generic drugs (12).
There are also a number of chal-
lenges to setting up clinical trials
and performing biopharmaceuti-
cal development, including lan-
guage and cultural barriers as well
as infrastructure, regulatory, and
quality issues.
KEY TRENDS AND DEVELOPMENTSRegulatory Approval
Gaining regulatory approval has
been and continues to repre-
sent a significant roadblock for
manufacturers trying to bring
a new drug to the Chinese mar-
ket, particularly multinational
companies. The China Food and
Drug Administ rat ion (CFDA)
has been conservative, slow, and
extremely r isk averse, causing
the waiting list for approvals to
exceed more than 18,500 drugs
at the end of 2014 (13). For an
imported new drug, it generally
takes two to three years or more
for approval (14).
At the same time, quality and
integrity have come under the
microscope in China amid recent
allegations of bribery and cor-
ruption, as well as a number
of reported cases where imple-
menters of clinical trials have
manipulated results. Against this
backdrop, the CFDA finds itself
in a delicate position of look-
ing for ways to expedite drug
approval processes while simulta-
neously upholding quality in the
Global Biopharma Markets
Focus Impact
Broadening basic healthcare coverageBy 2013, basic insurance programs covered
more than 95% of the population (3).
Providing urban and rural populations
with equal access to basic public
healthcare services
Increased subsidies taken together with a
system of price controls on doctor visits,
surgery, and other procedures have widened
access to basic care for rural and urban
populations alike (4).
Improving the quality, accessibility, and
regulation of pharmaceuticals
Interventions have sought to cut
pharmaceutical prices for consumers, either
through government subsidies or regionally
fxed drug prices that target common
infectious and chronic diseases (4).
Table I: China’s plans for healthcare reform.
ES683173_BP1015_051.pgs 10.01.2015 20:36 ADV blackyellowmagentacyan

52 BioPharm International www.biopharminternational.com October 2015
application process, implementa-
tion, and scrutiny of clinical trials.
On one hand, China recently
vowed to slash its approval backlog
for foreign drugs within the next
two to three years (15). China’s
efforts will reportedly include the
increased use of clinical trial waiv-
ers under certain conditions, out-
sourcing some of its approvals, and
eliminating the time spent by gov-
ernment officials in dealing with
the intermediaries manufacturers
often hire to take their products
through the approval process (16).
One the other hand, in 2015
the CFDA issued guidance on
international multi-center clini-
cal trials that adds new levels of
regulation and could significantly
lengthen manufacturers’ road to
market approval. According to the
guidance, international multi-
center clinical trial data used for
the application of drug registra-
tion must be derived from two
countries, including China (17).
Because these regulations are
rather new, manufacturers are still
trying to figure out how to inter-
pret them and what changes need
to be made to address them. At
the same time, the impact of these
regulations on the overall attrac-
tiveness of the Chinese market
still remains to be seen.
Drug Pricing
In China, branded pharmaceu-
t ica ls and gener ics that earn
placement on t he Nat iona l
R e i m b u r s e m e n t D r u g L i s t
(NRDL) are partially (10%–90%)
or fully reimbursed. Since 2000,
China’s National Development
and Reform Commission (NDRC)
has played a key role in pricing
drugs on the NRDL by setting
price caps based on the manu-
facturer-reported costs of pro-
duction. This system, however,
gradually created concerns that
focusing purely on price would
sacrifice drug safety and qual-
ity, as well as provide opportuni-
ties for manufacturers to inflate
costs to obtain a higher price. At
the same time, pricing restric-
tions squeezed certain drugs out
of the market as manufacturers
stopped production over prof-
itability concerns (18). In the
end, this system failed to achieve
the intended reduction in drug
prices.
Recognizing that a government-
controlled pricing system was not
working, the NDRC announced
that price caps for all drugs aside
from anesthetics and grade-one
psychiatric medications would be
removed (19). While at first glance
this new policy may appear to ben-
efit manufacturers, pricing pres-
sures remain.
Drugs that receive regula-
tory approval in China must be
purchased on a provincial pro-
curement platform through a com-
petitive bidding process before
they can be used in hospitals. Until
recently, bidding systems at the
provincial level placed imported
branded drugs in a separate group
where they didn’t compete directly
with low-cost local alternatives.
Under the new system, these pre-
mium products must now com-
pete with Chinese generic drugs.
In fact, foreign manufacturers
dropped out of approximately 61%
of bids in the wealthy eastern prov-
ince of Zhejiang in 2015 and thus
won’t be able to sell their products
to public hospitals (20).
In addition to facing more
stringent drug procurement pro-
cesses, manufacturers will also
need to prepare for greater trans-
parency and scrutiny from the
government regarding pricing
activities. Specifically, pharma-
ceutical manufacturers will be
required to provide information on
drug production and distribution
costs. Also, the NDRC will launch a
six-month campaign against price-
related violations such as excessive
pricing, price fraud, and collusion
to manipulate market prices (21).
Online Pharmaceutical Sales
Drug sales to hospitals currently
make up approx imately 75%
of the Chinese pharmaceutical
market (22). Some of the market
access challenges manufacturers
may encounter due to more heav-
ily scrutinized procurement and
competitive bidding procedures,
however, could be partially offset
by the government’s recent deci-
sion to lift bans on online pre-
scription drug sales. The country
continues to wait for the CFDA
to draw up regulations that are
expected to be robust at first, in
light of growing concerns over
quality, safety, and corruption
(e.g., counterfeit drugs). While
manufacturers may have to wait
some time before the true impact
of this policy change on market
penetration and pharmaceutical
sales can be realized, even open-
ing a slice of the huge prescrip-
tion drugs market could be a big
boost to the industry.
IMPLICATIONS FOR MANUFACTURERSChina’s government has verbal-
ized a commitment to making
its regulatory landscape for new
and innovative pharmaceuticals
more stable, predictable, and
efficient (23). It has also taken
multiple steps to create a more
ma rket- d r iven pha r maceut i -
cal industry, particularly with
respect to pricing and access.
Concurrently, China’s economy
continues to develop at an unpar-
alleled pace. The country is more
focused on genuine innovation
than ever before, and its health-
care landscape is characterized
by an aging populat ion with
greater access to providers and
medicines. While manufacturers
across the globe cannot discount
the aforementioned challenges
Global Biopharma Markets
ES683167_BP1015_052.pgs 10.01.2015 20:36 ADV blackyellowmagentacyan

October 2015 www.biopharminternational.com BioPharm International 53
Global Biopharma Markets
and should ant ic ipate pol icy
changes to take some time, there
are plenty of reasons why these
organizations should be bullish
on China’s potential for provid-
ing future growth and expansion
opportunities.
The dynamic nature of global
markets continues to apply sig-
nif icant pressure on manufac-
turers’ business models, f rom
product design and drug devel-
opment through commercial-
ization. China is no exception.
To maintain competit iveness,
manufacturers are encouraged
to develop an accurate and up-
to-date understanding of the
Chinese regulatory framework
and an adaptive market access
strategy.
Unti l there is more clar ity
around how the CFDA will reduce
the length of the drug approval
process and until these policy
changes are fully implemented,
mult inat ional manufacturers
looking to launch drugs already
marketed in other countries will
likely continue to face delays.
By expanding their presence in
China, either through partner-
ships with domestic companies or
infrastructure investments, manu-
facturers may be able to reduce
the extent of these delays. In fact,
leading manufacturers such as
Eli Lilly and Novartis are already
shif t ing f rom late-stage drug
development and R&D outsourc-
ing to building facilities that will
house more fully integrated R&D
capabilities (1).
China’s domestic pharmaceuti-
cal industry has been dominated
by generic-drug manufacturers
that have not heavily invested in
R&D or manufacturing excellence.
Global manufacturers remain
well positioned to leverage qual-
ity and innovation as competi-
tive advantages. Lilly is among
the pharmaceutical companies to
have capitalized on this by forg-
ing a strategic partnership with
a domestic pharmaceutical com-
pany to create a platform for Lilly-
branded generic medicines (24).
REFERENCES1. S. Grimes and M. Miozzo, Big
Pharma’s Internationalization of
R&D to China (Routledge, Taylor &
Francis Group, 2015, www.finfacts.
ie/biz10/Big_Pharma_R&D_china.
pdf , accessed July 13, 2015.
2. C. Kahler, China Business Review (Jan.
1, 2011), www.chinabusinessreview.
com/chinas-healthcare-reform-how-far-
has-it-come/, accessed July 13, 2015.
3. T-M Chen, Health Affairs (Millwood,
2012);31:2536-2544.
4. A. Daemmrich and A. Mohanty,
Journal of Pharmaceutical Policy
and Practice 7:9 (2014).
5. J. Perkowski, Forbes (November
12, 2014), www.forbes.com/sites/
jackperkowski/2014/11/12/health-
care-a-trillion-dollar-industry-in-the-
making/, accessed July 13, 2015
6. International Agency for Research on
Cancer, World Cancer Report 2014.
7. World Health Organization
Representative Office—China,
Cardiovascular diseases
factsheet,www.wpro.who.int/china/
mediacentre/factsheets/cvd/
en/, accessed July 13, 2015
8. Y. Xu et al., JAMA. 2013;310(9):948-
959. doi:10.1001/jama.2013.168118.
9. China-Britain Business Council,
Healthcare & Life Sciences, www.
cbbc.org/sectors/life-science-
healthcare/#sthash.P9eEBpRH.
dpuf, accessed July 13, 2015
10. IMS Institute for Healthcare Informatics,
Global Outlook for Medicines Through
2018, November 2014. http://
static.correofarmaceutico.com/
docs/2014/12/01/informe_ims.
pdf, accessed July 13, 2015
11. Council on Foreign Relations, Chinese
Pharma: A Global Health Game
Changer?, March 31, 2015 www.cfr.
org/china/chinese-pharma-global-
health-game-changer/p36365.
12. Forbes, Betting On China For
New Drug Development, April 29,
2015 www.forbes.com/sites/
medidata/2015/04/29/betting-on-
china-for-new-drug-development/
13. Reuters, China drug approval
backlog jumped by a third last
year, March 13, 2015.www.
reuters.com/article/2015/03/13/
us-china-pharmaceuticals-
idUSKBN0M90QP20150313,
accessed July 13, 2015
14. Bloomberg, Foreign Drug Companies
in China See Approval Delays, Dec.
7, 2014, www.bloomberg.com/news/
articles/2014-12-07/foreign-drug-
companies-in-china-see-approval-
delays, accessed July 13, 2015
15. US Department of Commerce,
Fact Sheet: 25th U.S.-China Joint
Commission on Commerce and Trade,
Dec. 19, 2014, www.commerce.
gov/news/fact-sheets/2014/12/
fact-sheet-25th-us-china-joint-
commission-commerce-and-trade,
accessed July 13, 2015
16. E.J. Lane, FiercePharmaAsia
(April 26, 2015).
17. NP Taylor, “Asia Regulatory Roundup:
Clinical Trials in Focus in China,
India,” RAPS.org, Dec. 2, 2014,
www.raps.org/Regulatory-Focus/
News/2014/12/02/20867/
Asia-Regulatory-Roundup-Clinical-
Trials-in-Focus-in-China-India--2-
December-2014/#sthash.ATGYke6e.
dpuf, accessed July 13, 2015
18. L. Burkitt, “Scraps Price Caps on Low-
Cost Drugs,” Wall Street Journal, May 8,
2014, www.wsj.com/articles/SB1000
1424052702304655304579548933
340544044, accessed July 13, 2015
19. Jing Li, “China scraps price caps for
most drugs,” South China Morning
Post, May 5, 2015, www.scmp.
com/news/china/policies-politics/
article/1786573/china-stop-
setting-prices-most-medicines-
june-1, accessed July 13, 2015
20. Bloomberg, “Foreign Drugmakers Face
Pressure to Lower Prices in China,”
May 25, 2015, www.bloomberg.
com/news/articles/2015-05-25/
foreign-drugmakers-face-more-
pressure-to-lower-prices-in-china,
accessed July 13, 2015.
21. S. Wong and D. Pountney, “China
amends the Drug Administration Law
and removes price caps for most
pharmaceutical products,” Bird &
Bird, May 15, 2015, www.twobirds.
com/en/news/articles/2015/
china/china-amends-the-drug-
administration-law-and-removes-
price-caps-for-most-pharmaceutical-
products, accessed July 13, 2015.
22. Bloomberg, “China Web Pharmacies
Would Have Alibaba Vying With
Legacy Firms,” March 29, 2015,
www.bloomberg.com/news/
articles/2015-03-29/china-
web-pharmacies-would-have-
alibaba-vying-with-legacy-firms,
accessed July 13, 2015.
23. Asia-Pacific Council of American
Chambers of Commerce, 2014
Annual Report, June 2014, http://
apcac.org/wp-content/themes/
apcac/images/APCAC%20
2014%20Annual%20Report.pdf
24. Eli Lilly and Company, Lilly Expands
Strategic Partnership with Chinese
Manufacturer Novast to Serve Chinese
Patients with High-Quality Branded
Generic Medicines, Press Release, June
12, 2012, https://investor.lilly.com/
releasedetail.cfm?releaseid=682259,
accessed July 13, 2015. ♦
ES683157_BP1015_053.pgs 10.01.2015 20:35 ADV blackyellowmagentacyan

54 BioPharm International www.biopharminternational.com October 2015
Analytical Best Practices
iMA
ge
: p
As
ieK
A/s
Cie
NC
e p
ho
to
lib
rA
ry
/ge
tt
y.
Small-Scale and At-Scale Model Development and OptimizationAn approach to small-model generation and calibrating small-scale models to reliably predict performance at scale is presented.
During development, there is a need to
characterize and optimize processes.
In vaccines and biologics develop-
ment, there are often scale and system differ-
ences between shaker flasks, 0.5 L, 2 L, 5 L, 10
L, 200 L, and 2000 L environments. Often the
difference in scale makes scale up and predic-
tion uniquely challenging. This article pres-
ents an approach to small-model generation
and how to calibrate the small-scale models
to reliably predict performance at scale. This
assumes that the small-scale model develop-
ment has been scientifically and thoughtfully
designed to represent as many of the func-
tions and environments that will be present
at scale. No amount of secondary model tun-
ing and correction will make up for a failure
to select and reasonably range the parameters
and build a good model of the process at
small scale.
SmAll-ScAle develoPment And StrAtegYFor most product development, characteriza-
tion, and control strategies, there is a need
to develop small-scale and at-scale process
models to aid in product knowledge and pro-
mote process understanding, prediction, and
control.
Advantages of developing small-scale models
include:
• Materialsuseandavailability
• Equipmentavailability
•Costofdevelopment
•Timetodevelopmentsolution
•Ability to generate product and
process models at both scales
•Facilitiesavailability
•Efficientlyexplorecontrolstrate-
gies
•Experimentalstrategy.
Problems with small-scale models include:
• Theymaynotberepresentativeoftheprod-
uct or process at scale.
• Theymaynotaccuratelyrepresentthemean
response at scale.
• Theymaynotaccuratelyrepresentthevaria-
tion at scale.
• Theymay not accurately represent out-of-
specification (OOS) and failure rates/modes.
Regulatory guidance documents provide the
following comments on process development
requirements:
• InternationalConferenceonHarmonization
(ICH) Q8 Pharmaceutical Development (1)
states, “an assessment of the ability of the
process to reliably produce a product of
the intended quality (e.g., the performance
of the manufacturing process under dif-
ferent operating conditions, at different
scales, or with different equipment) can be
provided.”
no amount of secondary
model tuning and correc-
tion will make up for a fail-
ure to select and reasonably
range the parameters and
build a good model of the
process at small scale.
Thomas A. Little is president
of Thomas A. Little Consulting,
12401 N Wildflower Lane
Highland, UT 84003,
tel. 1.925.285.1847,
www.qualitybydesginconsulting.com.
ES684874_BP1015_054.pgs 10.05.2015 21:34 ADV blackyellowmagentacyan

October 2015 www.biopharminternational.com BioPharm International 55
Analytical Best PracticesA
ll f
igu
re
s A
re
su
pp
lie
d b
y t
he
Au
th
or
.
• ICH Q11 Development and
Manufacture of Drug Substance (2)
states, “small-scale models can
be developed and used to sup-
port process development stud-
ies. The development of a model
should account for scale effects
and be representative of the pro-
posed commercial process. A sci-
entifically justified model can
enable a prediction of product
quality, and can be used to sup-
porttheextrapolationofoperat-
ing conditions across multiple
scales and equipment.”
• ICHQ9Quality Risk Management
(3) states the following regard-
ing development and scale up:
“To establish appropriate specifi-
cations, identify critical process
parameters, and establish man-
ufacturing controls (e.g., using
information from pharmaceuti-
cal development studies regard-
ing the clinical significance of
quality attributes and the ability
to control them during process-
ing) … To assess the need for
additional studies (e.g., bioequiv-
Figure 1: Whole model for the
small-scale purifcation experiment.
Actual by predicted plot
105
100
95
90
85
80
75
70
65
6060 65
Step Yield (%) Predicted P<.0001
Step
Yie
ld (
%)
Act
ual
RSq=0.94 RM SE=2.4165
Summary of Fit
RSquare
RSquare Adj
Root Mean Square Error
Mean od Response
Observations (or Sum Wgts)
0.944297
0.934609
2.416482
89.02143
23
Analysis of Variance
Source
Model
Error
C. Total
4
23
27
2276.7813
134.3058
2411.0871
569.195
5.839
97.4752
Prob > F
<.0001*
DF
Sum of
Squares Mean Square F Ratio
70 75 80 85 90 95 100
Figure 2: scaled estimates or half effect of the factors in the small-scale
Scaled Estimates
Continuous factor centered by mean, scaled
by range/2
Term
Intercept
Protein Load (g/L)
Buffer Molarity (mM)
(Protein Load (g/L)-19.9321)*(Buffer Molarity (mM)-137)
(Buffer Molarity (mM)-137)*(Buffer Molarity (mM)-137)
91.501094
-5.169513
-8.939059
-5.251956
-4.315967
0.697668
0.584057
0.604199
0.65481
0.923021
131.15
-8.85
-14.79
-8.02
-4.68
<.0001*
<.0001*
<.0001*
<.0001*
0.0001*
Std Error tRatio Prob>|t|Scaled
Estimate
Figure 4: simulation of full-scale results using the small-scale model.
Prediction profler
120
110
100
90
80
70
60
Defect
Step yield (%) 0
Protein
load(g/L)Random
Normal
Mean
SD
Mean
SD
136
2.65
17
1.94
Simulator
Responses
Step yield (%)
Step yield (%) 61 110
N Runs 5000
Spec limits
Response LSL USL
Add random no Std Dev: 2.4164817
Normal
Random
Buffermolarity (mM)
0 94.4908 3.31803
Rate PPM Mean SD
10
15
20
25
Ste
p y
ield
(%
)
130
135
140
145
94.84223
[93.2839,
96.4006]
17 136
A low-level risk
assessment and
experimental design
should be generated
and the process model
generated and saved.
Figure 3: small-scale model equation for step yield in titer.
245.973340434413
+ -0.9231273167598 * Protein load (g/L)
+ -0.9932287691945 * Buffer molarity (mM)
+ [ Protein load (g/L) - 19.9321428571429] * [[Buffer molarity (mM) - 137] * -0.1042054835185]
+ [Buffer molarity (mM) - 137] * [[Buffer molarity (mM) - 137] * -0.053283548078]
ES684873_BP1015_055.pgs 10.05.2015 21:34 ADV blackyellowmagentacyan

56 BioPharm International www.biopharminternational.com October 2015
Analytical Best Practices
alence, stability) relating to scale up and technology
transfer.”
•FDA’sprocessvalidationguidance (4)states,“before
any batch from the process is commercially dis-
tributed for use by consumers, a manufacturer
should have gained a high degree of assurance
in the performance of the manufacturing process
such that it will consistently produce APIs and
drug products meeting those attributes relating
to identity, strength, quality, purity, and potency.
The assurance should be obtained from objective
information and data from laboratory-, pilot-, and/
or commercial-scale studies. Information and data
should demonstrate that the commercial manufac-
turing process is capable of consistently producing
acceptable quality products within commercial
manufacturing conditions.”
SmAll-ScAle model develoPment And deSign of exPerimentSSmall-scale experimentalmodelsmust be first gener-
ated.Careneeds to bemade that operational ranges
represent conditions that occur in the full-scale pro-
cess. For example, fill timesmaybe 20minutes in a
small-scale process; however, in the full-scale process,
it may take two hours. Small-scale models should be
generated to represent conditions at scale as much as
is practicable.
Alow-levelriskassessmentandexperimentaldesign
should be generated and the process model generated
andsaved.Thefollowingpurificationprocessexample
is presented.
Two significant factors are influencing the step
yield: protein load on the column and wash molarity.
Themodelexplainsmorethan94.4%ofthevariation
(R2) in titer step yield. The following are the steps in
generating the small-scale model:
1. Low level risk assessment
2.Designofexperiment
3.Model refinement for significant factors (Figure 1
and Figure 2)
4.Savetheformula(transferfunction)(Figure 3)
5. Simulate the process set point at scale (model, varia-
tion at set point, noise) (Figure 4)
6.DeterminethevariationinXatscale
7.Add the rootmean squared error (RMSE) into the
noise for the simulation
8. Simulate process conditions to predict themean
and standard deviation at scale.
gmP or engineering Production runS At ScAleAt somepoint in thedevelopment, full-scaleGMPor
engineering runswill be performed.Care needs to
be taken to record all of the run conditions that were
present in the small-scale model. Using the equation
fromthesmall-scaleexperiment,plug inthefull-scale
measures into the small-scale model and compare them
to the full-scale results. Notice the means and standard
deviations are not well matched (calibrated) to the full-
scale results. The difference in means and standard
deviations (Figure 5) indicates some scale effects, and
the small-scale model needs to be calibrated to predict
the step yield titer more reliably at scale.
Figure 5: small-scale and full-scale results.
Predicted step yield from small scale
Step yield from at scale
Summary statistics
Mean
Std Dev
Std Err mean
Upper 95% mean
Lower 95% mean
N
94.409511
1.6001009
0.3079396
95.04249
93.776533
27
90 91 92 93 94 95 96 97 98
54321
Count
70 75 80 85 90 95 100
8642
Count
Summary statistics
Mean
Std Dev
Std Err mean
Upper 95% mean
Lower 95% mean
N
86.296296
5.9018564
1.1358128
88.630993
83.9616
27
Figure 6: full-scale and small-scale model calibration
using orthogonal regression.
Bivariate ft of step yield by predicted step yield from small scale
100
95
90
85
80
75
7090
Ste
p y
ield
91 92 93 94 95 96 97 98Predicted step yield from small scale
Orthogonal ft ratio=13.60
Orthogonal ft ratio=13.60
Variable
Predicated step yield from small scale
step yield
Intercept
-261.926 3.688428 2.351414 5.785667 0.05000
94.40951
86.2963
1.600101
5.901856
13.6045 0.6985
Slope LowerCL UpperCL Alpha
Mean Std Dev CorrelationVariance
Ratio
ES684875_BP1015_056.pgs 10.05.2015 21:34 ADV blackyellowmagentacyan

October 2015 www.biopharminternational.com BioPharm International 57
Analytical Best Practices
SmAll-ScAle model cAliBrAtionGenerally, regression is used to determine how to cali-
brate the model. When calibrating the small-scale model
to the full scale, the Y response is the full-scale mea-
surements,andtheXfactoristhepredictedsmall-scale
model results (see Figure 6). An orthogonal principle
components fit was used in fitting the line. The intercept
corrects for the mean, and slope corrects for the standard
deviation. Linear regression using a least-squares error
method of line calculation is used when the correlation
ishigh(70%+R2); however, when the correlation is poor,
an orthogonal method of regression is typically more
reliable.Ifaleast-squareslinewereusedinthisexample,
it would not correctly calibrate the small-scale model.
Other regression fits are possible to calibrate a small-scale
model; however, it is beyond the scope of this paper.
Figure 7: full-scale calibrated model.
-261.92636066547 + 3.68842769808727*
245.973340434413
+ -0.9231273167598 * Protein load (g/L)
+ -0.9932287691945 * Wash molarity
+ [ Protein load (g/L) - 19.9321428571429 ] * [[Wash molarity - 137] * -0.1042054835185]
+ [ Wash molarity - 137 ] * [[Wash molarity - 137] * -0.053283548078]
Figure 8: Calibrated full-scale model and actual measurement data.
Step yield actual at scale
Calibrated small scale model
70 75 80 85 90 95 100
8642
70
Count
Count
75 80 85 90 95 100
8642
Quantiles
100.0%
99.5%
97.5%
90.0%
75.0%
50.0%
25.0%
10.0%
2.5%
0.5%
0.0%
Mean
Std Dev
Std Err mean
Upper 95% mean
Lower 95% mean
N
Mean
Std Dev
Std Err mean
Upper 95% mean
Lower 95% mean
N
86.296296
5.9018564
1.1358128
88.630993
83.9616
27
96
96
96
94.2
90
86
84
77.6
71
71
71
95.7670912
95.7670912
95.7670912
93.196448599
90.686317151
87.892364112
82.146635662
78.670459395
71.346160717
71.346160717
71.346160717
86.296296
5.9018564
1.1358128
88.630993
83.9616
27
maximum
minimum
minimum
quartile
median
quartile
100.0%
99.5%
97.5%
90.0%
75.0%
50.0%
25.0%
10.0%
2.5%
0.5%
0.0%
maximum
quartile
median
quartile
Summary statistics
Quantiles Summary statistics
ES684877_BP1015_057.pgs 10.05.2015 21:34 ADV blackyellowmagentacyan
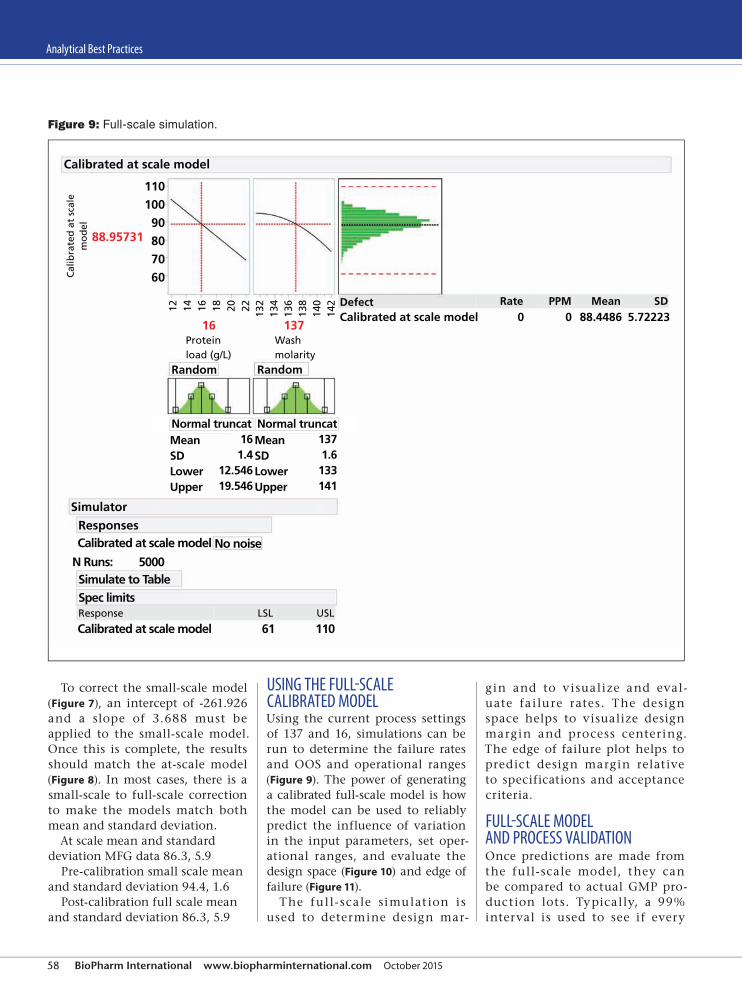
58 BioPharm International www.biopharminternational.com October 2015
Analytical Best Practices
To correct the small-scale model
(Figure 7), an intercept of -261.926
and a slope of 3.688 must be
applied to the small-scale model.
Once this is complete, the results
should match the at-scale model
(Figure 8). In most cases, there is a
small-scale to full-scale correction
to make the models match both
mean and standard deviation.
At scale mean and standard
deviationMFGdata86.3,5.9
Pre-calibration small scale mean
andstandarddeviation94.4,1.6
Post-calibration full scale mean
andstandarddeviation86.3,5.9
uSing the full-ScAle cAliBrAted modelUsing the current process settings
of 137 and 16, simulations can be
run to determine the failure rates
and OOS and operational ranges
(Figure 9). The power of generating
a calibrated full-scale model is how
the model can be used to reliably
predict the influence of variation
in the input parameters, set oper-
ational ranges, and evaluate the
design space (Figure 10) and edge of
failure (Figure 11).
The ful l-scale simulat ion is
used to determine design mar-
gin and to visualize and eval-
uate fa i lure rates. The design
space helps to visualize design
margin and process centering.
The edge of failure plot helps to
predict design margin relative
to specifications and acceptance
criteria.
full-ScAle model And ProceSS vAlidAtionOnce predictions are made from
the full-scale model, they can
be compared to actualGMPpro-
duction lots. Typically, a 99%
interval is used to see if every
Figure 9: full-scale simulation.
Calibrated at scale model
Simulator
Simulate to Table
Spec limits
Responses
Calibrated at scale model
Calibrated at scale model 61 110
N Runs: 5000
No noise
Defect
Random
Mean
SD
Lower
Upper
Mean
SD
Lower
Upper
137
1.6
133
141
16
1.4
12.546
19.546
Random
Calibrated at scale model 0 0 88.4486 5.72223
Rate PPM Mean SD
110
100
90
80
70
60Calib
rate
d a
t sc
ale
mo
del
12
14
16
18
20
22
Protein
load (g/L)
Response LSL USL
Wash
molarity
132
134
136
138
140
142
88.95731
16 137
Normal truncat Normal truncat
ES684872_BP1015_058.pgs 10.05.2015 21:34 ADV blackyellowmagentacyan

October 2015 www.biopharminternational.com BioPharm International 59
Analytical Best Practices
batch i s fa l l ing w it h in t he
full-model predictions. If so, it
indicates the validity of the full-
scale model. Model simulation
and scale-up results should be
part of the development report
and Stage I process validation
reports.
concluSionModel deve lopment at va r i -
ous scale and variation under-
standing and modeling is a core
component of modern drug devel-
opment. It is a required element
of Stage I validation and increases
product and process knowledge
and reduces risk. Generating reli-
able small-scale models and cali-
brating the models to full-scale
results are essential steps in gener-
ating process understanding and
communicating that understand-
ing to development and GMP
team members. Using a valid
and well-defined process model
to simulate, predict, and control
drug substance and drug product
is core to every drug development
team globally.
Learning how to reliably predict
performance at multiple scales is
anessentialskillforallCMCteam
members. Failure to build reliable
process models will likely gener-
ate higher variation and is likely
to result in OOS measures and lot
failures.
referenceS 1. ICH, Q8(R2) Pharmaceutical
Development (IHC, 2009).
2. ICH, Q11 Development and
Manufacture of Drug Substance (ICH,
2011).
3. ICH, Q9 Quality Risk Management
(ICH, 2006).
4. FDA, Guidance for Industry, Process
Validation: General Principles and
Practices (FDA, 2011). ◆
Figure 10: purifcation design space from full-scale model.
146
144
142
140
138
136
134
132
7.5 10Protein load (g/L)
Wa
sh m
ola
rity
12.5 15 17.5 20 22.5 25
Figure 11: purifcation design space from full-scale model.
Edge of failure analysis
11010510095908580757065605550
13Protein
load (g/L)
Calib
rate
d
at
scale
mo
del
Wash
molarity
14 15 16 17 18 19 133.5 136 138 140
once predictions are
made from the full-
scale model, they can
be compared to actual
gmP production lots.
ES684876_BP1015_059.pgs 10.05.2015 21:34 ADV blackyellowmagentacyan

60 BioPharm International www.biopharminternational.com October 2015
Troubleshooting
Sv
eta
De
miD
of
f/G
et
ty
im
aG
eS
Today’s single-use technology (SUT) is
more than just bioprocess bags and the
silicone tubing to connect them. Most
companies now use SUT bags for at least one
other application, usually storage of small-
volume buffers or for in-process sampling. For
sample handling in particular, bags provide
obvious advantages over traditional sample
bottle assemblies that must be steamed in
place to obtain an aseptic sample of a cell-cul-
ture vessel. However, single use now reaches
into many more phases of the modern biolog-
ics manufacturing process. Bags are available
with internal mixing systems from several
suppliers. Disposable filter capsules contain-
ing more than 2.3 m2 of membrane area are
available. Aseptic connection devices in a
variety of sizes and shapes allow tubing con-
nections in seconds. Single-use formats are
available for many sensors, including those
that measure pH, conductivity, and dissolved
oxygen. Together, these advances in SUT have
enabled wide adoption of single-use bioreac-
tors (SUBs) across the industry. Even chroma-
tography columns up to 60 cm in diameter are
now available pre-packed and fully disposable.
The author evaluated the potential to
reduce operat ing costs by switching to
largely disposable process equipment dur-
ing the technology transfer of a commer-
cial purification manufacturing process. The
design considered replacing most of the steel
tanks, filter housings, and transfer lines with
SUT. Detailed design planning identified
more than 80 SUT components
that would be required, includ-
ing roughly a dozen static bag
designs from 1 L to 2000 L, mix-
ing systems from 100 L to 1000
L, and more than 20 separate tub-
ing assemblies, manifolds, and
hoses. To support routine operations, more
than 500 individual pieces of SUT would be
required per batch. With only 20 batches a
year, the number of SUT items that need to
move annually through procurement, ware-
housing, release, use, and disposal quickly
exceeds 10,000.
Selecting which SUT to use is only the
beginning of the implementation process.
Implementation of SUT at any stage of a com-
mercial manufacturing process requires bring-
ing the SUT components into GMP systems
as a raw material. This means generation of
new part numbers, material specification doc-
uments, manufacturing procedures, release
testing procedures, supply agreements, qual-
ity technical agreements, quality audits of
the supplier manufacturing sites, and assess-
ment of potential SUT extractables and
leachables (E/L). The E/L testing is one of
the longer duration pre-requisite activities to
GMP implementation. For process develop-
ment teams supporting post-approval pro-
cesses, the scope and duration of this work
can be easily underestimated. This workload
will grow exponentially when considering
the technology transfer of processes currently
being developed that heavily leverage SUT in
multiple steps.
Risk assessmentThe potential for polymeric components to
leach unwanted chemicals into drug products
must be evaluated (1, 2). E/L data are used
to assess potential risks to patients from the
use of SUT in manufacturing processes (3).
The scope of the assessment should include
everything from small surface area poly-
mers such as valve diaphragms to large sur-
face area materials such as chromatography
resins. A process based largely on SUT will
A Risk-Based Strategy for Implementing Disposables in a Commercial Manufacturing ProcessThe author explores a dual-supplier sourcing strategy for single-use products and its ability to mitigate business continuity risk.
Chad Atwell is associate director
of manufacturing science and
technology at Genzyme;
68 new York avenue,
Framingham, ma 01701.
ES683160_BP1015_060.pgs 10.01.2015 20:36 ADV blackyellowmagentacyan

October 2015 www.biopharminternational.com BioPharm International 61
aL
L f
iGU
Re
S a
Re
Co
UR
te
Sy
of
tH
e a
Ut
Ho
R.
have hundreds of SUT polymeric
components to be evaluated and
potentially tested for E/L. It is not
feasible to expose every process
component to every process solu-
tion to confirm chemical compat-
ibility in all situations. However,
risk assessment tools can be used
to provide thorough assessments
and pr ior it ize high-r isk com-
ponent solution combinations
to result in a reduced E/L study
scope.
The risk assessment tool used to
design the E/L studies is a three-
step process streamlined from the
numerical method described by
the Biopharmaceutical Process
Extractables Core Team in 2002 (4).
Quantitative evaluation criteria
are first defined. The capability
of extraction for each solution
and component pair is then
determined based on the crite-
ria for both ease and extent of
the extraction. Finally, the prox-
imity to final product is deter-
mined. These three steps yield
a risk action level for each SUT
component solution combina-
tion. The ratings should be agreed
upon by a cross-functional team,
including members f rom the
manufacturing users, technical
experts, and quality assurance.
Def init ions and category cr i-
teria should be defined prior to
making any rankings to ensure
a precise, unbiased, data-driven
ranking process.
T he c apab i l i t y o f e x t r ac-
tion is determined by rating the
ease and extent of the potential
extraction. The ease of extrac-
tion is rated either as difficult,
average, or easy. Use of organic
solvents or operating a material
at the extremes of the supplier-
supported chemical compatibil-
ity conditions, for example, can
be considered easy to extract,
whereas an aqueous solution used
within the component’s recom-
mended temperature range can
be considered difficult to extract.
The extent of extraction is rated
either as negligible, moderate, or
significant. For example, compo-
nents with small surface area or
short exposure duration can be
considered to have a negligible
extent of extraction; whereas
mater ial exposed to steam or
extended durations, such as liq-
uid storage bags, can be con-
sidered as having a significant
extent of extraction. The two rat-
ings are applied to the extraction
capability matrix shown in Figure 1,
to identify an extraction capability
level of L1, L2, or L3.
This “L” rating is applied to the
y-axis of the action level matrix
shown in Figure 2. The x-axis
represents the proximity to fin-
ished goods and is categorized
into three zones. Zone 1 repre-
sents materials used in a process
step such as the final drug sub-
stance filtration or formulation
step where there are no clear-
ance steps (e.g., diafiltration step,
bind and elute chromatography
step) before the finished product.
Zone 3 consists of component
solution combinations that are
substantially upstream in the pro-
cess, typically separated from the
drug substance by two or more
clearance steps before the fin-
ished product. From this second
matrix, the final risk action level
is defined. SUT component solu-
tion combinations rated as risk
action level 3—low risk—would
not require additional E/L data to
be generated. In all cases of prod-
uct contact, the materials should
be confirmed to meet the mini-
mum United States Pharmacopeial
troubleshooting
Figure 1: extraction capability risk-assessment matrix. L1 has a higher capability
of extraction than L3. the extraction capability level is applied to the proximity
risk-assessment matrix in Figure 2.
L2 L1 L1
L3 L2 L1
L3 L3 L2
Neg
lig
ible
Mo
dera
teSig
nif
can
t
Exte
nt
of
extr
act
ion
Diffcult Average
Ease of extraction
Easy
ES683155_BP1015_061.pgs 10.01.2015 20:35 ADV blackyellowmagentacyan

62 BioPharm International www.biopharminternational.com October 2015
troubleshooting
Convention (USP) class VI or
other compendial expectations
or else additional risk mitigation
steps may be appropriate. For
components rated as risk action
level 1—high r isk—E/L data
must be obtained and assessed.
E/L data may not be necessary
for materials rated as risk action
level 2—medium risk— based on
the justifications provided by the
cross-functional risk assessment
team. Many upstream compo-
nents can typically be excluded
from the E/L studies based on
low-risk action levels.
supplieR selection and dual souRcinG as Risk mitiGationA manufacturing process that
relies heavily on SUT requires the
manufacturer to depend on the
SUT suppliers. There are ways to
reduce the risks resulting from
this dependence. Supplier selec-
tions and the quality of your
supplier relationships become
crucial to ensuring consistent
supply of the manufactured drug
products. When identifying new
SUT components to implement,
leverage existing supplier rela-
tionships to expedite implemen-
tation by eliminating the need
for new quality technical agree-
ments (QTAs), supply agreements,
or supplier audits. When a new
supplier is required, the strength
of the supplier’s quality system
and their reputation in the indus-
try are as important as the tech-
nical process needs. Understand
the supplier’s validation program
and lot-release process. Define
requirements for endotoxin and
sterility assurance. Risk assess-
ment tools can also be used to
determine the level of sterility
assurance required for each com-
ponent. The impact of potential
bioburden ingress is not the same
for all process steps, so not all com-
ponents require the same level of
sterility assurance. This may repre-
sent an opportunity to reduce the
overall cost of goods (COGs).
High consumable volumes
necessitate consideration of both
capital investment and opera-
tional expenditure costs together
over a fixed period before select-
ing SUT technologies or suppli-
ers. The comparative analysis
of capital costs and operational
expenses will facilitate important
process decisions such as tech-
nology and supplier selections.
Establish business agreements
for ≥3 years to lock in important
assumptions that impact COGs at
least through the initial phases of
commercial production.
As with all raw materials, sup-
ply-chain risk can be reduced by
qualifying a secondary source for
SUT components. Occasionally,
technology selection prevents
dual sourcing. For example, sev-
eral currently available disposable
mixing systems utilize patented
mixing technologies that are
not interchangeable and require
purchase of the compatible mix-
ing bags from one supplier alone.
Many SUT components, however,
can be dual sourced.
There are essentially three ways
to implement dual sourcing for
SUT. The first is true redundancy
for 100% of the SUT compo-
nents, but this presents several
challenges. It is simple enough
to select two qualified suppliers
and approve SUT design drawings
with both. However, if the SUT
parts are considered critical pro-
cess raw materials and the fluid
handling systems are qualified
Figure 2: Proximity risk-assessment matrix. Solution component combinations
determined to be action level 1, or high risk, require extractable/leachable (e/L)
data to be generated. Combinations determined to be action level 3, or low risk,
would not need additional e/L data.
Action level2
Action level1
Action level 1
Action level3
Action level2
Action level1
Action level3
Action level3
Action level1L
3L2
L1
Ca
pa
bil
ity o
f e
xtr
act
ion
(L l
eve
l)
Diffcult Average
Proximity to fnished goods
Easy
ES683158_BP1015_062.pgs 10.01.2015 20:36 ADV blackyellowmagentacyan

October 2015 www.biopharminternational.com BioPharm International 63
troubleshooting
as part of the process validation
(PV), it may not be feasible to
validate equivalence for all SUT
components. Each SUT compo-
nent will require creation of two
material specifications, one for
each source. Enterprise inventory
management systems and quality
control material release systems
will also have to manage the two
source options for each process
component. The warehouse may
also need a strategy to segregate
the two sources and determine
when each opt ion should be
delivered to the manufacturing
floor. In general, it will be neces-
sary to generate twice the number
of GMP documents to incorporate
all of the duplicate SUT compo-
nents into GMP systems.
A second option is to identify
one supplier as primary and pur-
chase all SUT components from
that supplier for normal opera-
t ions. The secondary supplier
would only need to be engaged
in the event of a supply-chain
interruption or quality problem
with the primary supplier. This
strategy minimizes the number
of items to be incorporated into
GMP document systems. The sec-
ondary supplier, however, would
need to build and maintain the
templates and documentation
required to produce these mate-
rials without receiving a com-
mitment from the process owner
for any significant volume pur-
chases. This could lead to long
start-up times when the material
is requested. The lead time to sat-
isfy a production request when
demand is infrequent is a crucial
consideration in this case.
T he t h i r d , r e c om me nd e d
option is to make each supplier
the pr imary source for some
materials and secondary for oth-
ers. This opt ion a l lows both
suppliers to be engaged by a
constant stream of revenue and
dedicate some portion of their
manufacturing capacity to sup-
porting a process. E/L testing can
be performed on both films to
accelerate timelines. This pro-
vides an inherent alternative if
any SUT components are found
to have unacceptable leach-
able levels late in the schedule,
because it is unlikely that both
tested source materials will expe-
rience the same failure. Approve
design drawings for most com-
ponents with both suppliers for
future use. The advantage of
this option compared to 100%
redundancy is the reduced num-
ber of new GMP documents
required. Material specifications,
QC material release documents,
and inventory management sys-
tems require only single exam-
ples, not one for each supplier.
Manufacturing procedures can
also be specific to the expected
source component and will not
need to incorporate provisions
for two possible components
being used.
As part of the QTAs and busi-
ness agreements, expectations
for customer change notif ica-
tion and demonstration of com-
ponent equivalency should be
considered . A n ex t rac tables
study was performed by the SUT-
integrator ASI comparing two
platinum-cured silicone-tubing
materials with similar specif i-
cat ions. The study found the
extraction profiles were similar
enough to conclude they were
comparable w ith in the va r i -
abil ity of the analytical tech-
niques used (5). Such data could
allow the two raw materials to
be deemed interchangeable so
the SUT supplier could use either
one without notifying the end
user of a change in raw mate-
rial source. This is a shift away
from the traditional quality defi-
nition of supplier change notifi-
cation expectations, but it may
become a necessary f lexibility
as industry use of SUT increases.
Questions around dual sourcing
are being discussed by industry
groups such as the BioPhorum
Operations Group (BPOG) and
the Bio-Process Systems Alliance
(BPSA). SUT suppliers have the
same interests in dual sourcing
of raw mater ials as drug sub-
stance manufacturers, so expec-
t at ions for suppl ie r- c ha nge
notification should be contrac-
tually defined to avoid future
unwanted surprises.
SUT now exists to support all
phases of drug substance manu-
facturing. Implementation of a
commercial GMP manufactur-
ing process that heavily lever-
ages SUT components requires
a large scope of work, including
legal and business agreements;
procurement and supply chain
system designs; GMP documen-
tat ion; and E/L studies. High
numbers of SUT components can
also mean a significant potential
for in-process leachables, but good
risk-assessment tools can prioritize
the potential risks and reduce the
scope of the E/L testing. The SUT-
dependent process also means rely-
ing heavily on the quality systems
of SUT suppliers. Dual sourcing and
strong QTAs can mitigate some of
that risk.
ReFeRences 1. USP, USP <1031>, “The
Biocompatibility of Materials used in
Drug Containers, Medical Devices
and Implants,” USP 38–NF 33, US
Pharmacopeial Convention, Rockville,
MD, 2015).
2. FDA, Guidance for Industry: Container
Closure Systems for Packaging Human
Drugs and Biologics (Rockville MD,
May 1999).
3. W. Ding et al., Pharm. Eng. 34 (6), pp.
1–11 (2014).
4. J. Bennan et al., “Evaluation of
Extractables from Product-Contact
Surfaces” from the Mega Source
supplement to BioPharm Int. 15,
s22–34 (2002).
5. J. Briggs and N. Chandarana, Bioproc.
Int. 12 (11), pp. 26–29 (2014). ◆
ES683162_BP1015_063.pgs 10.01.2015 20:36 ADV blackyellowmagentacyan

64 BioPharm International www.biopharminternational.com October 2015
STATEMENT OF OWNERSHIP, MANAGEMENT, AND CIRCULATION(Requester Publications Only)
(Required by 39 USC 3685)
1. Publication Title: BioPharm International
2. Publication Number: 1542-166X
3. Filing Date: 9/30/15
4. Issue Frequency: Monthly
5. Number of Issues Published Annually: 12
6. Annual Subscription Price (if any): $79.00
7. Complete Mailing Address of Known Office of Publication: 131 West First Street, Duluth, St. Louis County, Minnesota 55802-2065
Contact Person: Rochelle Ballou
Telephone: 218-740-7005
8. Complete Mailing Address of Headquarters or General Business Office of Publisher: 2450 Colorado Avenue, Suite 300, Santa Monica, CA 90404
9. Full Names and Complete Mailing Addresses of
Publisher: Mike Tracey, 485F US Highway 1 S, Suite 210, Iselin, NJ 08830-3009
Editorial Director: Rita Peters, 485F US Highway 1 S, Suite 210, Iselin, NJ 08830-3009
Managing Editor: Susan Haigney, 485F US Highway 1 S, Suite 210, Iselin, NJ 08830-3009
10. This publication is owned by: Advanstar Communications Inc., 2450 Colorado Avenue, Suite 300, Santa Monica, CA 90404. The sole shareholder of Advanstar
Communications Inc. is: Advanstar, Inc., whose mailing address is 2450 Colorado Avenue, Suite 300, Santa Monica, CA 90404.
11. Known Bondholders, Mortgages, and Other Security Holders Owning or Holding 1 Percent or More of Total Amounts of Bonds,
Mortgages, or Other Securities. If none, check box. None
12. Does Not Apply
13. Publication Title: BioPharm International
14. Issue Date for Circulation Data Below: August 2015
15. Extent and Nature of Circulation
16. Electronic Copy Circulation
*If you are not claiming electronic copies, skip to line 17
a. Requested and Paid Electronic Copies
b. Total Requested and Paid Print Copies (Line 15C) + Requested/Paid Electronic Copies
c. Total Requested Copy Distribution (Line 15F) + Requested/Paid Electronic Copies
d. Percent Paid and/or Requested Circulation (Both Print & Electronic Copies)
□ I certify that 50% of all my distributed copies (electronic and print) are legitimate requests or paid copies
17. Publication of Statement of Ownership for a Requester Publication is required and will be printed in the October issue of this publication.
Name and Title of Editor, Publisher, Business Manager, or Owner: Christine Shappell, Audience Development Director
Signature:
Date: September 30, 2015
I certify that the statements made by me above are correct and complete.
Average No. Copies Each Issue During Preceding 12 Months
No. Copies of Single Issue Published Nearest to Filing Date
A. Total Number of Copies 24,829 24,046
B. Legitimate Paid and/or Requested Distribution1. Outside County Paid/Requested Mail Subscriptions Stated on PS Form 35412. In-County Paid/Requested Mail Subscriptions Stated on PS Form 35413. Sales Through Dealers and Carriers, Street Vendors, Counter Sales, and Other Paid or
Requested Distribution Outside USPS4. Requested Copies Distributed by Other Mail Classes Through the USPS
17,2670
3,7540
17,9030
2,4210
C. Total Paid and/or Requested Circulation(Sum of 15b (1), (2), (3), and (4) ) 21,021 20,324
D. Non-requested Distribution1. Outside County Non-requested Copies as Stated on PS Form 35412. In-County Non-requested Copies Stated on PS Form 35413. Non-requested Copies Distributed Through the USPS by Other Classes of Mail4. Non-requested Copies Distributed Outside the Mail
2,58400
1,018
2,95000
709
E. Total Non-requested Distribution(Sum of 15d (1), (2), (3) and (4) ) 3,602 3,659
F. Total Distribution(Sum of 15c and e) 24,623 23,983
G. Copies not Distributed 206 63
H. Total(Sum of 15f and g) 24,829 24,046
I. Percent Paid and/or Requested Circulation 85.37% 84.74%
ES685448_BP1015_064.pgs 10.06.2015 02:10 ADV black

October 2015 www.biopharminternational.com BioPharm International 65
Regulatory Beat
New Technology Showcase
Pa
ge
he
ad
er
im
ag
e:
ar
th
ur
S.
au
br
y/g
et
ty
im
ag
eS
Nuvia cPrime hydroPhobic
catioN exchaNge media
The Nuvia™ cPrime™ chromatography
media are a new addition to Bio-Rad’s
family of mixed-mode purification
products. The media are designed for
process-scale purification of a wide
variety of therapeutic proteins. The selectivity allows method developers to
use hydrophobic and cation exchange interaction modes to achieve effective
purification. Bio-Rad Laboratories, Inc., www.bio-rad.com/nuvia
celebrate PerformaNce with the
New ex-cell® advaNced™ cho fed-
batch Platform by Safc®
Introducing the next generation in chemically-defined CHO fed-batch media. This contemporary media and feed platform was developed across a wide range of CHO cell lines commonly used in
industrial bio-manufacturing with an emphasis on simple adaptation (regardless of cell bank medium), demonstrated performance with sustained high biomass and maximum titers, and formulations allowing for flexibility to adjust protein quality attributes as needed. For more information or to try a sample, please visit us at www.Sigma-Aldrich.com/CHOperformance, SAFC®
eurofiNS laNcaSter labS
As a member of Eurofins’ BioPharma Product
Testing Group—the largest network of
harmonized bio/pharmaceutical GMP
product testing laboratories worldwide—
Eurofins Lancaster Laboratories supports all
functional areas of bio/pharmaceutical
manufacturing, including method development, microbiology, process validation,
and quality control throughout all stages of the drug development process. Eurofins
Lancaster Labs, tel. 717.656.2300, www.EurofinsLancasterLabs.com
oNliNe viable cell
deNSity moNitoriNg
Hamilton’s Incyte, viable cell density sensor, enables measurement of viable cells without influence from changes in the media, microcarriers, dead cells, or debris. Designed for use in mammalian cell culture, yeast and bacterial
fermentation, its 12 mm diameter, PG13.5 thread and 120 thru 425 mm lengths fit all reactor sizes. Either 2 or 4 sensors connect to the Arc View Controller, which displays, records, and exports measurement data in 4-20 mA, OPC or Modbus formats. Hamilton Company, tel: 800.648.5950, [email protected], www.hamiltoncompany.com/sensors
Cambridge Healthtech Institute’s 15th Annual
JANUARY 18-22SAN DIEGO, CATown & Country Resort and Convention Center
For exhibit & sponsorship opportunities, contact:Companies A-K:Jason [email protected]
Companies L-Z:Carol [email protected]
Register by October 23 for Early-Bird Savings up to $450!
MENTION KEYCODE L56 AND SAVE AN ADDITIONAL $100
Cambridge
HEALTHTECHInstitute
ORGANIZED BY
CHI-PepTalk.com
ES684515_BP1015_065.pgs 10.05.2015 17:43 ADV blackyellowmagentacyan
66 BioPharm International www.biopharminternational.com October 2015
BIOLOGICS NEWS PIPELINE
In the Pipeline
NIH Awards Grants for Genomics ResearchSix new grants from the National Institutes of Health
(NIH) will support researchers to develop new com-
putational approaches for searching among millions
of genomic variants to find those that make a differ-
ence in disease susceptibility or in other traits. The
awards are for three years each and total approximately
$13 million, pending the availability of funds, NIH
announced in a Sept. 21, 2015 press release. The awards
are administered by the National Human Genome
Research Institute (NHGRI) and the National Cancer
Institute, both parts of NIH.
Comparing the genomes of many people suggests
that there are tens of millions of genetic variants, or
DNA spelling differences. For the past decade, sci-
entists have used genome-wide association studies
(GWAS) to find regions of the genome associated with
diseases and traits. In GWAS, the genomes of thou-
sands of people with and without a disease are com-
pared to find the genomic regions containing variants
that affect disease risk. Although GWAS may find
hundreds of variants that appear to be associated with
a disease, it remains a challenge to find out which
variants actually have a role in the disease process, and
what that role might be.
Most variants are in genomic regions that do not
code for proteins. These variants usually affect the
regulation of genes, residing within “switches” in the
genome that determine when and where proteins
are made.
The researchers are developing computational
approaches to combine many different sets of data
to identify disease-causing variants or narrow down
the set of candidate variants. They will use data from
experiments to determine the accuracy of the compu-
tational predictions.
MedImmune and 3M Collaborate on TLR Agonist Cancer TherapiesMedImmune, the global biologics research and devel-
opment arm of AstraZeneca, and 3M Drug Delivery
Systems, announced a research collaboration focused
on developing next-generation toll-like receptor (TLR)
agonists, the companies announced on Sept. 25, 2015.
As part of the agreement, MedImmune has in-licensed
from 3M MEDI9197 (formerly 3M-052), a novel TLR7/
TLR8 dual agonist. FDA recently accepted an investiga-
tional new drug application (IND) for a Phase I study
to explore the safety and tolerability of MEDI9197 as a
potential treatment for patients with solid tumors.
TLR agonists are promising agents that activate anti-
gen-presenting cells such as dendritic cells, enhanc-
ing the visibility of a tumor to the immune system.
MEDI9197 has been designed to activate a broad range
of innate immune cells through targeting of both TLR7
and TLR8, leading to a more robust, adaptive immune
response. A TLR7/TLR8 dual agonist can additionally
convert immune suppressive cells in the tumor to those
with anti-tumor properties, allowing the generation of
an effective anti-tumor response. MEDI9197 will also be
the first dual TLR7/TLR8 agonist administered directly
into a tumor in a clinical setting.
Preclinical studies demonstrate that intratumoral dos-
ing of MEDI9197 may inhibit tumor growth of both the
injected and distant lesions in multiple types of cancer,
including melanoma. MEDI9197 is uniquely designed
for intratumoral injection, allowing the compound to
be retained in the tumor and provide specific immune
activation, enhancing its safety and tolerability profile.
Under the agreement, MedImmune is responsible for
the clinical development and strategy for MEDI9197. 3M
will continue to develop additional TLR agonists in oncol-
ogy and other therapy areas, with MedImmune holding
exclusive rights to conduct research on new molecules
resulting from the collaboration and to determine which
to progress to clinical development. The terms of the
agreement include an upfront payment and development-
related milestone payments for MEDI9197 in addition to
research funding paid by MedImmune to 3M. 3M retains
the rights to 3M-052 in certain topical applications and
use in vaccine admixtures.
Ad IndexCompany Page
ANTITOPE LIMITED 25
BIO RAD LABORATORIES 68
BRUKER DALTONICS 31
CHI–PEP TALK 65
EPPENDORF NORTH AMERICA 19
EMD MILLIPORE 23
EUROFINS LANCASTER LABORATORIES 11
GE HEALTHCARE LIFE SCIENCES 67
HAMILTON CO 13
PATHEON PHARMACEUTICAL SVC INC 7
SGS LIFE SCIENCE SERVICES 35
SIGMA-ALDRICH CORP 15
THERMO FISHER SCIENTIFIC 5, 45
WATERS CORP 2
WOODLEY CLINICAL TRIALS 29
ES685675_BP1015_066.pgs 10.06.2015 22:03 ADV blackyellowmagentacyan

www.gelifesciences.com/BioProcess GE, GE monogram, BioProcess, ReadyToProcess WAVE, and UNICORN are trademarks of General Electric Company. © 2014–2015 General Electric Company. First published Apr. 2014.GE Healthcare Bio-Sciences AB. Björkgatan 30, 751 84 Uppsala, Sweden
29120139 AC 09/2015
The single-use ReadyToProcess WAVE™ 25 bioreactor system delivers
reliable cell culture performance for working volumes up to 25 L. The intuitive
UNICORN™ software, together with advanced sensors and intelligent control
strategies, combine ease of use with accurate and stable control.
In your quest for reliable and accurate cell culture performance, we are
a partner like no other.
upstream downstream single-use services
Intelligence and user friendliness combined.
Our latest rocking bioreactor system.
ES685084_BP1015_CV3_FP.pgs 10.05.2015 23:40 ADV blackyellowmagentacyan

We have your aggregate impurity concerns covered.
RESOLVE TO HAVE IT ALL
Upstream improvements in expression systems continue to impact the level of
downstream product- and process-related impurities. This includes aggregate
formation, which influences biotherapeutic efficacy and immunogenicity. Bio-Rad
offers a range of robust, easy-to-use, and scalable chromatography resins —
CHT™ Ceramic Hydroxyapatite and Nuvia™ HR-S — to address your aggregate
clearance challenges.
n Industry Proven — selected for late-stage and commercially approved processes
n Secure Supply — uninterrupted supply of process chromatography resins
n Global Support — process development expertise and consulting offered worldwide
Visit bio-rad.com/info/cht to receive a resin sample.
ES685052_BP1015_CV4_FP.pgs 10.05.2015 23:39 ADV blackyellowmagentacyan