Embed Size (px)
Citation preview
UNIVERSITY OF CALIFORNIA, BERKELEY Department of Economics Berkeley, California 94720-3880
CENTER FOR INTERNATIONAL AND DEVELOPMENT ECONOMICS RESEARCH Working Paper No. C03-126 Changing Status of Daughters in Indonesia Michael Kevane Department of Economics, Santa Clara University
David I. Levine Haas School of Business, University of California, Berkeley February 2003
Keywords: intrahousehold allocation, Indonesia, son preference JEL Classification: O12, J71, D13, I21 Abstract: In many nations, parents exhibit a variety of behaviors that favor sons over daughters. In this paper we provide evidence suggesting that in Indonesia there is no problem of �missing daughters� and that patterns of births, birth spacing and nutrition allocations do not suggest son preference during the cohorts born from 1940�s to the 1990�s. In contrast, gender differences in educational attainment and inheritance were quite prevalent in the recent past. These gaps have narrowed for secondary education and inheritance, and disappeared for primary education. ______________________________ Minnie Ames, Sarah Barber, Susan Blackburn, Garrick Blalock, Maya Federman, Fitria Fitrani, Deb Garvey, Paul Gertler, Mark Gilkey, Terrence Hull, Kai Kaiser, Ron Lee, Daniel Levine, Dov Rothman, G. William Skinner, Bill Sundstrom, and participants at seminars at U.C. Berkeley and U.C. Riverside made helpful comments. The authors retain responsibility for errors. CIDER papers are produced by the Institute of International Studies and the Institute of Business and Economic Research. This paper can be found online at the new UC eScholarship Digital Repository site: http://repositories.cdlib.org/iber/cider with links to the CIDER publications page: http://www.haas.berkeley.edu/groups/iber/wps/ciderwp.htm
1
Son preference influences parental decisions and child outcomes in many parts of the world. These
outcomes range from the sex composition of the family and the spacing of births to the resources devoted to
children of different sexes. In South and East Asia, perhaps 80 million young women are "missing" because
they have been aborted, killed or neglected; that is, the proportion of young women alive is much lower than
would be expected to occur under normal chances of survival with equal access to health care (Bardhan and
Klasen 1999). At the same time, the publicity devoted to missing girls obscures considerable variation in the
treatment of daughters across Asia and over time (Banister 1999).
This paper offers a comprehensive view of the relative treatment of daughters in Indonesia, using the
1993 and 1997 waves of the Indonesia Family Life Survey (IFLS). We examine multiple measures of son
preference and the status of girls relative to boys more generally. We study several birth cohorts to
understand how the relative treatment of daughters has evolved in recent decades. The measures we study
capture the actions parents, siblings and others take (often encouraged by customs, laws, or economic
incentives) that favor sons over daughters.
Indonesia is famous for its relatively egalitarian treatment of women. Thus, some readers may doubt
why an article is needed that looks at gender differences in the treatment of sons and daughters. In fact, the
evidence for equality was never that strong. There is plenty of anthropological evidence suggesting unequal
treatment, and bias towards boys (Atkinson and Errington 1990; Bedner 1999; Hobart 1995; Ihromi 1994;
Mulatsih 1994; Parker 1997; Sullivan 1994; Wolf 1992). As we will document, for children born in the middle
of the 20th century, education and inheritance were much more favorable to sons than to daughters. At the
same time, there has been no evidence of son preference in birth spacing. Nevertheless, this lack of
differentiation may merely have been because it was difficult to space children before modern contraception
was accessible. In India, for example, recent debates have highlighted a possible increased manifestation of
son preference as more control over birth can be exercised (DasGupta and Bhat 1997). The adat survey
2evidence we present below indicates that in roughly half of 270 Indonesian communities, the tradition was, in
fact, to prefer a son for the first birth (and only six percent preferred a daughter first). Respondents also
indicated there was more 'social pressure' to have a son than to have a daughter.
Because son preference can take many forms, we examine its several possible facets in turn. We
start with a brief review of the anthropological literature on the status of daughters in Indonesia, and then
describe the IFLS dataset and the methods we use. The following sections present evidence on “missing
girls,” provide tests of whether parents spaced births to obtain a desired number of sons, and examine
whether sons received preferences in nutrition, education and inheritance.
Our analysis is more comprehensive than most in that we look at many dimensions of son preference
over several decades. Given the many time periods and results we examine, it is important to sketch the
coherent story our results present – recalling that our results present averages for a diverse nation. Our first
main result is that there is no evidence that parents intrinsically value daughters less than sons. Most
importantly, there is no “missing girls” problem in Indonesia. In addition, there is also no systematic evidence
that son preference has affected the size and sex composition of families even with the advent of modern
contraception; for example, we do not find that parents who have many daughters have large families as they
try to achieve a desired number of sons. Furthermore, there is little evidence of discriminatory allocations of
nutrition.
Our second main result is that in the past as daughters grew up, gender differences became more
important. In both education and inheritance, sons born in the middle of the twentieth century were strongly
favored on average.
Our final main result is that these gender gaps have diminished over time. As primary school became
universal, gaps in enrollments have largely disappeared. Moreover, the gap has narrowed considerably at the
secondary level. Gender gaps in inheritance were also much smaller by the 1990s.
Setting and data
3Indonesia is the fourth most populous country in the world and contains tremendous cultural and
economic diversity, and widespread poverty. From the end of the 1960s until the 1997 financial crisis, real
per annual capita GDP growth rate was an impressive 3.9 percent. Even after this growth, annual per capita
incomes averaged only US$880 in 1996. During this period Indonesia also saw remarkable improvements in
health status. Between 1960 and 1995, life expectancy at birth increased from 39 to 66 years and infant
mortality decreased from 148 to 49 per thousand.
Generalizing over the archipelago with its hundreds of languages and ethnic groups, and over the time
period of the second half of the twentieth century, during which Indonesia has undergone rapid urbanization
and industrialization, is obviously difficult. Moreover, class differences in the status of women can be very
large even within ethnic groups. There is little doubt, however, that overall gender differentials are less salient
in most parts of Indonesia than in countries with well-documented unequal status such as India and China
(see the papers in the collection edited by Atkinson and Errington (1990)). Nevertheless, substantial
disagreement exists in how best to summarize the differential treatment of children and of adults, and
evidence is plentiful of localized discrimination against girls. These disagreements and ambiguities emphasize
the important role of large-scale surveys in determining the nature, extent, and causes of bias against girls in
Indonesia.
The data used in this analysis come from the 1993 and 1997 waves of the Indonesia Family Life
Survey (IFLS) (Frankenberg and others 1995); and Frankenberg and Thomas, 1997). This panel survey has
information on individuals in approximately 7224 households distributed in several hundred villages or
neighborhoods. The IFLS is a representative sample of 83% of the population in late 1993, covering 13 of 27
provinces in the country. Small provinces and politically unstable provinces such as Irian Jaya and the former
East Timor were not sampled; thus, our sample misses some heavily Christian areas and the enormous variety
of Irian Jaya. After stratifying by urban and rural areas, households were randomly selected in 321
4enumeration areas. Within households different members were interviewed according to various selection
criteria to ensure adequate numbers of older respondents.
For most of the different facets of potential son preference, we analyzed three groups of individuals.
Results were almost always consistent across samples; thus, we typically only report results from one or
two of the samples. The first sample consists of the household heads, their spouses, and their siblings. This
group gives us family sex composition and other demographic information going back to the cohort born in
the 1940s. These data must be treated with some caution. The “families” for which we have data on are
ones where a child grew up to become head of a household or the spouse of a household head, and survived
to 1993. More worrisome is that the adults responded to questionnaires regarding their own schooling and
biological siblings, but only reported data on siblings currently alive or deceased in the past year, and not on
the deceased siblings who may have been present during their childhoods. Thus, for older respondents the
number of siblings is much more likely to be significantly lower than for relatively younger adults. Indeed,
the frequency in household rosters of adults over 60 declines rapidly.
The second sample consists of children of ever-married mothers, as reported in a retrospective
pregnancy history for all women aged 15-49 in the sample households. With this retrospective history, we
are able to reconstruct sex composition of families and other demographic information at different times.
The third group uses the roster of children and adults present in households in 1993. From this
roster we constructed both children residing in the household (regardless of biological parents) and biological
children of the household head (regardless of residence). We use the ‘residential’ sample to report on
differential allocations of nutrition and health care (captured by height-for-age), education, and inheritances,
because only persons residing in the household were measured for height and weight and asked about
education and inheritances. We estimated demographic outcomes for these families but we do not report them
because they are virtually identical to the results from the families of ever-married mothers.
There are two sets of tests for son preference in intra-household resource allocation. The first set
compares mean outcomes for sons and daughters. We examine a panoply of outcomes including births,
5mortality, number of siblings, likelihood of being youngest child, intervals after birth to birth of next child,
height, and education attainment. We rely on simple comparisons of unadjusted means whenever possible, and
note when differences are statistically significant. The second set of tests looks for competition from
siblings (Garg and Morduch 1998). Intuitively, if parents invest more in sons or if brothers are more
successful competitors for scarce family resources, then children will have better outcomes if their siblings
are sisters, not brothers.1 We present regression results testing if, after controlling for family size, the
proportion of siblings who are brothers affects an individual’s education, height, and inheritance.
No single paper or dataset could capture the behavior of the entire population of Indonesia.
Surveyed provinces contain vast heterogeneity, and our results reporting average behavior do not capture the
different experiences among regions and ethnic groups. For many of the tests of differences in means, we
also ran regressions with controls for family demographic characteristics, socio-economic status of current
household, ethnicity, religion, local marriage norm (virilocal, uxorilocal or ambilocal), and region. These
controls never affected results.
One further source of evidence we use is a unique opinion survey of custom and traditional law
carried out in the 1997 IFLS. In 270 relatively homogeneous rural enumeration areas (where one ethnic
group accounted for at least 50% of the community), village chiefs were asked to name a local expert in adat.
This word, adat, refers to the local norms and traditional law that stand in contrast to the formal laws of the
nation-state. In many parts of Indonesia the state is far removed, and adat norms bind and guide behavior.
The adat questionnaire consisted of approximately ninety questions related to customs concerning gender.
Each expert was asked to state whether the custom held in traditional law and whether it remained common
practice at the time of the 1997 interview. These responses are best thought of as the opinions of influential
members of communities.2
1 Of course, having brothers might increase the share of resources going to children generally; see Butcher and Case(1994), Kaestner (1997) and Hauser and Kuo (1998) for the mixed U.S. evidence.2 The selection process of respondents seems to have been fairly arbitrary (very few women were included, forexample). The exact phrasing of questions is not known, and this is of course very important when measuring
6Some traditions related to son preference showed enormous declines according to these experts’
opinions. We have recoded responses as zero if the custom favored girls or women (rarely the case) or was
neutral (more common), and one if the custom favored boys or men. Slightly less than half of the adat
respondents thought that families preferred to have their first child be a son in the past, while less than one-
third thought that was the case in the present. There was a similar decline in pressure to have sons more
generally. The tradition that boys receive education priority declined from 48 to 14 percent. Exclusive male
decision-making about schooling also declined substantially. Furthermore, health care priority for boys
virtually disappeared. Cases of unequal inheritance declined as well. Girls inherited more than boys according
to only 12.5% of the respondents. But the fraction of areas where boys received more than half of their
parents’ estates declined from 69% in traditional practice to 48% in current practice, suggesting movement
away from Islamic inheritance norms (where boys inherit twice their sisters’ shares).
Gender relations at the adult level also moved toward equality. Women were less restricted in births
than they were before (births are now less likely to be at the home of the husband’s family, the incidence of
forty days of seclusion following birth declined, and women are less likely to have restrictions on bathing
following birth). Marriage ages increased dramatically, with girls no longer expected to marry young. The 60
percent of the sample that reported female circumcision seems quite high. Anecdotal evidence suggests,
however, that in Indonesia female circumcision almost usually has involved a symbolic drawing of blood, and
is different from the genital mutilation found in parts of Africa and South Asia that is the focus of most of the
research literature and the press (Feillard and Marcoes, 1998).
In questions relating to the status of women as adults and within households, there were also
improvements in status for almost every indicator, but there is still evidence of inequality. Under local
traditional laws, unmarried women still could not own land in roughly a fifth of the enumeration areas. Their
differences between the ideals of ‘custom’ or ‘tradition’ and actual practice. “The past’ is also a vague concept,open to multiple interpretations. Finally, since only one person in each enumeration area was interviewed, there is noway to validate opinions (though we have found that responses on many items do correlate with averages of actual
7husbands almost always seemed to have the right to not let them work. In a majority of cases women could
not spend their income as they chose. In 42 percent of the enumeration areas, an older man could remarry if
his wife died, but an older woman could not if she became a widow.
Note that while the received wisdom regarding the status of women in Indonesia is that gender status
is much more equitable than in many other societies, the adat responses suggest that there are many areas in
Indonesia where unequal treatment has been regarded as the norm.
Son preference and “missing girls”
In much of Asia, very strong preferences for sons results in a skewed sex composition of the family.
This happens through infanticide and through relative neglect of girls in health and nutrition leading to higher
rates of female than male mortality during childhood. More recently, in Korea, Taiwan, and many provinces
of China, sex-selective abortions following ultrasound, amniocentesis, or CVS (a procedure similar to
amniocentesis) reduced the number of daughters in the 1990s (Cho and Kim 1994; Coale and Banister 1994;
Hong 1994; Hull 1990). In Indonesia, the techniques were only gradually becoming familiar and affordable to
only a small portion of parents during the period covered by our data.
Regardless of whether the source is prenatal abortion or postnatal treatment, it is important to look
for evidence of missing girls in Indonesia. The adat survey suggests that son preference was present.
Slightly less than half of the adat respondents thought that families preferred to have their first child be a boy
in the past, while less than one-third thought that was the case in the present. There was also a large decline
in the pressure to have sons more generally. Interestingly, the “no pressure to have female child” response
also increased. Apparently, as families began to have smaller families, they were increasingly content to have
only sons. In addition, if a family were going to adopt, the likelihood that they would adopt boys increased
rather than decreased.
reported practices). For all of these reasons, the responses from the survey should be seen as responses from a smallsample of influential persons.
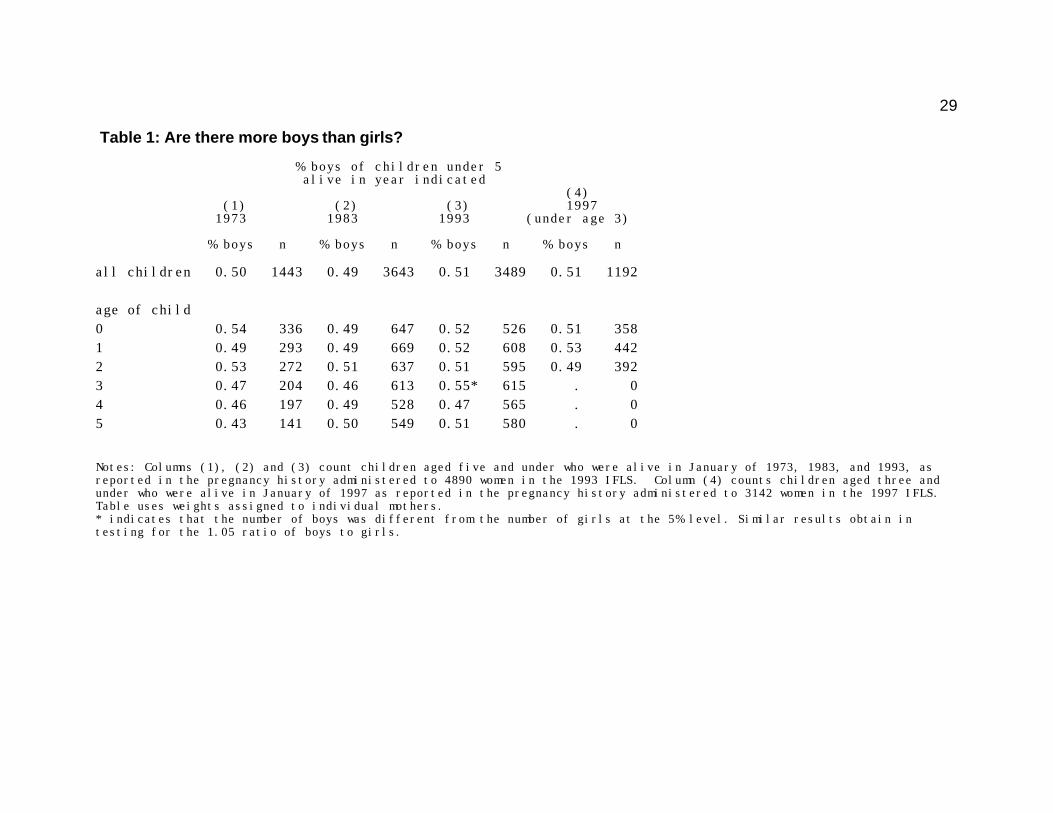
8The data presented in Table 1 on the sex ratio of children of various ages does not indicate son
preference. Given the biological norm of 1.05 boys born for every girl, an initial ratio of 51.2% would be
expected. Higher mortality of girls would lead to an increase in the percentage of boys. Using several
samples, no pattern of excess female mortality appears.3 The first three columns use the pregnancy histories
of 4890 ever-married women to count the number of boys and girls that survived in each age group at three
points in time (1973, 1983, and 1993). The fourth column uses the pregnancy history administered to women
in the second wave of the IFLS in 1997. In only one case out of twenty-one is the number of girls in an age
group at a particular point in time statistically significantly less than the number of boys (3 year olds in 1993).
Having one in 21 tests be statistically significant at the 5% level is almost exactly the rate predicted by mere
chance. These results held for the sample of biological children of household heads, and for the sample of all
children present in households regardless of their biological status. The data were also broken down
according to urban or rural residence, with no differences.
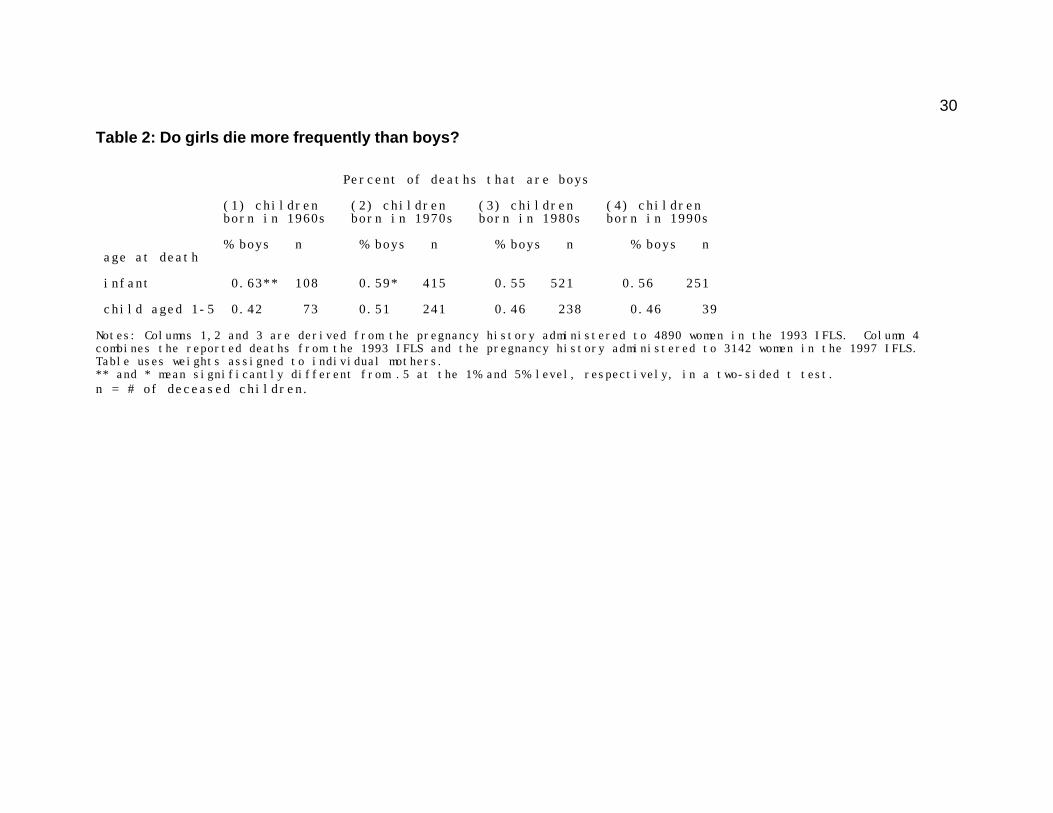
Table 2 checks this finding by using the detailed pregnancy histories to find the sex ratio of children
who died between 1970 and 1993. There is no evidence of higher mortality for daughters, and for infants the
normal higher mortality for boys was evident.4 These findings are consistent with larger scale findings, such
as those reported in United Nations (2000, pp.158-63) and those of Martin, et al. (1983), using the 1976
World Fertility Survey for Indonesia. Note that the most important feature of the table is the apparent decline
in excess infant deaths for boys, from .63 to .56 of all infant deaths, over the twenty-year period. However,
3 This finding of no differential births or mortality in the past was further confirmed in data from a short pregnancyhistory form administered to older women over 50. Of these 2,423 women who had given birth to a child, the genderratios of births and deaths were also basically 50:50.4 Hill and Upchurch (1995) and (Klasen 1999) note that mortality rates should normalize for the known higherpropensity of boy children to suffer excess mortality over girls. The bounds for the 95% confidence intervals for themortality ratios found in Table 2 include the estimates of normal excess boy mortality presented in Klasen’s Table 1,except for the 1960s cohort, where the Indonesia data display slightly lower female mortality than would be expected. The finding of no son preference is therefore quite robust. Hill and Upchurch do find that the Demographic andHealth surveys show a slight female disadvantage in mortality in Indonesia, compared with a normal standard. Butout of 34 developing countries, 24 have more disadvantage than Indonesia, and Middle Eastern countries andPakistan have disadvantages three times the level of Indonesia’s.
9results from this sample must be treated with caution, as many women from these birth cohorts were no
longer living in 1993.
Son preference and the sex composition of families
As the target fertility of parents declines and access to contraception increases, son preference might
be more likely to manifest itself in birth ordering and spacing (DasGupta and Bhat 1997; Rahman and
DaVanzo 1993). When parents prefer sons, then they are more likely to keep having children after the birth
of a daughter or when their first children are largely daughters. In the extreme case of parents with a target
number of sons, they will always try to have another child when the most recent child is a daughter. This
logic suggests the proportion of families with completed fertility whose youngest child is a son should be
higher than the proportion with a youngest child who is a daughter. In addition, girls should be more likely to
be members of bigger households. Finally, when parents can affect birth timing, the spacing of births after a
son should be longer (for a review of these ‘optimal stopping’ hypotheses, see Clark 2000)
In Indonesia, contraceptive use was very low in the 1970s, and rather high in the 1990s. Only 20%
of women responding to the IFLS 1993 questionnaire who were born in the period 1944-53 had started using
contraceptives when they were under 25 years old. In contrast, 50% of women born in the period 1954-63
started when they were under 25, and a full 86% of women born in the period 1964-73 had already started
using contraceptives when they were under 25 (and this number would be expected to rise, as some of the
women not using contraceptives were still under 25).
In any case, there is no evidence in the IFLS data supporting the three hypotheses about “optimal
stopping” behavior.5 We first look at whether it was more likely that the last child of a family that had
5Tables 4, 5 and 6 were also reproduced in regression form, adding province dummies and other controls; theregressions confirmed the lack of son preference. Many parents in Indonesia report a desire to have at least onedaughter. This desire is particularly important in the few matrilineal regions, and in the larger number of regionswhere elderly parents traditionally live with a daughter and her family (see Cameron 2000). Thus, we repeated alltests of son preference for families with at least one daughter, and look for daughter preference in families with onlysons. We found little evidence supporting preference of either kind.
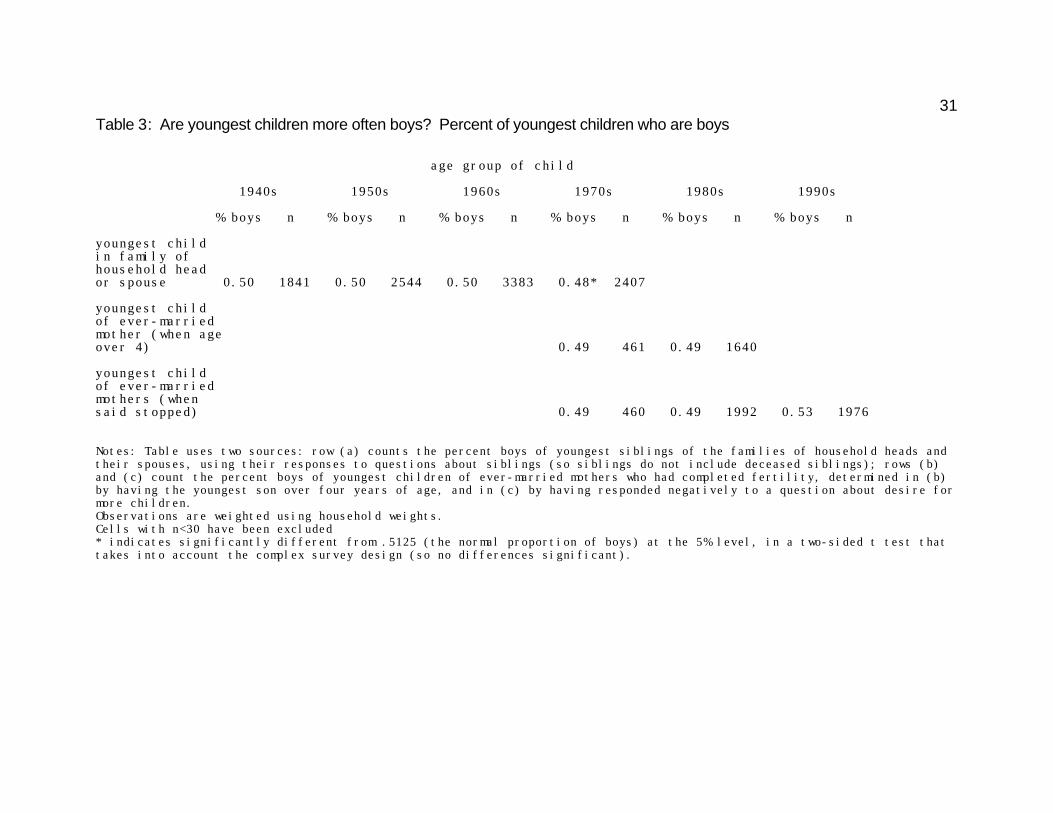
10completed its fertility was a boy. Table 3 reports this statistic over six decades, from the 1940s to the 1990s.
Only one of the cohorts has a percentage different from .50, and that only at the 10% level of significance,
and it is the 1990s cohort in the sample where mothers indicated they had completed their fertility. These
were younger mothers whose fertility had probably not ended for sure, even though they had indicated a
desire not to have more children (especially considering that the average interval between births was on the
order of 3.5 years). It may be that young mothers having boys were more likely to say that they had attained
their desired family size, but in fact did not typically stop. (Recall moreover that the chance of having a boy
is actually slightly higher than the chance of having a girl, so the test of equality of boys and girls is actually
more generous than the correct test.) For the sample of ever-married mothers, there was no correlation
between the sex of the youngest child and current contraception use (not shown).
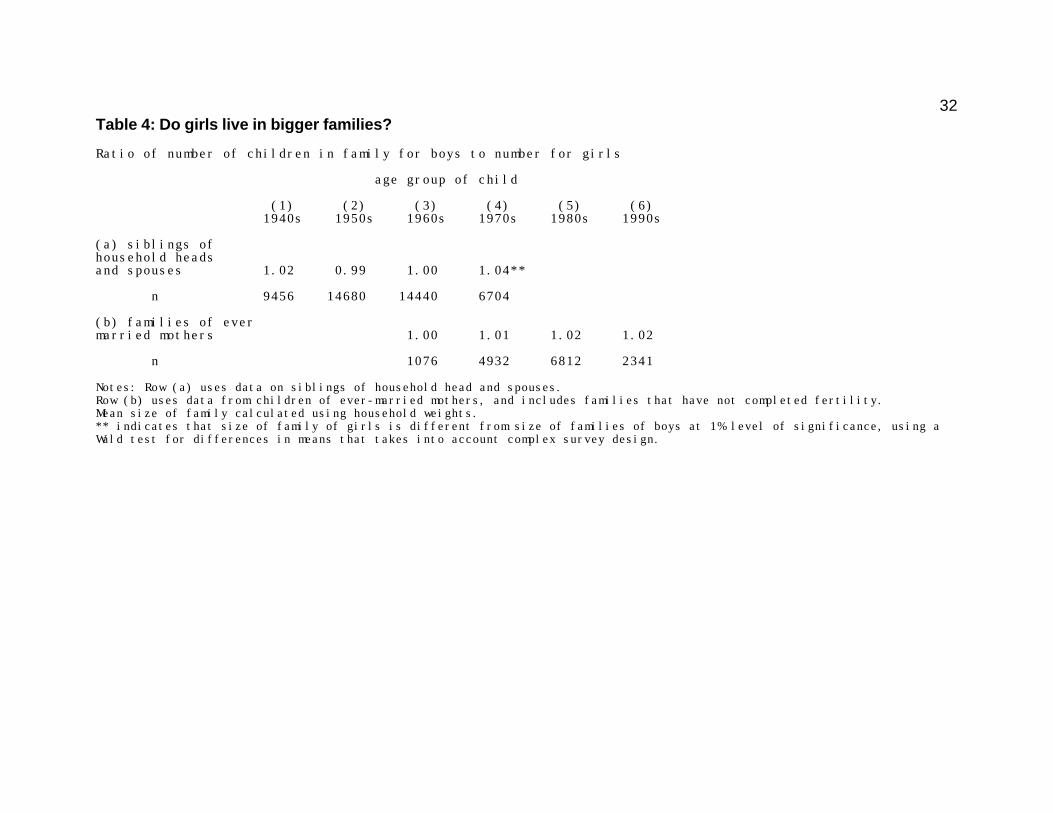
We next look at whether there is a tendency for larger families to be composed of more girls, as
“unlucky” parents who prefer sons continue to have children. Table 4 shows that, again, over the decades
from the 1940’s to the 1990’s only one ratio of the size of family for boys over the size of family for girls is
significantly different from one, and in the wrong direction (boys are more likely to live in larger families).
None of the cohorts from the sample of children of ever-married mothers have ratios different from one.6
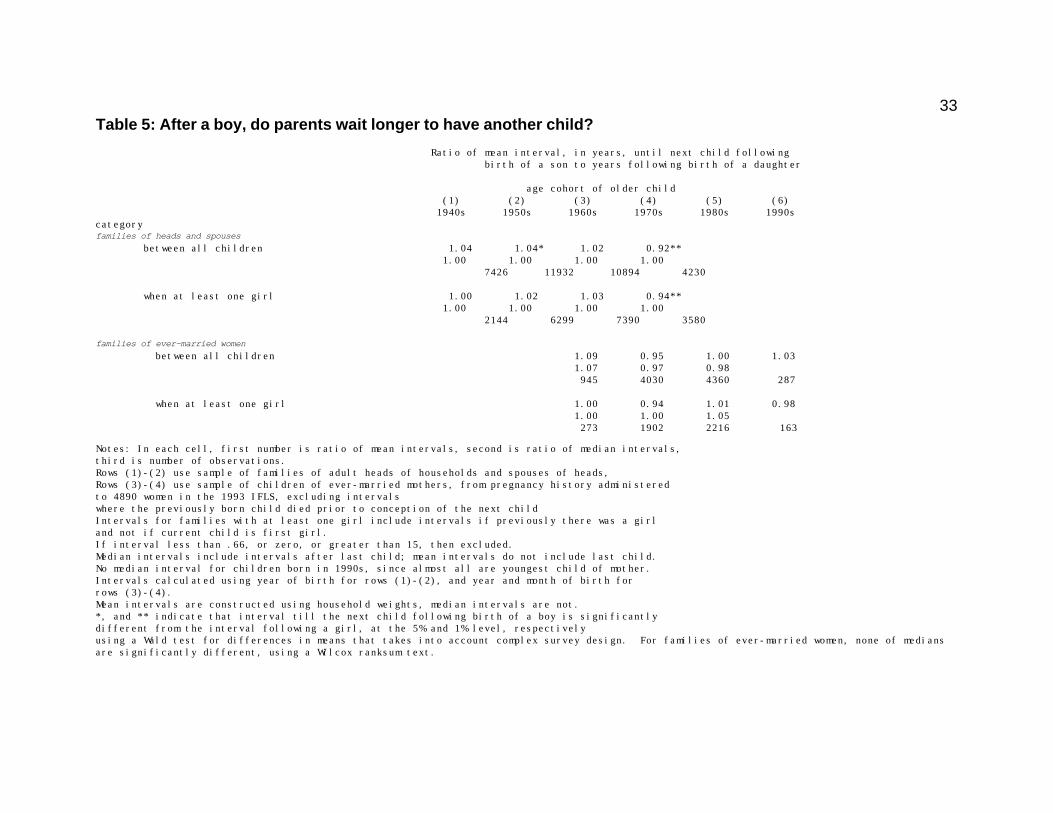
Spacing between children is also basically the same for boys and girls at present, but seems to have
been slightly skewed in the distant past. In Table 5 we consider the intervals in years that follow the birth of
a boy until the birth of the next child, compared with the intervals that follow the birth of a girl. We present
the ratios of these intervals, again for cohorts where the older child was born in the decade indicated (from
the 1940s to the 1990s). We calculate the ratio for several different intervals: first, all the intervals following a
child; second, the intervals following children when there is at least one girl older sibling, not including the
child just born herself (because in many parts of Indonesia elderly parents reside with a daughter, the
anthropological literature suggests that son preference may be stronger when the family has at least one
6In a separate table (available upon request), we find that there is no tendency for the percent of boys to decline asfamily sizes get larger, a fundamental implication of son preference, given the small size of Indonesian families overall.
11daughter); third, the intervals following a second child, if the first child is a boy (that is, are intervals longer
after boy-boy combinations than girl-boy/girl combinations); and fourth, the intervals following a second child
when the first child is a girl. (In the interest of saving space, we do not present the latter two sets of
intervals.)
For the sample of children of ever-married mothers, we omitted intervals where the older child died
prior to the conception of the new child, and so the next child was plausibly a ‘replacement’ for the previous
child who died. Including these intervals (5.8% of all intervals) did not substantively alter the main results.
But they do indicate some son preference for the earlier cohorts (1960s through the 1980s); compared with
daughters, the intervals between the birth of a son and the next child are quite a bit shorter in cases where the
son dies before conception of the following child. Parents did seem to hurry to replace sons.
For the childhood families of adults, the mean interval across the entire sample of intervals is 3.4
years, identical to the intervals for the younger cohorts. (Actually, the mean interval falls from around 4.0
years for children in the 1940s to 3.0 years for the 1970s, partly due to the deaths of siblings meaning
intervals getting miscounted because they are no longer anchoring separate intervals.)
The ratios of intervals are sometimes statistically different from one, but in ambiguous directions.
For the earlier generations the intervals are longer following the birth of a boy, consistent with son preference,
but for the 1970s cohort the intervals are considerably shorter following a boy. The intervals following boys
when there was at least one girl present were typically slightly lower than the overall intervals. Overall, we
are left with an ambiguous result. In any case, the differences in mean intervals are fairly small, with the
largest difference on the order of six months. That suggests looking at the median intervals. Looking at
median intervals has the additional advantage of being able to include the intervals after the last birth, by
coding them as large intervals. Here we find that for all of the adult cohorts the median intervals are the same
following a boy as for those following a girl (for the adults we only have year of birth and not month of birth,
so intervals are whole numbers). For the more recent cohorts there is variation, but no pattern of differential
spacing emerges.
12As a caution, recall that the data on birth spacing for earlier generations rely on adults’ reports of
their siblings (and not on direct reports of their parents’ fertility). In previous generations divorce rates were
high in much of Indonesia, and families often formed and re-formed over time. In many parts of Indonesia,
extended families were the norm, some with multiple wives and many with step-siblings and foster-siblings.
Son preference and nutritional status
We have established above that there is not so much discrimination against daughters that they have
experienced excess mortality or differential ‘presence’ in families. Nevertheless, allocations of resources to
boys and girls may still be unequal.
We conduct three tests to examine the hypothesis of unequal nutritional allocation to sons and
daughters. First, we examine the relative heights of adult males and females because for adults height largely
measures nutritional status as a child (Strauss and Thomas 1988). Second, we ask whether standardized
height-for-age for children under 10 in 1993 were different for boys and girls. We standardize height-for-age
using the NCHS/WHO reference norms calculated from a population of well-fed children. Specifically, we
transformed each height observation into a z-scored height-for-age by subtracting the NCHS/WHO reference
mean for each age and sex and dividing by the age- and sex-specific NCHS/WHO reference standard
deviation. Finding differences in these standardized measures is not necessarily indicative of unequal
allocations because children of different ethnic groups may follow different growth paths. At the same time,
substantial evidence suggests that for young children, most differences in height-for-age is due to health, not
genetic differences (for controversies on the use of the NCHS/WHO reference standards, see Klasen 2000).
Third, in the section with multivariate analysis (below) we examine whether children and adults who grew up
in families with a higher proportion of male siblings were (controlling for family size) shorter on average.
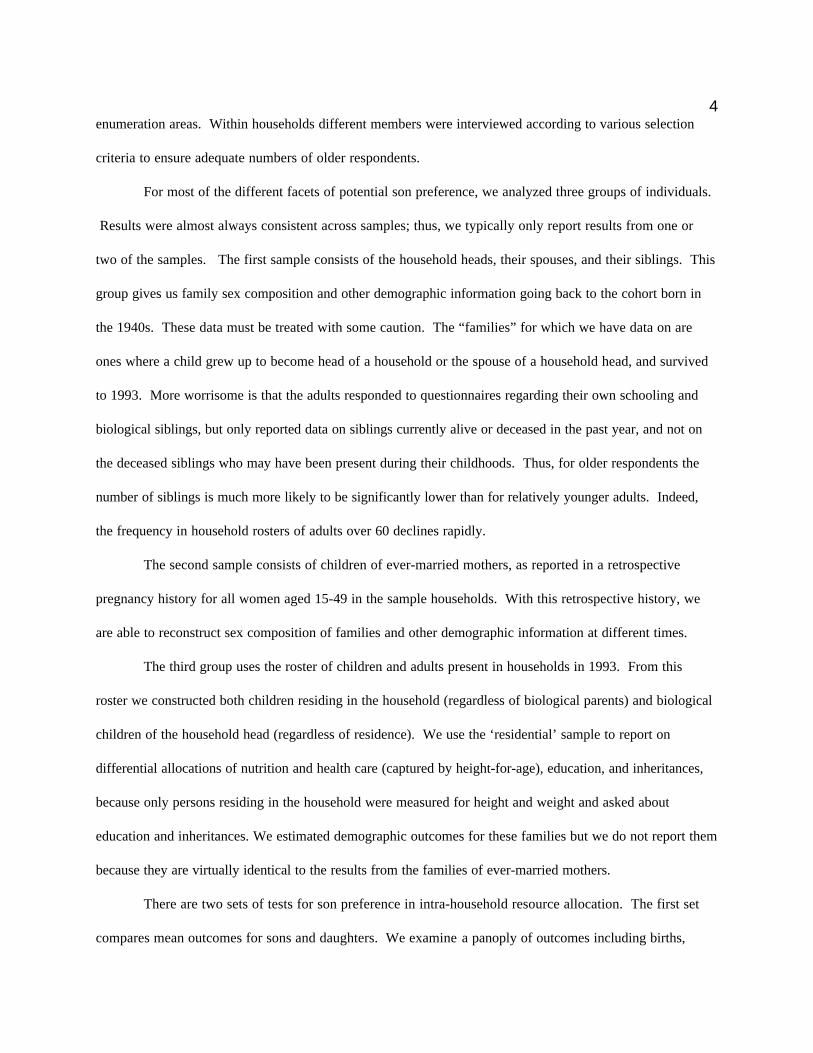
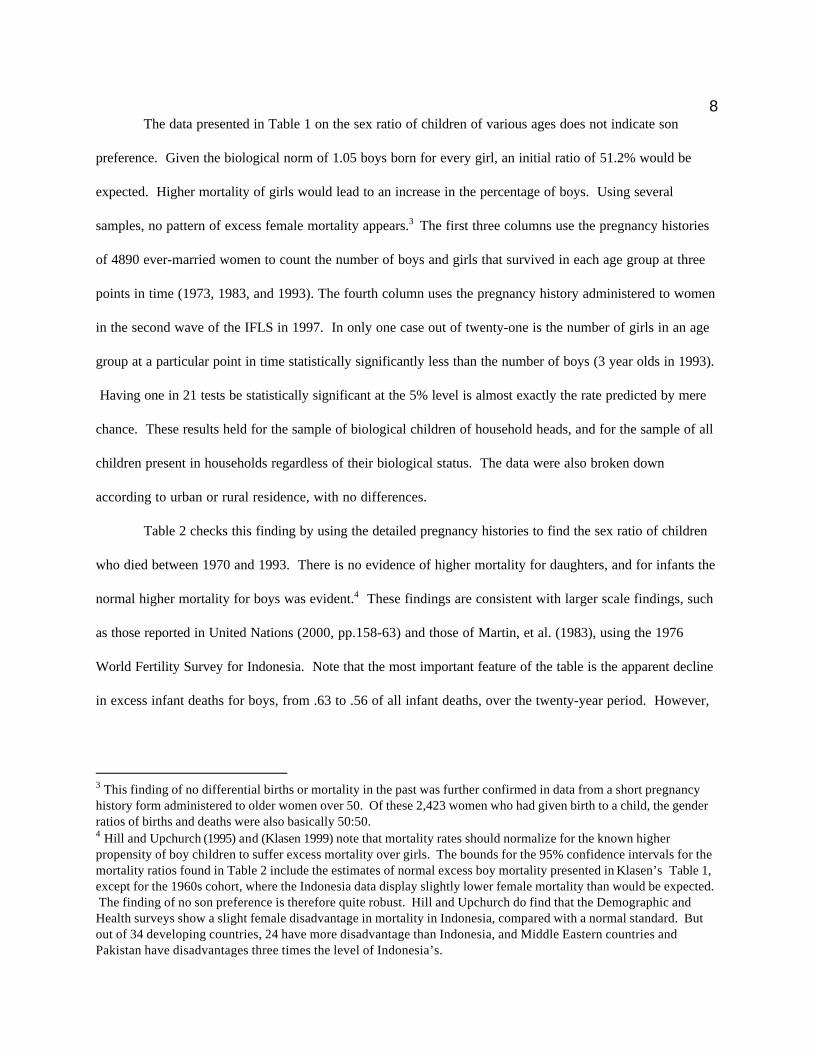
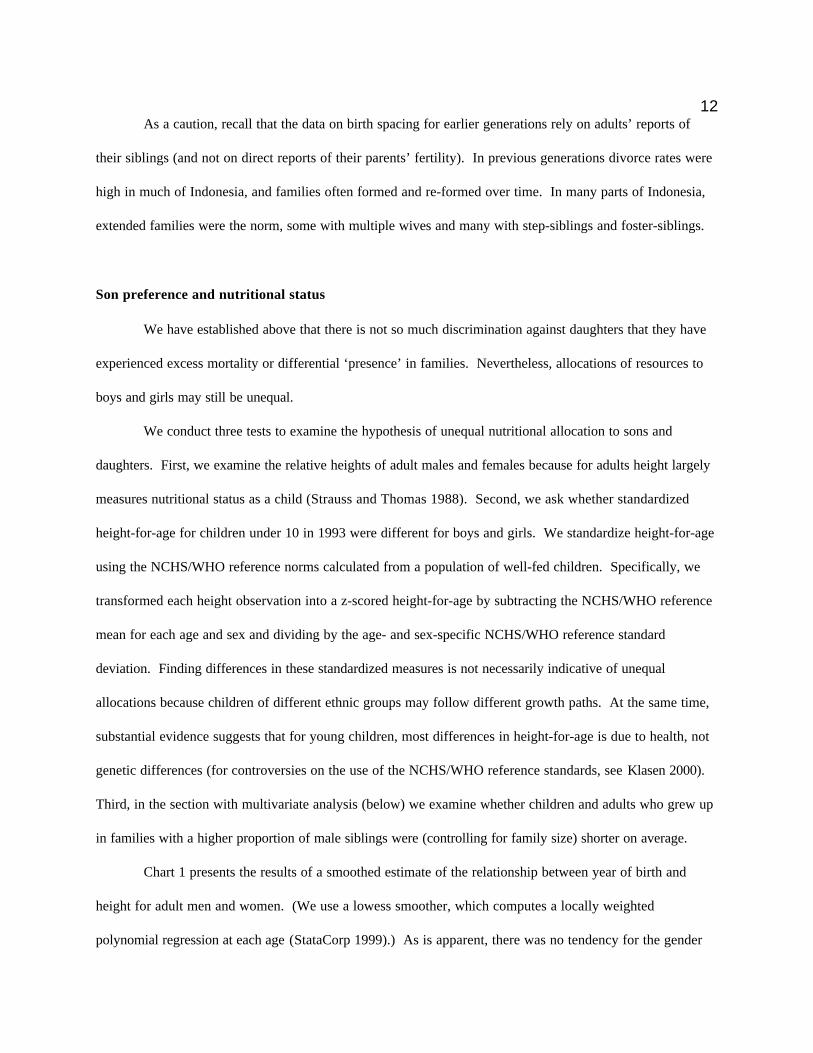
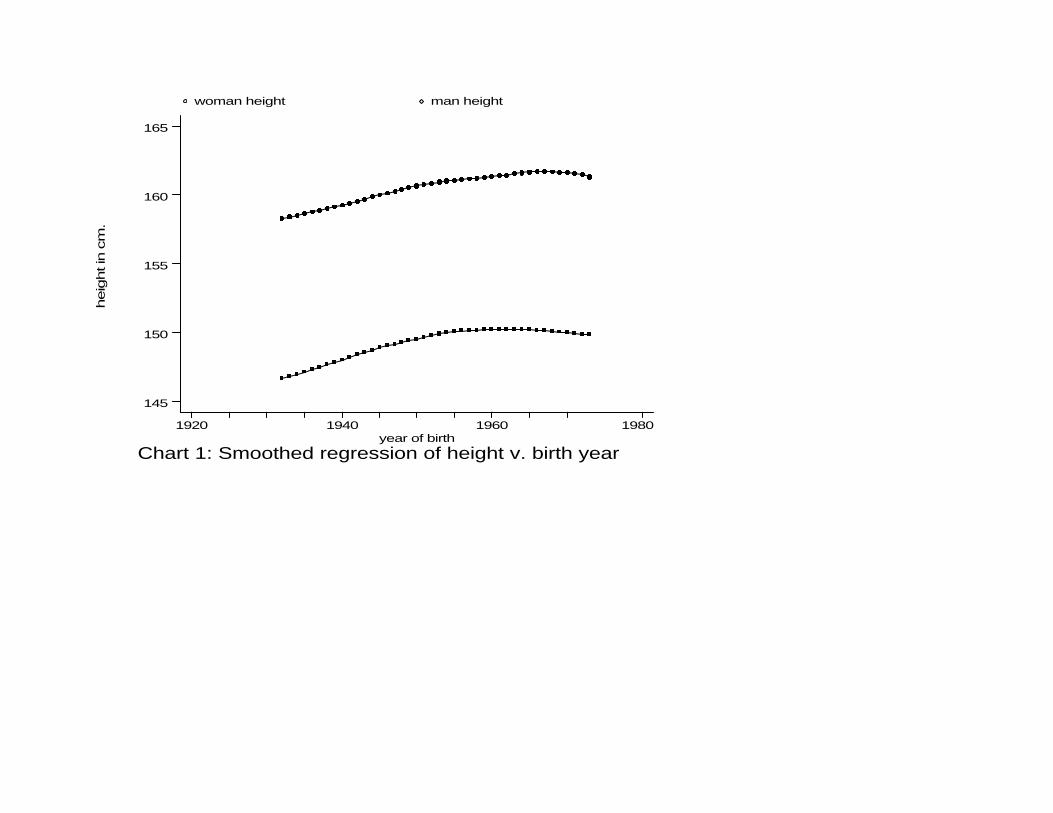
Chart 1 presents the results of a smoothed estimate of the relationship between year of birth and
height for adult men and women. (We use a lowess smoother, which computes a locally weighted
polynomial regression at each age (StataCorp 1999).) As is apparent, there was no tendency for the gender
13differences in height to narrow for younger cohorts. We also calculated the ratio of median height of adult
men to median height of adult women for various age groups. There was virtually no change in the ratio
from the first cohort (adults born in 1934-43) to the latest cohort (adults born in the 1970s); adult men
remained about eight percent taller than women for all age groups. Note that this constancy is at odds with
an implication of son preference that as nutrition improves and both sexes grow taller, women would grow
relatively taller and the gap would narrow.
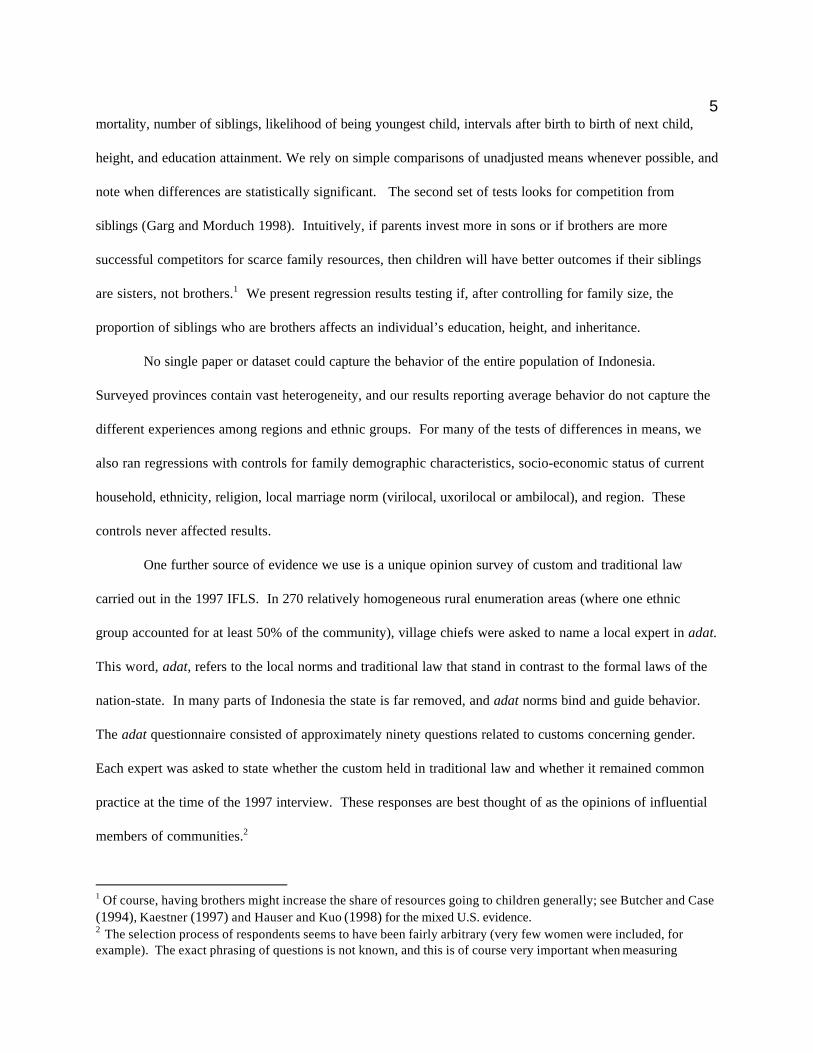
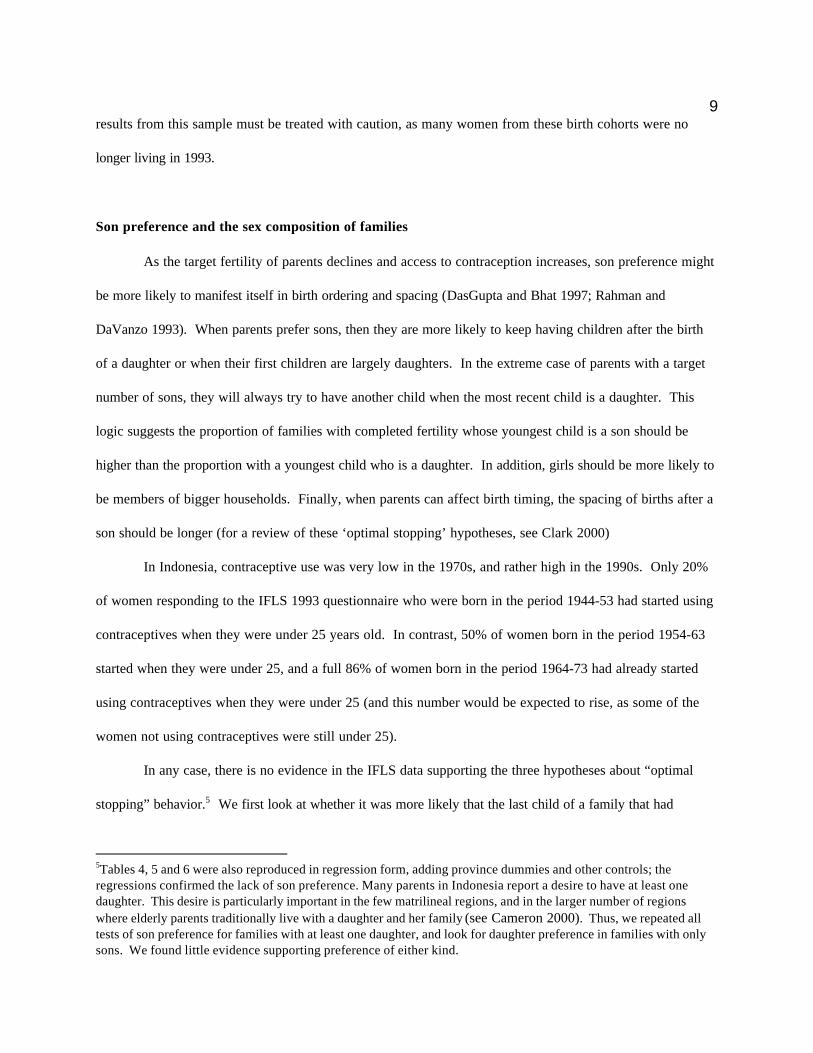
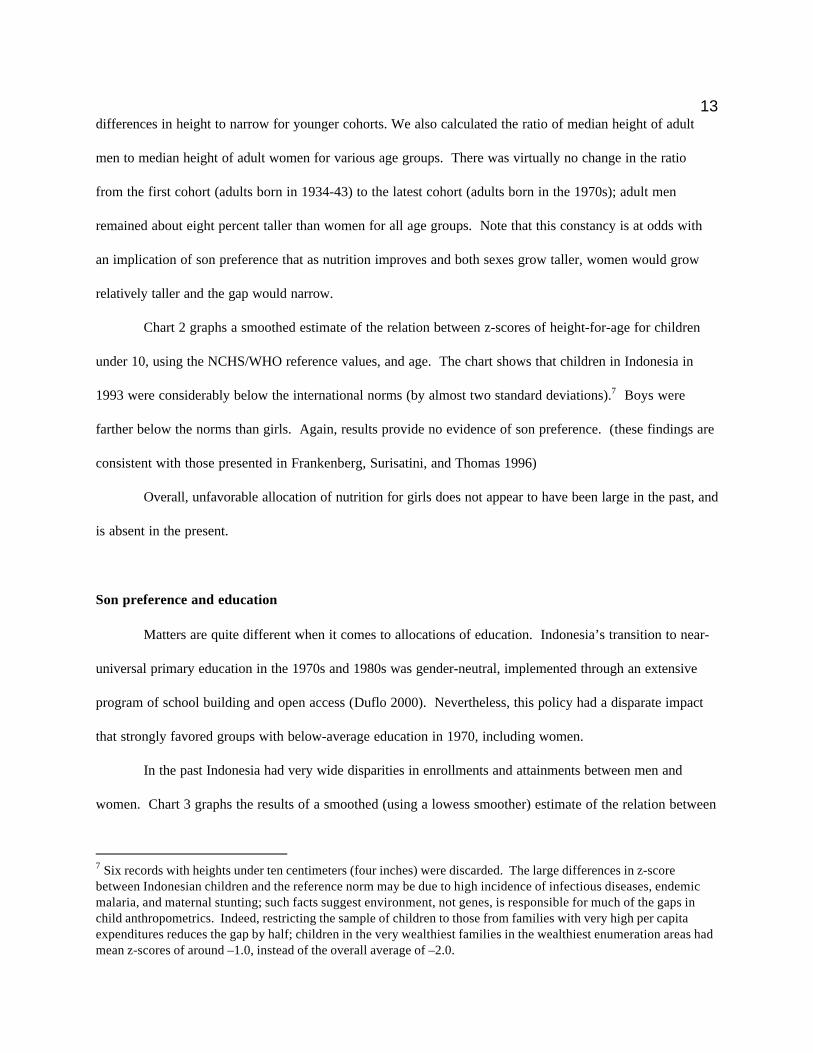
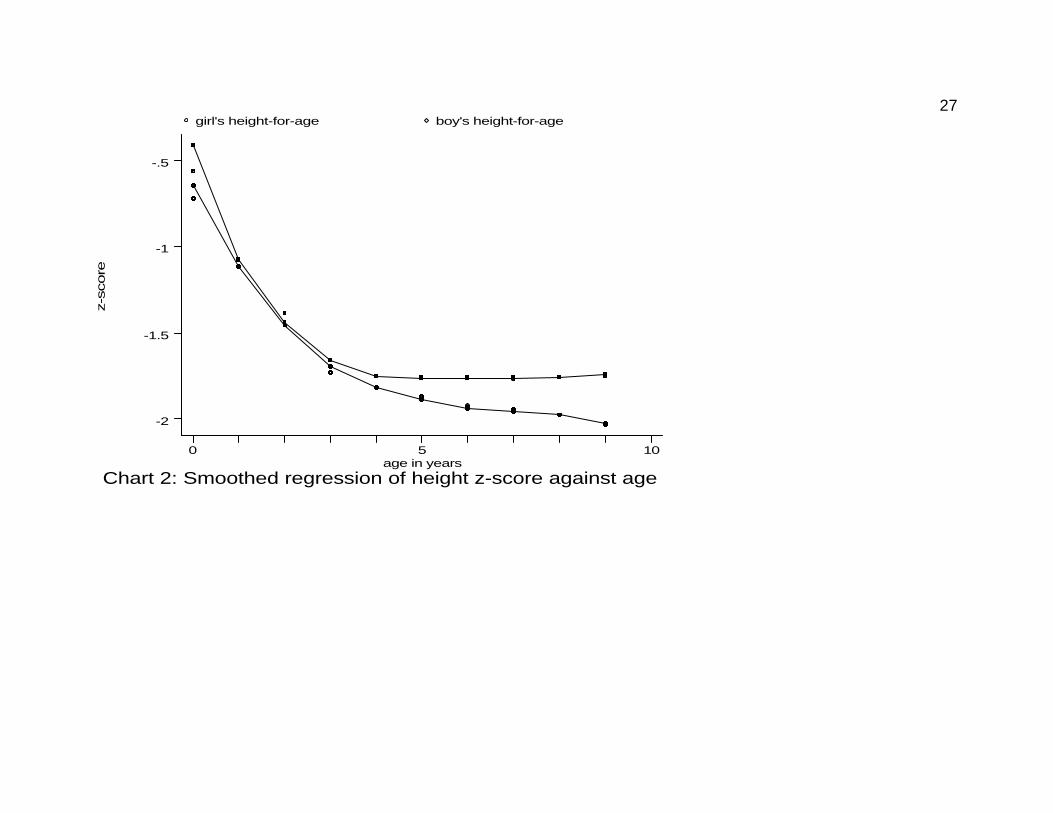
Chart 2 graphs a smoothed estimate of the relation between z-scores of height-for-age for children
under 10, using the NCHS/WHO reference values, and age. The chart shows that children in Indonesia in
1993 were considerably below the international norms (by almost two standard deviations).7 Boys were
farther below the norms than girls. Again, results provide no evidence of son preference. (these findings are
consistent with those presented in Frankenberg, Surisatini, and Thomas 1996)
Overall, unfavorable allocation of nutrition for girls does not appear to have been large in the past, and
is absent in the present.
Son preference and education
Matters are quite different when it comes to allocations of education. Indonesia’s transition to near-
universal primary education in the 1970s and 1980s was gender-neutral, implemented through an extensive
program of school building and open access (Duflo 2000). Nevertheless, this policy had a disparate impact
that strongly favored groups with below-average education in 1970, including women.
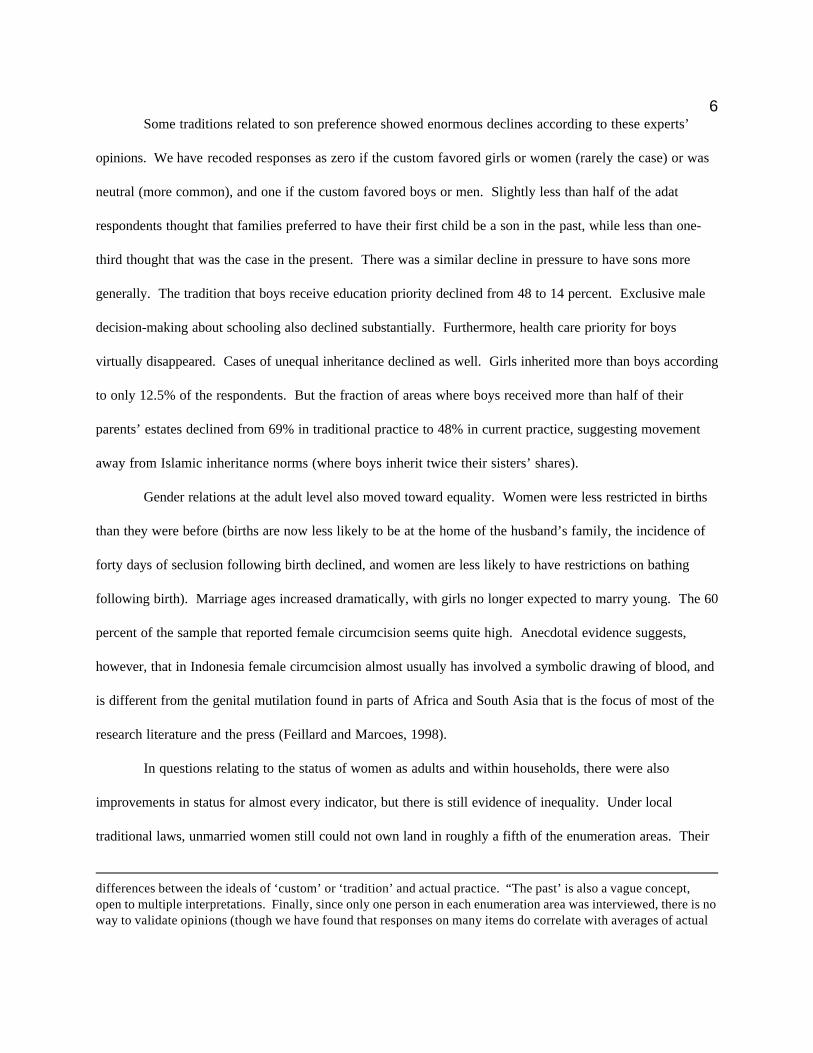
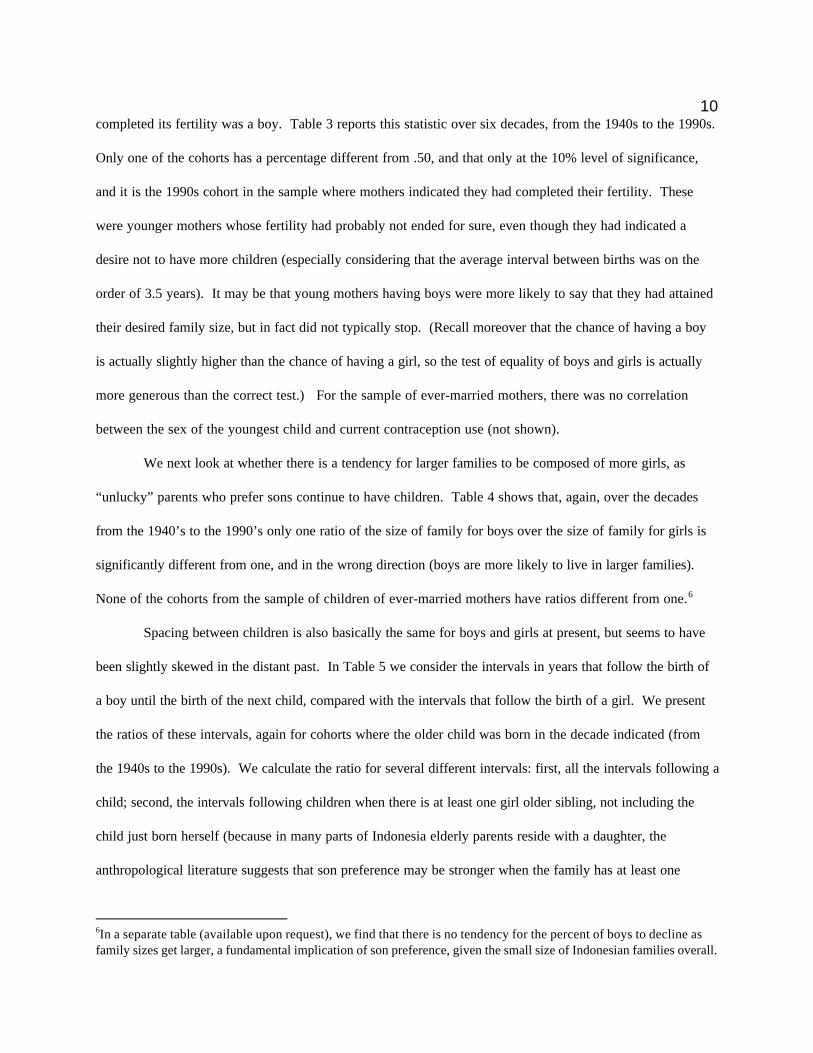
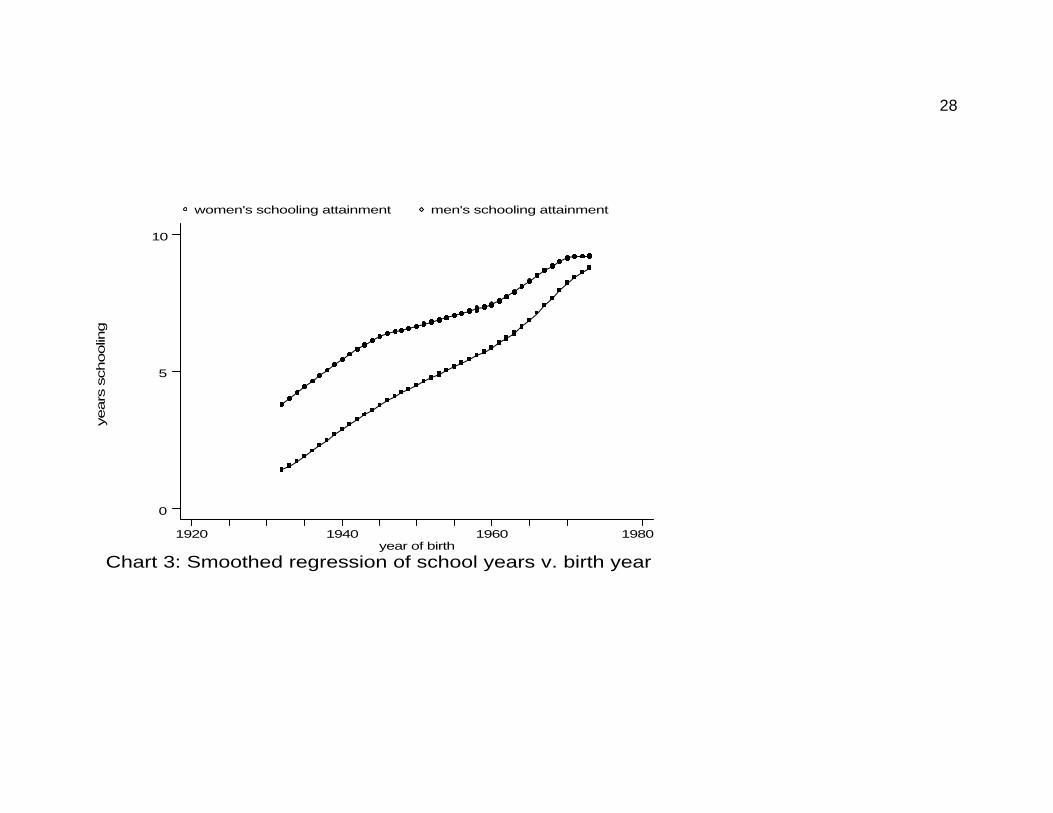
In the past Indonesia had very wide disparities in enrollments and attainments between men and
women. Chart 3 graphs the results of a smoothed (using a lowess smoother) estimate of the relation between
7 Six records with heights under ten centimeters (four inches) were discarded. The large differences in z-scorebetween Indonesian children and the reference norm may be due to high incidence of infectious diseases, endemicmalaria, and maternal stunting; such facts suggest environment, not genes, is responsible for much of the gaps inchild anthropometrics. Indeed, restricting the sample of children to those from families with very high per capitaexpenditures reduces the gap by half; children in the very wealthiest families in the wealthiest enumeration areas hadmean z-scores of around –1.0, instead of the overall average of –2.0.
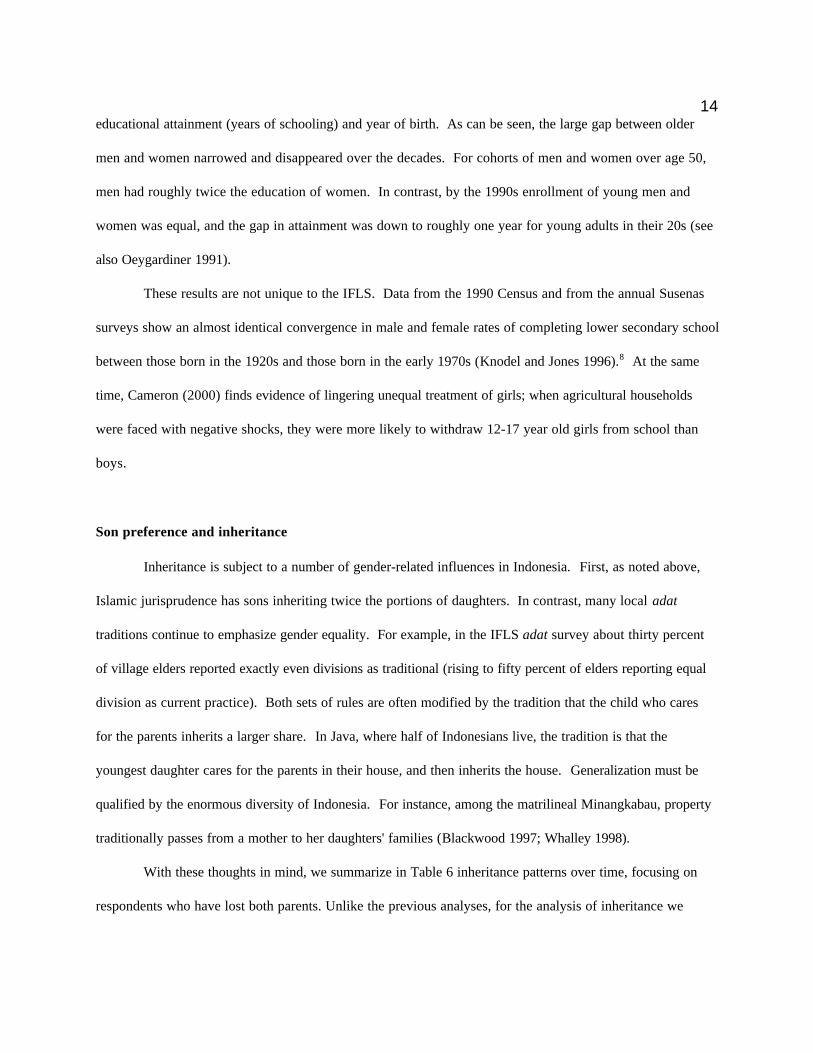
14educational attainment (years of schooling) and year of birth. As can be seen, the large gap between older
men and women narrowed and disappeared over the decades. For cohorts of men and women over age 50,
men had roughly twice the education of women. In contrast, by the 1990s enrollment of young men and
women was equal, and the gap in attainment was down to roughly one year for young adults in their 20s (see
also Oeygardiner 1991).
These results are not unique to the IFLS. Data from the 1990 Census and from the annual Susenas
surveys show an almost identical convergence in male and female rates of completing lower secondary school
between those born in the 1920s and those born in the early 1970s (Knodel and Jones 1996).8 At the same
time, Cameron (2000) finds evidence of lingering unequal treatment of girls; when agricultural households
were faced with negative shocks, they were more likely to withdraw 12-17 year old girls from school than
boys.
Son preference and inheritance
Inheritance is subject to a number of gender-related influences in Indonesia. First, as noted above,
Islamic jurisprudence has sons inheriting twice the portions of daughters. In contrast, many local adat
traditions continue to emphasize gender equality. For example, in the IFLS adat survey about thirty percent
of village elders reported exactly even divisions as traditional (rising to fifty percent of elders reporting equal
division as current practice). Both sets of rules are often modified by the tradition that the child who cares
for the parents inherits a larger share. In Java, where half of Indonesians live, the tradition is that the
youngest daughter cares for the parents in their house, and then inherits the house. Generalization must be
qualified by the enormous diversity of Indonesia. For instance, among the matrilineal Minangkabau, property
traditionally passes from a mother to her daughters' families (Blackwood 1997; Whalley 1998).
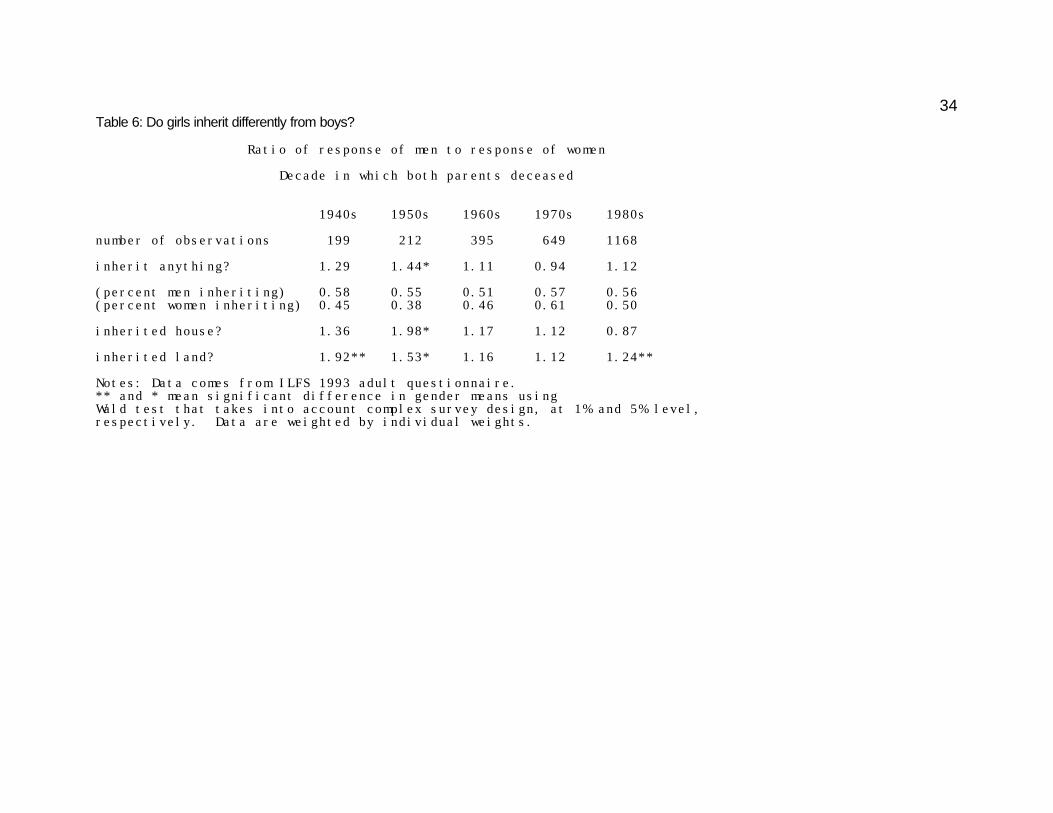
With these thoughts in mind, we summarize in Table 6 inheritance patterns over time, focusing on
respondents who have lost both parents. Unlike the previous analyses, for the analysis of inheritance we
15stratify our sample based on the decade of the most recent death of a parent (as opposed to the age of the
child). Thus, we are looking at trends in inheritances that took place in the 1950s through the 1980-1993
period. The table presents the proportion of sons and daughters who have received any inheritance, and
whether they received a house or land as inheritance.9
The basic results are clear. Differences between sons and daughters are significant for the earliest
decade, and not for the later decades. For people who lost their parents in the 1950s, sons were more likely
to have a positive inheritance than were daughters (58 vs. 45 percent). Somewhat consistent with the
Javanese custom of younger daughters inheriting the house, the gap in home inheritance was smaller in
absolute terms, though the relative gap remained quite large. At the same time, consistent with gender
discrimination, sons were far more likely to inherit land than were their sisters. The results on land
inheritance are similar to the patterns Estudillo, et al., (1999) reported for the Philippines.
These gaps declined over the next 40 years. By the 1980-1993 period, the gap in inheriting the family
home disappeared and men were only 5 percentage points more likely to inherit land than were their sisters.
Given that the absolute share of men who inherited land actually declined from 50 to 45 percent (presumably
due in part to urbanization), it is remarkable that the proportion of daughters who inherited land rose from 29
to 40 percent. These results contrast sharply to the Philippines results, where the two-to-one advantage of
sons over daughters in land inheritance remained from mid-century till the 1990s (Estudillo, Quisumbing, and
Otsuka 1999). Thus, consistent with the findings for education, Indonesia exhibited substantial gender
discrimination in inheritance in the 1950s and 1960s, but the gender gap shrank markedly by the 1980s and
1990s. At the same time, economically and statistically significant gender gaps in inheritances remained at the
end of our study period.10
8 We are grateful to Minnie Ames for verifying this using the pooled 1993-1996 Susenas data.9 Rupiah figures valuing inheritances suffer from problems of consistency across responses, given the history ofoften high inflation, and from an extremely high number of non-responses.
10 Our measures of inheritance leave off transfers to children while the parents were still alive. Thus, it is possiblethat the inheritance gap in favor of sons was counterbalanced by higher in vivo transfers to daughters. Similarly, the
16
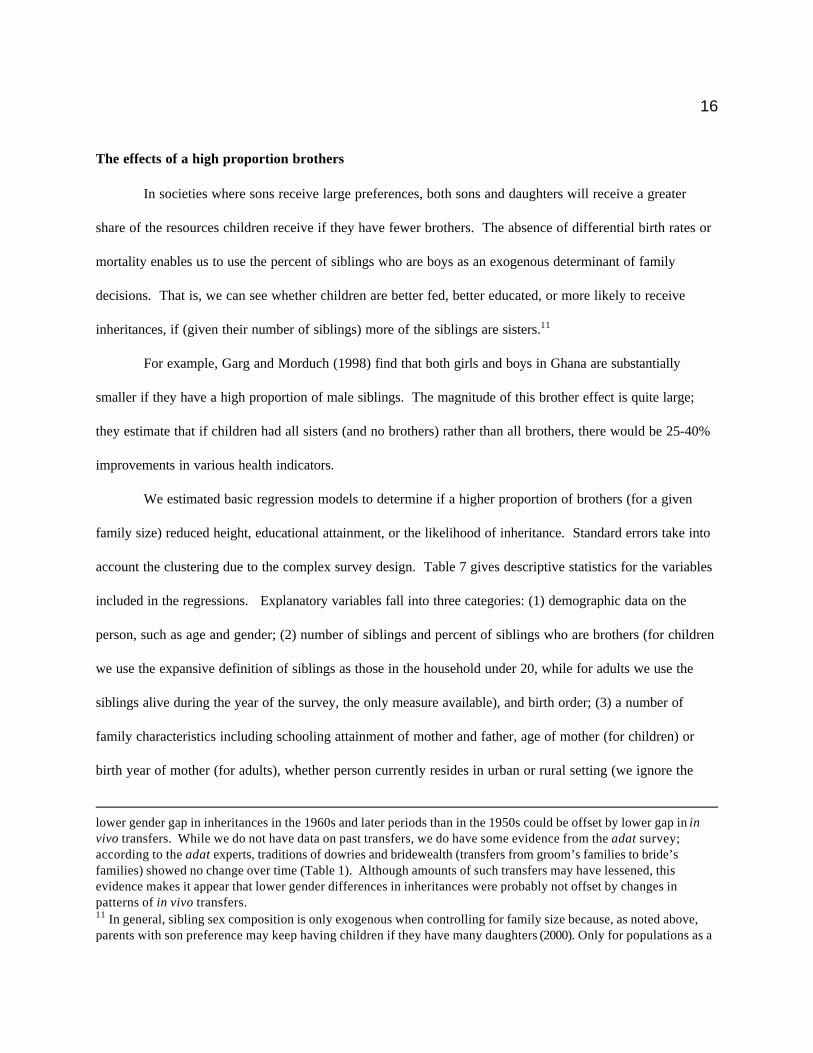
The effects of a high proportion brothers
In societies where sons receive large preferences, both sons and daughters will receive a greater
share of the resources children receive if they have fewer brothers. The absence of differential birth rates or
mortality enables us to use the percent of siblings who are boys as an exogenous determinant of family
decisions. That is, we can see whether children are better fed, better educated, or more likely to receive
inheritances, if (given their number of siblings) more of the siblings are sisters.11
For example, Garg and Morduch (1998) find that both girls and boys in Ghana are substantially
smaller if they have a high proportion of male siblings. The magnitude of this brother effect is quite large;
they estimate that if children had all sisters (and no brothers) rather than all brothers, there would be 25-40%
improvements in various health indicators.
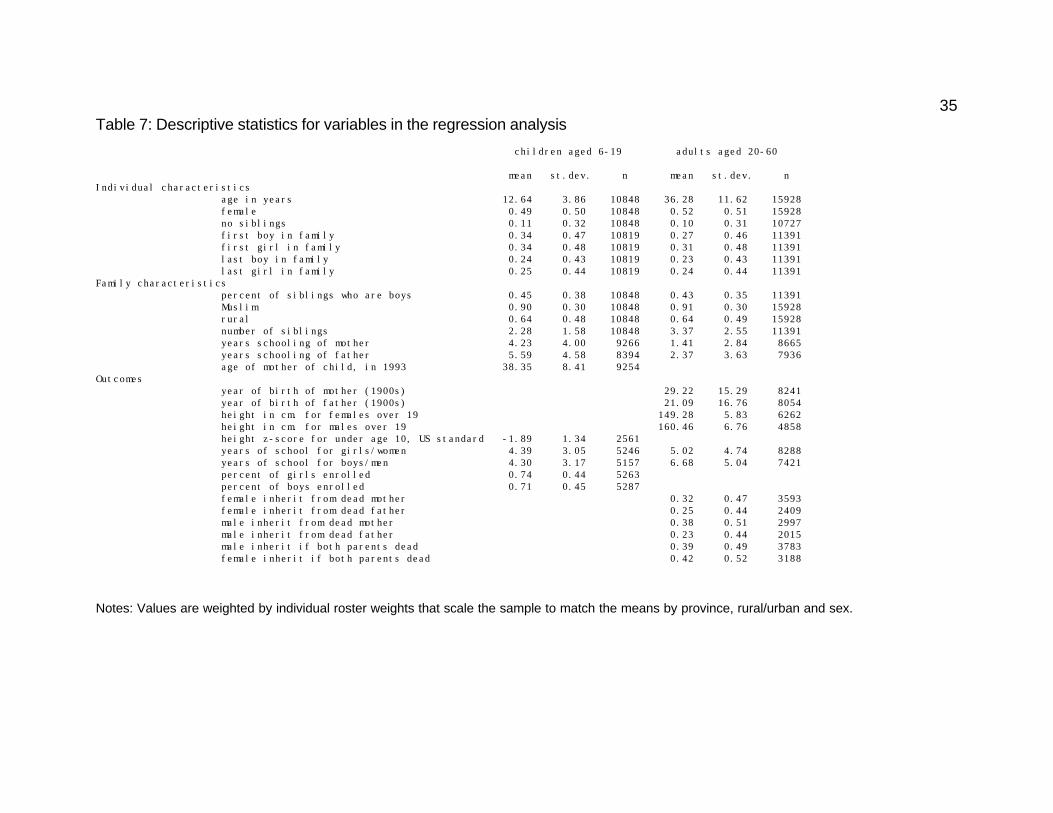
We estimated basic regression models to determine if a higher proportion of brothers (for a given
family size) reduced height, educational attainment, or the likelihood of inheritance. Standard errors take into
account the clustering due to the complex survey design. Table 7 gives descriptive statistics for the variables
included in the regressions. Explanatory variables fall into three categories: (1) demographic data on the
person, such as age and gender; (2) number of siblings and percent of siblings who are brothers (for children
we use the expansive definition of siblings as those in the household under 20, while for adults we use the
siblings alive during the year of the survey, the only measure available), and birth order; (3) a number of
family characteristics including schooling attainment of mother and father, age of mother (for children) or
birth year of mother (for adults), whether person currently resides in urban or rural setting (we ignore the
lower gender gap in inheritances in the 1960s and later periods than in the 1950s could be offset by lower gap in invivo transfers. While we do not have data on past transfers, we do have some evidence from the adat survey;according to the adat experts, traditions of dowries and bridewealth (transfers from groom’s families to bride’sfamilies) showed no change over time (Table 1). Although amounts of such transfers may have lessened, thisevidence makes it appear that lower gender differences in inheritances were probably not offset by changes inpatterns of in vivo transfers.11 In general, sibling sex composition is only exogenous when controlling for family size because, as noted above,parents with son preference may keep having children if they have many daughters (2000). Only for populations as a
17selectivity of migration), and whether person is Muslim. The control variables are also interacted with the
gender of the person. We also experimented with numerous other versions of sibling characteristics,
including younger siblings only, with little change in the basic results.
Table 8 gives the results for five regressions testing son preference by looking at whether the percent
of siblings who are brothers affects outcomes. All of the regressions also include controls for province of
residence (coefficients not reported).
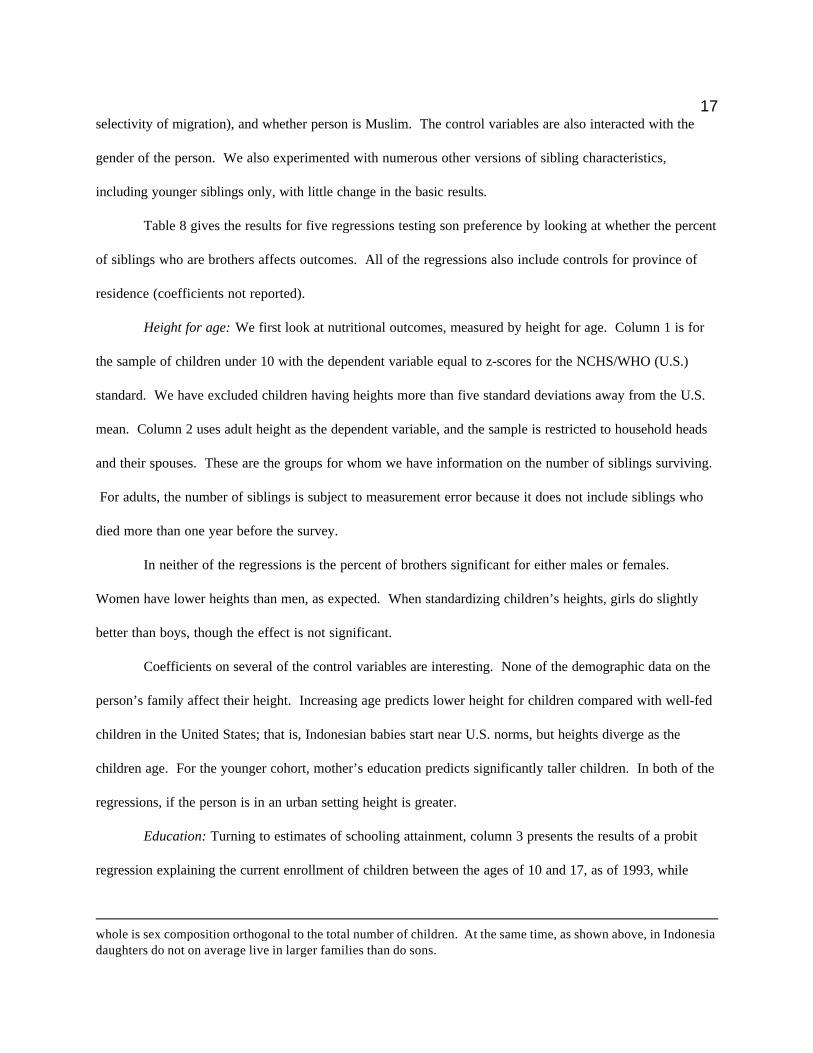
Height for age: We first look at nutritional outcomes, measured by height for age. Column 1 is for
the sample of children under 10 with the dependent variable equal to z-scores for the NCHS/WHO (U.S.)
standard. We have excluded children having heights more than five standard deviations away from the U.S.
mean. Column 2 uses adult height as the dependent variable, and the sample is restricted to household heads
and their spouses. These are the groups for whom we have information on the number of siblings surviving.
For adults, the number of siblings is subject to measurement error because it does not include siblings who
died more than one year before the survey.
In neither of the regressions is the percent of brothers significant for either males or females.
Women have lower heights than men, as expected. When standardizing children’s heights, girls do slightly
better than boys, though the effect is not significant.
Coefficients on several of the control variables are interesting. None of the demographic data on the
person’s family affect their height. Increasing age predicts lower height for children compared with well-fed
children in the United States; that is, Indonesian babies start near U.S. norms, but heights diverge as the
children age. For the younger cohort, mother’s education predicts significantly taller children. In both of the
regressions, if the person is in an urban setting height is greater.
Education: Turning to estimates of schooling attainment, column 3 presents the results of a probit
regression explaining the current enrollment of children between the ages of 10 and 17, as of 1993, while
whole is sex composition orthogonal to the total number of children. At the same time, as shown above, in Indonesiadaughters do not on average live in larger families than do sons.
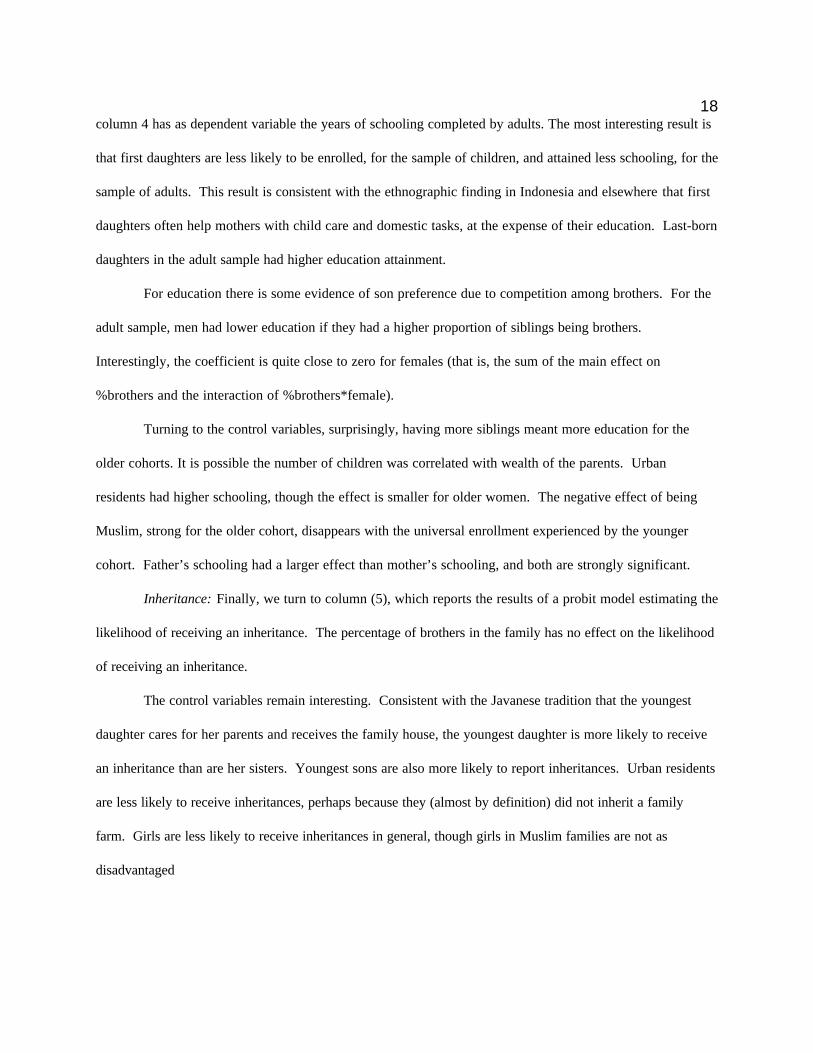
18column 4 has as dependent variable the years of schooling completed by adults. The most interesting result is
that first daughters are less likely to be enrolled, for the sample of children, and attained less schooling, for the
sample of adults. This result is consistent with the ethnographic finding in Indonesia and elsewhere that first
daughters often help mothers with child care and domestic tasks, at the expense of their education. Last-born
daughters in the adult sample had higher education attainment.
For education there is some evidence of son preference due to competition among brothers. For the
adult sample, men had lower education if they had a higher proportion of siblings being brothers.
Interestingly, the coefficient is quite close to zero for females (that is, the sum of the main effect on
%brothers and the interaction of %brothers*female).
Turning to the control variables, surprisingly, having more siblings meant more education for the
older cohorts. It is possible the number of children was correlated with wealth of the parents. Urban
residents had higher schooling, though the effect is smaller for older women. The negative effect of being
Muslim, strong for the older cohort, disappears with the universal enrollment experienced by the younger
cohort. Father’s schooling had a larger effect than mother’s schooling, and both are strongly significant.
Inheritance: Finally, we turn to column (5), which reports the results of a probit model estimating the
likelihood of receiving an inheritance. The percentage of brothers in the family has no effect on the likelihood
of receiving an inheritance.
The control variables remain interesting. Consistent with the Javanese tradition that the youngest
daughter cares for her parents and receives the family house, the youngest daughter is more likely to receive
an inheritance than are her sisters. Youngest sons are also more likely to report inheritances. Urban residents
are less likely to receive inheritances, perhaps because they (almost by definition) did not inherit a family
farm. Girls are less likely to receive inheritances in general, though girls in Muslim families are not as
disadvantaged
19Caveats
Our study is subject to many limitations, each of which presents opportunities for future research.
For example, we focus here on national averages. Future research will describe the heterogeneity across
cultural groups, regions, and levels of educational and economic development (see Soeradji and Hatmadji
1994). It is also important to remember that the IFLS excluded a number of regions experiencing conflict.
Understanding the clustering of cultural norms and of female outcomes is also crucial. Substantial evidence
from other countries indicates that where daughters move to their husbands’ villages, parents have weaker
incentives to invest in their daughter’s health and education (Skinner 1997). A companion paper offers some
preliminary findings that are surprisingly unsupportive of this effect (Levine and Kevane 2001). That is,
Indonesian daughters do not fare relatively worse in cultures where daughters typically move away from their
parents after marriage.
We study various measures going back to between 1933 and 1960. It is possible that the status of
daughters may have been more distinct in earlier periods, and substantial convergence may have occurred
prior to when our data start. Moreover, our data on families from the earlier cohorts used retrospective data,
which may introduce errors. Future research can try to use more data sources drawn from the earlier
periods, though these tend to be fragmentary.
In our discussion we implicitly use numerical equality as a benchmark. Although this standard is
adequate for description, equality may not always be the relevant benchmark for understanding if Indonesian
parents are treating their daughters well compared to their sons. For example, if investing disproportionately
in sons raises the family's income so much that daughters benefit, then unequal investments can be optimal
for daughters. Moreover, if the daughters internalize norms of unequal treatment, they may prefer their
brothers to eat more. Welfare analysis of such situations is fraught with difficulties.
Our analysis does not analyze the separate preferences of fathers and mothers. It is potentially
important to look for such divergences in terms of son preference (as in Thomas, Conterras, and
20Frankenberg 1999). The preferences of others, ranging from older siblings who provide care to neighbors, to
school officials, can also matter.
Our study ends in 1997, and tracks women’s educational success in large part during the strong
economic growth of the New Order regime (1965-1997). It is important to understand whether the financial
crisis of 1997-1998 and the following economic and social collapse disproportionately hurt women
(Frankenberg, Thomas, and Beegle 1999; Thomas and others 1999). Press reports cited disproportionately
large harms for young women. Interestingly, other work by one of the present authors does not find
disproportionate effects on women and girls (Ames, Gertler, and Levine 2000).
Conclusion
We have examined a number of measures of son preference and the relative status of daughters. In
the past, daughters did not have excess mortality, birth of a daughter did not predict patterns of future
childbirth, and women were not relatively malnourished (as indicated by their adult height). At the same time,
norms favored sons in education and inheritance. Moreover, gaps in educational attainment and inheritance
matched the norms, and women had far less education and were less likely to inherit land than were men. In
the spheres where it was present, son preference has weakened in Indonesia. By the 1990s almost all girls
(along with their brothers) attended primary school, and gender gaps in higher levels of education and in
inheritance narrowed.
These findings accord with much of the received understanding of son preference in Indonesia
(Atkinson and Errington 1990; Banister 1999; Central Bureau of Statistics 1978; Dube 1997). But much of
this understanding stems from work done on early census results, showing normal sex ratios. The spread of
inexpensive contraception throughout the archipelago after the 1970s may have led to the emergence of
demographic effects of a latent son preference. Once parents were able to more easily control their fertility,
their preferences may have been more visible. It is important, therefore, to update the older studies with more
21recent data. We find that even with extensive contraception availability and use, there is still no manifestation
of son preference in the demographic data.
The absence of son preference shows that societies can have distinct patterns of age-dependent
gender outcomes; girls may be treated as well as boys, but women face substantial discrimination. In
Indonesia discrimination and unequal treatment of adult women is well established. For example, 93 percent
of managers of formal enterprises are male (higher than the average for nations with similar incomes), and
over 98 percent of village heads are male (Sullivan 1994). Thus, these results do not imply that gender has no
effect on economic or political outcomes in Indonesia; that conclusion would plainly fly in the face of a
considerable body of evidence. But the gendering of economic and social life does not seem to be associated
with some of the basic capacities fostered during childhood; son preference is neither a significant
determinant of nutrition and (by the 1990s) of education. The question then is how equal treatment of boys
and girls becomes unequal treatment of women and men? Our results suggest the need for continued
exploration of the mechanisms that determine son preference and gendered economic behavior more
generally. One might also enquire whether other countries, such as Thailand and Sri Lanka, where son
preference is apparently absent in terms of sex composition of families (Abeykoon 1995; Wongboonsin and
Ruffolo 1995), are also gender-neutral in terms of resource allocations?
Daughters are less disadvantaged in Indonesia than several very populous poor countries: India,
China, Pakistan and Bangladesh. It remains an area of active research to identify the causal mechanisms
underlying these important differences, which may reflect complex economic or social processes: different
agricultural technologies and institutions; different patterns of incipient industrialization; different non-
economic cultural preferences with origins in the distant past; or different equilibria of a common structure,
with the relevant equilibrium in each region selected largely by historical accident. Cross-national analyses are
especially important in view of recent interest in gender equality as a determinant, as well as consequence, of
economic growth.
22References
Ames, Minnie, Paul Gertler, and David Levine. “Boys and Girls in the Indonesian Financial Crisis.” UCBerkeley, 2001.
Abeykoon, A.T.P.L. "Sex Preference in South Asia: Sri Lanka an Outlier." Asia-Pacific Population Journal10, no. 3 (1995): 5-16.
Atkinson, Jane Monnig, and Shelly Errington. Power and Difference: Gender in Island Southeast Asia.Stanford: Stanford University Press, 1990.
Banister, Judith. Son Preference in Asia--Report of a Symposium. : U.S. Census Bureau (www.census.gov/ipc/www/ebspr96a.html), 1999.
Bardhan, Kalpana, and S. Klasen. "Women's welfare and gender equity in emerging Asia." Asian DevelopmentReview (1999).
Blackburn, S. "Women and citizenship in Indonesia." Australian Journal of Political Science 34, no. 2 (1999):189-204.
Blackwood, E. "Women, land, and labor: Negotiating clientage and kinship in a Minangkabau peasantcommunity." Ethnology 36, no. 4 (1997): 277-293.
Butcher, K., and A. Case. "The Effect of Sibling Sex Composition on Women's Education and Earnings."Quarterly Journal of Economic 109, no. 3 (1994): 531-563.
Cameron, L. "The residency decision of elderly Indonesians: A nested logit analysis." Demography 37, no. 1(2000): 17-27.
Cameron, L. , and C. Worswick. "Education Expenditure Responses to Crop Loss in Indonesia: A GenderBias." Economic Development and Cultural Change 49, no. 2 (2000): 351-.
Central Bureau of Statistics. Indonesia Fertility Survey 1976. Principal Report, vol.1. Jakarta, Indonesia,1978.
Cho, Nam-Hoon, and Il-Hyun Kim. "Impact of Induced Abortion on Sex Ratio at Birth in Korea." A paperdelivered at the International Symposium on Issues Related to Sex Preference for Children in theRapidly Changing Demographic Dynamics in Asia, Seoul, Korea, 1994.
Clark, S. "Son preference and sex composition of children: Evidence from India." Demography 37, no. 1(2000): 95-108.
Coale, Ansley, and Judith Banister. "Five Decades of Missing Females in China." Demography 31, no. 3(1994): 459-79.
Devi, D. Radha. "Status of Women in India: A Comparison by State." Asia-Pacific Population Journal 8, no.4 (1993): 59-77.
23Dube, Leela. Women and Kinship: Comparative Perspectives on Gender in South and South-East Asia.
Tokyo: United Nations University Press, 1997.
Duflo, Esther. Schooling and Labor Market Consequences of School Construction in Indonesia: Evidencefrom an Unusual Policy Experiment. , 2000. NBER Working Paper No. W7860.
Estudillo, J., A. Quisumbing, and K. Otsuka. Gender difference in schooling and land inheritance in ruralPhilippines. , 1999.
Frankenberg, E., L. Karoly, P. Gertler, C. Peterson, and Wesley D. The 1993 Indonesian Family Life Survey:Overview and Field Report. Santa Monica, CA: RAND, 1995, DRU-1195.
Frankenberg, Elizabeth, Wayan Surisatini, and Duncan Thomas. Nutritional Status in Indonesia: Evidencefrom the 1993 Indonesian Family Life Survey. : RAND, 1996. Labor and Population Program, 96-01.
Frankenberg, Elizabeth, Duncan Thomas, and Kathleen Beegle. The Real Costs of Indonesia's EconomicCrisis: Preliminary Findings from the Indonesia Family Life Surveys. : RAND, 1999. Labor andPopulation Program, 99-04.
Garg, Ashish, and Jonathan Morduch. "Sibling rivalry and the gender gap: Evidence from child healthoutcomes in Ghana." Journal of Population Economics 11 (1998): 471-93.
Geertz, Hildred. The Javanese Family. Glencoe IL: Free Press, 1961.
Hatley, Barbara. "Imagery and Ideology in Java." In Power and Difference: Gender in Island Southeast Asia,ed. Jane Atkinson and Shelly Errington, 177-207. Stanford: Stanford University Press, 1990.
Hauser, R., and H. D. Kuo. "Does Gender Composition of Sibships Affect Women's Educational Attainment?"Journal of Human Resources 33, no. 3 (1998): 644-657.
Hill, Kenneth, and Dawn Upchurch. "Gender differences in child health: Evidence from the demographic andhealth surveys." Population and Development Review 21, no. 1 (1995): 127-51.
Hong, Moon Sik. "Boy Preference and Imbalance in Sex Ratio in Korea." A paper delivered at the InternationalSymposium on Issues Related to Sex Preference for Children in the Rapidly Changing DemographicDynamics in Asia, Seoul, Korea, 1994.
Hull, Terence H. "Recent Trends in Sex Ratios at Birth in China." Population and Development Review 16,no. 1 (1990): 63-83.
Ihromi, T. Omas. "Inheritance and Equal Rights for Toba Batak Daughters." Law & Society Review 28, no. 4(1994): 525-38.
Kaestner, R. "Are Brothers Really Better? Sibling Sex Composition and Educational Achievement Revisited."Journal of Human Resource 32, no. 2 (1997): 250-284.
Keeler, Ward. "Speaking of Gender in Java." In Power and Difference: Gender in Island Southeast Asia, ed.Jane Atkinson and Shelly Errington, 127-52. Stanford: Stanford University Press, 1990.
24Klasen, Stephan. Family Composition, Gender Preference, and Parental "Investment": Selective Gender Bias
in Mortality among Infants and Children During Early German Development. : University ofMunich, 1999.
Klasen, Stephan. Malnourished and surviving in South Asia, better nourished and dying young in Africa:What can explain this puzzle? : University of Munich, 2000.
Knodel, John, and Gavin W. Jones. "Post-Cairo population policy: does promoting girls' schooling miss themark." Population and Development Review 22 (1996): 683-702.
Levine, David, and Michael Kevane. Are Investments in Daughters Lower When Daughters Move Away?Evidence from Indonesia. : Dept. of Economics, Santa Clara University, 2001.
Mulatsih, S. Women in Rural Indonesia: A Case Study from East Kalimantan. Aachen: Alano Verlag, 1994.
Oeygardiner, M. "Gender Differences in Schooling in Indonesia." Bulletin of Indonesian Economic Studies27, no. 1 (1991): 57-79.
Parker, L. "Engendering school children in Bali." Journal of the Royal Anthropological Institute 3, no. 3(1997): 497-516.
Rahman, Mizanur, and Julie DaVanzo. "Gender Preference and Birth Spacing in Matlab, Bangladesh."Demography 30, no. 3 (1993): 315-22.
Skinner, G. William. "Family Systems and Demographic Processes." In Anthropological Demography:Toward a New Synthesis, ed. David Kertzer and Tom Fricke, 53-114. Chicago: University of ChicagoPress, 1997.
Soeradji, Budi, and Sri Harijati Hatmadji. Issues on sex preference: the case of Indonesia. , 1994. Paperpresented at the International Symposium on Issues Related to Sex Preference for Children in theRapidly Changing Demographic Dynamics in Asia, Seoul, Republic of Korea, 21-24 November 1994.
StataCorp. Stata Statistical Software: Release 6.0. College Station, TX: Stata Corporation, 1999.
Strauss, John, and Duncan Thomas. "Human Resources: Empirical Modeling of Household and FamilyDecisions." In Handbook of Development Economics, ed. Jere Behrman and T.N. Srinivasan, 3A:North-Holland, 1988.
Sullivan, Norma. Masters and Managers: A Study of Gender Relations in Urban Java. St. Leonards Australia:Allen&Unwin, 1994.
Thomas, Duncan, Elizabeth Frankenberg, Kathleen Beegle, and Graciela Teruel. Household budgets,household composition and the crisis in Indonesia: Evidence from longitudinal household surveydata. : RAND, 1999.
United Nations. Population, Gender and Development (draft). New York: Commission on Population andDevelopment, 2000, ESA/P?WP.159.
25Whalley, Lucy. "Urban Minangkabau Muslim Women: Modern Choices, Traditional Concerns in Indonesia."
In Women in Muslim Societies: Diversity within Unity, ed. Herbert L. Bodman and Nayereh EsfahlaniTohidi, 229-250. Boulder, Colo.: Lynne Rienner Publishers, 1998.
Whyte, Martin King. The status of women in preindustrial societies. Princeton, N.J.: Princeton UniversityPress, 1978.
Wieringa, S. "Ibu or the Beast - Gender Interests in 2 Indonesian Women's Organizations." Feminist Review ,no. 41 (1992): 98-113.
Wongboonsin, Kua, and Vipan Prachuabmoh Ruffolo. "Sex Preference for Children in Thailand and SomeOther South-East Asian Countries." Asia-Pacific Population Journal 10 (1995): 43-62.
heig
ht in
cm
.
Chart 1: Smoothed regression of height v. birth yearyear of birth
woman height man height
1920 1940 1960 1980
145
150
155
160
165
27z-s
core
Chart 2: Smoothed regression of height z-score against age age in years
girl's height-for-age boy's height-for-age
0 5 10
-2
-1.5
-1
-.5
28years
schoolin
g
Chart 3: Smoothed regression of school years v. birth yearyear of birth
women's schooling attainment men's schooling attainment
1920 1940 1960 1980
0
5
10
29
Table 1: Are there more boys than girls?
% boys of children under 5 alive in year indicated (4) (1) (2) (3) 1997 1973 1983 1993 (under age 3)
% boys n % boys n % boys n % boys n
all children 0.50 1443 0.49 3643 0.51 3489 0.51 1192
age of child0 0.54 336 0.49 647 0.52 526 0.51 3581 0.49 293 0.49 669 0.52 608 0.53 4422 0.53 272 0.51 637 0.51 595 0.49 3923 0.47 204 0.46 613 0.55* 615 . 04 0.46 197 0.49 528 0.47 565 . 05 0.43 141 0.50 549 0.51 580 . 0
Notes: Columns (1), (2) and (3) count children aged five and under who were alive in January of 1973, 1983, and 1993, asreported in the pregnancy history administered to 4890 women in the 1993 IFLS. Column (4) counts children aged three andunder who were alive in January of 1997 as reported in the pregnancy history administered to 3142 women in the 1997 IFLS.Table uses weights assigned to individual mothers.* indicates that the number of boys was different from the number of girls at the 5% level. Similar results obtain intesting for the 1.05 ratio of boys to girls.
30
Table 2: Do girls die more frequently than boys?
Percent of deaths that are boys
(1) children (2) children (3) children (4) children born in 1960s born in 1970s born in 1980s born in 1990s
% boys n % boys n % boys n % boys n age at death
infant 0.63** 108 0.59* 415 0.55 521 0.56 251
child aged 1-5 0.42 73 0.51 241 0.46 238 0.46 39
Notes: Columns 1,2 and 3 are derived from the pregnancy history administered to 4890 women in the 1993 IFLS. Column 4combines the reported deaths from the 1993 IFLS and the pregnancy history administered to 3142 women in the 1997 IFLS.Table uses weights assigned to individual mothers.** and * mean significantly different from .5 at the 1% and 5% level, respectively, in a two-sided t test.n = # of deceased children.
31Table 3: Are youngest children more often boys? Percent of youngest children who are boys
age group of child
1940s 1950s 1960s 1970s 1980s 1990s
% boys n % boys n % boys n % boys n % boys n % boys n
youngest childin family ofhousehold heador spouse 0.50 1841 0.50 2544 0.50 3383 0.48* 2407
youngest childof ever-marriedmother (when ageover 4) 0.49 461 0.49 1640 youngest childof ever-marriedmothers (whensaid stopped) 0.49 460 0.49 1992 0.53 1976
Notes: Table uses two sources: row (a) counts the percent boys of youngest siblings of the families of household heads andtheir spouses, using their responses to questions about siblings (so siblings do not include deceased siblings); rows (b)and (c) count the percent boys of youngest children of ever-married mothers who had completed fertility, determined in (b)by having the youngest son over four years of age, and in (c) by having responded negatively to a question about desire formore children.Observations are weighted using household weights.Cells with n<30 have been excluded* indicates significantly different from .5125 (the normal proportion of boys) at the 5% level, in a two-sided t test thattakes into account the complex survey design (so no differences significant).
32Table 4: Do girls live in bigger families?
Ratio of number of children in family for boys to number for girls
age group of child
(1) (2) (3) (4) (5) (6) 1940s 1950s 1960s 1970s 1980s 1990s
(a) siblings ofhousehold headsand spouses 1.02 0.99 1.00 1.04**
n 9456 14680 14440 6704
(b) families of evermarried mothers 1.00 1.01 1.02 1.02
n 1076 4932 6812 2341
Notes: Row (a) uses data on siblings of household head and spouses.Row (b) uses data from children of ever-married mothers, and includes families that have not completed fertility.Mean size of family calculated using household weights.** indicates that size of family of girls is different from size of families of boys at 1% level of significance, using aWald test for differences in means that takes into account complex survey design.
33Table 5: After a boy, do parents wait longer to have another child? Ratio of mean interval, in years, until next child following birth of a son to years following birth of a daughter
age cohort of older child (1) (2) (3) (4) (5) (6) 1940s 1950s 1960s 1970s 1980s 1990scategoryfamilies of heads and spouses
between all children 1.04 1.04* 1.02 0.92** 1.00 1.00 1.00 1.00
7426 11932 10894 4230
when at least one girl 1.00 1.02 1.03 0.94** 1.00 1.00 1.00 1.00
2144 6299 7390 3580
families of ever-married women between all children 1.09 0.95 1.00 1.03 1.07 0.97 0.98 945 4030 4360 287
when at least one girl 1.00 0.94 1.01 0.98 1.00 1.00 1.05 273 1902 2216 163
Notes: In each cell, first number is ratio of mean intervals, second is ratio of median intervals,third is number of observations.Rows (1)-(2) use sample of families of adult heads of households and spouses of heads,Rows (3)-(4) use sample of children of ever-married mothers, from pregnancy history administeredto 4890 women in the 1993 IFLS, excluding intervalswhere the previously born child died prior to conception of the next childIntervals for families with at least one girl include intervals if previously there was a girland not if current child is first girl.If interval less than .66, or zero, or greater than 15, then excluded.Median intervals include intervals after last child; mean intervals do not include last child.No median interval for children born in 1990s, since almost all are youngest child of mother.Intervals calculated using year of birth for rows (1)-(2), and year and month of birth forrows (3)-(4).Mean intervals are constructed using household weights, median intervals are not.*, and ** indicate that interval till the next child following birth of a boy is significantlydifferent from the interval following a girl, at the 5% and 1% level, respectivelyusing a Wald test for differences in means that takes into account complex survey design. For families of ever-married women, none of mediansare significantly different, using a Wilcox ranksum text.
34Table 6: Do girls inherit differently from boys?
Ratio of response of men to response of women
Decade in which both parents deceased
1940s 1950s 1960s 1970s 1980s
number of observations 199 212 395 649 1168
inherit anything? 1.29 1.44* 1.11 0.94 1.12
(percent men inheriting) 0.58 0.55 0.51 0.57 0.56(percent women inheriting) 0.45 0.38 0.46 0.61 0.50
inherited house? 1.36 1.98* 1.17 1.12 0.87
inherited land? 1.92** 1.53* 1.16 1.12 1.24**
Notes: Data comes from ILFS 1993 adult questionnaire.** and * mean significant difference in gender means usingWald test that takes into account complex survey design, at 1% and 5% level,respectively. Data are weighted by individual weights.
35Table 7: Descriptive statistics for variables in the regression analysis
children aged 6-19 adults aged 20-60
mean st.dev. n mean st.dev. nIndividual characteristics age in years 12.64 3.86 10848 36.28 11.62 15928 female 0.49 0.50 10848 0.52 0.51 15928 no siblings 0.11 0.32 10848 0.10 0.31 10727 first boy in family 0.34 0.47 10819 0.27 0.46 11391 first girl in family 0.34 0.48 10819 0.31 0.48 11391 last boy in family 0.24 0.43 10819 0.23 0.43 11391 last girl in family 0.25 0.44 10819 0.24 0.44 11391Family characteristics percent of siblings who are boys 0.45 0.38 10848 0.43 0.35 11391 Muslim 0.90 0.30 10848 0.91 0.30 15928 rural 0.64 0.48 10848 0.64 0.49 15928 number of siblings 2.28 1.58 10848 3.37 2.55 11391 years schooling of mother 4.23 4.00 9266 1.41 2.84 8665 years schooling of father 5.59 4.58 8394 2.37 3.63 7936 age of mother of child, in 1993 38.35 8.41 9254 Outcomes year of birth of mother (1900s) 29.22 15.29 8241 year of birth of father (1900s) 21.09 16.76 8054 height in cm. for females over 19 149.28 5.83 6262 height in cm. for males over 19 160.46 6.76 4858 height z-score for under age 10, US standard -1.89 1.34 2561 years of school for girls/women 4.39 3.05 5246 5.02 4.74 8288 years of school for boys/men 4.30 3.17 5157 6.68 5.04 7421 percent of girls enrolled 0.74 0.44 5263 percent of boys enrolled 0.71 0.45 5287 female inherit from dead mother 0.32 0.47 3593 female inherit from dead father 0.25 0.44 2409 male inherit from dead mother 0.38 0.51 2997 male inherit from dead father 0.23 0.44 2015 male inherit if both parents dead 0.39 0.49 3783 female inherit if both parents dead 0.42 0.52 3188
Notes: Values are weighted by individual roster weights that scale the sample to match the means by province, rural/urban and sex.

Table 8: The effects of a high proportion brothers(1) (2) (3) (4) (5)Height z-scoredwith WHO/NCHSstandard(children under10)
Height in cm.(adults)
Currentlyenrolled?(children aged 10-17)
Years schooling(adults)
Did inheritanything? (adults)
number of siblings 0.004 0.102 -0.012 0.112 0.000(0.11) (1.36) (1.30) (2.24)* (0.01)
percent siblings who are brothers 0.059 -0.665 -0.041 -0.723 0.081(0.50) (1.16) (1.23) (2.20)* (1.30)
are you only child? 0.042 -0.181 -0.030 -0.337 -0.040(0.42) (0.50) (1.00) (1.35) (0.89)
first born boy 0.075 -0.037 -0.002 -0.286 -0.033(0.78) (0.11) (0.11) (1.34) (0.86)
first born girl -0.112 -0.170 -0.047 -0.580 -0.019(1.13) (0.72) (2.08)* (4.04)** (0.52)
last born boy 0.046 0.010 -0.018 -0.061 0.087(0.54) (0.03) (0.66) (0.24) (2.10)*
last born girl -0.044 -0.102 0.016 0.363 0.109(0.44) (0.39) (0.56) (2.52)* (3.21)**
age in years -0.075 -0.091 -0.202 -0.038 0.010(6.14)** (6.26)** (4.27)** (3.90)** (6.52)**
age squared 2.386 -0.406 0.713 -0.083 -0.021(6.27)** (3.05)** (2.82)** (1.01) (1.39)
Muslim -0.107 -0.775 -0.037 -1.195 0.052(0.91) (1.38) (1.17) (3.42)** (1.06)
urban area 0.298 0.962 0.077 2.343 -0.119(3.90)** (2.92)** (3.40)** (7.78)** (4.07)**
years schooling of mother 0.026 0.054 0.015 0.216 0.012(2.69)** (0.80) (3.52)** (4.93)** (1.77)
years schooling of father 0.012 0.062 0.022 0.405 -0.004(1.33) (1.13) (6.42)** (12.88)** (0.97)
female 0.395 -11.234 0.109 -1.757 -0.376(1.41) (12.94)** (0.32) (3.02)** (2.18)*
number of siblings*female -0.054 -0.072 -0.005 -0.029 -0.000(1.17) (0.75) (0.45) (0.48) (0.03)
percent siblings brothers * female 0.109 0.914 0.048 0.588 -0.061(0.71) (1.29) (1.11) (1.53) (0.78)
age*female 0.032 0.034 -0.020 -0.034 -0.001(2.00)* (1.88) (0.27) (3.72)** (0.53)
age squared * female 0.626 0.049 0.097 -0.062 0.018(1.20) (0.31) (0.25) (0.75) (0.88)
Muslim * female -0.063 0.076 -0.041 -0.036 0.260(0.61) (0.16) (1.27) (0.11) (3.97)**
urban * female 0.082 0.210 0.021 -0.768 -0.057(1.05) (0.61) (0.77) (3.56)** (1.48)
schooling father * female -0.007 -0.022 -0.002 0.047 0.010(0.50) (0.32) (0.56) (1.25) (1.43)
schooling mother * female 0.000 0.003 0.005 0.040 -0.002(0.03) (0.04) (0.90) (0.71) (0.17)
year of death of parent 0.001(0.86)
year of death of parent * female 0.001(1.11)
Constant -2.161 161.506 5.152(7.98)** (177.03)** (7.07)**
Observations 4739 6797 4007 7057 3450R-squared or F-stat 0.12 0.50 F(34,285)=17.13** 0.40 F(36,284)=6.46**Absolute value of t-statistics in parentheses*significant at 5% level; ** significant at 1% levelAll regressions include dummy variables for provinces. Probit results marginal effects; dy/dx for dummy variables is effect of changefrom 0 to 1.