Embed Size (px)
Citation preview
CHANGING CONSUMER PROSPERITYTHE IMPACT OF WEALTH FRAGMENTATION ON THE CONSUMER ENVIRONMENT
Copyright © 2019 The Nielsen Company (US), LLC. Confidential and proprietary. Do not distribute.

2 Copyright © 2019 The Nielsen Company (US), LLC. Confidential and proprietary. Do not distribute.
CONSUMERS FEEL FINANCIALLY FITTERMarkets around the world have faced fluctuating economic conditions in recent years, with many economies experiencing varying degrees of growth or recession. Amid these unpredictable conditions, many experts expected an uptick in consumers’ financial situations and millions of consumers to join the middle class. Conversely, many commentators questioned whether economic progression was proportionate, pointing to growing wealth gaps in many markets. The pundit catchphrase “haves and have-nots” points to a growing divide, where the rich are getting richer and the poor are getting poorer, despite country economic performance.
The Nielsen Changing Consumer Prosperity report reveals consumers’ sentiment toward their financial situations and explores the behaviour and impact on spending, and how this has changed over time.
Globally, the majority (58%) of consumers feel that they are in a better financial position than they were five years ago, but there is also a sizeable proportion of consumers who feel that they are only in survival mode, with sentiment differing considerably by region and country.
¹ Source: Nielsen Global Premiumization Study 2018
58%GLOBAL CONSUMERS FEEL THEY ARE
FINANCIALLY BETTER OFF THAN THEY WERE FIVE YEARS AGO.

3 Copyright © 2019 The Nielsen Company (US), LLC. Confidential and proprietary. Do not distribute.
¹ Source: Nielsen Global Premiumization Study 2018
¹ Source: Nielsen Global Premiumization Study 2018, “Compared to five years ago, are you financially better or worse off today?”
19%GLOBAL CONSUMERS FEEL THEY ARE
FINANCIALLY WORSE OFF THAN THEY WERE FIVE YEARS AGO.
FINANCIAL WELLBEING DOES NOT EQUATE TO WEALTHAsia-Pacific consumers feel the most optimistic about their financial situation, while 70% reporting that they are in a better position today compared with five years ago. Europeans are the least positive, with only 37% of consumers saying they are currently in a firmer financial position.
The findings highlight significant disparities in consumer sentiment across global markets, with many consumers feel that their personal economic circumstances have improved in recent years, numerous others believe they are faring worse.
Nearly one in five global consumers (19%) believe they are in an inferior financial position compared with recent years, with regional differences regarding deteriorating financial standing following a similar pattern to the regions where consumers feel more prosperous. Asia-Pacific consumers have the lowest incidence of consumers feeling worse off, while Europe records the highest.
CONSUMER PERCEPTIONS ABOUT THEIR FINANCIAL WELLBEING ARE STRONGER IN DEVELOPING MARKETS
GLOBAL 58%
ASIA PACIFIC
EUROPE
AFRICA / MIDDLE EAST
LATIN AMERICA
NORTH AMERICA
70%
37%
52%
50%
46%
23%
18%
32%
21%
21%
33%
19%
12%
31%
27%
29%
21%
BETTER OFF ABOUT THE SAME WORSE OFF
4 Copyright © 2019 The Nielsen Company (US), LLC. Confidential and proprietary. Do not distribute.
¹ Source: Nielsen Global Premiumization Study 2018 and ² 2016
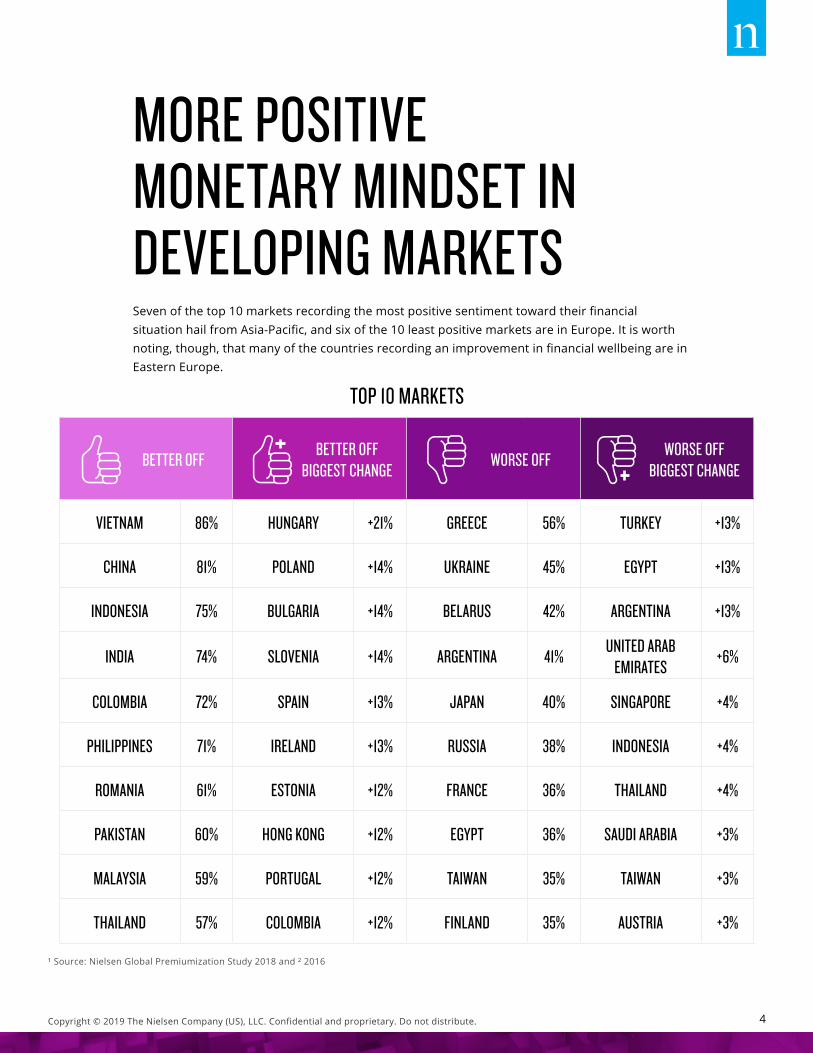
MORE POSITIVE MONETARY MINDSET IN DEVELOPING MARKETSSeven of the top 10 markets recording the most positive sentiment toward their financial situation hail from Asia-Pacific, and six of the 10 least positive markets are in Europe. It is worth noting, though, that many of the countries recording an improvement in financial wellbeing are in Eastern Europe.
BETTER OFF BETTER OFF BIGGEST CHANGE WORSE OFF WORSE OFF
BIGGEST CHANGE
VIETNAM 86% HUNGARY +21% GREECE 56% TURKEY +13%
CHINA 81% POLAND +14% UKRAINE 45% EGYPT +13%
INDONESIA 75% BULGARIA +14% BELARUS 42% ARGENTINA +13%
INDIA 74% SLOVENIA +14% ARGENTINA 41% UNITED ARAB EMIRATES +6%
COLOMBIA 72% SPAIN +13% JAPAN 40% SINGAPORE +4%
PHILIPPINES 71% IRELAND +13% RUSSIA 38% INDONESIA +4%
ROMANIA 61% ESTONIA +12% FRANCE 36% THAILAND +4%
PAKISTAN 60% HONG KONG +12% EGYPT 36% SAUDI ARABIA +3%
MALAYSIA 59% PORTUGAL +12% TAIWAN 35% TAIWAN +3%
THAILAND 57% COLOMBIA +12% FINLAND 35% AUSTRIA +3%
TOP 10 MARKETS
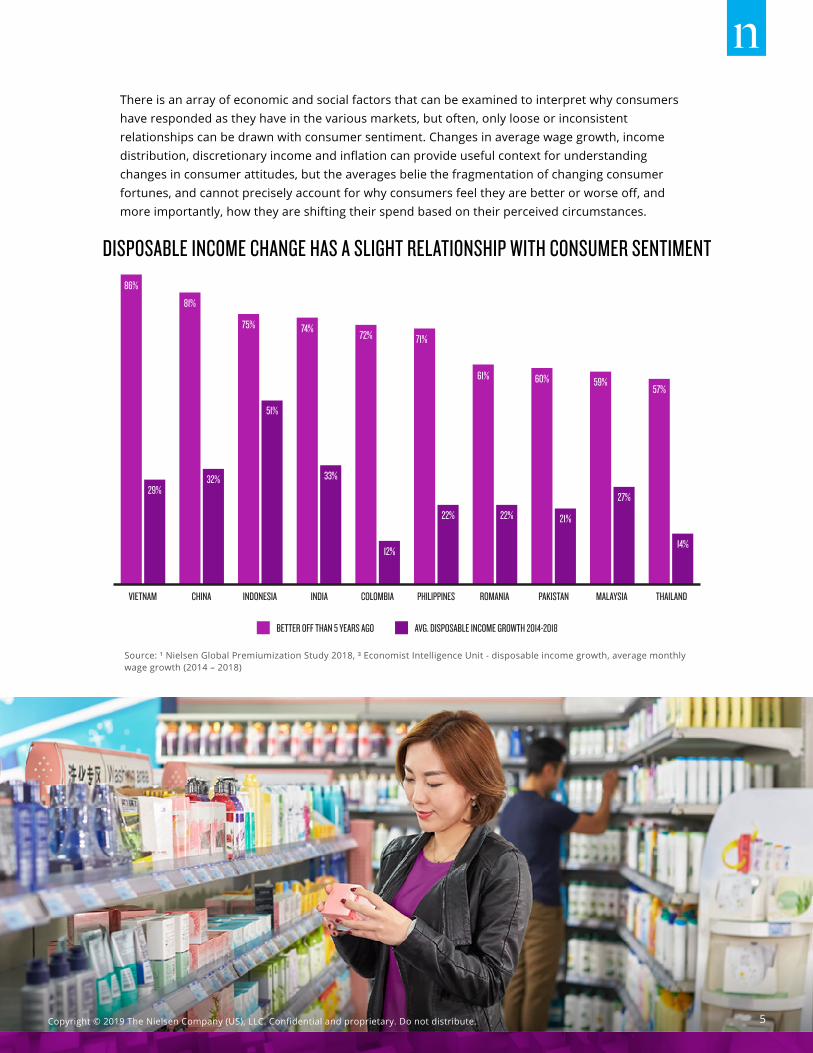
There is an array of economic and social factors that can be examined to interpret why consumers have responded as they have in the various markets, but often, only loose or inconsistent relationships can be drawn with consumer sentiment. Changes in average wage growth, income distribution, discretionary income and inflation can provide useful context for understanding changes in consumer attitudes, but the averages belie the fragmentation of changing consumer fortunes, and cannot precisely account for why consumers feel they are better or worse off, and more importantly, how they are shifting their spend based on their perceived circumstances.
DISPOSABLE INCOME CHANGE HAS A SLIGHT RELATIONSHIP WITH CONSUMER SENTIMENT
BETTER OFF THAN 5 YEARS AGO AVG. DISPOSABLE INCOME GROWTH 2014-2018
86%
81%
75% 74%72% 71%
61% 60% 59%57%
27%
21%22%22%
12%
33%32%29%
51%
14%
VIETNAM CHINA INDONESIA INDIA COLOMBIA PHILIPPINES ROMANIA PAKISTAN MALAYSIA THAILAND
Source: ¹ Nielsen Global Premiumization Study 2018, ³ Economist Intelligence Unit - disposable income growth, average monthly wage growth (2014 – 2018)
5 Copyright © 2019 The Nielsen Company (US), LLC. Confidential and proprietary. Do not distribute.
6 Copyright © 2019 The Nielsen Company (US), LLC. Confidential and proprietary. Do not distribute.
¹ Source: Nielsen Global Premiumization Study 2018, Percentage of global consumers
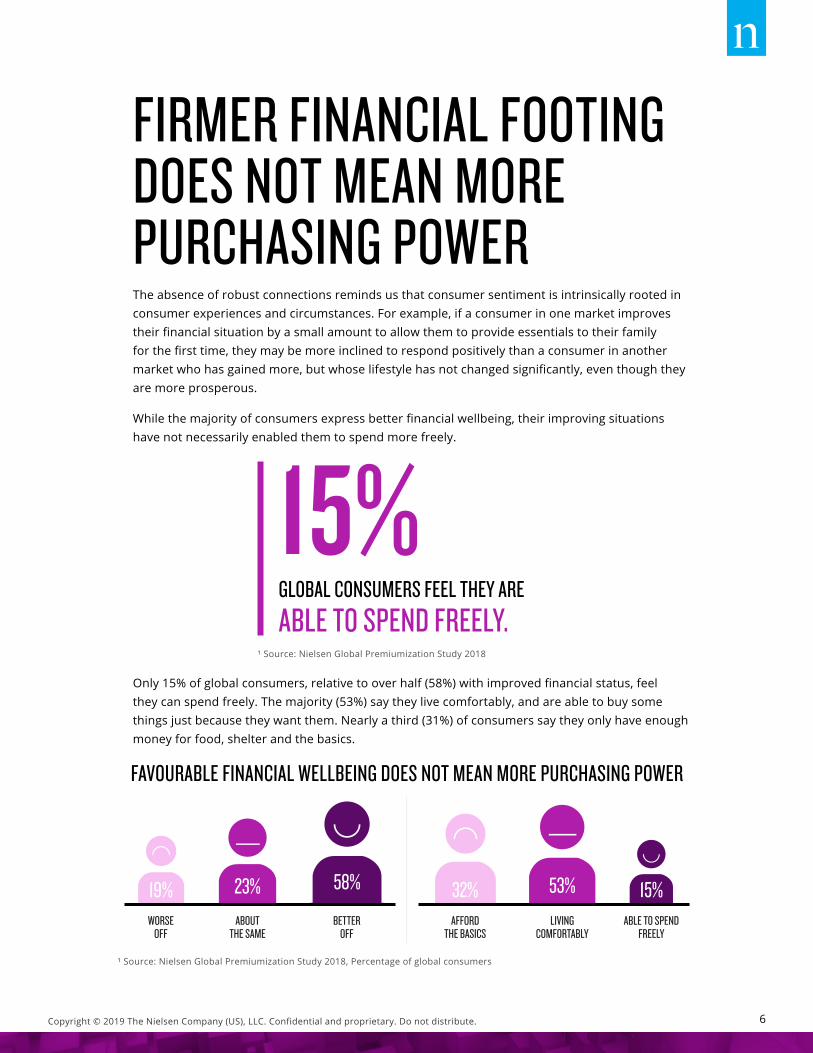
FIRMER FINANCIAL FOOTING DOES NOT MEAN MORE PURCHASING POWERThe absence of robust connections reminds us that consumer sentiment is intrinsically rooted in consumer experiences and circumstances. For example, if a consumer in one market improves their financial situation by a small amount to allow them to provide essentials to their family for the first time, they may be more inclined to respond positively than a consumer in another market who has gained more, but whose lifestyle has not changed significantly, even though they are more prosperous.
While the majority of consumers express better financial wellbeing, their improving situations have not necessarily enabled them to spend more freely.
Only 15% of global consumers, relative to over half (58%) with improved financial status, feel they can spend freely. The majority (53%) say they live comfortably, and are able to buy some things just because they want them. Nearly a third (31%) of consumers say they only have enough money for food, shelter and the basics.
FAVOURABLE FINANCIAL WELLBEING DOES NOT MEAN MORE PURCHASING POWER
¹ Source: Nielsen Global Premiumization Study 2018
15%GLOBAL CONSUMERS FEEL THEY ARE
ABLE TO SPEND FREELY.
WORSEOFF
ABOUTTHE SAME
BETTEROFF
19% 23% 58%
AFFORDTHE BASICS
LIVINGCOMFORTABLY
ABLE TO SPENDFREELY
32% 53% 15%
7 Copyright © 2019 The Nielsen Company (US), LLC. Confidential and proprietary. Do not distribute.
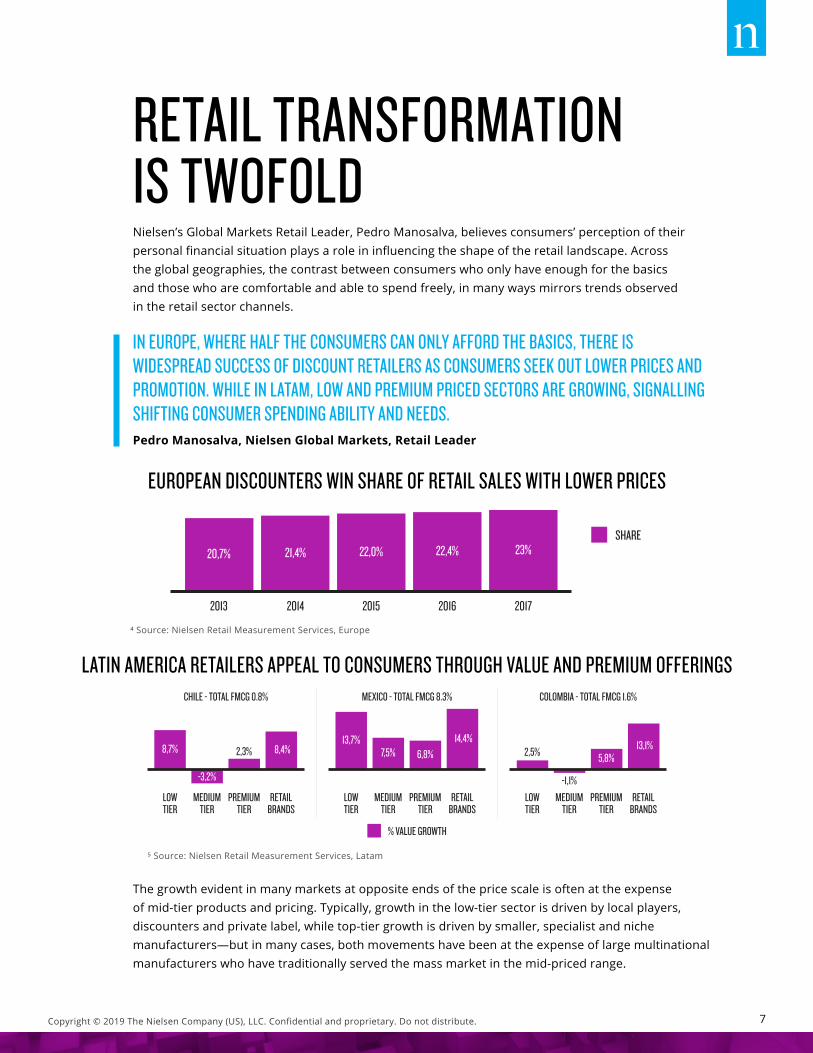
IN EUROPE, WHERE HALF THE CONSUMERS CAN ONLY AFFORD THE BASICS, THERE IS WIDESPREAD SUCCESS OF DISCOUNT RETAILERS AS CONSUMERS SEEK OUT LOWER PRICES AND PROMOTION. WHILE IN LATAM, LOW AND PREMIUM PRICED SECTORS ARE GROWING, SIGNALLING SHIFTING CONSUMER SPENDING ABILITY AND NEEDS.Pedro Manosalva, Nielsen Global Markets, Retail Leader
⁴ Source: Nielsen Retail Measurement Services, Europe
⁵ Source: Nielsen Retail Measurement Services, Latam
RETAIL TRANSFORMATION IS TWOFOLDNielsen’s Global Markets Retail Leader, Pedro Manosalva, believes consumers’ perception of their personal financial situation plays a role in influencing the shape of the retail landscape. Across the global geographies, the contrast between consumers who only have enough for the basics and those who are comfortable and able to spend freely, in many ways mirrors trends observed in the retail sector channels.
The growth evident in many markets at opposite ends of the price scale is often at the expense of mid-tier products and pricing. Typically, growth in the low-tier sector is driven by local players, discounters and private label, while top-tier growth is driven by smaller, specialist and niche manufacturers—but in many cases, both movements have been at the expense of large multinational manufacturers who have traditionally served the mass market in the mid-priced range.
EUROPEAN DISCOUNTERS WIN SHARE OF RETAIL SALES WITH LOWER PRICES
LATIN AMERICA RETAILERS APPEAL TO CONSUMERS THROUGH VALUE AND PREMIUM OFFERINGSCHILE - TOTAL FMCG 0.8%
% VALUE GROWTH
MEXICO - TOTAL FMCG 8.3% COLOMBIA - TOTAL FMCG 1.6%
LOWTIER
MEDIUMTIER
PREMIUMTIER
RETAILBRANDS
8,7% 2,3%
-3,2%
8,4%
LOWTIER
MEDIUMTIER
PREMIUMTIER
RETAILBRANDS
13,7%6,8%7,5%
14,4%
LOWTIER
MEDIUMTIER
PREMIUMTIER
RETAILBRANDS
2,5% 5,8%
-1,1%
13,1%
2014 2015 2016 2017
SHARE20,7% 21,4% 22,0% 22,4% 23%
2013
8 Copyright © 2019 The Nielsen Company (US), LLC. Confidential and proprietary. Do not distribute.
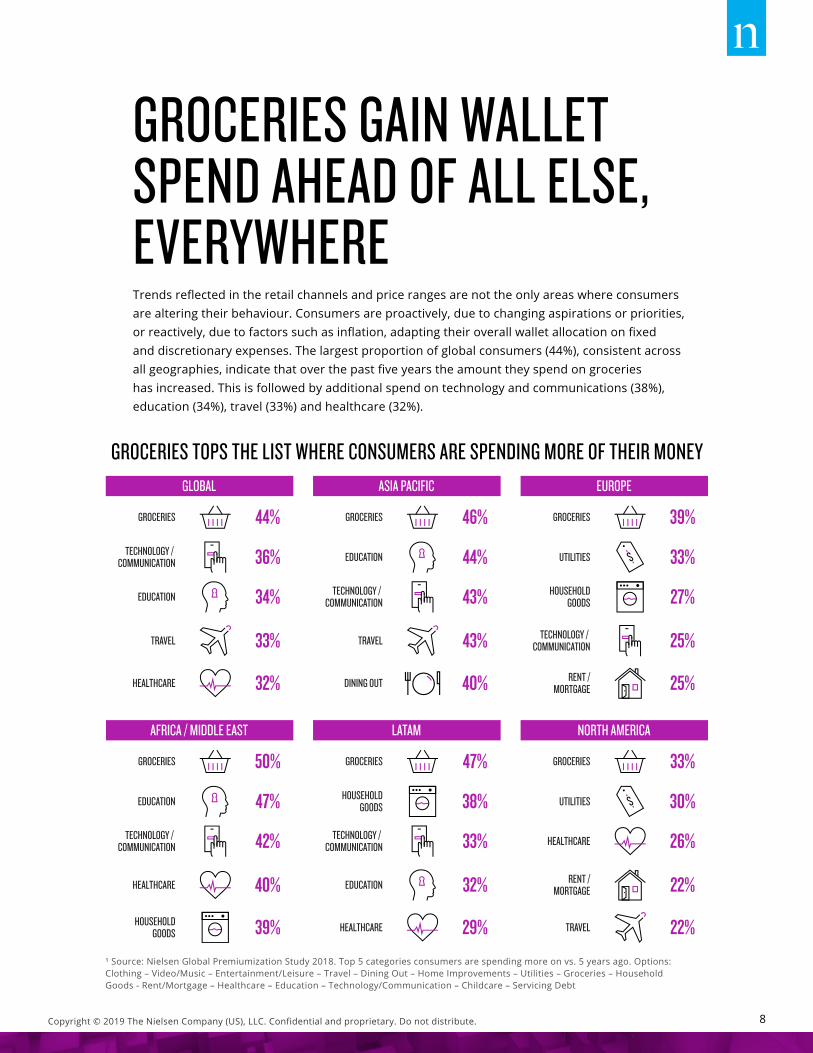
¹ Source: Nielsen Global Premiumization Study 2018. Top 5 categories consumers are spending more on vs. 5 years ago. Options: Clothing – Video/Music – Entertainment/Leisure – Travel – Dining Out – Home Improvements – Utilities – Groceries – Household Goods - Rent/Mortgage – Healthcare – Education – Technology/Communication – Childcare – Servicing Debt
GROCERIES GAIN WALLET SPEND AHEAD OF ALL ELSE, EVERYWHERETrends reflected in the retail channels and price ranges are not the only areas where consumers are altering their behaviour. Consumers are proactively, due to changing aspirations or priorities, or reactively, due to factors such as inflation, adapting their overall wallet allocation on fixed and discretionary expenses. The largest proportion of global consumers (44%), consistent across all geographies, indicate that over the past five years the amount they spend on groceries has increased. This is followed by additional spend on technology and communications (38%), education (34%), travel (33%) and healthcare (32%).
GROCERIES TOPS THE LIST WHERE CONSUMERS ARE SPENDING MORE OF THEIR MONEYGLOBAL
GROCERIES
TECHNOLOGY / COMMUNICATION
EDUCATION
TRAVEL
HEALTHCARE
44%
36%
34%
33%
32%
ASIA PACIFIC
GROCERIES
TECHNOLOGY / COMMUNICATION
EDUCATION
TRAVEL
DINING OUT
46%
44%
43%
43%
40%
EUROPE
GROCERIES
TECHNOLOGY / COMMUNICATION
UTILITIES
HOUSEHOLDGOODS
RENT /MORTGAGE
39%
33%
27%
25%
25%
AFRICA / MIDDLE EAST
GROCERIES
TECHNOLOGY / COMMUNICATION
EDUCATION
HOUSEHOLDGOODS
HEALTHCARE
50%
47%
42%
40%
39%
LATAM
GROCERIES
TECHNOLOGY / COMMUNICATION
HOUSEHOLDGOODS
EDUCATION
HEALTHCARE
47%
38%
33%
32%
29%
NORTH AMERICA
GROCERIES
RENT /MORTGAGE
UTILITIES
HEALTHCARE
TRAVEL
33%
30%
26%
22%
22%
9 Copyright © 2019 The Nielsen Company (US), LLC. Confidential and proprietary. Do not distribute.
Rising spend on technology and communication is also common across all regions, as the scale and utility of connectivity continues to influence the lives of consumers around the world. Paying more for education, travel and healthcare is specific to certain regions and markets as macro change drivers unfold at differing rates in different areas.
Region and market individuality reflect the diverse conditions, circumstances, priorities and aspirations of consumers around the globe. In Asia-Pacific, the growing spend in discretionary areas points to rising confidence, ability and willingness to spend. Asian consumers called out more spend allocated towards travel and dining out over the past five years.
In Europe and North America, the presence of utilities and rent/mortgage payments in the top five areas illustrates tight financial conditions where the cost of living is putting a strain on many.
Rising spend on healthcare in North America is indicative of the aging population where older life stages have impacted spend. Conversely, the immense young generation in Asia and Africa result in education spend featuring highly, within the top five areas, where spend has increased.
In many areas inflation is a core component of the cost. High inflationary markets and environments with foreign exchange volatility, particularly in Africa and Latin America, have resulted in relatively higher scores for the essential groceries and household goods.
9 Copyright © 2019 The Nielsen Company (US), LLC. Confidential and proprietary. Do not distribute.
10 Copyright © 2019 The Nielsen Company (US), LLC. Confidential and proprietary. Do not distribute.
¹ Source: Nielsen Global Premiumization Study 2018. Top 5 categories consumers are willing to pay a premium for (spend more than the category average price)
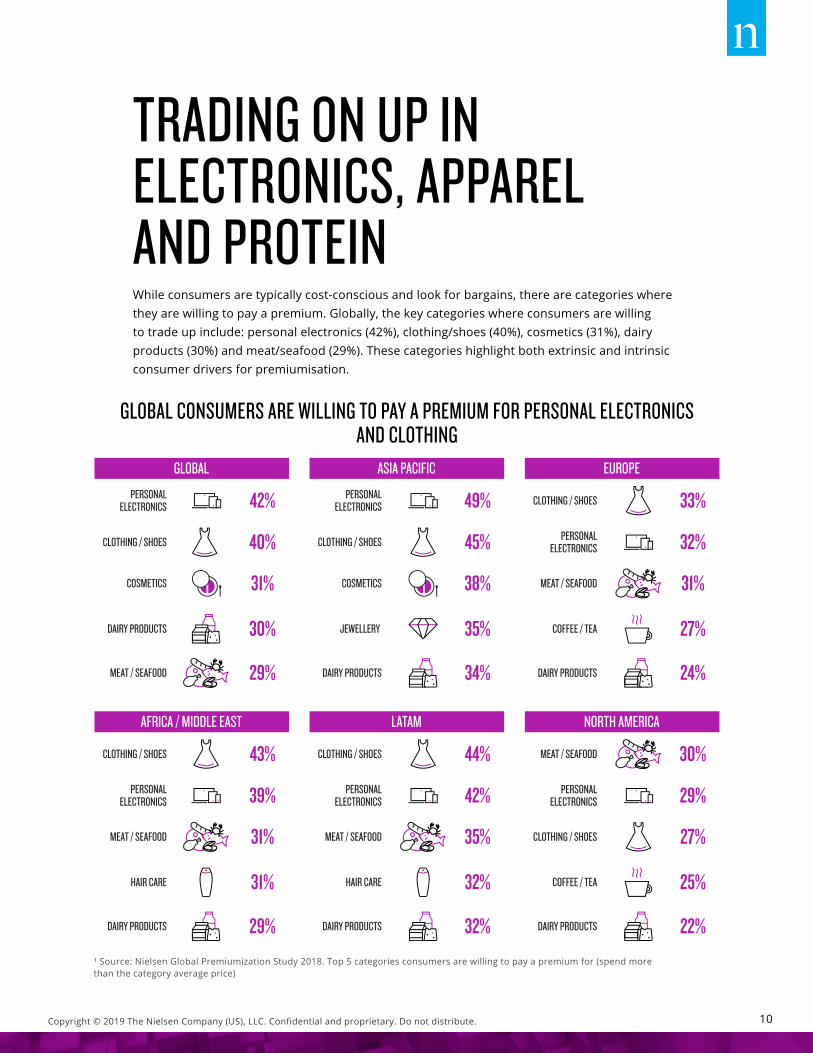
TRADING ON UP IN ELECTRONICS, APPAREL AND PROTEINWhile consumers are typically cost-conscious and look for bargains, there are categories where they are willing to pay a premium. Globally, the key categories where consumers are willing to trade up include: personal electronics (42%), clothing/shoes (40%), cosmetics (31%), dairy products (30%) and meat/seafood (29%). These categories highlight both extrinsic and intrinsic consumer drivers for premiumisation.
GLOBAL CONSUMERS ARE WILLING TO PAY A PREMIUM FOR PERSONAL ELECTRONICS AND CLOTHING
GLOBAL
PERSONALELECTRONICS
CLOTHING / SHOES
COSMETICS
DAIRY PRODUCTS
MEAT / SEAFOOD
42%
40%
31%
30%
29%
ASIA PACIFIC
PERSONALELECTRONICS
COSMETICS
CLOTHING / SHOES
JEWELLERY
DAIRY PRODUCTS
49%
45%
38%
35%
34%
EUROPE
CLOTHING / SHOES
COFFEE / TEA
PERSONALELECTRONICS
MEAT / SEAFOOD
DAIRY PRODUCTS
33%
32%
31%
27%
24%
AFRICA / MIDDLE EAST
CLOTHING / SHOES
MEAT / SEAFOOD
PERSONALELECTRONICS
DAIRY PRODUCTS
HAIR CARE
43%
39%
31%
31%
29%
LATAM
CLOTHING / SHOES
MEAT / SEAFOOD
PERSONALELECTRONICS
HAIR CARE
DAIRY PRODUCTS
44%
42%
35%
32%
32%
NORTH AMERICA
MEAT / SEAFOOD
COFFEE / TEA
PERSONALELECTRONICS
CLOTHING / SHOES
DAIRY PRODUCTS
30%
29%
27%
25%
22%
11 Copyright © 2019 The Nielsen Company (US), LLC. Confidential and proprietary. Do not distribute.
A KEY WATCH-OUT IS TO AVOID FEATURING PRODUCTS THAT CONSUMERS ARE WILLING TO PAY A PREMIUM FOR, OR DISCOUNTING MORE THAN CONSUMERS ARE EXPECTING. IT’S IMPORTANT THAT PROMOTIONS ARE MATCHED TO THE NEEDS OF LOCAL CONSUMERS - PRICE ELASTICITY ANALYSES SHOW WHAT CONSUMERS ARE WILLING TO PAY.Laura McCullough, Nielsen Global Markets, Sales and Marketing Effectiveness Lead
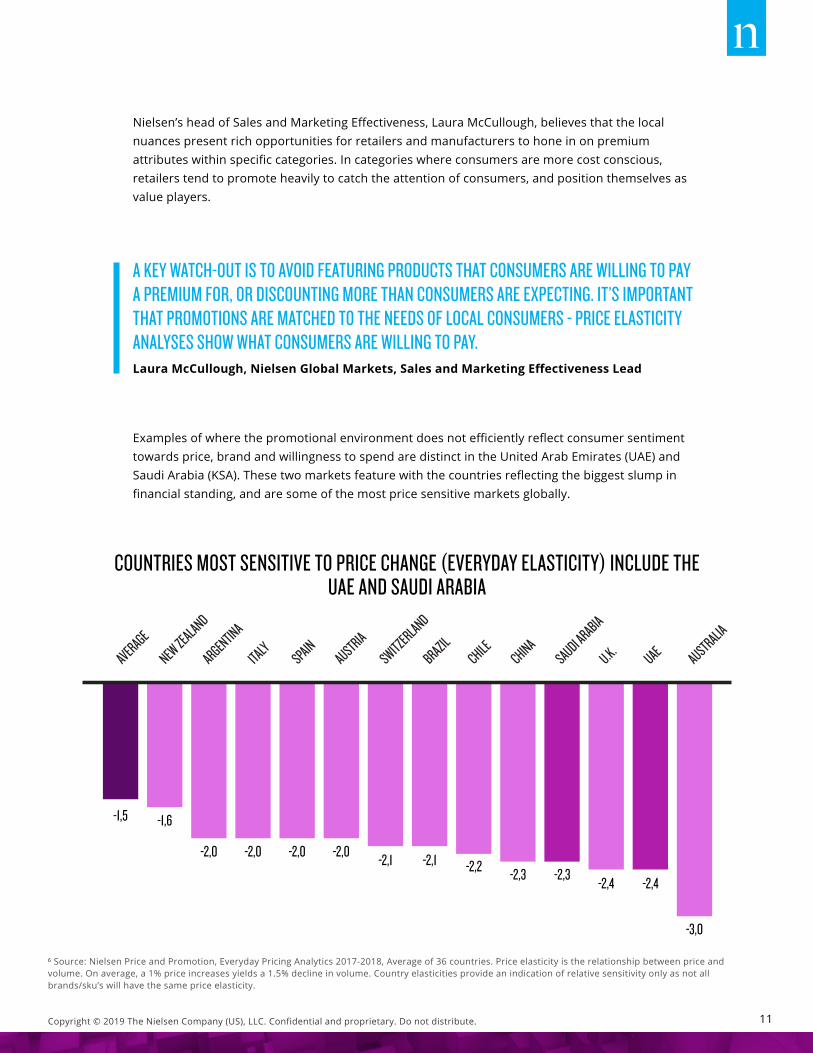
⁶ Source: Nielsen Price and Promotion, Everyday Pricing Analytics 2017-2018, Average of 36 countries. Price elasticity is the relationship between price and volume. On average, a 1% price increases yields a 1.5% decline in volume. Country elasticities provide an indication of relative sensitivity only as not all brands/sku’s will have the same price elasticity.
COUNTRIES MOST SENSITIVE TO PRICE CHANGE (EVERYDAY ELASTICITY) INCLUDE THE UAE AND SAUDI ARABIA
Nielsen’s head of Sales and Marketing Effectiveness, Laura McCullough, believes that the local nuances present rich opportunities for retailers and manufacturers to hone in on premium attributes within specific categories. In categories where consumers are more cost conscious, retailers tend to promote heavily to catch the attention of consumers, and position themselves as value players.
Examples of where the promotional environment does not efficiently reflect consumer sentiment towards price, brand and willingness to spend are distinct in the United Arab Emirates (UAE) and Saudi Arabia (KSA). These two markets feature with the countries reflecting the biggest slump in financial standing, and are some of the most price sensitive markets globally.
AVERAGE
NEW ZEALAND
ARGENTINA
ITALYSPAIN
AUSTRIASWITZERLAND
BRAZILCHILE
CHINASAUDI ARABIA
U.K.UAE AUSTRALIA
-1,5 -1,6
-2,0 -2,0 -2,0 -2,0 -2,1 -2,1 -2,2 -2,3 -2,3 -2,4 -2,4
-3,0
40% EFFICIENCY
60% INEFFICIENT
TOTAL PRODUCT SALES100%
PROMOTED SALES35%
NON PROMOTED SALES65%
NON PROMOTED SALES65%
INCREMENTAL SALES14%
SUBSIDIZED SALES21%
BASE SALES
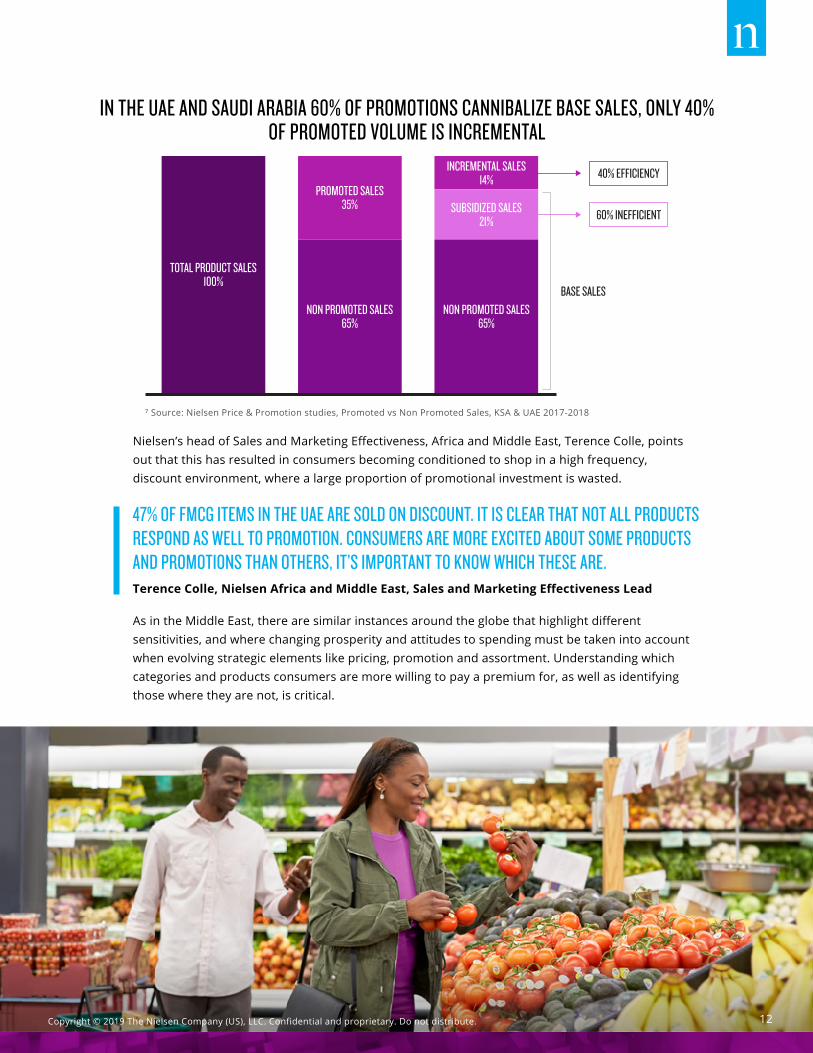
⁷ Source: Nielsen Price & Promotion studies, Promoted vs Non Promoted Sales, KSA & UAE 2017-2018
Nielsen’s head of Sales and Marketing Effectiveness, Africa and Middle East, Terence Colle, points out that this has resulted in consumers becoming conditioned to shop in a high frequency, discount environment, where a large proportion of promotional investment is wasted.
IN THE UAE AND SAUDI ARABIA 60% OF PROMOTIONS CANNIBALIZE BASE SALES, ONLY 40% OF PROMOTED VOLUME IS INCREMENTAL
As in the Middle East, there are similar instances around the globe that highlight different sensitivities, and where changing prosperity and attitudes to spending must be taken into account when evolving strategic elements like pricing, promotion and assortment. Understanding which categories and products consumers are more willing to pay a premium for, as well as identifying those where they are not, is critical.
47% OF FMCG ITEMS IN THE UAE ARE SOLD ON DISCOUNT. IT IS CLEAR THAT NOT ALL PRODUCTS RESPOND AS WELL TO PROMOTION. CONSUMERS ARE MORE EXCITED ABOUT SOME PRODUCTS AND PROMOTIONS THAN OTHERS, IT’S IMPORTANT TO KNOW WHICH THESE ARE.Terence Colle, Nielsen Africa and Middle East, Sales and Marketing Effectiveness Lead
12 Copyright © 2019 The Nielsen Company (US), LLC. Confidential and proprietary. Do not distribute.

13 Copyright © 2019 The Nielsen Company (US), LLC. Confidential and proprietary. Do not distribute.
¹ Source: Nielsen Global Premiumization Study 2018. Bottom 5 categories consumers are willing to pay a premium for (spend more than the category average price)
CEILING FOR PREMIUM PRODUCTS NOT MATCHING PRICE PERCEPTIONLooking at the categories that consumers are least likely to pay more for there are variations by region, however, two categories feature most consistently; carbonated beverages and tobacco. Consumers view products in these categories as value purchases, or they do not associate them with sufficiently differentiated attributes to account for a price premium. Historically, categories and products that have low involvement and investment have been the domain of retail brands or private label, as they provide a natural entry point for consumers looking for more accessible price points. This, however, has changed as retailers expand their private label footprint into broader ranges of products and categories, and many have introduced premium tier private-label offerings, attractive to consumers at the lower end of the premium pricing spectrum.
CONSUMERS ARE LEAST WILLING TO PAY A PREMIUM FOR TOBACCO AND CARBONATED BEVERAGES
GLOBAL ASIA PACIFIC EUROPE
TOBACCO 6% TOBACCO 7% TOBACCO 6%
SALTY SNACKS 11% CARBONATEDBEVERAGES 11% SALTY SNACKS 7%
CEREAL 11% CEREAL 12% CEREAL 8%FROZEN DINNERS /
MEAL STARTERS 11% SALTY SNACKS 11% FROZEN DINNERS / MEAL STARTERS 7%
CARBONATEDBEVERAGES 10% PET FOOD 10% CARBONATED
BEVERAGES 7%
AFRICA / MIDDLE EAST LATAM NORTH AMERICA
CARBONATEDBEVERAGES 11% FROZEN DINNERS /
MEAL STARTERS 13% SUGAR / SUGARSUBSTITUTE 7%
TOBACCO 7% CARBONATEDBEVERAGES 11% BABY DIAPERS /
WIPES 5%ALCOHOL /
SPIRITS 6% TOBACCO 5% TOBACCO 4%
FROZEN DINNERS / MEAL STARTERS 10% BABY FORMULA /
FOOD 11% CEREAL 7%
PET FOOD 9% BABY DIAPERS / WIPES 11% BABY FORMULA /
FOOD 5%
14 Copyright © 2019 The Nielsen Company (US), LLC. Confidential and proprietary. Do not distribute.
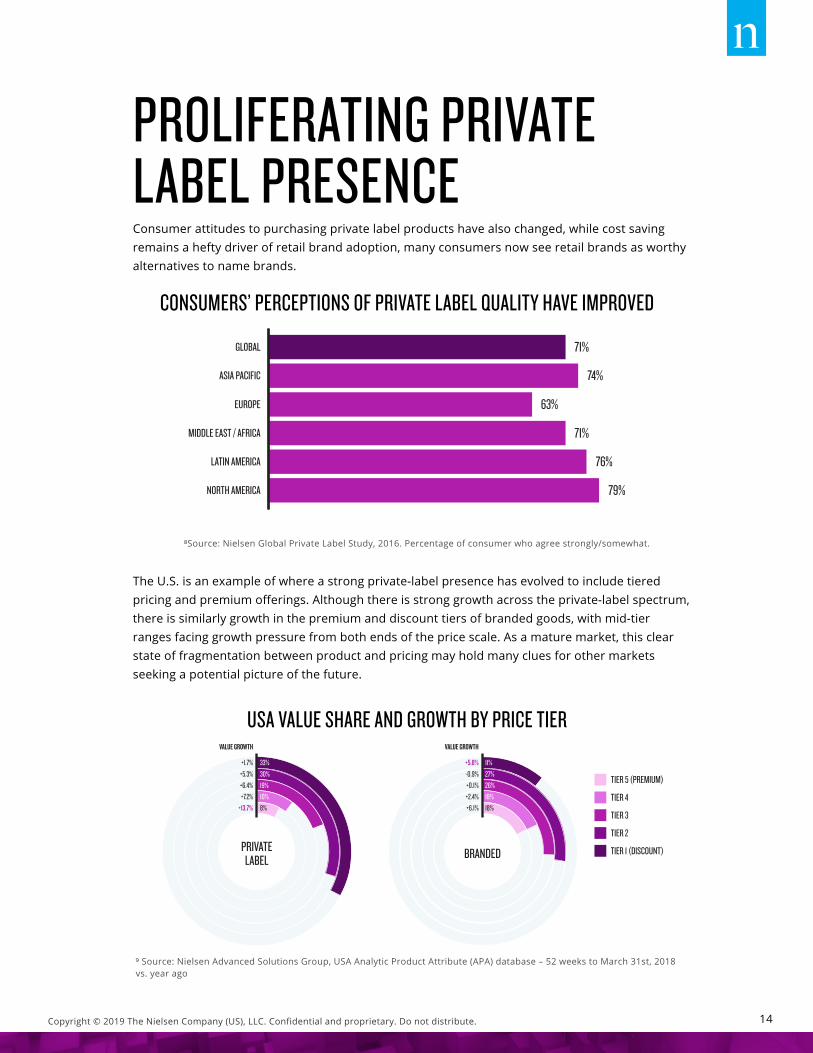
⁸Source: Nielsen Global Private Label Study, 2016. Percentage of consumer who agree strongly/somewhat.
⁹ Source: Nielsen Advanced Solutions Group, USA Analytic Product Attribute (APA) database – 52 weeks to March 31st, 2018 vs. year ago
PROLIFERATING PRIVATE LABEL PRESENCEConsumer attitudes to purchasing private label products have also changed, while cost saving remains a hefty driver of retail brand adoption, many consumers now see retail brands as worthy alternatives to name brands.
The U.S. is an example of where a strong private-label presence has evolved to include tiered pricing and premium offerings. Although there is strong growth across the private-label spectrum, there is similarly growth in the premium and discount tiers of branded goods, with mid-tier ranges facing growth pressure from both ends of the price scale. As a mature market, this clear state of fragmentation between product and pricing may hold many clues for other markets seeking a potential picture of the future.
CONSUMERS’ PERCEPTIONS OF PRIVATE LABEL QUALITY HAVE IMPROVED
USA VALUE SHARE AND GROWTH BY PRICE TIER
GLOBAL
ASIA PACIFIC
EUROPE
MIDDLE EAST / AFRICA
LATIN AMERICA
NORTH AMERICA
71%
74%
63%
71%
76%
79%
TIER 5 (PREMIUM)
TIER 4
TIER 3
TIER 2
TIER 1 (DISCOUNT)
8%10%19%30%33%
VALUE GROWTH
+13.7%+7.2%+6.4%+5.3%+1.7%
18%18%26%27%11%
PRIVATELABEL BRANDED
VALUE GROWTH
+6.1%+2.4%+0.1%-0.9%+5.8%

15 Copyright © 2019 The Nielsen Company (US), LLC. Confidential and proprietary. Do not distribute.
IN EUROPEAN MARKETS, RETAILERS HAVE DEVELOPED A CONSUMER RELATIONSHIP THAT HAS MOVED BEYOND PRICE AND IS ALLOWING THEM TO WIN IN DIFFERENT TIERS AND CATEGORIES.Mike Watkins, Nielsen U.K., Head of Retail Services
10 Source: Nielsen Retail Measurement Services, Thailand, June 2018. Premium price index vs. category average greater than 1.2
IMPROVING FINANCIAL STATUS ENTICES THAI CONSUMERS TO SPEND MORE ON PREMIUM PRODUCTS
In some regions, private label has also been perpetuated by well-defined strategies and a sharp focus by retailers that recognize the diverse consumer views on spending across different categories.
Within the discount retail model there are four clear stages evolving:
1. Retailers enter or grow when there are weak or changing economic conditions.
2. Growth is sustained by following a ‘lowest price’ strategy, supported by new store openings.
3. Share is consolidated by engaging more with customers around quality, as well as price.
4. Shopping trips and sales are accelerated through extended ranges of fresh and chilled foods, and stores are re-imagined as modern, small supermarkets.
While remaining true to their origins of; limited range, primarily private label, proximity retailers, with a low cost operating model.
There remain categories and markets, though, where private label has struggled to penetrate, and in many cases these correspond with markets that are experiencing favourable development in consumer prosperity and spending intent. In Asia, the presence of private label is relatively low compared to other regions, and although dynamics such as strong local value players and traditional trade need to be considered, there is no doubt that the growth of premium offerings, and the future opportunities, can be linked to increasing wealth.
In Thailand, nearly one third (29.9%) of FMCG sales are considered premium and are growing at the expense of mainstream and value offerings. In particular, it is the higher price bands within the premium segment that are driving the expansion. The distribution of consumer spending in Thailand aligns closely with consumers’ attitude to spending, with 23% of Thai consumers saying they are able to spend freely.
LOWER PREMIUM:48% (-2.9%)
HIGH PREMIUM:27% (+5.1%)
AFFORDABLE LUXURY:12% (+8.3%)
MID PREMIUM:14% (-2.4%)
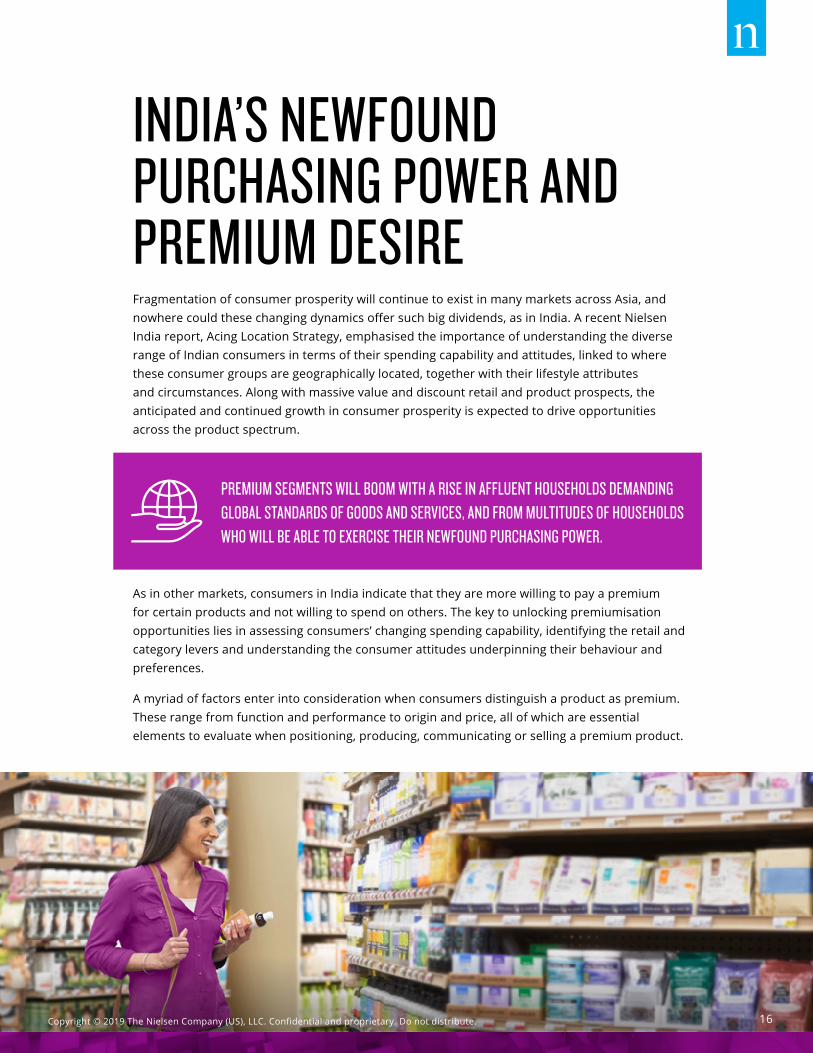
INDIA’S NEWFOUND PURCHASING POWER AND PREMIUM DESIRE Fragmentation of consumer prosperity will continue to exist in many markets across Asia, and nowhere could these changing dynamics offer such big dividends, as in India. A recent Nielsen India report, Acing Location Strategy, emphasised the importance of understanding the diverse range of Indian consumers in terms of their spending capability and attitudes, linked to where these consumer groups are geographically located, together with their lifestyle attributes and circumstances. Along with massive value and discount retail and product prospects, the anticipated and continued growth in consumer prosperity is expected to drive opportunities across the product spectrum.
As in other markets, consumers in India indicate that they are more willing to pay a premium for certain products and not willing to spend on others. The key to unlocking premiumisation opportunities lies in assessing consumers’ changing spending capability, identifying the retail and category levers and understanding the consumer attitudes underpinning their behaviour and preferences.
A myriad of factors enter into consideration when consumers distinguish a product as premium. These range from function and performance to origin and price, all of which are essential elements to evaluate when positioning, producing, communicating or selling a premium product.
PREMIUM SEGMENTS WILL BOOM WITH A RISE IN AFFLUENT HOUSEHOLDS DEMANDING GLOBAL STANDARDS OF GOODS AND SERVICES, AND FROM MULTITUDES OF HOUSEHOLDS WHO WILL BE ABLE TO EXERCISE THEIR NEWFOUND PURCHASING POWER.
16 Copyright © 2019 The Nielsen Company (US), LLC. Confidential and proprietary. Do not distribute.
17 Copyright © 2019 The Nielsen Company (US), LLC. Confidential and proprietary. Do not distribute.
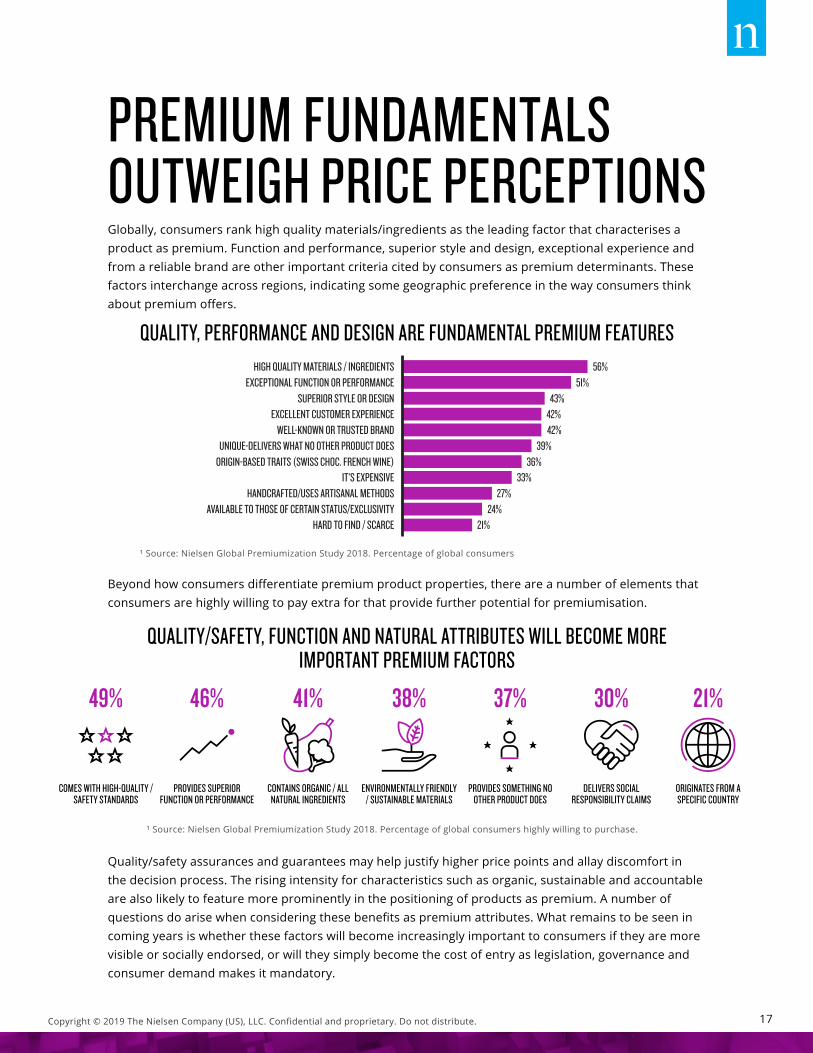
PREMIUM FUNDAMENTALS OUTWEIGH PRICE PERCEPTIONSGlobally, consumers rank high quality materials/ingredients as the leading factor that characterises a product as premium. Function and performance, superior style and design, exceptional experience and from a reliable brand are other important criteria cited by consumers as premium determinants. These factors interchange across regions, indicating some geographic preference in the way consumers think about premium offers.
Beyond how consumers differentiate premium product properties, there are a number of elements that consumers are highly willing to pay extra for that provide further potential for premiumisation.
Quality/safety assurances and guarantees may help justify higher price points and allay discomfort in the decision process. The rising intensity for characteristics such as organic, sustainable and accountable are also likely to feature more prominently in the positioning of products as premium. A number of questions do arise when considering these benefits as premium attributes. What remains to be seen in coming years is whether these factors will become increasingly important to consumers if they are more visible or socially endorsed, or will they simply become the cost of entry as legislation, governance and consumer demand makes it mandatory.
¹ Source: Nielsen Global Premiumization Study 2018. Percentage of global consumers
¹ Source: Nielsen Global Premiumization Study 2018. Percentage of global consumers highly willing to purchase.
QUALITY, PERFORMANCE AND DESIGN ARE FUNDAMENTAL PREMIUM FEATURES
QUALITY/SAFETY, FUNCTION AND NATURAL ATTRIBUTES WILL BECOME MORE IMPORTANT PREMIUM FACTORS
HIGH QUALITY MATERIALS / INGREDIENTSEXCEPTIONAL FUNCTION OR PERFORMANCE
SUPERIOR STYLE OR DESIGN
WELL-KNOWN OR TRUSTED BRANDEXCELLENT CUSTOMER EXPERIENCE
UNIQUE-DELIVERS WHAT NO OTHER PRODUCT DOESORIGIN-BASED TRAITS (SWISS CHOC. FRENCH WINE)
IT’S EXPENSIVEHANDCRAFTED/USES ARTISANAL METHODS
AVAILABLE TO THOSE OF CERTAIN STATUS/EXCLUSIVITYHARD TO FIND / SCARCE
56%51%
43%
42%42%
39%36%
33%27%
24%21%
49% 46% 41% 38% 37% 30% 21%
COMES WITH HIGH-QUALITY / SAFETY STANDARDS
PROVIDES SUPERIOR FUNCTION OR PERFORMANCE
CONTAINS ORGANIC / ALL NATURAL INGREDIENTS
ENVIRONMENTALLY FRIENDLY / SUSTAINABLE MATERIALS
PROVIDES SOMETHING NO OTHER PRODUCT DOES
DELIVERS SOCIAL RESPONSIBILITY CLAIMS
ORIGINATES FROM A SPECIFIC COUNTRY
18 Copyright © 2019 The Nielsen Company (US), LLC. Confidential and proprietary. Do not distribute.
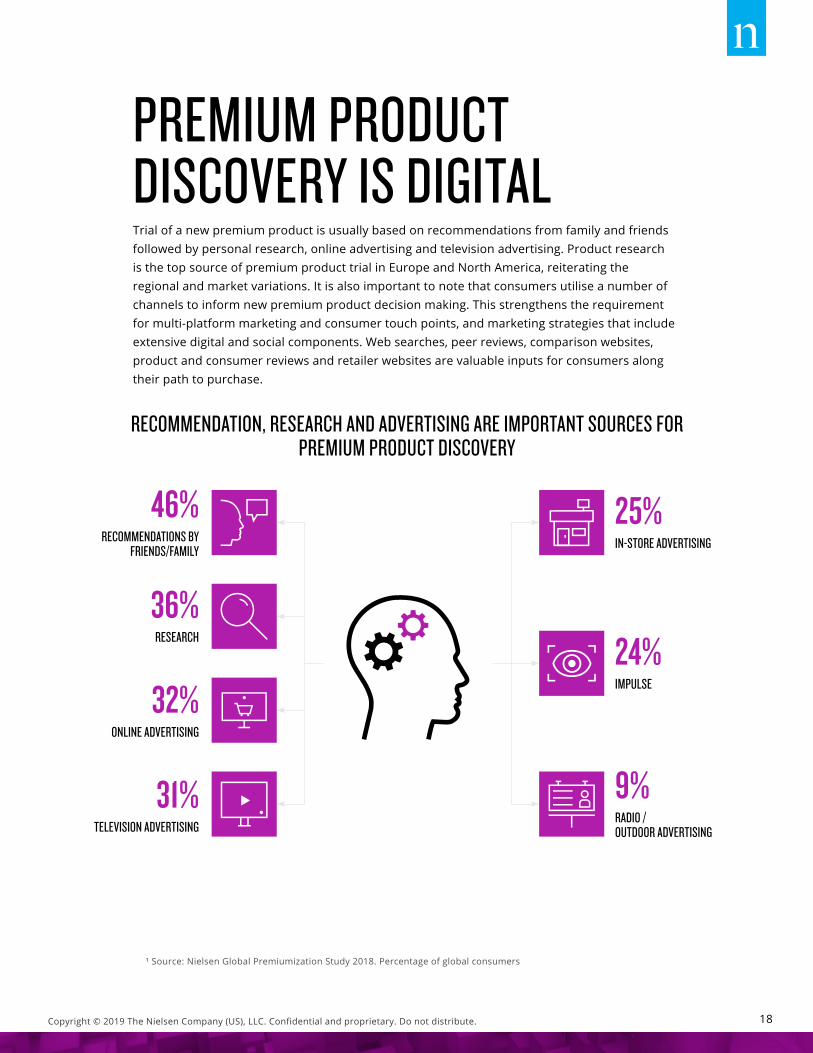
¹ Source: Nielsen Global Premiumization Study 2018. Percentage of global consumers
PREMIUM PRODUCT DISCOVERY IS DIGITALTrial of a new premium product is usually based on recommendations from family and friends followed by personal research, online advertising and television advertising. Product research is the top source of premium product trial in Europe and North America, reiterating the regional and market variations. It is also important to note that consumers utilise a number of channels to inform new premium product decision making. This strengthens the requirement for multi-platform marketing and consumer touch points, and marketing strategies that include extensive digital and social components. Web searches, peer reviews, comparison websites, product and consumer reviews and retailer websites are valuable inputs for consumers along their path to purchase.
RECOMMENDATION, RESEARCH AND ADVERTISING ARE IMPORTANT SOURCES FOR PREMIUM PRODUCT DISCOVERY
25%
36%
32%
31%
24%
9%
IN-STORE ADVERTISING
46%RECOMMENDATIONS BY
FRIENDS/FAMILY
RESEARCH
ONLINE ADVERTISING
TELEVISION ADVERTISING
IMPULSE
RADIO / OUTDOOR ADVERTISING
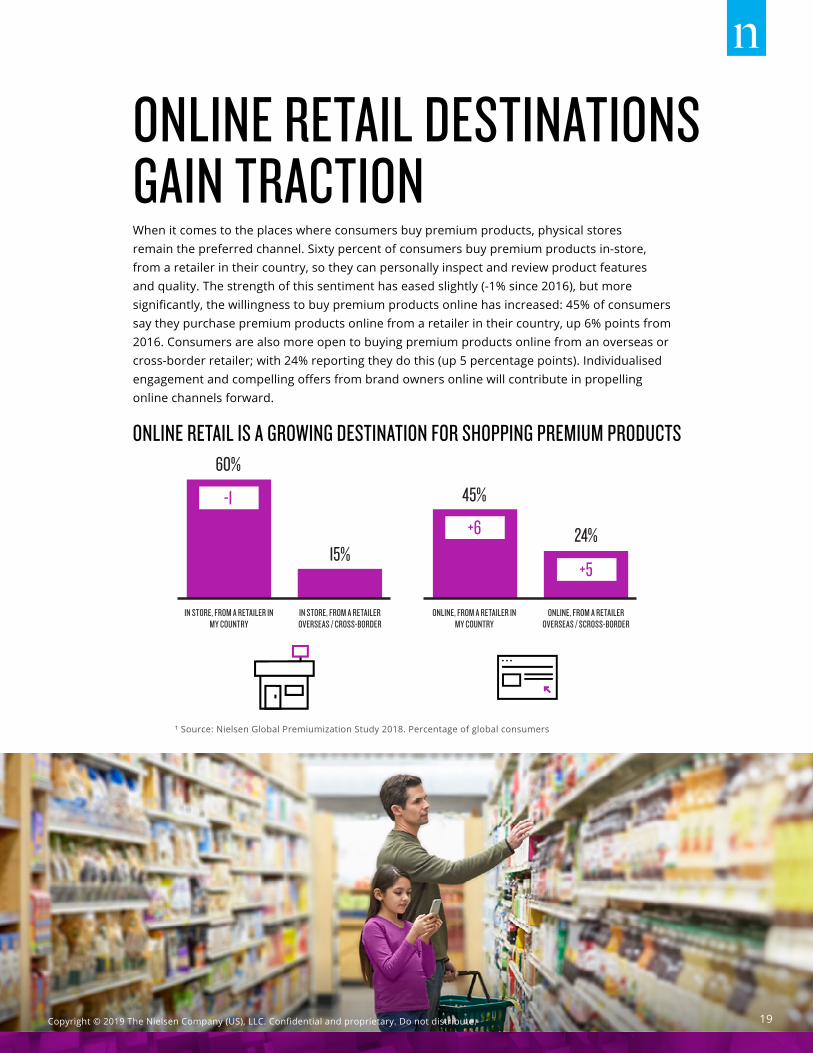
ONLINE RETAIL DESTINATIONS GAIN TRACTIONWhen it comes to the places where consumers buy premium products, physical stores remain the preferred channel. Sixty percent of consumers buy premium products in-store, from a retailer in their country, so they can personally inspect and review product features and quality. The strength of this sentiment has eased slightly (-1% since 2016), but more significantly, the willingness to buy premium products online has increased: 45% of consumers say they purchase premium products online from a retailer in their country, up 6% points from 2016. Consumers are also more open to buying premium products online from an overseas or cross-border retailer; with 24% reporting they do this (up 5 percentage points). Individualised engagement and compelling offers from brand owners online will contribute in propelling online channels forward.
ONLINE RETAIL IS A GROWING DESTINATION FOR SHOPPING PREMIUM PRODUCTS
¹ Source: Nielsen Global Premiumization Study 2018. Percentage of global consumers
ONLINE, FROM A RETAILER IN MY COUNTRY
ONLINE, FROM A RETAILER OVERSEAS / SCROSS-BORDER
IN STORE, FROM A RETAILER IN MY COUNTRY
IN STORE, FROM A RETAILER OVERSEAS / CROSS-BORDER
60%
15%
45%
24%
-1
+6
+5
19 Copyright © 2019 The Nielsen Company (US), LLC. Confidential and proprietary. Do not distribute.

20 Copyright © 2019 The Nielsen Company (US), LLC. Confidential and proprietary. Do not distribute.
MINDSET AND INTENT MATTER MORE THAN INCOMETo steer premium and value strategies moving forward there are forecasts and indicators that can guide corporate thinking and help structure additional research, insights and metrics. While unforeseen market disruptions such as political, social, legislative or even environmental conditions can fundamentally alter the consumer and business environment, growth in average disposable income could be interpreted as an indication of expected consumption capability and spending growth. This provides one way to identify markets with increased future premiumisation opportunities (top ranked growth markets) versus those that may be more in need of value propositions (bottom ranked growth markets). But, with examples of markets experiencing healthy advancement in economic and income factors, while also reporting fragmented attitudes to consumer prosperity and spending, other variables such as consumer mindset and spending intent will need to be incorporated.
GROWTH IN DISPOSABLE INCOME CAN PROVIDE AN INDICATION OF FUTURE CONSUMPTION POTENTIAL
In high growth markets, small groups of consumers will shift to higher levels of income and consumption capability, creating opportunities for premium, niche and specialist products. At the opposite end of the growth spectrum, premium opportunities will still exist, especially in more mature markets such as the U.K., Netherlands, Denmark and Japan, but identifying market value propositions will be as relevant.
³ Source: Economist Intelligence Unit, Top 25 ranked countries 2019-2022
>20 20% > 10% 10% > 1%India 43% Kazakhstan 17% Australia / Brazil / Canada 10%
Venezuela 39% Hong Kong / Peru / Poland / Turkey 16% Hungary / Spain / Sweden / Ukraine 9%
Malaysia 30% Colombia 14% Ireland / Korea / Norway / Usa 8%
Egypt 28% Bulgaria / Taiwan 13% Mexico / Portugal / United Kingdom 7%
Vietnam 26% Chile / South Africa / Singapore / Romania 12% Austria / Denmark/ Finland / France / Greece / Russia /
New Zealand / Slovakia / Netherlands 6%
China 24% Israel 11% Argentina / Belgium / Czech Republic / Germany / Switzerland 5%
Indonesia 23% Italy 4%
Philippines 22% Japan 1%
CONSUMERS ARE NOT BENEFITTING PROPORTIONATELY FROM INCREASED PROSPERITY. WAGE AND DISPOSABLE INCOME INDICATORS WILL NOT BE ENOUGH FOR UNDERSTANDING FUTURE CONSUMPTION POTENTIAL.Regan Leggett, Nielsen Global Markets, Head of Thought Leadership and Foresight
21 Copyright © 2019 The Nielsen Company (US), LLC. Confidential and proprietary. Do not distribute.
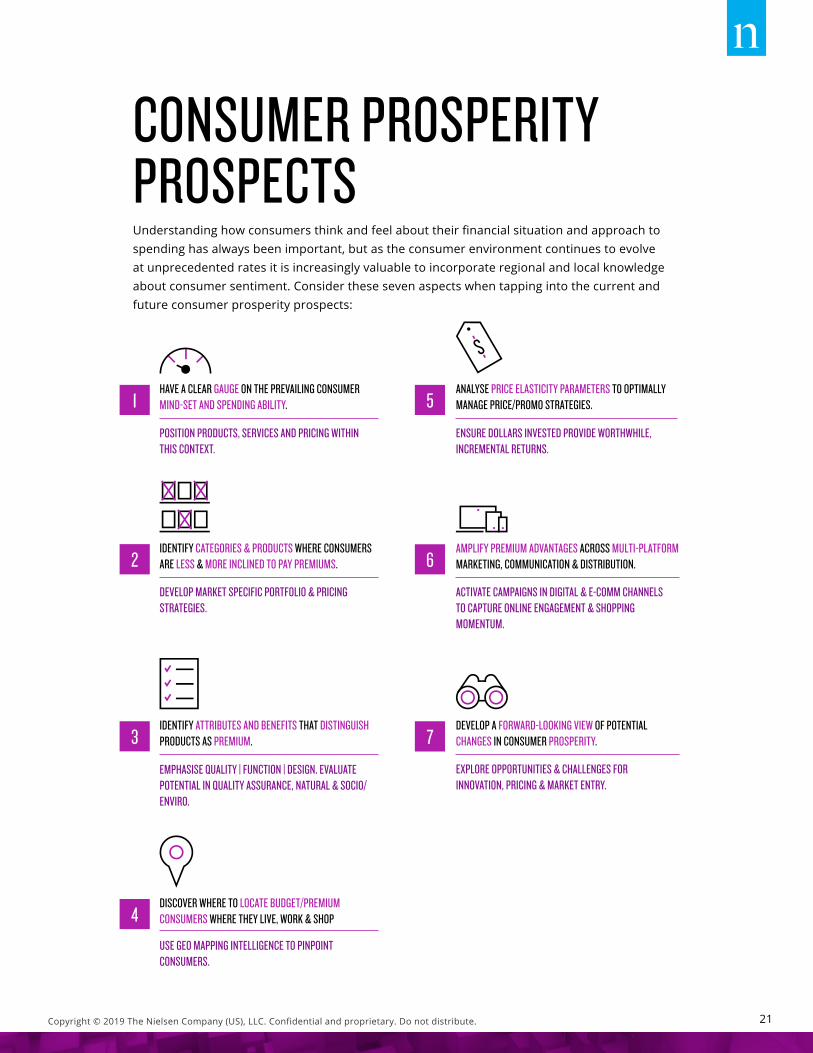
CONSUMER PROSPERITY PROSPECTSUnderstanding how consumers think and feel about their financial situation and approach to spending has always been important, but as the consumer environment continues to evolve at unprecedented rates it is increasingly valuable to incorporate regional and local knowledge about consumer sentiment. Consider these seven aspects when tapping into the current and future consumer prosperity prospects:
USE GEO MAPPING INTELLIGENCE TO PINPOINT CONSUMERS.
DISCOVER WHERE TO LOCATE BUDGET/PREMIUM CONSUMERS WHERE THEY LIVE, WORK & SHOP4
ENSURE DOLLARS INVESTED PROVIDE WORTHWHILE, INCREMENTAL RETURNS.
ANALYSE PRICE ELASTICITY PARAMETERS TO OPTIMALLY MANAGE PRICE/PROMO STRATEGIES.5
POSITION PRODUCTS, SERVICES AND PRICING WITHIN THIS CONTEXT.
HAVE A CLEAR GAUGE ON THE PREVAILING CONSUMER MIND-SET AND SPENDING ABILITY.1
AMPLIFY PREMIUM ADVANTAGES ACROSS MULTI-PLATFORM MARKETING, COMMUNICATION & DISTRIBUTION.
ACTIVATE CAMPAIGNS IN DIGITAL & E-COMM CHANNELS TO CAPTURE ONLINE ENGAGEMENT & SHOPPING MOMENTUM.
6IDENTIFY CATEGORIES & PRODUCTS WHERE CONSUMERS ARE LESS & MORE INCLINED TO PAY PREMIUMS.
DEVELOP MARKET SPECIFIC PORTFOLIO & PRICING STRATEGIES.
2
DEVELOP A FORWARD-LOOKING VIEW OF POTENTIAL CHANGES IN CONSUMER PROSPERITY.
EXPLORE OPPORTUNITIES & CHALLENGES FOR INNOVATION, PRICING & MARKET ENTRY.
7EMPHASISE QUALITY | FUNCTION | DESIGN. EVALUATE POTENTIAL IN QUALITY ASSURANCE, NATURAL & SOCIO/ENVIRO.
IDENTIFY ATTRIBUTES AND BENEFITS THAT DISTINGUISH PRODUCTS AS PREMIUM.3
22 Copyright © 2019 The Nielsen Company (US), LLC. Confidential and proprietary. Do not distribute.
REFERENCES AND SOURCES1. NIELSEN GLOBAL PREMIUMIZATION STUDY 2018
2. NIELSEN GLOBAL PREMIUMIZATION STUDY 2016
3. THE ECONOMIST INTELLIGENCE UNIT, DISPOSABLE INCOME GROWTH AND AVERAGE MONTHLY WAGE GROWTH
4. NIELSEN RETAIL MEASUREMENT SERVICES, EUROPE: AUSTRIA, BELGIUM, DENMARK, FINLAND, FRANCE, GERMANY, GREECE, ITALY, IRELAND, THE NETHERLANDS, NORWAY, PORTUGAL, SPAIN, SWEDEN, SWITZERLAND, UNITED KINGDOM, HUNGARY, AND POLAND
5. NIELSEN RETAIL MEASUREMENT SERVICES: CHILE, MEXICO, COLOMBIA
6. NIELSEN PRICE AND PROMOTION EVERYDAY PRICING ANALYSIS 2018: AVERAGE OF 36 COUNTRIES
7. NIELSEN PRICE AND PROMOTION ANALYSIS 2017-2018: SAUDI ARABIA, UNITED ARAB EMIRATES
8. NIELSEN GLOBAL PRIVATE LABEL STUDY 2016
9. NIELSEN ADVANCED SOLUTIONS GROUP, USA ANALYTIC PRODUCT ATTRIBUTE (APA) DATABASE – 52 WEEKS TO MARCH 31ST, 2018 VS. YEAR AGO
10. NIELSEN RETAIL MEASUREMENT SERVICES, JUNE 2018: THAILAND
23 Copyright © 2019 The Nielsen Company (US), LLC. Confidential and proprietary. Do not distribute. 190147
ABOUT NIELSENNielsen Holdings plc (NYSE: NLSN) is a global measurement and data analytics company that provides the most complete and trusted view available of consumers and markets worldwide. Our approach marries proprietary Nielsen data with other data sources to help clients around the world understand what’s happening now, what’s happening next, and how to best act on this knowledge. For more than 90 years Nielsen has provided data and analytics based on scientific rigor and innovation, continually developing new ways to answer the most important questions facing the media, advertising, retail and fast-moving consumer goods industries. An S&P 500 company, Nielsen has operations in over 100 countries, covering more than 90% of the world’s population. For more information, visit www.nielsen.com.
THE SCIENCE BEHIND WHAT’S NEXT ™

24 Copyright © 2019 The Nielsen Company (US), LLC. Confidential and proprietary. Do not distribute.
THE SCIENCE BEHIND WHAT’S NEXT™
At Nielsen, data drives everything we do—even art. That’s why we used real data to create this image. Copyright © 2019 The Nielsen Company (US), LLC. Confidential and proprietary. Do not distribute.