Embed Size (px)
Citation preview

Changes to the Method forDeriving Australian and New
Zealand Water Quality GuidelineValues for Toxicants
Michael St. J. Warne 1, Graeme E. Batley 2 and Rick van Dam3
1. Department of Science, Information Technology and Innovation (DSITI)2. Commonwealth Scientific and Industrial Research Organisation (CSIRO)3. Environmental Research Institute of the Supervising Scientist (ERISS)

Managing Water Quality in Australia
Australian and New Zealand Guidelines
for Fresh and Marine Water Quality (WQGs)(1 of 25 documents)
WQGs aim to protect water resources for varioususes (values), e.g., Human Health, Ecosystem
Protection, Irrigation, Cultural
National Water Quality Management Strategy (NWQMS)Aim to achieve the sustainable use of the nation’s water resources by protecting and
enhancing their quality while maintaining economic and social development
Risk-based protection (% of species) is provided bymeeting Guideline Values (GVs) previously called
Trigger Values (TVs)
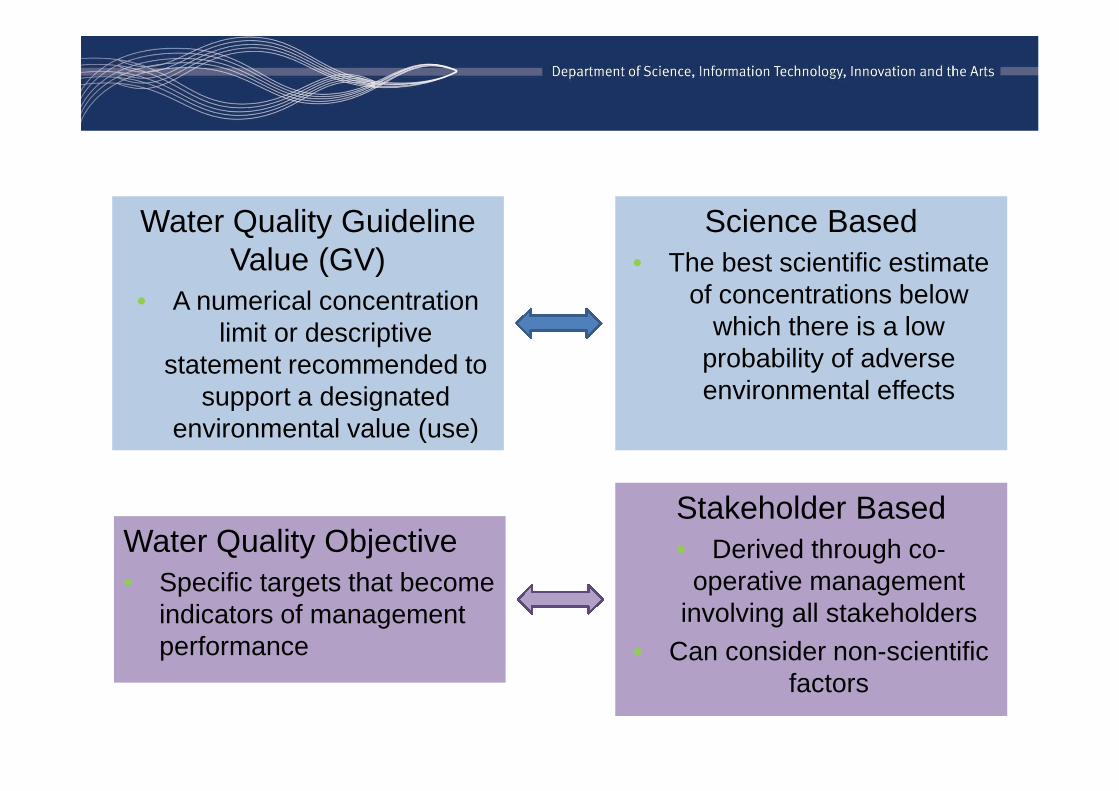
Water Quality GuidelineValue (GV)
• A numerical concentrationlimit or descriptive
statement recommended tosupport a designated
environmental value (use)
Water Quality Objective• Specific targets that become
indicators of managementperformance
Science Based• The best scientific estimate
of concentrations belowwhich there is a low
probability of adverseenvironmental effects
Stakeholder Based• Derived through co-
operative managementinvolving all stakeholders
• Can consider non-scientificfactors

Why?
• It is a regulatory requirement to review and update thewater quality guidelines
• There is the need to maintain scientific rigour and relevanceto the user
• To correct mistakes and develop guidelines for newchemicals
• To improve the methodology for deriving TVs
• To increase the use of SSD approach and decrease use ofthe Assessment Factor method
• To use new data and advances in the science
Revision of the Water Quality Guidelines(2009 – 2016)

What are being revised?
• Document 4 – Australian and NewZealand Guidelines for Fresh and MarineWater Quality
• Document 7 – Monitoring and Reporting
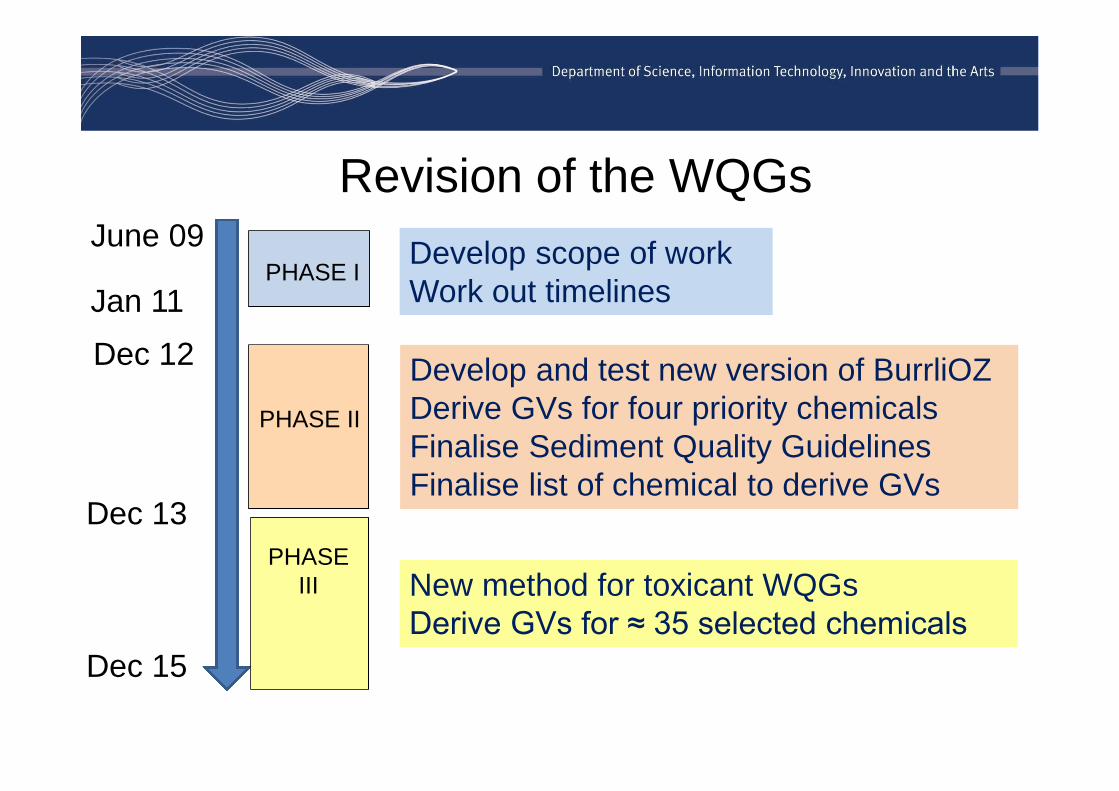
PHASE I
Revision of the WQGsJune 09
Develop scope of workWork out timelinesJan 11
PHASE II
Dec 12
Dec 13
Develop and test new version of BurrliOZDerive GVs for four priority chemicalsFinalise Sediment Quality GuidelinesFinalise list of chemical to derive GVs
PHASEIII
Dec 15
New method for toxicant WQGsDerive GVs for ≈ 35 selected chemicals
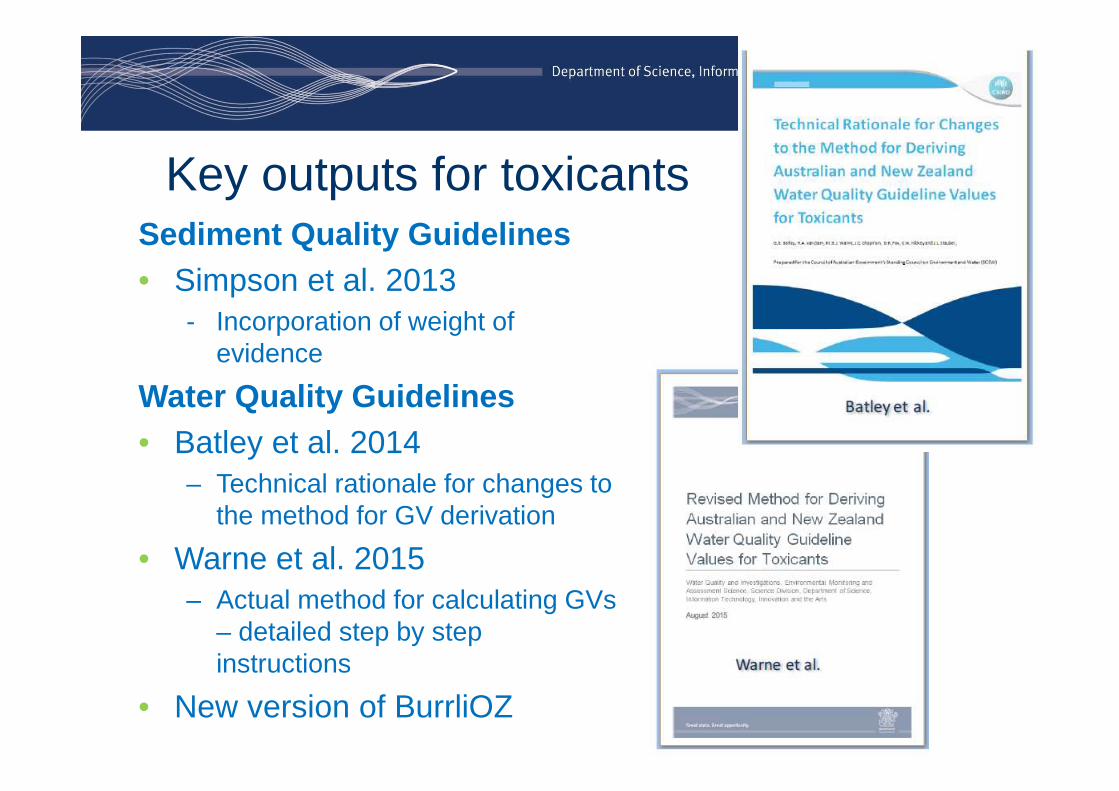
Key outputs for toxicantsSediment Quality Guidelines
• Simpson et al. 2013- Incorporation of weight of
evidence
Water Quality Guidelines
• Batley et al. 2014– Technical rationale for changes to
the method for GV derivation
• Warne et al. 2015– Actual method for calculating GVs
– detailed step by stepinstructions
• New version of BurrliOZ

Guidelines
• The Australian and New Zealand WaterQuality Guidelines are Guidelines. Theyprovide guidance.
• Default is to use the GVs and methodsprovided
• Exceptions are permitted provided they are:
– scientifically defensible
– transparent and
– pass critical review
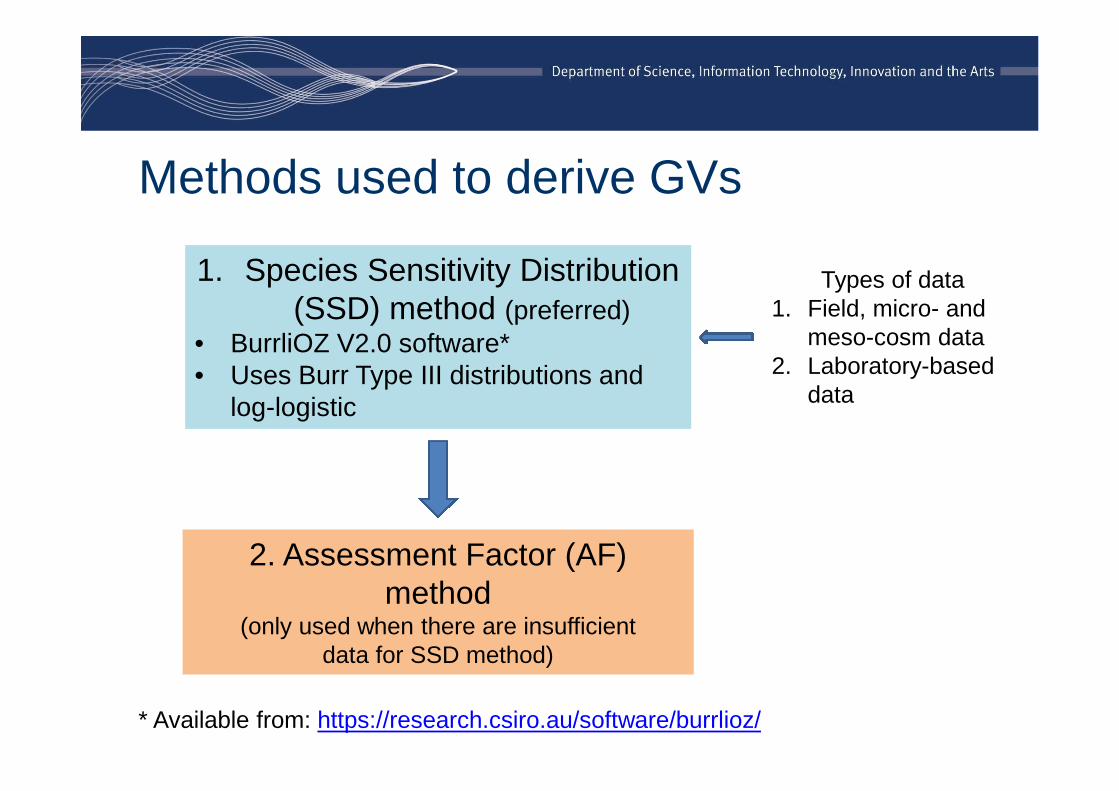
Methods used to derive GVs
1. Species Sensitivity Distribution(SSD) method (preferred)
• BurrliOZ V2.0 software*• Uses Burr Type III distributions and
log-logistic
Very low reliability
2. Assessment Factor (AF)method
(only used when there are insufficientdata for SSD method)
Types of data1. Field, micro- and
meso-cosm data2. Laboratory-based
data
* Available from: https://research.csiro.au/software/burrlioz/

6. Visual assessment of goodness of fit ofdata
1. Collate toxicity and physicochemical data
2. Screen and assess quality of toxicity data
3. Manipulate data to obtain 1 value perspecies
5. Enter data into BurrliOZ
4. Are data uni- or multi-modal?
7. Calculate GVs for different levels ofprotection
8. Bioaccumulation correction
9. Determine reliability of GVs
10. Ground-truth the GVs(use field, micro- and meso-cosm data)
Overview of the method for deriving toxicant GVsusing a SSD method

Acceptable sources of data• Previously only published articles were used
• Therefore much data was excluded, e.g. consultingreports and commercial-in-confidence data
• Aim is to use all appropriate quality ecotoxicology dataas SSDs are a statistical method
• We do not differentiate between standard tests (e.g.OECD methods), GLP, research or commercialecotoxicology results
• Two steps
– Develop method to include commercial-in-confidencedata (e.g. NICNAS, APVMA data)
– All grey literature data used provided copy publicallyavailable.

Acceptable endpoints
• Ecologically relevant endpoints (e.g., lethality,immobilisation, growth, population growth rate)
• Non-traditional endpoints (e.g., photosynthesis inhibition,in-vivo biochemical and physiological endpoints,behavioural endpoints, and genotoxicity andmutagenicity) can be used:
– to derive GVs provided their ecological relevancecan be proved
– in a weight of evidence manner if ecologicalrelevance not proved
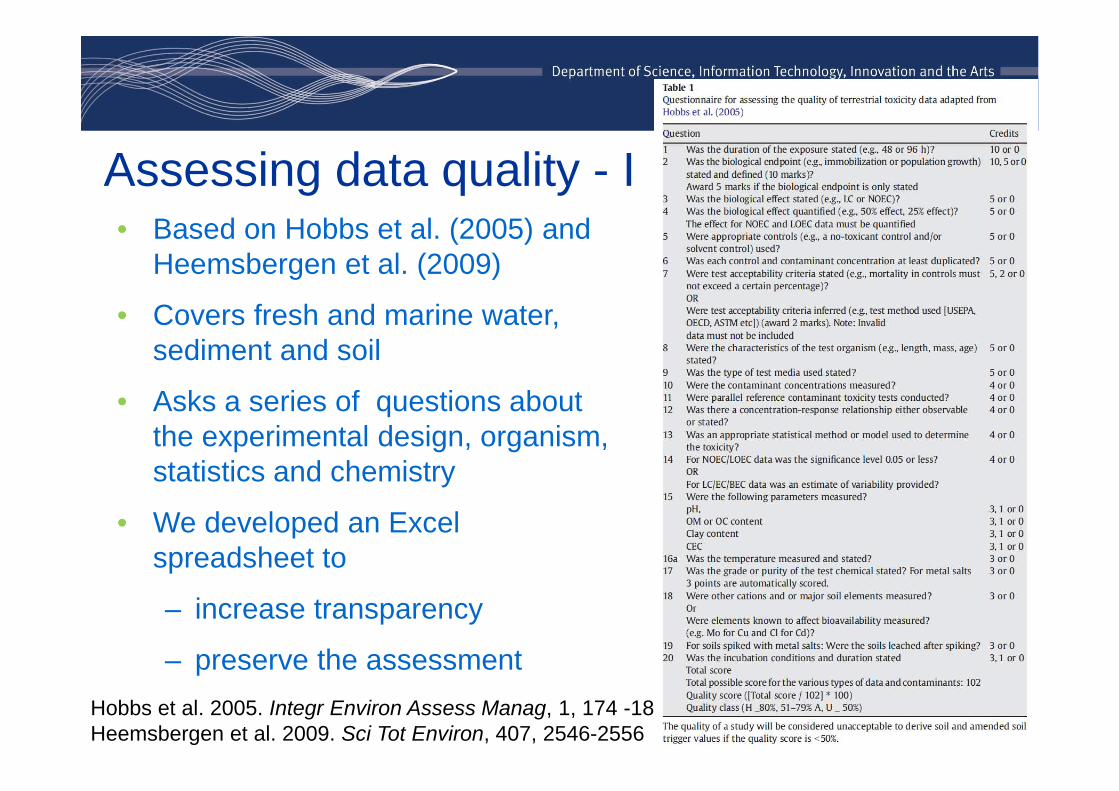
Assessing data quality - I• Based on Hobbs et al. (2005) and
Heemsbergen et al. (2009)
• Covers fresh and marine water,sediment and soil
• Asks a series of questions aboutthe experimental design, organism,statistics and chemistry
• We developed an Excelspreadsheet to
– increase transparency
– preserve the assessment
Hobbs et al. 2005. Integr Environ Assess Manag, 1, 174 -180.Heemsbergen et al. 2009. Sci Tot Environ, 407, 2546-2556

• Quality Score = total score x 100
total possible score
• Three quality classes
• Tests with nominal concentrations cannot be high qualityand usually end up being unacceptable
Quality Score QualityClassification
Acceptable todrive GVs
>80 High Yes
>50 to ≤80 Moderate
<50% Unacceptable No
Assessing data quality - II
• This is quite different to the Klimisch et al. (1997) dataquality assessment method
• The numerical quality score helps with subsequentweight of evidence type approaches
Assessing data quality - III
• Acute toxicity: A lethal or adverse sub-lethaleffect over a short exposure period relative to theorganism’s life span.
• Chronic toxicity: An adverse lethal or adversesub-lethal effect over a substantial portion of theorganism’s life span (usually a long-term exposure)or a sub-lethal adverse effect on an early life stage.
New definitions of acute and chronic
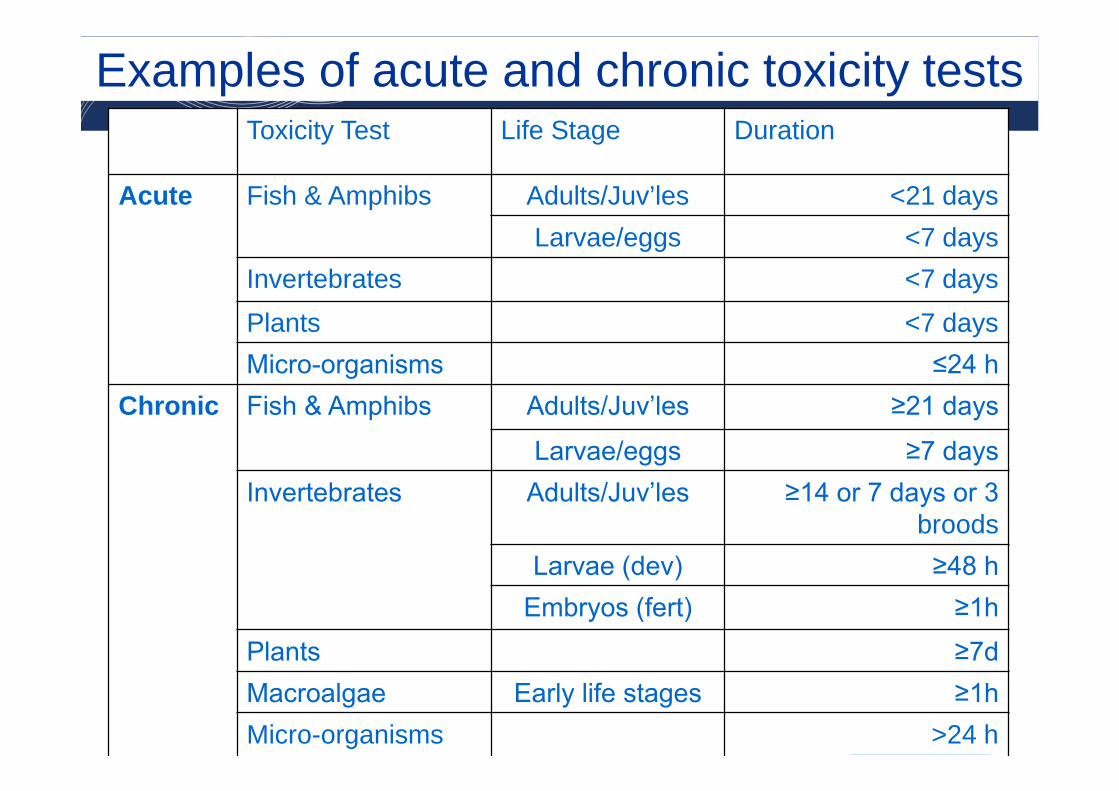
Toxicity Test Life Stage Duration
Acute Fish & Amphibs Adults/Juv’les <21 days
Larvae/eggs <7 days
Invertebrates <7 days
Plants <7 days
Micro-organisms ≤24 h
Chronic Fish & Amphibs Adults/Juv’les ≥21 days
Larvae/eggs ≥7 days
Invertebrates Adults/Juv’les ≥14 or 7 days or 3 broods
Larvae (dev) ≥48 h
Embryos (fert) ≥1h
Plants ≥7d
Macroalgae Early life stages ≥1h
Micro-organisms >24 h
Examples of acute and chronic toxicity tests

Data requirements and adequacy
Sample size Adequacy of sample size
≥15 species for ≥4 taxa Preferred
8 – 14 species for ≥4 taxa Good
5 – 7 species for ≥4 taxa Adequate
5 species for ≥4 taxa Minimum*
<5 species Low to very low
* aim is to increase the adequacy of sample size over time
No requirement for data for any specific type of organism – as itviolates a key assumption of SSD methods

Order of Preference for Data Use
1. NEC
2. EC10
3. BEC10
4. EC15 – 20
5. NOEC
6. est. values from EC\LC\IC50,LOEC or MATC
Highest
Lowest
Chronic
Acute

e.g. Hoekstra & Van Ewijk. 1993. ET&C 12, 187-194;Chapman et al. 1996. ET&C 15, 77-79; Fox 2008. Aus JEcotox 14(1), 6-9; Newman. 2008. ET& Chemistry 27, 1013-1019; Warne & Van Dam. 2008. Aus J Ecotox 14(1), 1-5.
NOEC data
To NOEC or notto NOEC that isthe question!
NOEC data have beenextensively criticised• have a misleading name• are inappropriate for theintended use• are an invalid use of statisticalmethods
But they form the majority ofexisting chronic toxicity data
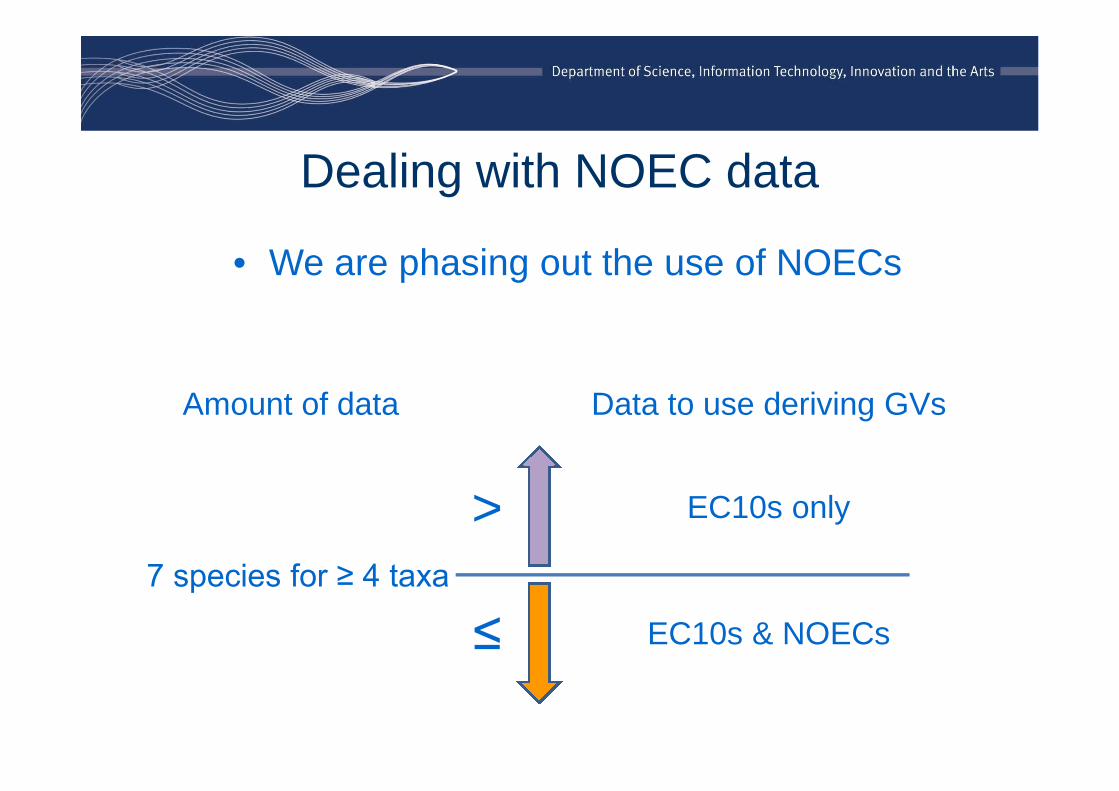
Dealing with NOEC data
• We are phasing out the use of NOECs
>
≤
EC10s only
EC10s & NOECs
Amount of data Data to use deriving GVs
7 species for ≥ 4 taxa
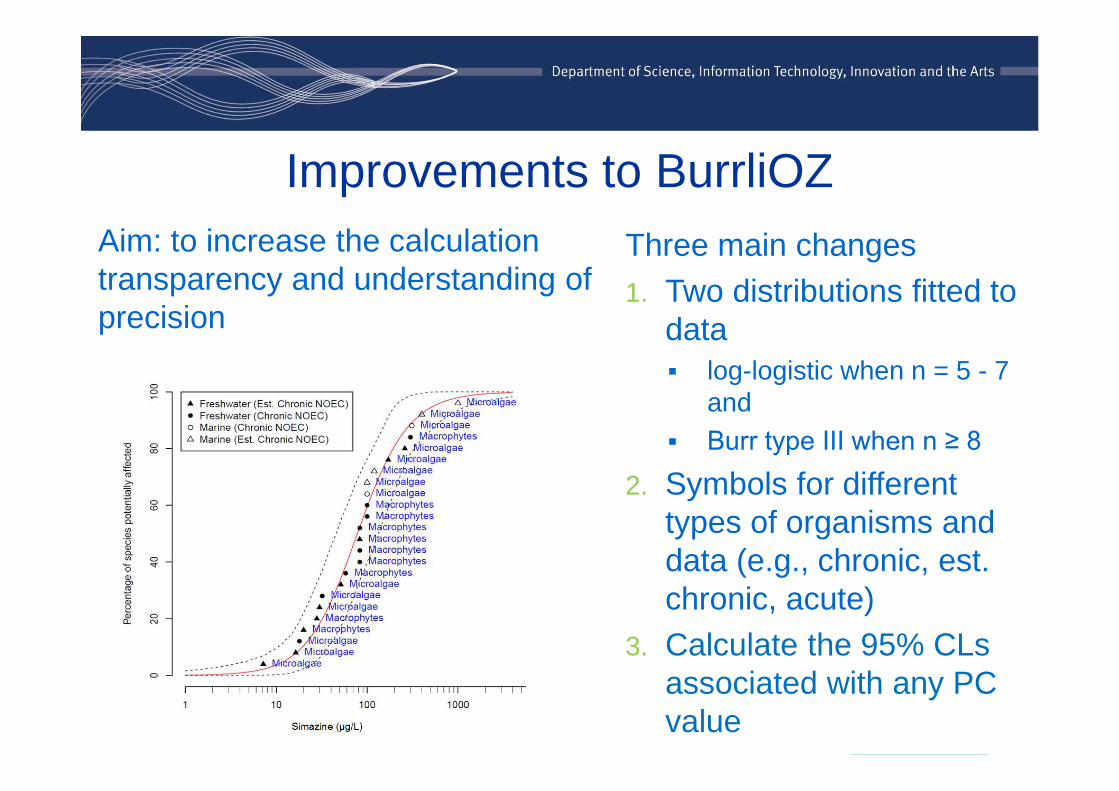
Improvements to BurrliOZ
Aim: to increase the calculationtransparency and understanding ofprecision
Three main changes
1. Two distributions fitted todata log-logistic when n = 5 - 7
and
Burr type III when n ≥ 8
2. Symbols for differenttypes of organisms anddata (e.g., chronic, est.chronic, acute)
3. Calculate the 95% CLsassociated with any PCvalue

Guideline values
Type of ecosystem Guideline Value (degree of protection)
High conservation value – minimalmodification
PC99 (HC1)
Slightly to moderately modified PC95 (HC5)
Highly modified PC90 or PC80 (HC10 or HC20)
GVs are the outputs of the SSD. They are not thendivided by an AF.

Reliability of GVs
Previously
• High reliability
• Moderate reliability
• Low reliability
– Interim
– Environmental concernlevel (ECL)
Based on
(1) the no. of species & taxa
(2) the type of data
Currently
• Very high reliability
• High reliability
• Moderate reliability
• Low reliability
• Very low reliability
Based on
(1) the no. of species & taxa
(2) the type of data
(3) fit of model to data

SAMPLESIZEa
DATA TYPE ADEQUACY OF RELIABILITY
SAMPLE SIZE SSD FIT
≥15 Chronic Preferred Good Very highPoor Moderate
8–14 Chronic Good Good HighPoor Moderate
5–7 Chronic Adequate Good ModeratePoor Low
≥15 Chronic & c. acute Preferred Good ModeratePoor Low
8–14 Chronic & c. acute Good Good ModeratePoor Low
5–7 Chronic & c. acute Adequate Good ModeratePoor Low
≥15 Converted acute Preferred Good ModeratePoor Low
8–14 Converted acute Good Good ModeratePoor Low
5–7 Converted acute Adequate Good LowPoor Very low
Options for GV derivation
• Derivation of site-specific GVs is encouraged
• GVs (including default) can and are being derived by non-government scientists – could include industry
• But all proposed default GVs must be rigorously assessedbefore being endorsed

Acknowledgements
– USEPA for theinvitation to attend
– Members ofTechnical WorkingGroup 4 for WQGRevision
– Partners andfamilies of scientistsinvolved My family
My family

Thank you
Any questions?