Embed Size (px)
Citation preview

Clark, Chatterjee and Melia
TRB 2015 Annual Meeting Pre-print
1
CHANGES TO COMMUTE MODE: THE ROLE OF LIFE EVENTS, 1
SPATIAL CONTEXT AND ENVIRONMENTAL ATTITUDE 2
3
Ben Clark 4
Kiron Chatterjee (corresponding author) 5
Steve Melia 6
7
Centre for Transport & Society 8
Department of Geography and Environmental Management 9
University of the West of England 10
Bristol 11
BS16 1QY 12
UK 13
Tel: +44(0) 117 32 8 {3066; 2032; 3267} 14
Fax: +44(0) 117 32 83002 15
E-mail:{Ben4.Clark; Kiron.Chatterjee; Steve.Melia}@uwe.ac.uk 16
17
18
Submission date: 15th
November 2014 19
Number of words: 7820 20
Number of tables: 7 21
Number of figures: 1 22
Total: 9820 23
24

Clark, Chatterjee and Melia
TRB 2015 Annual Meeting Pre-print
2
ABSTRACT 1 2
It has been suggested that commuting behaviours become resistant to change and that 3
changes to commute mode may be more likely at the time of major life events. This paper 4
presents for the first time a robust quantification of the effect of life events on the likelihood 5
of changing commute mode, controlling for demographics, socio-economics, spatial context 6
and environmental attitude. This is conducted for a large, representative sample of the 7
English working population using data from the first two waves of the UK Household 8
Longitudinal Study. Changes in commute mode are found to be most strongly associated with 9
changes in distance to work which occur in association with moving home or changing job. 10
The distance relationship is asymmetric with increases in distance being far more likely to 11
prompt switches to car commuting than reductions in distance are to prompt switches to non-12
car commuting. Residential relocations that involve an increase in population density and 13
reduced journey times to employment by public transport are found to increased likelihood of 14
switching to non-car commuting. The results support a theoretical conception put forward in 15
the paper of how travel behaviour is influenced by events over the life course and indicate 16
there are opportunities for behavioural change interventions to be targeted at population 17
groups experiencing life events. 18
19

Clark, Chatterjee and Melia
TRB 2015 Annual Meeting Pre-print
3
1. INTRODUCTION 1 2
Local transport policies in urban areas are often concerned with encouraging people to adopt 3
non-car transport in order to reduce pressure on scarce road space and to improve the quality 4
of the urban environment. Policies are particularly targeted towards managing commuting 5
behaviours, as it is during the morning and evening peak commuting times that transport 6
networks are under the most pressure. However, it has been shown that daily car commuting 7
becomes habitual and is repeated with little or no conscious consideration of alternatives (1). 8
Habits are automatically repeated behaviours with little or no conscious reconsideration of 9
whether alternative behaviours may be as, or more effective. 10
For this reason it is a challenge to encourage people to adopt new commuting 11
behaviours, even if improvements are made to public transport services or to walking and 12
cycling environments. Whilst there has been substantial research into the factors associated 13
with commuting by different transport modes, there has been less attention given to 14
identifying the factors associated with changes to commute mode. However, it is important to 15
understand these factors if effective policies and measures are to be developed to influence 16
commuting behaviours. The ‘habit-discontinuity hypothesis’ posits that habits may become 17
weakened when routine behaviours, such as commuting, are interrupted by a contextual 18
change (2). It can be expected that people are more likely to change commuting mode if there 19
is a contextual change to their life situation (life event) or to external situational factors (3). 20
In this paper we: 21
22
1. Review existing knowledge on how life events and other factors influence the 23
mode of transport used by individuals to get to work; and 24
2. Use national panel data for England to identify the role of life events, spatial 25
context and environmental attitude in workers changing their commute mode. 26
27
The paper begins with the review which clarifies the knowledge gaps and intended 28
contributions of our study. We then put forward a framework for analysing changes in 29
commuting behaviours, describe the data used for our analysis and present results. The paper 30
finishes with a discussion of the implications of the results for research and policy. 31
32
2. LITERATURE REVIEW 33
34 The main focus of the review is on longitudinal studies that have investigated factors 35
associated with changes to commute mode choices, but we start by discussing mode choice 36
models that have been developed from cross-sectional data to explain commute mode choices 37
since these are useful in setting out factors that are considered to influence commute mode 38
choices. 39
40
2.1 Determinants of commute mode choice 41 42
Mode choice models are usually underpinned by a utility maximising framework in which 43
travellers are assumed to evaluate the attributes of transport modes available to them for the 44
journey they are undertaking and choose the option that provides the greatest overall utility. 45
Travel times and costs are the attributes usually included in mode choice models with 46
sometimes additional attributes such as reliability included. Demographic and socio-47
economic characteristics (e.g. gender, income) are included as explanatory variables in mode 48
choice models to recognise that tendencies to use modes may vary in the population. After 49
including modal attributes and trip maker characteristics in mode choice models, there are 50

Clark, Chatterjee and Melia
TRB 2015 Annual Meeting Pre-print
4
usually unexplained preferences for particular modes and these are represented by alternative 1
specific constants in the utility function. 2
Recent work has sought to explain differences in individual mode preferences by 3
incorporating subjective variables relating to perceptions and attitudes in mode choice 4
models. For example, Johansson et al (4) found for a sample of workers commuting between 5
Uppsala and Stockholm in Sweden that attitudes towards flexibility and comfort, as well as 6
pro-environmental inclination, influenced their mode choices. These were additional to the 7
influence of modal time and cost. 8
Urban planners have an interest in how urban form influences travel behaviour and 9
have looked more broadly at the influence of the built environment on commute mode 10
choices than merely though their impact upon travel times and costs. They have shown that 11
commute mode choice can also be influenced by land use density, mix and design (5). A 12
study by Dalton et al (6) is an example of a study that considered a wide range of built 13
environment characteristics. They analysed a data set of commuters living in Cambridge 14
(n=1124) to identify which neighbourhood, route and workplace related environmental 15
characteristics influence mode choice. Those working in areas with fewer destinations were 16
less likely to use public transport or cycle, whilst the availability of free parking at the 17
workplace was associated with lower odds of using public transport, cycling or walking. The 18
distance to work strongly predicted walking and cycling and the models indicated that the 19
odds of walking and cycling were 3.9 and 1.3 times lower for each additional km. With 20
respect to the structure of the transport network, the authors report that “low junction density 21
(indicating poor street connectivity) and a greater distance to a railway station were 22
associated with lower odds of walking, cycling, and public transport use. A greater distance 23
to the nearest bus stop and a lower bus frequency were associated with lower odds of public 24
transport use.” 25
The question has been raised, however, as to whether built environment has a causal 26
influence on commute mode choice or whether people self-select into residential 27
neighbourhoods that suit their pre-existing commute mode preference. Studies that have 28
sought to distinguish between the effect of attitudes towards travel and the effect of built 29
environment have tended to confirm that both are important with built environment exerting 30
an independent effect, after controlling for measures of attitudinal self-selection (7). 31
Potentially, longitudinal studies that track commuting behaviour and individual 32
circumstances (including life events such as residential moves) over time can shed further 33
light on causal influences of commute mode choices and we now turn to these. 34
35
2.2 Determinants of changes to commute mode choice 36 37
We now review longitudinal studies of commuting behaviour that have identified 38
determinants of changes to commuting mode. A study by Panter et al (8) identified predictors 39
of changes in commuting mode occurring over a 12 month interval for a sample of 655 40
workers in Cambridge. The predictors tested were measured at baseline and reflected factors 41
(demographic, socio-economic, attitudinal, built environment) found to be relevant in cross-42
sectional studies. They found uptake of alternatives to the car was associated with being 43
older, having a degree, convenient cycle routes and a lack of free workplace parking. They 44
found increased walking to work was associated with not having children, convenient public 45
transport and a lack of free workplace parking. Increased cycling to work was predicted by 46
convenient cycle routes and more frequent bus services. The study did not test the influence 47
of change variables for events occurring in people’s lives or external situational factors. 48
49
The role of life events 50

Clark, Chatterjee and Melia
TRB 2015 Annual Meeting Pre-print
5
1
Dargay and Hanly (9) showed through a descriptive analysis of the British Household Panel 2
Survey (n~5,000) that 17.6% of surveyed commuters changed mode between years. A 3
bivariate analysis indicated that 14.0% of those who do not move home and do not change 4
employer change commute mode, but this increases to 28.1% for those who move home, 5
32.7% for those that change employer and 44.6% for those that change both home and 6
employer. This confirms susceptibility to these events for commute mode and is particularly 7
significant when recognising that 8.3% of survey sample moved home between any pair of 8
years, 9.3% changed employer and 2.0% changed both home and employer. While this study 9
shows that commuting mode is more likely to change at the time of these life events, other 10
factors have not been controlled for in these bivariate examples. 11
Oakil et al (10) is the only identified multiple regression analysis of the relationship 12
between a full range of life events and commute mode changes using a retrospective survey 13
capturing 21 year event histories for 200 respondents in the Utrecht region (Netherlands). 14
Shifts from commuting by car were associated with switching to part time work, changing 15
employer, and separation from a partner (1 year before the shift). Shifts to commuting by car 16
were associated with the birth of the first child, changing employer, and separation (1 year 17
before the shift). After controlling for other factors, residential relocations were not 18
significant (though this may be confounded by separation effects). Data limitations prevented 19
an examination of spatial context however. 20
Verplanken et al (2) studied the effect of residential relocations on the commuting 21
mode of 433 university employees and found employees who had moved within the last year 22
and were environmentally concerned used the car less frequently than environmentally 23
concerned commuters who had not moved within the last year. They suggest that the 24
contextual change allows environmentally concerned individuals to adjust their commuting 25
behaviour in line with their values. 26
Walker et al (11) investigated how the relocation of a workplace to a site with restricted 27
parking availability affected commuting mode choices and habits among affected staff. There 28
was a large increase in train use (19% to 56%) and reduction in car use (55% to 23%) after 29
the move. Habit strength was shown to weaken amongst both commute mode changers and 30
non-changers and new commuting habits were shown to grow, but remain relatively weak in 31
the weeks following the move. This indicates that people may be susceptible to reverting to 32
prior commuting behaviours following a contextual change. Walker et al also identified that 33
measures of pre-move habit strength, age, children and consideration of post-move travel 34
failed to predict commute mode changes in a logistic regression. The only significant factor 35
was level of environmental concern. They speculate that spatial context factors which were 36
omitted from their models were likely to be of greater importance. 37
Qualitative studies provide deeper insights into the process of changing commuting 38
behaviour in adjustment to a residential relocation. People are shown to differ in the extent to 39
which they plan travel, including the journey to work during the moving process and are not 40
fully aware of transport opportunities until after the move. Jones and Ogilvie (12), argue that 41
the notion of residential self-selection is consequently too deterministic. Stanbridge and 42
Lyons (13) identified that travel is considered at different stages in the moving process and in 43
particular when ‘selecting areas to search’, as a ‘prompt for the move’ and ‘after some time in 44
the new house’. Qualitative accounts also reveal that people may follow a process of ‘trial 45
and error’ adaptation to the new location, in which alternative commuting options are tried 46
out until a satisfactory travel routine is established. This process can continue for several 47
years after the move (12, 14). 48
Another body of work has examined how commuting influences the likelihood of home 49
or job moves. For example, Clark et al (15) found (using Puget Sound Transportation Panel 50

Clark, Chatterjee and Melia
TRB 2015 Annual Meeting Pre-print
6
data over the years 1989-1997) that both one-worker and two-worker households more 1
frequently decrease commute distance and time, or it stays the same, than increase it when 2
they move home (accompanied by job change or not). They develop a model which indicates 3
a critical value of 8 km as the commute distance beyond which the likelihood of decreasing 4
commute distance increases rapidly. This emphasises that it needs to be recognised that 5
homes and job changes are not strictly exogenous but may be motivated by a wish to reduce 6
the distance or time spent commuting, or use a particular mode of transport for the commute. 7
8
Changes to transport system 9
10
Changes to characteristics of the transport system are expected to influence commute mode 11
choices (based on the concept of utility maximisation) and indeed are implemented for this 12
purpose. Monitoring studies are often conducted to assess change in transport mode usage at 13
an aggregate level after transport system interventions. These often show that there is a 14
gradual response to an intervention with full impacts taking some time to be apparent (16). 15
Few monitoring studies collect longitudinal data on individual travellers that can be used to 16
confirm travellers react as anticipated to changes in the relative utilities of transport modes. A 17
few exceptions are now considered. 18
Bradley (17) reported on mode choice modelling he conducted looking at the effect on 19
mode choice of a new rail commuter line in the Netherlands. Before and after panel data for 20
475 commuters collected a year apart showed that 119 of the 475 car and bus commuters 21
switched to the train. Bradley tested a dynamic model specification for the mode choice after 22
the new line opened which accounted for the utility before and after the line opening. This 23
showed that utilities in both periods were significant and demonstrates that the commuters 24
had responded to the change in transport options but not completely adjusted to them at the 25
time of the after survey. This suggests that commuters respond to a change in the transport 26
system but not always instantaneously – one reason for a delay in response could be that 27
residents are triggered to act when events occur in their lives that prompt them to think about 28
travel conditions and options. To our knowledge no studies have been conducted that have 29
considered the role of life events in how travellers respond to a change in the transport 30
system. 31
32
Information and marketing interventions 33
34
As well as transport system changes, current transport policy is interested in the potential for 35
information and marketing measures to influence transport mode choices. Tornblad et al (18) 36
tested the impact of tailored information accompanied by a free seven-day public transport 37
pass on 498 commuters in Lillestrøm, Norway, and found no significant effect on commuting 38
by car in the short run (five weeks after) and medium run (five months after). 39
In contrast, Thøgersen (19) evaluated the impact of a free one month public transport 40
card on 373 car owners in Copenhagen and found that it led to a significant increase in public 41
transport use of commuters during the intervention period from 5% to 10%. Five months after 42
the intervention public transport use stayed higher at 7% and more positive beliefs about 43
public transport use were evident. Thøgersen suggested the intervention could be more 44
effective if targeted at people undergoing changes in their lives and referred to research by 45
Bamberg et al (20) who investigated changes in car use of people moving home to Stuttgart, 46
Germany. Half of the subjects in this study were given a public transport information pack 47
(including a free day ticket) and half were not given the pack. They found from comparing 48
behaviour before the move and six weeks after the move that for both sets of participants the 49
change in decision context caused the subjects to re-evaluate their behaviour. As expected, 50

Clark, Chatterjee and Melia
TRB 2015 Annual Meeting Pre-print
7
the participants receiving the pack changed more to public transport use after the move (19% 1
to 47% compared to 19% to 24%). This indicates that an intervention timed to coincide with 2
a major life event can achieve a desired shift in travel behaviour. 3
4
3. KNOWLEDGE GAPS AND STUDY CONTRIBUTION 5 6
Studies of the impact of life events have shown that changes in commuting mode are more 7
likely when life events occur and that spatial context and attitudes play a role at these 8
occasions. Studies of the impact of transport interventions (system changes or information 9
and marketing) have shown that changes in commuting mode occur but that responsiveness 10
depends on individual circumstances. This indicates the value of investigating further the role 11
of life events. 12
The novel contribution of this study is to develop models for the probability of 13
changing commute mode that consider a full range of life events, at the same time as 14
comprehensively controlling for demographics and socio-economics, environmental attitudes, 15
spatial context and, importantly, changes in the distance to work. Such comprehensive 16
models have not been possible to date owing to panel data constraints and a new opportunity 17
to rigorously address this evidence gap arose following the initiation of a new large scale UK 18
Household Panel Study in 2009 (described in Section 5). The study also contributes to the 19
development of theory of travel behaviour change, by empirically examining relationships 20
put forward in the conceptual framework now described. 21
22
4. RESEARCH FRAMEWORK 23 24
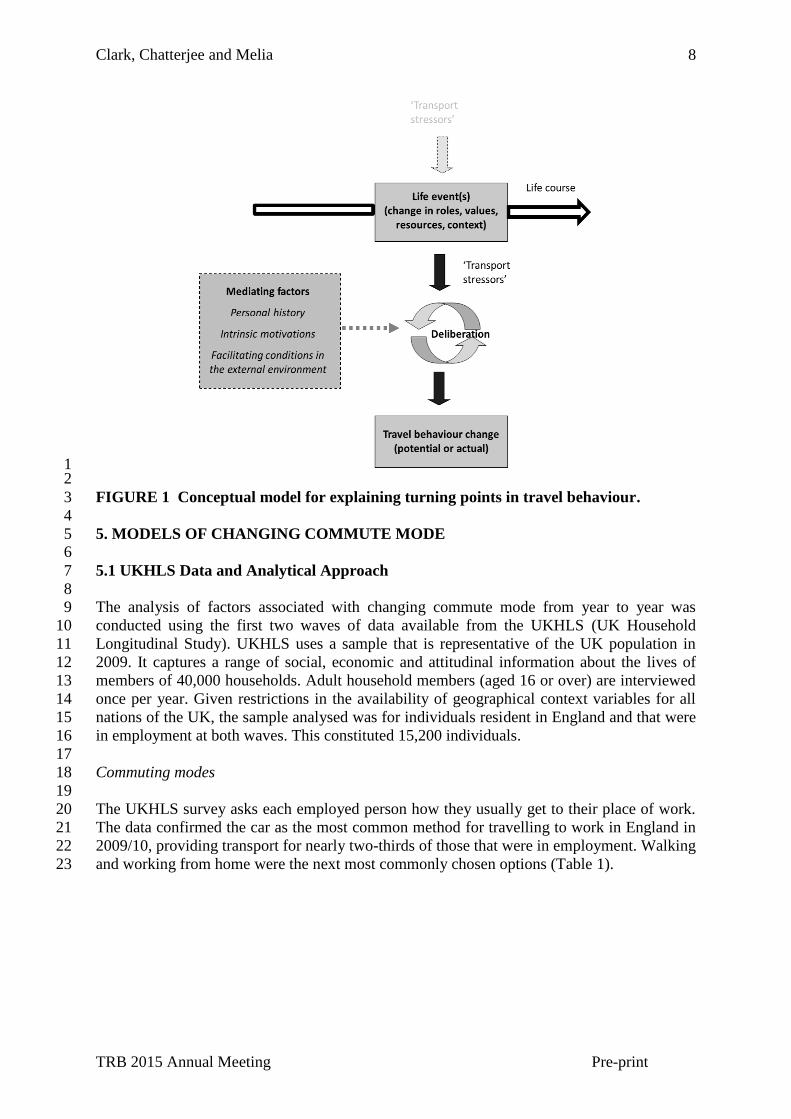
Our generalised conceptual model for the relationship between life events and travel 25
behaviour is shown in Figure 1. The hypothesis made is that travel behaviour changes are 26
triggered by a contextual change (a life event for the purposes of our research but this could 27
also be a transport intervention). Life events can alter the roles that people perform within 28
their family and social networks, alter the values people hold, alter the resources available for 29
travel and alter the context for travel. These can create ‘transport stressors’, which entail 30
discrepancies between the current transport circumstances and a desirable alternative (21) and 31
can change the travel mode alternatives that are available, the characteristics of travel that are 32
considered salient and hence attitudes towards transport modes (22). Three types of 33
mediating factor are hypothesised to play a role in the outcome on travel behaviour of 34
contextual change. These are personal history (for example, experience in using travel 35
modes), intrinsic motivations (for example, saving money or improving health) and 36
facilitating conditions (for example, public transport availability). 37
In the context of commute mode changes, life events are most likely to alter the 38
origin/destination or the length of the journey to work, and/or the transport options that are 39
available to serve the journey to work. They can also alter broader activity needs and 40
schedules which can affect attitudes towards transport modes. We also acknowledge that life 41
events themselves can be partly induced by transport considerations (such as a long 42
commute). Figure 1 shows that ‘transport stressors’ can act to cause life events, as well as life 43
events acting to cause ‘transport stressors’. This relationship is not directly explored in this 44
paper (given data limitations) but recognition is given to it in interpreting the results. The 45
method and results of our study are now reported. 46
Clark, Chatterjee and Melia
TRB 2015 Annual Meeting Pre-print
8
1 2
FIGURE 1 Conceptual model for explaining turning points in travel behaviour. 3
4
5. MODELS OF CHANGING COMMUTE MODE 5 6
5.1 UKHLS Data and Analytical Approach 7
8 The analysis of factors associated with changing commute mode from year to year was 9
conducted using the first two waves of data available from the UKHLS (UK Household 10
Longitudinal Study). UKHLS uses a sample that is representative of the UK population in 11
2009. It captures a range of social, economic and attitudinal information about the lives of 12
members of 40,000 households. Adult household members (aged 16 or over) are interviewed 13
once per year. Given restrictions in the availability of geographical context variables for all 14
nations of the UK, the sample analysed was for individuals resident in England and that were 15
in employment at both waves. This constituted 15,200 individuals. 16
17
Commuting modes 18
19
The UKHLS survey asks each employed person how they usually get to their place of work. 20
The data confirmed the car as the most common method for travelling to work in England in 21
2009/10, providing transport for nearly two-thirds of those that were in employment. Walking 22
and working from home were the next most commonly chosen options (Table 1). 23

Clark, Chatterjee and Melia
TRB 2015 Annual Meeting Pre-print
9
TABLE 1 2009 commuting modal share for the English workforce. 1
2
Commute mode
Percentage of English workforce (weighted)
Unweighted sample counts / percentage
Frequency Percent
Car (as driver or passenger) 64.2% 9561 62.9
Walk 10.0% 1621 10.7
Work from home 7.8% 1145 7.5
Bus/coach 5.4% 1014 6.7
Train 4.5% 679 4.5
Cycle 3.6% 478 3.1
Underground/light rail 2.7% 457 3.0
Other 1.7% 245 1.6
Total 100.0% 15200 100.0 3
Changing commute mode from year to year 4
5
3,056 (20%) of the 15,200 employees changed commuting mode by the following year. Table 6
2 shows, by mode, the percentage of people choosing the same or an alternative commuting 7
mode by the following year. This shows that car commuting is a more stable option compared 8
to other modes. It also illustrates how the car is the most attractive alternative to users of 9
other modes. For example over 90% of car commuters were still commuting by car the 10
following year. By contrast, a third of cyclists had changed to an alternative mode, with the 11
largest share (16% of cyclists) switching to commuting by car. 12
A separate analysis of British Household Panel Survey (predecessor to UKHLS) data 13
for 1991 – 2009 showed that the mean duration of car commuting (among the 4,098 14
respondents who participants in all 18 waves) was 6.3 years, while for public transport 15
commuting it was 3.0 years and active commuting (commuting by walking or cycling) was 16
3.2 years. This highlights that people do not maintain non-car commuting for very long and 17
once they start commuting by car, they are likely to remain a car commuting for a 18
considerable length of time. 19
20
TABLE 2 People choosing the same/new commute mode by the following year, by 21
mode. 22
%age of people choosing each commute mode by 2010/11
Commute mode in 2009/10 Car
Wal
k
WFH
Bu
s/co
ach
Trai
n
Cyc
le
Met
ro
Oth
er
Car 91.4% 2.5% 2.1% 1.1% 1.0% 0.6% 0.3% 1.0%
Walk 13.3% 76.1% 1.5% 4.6% 1.3% 1.6% 0.5% 1.0%
WFH 26.5% 3.5% 62.4% 0.8% 3.0% 0.6% 1.0% 2.3%
Bus/coach 16.6% 8.4% 1.1% 65.8% 2.7% 1.7% 2.5% 1.4%
Train 9.3% 2.9% 2.7% 5.7% 70.7% 1.0% 6.6% 1.0%
Cycle 16.3% 9.0% 0.8% 1.7% 1.9% 67.4% 1.0% 1.9%
Metro 6.8% 2.0% 2.4% 8.3% 13.1% 1.5% 64.3% 1.5%
Other 29.4% 10.6% 4.1% 2.4% 4.5% 3.3% 2.9% 42.9%
23

Clark, Chatterjee and Melia
TRB 2015 Annual Meeting Pre-print
10
Analysis of changes to commuting mode 1
2
The substantive analysis focussed on identifying factors (including life events and spatial 3
context) associated with commuting by car (driving or getting a lift) and changes to and from 4
this position and factors associated with commuting by active travel (walking and cycling, 5
herein referred to as active commuting) and changes to and from this position. There is major 6
policy interest in the UK in encouraging commuting by alternatives to the car and in 7
particular by active travel modes for those whom this is feasible. 8
These commuting behaviours were analysed through a two-step regression approach. 9
In step one a cross-sectional model was estimated, on the full wave one sample, to identify 10
factors associated with the commuting states of interest; namely: car commuting and active 11
commuting. In step two, transition models were estimated for the commute mode changes of 12
interest (to/from car commuting; to/from active commuting). The transition models were 13
estimated on the appropriate subsample i.e. switching from car commuting is applicable only 14
to those individuals that were commuting by car in wave one. For each employee there was 15
one observation (continue to use the same mode at wave 2 or change mode), so there is no 16
need to account for within-person serial correlation in observations. The dependent variables 17
for each model are described in Table 3. 18

Clark, Chatterjee and Melia
TRB 2015 Annual Meeting Pre-print
11
TABLE 3 Dependent variable descriptive statistics. 1
Wave one Changing mode by wave two
Variable n % n %
Commute by car 9432 63.03 812 8.6
Commute by non-car 5532 36.97 916 16.6
Total 14964 100 Commute by Active Travel 2070 13.83 465 22.5 Commute by non-Active Travel 12894 86.17 519 4.0
Total 14964 100
Notes: sample counts have been adjusted for missing values in the explanatory variables used in the regression models
2
Binary logistic regressions were employed for both the cross-sectional models and the 3
transition models. The dependent variables take the value ‘1’ for the outcome of interest 4
(commuting by car or active travel or changing to or from these positions) or ‘0’ otherwise. 5
Baseline variables for individual characteristics at wave one are included in the cross-6
sectional models and the commute mode change models. The transition models also include 7
life events and a number of other change variables to capture changes in circumstance by 8
wave two. With more waves of data available it would be possible consider longer term 9
dynamics of commuting behaviour (such as lags and leads of commute mode changes in 10
relation to life events). 11
12
Explanatory Variables – Baseline 13
14
The baseline variables include indicators of travel behaviour, distance to work, environmental 15
attitude, household composition, socio-economic status and the geographical context in 16
which the individual resides. The geographical context variables were drawn from other 17
neighbourhood level data sets and linked to UKHLS via a geographic identifier - the UK 18
census Lower Layer Super Output Area (LSOA). These linked variables are summarised in 19
Table 4. 20

Clark, Chatterjee and Melia
TRB 2015 Annual Meeting Pre-print
12
TABLE 4 Geographic context variables. 1
2 Neighbourhood variable Source data set Definition
Settlement type (London &
Metropolitan, Other urban,
Rural)
UK National Travel Survey
categories
Degree of urbanity of area of residence
Population density UK Census 2001 Population density in area of residence
Proportion of population
economically active
UK Census 2001 -
Travel time to the nearest
employment centre with at least
100 jobs by PT/Walk (mins)
DfT accessibility indicators
2009
Time taken by public transport to reach
closest employment centre
Number of employment centres
with at least 100 jobs accessible
by PT/walk (weighted by
distance decay function)
DfT accessibility indicators
2009
Ease of access by public transport to
major employment opportunities
Travel time to nearest town
centre by PT/walk (mins)
DfT accessibility indicators
2009
Time taken by public transport to reach
closest commercial centre
Number of food stores
accessible by PT/walk
(weighted by distance decay
function)
DfT accessibility indicators
2009
Ease of access by public transport to
food shops (indicator of mixed land use)
Overall Index of Multiple
Deprivation (IMD)
Indices of Multiple Deprivation
2010
Overall level of social deprivation
Living environment IMD Indices of Multiple Deprivation
2010
Index combining measures of poor
quality housing, numbers of road
casualties and air pollution
Presence of railway station in
LSOA or surrounding LSOA
National Public Transport Data
Repository
-
No. of bus stops in LSOA National Public Transport Data
Repository
-
Note: All variables measured at Lower Layer Super Output Area level (typically population of 1500), except
population density measured at Medium Layer Super Output Area level (typically population of 7000)
3
Distance to work was only collected during the first six months of the wave one survey 4
(owing to having to shorten the UKHLS interview during wave one). Models were also 5
estimated on the work-distance subsample (n=4,288) as a robustness check for the preferred 6
(full sample) model results. 7
Environmental attitude was measured in the base year as a binary response to the 8
statement “any changes I make to help the environment need to fit in with my lifestyle” 9
(agreement or disagreement). 10
11
Explanatory Variables – Life events and other change variables 12
13 Continuous change variables: A number of continuous difference variables were included 14
to capture changes in geographic context (such as an increase in number of local bus stops/ 15
increase in population density) and change in household income between waves one and two. 16
Note that a change in geographic context could only occur in association with a residential 17
relocation as the geographic context variables were statically defined as a baseline measure. 18
Change in distance to work: Given that the work distance variable included a large 19
number of missing values in wave one, it was necessary to code change in work distance as a 20
categorical variable (including missing as a category to retain all observations). A single 21
distance change threshold was defined for each commute mode switch. Sensitivity tests 22
indicated that changes from 3 miles or over to below 3 miles most strongly predicted 23
switches to non-car and to active commuting, while changes from 2 miles or less to over 2 24

Clark, Chatterjee and Melia
TRB 2015 Annual Meeting Pre-print
13
miles most strongly predicted switches to car and non-active commuting. These distance 1
change thresholds were used in the preferred models. 2
Life events: Dummy variables were coded for the range of life events summarised in 3
Table 5. Employment changes were the most frequently experienced events followed by 4
residential relocations. For each life event subsample, Table 5 also reports the percentage of 5
individuals that experienced different commute mode changes. This may be compared to the 6
proportion of commute mode changers for the full sample of interest (shown in bold in the 7
first row of Table 5 to identify whether the life event is associated with increased prevalence 8
of commute mode change. 9
10
TABLE 5 Percentage of commuters changing commute mode in association with life 11
events. 12
Full sample Car to non-
car
Non-car to
car
Active to
non-active
Non-active to
active
n %a n %
c n %
c n %
c n %
c
Full sample 14964 100.0 9432b 8.6 5532
b 16.6 2070
b 22.5 12894
b 4.0
Life event sub samples
Switched employer 1576 10.5 971 *18.2 605 *30.3 192 *59.4 1384 *8.7
Residential relocation 1012 6.8 590 *15.1 422 *23.0 178 *38.2 834 *7.9
Had child 578 3.9 368 9.2 210 20.5 80 26.3 498 3.2
Acquired driving licence 281 1.9 72 *15.3 209 *34.9 73 *52.1 208 *6.7
Started cohabiting 278 1.9 176 *14.2 102 **22.6 42 *35.7 236 5.5
Stopped cohabiting 183 1.2 116 *15.5 67 14.9 25 16.0 158 *7.6
Notes:
a: % individuals experiencing the life event
b: size of wave one commute mode sub sample (car, non car, active or non-active)
c: % of individuals changing commute mode
*: life event subgroup has a higher/lower prevalence of commute mode change compared to sample average,
significant at 95% level
**: significant at 90% level
13
The comparison indicates that, of the life events tested, residential relocations, 14
employment switches and gaining a driving licence were most strongly associated with 15
increased prevalence of changing commute mode to/from car/active commuting. It is also 16
once again apparent that switching away from non-car and active commuting is far more 17
prevalent than switching towards non-car or active commuting in association with a life 18
event. For example, the majority of active commuters in the sample, nearly 60%, switched to 19
non-active commuting when they changed employer. Having a child is not found to be 20
significant although there may be longer term effects of this life event that are not observable 21
in this two wave sample. For example, parents returning to work from maternity leave may 22
adopt alternative commuting behaviours and a large proportion of these individuals are likely 23
to be excluded from this two wave sample. 24
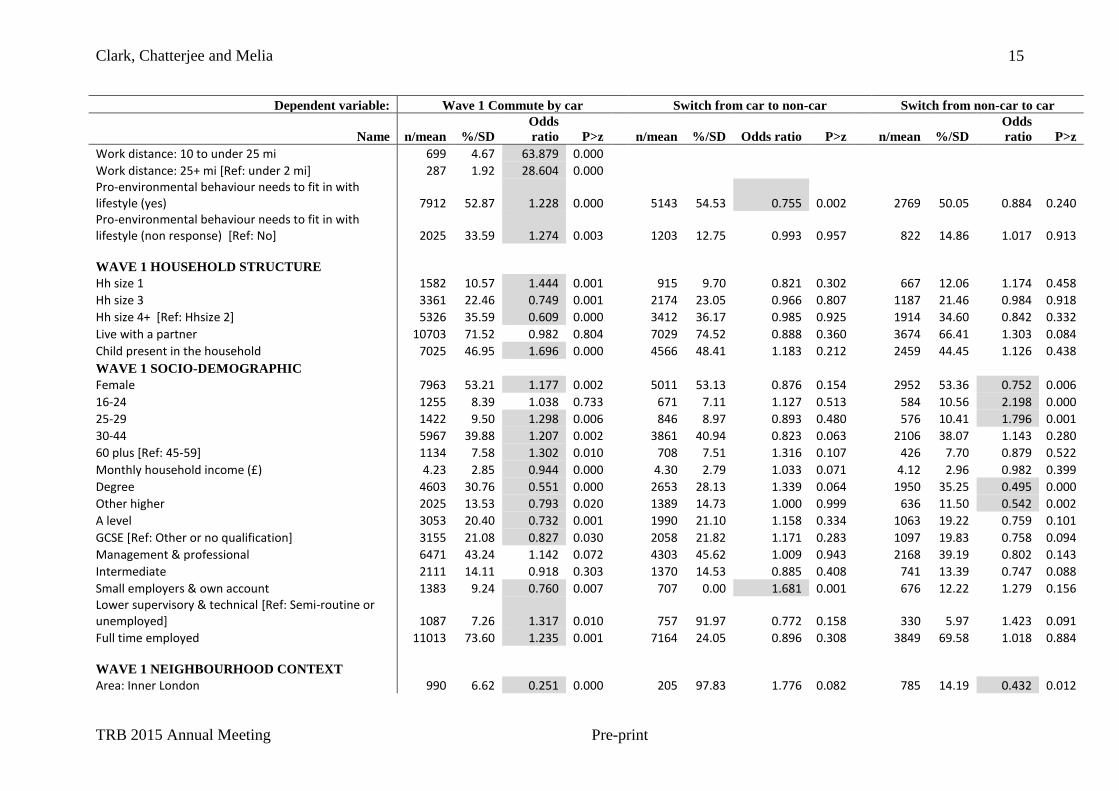
The regression models for car and active commuting are presented in Tables 6 and 7 25
respectively. Note that these tables also report descriptive statistics for all explanatory 26
variables (counts and percentages for categorical variables and means and standard deviations 27
for continuous variables). 28

Clark, Chatterjee and Melia
TRB 2015 Annual Meeting Pre-print
14
TABLE 6 Logistic regression models of car commuting and switches to and from this. 1
2
Dependent variable: Wave 1 Commute by car Switch from car to non-car Switch from non-car to car
Name n/mean %/SD
Odds
ratio P>z n/mean %/SD Odds ratio P>z n/mean %/SD
Odds
ratio P>z
LIFE EVENTS
Residential relocation 1012 6.76
590 6.26 1.803 0.000
422 7.63 1.684 0.006
Change in number of bus stops in LSOA 0.01 3.94
0.01 3.11 1.003 0.812
0.02 5.05 0.992 0.441
Change in rail station proximity 0.00 0.15
0.00 0.15 0.982 0.942
0.00 0.16 0.584 0.071 Change in travel time to nearest employment centre by PT/walk (mins) 0.01 1.39
0.01 1.51 0.918 0.020
0.02 1.17 1.106 0.052
Change in no. of emp centres with 100+ jobs by PT/walk -0.01 0.23
-0.01 0.24 0.934 0.786
0.00 0.22 0.956 0.888
Change in travel time to nearest town centre by PT/walk (mins) 0.01 1.39
0.02 2.96 1.035 0.058
0.02 2.96 0.996 0.858
Change in no. of foodstores accessible by PT/walk in LSOA -0.01 0.27
-0.01 0.27 1.059 0.788
0.00 0.26 0.753 0.305
Change in MSOA population density -0.10 7.59
0.01 6.20 1.017 0.007
-0.27 9.50 1.003 0.622
Had child 578 3.86
368 3.90 1.127 0.582
210 3.80 1.164 0.537
Starting cohabiting 278 1.86
176 1.87 1.092 0.760
102 1.84 1.559 0.211
Stopped cohabiting 183 1.22
116 1.23 2.317 0.008
67 1.21 0.748 0.533
Switched employer 1576 10.53
971 10.29 2.538 0.000
605 10.94 2.479 0.000
Acquired driving licence 281 1.88
72 0.76 0.369 0.015
209 3.78 16.649 0.000
Change in work distance: missing 10738 71.76
7256 76.93 1.656 0.000
3482 62.94 1.600 0.000 Change in work distance to: below 3 mi to non car, above 2 mi to car [ref: no]
141 1.60 9.155 0.000
292 5.28 30.179 0.000
Change in income 0.24 2.41
0.22 2.35 1.017 0.346
0.29 2.52 0.994 0.756
WAVE 1 BEHAVIOUR AND ATTITUDES
No. of household cars 1.53 0.83 3.038 0.000
1.76 0.71 0.798 0.003
1.14 0.87 1.462 0.000
Driving licence availability 12634 84.43 10.207 0.000
8998 95.40 0.178 0.000
3636 65.73 5.647 0.000
Work distance: missing 10677 71.35 37.366 0.000 Work distance: 2 to under 5 mi 913 6.10 44.248 0.000 Work distance: 5 to under 10 mi 732 4.89 54.699 0.000
Clark, Chatterjee and Melia
TRB 2015 Annual Meeting Pre-print
15
Dependent variable: Wave 1 Commute by car Switch from car to non-car Switch from non-car to car
Name n/mean %/SD
Odds
ratio P>z n/mean %/SD Odds ratio P>z n/mean %/SD
Odds
ratio P>z
Work distance: 10 to under 25 mi 699 4.67 63.879 0.000 Work distance: 25+ mi [Ref: under 2 mi] 287 1.92 28.604 0.000 Pro-environmental behaviour needs to fit in with
lifestyle (yes) 7912 52.87 1.228 0.000
5143 54.53 0.755 0.002
2769 50.05 0.884 0.240 Pro-environmental behaviour needs to fit in with lifestyle (non response) [Ref: No] 2025 33.59 1.274 0.003
1203 12.75 0.993 0.957
822 14.86 1.017 0.913
WAVE 1 HOUSEHOLD STRUCTURE
Hh size 1 1582 10.57 1.444 0.001
915 9.70 0.821 0.302
667 12.06 1.174 0.458
Hh size 3 3361 22.46 0.749 0.001
2174 23.05 0.966 0.807
1187 21.46 0.984 0.918
Hh size 4+ [Ref: Hhsize 2] 5326 35.59 0.609 0.000
3412 36.17 0.985 0.925
1914 34.60 0.842 0.332
Live with a partner 10703 71.52 0.982 0.804
7029 74.52 0.888 0.360
3674 66.41 1.303 0.084
Child present in the household 7025 46.95 1.696 0.000
4566 48.41 1.183 0.212
2459 44.45 1.126 0.438
WAVE 1 SOCIO-DEMOGRAPHIC
Female 7963 53.21 1.177 0.002
5011 53.13 0.876 0.154
2952 53.36 0.752 0.006
16-24 1255 8.39 1.038 0.733
671 7.11 1.127 0.513
584 10.56 2.198 0.000
25-29 1422 9.50 1.298 0.006
846 8.97 0.893 0.480
576 10.41 1.796 0.001
30-44 5967 39.88 1.207 0.002
3861 40.94 0.823 0.063
2106 38.07 1.143 0.280
60 plus [Ref: 45-59] 1134 7.58 1.302 0.010
708 7.51 1.316 0.107
426 7.70 0.879 0.522
Monthly household income (£) 4.23 2.85 0.944 0.000
4.30 2.79 1.033 0.071
4.12 2.96 0.982 0.399
Degree 4603 30.76 0.551 0.000
2653 28.13 1.339 0.064
1950 35.25 0.495 0.000
Other higher 2025 13.53 0.793 0.020
1389 14.73 1.000 0.999
636 11.50 0.542 0.002
A level 3053 20.40 0.732 0.001
1990 21.10 1.158 0.334
1063 19.22 0.759 0.101
GCSE [Ref: Other or no qualification] 3155 21.08 0.827 0.030
2058 21.82 1.171 0.283
1097 19.83 0.758 0.094
Management & professional 6471 43.24 1.142 0.072
4303 45.62 1.009 0.943
2168 39.19 0.802 0.143
Intermediate 2111 14.11 0.918 0.303
1370 14.53 0.885 0.408
741 13.39 0.747 0.088
Small employers & own account 1383 9.24 0.760 0.007
707 0.00 1.681 0.001
676 12.22 1.279 0.156 Lower supervisory & technical [Ref: Semi-routine or unemployed] 1087 7.26 1.317 0.010
757 91.97 0.772 0.158
330 5.97 1.423 0.091
Full time employed 11013 73.60 1.235 0.001
7164 24.05 0.896 0.308
3849 69.58 1.018 0.884
WAVE 1 NEIGHBOURHOOD CONTEXT
Area: Inner London 990 6.62 0.251 0.000
205 97.83 1.776 0.082
785 14.19 0.432 0.012
Clark, Chatterjee and Melia
TRB 2015 Annual Meeting Pre-print
16
Dependent variable: Wave 1 Commute by car Switch from car to non-car Switch from non-car to car
Name n/mean %/SD
Odds
ratio P>z n/mean %/SD Odds ratio P>z n/mean %/SD
Odds
ratio P>z
Area: Outer London 1644 10.99 0.386 0.000
759 91.95 1.138 0.544
885 16.00 0.590 0.040
Area: Metropolitan areas 2254 15.06 1.086 0.471
1471 84.40 0.718 0.084
783 14.15 1.357 0.198
Area: Large urban (250k+) 1665 11.13 1.027 0.827
1087 88.48 0.926 0.695
578 10.45 1.274 0.333
Area: Medium urban (25k-250k) 3894 26.02 0.939 0.529
2647 71.94 1.002 0.989
1247 22.54 1.376 0.130
Area: Small urban (10k-25k) 1100 7.35 0.982 0.877
783 91.70 0.923 0.681
317 5.73 1.750 0.026
Area: Very small urban (3k-10k) [Ref: rural] 772 5.16 0.833 0.170
548 94.19 1.061 0.778
224 4.05 1.297 0.339 Travel time to nearest employment centre by PT/walk (mins) 9.65 5.50 0.997 0.638
9.98 5.36 0.989 0.324
9.09 5.69 1.019 0.080
No. of emp centres with 100+ jobs by PT/walk 7.10 1.00 1.068 0.157
6.99 0.99 0.943 0.453
7.29 0.99 1.298 0.006
Travel time to nearest town centre by PT/walk (mins) 16.67 10.95 1.003 0.393
17.57 11.26 1.005 0.324
15.15 10.23 1.007 0.274
No. of foodstores accessible by PT/walk in LSOA 3.40 1.01 0.940 0.159
3.27 0.99 1.132 0.098
3.62 1.01 0.998 0.979
Rail station in LSOA or neighbouring LSOA 5234 34.98 0.891 0.035
3164 66.45 1.113 0.248
2070 37.42 0.850 0.136
Number of bus stops in LSOA 10.85 11.41 0.995 0.070
11.14 9.60 0.998 0.719
10.36 13.96 0.991 0.091
MSOA population density (persons/HA) 31.33 31.66 0.994 0.000
24.98 24.54 1.002 0.508
42.15 38.72 0.997 0.255
LSOA proportion economically active 0.64 0.09 3.250 0.004
0.65 0.09 0.596 0.453
0.63 0.10 1.680 0.509
Overall Index of Multiple Deprivation score 20.50 14.60 1.019 0.000
18.89 13.94 0.992 0.144
23.23 15.27 1.009 0.123 Living environment Index of Multiple Deprivation score 21.25 16.27 0.989 0.000
18.69 15.17 1.009 0.011
25.61 17.13 0.999 0.738
Ethnic minority boost sample household 1768 11.82 1.025 0.774
771 8.17 1.203 0.237
997 18.02 1.429 0.022
Constant
0.001 0.000
0.366 0.202
0.001 0.000
/lnsig2u
-0.405 0.000
-0.224 0.000
0.152 0.000
sigma_u
0.817 0.000
0.894 0.000
1.079 0.000
rho
0.169 0.000
0.195 0.000
0.261 0.000
n/% 14964 100
9432 63.03
5532 36.97 Successes 9432 63.03 812 8.6 916 16.6
Notes: Grey shading indicates significance at 95% level
1
2
Clark, Chatterjee and Melia
TRB 2015 Annual Meeting Pre-print
17
TABLE 7 Logistic regression models of active commuting and switches to and from this. 1
2
Dependent variable: Wave 1 commute by active travel Change from active to non-active Change from non-active to active
Name n/mean %/SD
Odds
ratio P>z n/mean %/SD
Odds
ratio P>z n/mean %/SD
Odds
ratio P>z
LIFE EVENTS
Residential relocation 1012 6.8
178 8.6 2.007 0.018
834 6.5 1.717 0.002
Change in number of bus stops in LSOA 0.01 3.9
-0.10 7.4 0.997 0.848
0.03 3.1 1.003 0.818
Change in rail station proximity 0.00 0.2
-0.01 0.2 0.899 0.825
0.00 0.2 1.085 0.746 Change in travel time to nearest employment centre by PT/walk (mins) 0.01 1.4
0.03 1.1 1.377 0.001
0.01 1.4 0.933 0.076
Change in no. of emp centres with 100+ jobs by PT/walk -0.01 0.2
0.00 0.2 1.521 0.415
-0.01 0.2 0.505 0.007
Change in travel time to nearest town centre by PT/walk (mins) 0.01 1.4
0.03 3.3 0.994 0.848
0.02 2.9 0.984 0.340
Change in no. of foodstores accessible by PT/walk in LSOA -0.01 0.3
-0.01 0.3 0.538 0.206
-0.01 0.3 1.524 0.054
Change in MSOA population density -0.10 7.6
-0.21 8.5 0.999 0.933
-0.08 7.4 1.005 0.307
Had child 578 3.9
80 3.9 0.761 0.480
498 3.9 0.743 0.295
Starting cohabiting 278 1.9
42 2.0 1.209 0.716
236 1.8 0.816 0.548
Stopped cohabiting 183 1.2
25 1.2 0.357 0.228
158 1.2 1.371 0.373
Switched employer 1576 10.5
192 9.3 11.050 0.000
1384 10.7 2.564 0.000
Acquired driving licence 281 1.9
73 3.5 7.421 0.000
208 1.6 0.567 0.071
Change in work distance: missing 10738 71.8
1627 78.6 1.321 0.172
9111 70.7 1.266 0.046 Change in work distance to: below 3 mi to active, above 2 mi to non-active [ref: no]
41 2.0 31.364 0.000
184 1.4 4.674 0.000
Change in income 0.24 2.4
0.26 2.2 1.026 0.463
0.24 2.4 0.977 0.358
BEHAVIOUR AND ATTITUDES
No. of household cars 1.53 0.8 0.515 0.000
1.08 0.8 1.234 0.083
1.60 0.8 0.655 0.000
Driving licence availability 12634 84.4 0.305 0.000
1248 60.3 2.161 0.000
11386 88.3 0.428 0.000
Work distance: missing 10677 71.4 0.745 0.002 Work distance: 2 to under 5 mi 913 6.1 0.590 0.000 Work distance: 5 to under 10 mi 732 4.9 0.157 0.000 Work distance: 10 to under 25 mi 699 4.7 0.024 0.000 Work distance: 25+ mi [Ref: under 2 mi] 287 1.9 0.000 0.995

Clark, Chatterjee and Melia
TRB 2015 Annual Meeting Pre-print
18
Dependent variable: Wave 1 commute by active travel Change from active to non-active Change from non-active to active
Name n/mean %/SD
Odds
ratio P>z n/mean %/SD
Odds
ratio P>z n/mean %/SD
Odds
ratio P>z
Pro-environmental behaviour needs to fit in with lifestyle (yes) 7912 52.9 0.775 0.000
1030 49.8 1.006 0.969
6882 53.4 0.796 0.036
Pro-environmental behaviour needs to fit in with lifestyle (non response) [Ref: No] 2025 13.5 0.710 0.001
288 13.9 1.484 0.099
1737 13.5 1.150 0.329
WAVE 1 HOUSEHOLD STRUCTURE
Hh size 1 1582 10.6 0.762 0.035
226 10.9 0.862 0.646
1356 10.5 0.950 0.800
Hh size 3 3361 22.5 1.337 0.005
464 22.4 0.986 0.956
2897 22.5 0.839 0.287
Hh size 4+ [Ref: Hhsize 2] 5326 35.6 1.641 0.000
749 36.2 0.803 0.432
4577 35.5 1.152 0.409
Live with a partner 10703 71.5 1.018 0.837
1329 64.2 0.904 0.638
9374 72.7 1.012 0.933
Child present in the household 7025 47.0 0.763 0.006
977 47.2 1.185 0.476
6048 46.9 1.199 0.228
WAVE 1 SOCIO-DEMOGRAPHIC
Female 7963 53.2 1.044 0.505
1232 59.5 0.871 0.396
6731 52.2 1.055 0.613
16-24 1255 8.4 0.916 0.476
267 12.9 4.054 0.000
988 7.7 1.116 0.567
25-29 1422 9.5 0.806 0.059
215 10.4 2.210 0.008
1207 9.4 1.041 0.817
30-44 5967 39.9 0.883 0.103
770 37.2 1.477 0.052
5197 40.3 0.859 0.215
60 plus [Ref: 45-59] 1134 7.6 0.645 0.001
122 5.9 0.799 0.569
1012 7.9 0.727 0.165
Monthly household income (£) 4.23 2.9 0.991 0.515
3.63 2.4 0.994 0.868
4.33 2.9 0.953 0.067
Degree 4603 30.8 1.028 0.804
535 25.9 0.958 0.881
4068 31.6 1.062 0.743
Other higher 2025 13.5 1.020 0.866
240 11.6 0.878 0.673
1785 13.8 1.061 0.767
A level 3053 20.4 0.929 0.491
409 19.8 0.806 0.432
2644 20.5 1.211 0.267
GCSE [Ref: Other or no qualification] 3155 21.1 1.051 0.621
521 25.2 1.103 0.696
2634 20.4 1.233 0.206
Management & professional 6471 43.2 0.517 0.000
637 30.8 1.200 0.413
5834 45.3 0.697 0.011
Intermediate 2111 14.1 0.623 0.000
277 13.4 1.162 0.546
1834 14.2 0.737 0.054
Small employers & own account 1383 9.2 0.267 0.000
87 4.2 2.071 0.059
1296 10.1 0.867 0.444 Lower supervisory & technical [Ref: Semi-routine or unemployed] 1087 7.3 0.750 0.017
166 8.0 1.821 0.043
921 7.1 0.720 0.107
Full time employed 11013 73.6 0.697 0.000
1304 63.0 1.293 0.170
9709 75.3 0.715 0.004
WAVE 1 NEIGHBOURHOOD CONTEXT
Area: Inner London 990 6.6 0.656 0.056
183 8.8 1.674 0.340
807 6.3 0.541 0.072
Area: Outer London 1644 11.0 0.697 0.037
166 8.0 1.514 0.346
1478 11.5 0.643 0.092
Area: Metropolitan areas 2254 15.1 1.001 0.996
319 15.4 1.237 0.590
1935 15.0 0.802 0.331

Clark, Chatterjee and Melia
TRB 2015 Annual Meeting Pre-print
19
Dependent variable: Wave 1 commute by active travel Change from active to non-active Change from non-active to active
Name n/mean %/SD
Odds
ratio P>z n/mean %/SD
Odds
ratio P>z n/mean %/SD
Odds
ratio P>z
Area: Large urban (250k+) 1665 11.1 1.415 0.026
276 13.3 1.189 0.670
1389 10.8 0.888 0.617
Area: Medium urban (25k-250k) 3894 26.0 1.602 0.000
645 31.2 0.921 0.814
3249 25.2 1.257 0.233
Area: Small urban (10k-25k) 1100 7.4 1.442 0.017
160 7.7 1.345 0.455
940 7.3 1.085 0.732
Area: Very small urban (3k-10k) [Ref: rural] 772 5.2 1.453 0.029
97 4.7 1.032 0.944
675 5.2 0.877 0.652 Travel time to nearest employment centre by PT/walk (mins) 9.65 5.5 0.980 0.022
8.67 4.2 1.026 0.263
9.81 5.7 0.985 0.270
No. of emp centres with 100+ jobs by PT/walk 7.10 1.0 0.723 0.000
7.22 1.0 1.521 0.006
7.08 1.0 0.915 0.342 Travel time to nearest town centre by PT/walk (mins) 16.67 11.0 0.993 0.071
14.86 10.1 1.015 0.144
16.97 11.0 1.005 0.442
No. of foodstores accessible by PT/walk in LSOA 3.40 1.0 1.265 0.000
3.67 1.0 0.830 0.184
3.36 1.0 1.223 0.020
Rail station in LSOA or neighbouring LSOA 5234 35.0 1.020 0.773
745 36.0 1.186 0.323
4489 34.8 1.054 0.631
Number of bus stops in LSOA 10.85 11.4 1.008 0.003
11.17 16.8 0.999 0.834
10.80 10.3 1.006 0.157
MSOA population density (persons/HA) 31.33 31.7 1.005 0.002
37.66 34.2 0.999 0.739
30.31 31.1 1.002 0.441
LSOA proportion economically active 0.64 0.1 0.339 0.031
0.63 0.1 3.269 0.336
0.65 0.1 0.291 0.108
Overall Index of Multiple Deprivation score 20.50 14.6 0.982 0.000
23.83 15.7 1.008 0.356
19.96 14.3 0.988 0.040 Living environment Index of Multiple Deprivation score 21.25 16.3 1.014 0.000
25.63 17.6 0.995 0.419
20.54 15.9 1.010 0.010
Ethnic minority boost sample household 1768 11.8 0.674 0.000
257 12.4 1.939 0.010
1511 11.7 0.826 0.253
Constant
21.356 0.000
0.001 0.000
0.299 0.187
/lnsig2u
0.253 0.000
0.593 0.000
-0.604 0.000
sigma_u
1.135 0.000
1.345 0.000
0.739 0.000
rho
0.281 0.000
0.355 0.000
0.142 0.000
n/% 14964 100
2070 100
12894 100 Successes 2070 13.8 465 22.5 519 4.0
Notes: Grey shading indicates significance at 95% level
1

Clark, Chatterjee and Melia
TRB 2015 Annual Meeting Pre-print
20
5.2 Regression Analysis: Car commuting and switches to/from this 1
2 Predictors of commuting by car 3
4
Before examining changes to/from car commuting the cross-sectional model is examined first 5
to identify factors associated with commuting by car in wave one. Car use opportunity and 6
distance to work have the strongest effects. Having a driving licence and greater access to 7
cars increases the likelihood of commuting by car. Commuting by car increases in likelihood 8
as the distance to work increases, but only up to 25 miles, after which rail competes with car. 9
The residential context has a strong effect with living in areas with greater access to 10
alternatives to the car (London, higher population density, proximity to rail, poorer living 11
environment – associated with main roads) reducing likelihood of commuting by car. Living 12
in areas of higher deprivation is also associated with higher likelihood of car commuting. 13
This may be because such locations have poorer public transport connectivity to employment. 14
After accounting for other factors, higher economic status, as indicated by educational 15
qualifications and income, is associated with reduced likelihood of car commuting. One 16
possible explanation for this is higher status jobs being located in larger urban areas that are 17
less accessible by car. Self-employed and those working for small employers are less likely to 18
commute by car (as they have a tendency to work from home) and those in lower supervisory 19
and technical roles have increased likelihood of commuting by car. Gender and life-stage 20
are relevant with the likelihood of car commuting greater for females, having children present 21
in the household and being 25-44 or 60+ (after accounting for other factors such as car access 22
and distance to work). This suggests that those with caring and household responsibilities 23
prefer to use a car. Attitudes are found to play a role with willingness to act to protect the 24
environment associated with lower likelihood of car use. 25
26
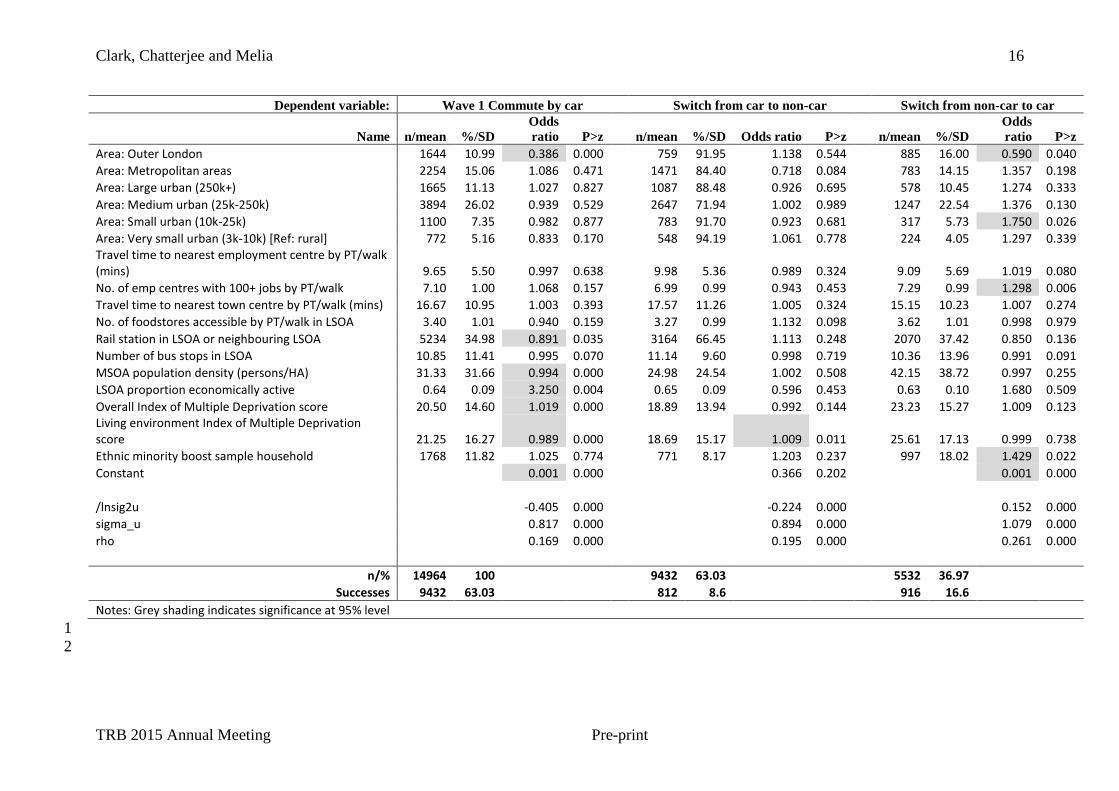
Predictors of switching to/from commuting by car 27
28
The transition models indicate that a change in distance to work most strongly predicts 29
switching to/from car commuting. The distance-commute mode relationship appears to be 30
asymmetric, with increases in distances having a stronger effect than reductions in distance 31
e.g. an increase from 2 miles or less to at least 2 miles increases the likelihood of switching to 32
car by 30 times, while a decrease from 3 miles or more to less than 3 miles increases 33
likelihood of switching to non-car commuting by only 9 times. 34
Such changes occur either when moving home or changing employer (or both). These 35
are frequently experienced, especially by younger adults, and are therefore of great 36
significance for commuting. Residential relocations that involve an increase in population 37
density and reduced public transport travel times to employment centres increase the 38
likelihood of switching to non-car commuting, highlighting the importance of public 39
transport availability/connectivity in reducing car commuting. Beyond these effects on 40
journey distance and context, changing employer and moving home, as events in themselves, 41
are associated with increased likelihood of changing to and from car commuting. This could 42
be simply because they prompt deliberation about how to get to work which would not occur 43
otherwise, but it may also be because they modify the attractiveness of commuting by 44
different modes in ways that were not captured by the data (no information was available on 45
transport attributes of the workplace). 46
Acquiring a driving licence is found to strongly predict a switch to car commuting – it 47
is worth noting that a licence may be acquired with travel to work in mind. Stopping 48
cohabitating increases likelihood of switching from car to non-car which reflects the loss of 49
a car which will often occur in this circumstance. The results also show that workers in 50

Clark, Chatterjee and Melia
TRB 2015 Annual Meeting Pre-print
21
different population groups and residential contexts have different propensities to switch to 1
and from car commuting. Those aged 16-29 are more likely than other age groups to 2
switch towards car commuting, indicating that young adults tend to move towards car 3
commuting in their early years in the labour force. On the other hand highly educated 4
individuals are less likely to switch to car commuting, suggesting that they take on jobs and 5
residential locations that do not suit car commuting (whether this is willingly or not is not 6
known). Willingness to act to protect the environment increases likelihood of switching 7
from car to non-car, but is not found to affect the opposite switch, which suggests that 8
attitude plays an active role for car commuters considering alternatives. 9
10
5.3 Regression Analysis: Active commuting and switches to/from this 11
12 Predictors of active commuting 13
14
The cross-sectional model confirms that many of the factors that predict car/non-car 15
commuting also predict active/non-active commuting. In this section we identify how these 16
attributes are similar or different to those found to be associated with car commuting. 17
In common with car commuting, distance to work and car use opportunity have the 18
strongest effects. Active commuting is most likely for those living within two miles of work 19
and the likelihood reduces for those within 2-5 miles (0.6 times the likelihood of those within 20
2 miles) and drops sharply for longer distances. Having a driving licence and greater access 21
to cars reduces the likelihood of active commuting. 22
The residential context has a strong effect, but different characteristics play a role than 23
with car commuting. Living in mixed land use areas (higher population density, close 24
proximity to food stores, not close to large employment centres, poorer living environment - 25
associated with main roads) and good access to bus services (more bus stops, shorter public 26
transport journey times to employment) increase likelihood of active commuting. Access to a 27
local rail station (which reduces likelihood of car commuting) does not have an effect. This 28
suggests that the nature of the local built environment is important to active commuting. The 29
result that higher deprivation is associated with lower likelihood of active commuting may 30
arise due to such locations being poorly connected to employment sites and/or social groups 31
living in these areas not being positive towards walking and cycling. Active commuting is 32
more likely in non-metropolitan urban areas than metropolitan areas (including London) and 33
rural areas after considering other factors such as distance to work and car ownership. 34
In contrast to car commuting, education level, income and gender are not important, but 35
employment type is found to have a stronger effect. Those working in higher categories of 36
employment (e.g. management roles) and those working for small employers or in self-37
employment are less likely to commute by active travel. The attitude relationship is as 38
expected with willingness to act to protect the environment associated with increased 39
likelihood of active commuting. 40
41
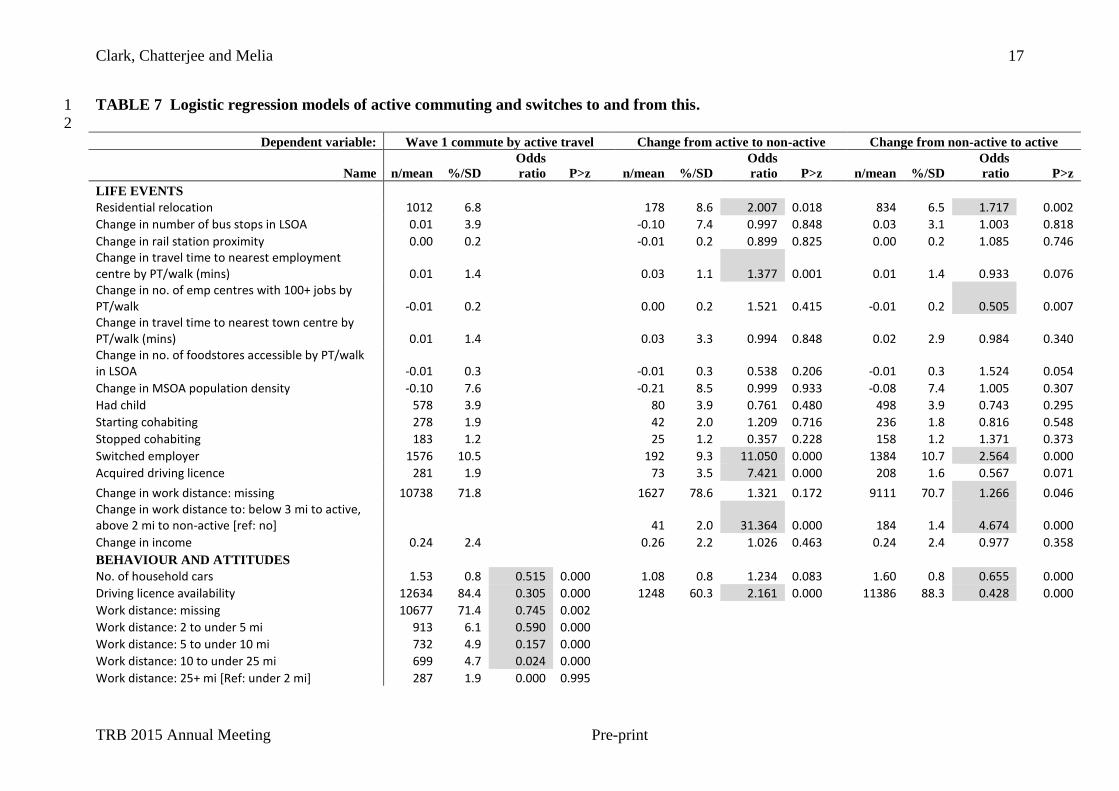
Predictors of switching to/from active commuting 42
43
The life events identified as important for switching to/from car commuting also hold for 44
switching to/from active commuting. Employment changes and residential relocations that 45
alter the distance to work are the strongest predictor of switches to and from active 46
commuting. The asymmetric relationship is once again confirmed. An increase from 2 miles 47
or less to at least 2 miles increases the likelihood of switching to non-active travel by 31 48
times, while a decrease from 3 miles or more to less than 3 miles increases likelihood of 49
Clark, Chatterjee and Melia
TRB 2015 Annual Meeting Pre-print
22
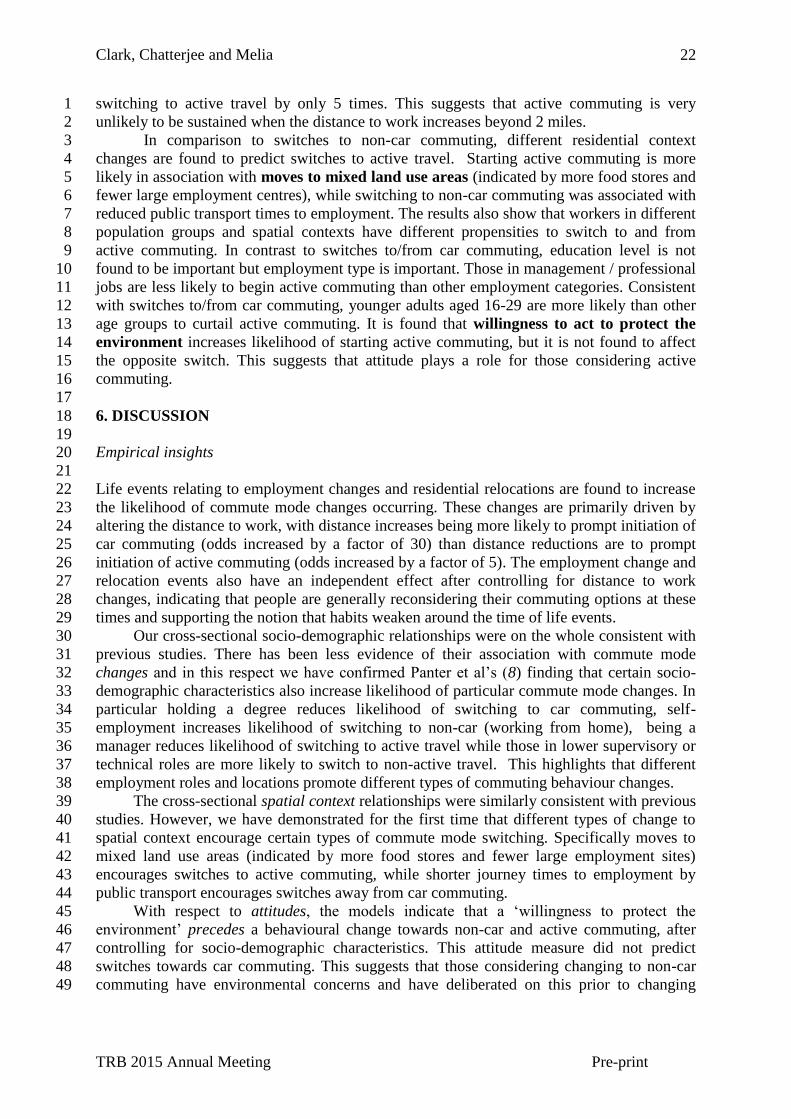
switching to active travel by only 5 times. This suggests that active commuting is very 1
unlikely to be sustained when the distance to work increases beyond 2 miles. 2
In comparison to switches to non-car commuting, different residential context 3
changes are found to predict switches to active travel. Starting active commuting is more 4
likely in association with moves to mixed land use areas (indicated by more food stores and 5
fewer large employment centres), while switching to non-car commuting was associated with 6
reduced public transport times to employment. The results also show that workers in different 7
population groups and spatial contexts have different propensities to switch to and from 8
active commuting. In contrast to switches to/from car commuting, education level is not 9
found to be important but employment type is important. Those in management / professional 10
jobs are less likely to begin active commuting than other employment categories. Consistent 11
with switches to/from car commuting, younger adults aged 16-29 are more likely than other 12
age groups to curtail active commuting. It is found that willingness to act to protect the 13
environment increases likelihood of starting active commuting, but it is not found to affect 14
the opposite switch. This suggests that attitude plays a role for those considering active 15
commuting. 16
17
6. DISCUSSION 18
19 Empirical insights 20
21
Life events relating to employment changes and residential relocations are found to increase 22
the likelihood of commute mode changes occurring. These changes are primarily driven by 23
altering the distance to work, with distance increases being more likely to prompt initiation of 24
car commuting (odds increased by a factor of 30) than distance reductions are to prompt 25
initiation of active commuting (odds increased by a factor of 5). The employment change and 26
relocation events also have an independent effect after controlling for distance to work 27
changes, indicating that people are generally reconsidering their commuting options at these 28
times and supporting the notion that habits weaken around the time of life events. 29
Our cross-sectional socio-demographic relationships were on the whole consistent with 30
previous studies. There has been less evidence of their association with commute mode 31
changes and in this respect we have confirmed Panter et al’s (8) finding that certain socio-32
demographic characteristics also increase likelihood of particular commute mode changes. In 33
particular holding a degree reduces likelihood of switching to car commuting, self-34
employment increases likelihood of switching to non-car (working from home), being a 35
manager reduces likelihood of switching to active travel while those in lower supervisory or 36
technical roles are more likely to switch to non-active travel. This highlights that different 37
employment roles and locations promote different types of commuting behaviour changes. 38
The cross-sectional spatial context relationships were similarly consistent with previous 39
studies. However, we have demonstrated for the first time that different types of change to 40
spatial context encourage certain types of commute mode switching. Specifically moves to 41
mixed land use areas (indicated by more food stores and fewer large employment sites) 42
encourages switches to active commuting, while shorter journey times to employment by 43
public transport encourages switches away from car commuting. 44
With respect to attitudes, the models indicate that a ‘willingness to protect the 45
environment’ precedes a behavioural change towards non-car and active commuting, after 46
controlling for socio-demographic characteristics. This attitude measure did not predict 47
switches towards car commuting. This suggests that those considering changing to non-car 48
commuting have environmental concerns and have deliberated on this prior to changing 49

Clark, Chatterjee and Melia
TRB 2015 Annual Meeting Pre-print
23
behaviour. The temporal sequence also confirms that attitudes do not simply adjust to match 1
new behaviours once they are established. 2
3
Theoretical contributions 4
5
Overall these empirical findings are supportive of the conceptual framework put forward in 6
Figure 1. They show that life events relating to residential and employment location are 7
associated with increased likelihood of commute mode changes. Factors relating to the built 8
environment and pre-existing attitude orientations are shown to play a mediating role in this 9
process. But it cannot be determined whether there was a wish to change commute mode 10
prior to changing home or job, or whether the deliberation over commute mode only occurred 11
afterwards. It is quite possible that reflection over commuting behaviour occurs both before 12
and after. UKHLS asks for reason for residential relocations, but the options offered are very 13
general (i.e. ‘moved for employment reasons’) and do not allow it to be understood whether a 14
change in commute was a main factor. 15
16
Study limitations 17
18
What we have not been able to examine is the longer term relationships between life events, 19
past experience and commute mode changes, given that only two waves of UKHLS data were 20
available for analysis. We have not been able to look at whether commute mode changes tend 21
to occur at the same as life events, or precede or follow them. Oakil et al (14) were able to 22
examine this but their sample was relatively small and the results inconclusive. This is an 23
area that would certainly benefit from further research as additional waves become available 24
in UKLHS. 25
We have also not been able to examine the longer term trajectories of commuting with 26
only two waves of data. It would be interesting to see whether duration of commuting by a 27
particular mode affects likelihood of a switch taking place (with and without occurrence of 28
life events). Past commuting behaviour is known to be a strong predictor of current behaviour 29
(13), indicating that behaviours learnt in the past may exert a strong influence on how people 30
adapt to new situations following life events. This could also be investigated with longer 31
history data. More waves of data will also enable it to be examined whether relationships are 32
stable over time or are specific to certain periods. 33
We only had information on life events experienced by our survey sample and not 34
transport interventions. Ideally, data would be collected on both of these but this presents a 35
challenging data collection requirement. However, combined data on both of these would 36
allow the interaction between life events and transport interventions to be understood better. 37
38
Policy implications 39
40 Employment changes: The results showed that people are more open to change behaviour 41
when they start working for a new employer. This implies that information and marketing 42
measures (e.g. travel packs, temporary free bus passes) are likely to be most effective during 43
recruitment and when new employees join an organisation. Such measures may be 44
particularly appropriate for new, young adult entrants to the labour market given the earlier 45
observation that young adults tend to move towards car commuting as their careers mature. 46
Specific measures may also be targeted to particular employment roles given that these are 47
shown to encourage specific types of commute mode changes. 48
Residential relocations: People are also more likely to change how they commute to 49
work when they move home. As with employment changes, this would suggest that travel 50

Clark, Chatterjee and Melia
TRB 2015 Annual Meeting Pre-print
24
planning (e.g. travel packs explaining available transport options in the local area) would be 1
most effective before residents move into a new home. 2
Land use planning: The findings also suggest that land use planning has an important 3
mediating role to play in enabling commuting by non-car modes when people move home or 4
change employer. The regression models indicated that shortening journey times by public 5
transport to employment sites encourages non-car commuting. This supports the case for 6
investment in high quality public transport connections to employment centres in urban areas, 7
including those in urban fringes. Mixed land uses were found to be associated with increased 8
likelihood of initiating active commuting, suggesting that planning policies should prioritise 9
mixed land use developments with short distances (less than 2 miles) between residential 10
areas and employment opportunities. 11
12
7. CONCLUDING REMARKS 13
14 The results provide firm evidence that life events (in particular employment changes and 15
residential relocations) are important determinants of commute mode changes. Life events 16
must be considered in both conceptualisations of commute mode change and in transport 17
policies concerned with promoting changes to commuting behaviour. Information was not 18
available about transport interventions experienced by the survey participants and future 19
research should seek to identify how life events interact with transport interventions to 20
influence commuting behaviour. 21
The study also confirms longitudinally, that spatial context is an important 22
determinant of how commuting behaviours change over time and that spatial planning (land 23
use patterns and the structure of the transport network) has a role to play in influencing how 24
people negotiate the journey to work over the course of their careers. 25
26
8. ACKNOWLEDGEMENTS 27
28 The research was funded by the Economic and Social Research Council under the Secondary 29
Data Analysis Initiative. It was conducted in partnership with the Institute for Social and 30
Economic Research, University of Essex (with thanks to Professor Heather Laurie and Dr 31
Gundi Knies) and the UK Department for Transport (with thanks to Deirdre O’Reilly, Ben 32
Savage, Tom Gerlach, John Screeton and Louise Taylor). 33
34
9. REFERENCES 35
36 (1) Gardner, B., Modelling Motivation and Habit in Stable Travel Mode Contexts. 37
Transportation Research Part F, Vol. 12, 2009, pp.68-76. 38
(2) Verplanken, B., Walker, I., Davis, A. and Jurasek, M. Context Change and Travel 39
Mode Choice: Combining the Habit Discontinuity and Self-activation Hypotheses. 40
Journal of Environmental Psychology, Vol. 28, No. 2, 2008, pp.121-127. 41
(3) Chatterjee, K., Sherwin, H. and Jain, J. Triggers for Changes in Cycling: The Role of 42
Life Events and Modifications to the Physical Environment. Journal of Transport 43
Geography, Vol. 30, 2013, pp.183-193. 44
(4) Johansson, M.V., Heldt, T., and Johansson, P. The Effects of Attitudes and 45
Personality Traits on Mode Choice. Transportation Research Part A, Vol. 40, 2006, 46
pp.507-525. 47
(5) Cervero, R. Built Environment and Mode Choice: Toward a Normative Framework. 48
Transportation Research Part D, Vol. 7, 2002, pp.265-284. 49

Clark, Chatterjee and Melia
TRB 2015 Annual Meeting Pre-print
25
(6) Dalton, A., Jones, A., Panter, J. and Ogilvie, D. Neighbourhood, Route and 1
Workplace-related Environmental Characteristics Predict Adults’ Mode of Travel to 2
Work. PLoS ONE, Vol. 8, No. 6, 2013, pp.1-11. 3
(7) Schwanen, T. and Mokhtarian, P.L. What Affects Commute Mode Choice: 4
Neighborhood Physical Structure or Preferences Toward Neighborhoods? Journal of 5
Transport Geography, Vol. 13, 2005, pp.83–99. 6
(8) Panter, J., Giffin, S., Dalton, A. and Ogilvie, D. Patterns and Predictors of Changes in 7
Active Commuting over 12 months. Preventive Medicine, Vol. 57, 2013, pp. 776-784. 8
(9) Dargay, J. and Hanly, M. Volatility of Car Ownership, Commuting Mode and Time in 9
the UK. Transportation Research Part A, Vol. 41, No. 1, 2007, pp.934-948. 10
(10) Oakil, A, Ettema, D., Arentze, T. and Timmermans, H. A Longitudinal Analysis of 11
the Dependence of Commute Mode Switching Decisions on Mobility Decisions and 12
Life-cycle Events. Presented at 16th
International Conference of Hong Kong Society 13
for Transportation Studies, 2011. 14
(11) Walker, I., Thomas, G., and Verplanken, B. Old Habits Die Hard: Formation and 15
Decay During an Office Relocation. Environment and Behaviour, in press. 16
(12) Jones, C.H.D. and Ogilvie, D. Motivations for Active Commuting: A Qualitative 17
Investigation of the Period of Home or Work Relocation. International Journal of 18
Behavioral Nutrition and Physical Activity, Vol. 9, No. 109, 2012. 19
(13) Stanbridge, K. and Lyons, G. Travel Behaviour Considerations During the Process of 20
Residential Relocation. Presented at 11th International Conference on Travel 21
Behaviour Research, Kyoto, Aug, 2006. 22
(14) Clark, B. Understanding How Household Car Ownership Changes Over Time. PhD 23
thesis. University of the West of England, 2012. 24
(15) Clark, W.A.V, Huang, Y. and Withers, S. Does Commuting Distance Matter? 25
Commuting Tolerance and Residential Change. Regional Science and Urban 26
Economics, Vol. 33, 2003, pp.199-221. 27
(16) Chatterjee, K. and Ma, K-R. Time Taken for Residents to Adopt a New Public 28
Transport Service: Examining Heterogeneity Through Duration Modelling. 29
Transportation, Vol. 36, 2009, pp. 1-25. 30
(17) Bradley, M. A Practical Comparison of Modeling Approaches for Panel Data. In: 31
Golob, T.F. Kitamura, R., Long, L. (eds.) Panels for Transportation Planning, pp. 281-32
304, 197, Kluwer, Boston. 33
(18) Tornblad, S.H., Kallbekken, S., Korneliussen, K. and Mideksa, T.B. Using Mobility 34
Management to Reduce Private Car Use: Results From a Natural Field Experiment in 35
Norway. Transport Policy, Vol. 32, 2014, pp.9-15. 36
(19) Thøgersen, J. Promoting Public Transport as a Subscription Service: Effects of a Free 37
Month Travel Card. Transport Policy, Vol. 16, 2009, pp.335-343. 38
(20) Bamberg, S., Rolle, D. and Weber, C. Does Habitual Car Use Not Lead to More 39
Resistance to Change of Travel Mode? Transportation, Vol. 30, No. 1, 2003, pp.97-40
108. 41
(21) Miller, E. An Integrated Framework for Modelling Short and Long Run Household 42
Decision Making. In Activity Based Analysis. 1st ed. (Timmermans, H. ed), Elsevier 43
Ltd, Oxford, 2005, pp.175-201. 44
(22) Van der Waerden, P., Timmermans, H. and Borgers, A. The Influence of Key Events 45
and Critical Incidents on Transport Mode Choice Switching Behaviour: A Descriptive 46
Analysis. Presented at 10th International Conference on Travel Behaviour, Lucerne, 47
Aug. 2003. 48