Embed Size (px)
Citation preview
Changes of storm surge and typhoon intensities under the future global warming
conditions
Il-Ju Moon & S. M. OhJeju (Cheju) National University, Korea
Storm Surge Congress 2010
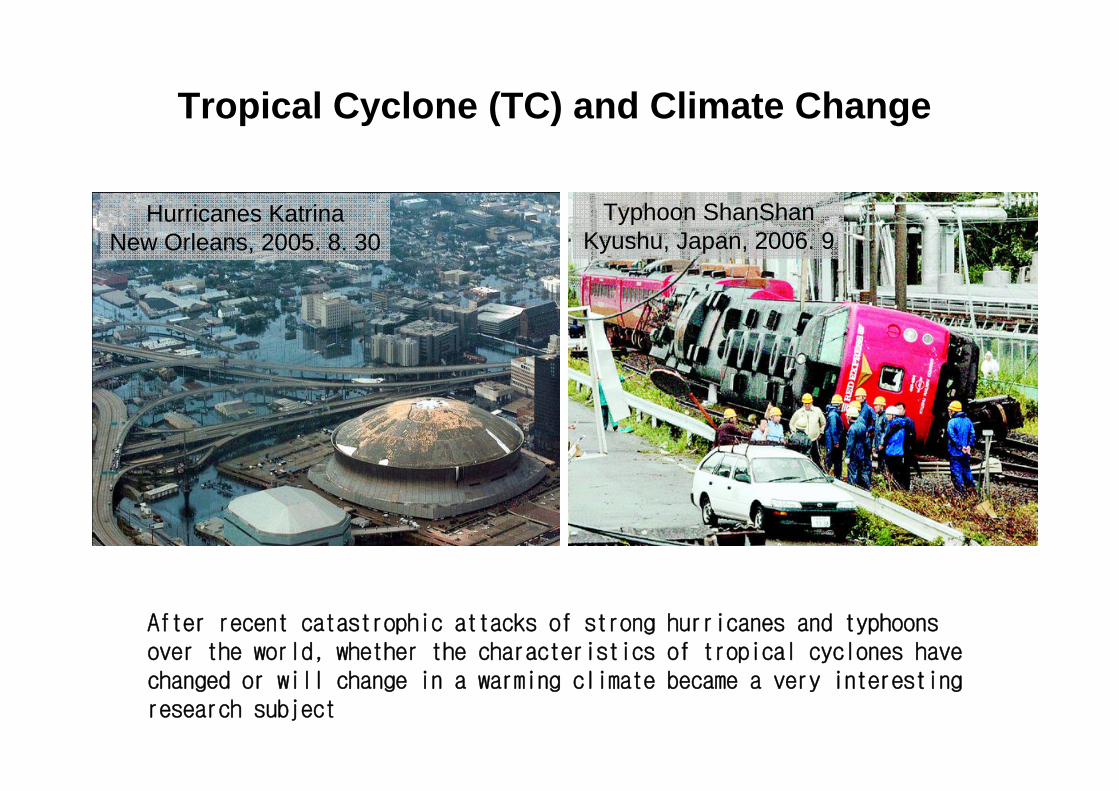
Hurricanes KatrinaNew Orleans, 2005. 8. 30
Typhoon ShanShanKyushu, Japan, 2006. 9
Tropical Cyclone (TC) and Climate Change
After recent catastrophic attacks of strong hurricanes and typhoons over the world, whether the characteristics of tropical cyclones have changed or will change in a warming climate became a very interesting research subject
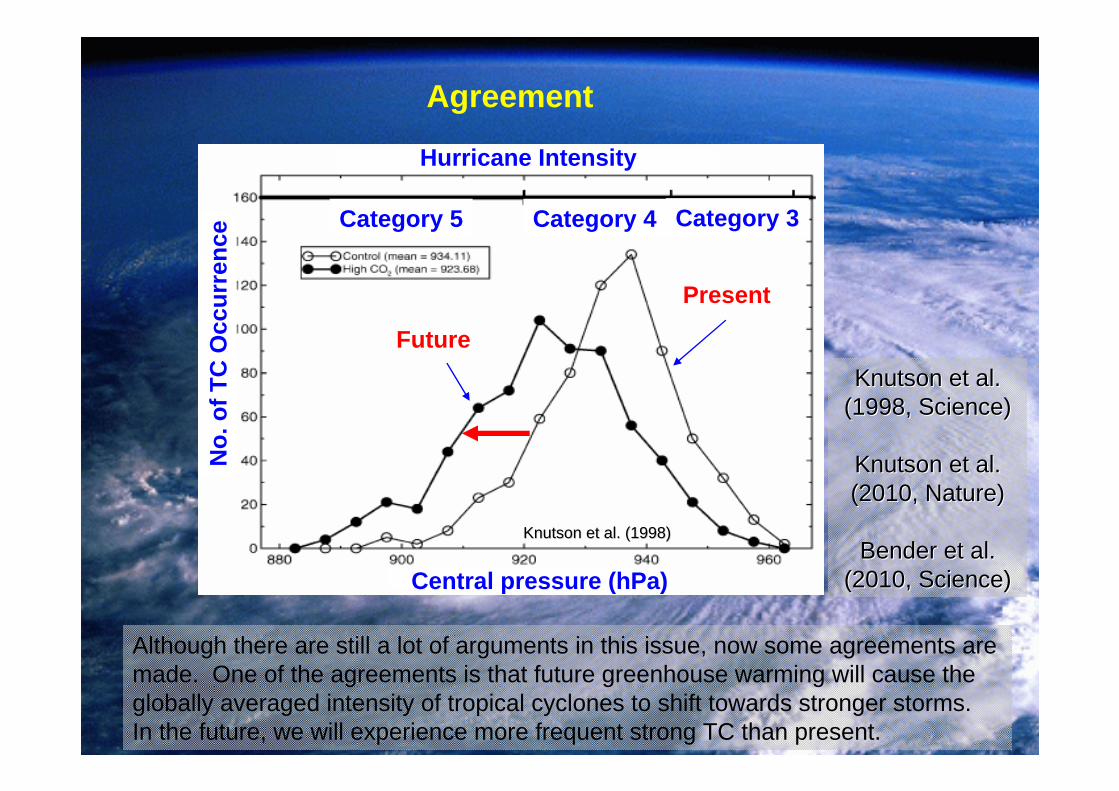
Knutson et al. Knutson et al. (1998, Science)(1998, Science)
Knutson et al.Knutson et al.(2010, Nature)(2010, Nature)
Bender et al.Bender et al.(2010, Science)(2010, Science)
No.
of T
C O
ccur
renc
e Category 5
Future
Agreement
Hurricane Intensity
Category 4 Category 3
Central pressure (hPa)
Although there are still a lot of arguments in this issue, now some agreements are made. One of the agreements is that future greenhouse warming will cause the globally averaged intensity of tropical cyclones to shift towards stronger storms.In the future, we will experience more frequent strong TC than present.
Present
Knutson et al. (1998)Knutson et al. (1998)
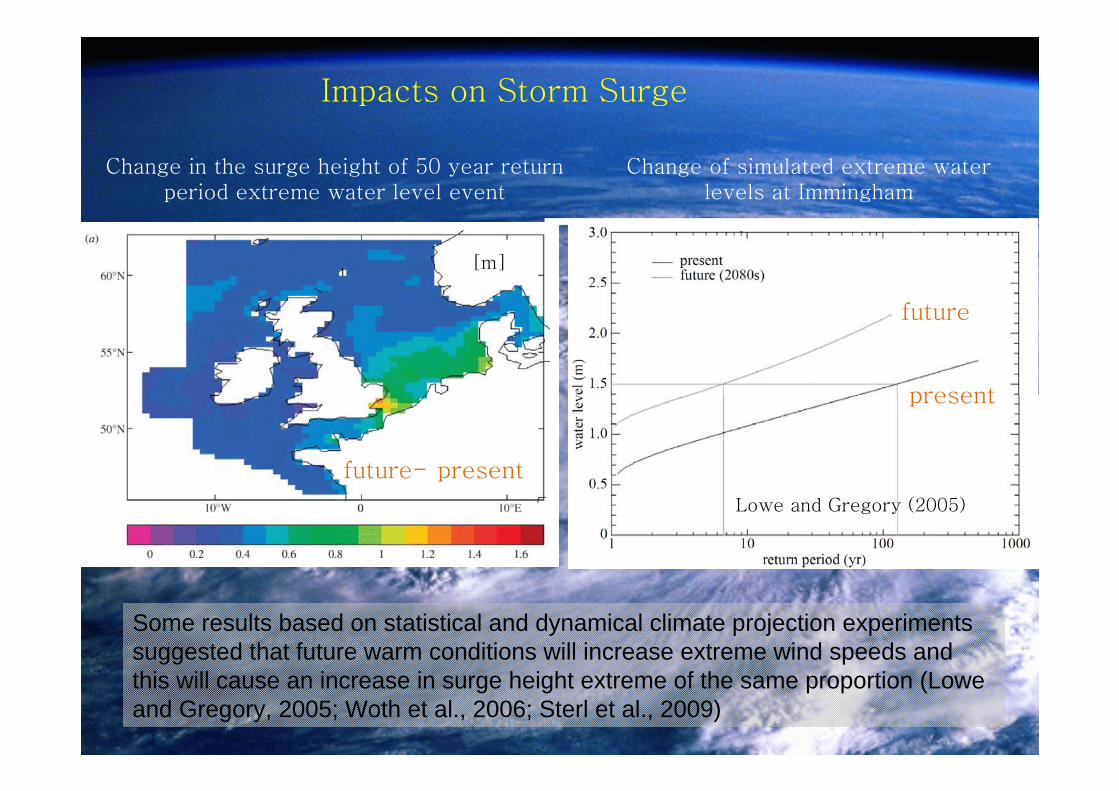
Lowe and Gregory (2005)
Change in the surge height of 50 year return period extreme water level event
Change of simulated extreme water levels at Immingham
present
future
Impacts on Storm Surge
Some results based on statistical and dynamical climate projection experiments suggested that future warm conditions will increase extreme wind speeds and this will cause an increase in surge height extreme of the same proportion (Lowe and Gregory, 2005; Woth et al., 2006; Sterl et al., 2009)
presentfuture-
[m]
Motivation and Purpose
Curiosity...
If the historical worst storm surge events happen again in the future global warming conditions
Questions...
1. How much will the storm intensity increase?
2. How much will the extreme storm surge height increase?
This allows us to estimate a possible extreme of storm surge height in the future in a certain region
Procedure of the present study
2. Constructing future climate conditions- Using results of IPCC global climate models- Extracting global warming mode using Cyclostationary EOF
1. Selecting the historical worst typhoons- Based on the highest storm surge events- Targeted region: the Korean peninsula
3. Simulating selected typhoons- under both the present and future conditions- Using WRF model
4. Simulating storm surges - Using storm surge model based on POM - Compare surge heights between present and future- Analyzing causes of the changed storm surge
Selected Two Typhoons
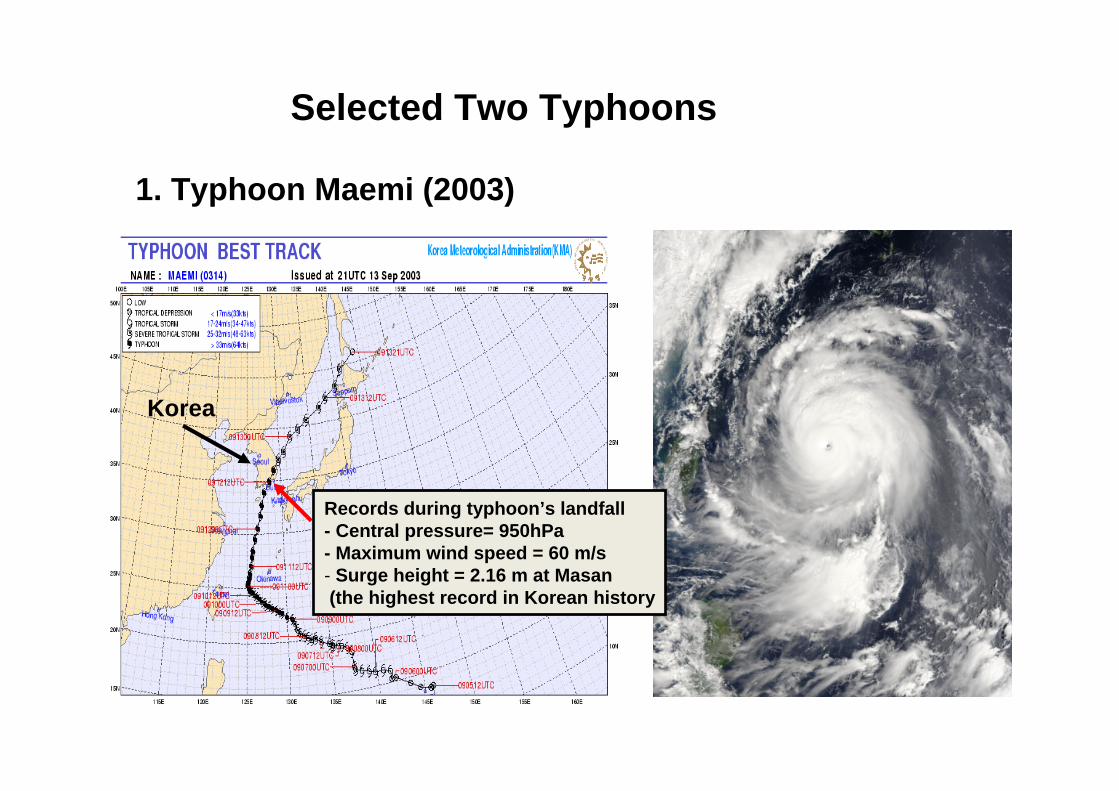
1. Typhoon Maemi (2003)
Records during typhoon’s landfall- Central pressure= 950hPa- Maximum wind speed = 60 m/s- Surge height = 2.16 m at Masan(the highest record in Korean history
Korea
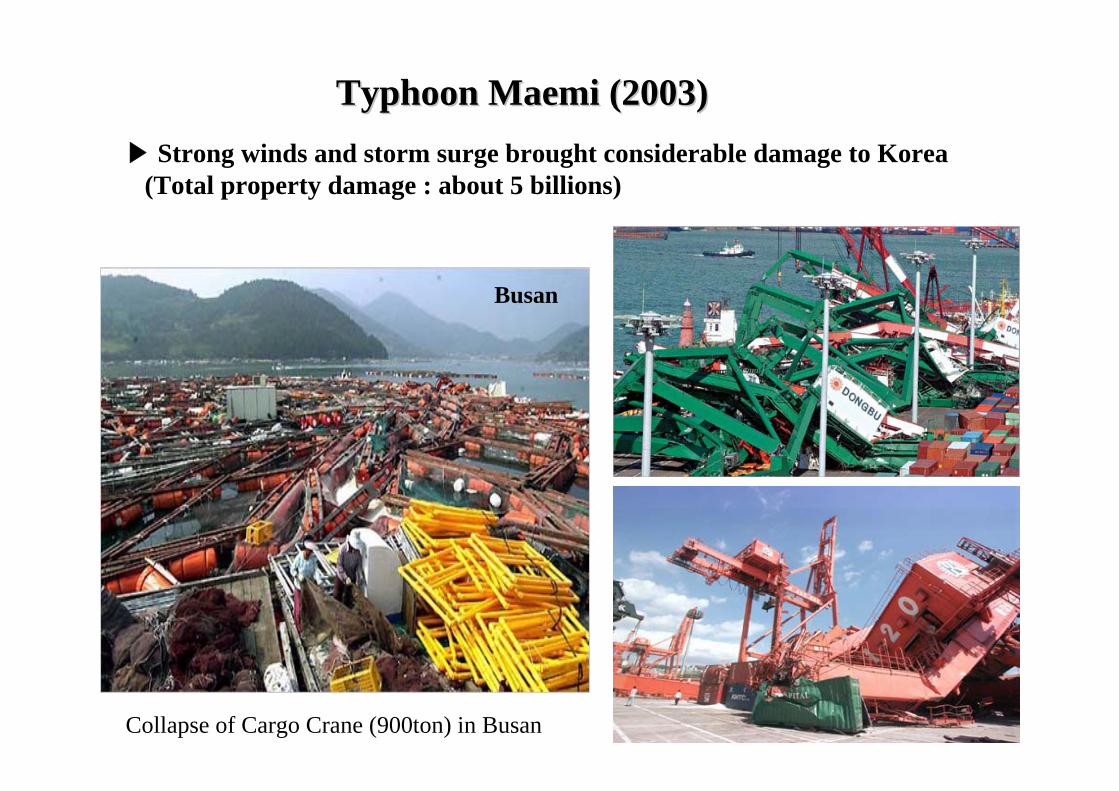
Typhoon Maemi (2003)Typhoon Maemi (2003)▶ Strong winds and storm surge brought considerable damage to Korea
(Total property damage : about 5 billions)
Collapse of Cargo Crane (900ton) in Busan
Busan
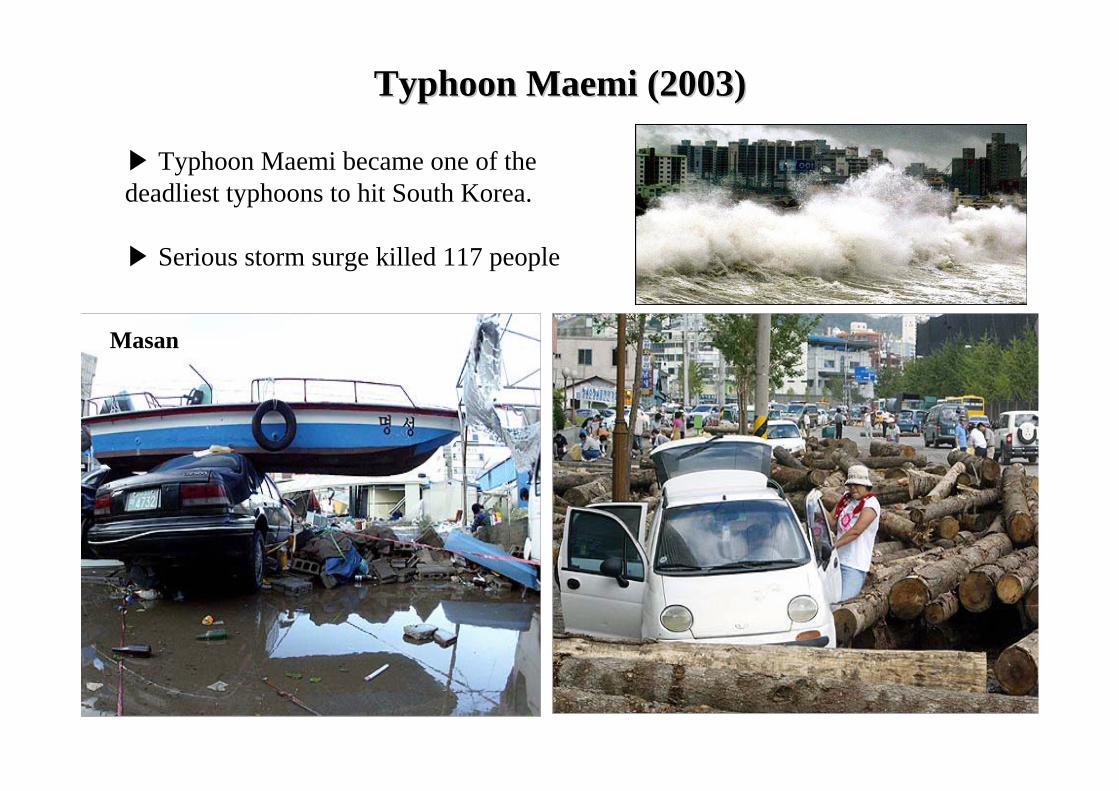
▶ Typhoon Maemi became one of the deadliest typhoons to hit South Korea.
▶ Serious storm surge killed 117 people
Storm Surge
Typhoon Maemi (2003)Typhoon Maemi (2003)
Masan
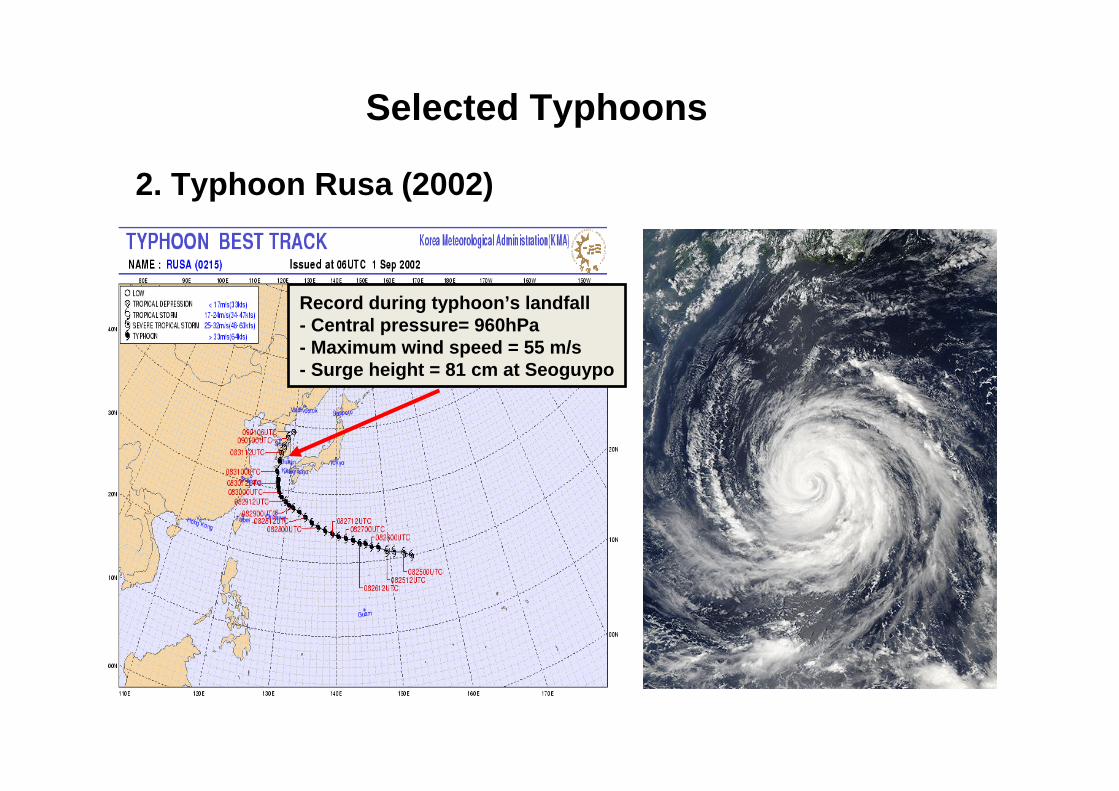
Selected Typhoons
2. Typhoon Rusa (2002)
Record during typhoon’s landfall- Central pressure= 960hPa- Maximum wind speed = 55 m/s- Surge height = 81 cm at Seoguypo
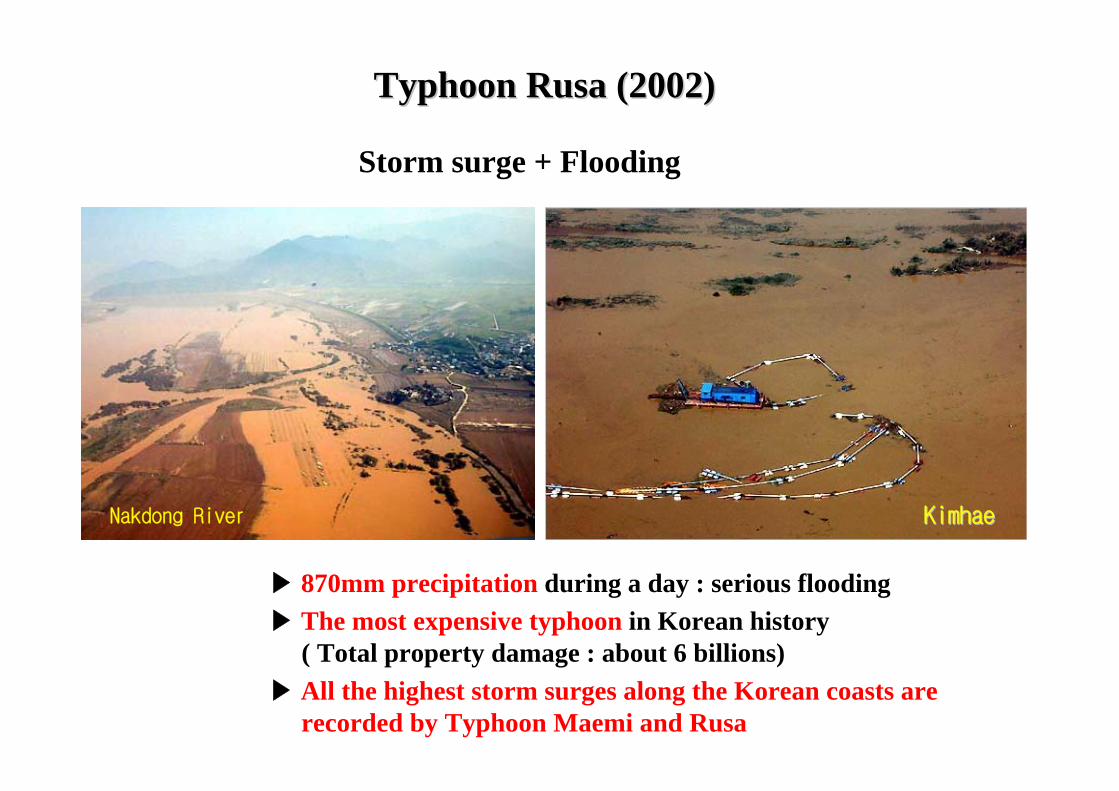
▶ 870mm precipitation during a day : serious flooding
KimhaeKimhaeNakdong River
Typhoon Typhoon RusaRusa (2002)(2002)
▶ The most expensive typhoon in Korean history ( Total property damage : about 6 billions)
Storm surge + Flooding
▶ All the highest storm surges along the Korean coasts are recorded by Typhoon Maemi and Rusa
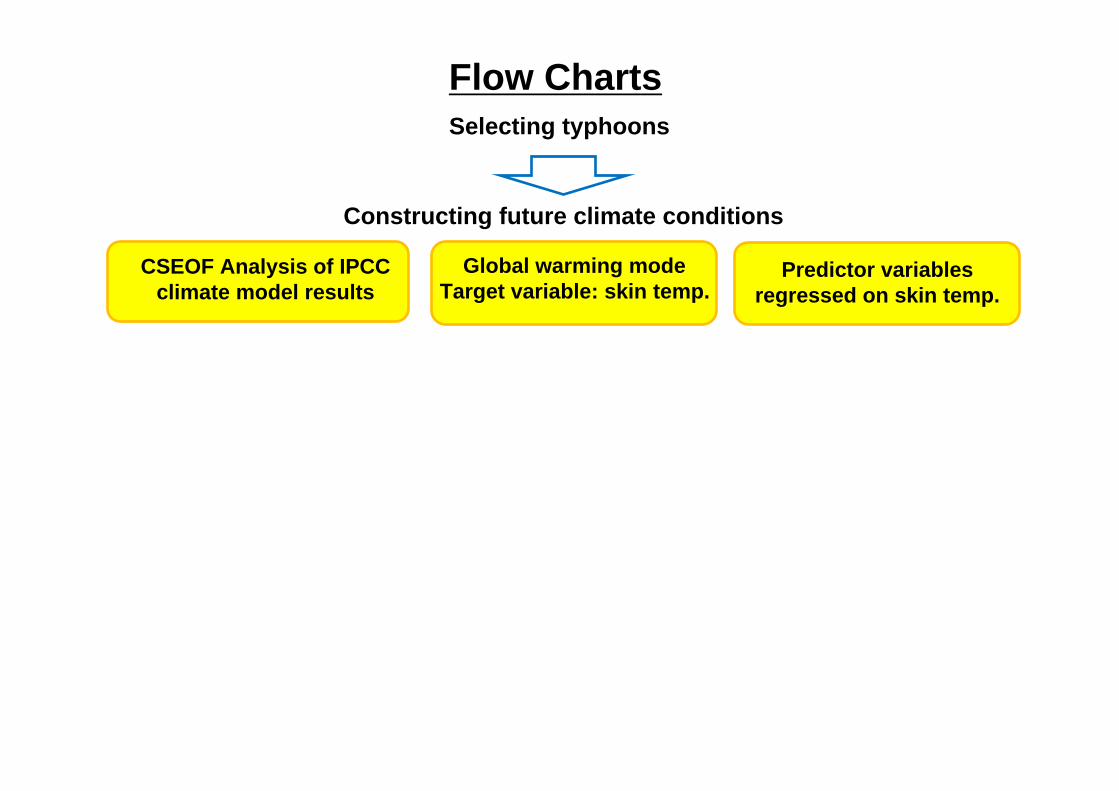
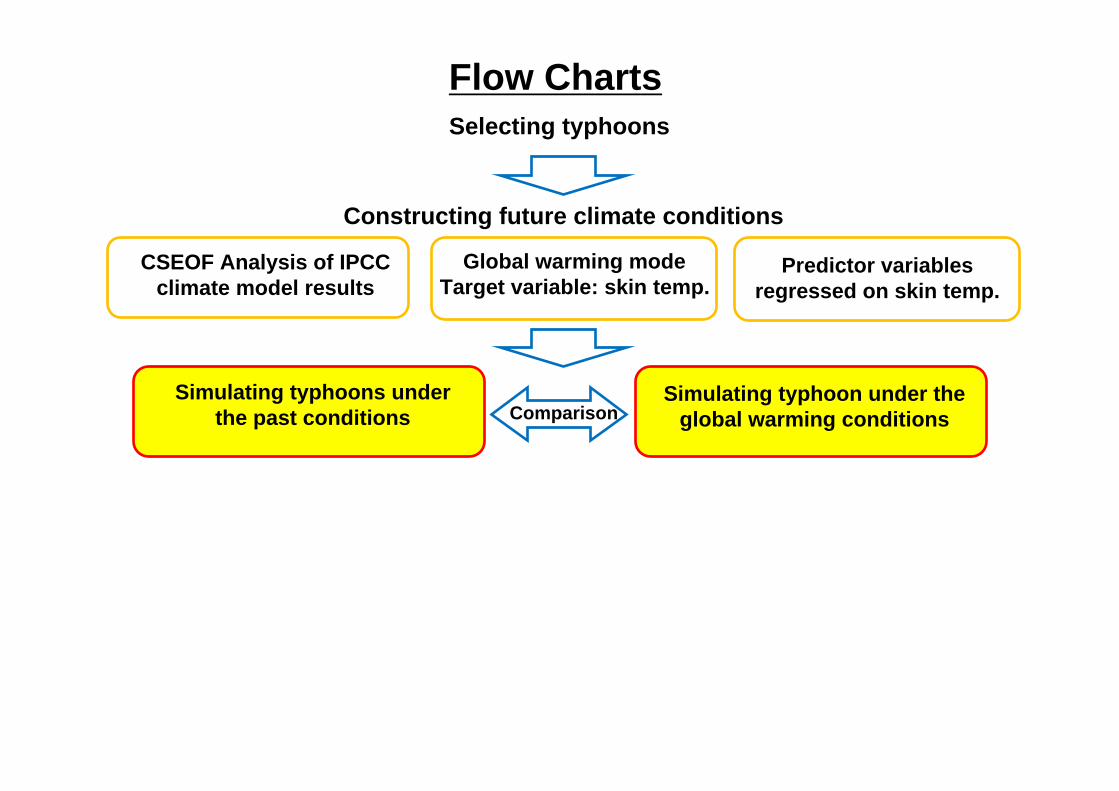
CSEOF Analysis of IPCC climate model results
Global warming mode Target variable: skin temp.
Predictor variables regressed on skin temp.
Selecting typhoons
Constructing future climate conditions
Flow Charts
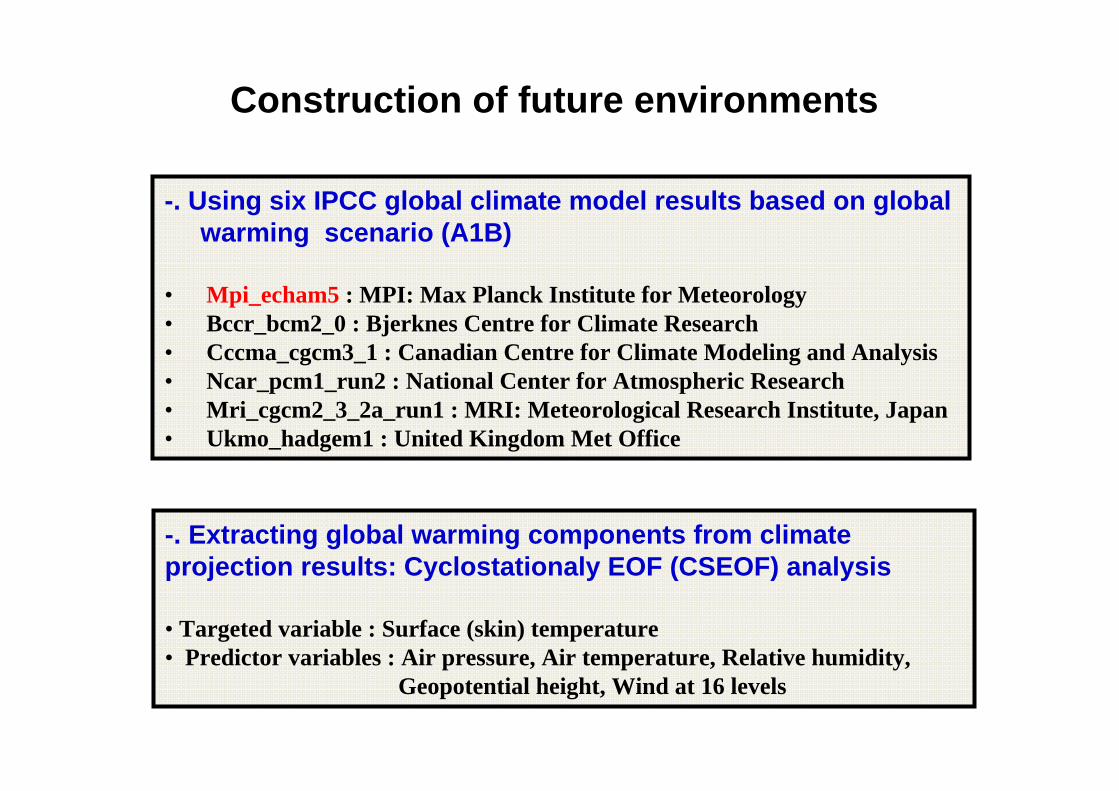
Construction of future environments
-. Using six IPCC global climate model results based on global warming scenario (A1B)
• Mpi_echam5 : MPI: Max Planck Institute for Meteorology • Bccr_bcm2_0 : Bjerknes Centre for Climate Research • Cccma_cgcm3_1 : Canadian Centre for Climate Modeling and Analysis• Ncar_pcm1_run2 : National Center for Atmospheric Research • Mri_cgcm2_3_2a_run1 : MRI: Meteorological Research Institute, Japan • Ukmo_hadgem1 : United Kingdom Met Office
-. Extracting global warming components from climate projection results: Cyclostationaly EOF (CSEOF) analysis
• Targeted variable : Surface (skin) temperature• Predictor variables : Air pressure, Air temperature, Relative humidity,
Geopotential height, Wind at 16 levels
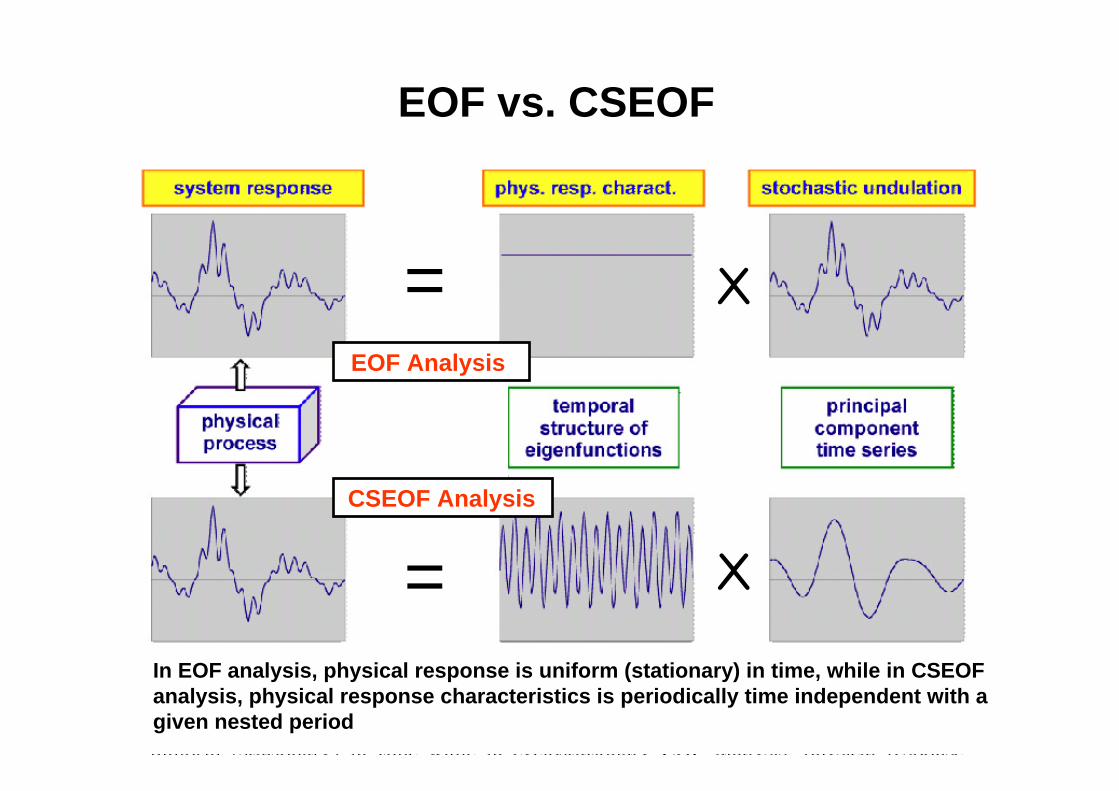
EOF vs. CSEOF
In EOF analysis, physical response is uniform (stationary) in time, while in CSEOF analysis, physical response characteristics is periodically time independent with a given nested period
EOF Analysis
CSEOF Analysis
=
=
ⅹ
ⅹ
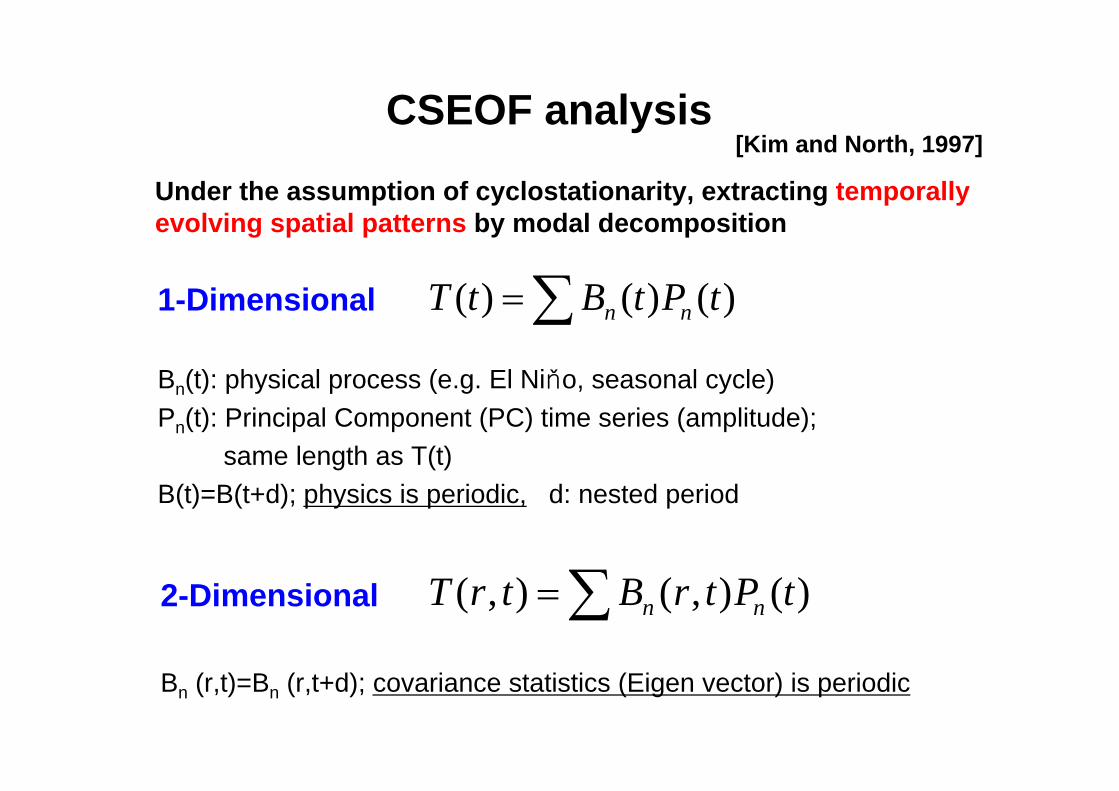
1-Dimensional
Bn(t): physical process (e.g. El Niňo, seasonal cycle)Pn(t): Principal Component (PC) time series (amplitude);
same length as T(t)B(t)=B(t+d); physics is periodic, d: nested period
∑= )()()( tPtBtT nn
2-Dimensional
Bn (r,t)=Bn (r,t+d); covariance statistics (Eigen vector) is periodic
∑= )(),(),( tPtrBtrT nn
CSEOF analysis[Kim and North, 1997]
Under the assumption of cyclostationarity, extracting temporally evolving spatial patterns by modal decomposition
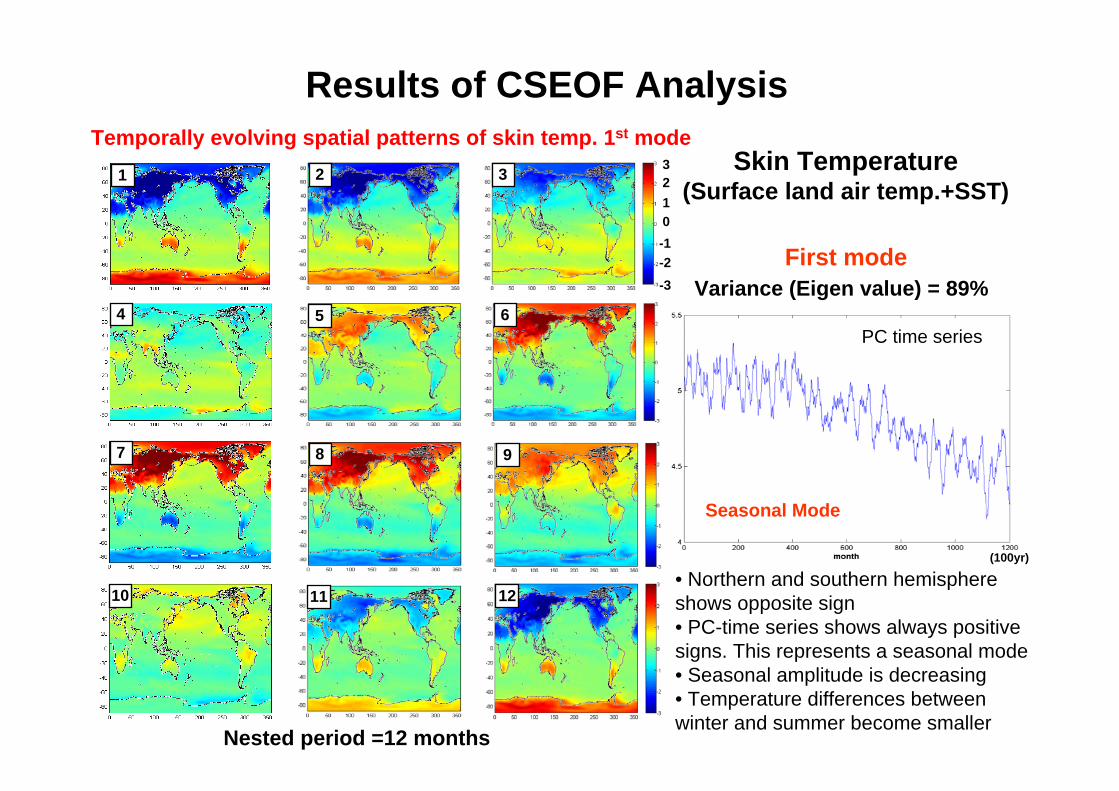
Skin Temperature(Surface land air temp.+SST)
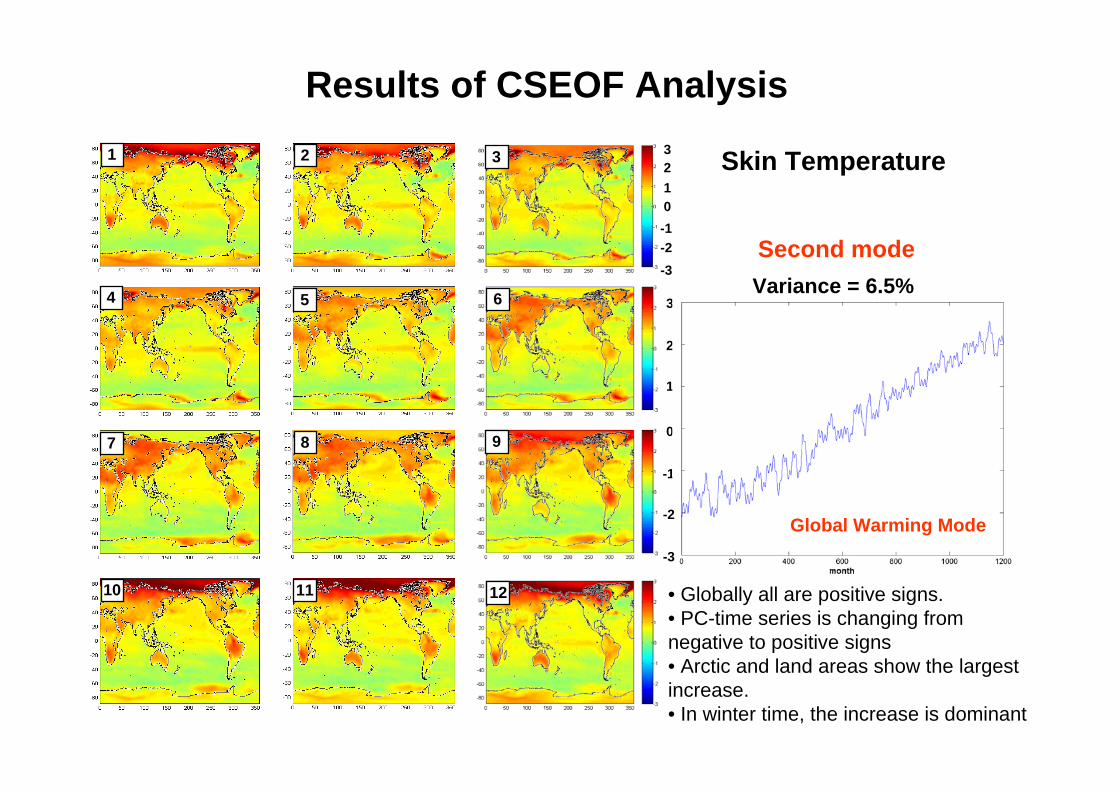
Results of CSEOF Analysis
Seasonal Mode
1 2 3
4 5 6
7 8 9
10 11 12
First modeVariance (Eigen value) = 89%
• Northern and southern hemisphere shows opposite sign • PC-time series shows always positive signs. This represents a seasonal mode• Seasonal amplitude is decreasing• Temperature differences between winter and summer become smaller
Temporally evolving spatial patterns of skin temp. 1st mode
Nested period =12 months
PC time series
(100yr)
0123
-1-2-3
1
4
7
10
2
5
8
11
3
6
9
12
Global Warming Mode
Skin Temperature
Second modeVariance = 6.5%
Results of CSEOF Analysis
• Globally all are positive signs. • PC-time series is changing from negative to positive signs• Arctic and land areas show the largest increase. • In winter time, the increase is dominant
0123
-1-2-3
0
1
2
3
-1
-3
-2
((℃℃))
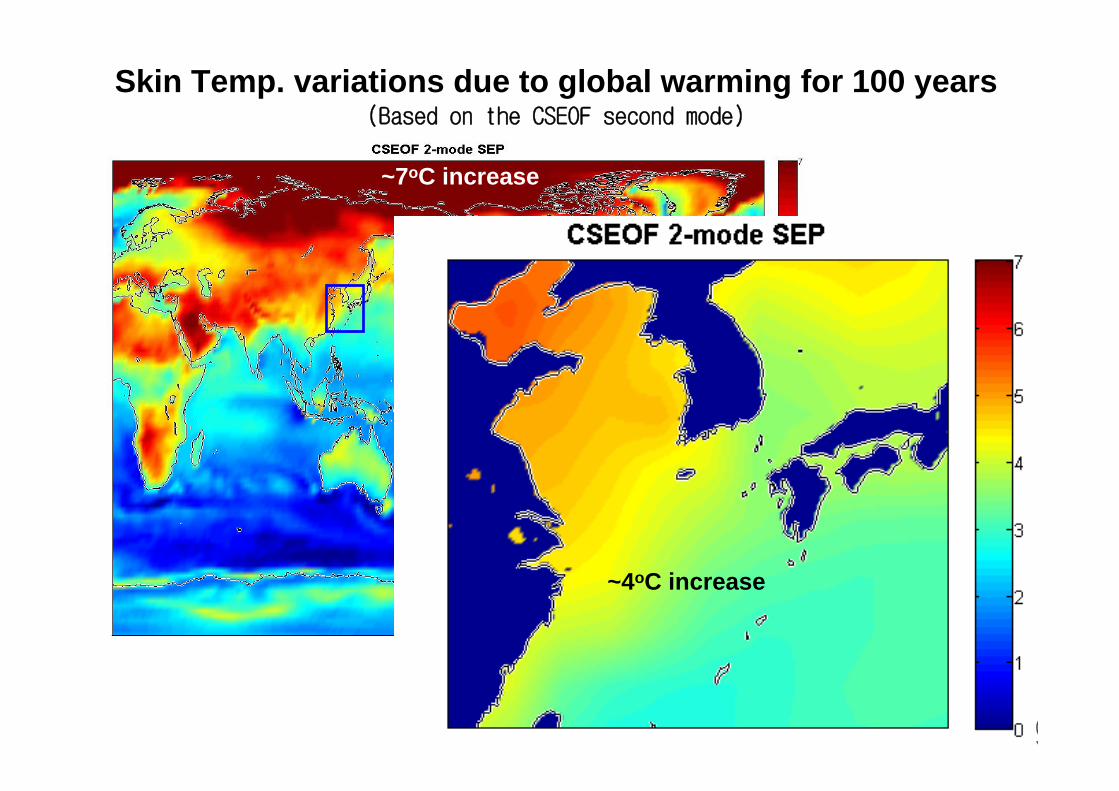
Skin Temp. variations due to global warming for 100 years(Based on the CSEOF second mode)
~7oC increase
()
~4oC increase
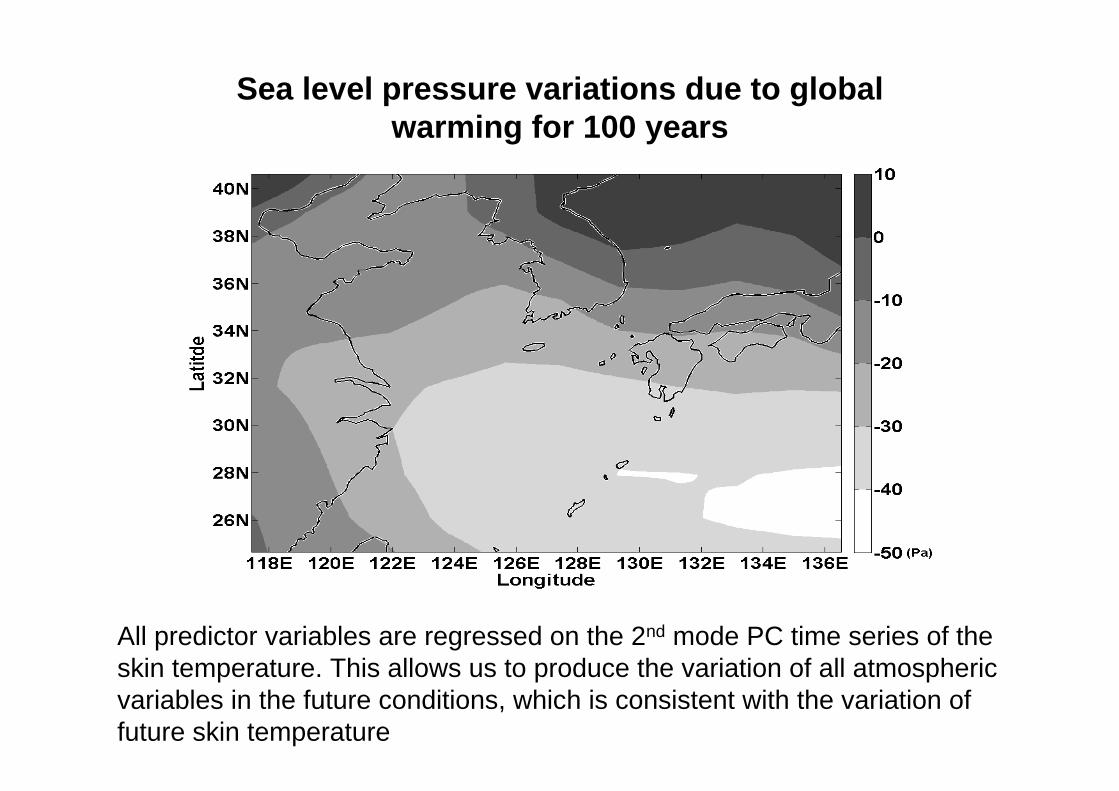
All predictor variables are regressed on the 2nd mode PC time series of the skin temperature. This allows us to produce the variation of all atmospheric variables in the future conditions, which is consistent with the variation of future skin temperature
Sea level pressure variations due to global warming for 100 years
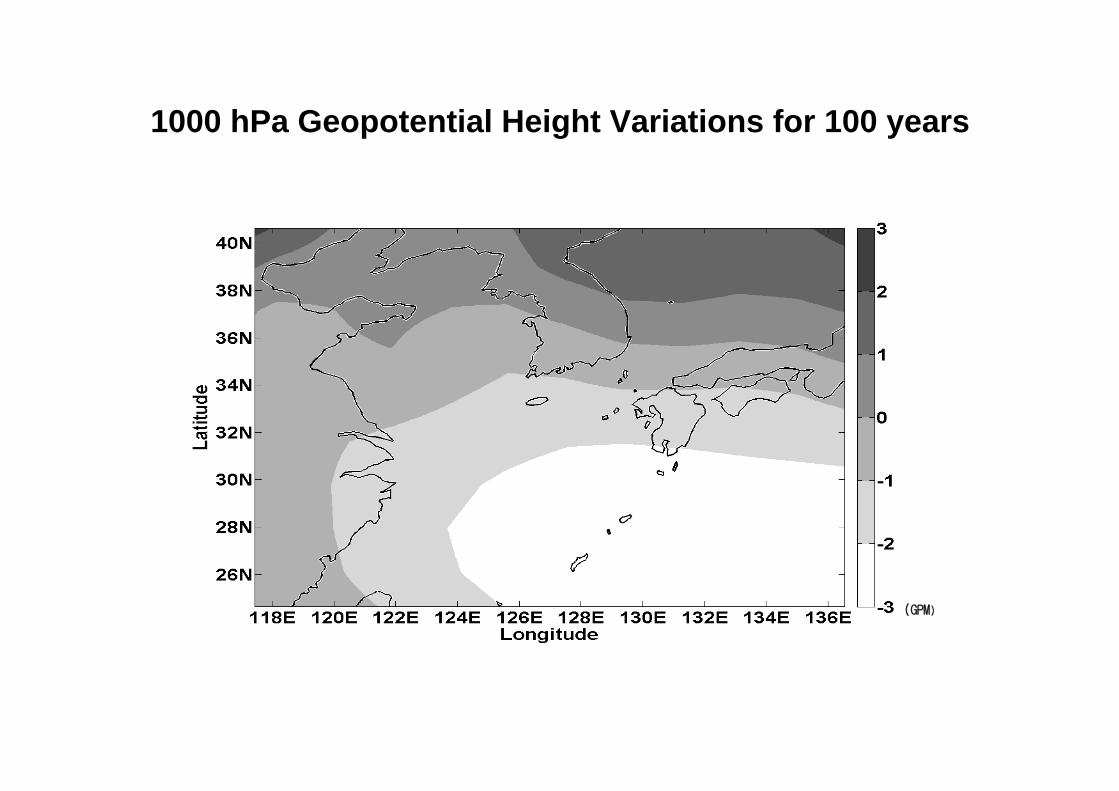
1000 hPa Geopotential Height Variations for 100 years
(GPM(GPM))
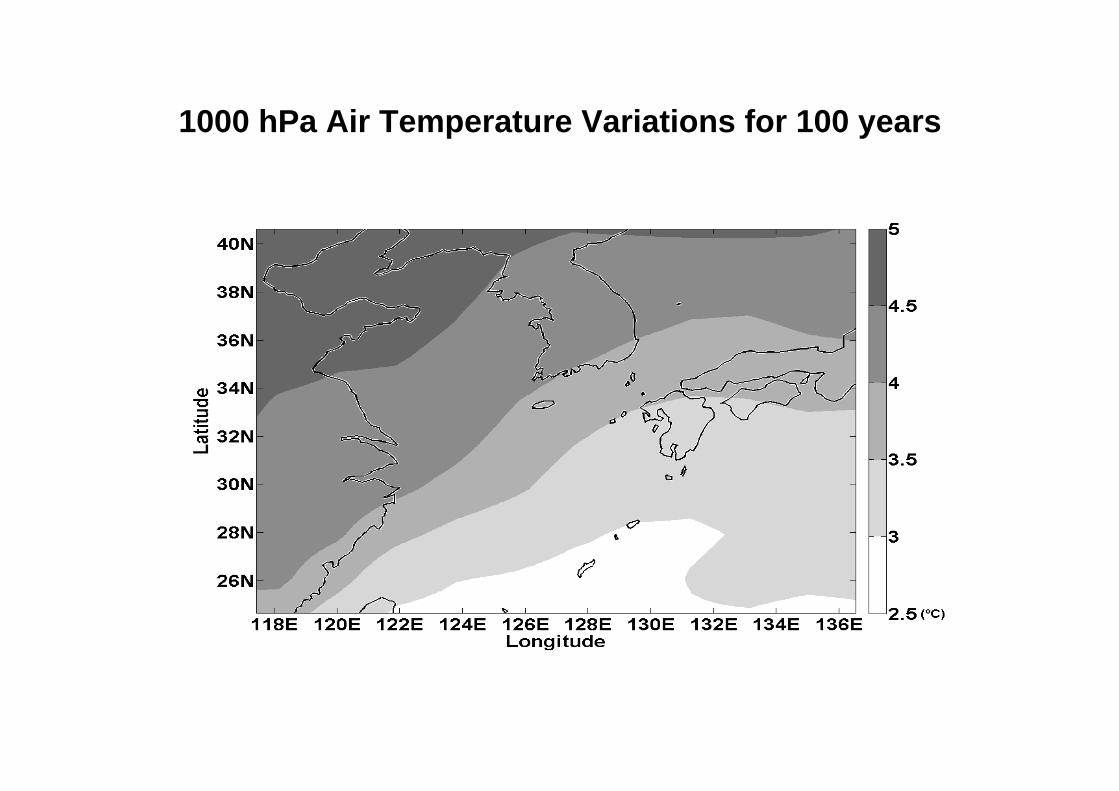
1000 hPa Air Temperature Variations for 100 years
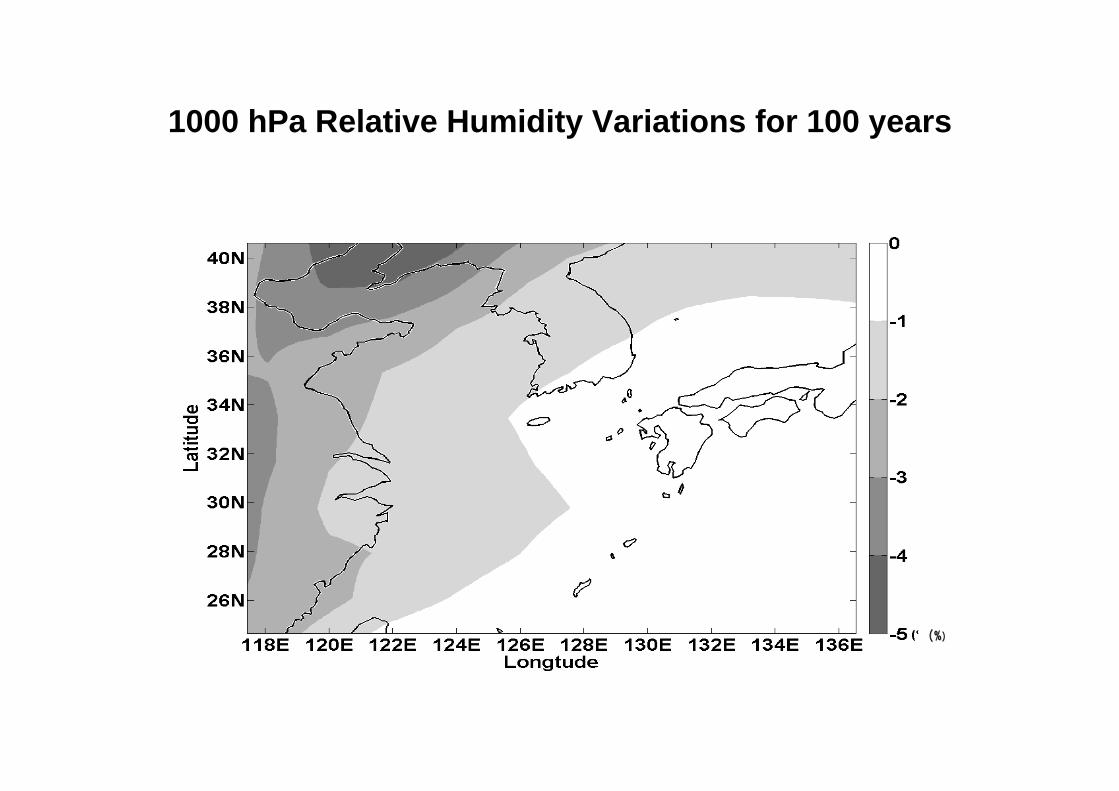
1000 hPa Relative Humidity Variations for 100 years
(%(%))
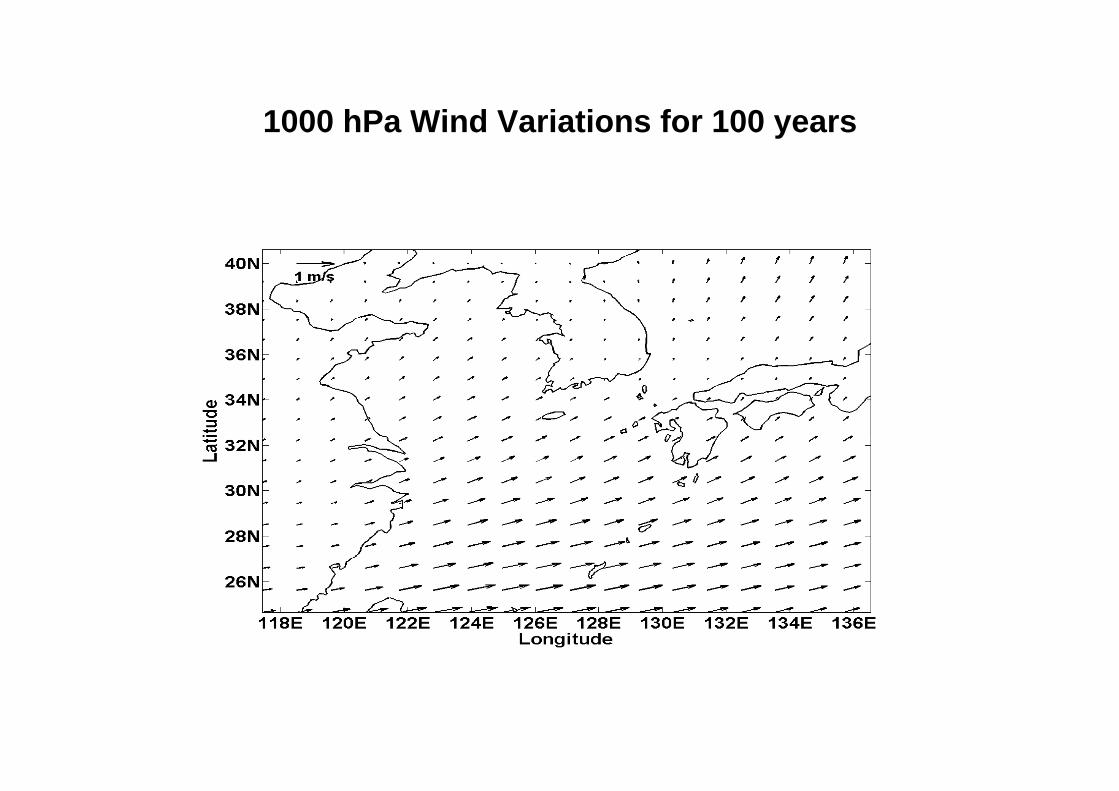
1000 hPa Wind Variations for 100 years
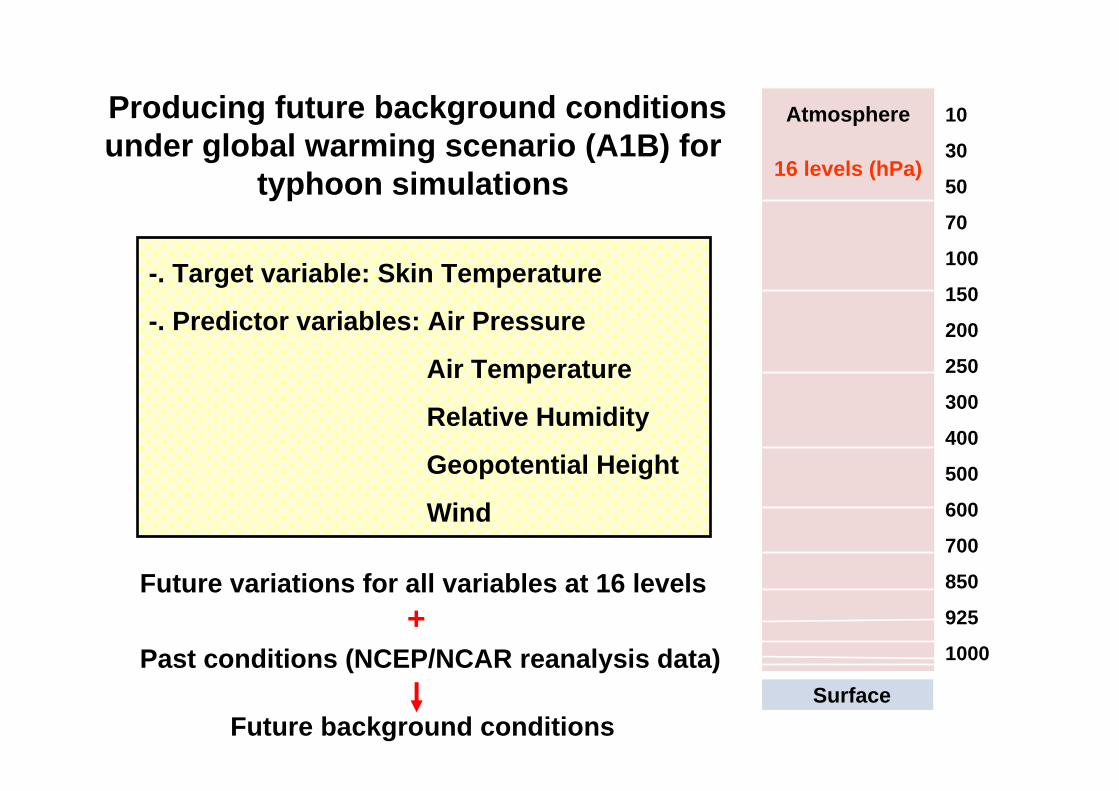
Producing future background conditions under global warming scenario (A1B) for
typhoon simulations
-. Target variable: Skin Temperature
-. Predictor variables: Air Pressure
Air Temperature
Relative Humidity
Geopotential Height
Wind
Atmosphere
16 levels (hPa)
Surface
10
30
50
70
100
150
200
250
300
400
500
600
700
850
925
1000
Future variations for all variables at 16 levels
Past conditions (NCEP/NCAR reanalysis data)+
Future background conditions
CSEOF Analysis of IPCC climate model results
Global warming mode Target variable: skin temp.
Predictor variables regressed on skin temp.
Simulating typhoons under the past conditions
Simulating typhoon under the global warming conditionsComparison
Selecting typhoons
Constructing future climate conditions
Flow Charts
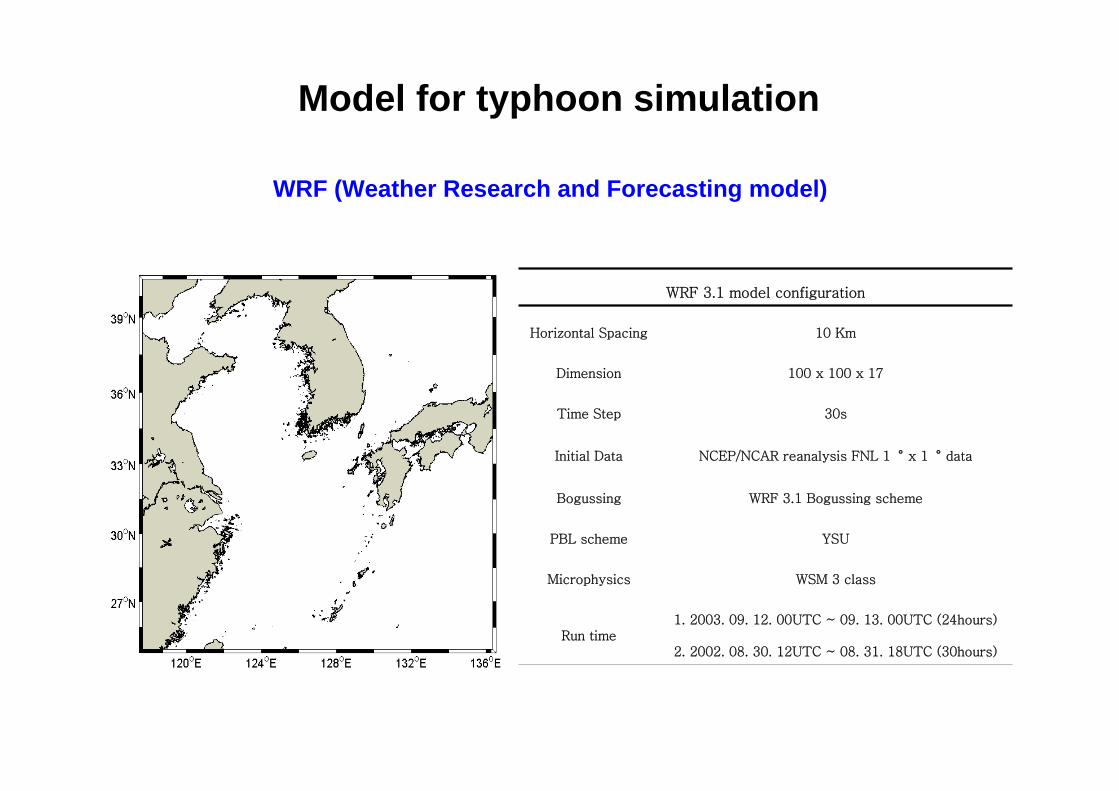
Model for typhoon simulation
WRF (Weather Research and Forecasting model)
WRF 3.1 model configuration
Horizontal Spacing 10 Km
Dimension 100 x 100 x 17
Time Step 30s
Initial Data NCEP/NCAR reanalysis FNL 1〬 x 1〬 data
Bogussing WRF 3.1 Bogussing scheme
PBL scheme YSU
Microphysics WSM 3 class
Run time1. 2003. 09. 12. 00UTC ~ 09. 13. 00UTC (24hours)
2. 2002. 08. 30. 12UTC ~ 08. 31. 18UTC (30hours)
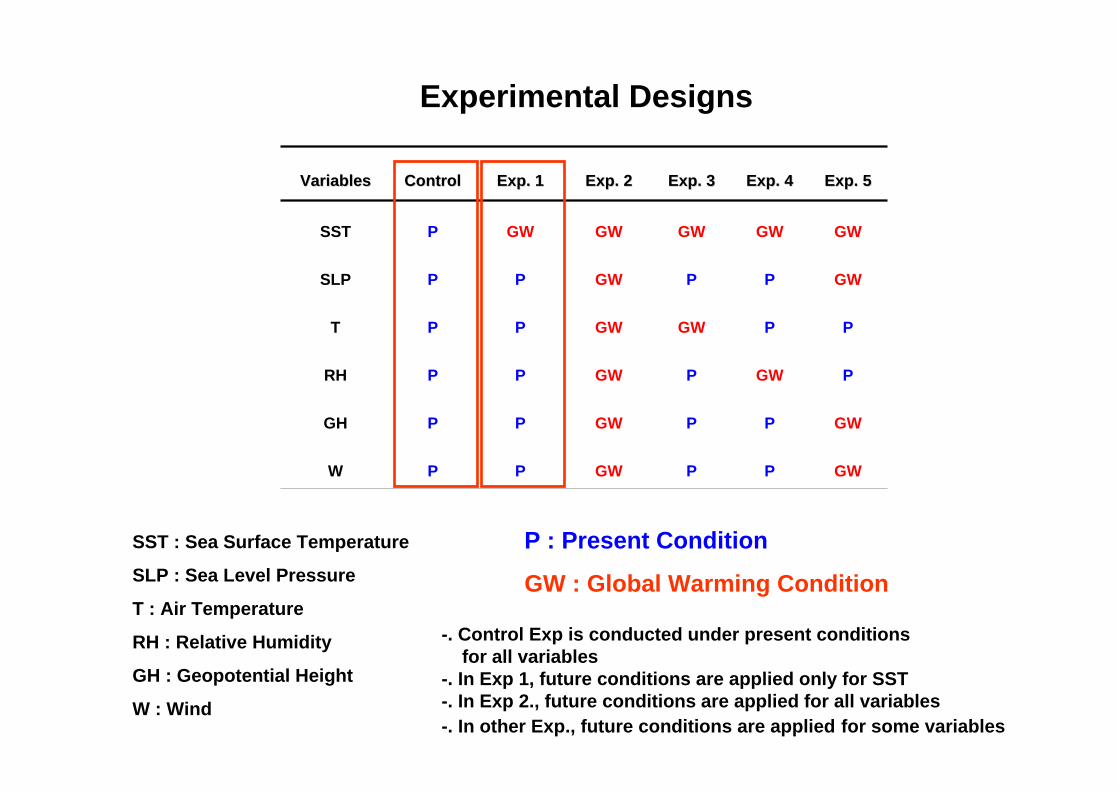
VariablesVariables ControlControl Exp. 1Exp. 1 Exp. 2Exp. 2 Exp. 3Exp. 3 Exp. 4Exp. 4 Exp. 5Exp. 5
SST P GW GW GW GW GW
SLP P P GW P P GW
T P P GW GW P P
RH P P GW P GW P
GH P P GW P P GW
W P P GW P P GW
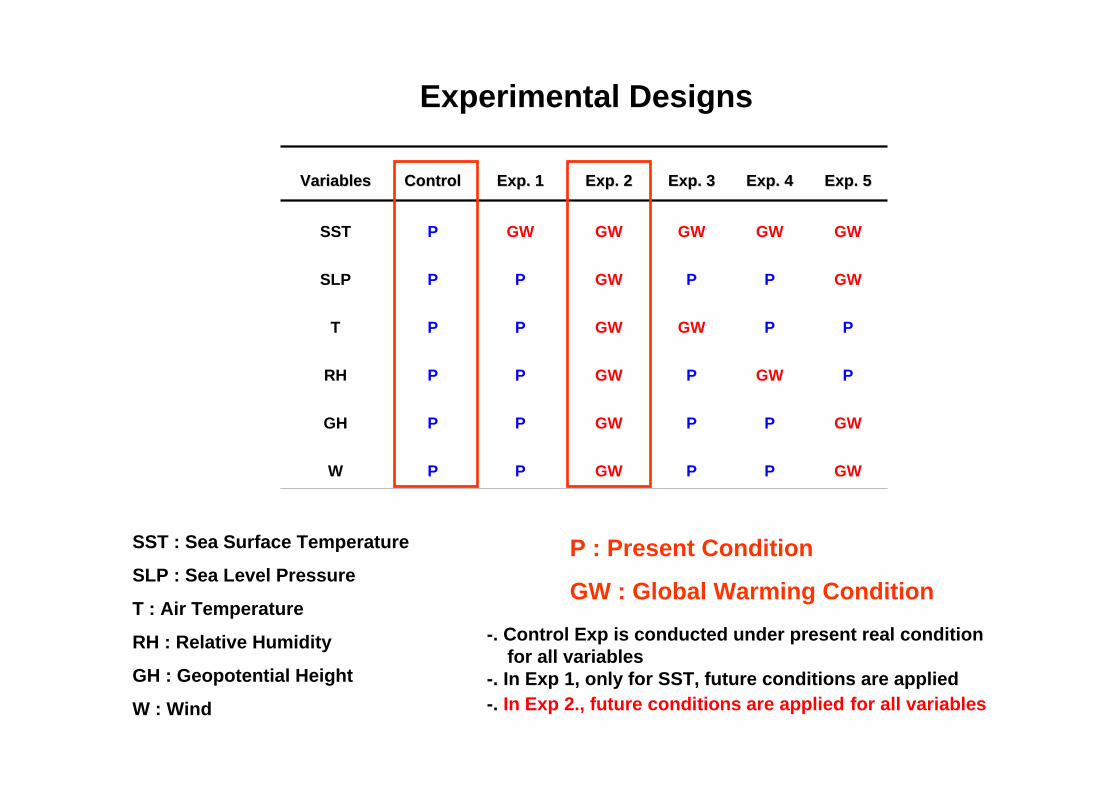
Experimental Designs
SST : Sea Surface Temperature
SLP : Sea Level Pressure
T : Air Temperature
RH : Relative Humidity
GH : Geopotential Height
W : Wind
P : Present Condition
GW : Global Warming Condition
-. Control Exp is conducted under present conditionsfor all variables
-. In Exp 1, future conditions are applied only for SST-. In Exp 2., future conditions are applied for all variables-. In other Exp., future conditions are applied for some variables
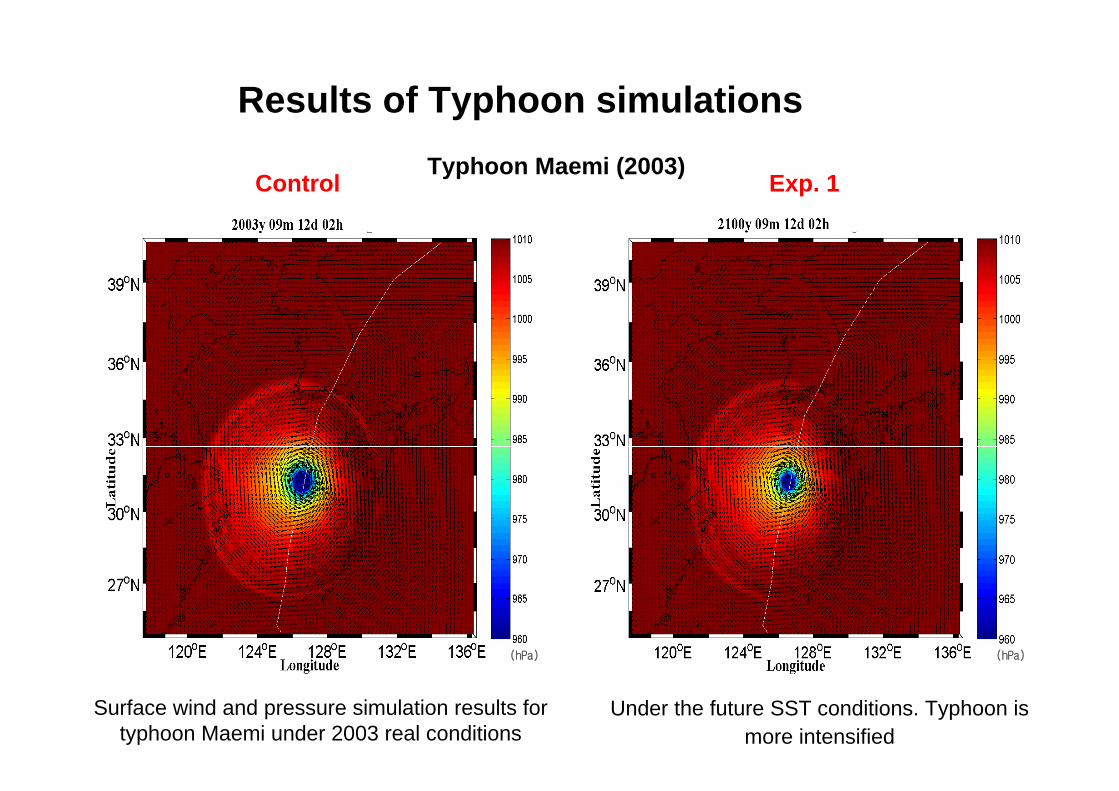
Typhoon Maemi (2003)Control Exp. 1
(hPa) (hPa)
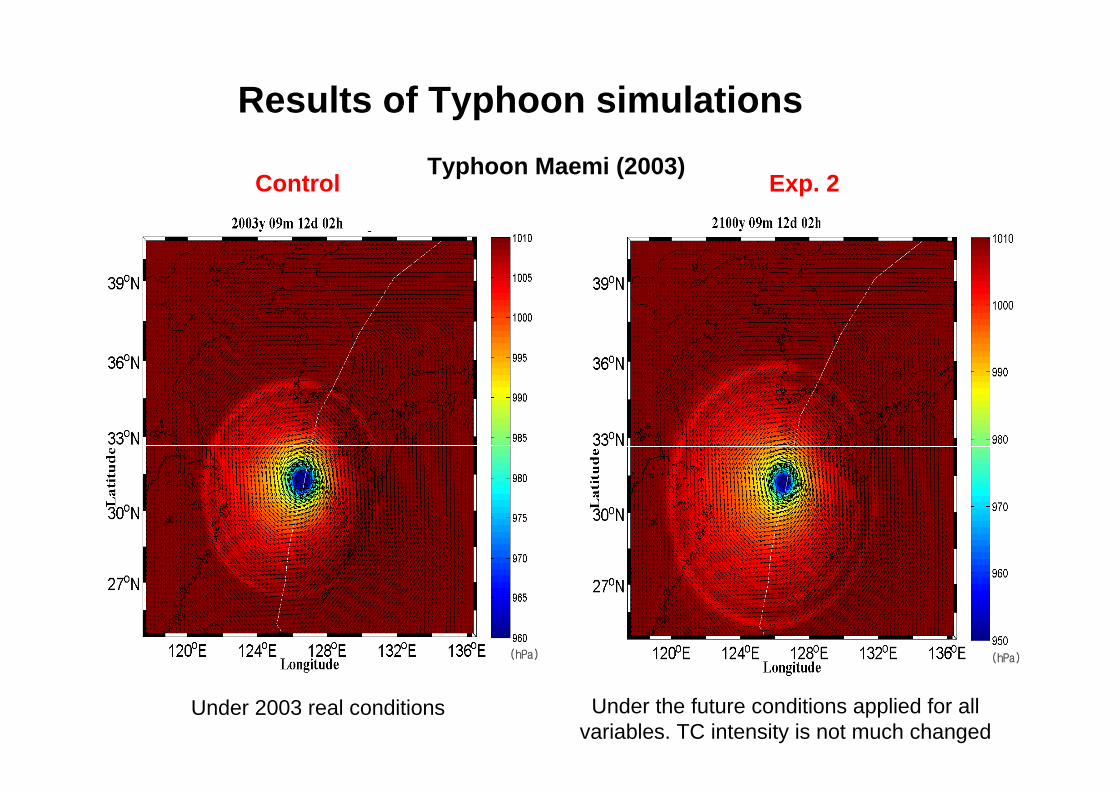
Results of Typhoon simulations
Under the future SST conditions. Typhoon is more intensified
Surface wind and pressure simulation results for typhoon Maemi under 2003 real conditions
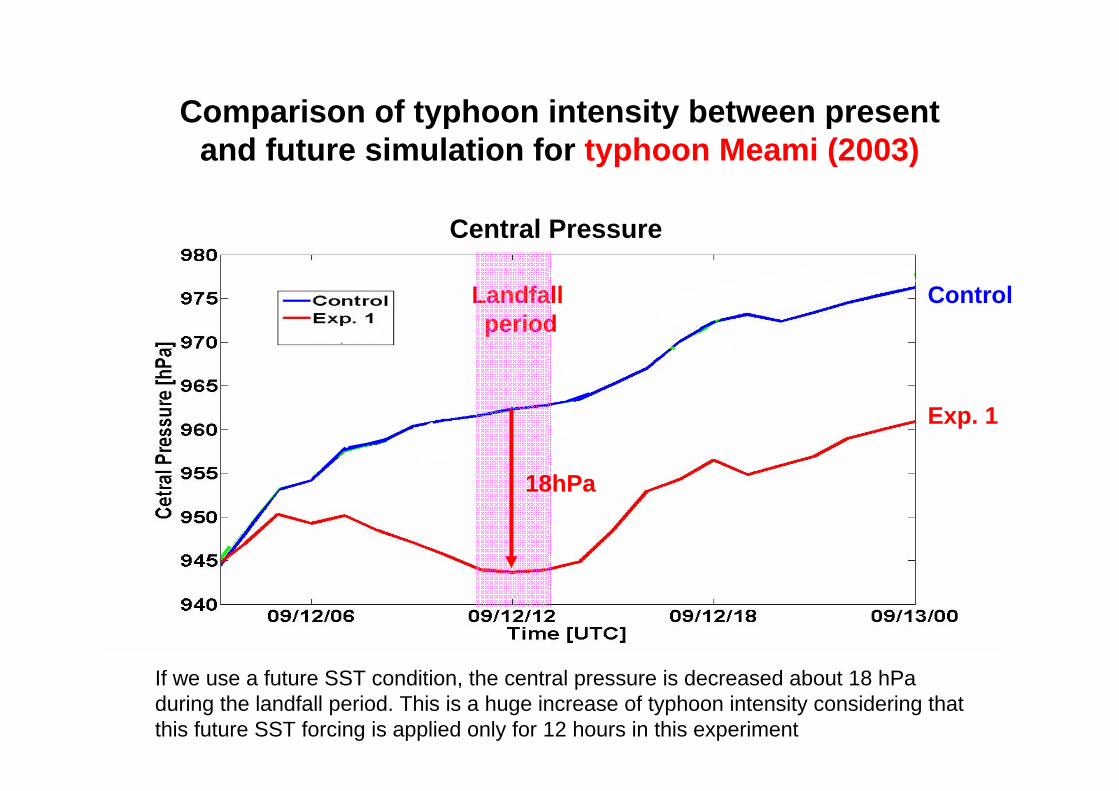
Comparison of typhoon intensity between present and future simulation for typhoon Meami (2003)
Central Pressure
Exp. 1
Control
If we use a future SST condition, the central pressure is decreased about 18 hPaduring the landfall period. This is a huge increase of typhoon intensity considering that this future SST forcing is applied only for 12 hours in this experiment
Landfallperiod
18hPa
VariablesVariables ControlControl Exp. 1Exp. 1 Exp. 2Exp. 2 Exp. 3Exp. 3 Exp. 4Exp. 4 Exp. 5Exp. 5
SST P GW GW GW GW GW
SLP P P GW P P GW
T P P GW GW P P
RH P P GW P GW P
GH P P GW P P GW
W P P GW P P GW
Experimental Designs
SST : Sea Surface Temperature
SLP : Sea Level Pressure
T : Air Temperature
RH : Relative Humidity
GH : Geopotential Height
W : Wind
P : Present Condition
GW : Global Warming Condition-. Control Exp is conducted under present real condition
for all variables-. In Exp 1, only for SST, future conditions are applied-. In Exp 2., future conditions are applied for all variables
(hPa) (hPa)
Typhoon Maemi (2003)Control Exp. 2
Results of Typhoon simulations
Under the future conditions applied for all variables. TC intensity is not much changed
Under 2003 real conditions
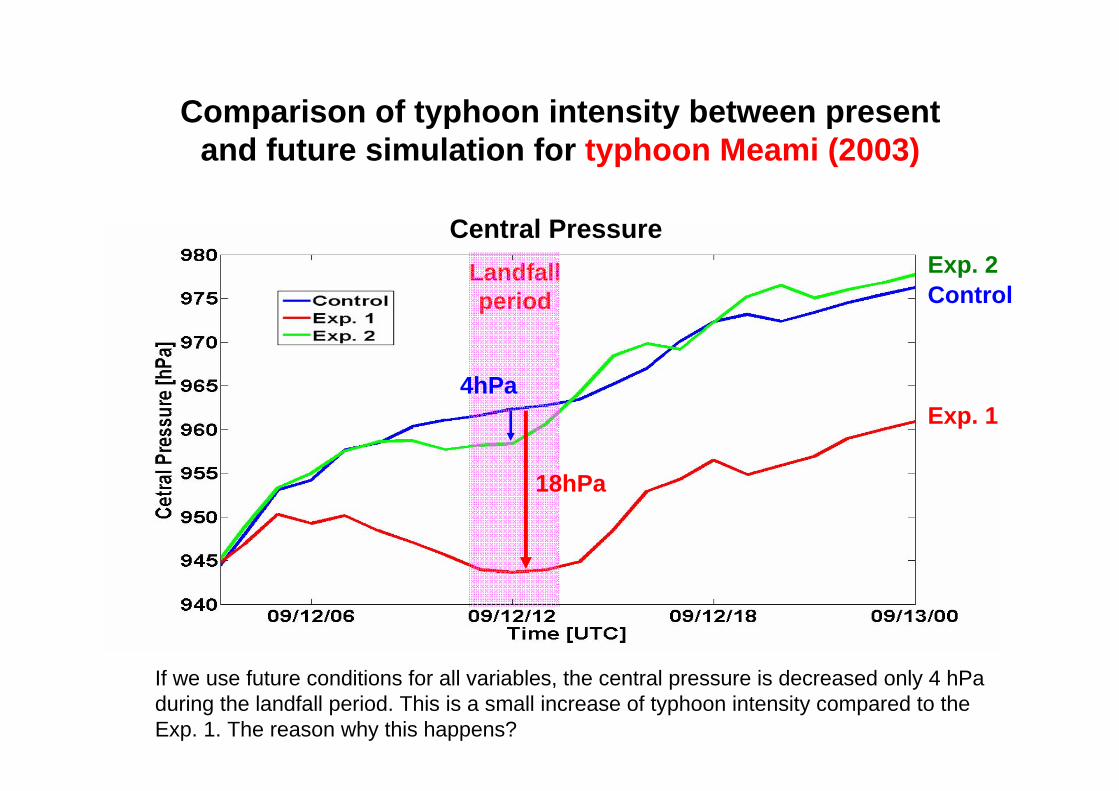
Comparison of typhoon intensity between present and future simulation for typhoon Meami (2003)
Central Pressure
Exp. 1
ControlExp. 2Landfall
period
18hPa
4hPa
If we use future conditions for all variables, the central pressure is decreased only 4 hPaduring the landfall period. This is a small increase of typhoon intensity compared to the Exp. 1. The reason why this happens?
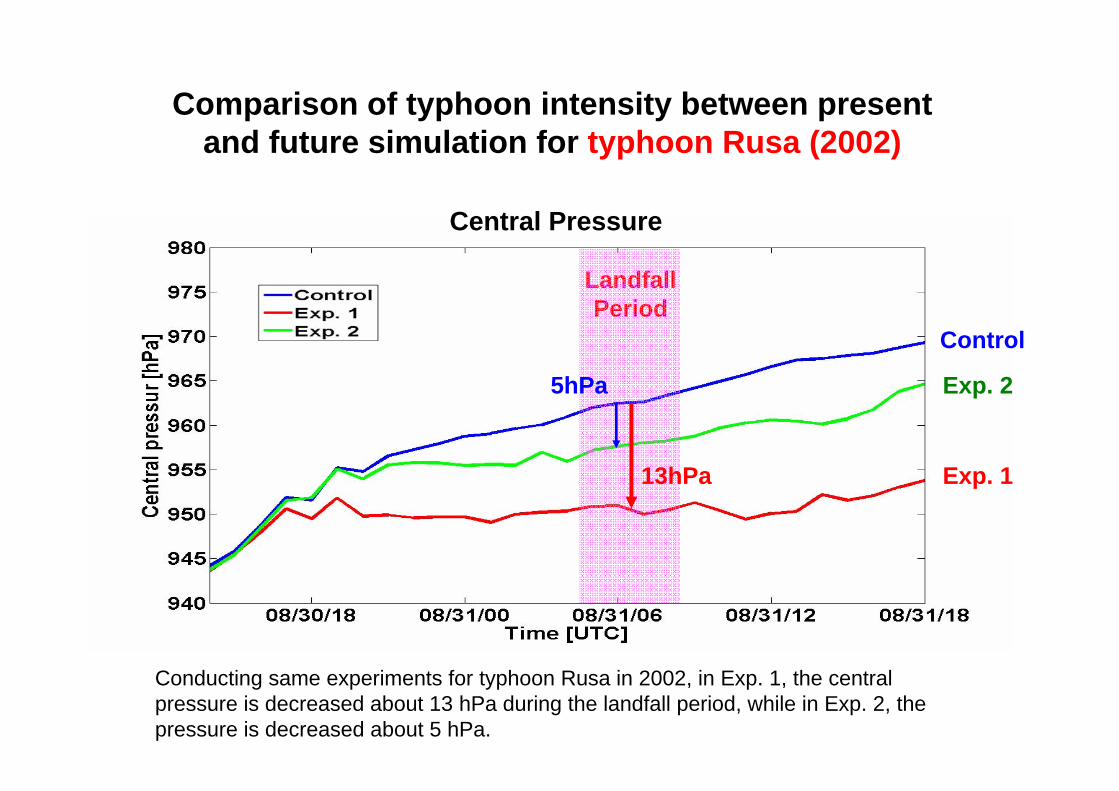
Comparison of typhoon intensity between present and future simulation for typhoon Rusa (2002)
Central Pressure
Exp. 1
Control
Exp. 2
LandfallPeriod
13hPa
5hPa
Conducting same experiments for typhoon Rusa in 2002, in Exp. 1, the central pressure is decreased about 13 hPa during the landfall period, while in Exp. 2, the pressure is decreased about 5 hPa.
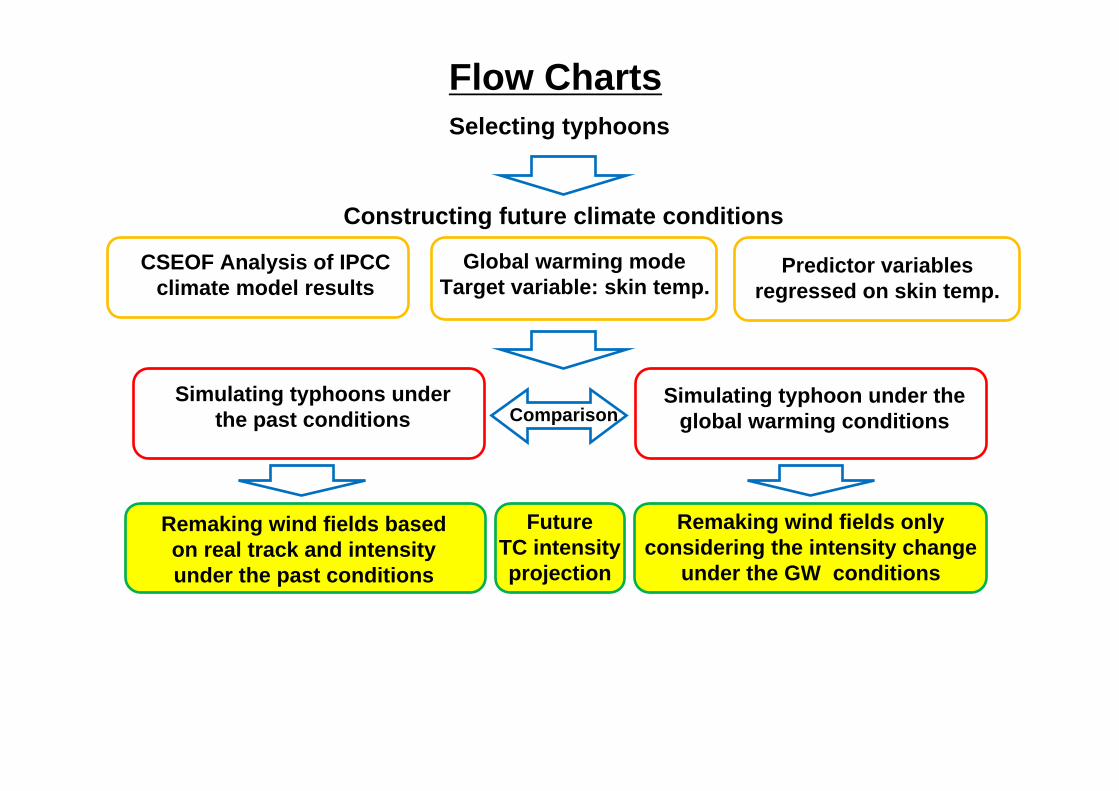
Simulating typhoons under the past conditions
Simulating typhoon under the global warming conditions
Remaking wind fields based on real track and intensity under the past conditions
Remaking wind fields only considering the intensity change
under the GW conditions
Comparison
CSEOF Analysis of IPCC climate model results
Global warming mode Target variable: skin temp.
Predictor variables regressed on skin temp.
FutureTC intensityprojection
Selecting typhoons
Constructing future climate conditions
Flow Charts
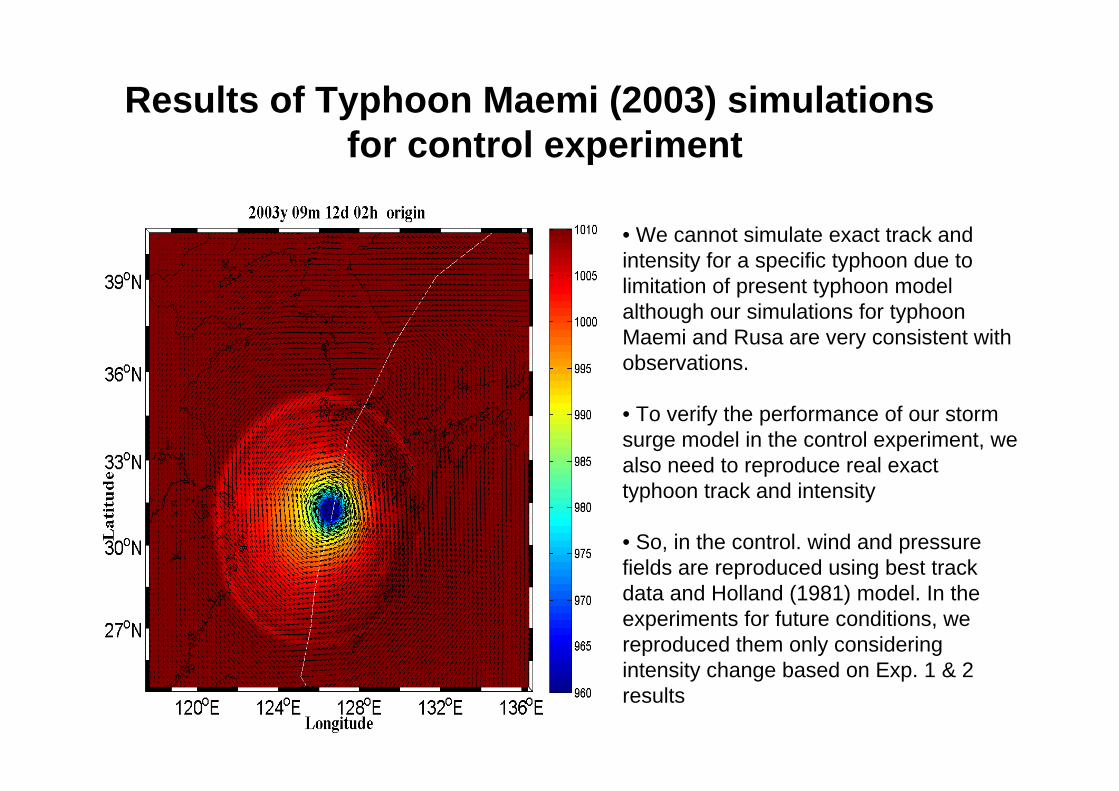
Results of Typhoon Maemi (2003) simulationsfor control experiment
• We cannot simulate exact track and intensity for a specific typhoon due to limitation of present typhoon model although our simulations for typhoon Maemi and Rusa are very consistent with observations.
• To verify the performance of our storm surge model in the control experiment, we also need to reproduce real exact typhoon track and intensity
• So, in the control. wind and pressure fields are reproduced using best track data and Holland (1981) model. In the experiments for future conditions, we reproduced them only considering intensity change based on Exp. 1 & 2 results
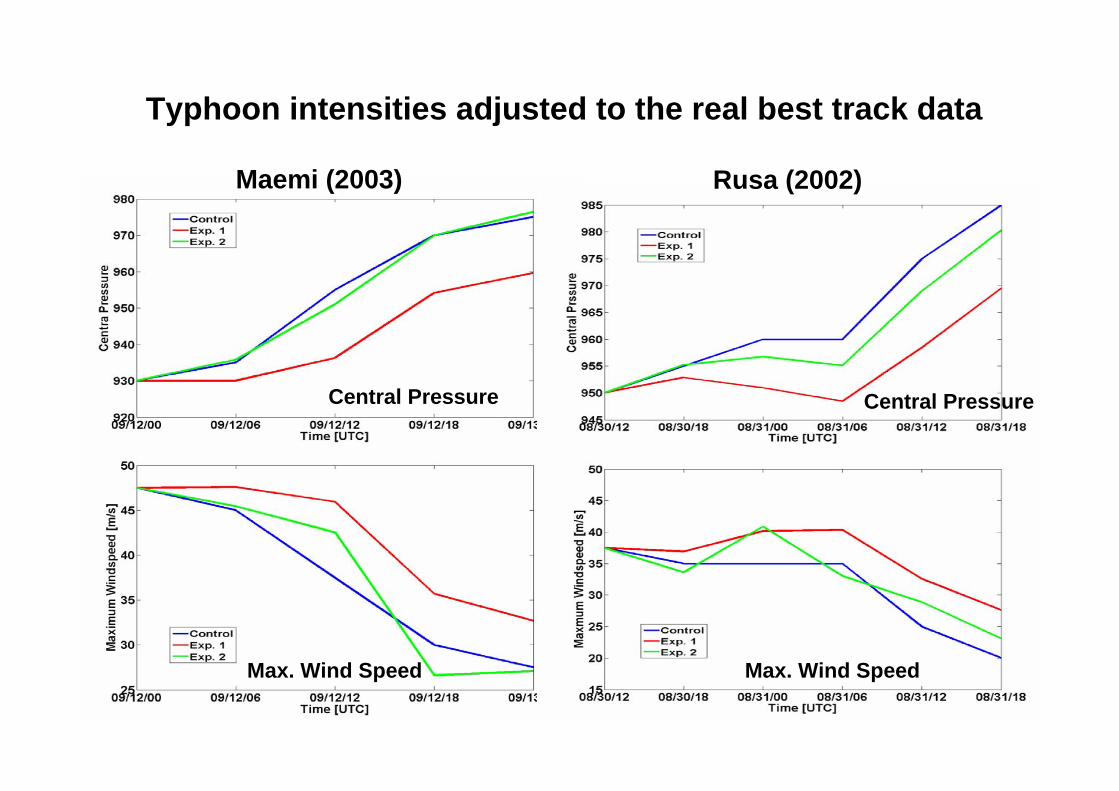
Typhoon intensities adjusted to the real best track data
Maemi (2003) Rusa (2002)
Central Pressure Central Pressure
Max. Wind Speed Max. Wind Speed
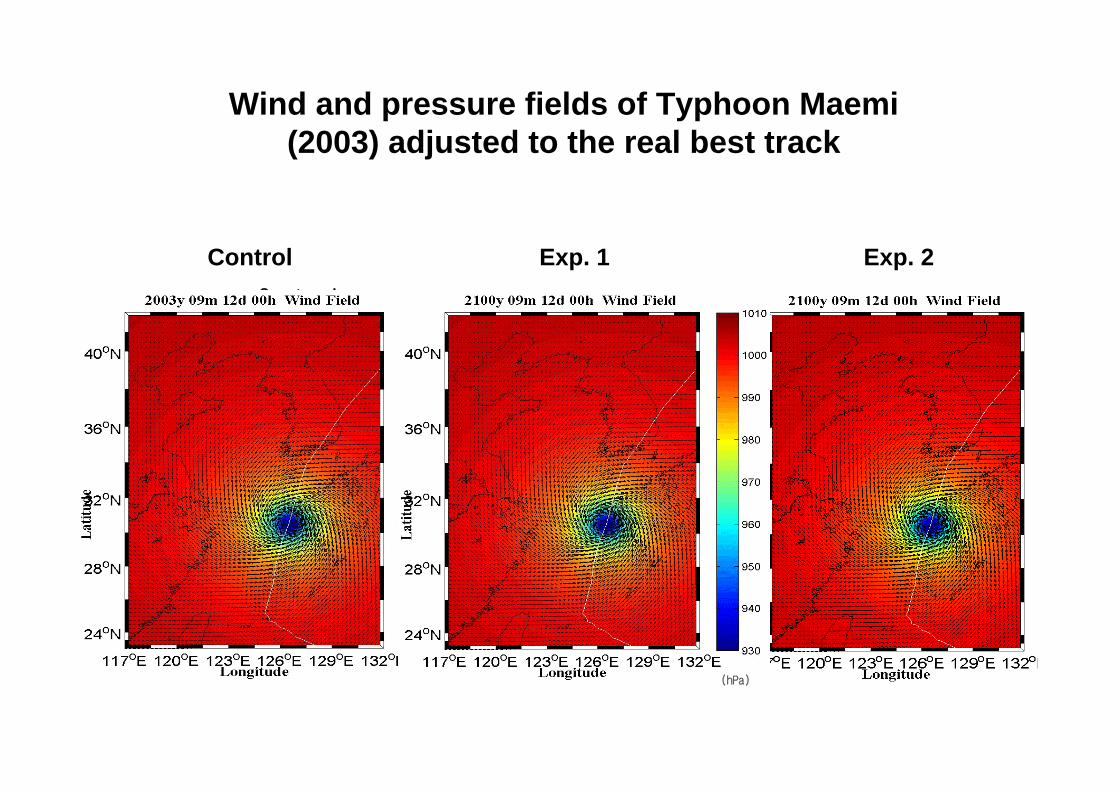
Control Exp. 1
Wind and pressure fields of Typhoon Maemi (2003) adjusted to the real best track
(hPa)
Control Exp. 1 Exp. 2
(hPa)
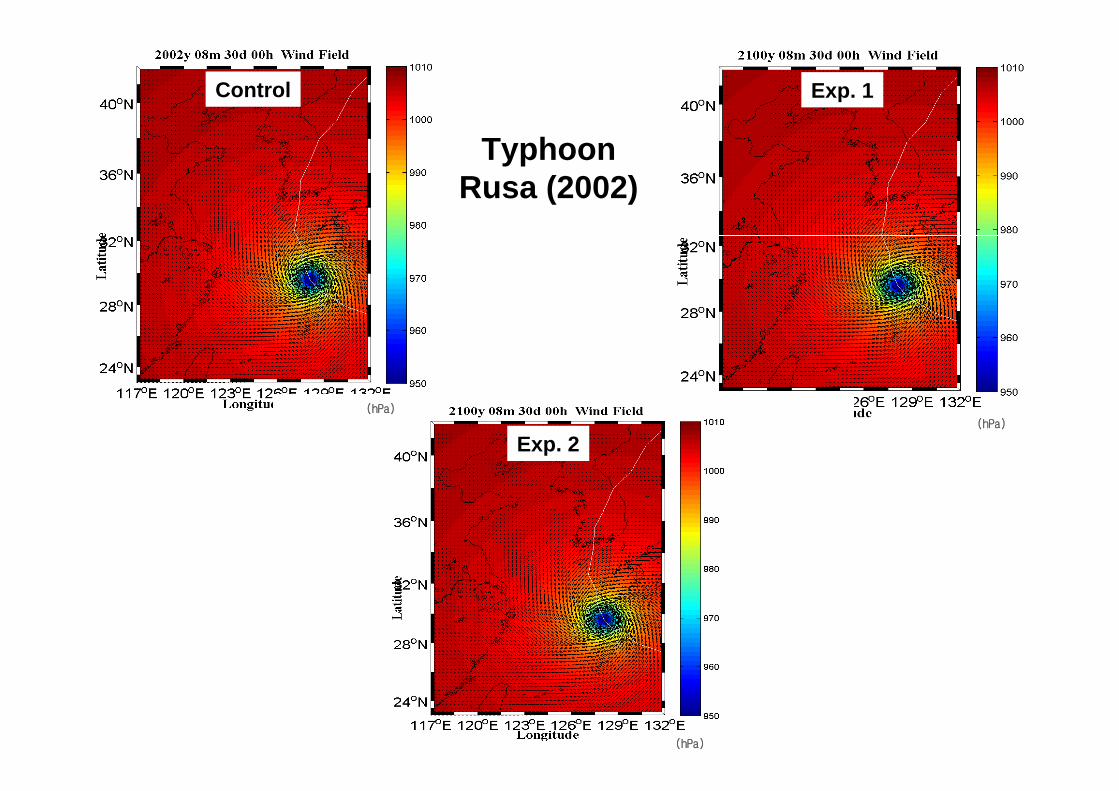
Typhoon Rusa (2002)
Control Exp. 1
Exp. 2
(hPa)
(hPa)
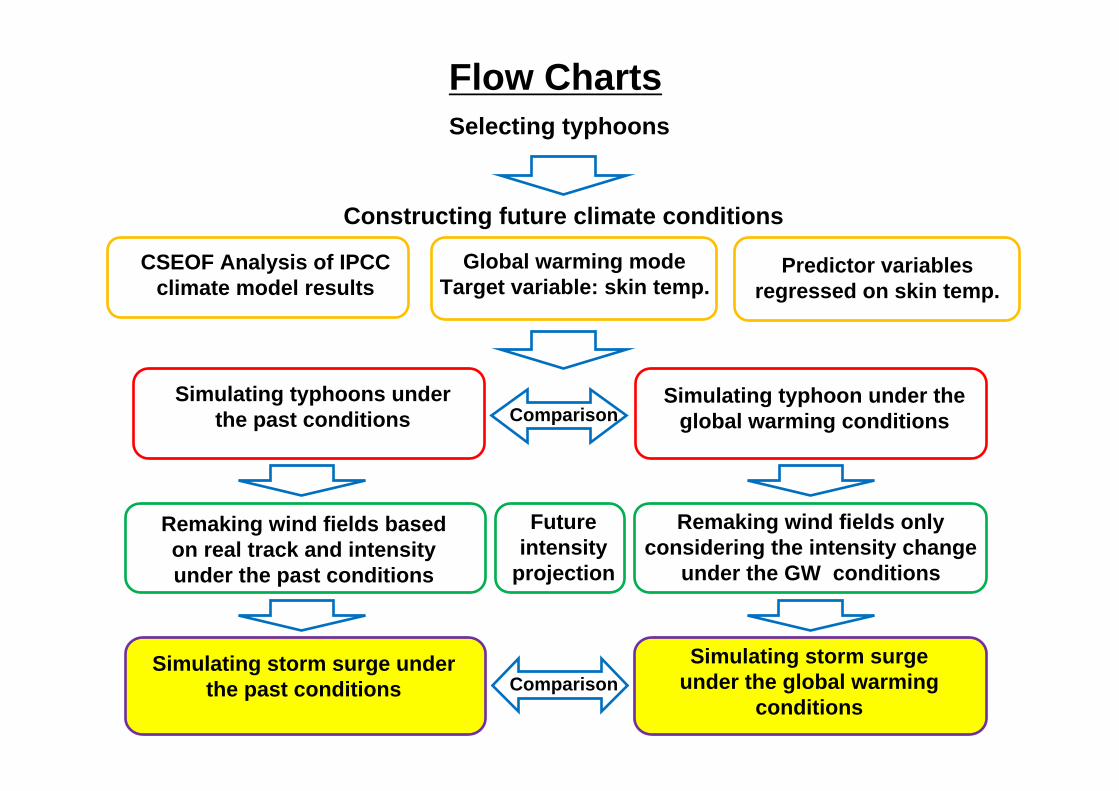
Simulating typhoons under the past conditions
Simulating typhoon under the global warming conditions
Remaking wind fields based on real track and intensity under the past conditions
Remaking wind fields only considering the intensity change
under the GW conditions
Comparison
CSEOF Analysis of IPCC climate model results
Global warming mode Target variable: skin temp.
Predictor variables regressed on skin temp.
Simulating storm surge under the past conditions
Simulating storm surge under the global warming
conditionsComparison
Futureintensity
projection
Selecting typhoons
Constructing future climate conditions
Flow Charts
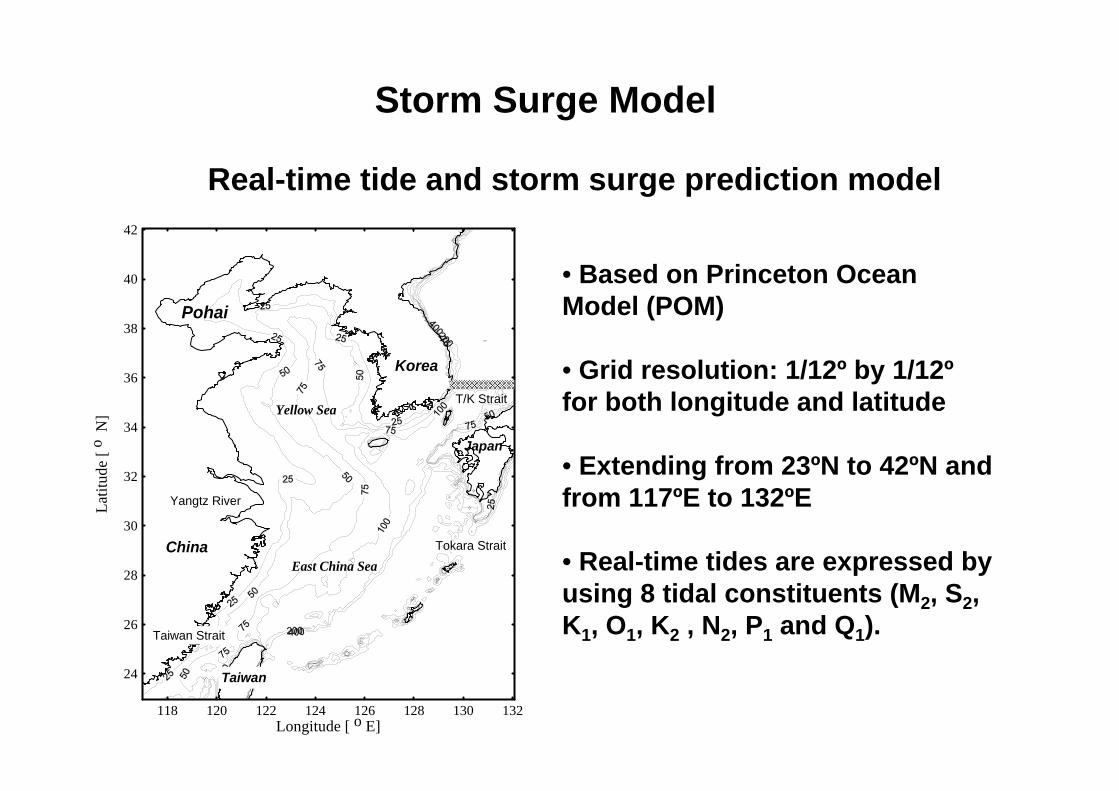
• Based on Princeton Ocean Model (POM)
• Grid resolution: 1/12º by 1/12ºfor both longitude and latitude
• Extending from 23ºN to 42ºN and from 117ºE to 132ºE
• Real-time tides are expressed by using 8 tidal constituents (M2, S2, K1, O1, K2 , N2, P1 and Q1).
Storm Surge Model
Real-time tide and storm surge prediction model
118 120 122 124 126 128 130 132Longitude [ o E]
24
26
28
30
32
34
36
38
40
42
Latit
ude
[ o N
] Yellow Sea
East China Sea
Korea
China
Japan
Taiwan
Yangtz River
Taiwan Strait
Tokara Strait
Pohai
T/K Strait
M2
S2
K1
O1
Amplitude Amplitude
Amplitude Amplitude
Phase
Phase
Phase
Phase
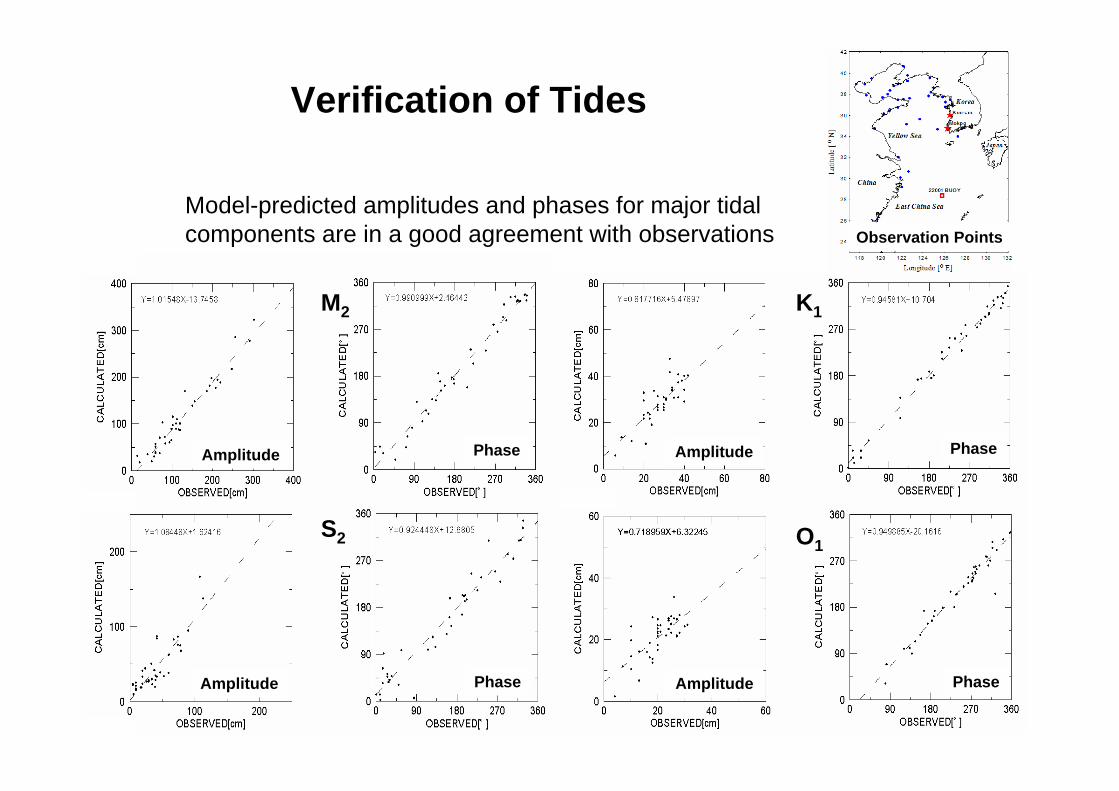
Verification of Tides
Observation Points
Model-predicted amplitudes and phases for major tidal components are in a good agreement with observations
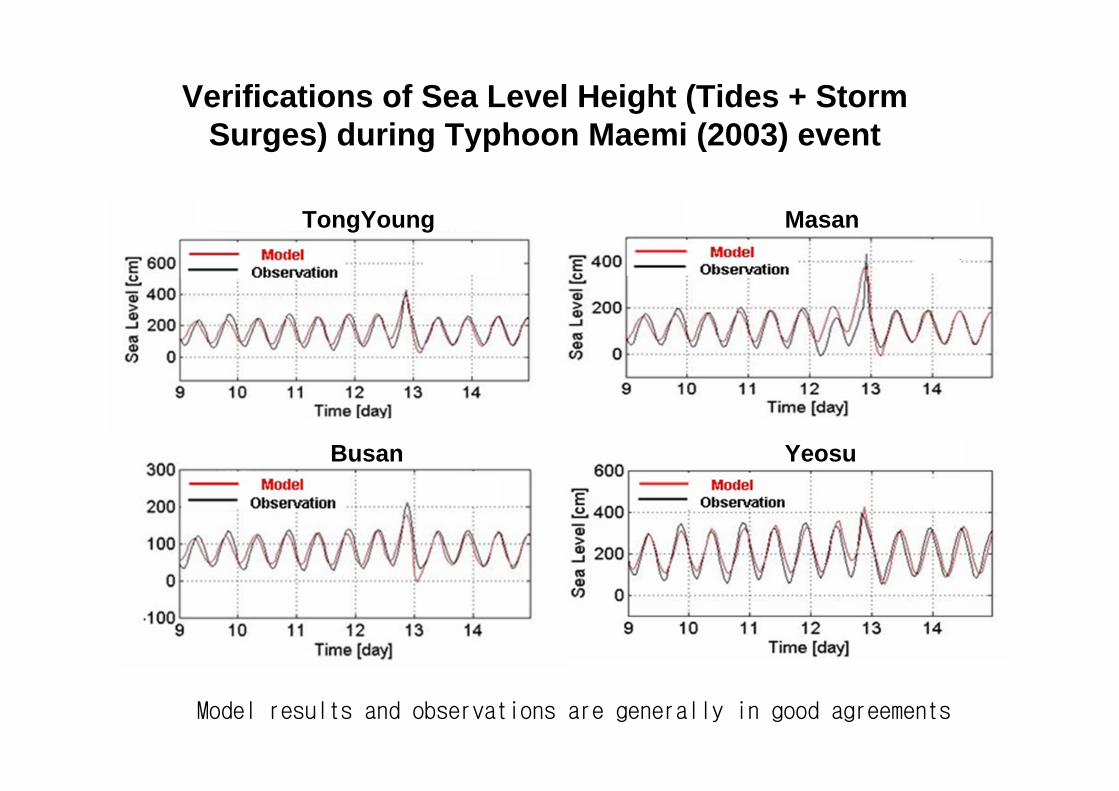
Verifications of Sea Level Height (Tides + Storm Surges) during Typhoon Maemi (2003) event
TongYoung
Busan
Masan
Yeosu
Model results and observations are generally in good agreements
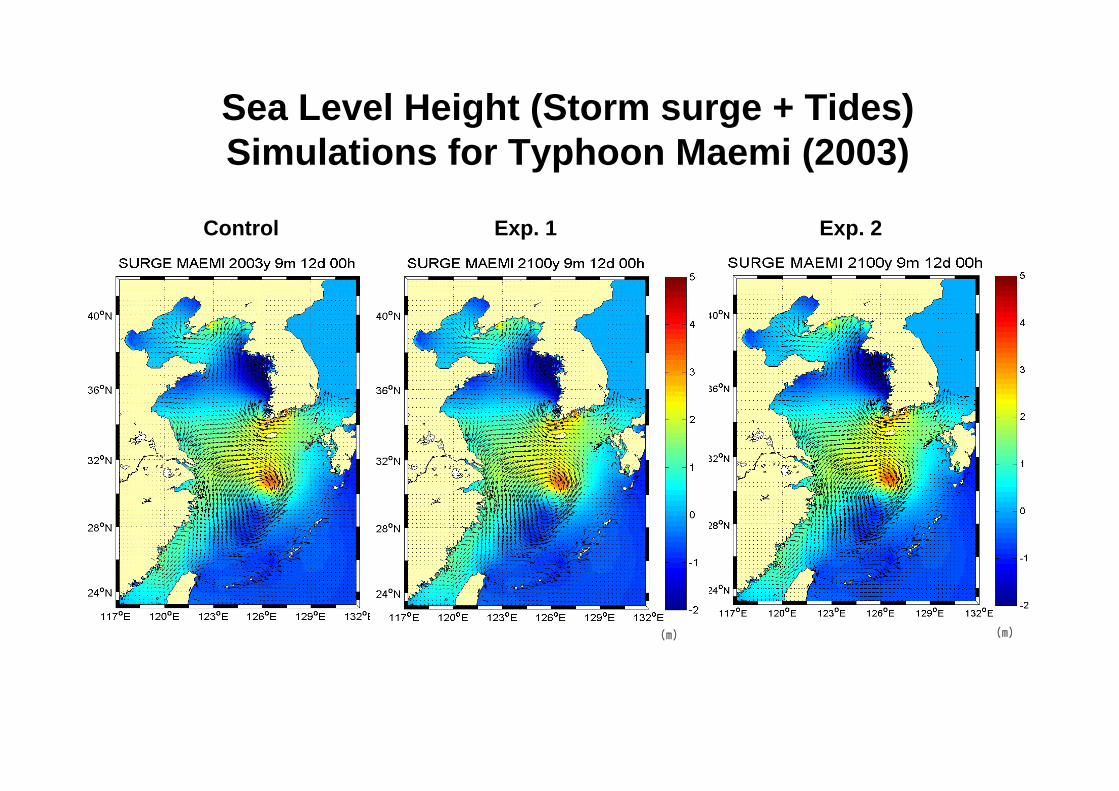
Control Exp. 1 Exp. 2
Sea Level Height (Storm surge + Tides) Simulations for Typhoon Maemi (2003)
(m) (m)
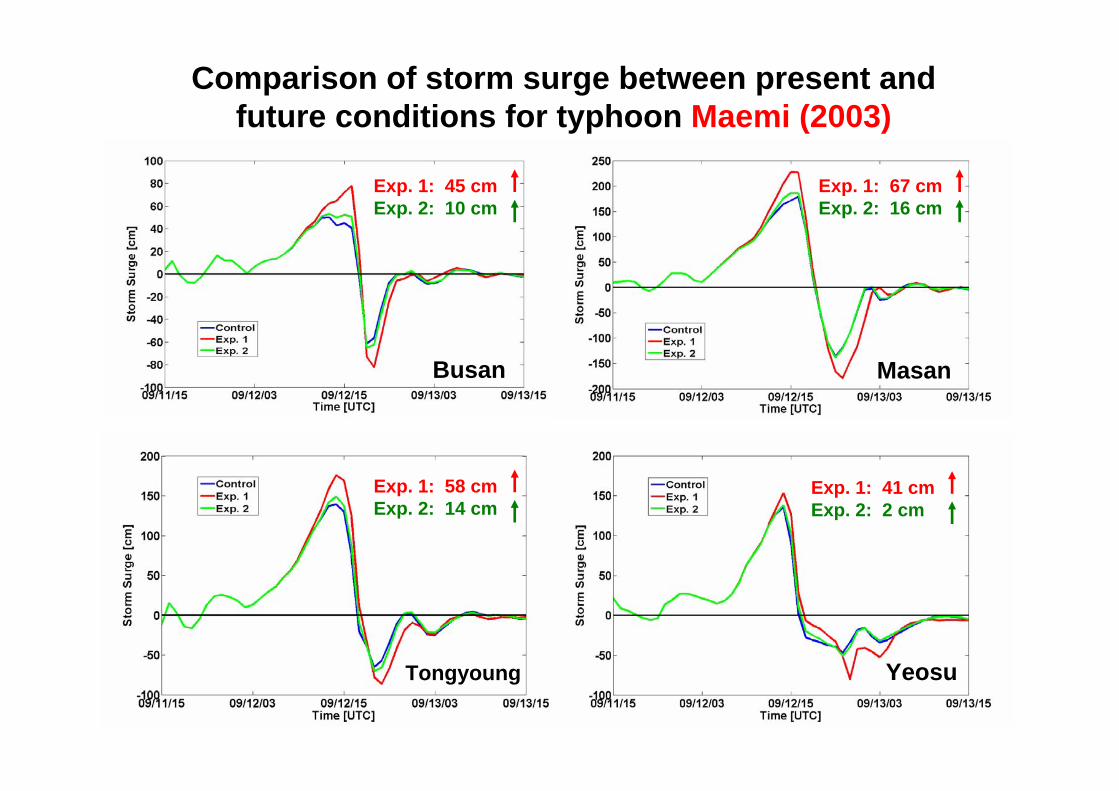
Comparison of storm surge between present and future conditions for typhoon Maemi (2003)
YeosuTongyoung
Busan Masan
Exp. 1: 45 cmExp. 2: 10 cm
Exp. 1: 67 cmExp. 2: 16 cm
Exp. 1: 58 cmExp. 2: 14 cm
Exp. 1: 41 cmExp. 2: 2 cm
Exp. 2
(m) (m)
(m)
Control Exp. 1
Exp. 2
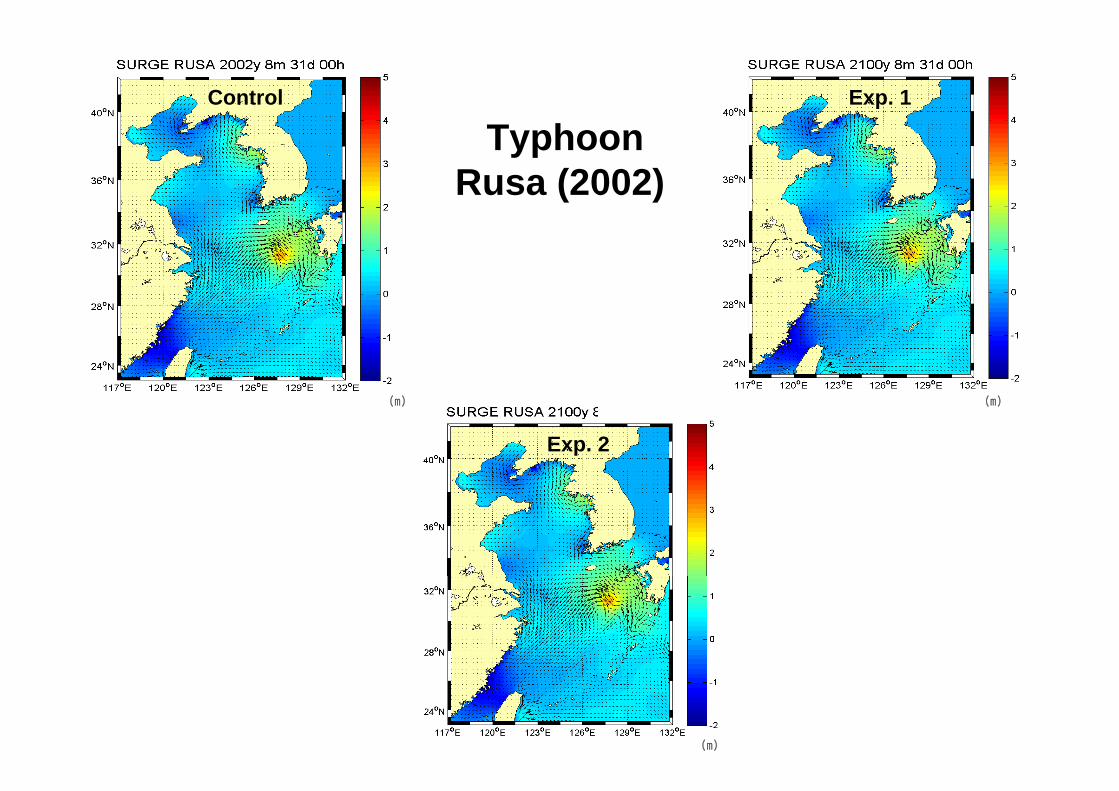
Typhoon Rusa (2002)
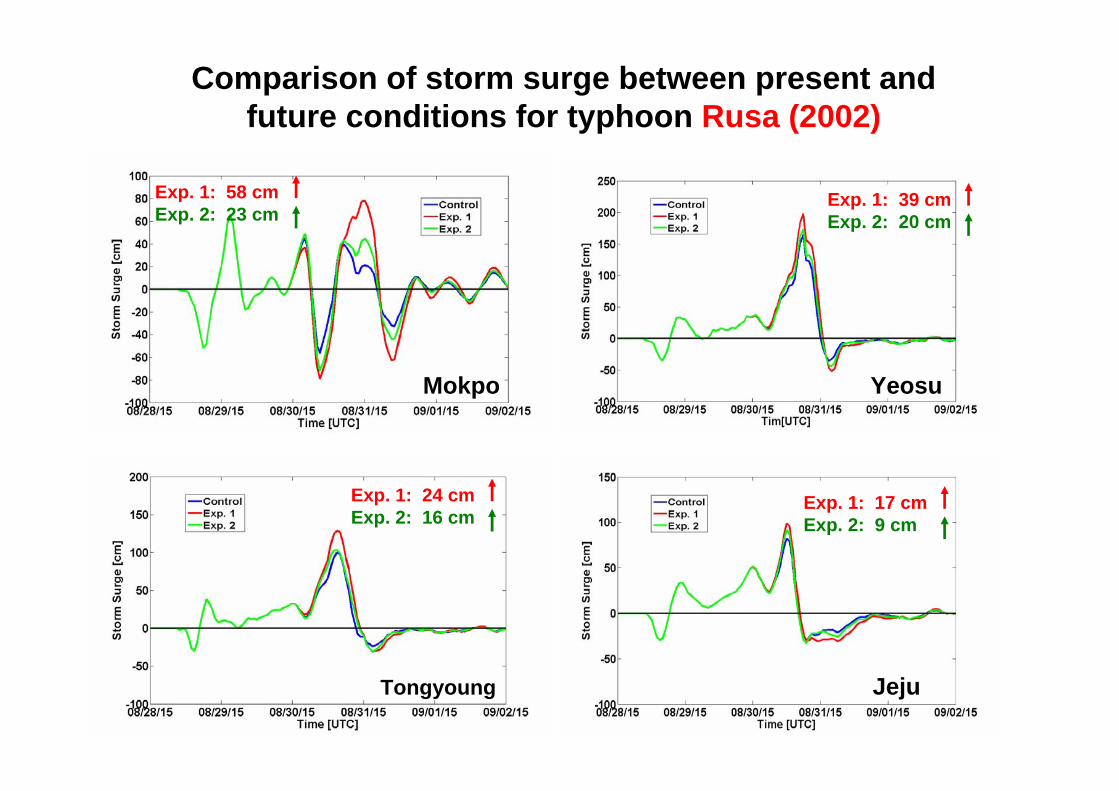
Exp. 1: 58 cmExp. 2: 23 cm
Exp. 1: 39 cmExp. 2: 20 cm
JejuTongyoung
Mokpo Yeosu
Exp. 1: 17 cmExp. 2: 9 cm
Exp. 1: 24 cmExp. 2: 16 cm
Comparison of storm surge between present and future conditions for typhoon Rusa (2002)
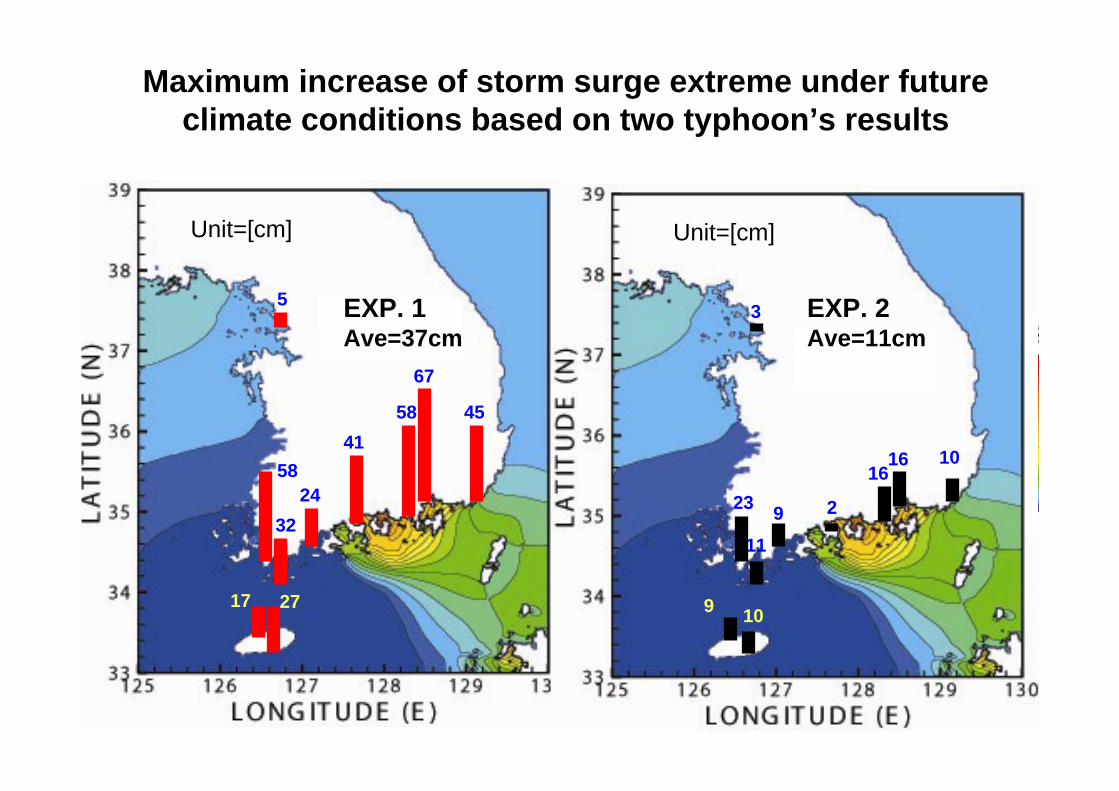
Maximum increase of storm surge extreme under future climate conditions based on two typhoon’s results
67
455841
2432
5
58
17 27
16 1016
2911
3
23
9 10
EXP. 1Ave=37cm
EXP. 2Ave=11cm
Unit=[cm] Unit=[cm]
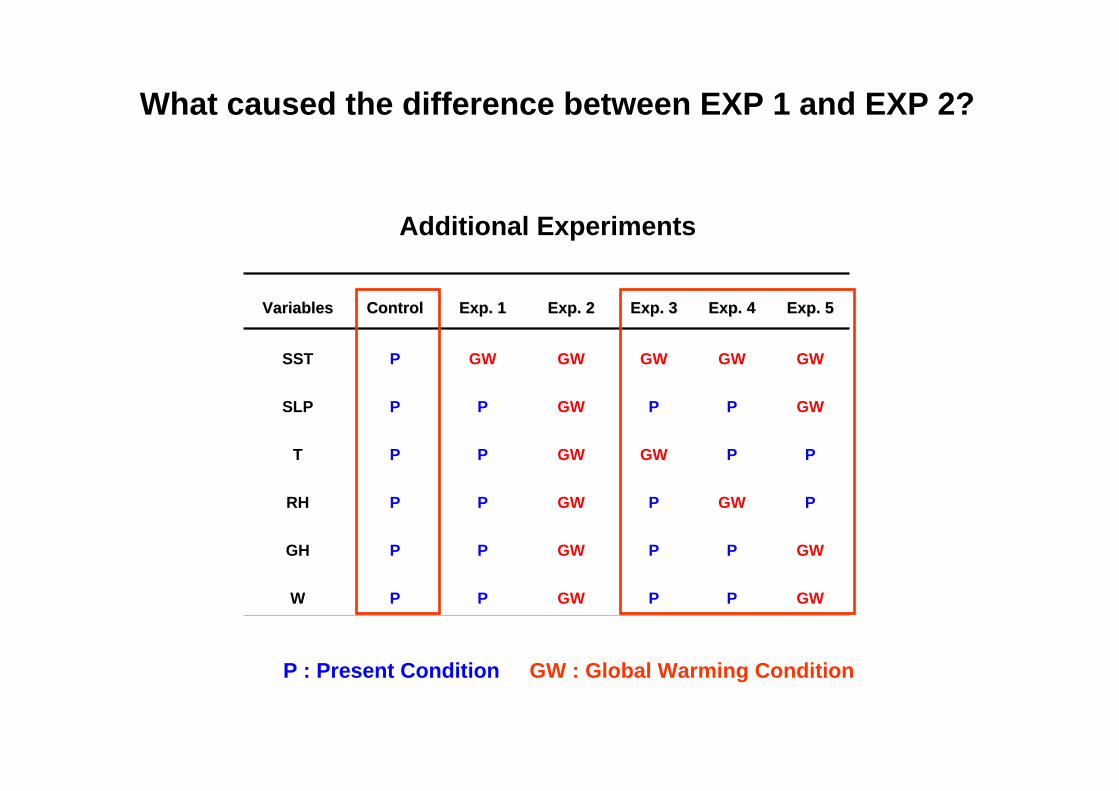
What caused the difference between EXP 1 and EXP 2?
VariablesVariables ControlControl Exp. 1Exp. 1 Exp. 2Exp. 2 Exp. 3Exp. 3 Exp. 4Exp. 4 Exp. 5Exp. 5
SST P GW GW GW GW GW
SLP P P GW P P GW
T P P GW GW P P
RH P P GW P GW P
GH P P GW P P GW
W P P GW P P GW
Additional Experiments
P : Present Condition GW : Global Warming Condition
ResultsVariablesVariables ControlControl Exp. 1Exp. 1 Exp. 2Exp. 2 Exp. 3Exp. 3 Exp. 4Exp. 4 Exp. 5Exp. 5
SST P GW GW GW GW GW
SLP P P GW P P GW
T P P GW GW P P
RH P P GW P GW P
GH P P GW P P GW
W P P GW P P GW
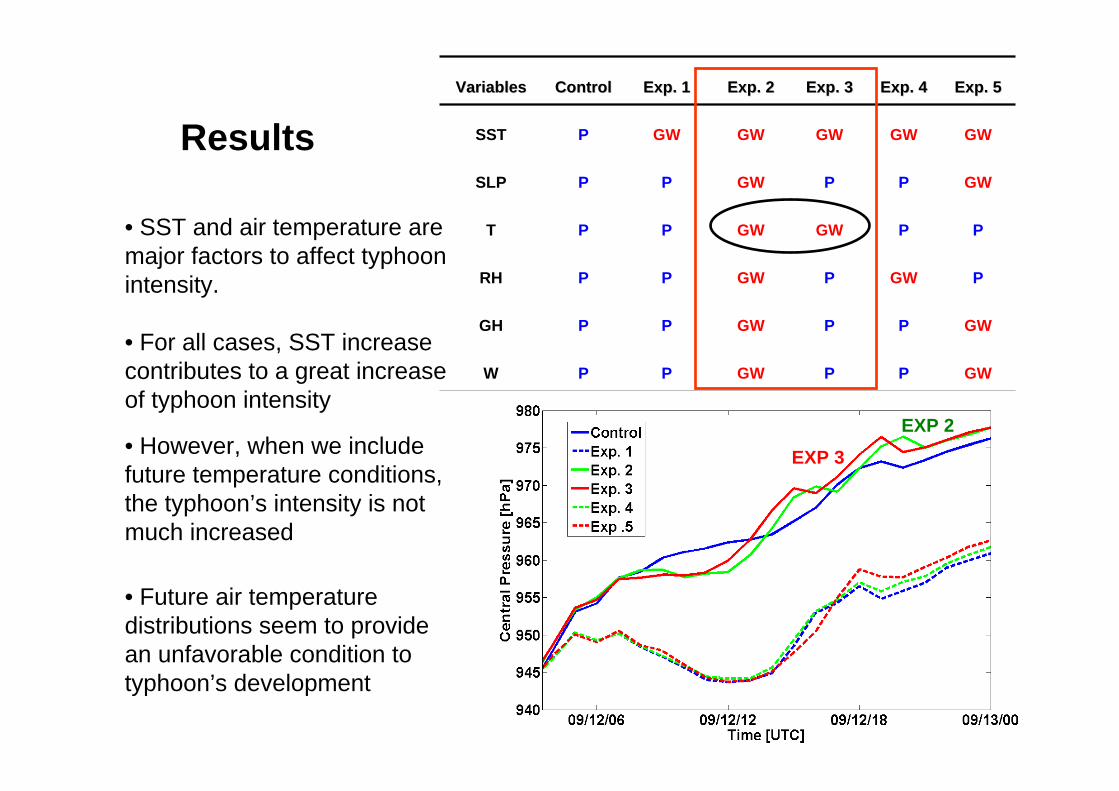
• However, when we include future temperature conditions, the typhoon’s intensity is not much increased
EXP 3EXP 2
• Future air temperature distributions seem to provide an unfavorable condition to typhoon’s development
• SST and air temperature are major factors to affect typhoon intensity.
• For all cases, SST increase contributes to a great increase of typhoon intensity
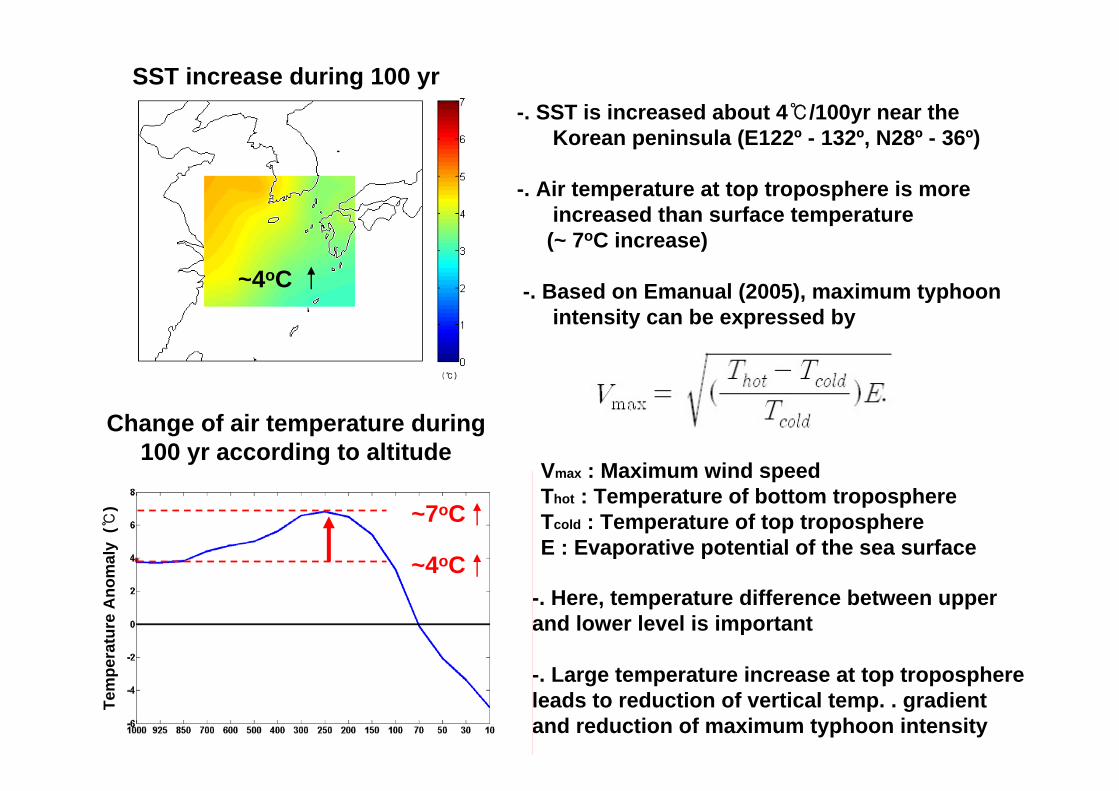
-. Here, temperature difference between upper and lower level is important
-. Large temperature increase at top troposphere leads to reduction of vertical temp. . gradient and reduction of maximum typhoon intensity
Tem
pera
ture
Ano
mal
y (℃
)
Change of air temperature during 100 yr according to altitude
~4oC
SST increase during 100 yr
~4oC
~7oC
-. SST is increased about 4℃/100yr near the Korean peninsula (E122º - 132º, N28º - 36º)
-. Air temperature at top troposphere is more increased than surface temperature
(~ 7oC increase)
-. Based on Emanual (2005), maximum typhoon intensity can be expressed by
Vmax : Maximum wind speed Thot : Temperature of bottom troposphereTcold : Temperature of top troposphereE : Evaporative potential of the sea surface
(℃)
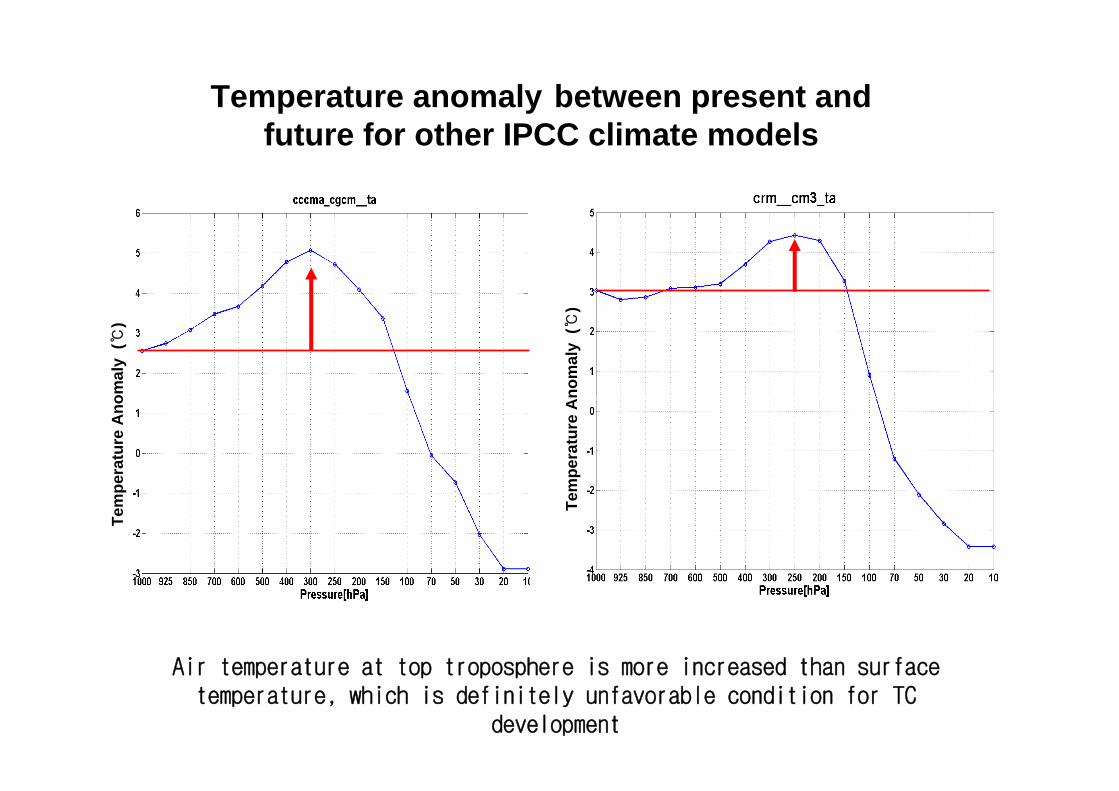
Temperature anomaly between present and future for other IPCC climate models
Air temperature at top troposphere is more increased than surface temperature, which is definitely unfavorable condition for TC
development
Tem
pera
ture
Ano
mal
y (℃
)
Tem
pera
ture
Ano
mal
y (℃
)
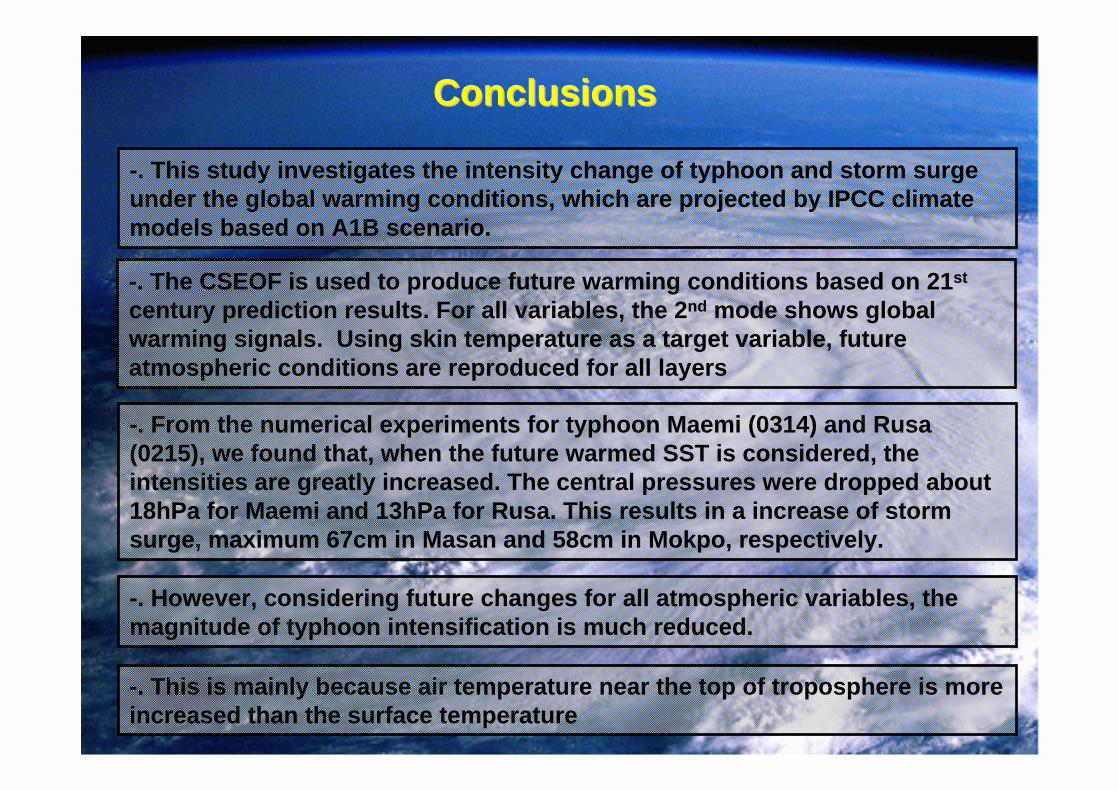
-. This study investigates the intensity change of typhoon and storm surge under the global warming conditions, which are projected by IPCC climate models based on A1B scenario.
ConclusionsConclusions
-. The CSEOF is used to produce future warming conditions based on 21st
century prediction results. For all variables, the 2nd mode shows global warming signals. Using skin temperature as a target variable, future atmospheric conditions are reproduced for all layers
-. From the numerical experiments for typhoon Maemi (0314) and Rusa(0215), we found that, when the future warmed SST is considered, the intensities are greatly increased. The central pressures were dropped about 18hPa for Maemi and 13hPa for Rusa. This results in a increase of storm surge, maximum 67cm in Masan and 58cm in Mokpo, respectively.
-. However, considering future changes for all atmospheric variables, the magnitude of typhoon intensification is much reduced.
-. This is mainly because air temperature near the top of troposphere is more increased than the surface temperature

Thank you!

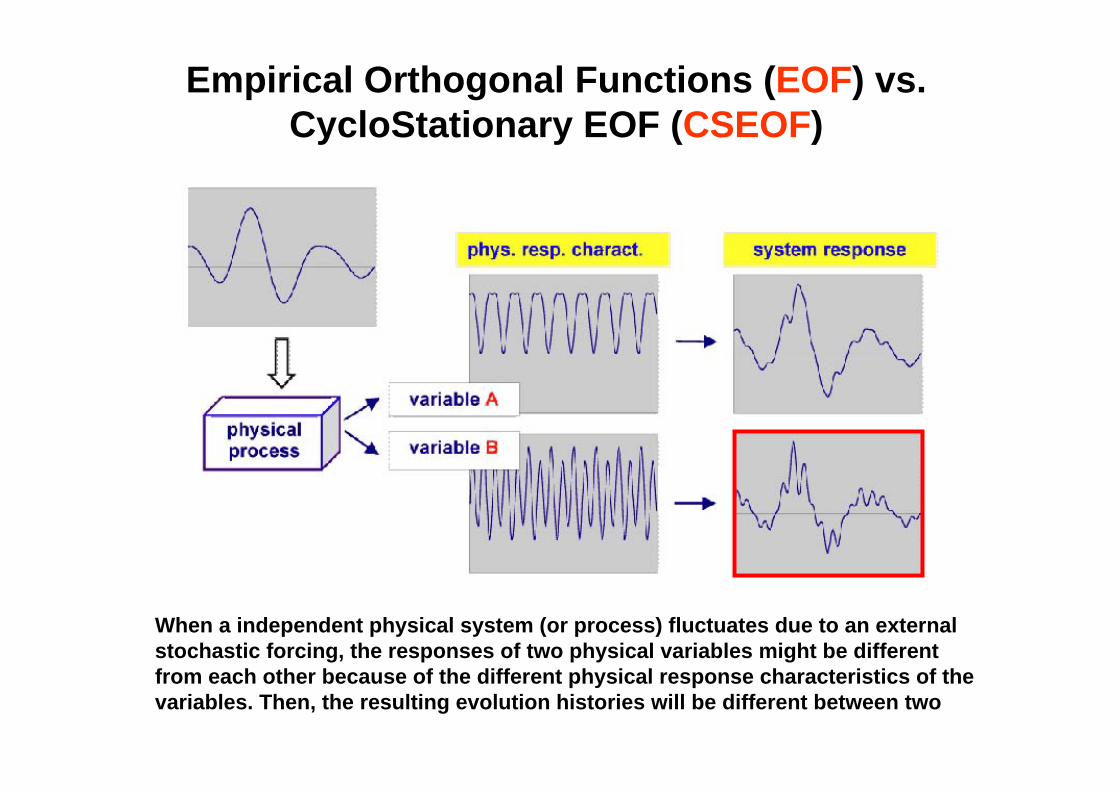
Empirical Orthogonal Functions (EOF) vs. CycloStationary EOF (CSEOF)
When a independent physical system (or process) fluctuates due to an external stochastic forcing, the responses of two physical variables might be different from each other because of the different physical response characteristics of the variables. Then, the resulting evolution histories will be different between two
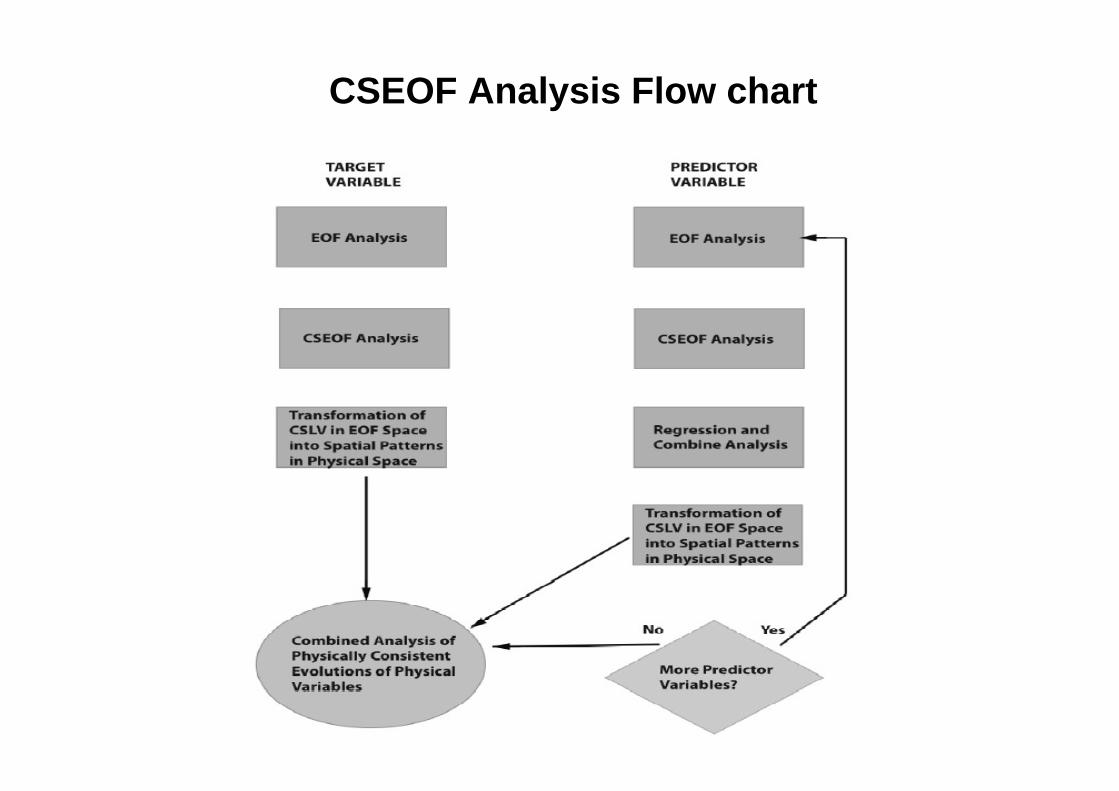
CSEOF Analysis Flow chart
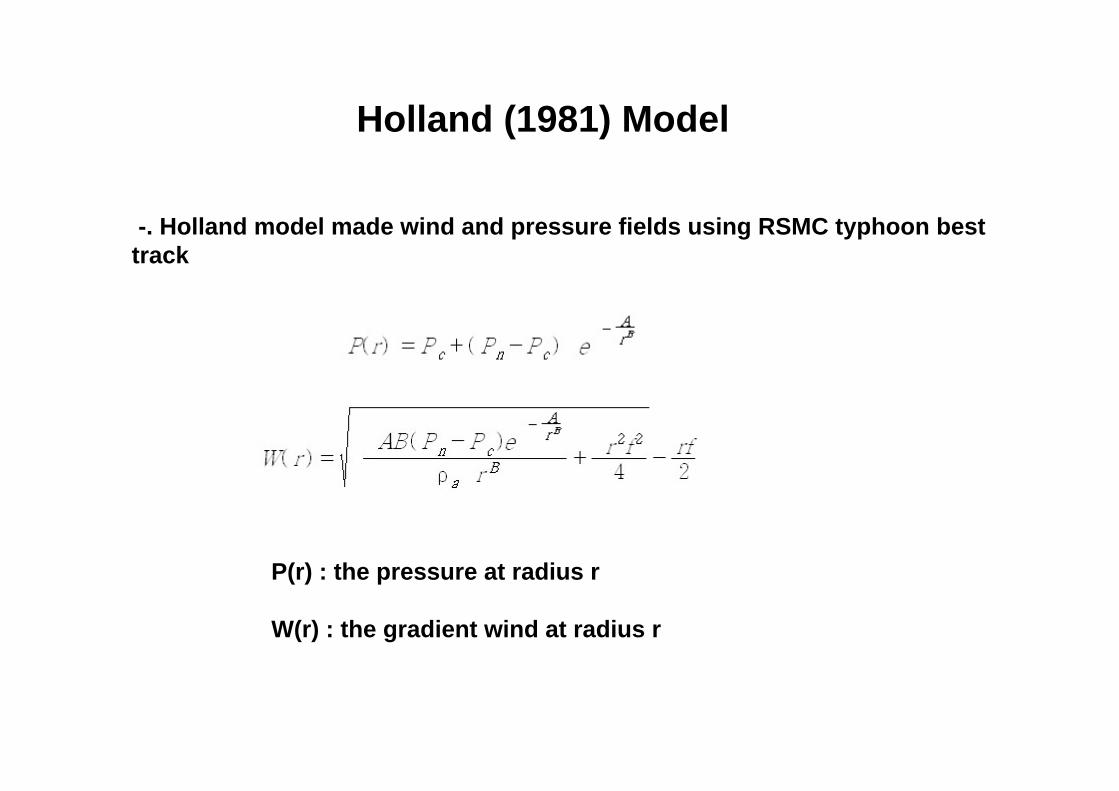
-. Holland model made wind and pressure fields using RSMC typhoon best track
P(r) : the pressure at radius r
W(r) : the gradient wind at radius r
Holland (1981) Model