Embed Size (px)
Citation preview
Changes in Transcript Abundance in Chlamydomonasreinhardtii following Nitrogen Deprivation PredictDiversion of Metabolism1[W][OA]
Rachel Miller2, Guangxi Wu2, Rahul R. Deshpande, Astrid Vieler, Katrin Gartner, Xiaobo Li,Eric R. Moellering, Simone Zauner, Adam J. Cornish, Bensheng Liu, Blair Bullard, Barbara B. Sears,Min-Hao Kuo, Eric L. Hegg, Yair Shachar-Hill, Shin-Han Shiu, and Christoph Benning*
Cell and Molecular Biology Program (R.M., G.W.), Department of Energy-Plant Research Laboratory(R.M., X.L., E.R.M.), Department of Plant Biology (R.R.D., X.L., B.B.S., Y.S.-H., S.-H.S.), and Department ofBiochemistry and Molecular Biology (A.V., K.G., E.R.M., S.Z., A.J.C., B.L., B.B., M.-H.K., E.L.H., C.B.),Michigan State University, East Lansing, Michigan 48824
Like many microalgae, Chlamydomonas reinhardtii forms lipid droplets rich in triacylglycerols when nutrient deprived. To beginstudying the mechanisms underlying this process, nitrogen (N) deprivation was used to induce triacylglycerol accumulationand changes in developmental programs such as gametogenesis. Comparative global analysis of transcripts under inducedand noninduced conditions was applied as a first approach to studying molecular changes that promote or accompanytriacylglycerol accumulation in cells encountering a new nutrient environment. Towards this goal, high-throughput sequenc-ing technology was employed to generate large numbers of expressed sequence tags of eight biologically independent libraries,four for each condition, N replete and N deprived, allowing a statistically sound comparison of expression levels under thetwo tested conditions. As expected, N deprivation activated a subset of control genes involved in gametogenesis while down-regulating protein biosynthesis. Genes for components of photosynthesis were also down-regulated, with the exception of thePSBS gene. N deprivation led to a marked redirection of metabolism: the primary carbon source, acetate, was no longerconverted to cell building blocks by the glyoxylate cycle and gluconeogenesis but funneled directly into fatty acid biosynthesis.Additional fatty acids may be produced by membrane remodeling, a process that is suggested by the changes observed intranscript abundance of putative lipase genes. Inferences on metabolism based on transcriptional analysis are indirect, butbiochemical experiments supported some of these deductions. The data provided here represent a rich source for theexploration of the mechanism of oil accumulation in microalgae.
The search for sustainable sources of biofuels has ledto renewed interest in microalgae as a potential feed-stock and, consequently, a flurry of research has re-cently been initiated in microalgae (Wijffels andBarbosa, 2010). Microalgae accumulate large quanti-ties of oils in the form of triacylglycerols (TAGs) whennutrient deprived, and a thorough analysis of theunderlying molecular mechanism is currently in itsinfancy (Hu et al., 2008). At this time, Chlamydomonas
reinhardtii is the premier microalgal molecular modelfor this analysis. As such, the formation of lipiddroplets following nitrogen (N) deprivation has re-cently been documented in detail (Wang et al., 2009;Moellering and Benning, 2010). Although C. reinhardtiiis not under direct consideration for the production ofbiomass as a biofuel feedstock, the analysis of itsmetabolism and physiology is expected to providebasic insights into mechanisms of TAG accumulationrelevant to other microalgae at least of the green algalphylum.
The genome of C. reinhardtii is available (Merchantet al., 2007), and its annotation is currently at version4 (http://genome.jgi-psf.org/chlamy/chlamy.home.html). At this time, a number of microarrays havebeen used to interrogate changes in response to envi-ronmental factors (Ledford et al., 2004, 2007; Jamerset al., 2006; Mus et al., 2007; Nguyen et al., 2008; Simonet al., 2008; Yamano et al., 2008; Mustroph et al., 2010).These microarrays could not cover all genes in thegenome, but more recently, massively parallel cDNAsequencing approaches were applied to C. reinhardtii,overcoming the shortcomings of microarrays (Gonzalez-Ballester et al., 2010). Likewise, we have chosen acDNA sequencing-based approach using 454 and
1 This work was supported by the U.S. Air Force Office ofScientific Research (grant no. FA9550–08–1–0165 to C.B.), by theU.S. National Science Foundation (grant nos. MCB–0749634 andMCB–0929100 to S.-H.S.), by a GermanAcademic Exchange Programpostdoctoral fellowship to S.Z., and by the Michigan State Agricul-tural Experiment Station.
2 These authors contributed equally to the article.* Corresponding author; e-mail [email protected] author responsible for distribution of materials integral to the
findings presented in this article in accordance with the policydescribed in the Instructions for Authors (www.plantphysiol.org) is:Christoph Benning ([email protected]).
[W] The online version of this article contains Web-only data.[OA] Open Access articles can be viewed online without a sub-
scription.www.plantphysiol.org/cgi/doi/10.1104/pp.110.165159
Plant Physiology�, December 2010, Vol. 154, pp. 1737–1752, www.plantphysiol.org � 2010 American Society of Plant Biologists 1737

Illumina technologies in parallel that allow the gener-ation of large numbers of ESTs of varying abundance,which can be counted to obtain a measure of geneexpression (Weber et al., 2007).
The goal of this study was to determine majorchanges in gene expression following N deprivation,the nutrient condition established in our previousanalysis of lipid droplet formation and TAG accu-mulation in C. reinhardtii (Moellering and Benning,2010). Comparison of the transcript levels of induced,N-deprived C. reinhardtii cultures with those of unin-duced, N-replete cultures was expected to reflect themetabolic changes leading to TAG accumulation. Ofcourse, making inferences about metabolism based ongene expression levels has its caveats, as gene expres-sion does not necessarily directly translate into meta-bolic fluxes. To interrogate the meaningfulness of someof the transcript-level changes we observedwith regardtometabolism, we also performed labeling experimentsusing acetate as the precursor. Acetate is a typical car-bon source provided to C. reinhardtii for photohetero-trophic growth enabling short doubling times, and it isreadily incorporated into fatty acids, the main constit-uents of TAGs. Keeping in mind that these are clearlyconditions optimized for an experimental laboratorysystem, we nevertheless expect to be able to makebasic inferences that will be relevant to a broaderunderstanding of the induction of TAG biosynthesisand lipid droplet accumulation in green algae.
RESULTS
Defining Conditions for N Deprivation of C. reinhardtii
Ideally, onewould like to use finely spaced time-courseexperiments to distinguish rapid versus long-termchanges in gene expression following N deprivation.However, because our resources were limited, wedecided to focus on two conditions, N replete and Ndeprived. Independent biological replicates allowedfor statistically sound interpretations of the data. Todetermine the time point for N deprivation most likelyto provide an accurate snapshot of readjustment oftranscript steady-state levels following N deprivation,we first used northern-blot hybridization to comparethe expression of genes known or expected to beregulated in C. reinhardtii following N deprivation.An ammonium transporter, AMT4, which has beenpreviously shown to be activated by N deprivation(Mamedov et al., 2005), and two putative diacylglyc-erol acyltransferases, tentatively designated DGTT2and DGTT3 (protein identifiers 184281 and 400751,genome version 4), were monitored to test the variousconditions. RNA was isolated from cells grown instandard (10 mM NH4
+) and low-N (0.5 mM NH4+) Tris-
acetate phosphate (TAP) medium to impose N depri-vation as well as from cells grown to mid-log phase instandard TAP medium, then transferred to eitherstandard or no-N (0 mM NH4
+) TAP, with samples
taken at 24 and 48 h, to accomplish more drastic N dep-rivation (Fig. 1A). For standardization, equal amountsof RNA were loaded and the 18S rRNA abundancewas examined. Although C. reinhardtii ribosomes turnover following N deprivation (Siersma and Chiang,1971; Martin et al., 1976), their abundance drops nolower than 50% (see below). AMT4 mRNAwas absentfrom the uninduced cells and present at a high level inN-limited or N-deprived cells under the conditionstested. DGTT2 mRNAwas present at low levels in allconditions. DGTT3 mRNA was present at low levelsand increased slightly following N deprivation. Ndeprivation for 48 h showed the greatest difference inRNA levels compared with the N-replete cultures.Based on this basic analysis and our previous time-course study of lipid droplet formation and TAGaccumulation (Moellering and Benning, 2010), a 48-hperiod of N deprivation was chosen to compare globaltranscript levels in N-replete and N-deprived cells.
Global Characteristics of C. reinhardtii Gene Expressionfollowing N Deprivation
To determine the differential expression of genes inC. reinhardtii under N-replete and N-deprived condi-tions, two sequencing approaches, 454 and Illumina,were applied. (The complete combined data set forboth experiments is provided in Supplemental Spread-sheet S1.) Read length is longer for 454, but the numberof reads per run is lower. As shown in Table I, 60- to 85-fold more sequence tags were generated with Illuminathan with 454 sequencing. Among the 454 reads, 78%to 80% mapped to the C. reinhardtii genome. For theIllumina data, wemapped in three different ways, withvarying stringency depending on whether 3#-end readquality and exon-spanning reads were considered.Without filtering reads, a substantially smaller propor-tion of Illumina reads (63%–68%) were mapped com-
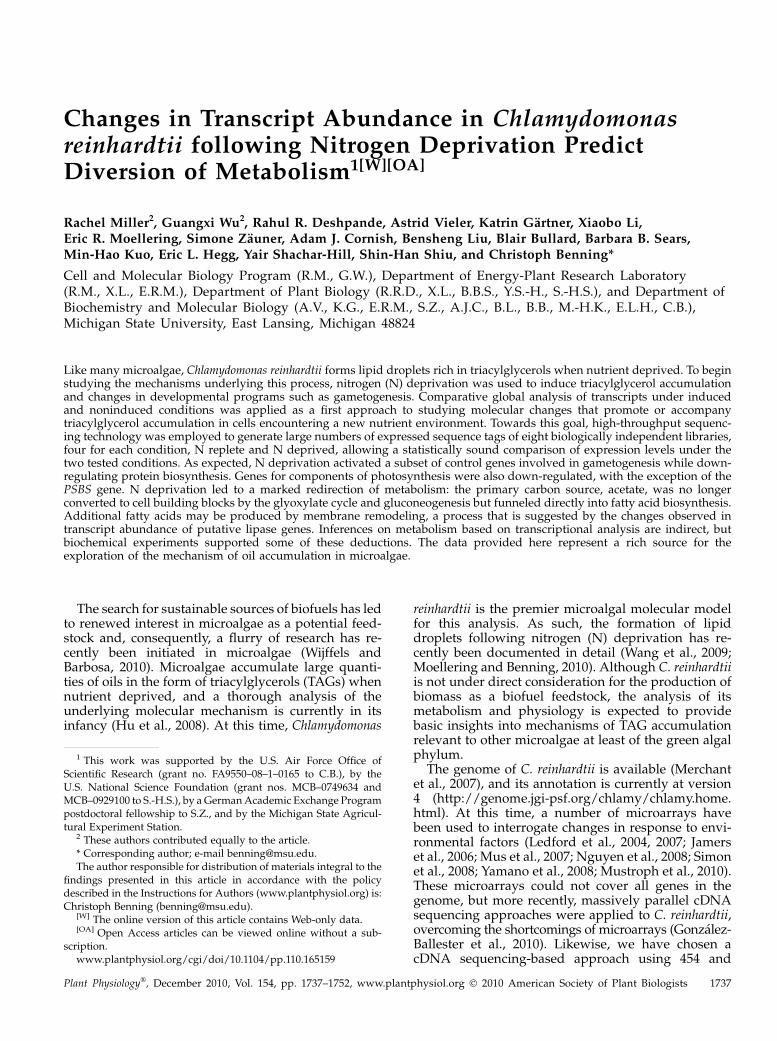
Figure 1. Transcript levels of specific genes. A, Cultures were grown inTAP medium that was N replete (10 mM NH4
+; 10), continual N limited(0.5 mM NH4
+; 0.5), or N deprived (0 mM NH4+; 0) for 24 or 48 h. The
expression levels of AMT4, DGTT2, and DGTT3 were measured byRNA-DNA hybridization, and rRNA was visualized as a loadingcontrol. B, Cultures were grown for 48 h in either N-replete orN-deprived conditions. The levels of PSBS1 and PSBS2 transcriptswere measured using RT-PCR, and the constitutive IDA5 gene served asa control.
Miller et al.
1738 Plant Physiol. Vol. 154, 2010

pared with 454 reads. Trimming low-quality 3# regionsof reads resulted in a further 2.7% decrease in thenumber of mapped reads. Despite the large number ofunmapped Illumina reads, out of 16,710 C. reinhardtiigene models, 15,505 (92%) had one or more reads. Incontrast, only 6,372 gene models (38.1%) were sup-ported by the 454 transcriptome data set. In addition,nearly all genes covered by 454 were also covered byIllumina. Therefore, our sequencing data covered mostannotated genes, enabling us to interrogate differentialexpression under normal conditions and following Ndeprivation. In addition, as expected, Illumina dataprovided a better coverage of the gene space than 454sequences.To determine differential gene expression follow-
ing N deprivation, we modeled count data with a
moderated negative binomial distribution (see “Ma-terials and Methods”). Using thresholds of 5% or lessfalse discovery rates and 2-fold or greater change forthe Illumina data set, 2,128 and 1,875 genes werecategorized as up- and down-regulated, respectively,following N deprivation. To see if fold changesinferred based on 454 and Illumina data sets wereconsistent, we determined the statistical correlationin fold change between these two data sets (Fig. 2)and found that it was rather weak (Pearson’s corre-lation coefficient, r2 = 0.10, P , 2.2 3 10216). Therewas an apparent anomaly, as 4,313 genes (out of6,369 genes with one or more reads from both datasets) had a high degree of up- and down-regulation,which was observed with the 454 but not the Illuminadata set (Fig. 2A). Most of these genes with extreme
Table I. Summary of expression tags generated using two different sequencing methods
Data TypeSequencing Methods
454 Illumina
Treatmenta N R N D T1 T2 T3 N1 N2 N3Totalb 2.51 3 10+05 2.15 3 10+05 1.69 3 10+07 1.83 3 10+07 1.78 3 10+07 1.77 3 10+07 1.79 3 10+07 1.52 3 10+07
Mappedc 2.01 3 10+05 1.68 3 10+05 1.09 3 10+07 1.24 3 10+07 1.15 3 10+07 1.07 3 10+07 1.13 3 10+07 9.86 3 10+06
Genicd 1.08 3 10+05 1.32 3 10+05 8.96 3 10+06 9.43 3 10+06 1.02 3 10+07 8.33 3 10+06 8.82 3 10+06 7.81 3 10+06
Intergenice 9.30 3 10+04 3.61 3 10+04 1.93 3 10+06 2.97 3 10+06 1.31 3 10+06 2.38 3 10+06 2.48 3 10+06 2.05 3 10+06
aTreatment types: N R, T1, T2, and T3 represent N-replete growth; N D, N1, N2, and N3 represent N-deprived growth. For Illumina, there arethree biologically independent replicates for each treatment (T1–T3 and N1–N3). bNumber of sequencing reads after filtering out low-qualityreads based on 454 and Illumina base-calling methods. cNumber of sequencing reads after mapping to the C. reinhardtii version 4.0genome. dNumber of mapped sequencing reads overlapping with C. reinhardtii version 4.0-filtered gene models. eNumber of mappedsequencing reads not overlapping with any C. reinhardtii version 4.0-filtered gene models
Figure 2. Fold change correlation between Illumina and 454 data sets and impacts of Illumina length bias on differentialexpression call. A, Only genes with one or more 454 and Illumina reads under either N-replete (+N) or N-deprived (2N)conditions were plotted. Fold change is determined by the number of reads following N deprivation divided by the number ofreads under N-replete conditions for each gene. For genes with 210-fold or greater or 2210-fold or lesser changes, the fold changevalues were set to 10. Blue circles (“high” 454 read genes) indicate genes with 10 or greater 454 reads (+N and –N combined)and one or more 454 reads in both +N and –N. Red circles (“low” 454 read genes) indicate genes that did not satisfy one or bothof the above criteria. B, Each box plot depicts the numbers of reads for protein-coding genes (log base 10) in a protein sequencesize bin (0–2,000 amino acids, bin size of 100 amino acids). All proteins of 2,000 or more amino acids are classified as 2,000amino acids. Outliers are shown in black circles. C, Percentage of genes that are regarded as differentially expressed (DE) in eachprotein sequence size bin. The line indicates the linear fit, and the equation for the line is shown as well.
Global Changes following N Deprivation in Chlamydomonas
Plant Physiol. Vol. 154, 2010 1739

responses based on 454 had very low counts (less than10 reads combined in both conditions or zero reads inone of the conditions; Fig. 2A, red data points). As aresult, high and likely inaccurate fold change valueswere assigned to those genes. In fact, if we onlyconsidered 2,056 genes with 10 or more reads com-bined and one or more reads in both conditions, thecorrelation between Illumina and 454 data was sub-stantially improved (r2 = 0.57, P , 2.2 3 10216; Fig. 2,blue data points).
One important consideration in identifying differ-entially regulated genes is that there is a considerabletranscript length bias in Illumina data. A longer tran-script tends to have more reads than a shorter tran-script expressed at the same level (Oshlack andWakefield, 2009; Bullard et al., 2010). Consistent withearlier findings, we observed a significant correlationbetween the number of reads assigned to a proteinsequence and its length (Spearman’s rank r = 0.33, P,2.2e-16; Fig. 2B). Because of this length bias, longertranscripts may have more significant differences indifferential gene expression studies and in some caseswill lead to false-positive differential expression calls(Oshlack and Wakefield, 2009; Bullard et al., 2010).However, unlike previously published studies, we didnot find a significant correlation between the percent-age of genes differentially expressed and sequence
length (r = 0.09, P = 0.7; Fig. 2C). This finding indicatesthat, although length bias remains an issue, our dif-ferential expression call may not be as significantlyaffected as reported previously.
Approximately 7% to 14% of the Illumina readsmapped to the “intergenic regions” (Table I). Weassembled Illumina reads into 42,574 transcribed frag-ments (transfrags). Among them, 17,095 transfrags didnot map with, or within the vicinity of (1,855 bases,99th percentile intron length), current gene models.With the same conservative criterion, transfrags werejoined into 1,828 “intergenic transcriptional units.”Most importantly, 287 of these intergenic transcrip-tional units were up-regulated and 176 were down-regulated following N deprivation. These transfragsare unannotated genes that require further analysis toestablish their authenticity.
Gene Ontology (GO) annotation was used tocoarsely identify major categories of genes involvedin particular biological processes to assess trends intheir transcriptional regulation following N depriva-tion. We foundmultiple GO categories with significantenrichment in their numbers of differentially regu-lated genes (Table II). Particularly, genes associatedwith lipid metabolism tend to be up-regulated, whilethose involved in photosynthesis and DNA replicationinitiation tend to be down-regulated.
Table II. GO categories significantly enriched in differentially regulated C. reinhardtii genes
GO Annotation GO Ra No GO Rb GO Uc No GO Ud Rege P f q g
GO:0006270 bph DNA replication initiation 9 926 0 6,633 Down 6.48 3 10209 4.51 3 10206
GO:0015995 bp Chlorophyll biosynthetic process 8 927 0 6,633 Down 5.29 3 10208 2.76 3 10205
GO:0033014 bp Tetrapyrrole biosynthetic process 6 929 0 6,633 Down 3.51 3 10206 7.32 3 10204
GO:0009765 bp Photosynthesis, light harvesting 22 913 14 6,619 Down 5.72 3 10212 5.98 3 10209
GO:0015979 bp Photosynthesis 23 912 0 6,633 Down 1.02 3 10221 2.13 3 10218
GO:0005576 cci Extracellular region 11 924 14 6,619 Down 8.28 3 10205 1.44 3 10202
GO:0009522 cc PSI 4 931 0 6,633 Down 2.32 3 10204 3.23 3 10202
GO:0009538 cc PSI reaction center 5 930 0 6,633 Down 2.85 3 10205 5.42 3 10203
GO:0009654 cc Oxygen-evolving complex 6 929 0 6,633 Down 3.51 3 10206 7.32 3 10204
GO:0019898 cc Extrinsic to membrane 4 931 0 6,633 Down 2.32 3 10204 3.23 3 10202
GO:0003755 mfj Peptidyl-prolyl cis-trans-isomeraseactivity
21 914 32 6,601 Down 4.39 3 10207 1.83 3 10204
GO:0004600 mf Cyclophilin 19 916 30 6,603 Down 2.29 3 10206 5.98 3 10204
GO:0016851 mf Magnesium chelatase activity 4 931 0 6,633 Down 2.32 3 10204 3.23 3 10202
GO:0030051 mf FK506-sensitive peptidyl-prolylcis-trans-isomerase
19 916 30 6,603 Down 2.29 3 10206 5.98 3 10204
GO:0042027 mf Cyclophilin-type peptidyl-prolylcis-trans-isomerase activity
19 916 30 6,603 Down 2.29 3 10206 5.98 3 10204
GO:0006006 bp Glc metabolic process 5 944 1 6,618 Up 1.65 3 10204 3.83 3 10202
GO:0006468 bp Protein amino acidphosphorylation
117 832 501 6,118 Up 2.37 3 10206 2.47 3 10203
GO:0006629 bp Lipid metabolic process 18 931 38 6,581 Up 9.92 3 10205 2.59 3 10202
GO:0004672 mf Protein kinase activity 113 836 479 6,140 Up 2.08 3 10206 2.47 3 10203
GO:0004713 mf Protein-Tyr kinase activity 85 864 342 6,277 Up 8.04 3 10206 4.20 3 10203
GO:0004674 mf Protein Ser/Thr kinase activity 92 857 391 6,228 Up 2.50 3 10205 7.46 3 10203
aGO R, Number of significantly up- or down-regulated (R) genes with the GO annotation in question. bNo GO R, Number of significantly up-or down-regulated genes without the GO annotation. cGO U, Number of genes without significant expression change with the GOannotation. dNo GO U, Number of genes with no significant expression change that do not have the GO annotation. eReg, Direction ofregulation (N deprived compared with N replete). fFisher’s exact test P value. gThe q value is calculated using the R package q value. hbp,Biological process. icc, Cellular component. jmf, Molecular function.
Miller et al.
1740 Plant Physiol. Vol. 154, 2010

Induction of Gametogenesis and Sexual Reproduction
Because N deprivation triggers gametogenesis(Martin and Goodenough, 1975; Kurvari et al., 1998),we examined several genes known to be involved inmating-type plus (mt+) gamete differentiation or sex-ual fusion in C. reinhardtii as internal controls for theinduction state of the cells following N deprivation(Supplemental Table S1). Following N deprivation,cells had substantial increases in the abundance oftranscripts of four of the six genes considered. Thesegenes encode FUS1, which is a glycoprotein requiredfor sex recognition, SAG1 (the mt+ agglutinin gene),peptidase M gametolysin, which releases the gametesfrom the cell wall, and NSG13, which is a protein ofunidentified function known to be expressed in gam-etes, as summarized by Harris (2009b). A secondgametolysin gene (encoding peptidase M11) and GSP1,which encodes a gamete-specific transcription factor,did not show increased expression following N dep-rivation, but perhaps that is because only a single timepoint was examined.
Effects on Genes of N Metabolism and
Protein Biosynthesis
Many genes involved in N import and assimilationare known to be induced following N deprivation(Schnell and Lefebvre, 1993; Gonzalez-Ballester et al.,2004; Fernandez et al., 2009). Our analysis revealedgreater than 2-fold up-regulation for several genes,including those that encode NO3
2 and NO22 trans-
porters and reductases, as well as transport systemsfor NH4
+ and organic N sources (Supplemental TableS2). Of the genes involved in assimilation of NH4
+ bythe Gln synthetase-Glu synthase cycle, only GLN3wasup-regulated. Similarly, most genes involved in aminoacid biosynthesis did not show a greater than 2-foldchange. Thus, transcript abundance suggests that fol-lowing N deprivation, pathways for the acquisition ofnew N sources are strongly up-regulated, whereasbiosynthetic pathways that utilize the assimilated Nremain relatively unaffected.Decades ago, N deprivation of C. reinhardtii was
found to result in degradation and resynthesis of bothcytoplasmic and chloroplast ribosomes (Siersma andChiang, 1971; Martin et al., 1976). Both the rRNA andproteins of the ribosomes were turned over under theconditions of N deprivation that also induce gametedifferentiation. Hence, we expected that the mRNAsfor the ribosomal proteins might show differentsteady-state levels in the comparison of logarithmi-cally growing cells and cells that have been N de-prived for 48 h. Indeed, following N deprivation, theabundance of transcripts encoding proteins of thechloroplast ribosomes consistently decreased to 30%to 50% of their levels of expression in logarithmicallygrowing cells (Supplemental Table S3).A subset of the cytosolic 80S ribosomal protein
genes has been identified in the version 4.0 genome
data set. Among those that have been annotated, mostare encoded by single-copy genes (Supplemental TableS4), although a few have two copies (e.g. L7, L10, L13,and L23). As these gene products are assembled intoribosomes, the respective genes have high levels ofconstitutive expression. The abundance of the tran-scripts in vegetative cells and N-deprived cells wasfairly similar, although they are listed in the tablestarting with those that have the most elevated ex-pression in the latter.
The RPL22 ribosomal protein of the cytosolic ribo-somes is encoded by amultigene family in C. reinhardtii.Of the 37 RPL22 genes in version 4.0 of the genome dataset, 13 appeared not to be expressed under eithercondition tested and six had barely detectable levelsof transcripts. Of the 18 remaining genes, two gave riseto the most predominant transcripts (SupplementalTable S5, yellow highlighting), and their transcriptsdid not change markedly in abundance. Four of the18 genes were moderately expressed, and their tran-script levels doubled in the N-deprived cells (Supple-mental Table S5, light blue highlighting). Six of the18 genes had markedly lower levels of transcriptsfollowing N deprivation (Supplemental Table S5, lightgreen highlighting), while six others showed relativelyconstant levels of expression (Supplemental Table S5,medium blue highlighting). The RPL22 genes arescattered among at least six chromosomes, and nocorrelation was found between location and level ofgene expression.
General Changes in Primary Metabolism
Changes in transcript abundance of genes encodingenzymes of primarymetabolism are depicted in Figure3 and summarized in Supplemental Table S6. Tran-scripts encoding key enzymes of the glyoxylate cycle,gluconeogenesis, and the photosynthetic carbon fixa-tion cycle markedly decrease following N deprivation.Transcript abundance for the glyoxylate cycle enzymesisocitrate lyase and malate synthase decreased morethan 16-fold. In addition, mRNA abundance of thecytosolic (predicted) phosphoenolpyruvate carboxy-kinase, which catalyzes the committed reaction ofgluconeogenesis, dropped to 25% of the levels inN-replete cells, as did transcripts encoding enzymesinvolved in carbon fixation and reduction, ribulose-bisphosphate carboxylase, sedoheptulose 1,7-bisphos-phate aldolase, and sedoheptulose-bisphosphatase. Incontrast, there was a considerable increase in thetranscript abundance of the cytosolic enzyme pyru-vate phosphate dikinase. This is a key enzyme in theC4 photosynthetic pathway and is regulated by light.It has also been associated with suppressed phospho-enolpyruvate carboxykinase activity (Osteras et al.,1997) and salt stress (Fisslthaler et al., 1995). Recently,this enzyme has been shown to play an important rolein N remobilization (Taylor et al., 2010). Likewise, thetranscript abundances for enzymes of the pentosephosphate cycle predicted to be localized in the cyto-
Global Changes following N Deprivation in Chlamydomonas
Plant Physiol. Vol. 154, 2010 1741

sol, Glc-6-P 1-dehydrogenase and phosphogluconatedehydrogenase (decarboxylating), were increased un-der those conditions. The mRNA encoding for one ofthe pyruvate decarboxylase subunits represented inthe data set was also increased in abundance followingN deprivation. The pyruvate decarboxylase complexconverts pyruvate to acetyl-CoA, which is a precursorof fatty acid biosynthesis. Genes for other enzymes ofthe glycolytic pathway, such as pyruvate kinase, didnot show very drastic changes in response to the Ndeprivation.
To verify whether the changes observed in RNAabundance actually reflect changes in the activity ofglyoxylate and gluconeogenic pathways, cells weregrown in the presence of [U-13C]acetate. As the cellstake up acetate as a carbon source, the distribution ofthe 13C in the cellular metabolites gives an insight intothe activity of the pathways leading to them. Theintracellular amino acids as well as the sugar units ofthe carbohydrates and RNAs were analyzed with gas
chromatography-mass spectrometry (GC-MS) as de-scribed in “Materials and Methods” (Fig. 4). Thenatural abundance refers to the naturally occurringdistribution of 13C in the molecule. The mass iso-topomers M0, M1, M2, etc. refer to molecules having,respectively, zero, one, two, etc. atoms of 13C.
Cells grown in N-replete medium showed a higherdegree of labeling in Ser and Gly than did N-deprivedcells (Fig. 4). The fully labeled fraction (M3) accountedfor almost 80% of the total Ser in the cells grown inN-replete medium. Hence, most of the Ser was derivedfrom the gluconeogenic pathway, which incorporatesthe labeling of acetate into the glycolytic intermediate3-phosphoglycerate, a precursor of Ser. There was alsoabout 10% of M2 Ser. This probably derived from thereaction catalyzed by the reversible Ser hydroxyl-methyltransferase, which favors the production ofSer from Gly (Mattingly et al., 1976). The Gly in thisreaction would mostly be fully labeled (M2; Fig. 4),largely from the glyoxylate cycle, hence giving rise to
Figure 3. Regulation of genes involvedin primary metabolism. The figureindicates the central metabolic path-ways of C. reinhardtii and gives the dif-ferential regulation of gene expressionfollowing N deprivation. Symbols rep-resent log2 fold change as follows:+++, greater than 5; ++, greater than2 and less than 5; +, greater than 1; 6,less than 1 and greater than21;2, lessthan21;22, less than22 and greaterthan 25; 222, less than 25.
Miller et al.
1742 Plant Physiol. Vol. 154, 2010

M2 Ser. In cells grown in N-deprived medium, weobserved a markedly lower incorporation of the 13Catoms into the amino acids. Almost 80% of Gly wasunlabeled (M0), indicating a very low activity of theglyoxylate cycle. Similarly, N-deprived cells had re-duced label in carbohydrates and Rib. Since thesemolecules were formed essentially by the gluconeo-genic pathway during growth in the medium em-ployed, the N-deprived cells appeared to have muchlower gluconeogenic activity. Thus, these biochemicaldata corroborated the transcript abundance data (Fig.3) that suggested a down-regulation of the glyoxylateand gluconeogenic pathways in N-deprived cells.No appreciable change in transcripts for genes en-
coding components of the mitochondrial respiratorypathway was noted following N deprivation. How-ever, an 11-fold increase in the transcript abundance ofan alternative oxidase gene (AOX1) was observed,while the AOX2 transcript was down-regulated 4-fold.These findings were consistent with previous obser-vations of changes in gene expression of AOX1 andAOX2 (Baurain et al., 2003).The candidate genes for peroxisomal b-oxidation
showed an overall decrease in their transcript levelsfollowing N deprivation, with acyl-CoA oxidase and3-oxoacyl-CoA thiolase (ATO1) transcript abundancedecreasing most drastically (greater than 3-fold). Theonly exception was an enoyl-CoA oxidase/isomerasecandidate gene (ECH1), which showed increased tran-script levels (greater than 2-fold; Supplemental TableS8). An apparent down-regulation of fatty acid oxida-tion is in line with the accumulation of TAGs underthese conditions.
Reduced Transcript Abundance for Most
Photosynthetic Genes
In C. reinhardtii, photosynthetic efficiency decreasesfollowing N deprivation, at least partially due to areduction in the abundance of light-harvesting com-plexes (Plumley and Schmidt, 1989; Peltier andSchmidt, 1991) and selective degradation of the cyto-chrome b6f complex (Bulte and Wollman, 1992; Majeranet al., 2000). Likewise, the abundance of transcriptsencoding photosynthesis-related proteins was substan-tially reduced following N deprivation. This regulationwas not restricted to light-harvesting complexes andcytochromes but extended to the two photosystems aswell (Supplemental Table S7). Following N deprivation,the steady-state level of all nucleus-encoded PSI genesdecreased by at least 6-fold, while the abundance oftranscripts from genes encoding the correspondinglight-harvesting proteins was decreased even fur-ther, resulting in a 19- to 43-fold decrease relative toN-replete conditions. Only four of the cytochrome sub-units are encoded by the nuclear genome, and three ofthem showed a considerable down-regulation (6-fold)following N deprivation. In contrast, the transcriptlevels of PETO were weakly increased (2-fold). Thisobservation supports the hypothesis that this proteinmay have a regulatory role as opposed to being afunctional cytochrome b6f subunit (Hamel et al., 2000),because the PETO protein is only loosely bound to thecomplex and its function is not required for the oxi-doreductase activity. Expression of all nuclear genesencoding PSII components also decreased following Ndeprivation (Supplemental Table S7), although the two
Figure 4. Changes in labeling patterns reflect-ing changes in gene expression. Labeling ofmetabolites after 24 h of N deprivation com-pared with N-replete cells is shown. Themetabolites give an indication of the pathwayactivity. Intracellular Ser and Gly were extractedby quick quenching and extraction with coldmethanol. Rib and Glc were obtained fromthe acid hydrolysis of RNA and cellular poly-saccharides, respectively. The labeling wasanalyzed by GC-MS after derivatization. Nat-ural labeling refers to the naturally occurringdistribution of 13C in the molecule. The massisotopomers M0, M1, M2, etc. refer to mole-cules having, respectively, zero, one, two, etc.atoms of 13C. White bars, Natural labeling;fine cross-hatched bars, N-replete cells;coarse cross-hatched bars, N-deprived cells.
Global Changes following N Deprivation in Chlamydomonas
Plant Physiol. Vol. 154, 2010 1743

least abundant transcripts decreased only slightly. ThePSII light-harvesting complex encoding transcriptsshowed a comparable change in abundance. Most ofthe transcript levels were reduced, while the weaklyexpressed LHCB7 gene showed no alteration in tran-script levels.
The only two genes of the light-harvesting complexof PSII not following that pattern were PSBS1 andPSBS2. Their transcript levels were strongly increasedfollowing N deprivation (119- and 52-fold, respec-tively). This result was confirmed by reverse tran-scription (RT)-PCR (Fig. 1B).
Specific Changes in Gene Expression Related to General
Lipid Metabolism
N deprivation has been demonstrated to lead to theaccumulation of TAG in specialized organelles as wellas to structural changes and breakdown of the intra-cellular membrane systems such as the thylakoids andthe endoplasmic reticulum (ER; Martin et al., 1976;Moellering and Benning, 2010). Therefore, we ex-pected this to be reflected in the expression of genesencoding enzymes of lipid metabolic pathways. How-ever, changes in transcript levels of genes encodingfatty acid metabolism (Supplemental Table S8) weremodest (Fig. 5). A 2-fold increase in transcript levelsfor ketoacyl-acyl carrier protein (ACP) synthetase wasobserved. This enzyme is part of the fatty acid syn-thase II complex that catalyzes the acyl-ACP-depen-dent elongation steps from C4 to C14 in higher plants.The gene for acyl-ACP thioesterase (FAT1) alsoshowed elevated transcript levels following N depri-vation (about 4-fold). Its reaction terminates fatty acidsynthesis by cleaving the acyl chain from ACP. Thisreaction competes with the direct transacylation ofACP by glycerol-3-phosphate acyltransferases for theformation of phosphatidate. An increase in FAT1 ac-tivity, therefore, could be indicative of increased fattyacid export from the chloroplast to the ER, where TAGassembly occurs, as acyl-ACPs have to be hydrolyzedprior to export (Pollard and Ohlrogge, 1999).
A strong increase in transcript levels was observedfor the gene encoding the committing step of TAGsynthesis. Out of the five putative diacylglycerol acyl-transferases genes identified in the version 4.0 genomedata set, only four were expressed under either or bothgrowth conditions (Supplemental Table S8). One ofthese genes (DGTT1, PID 285889) was almost com-pletely suppressed under N-replete conditions butshowed a large increase in transcript abundance fol-lowing N deprivation. However, its overall transcriptabundance was too low to be detected by northernblot compared with other genes encoding putativediacylglycerol acyltransferases, which were much lessdifferentially expressed, consistent with the initialRNA-DNA hybridization analysis (Fig. 1A).
Phosphatidic acid phosphatase takes part in theKennedy pathway of glycerolipid and TAG synthesis(Fig. 5). Both of the two candidate genes for phospha-
tidic acid phosphatase in C. reinhardtii annotated in theversion 4.0 data set showed increased transcript levelsfollowing N deprivation. Both are part of the PAP2family, which is thought to have a broad substratespecificity (Carman andHan, 2006). The increase in theexpression of the presumed phosphatidic acid phos-phatase genes is consistent with the notion that DAG isgenerated from phosphatidic acid for further TAGbiosynthesis following N deprivation.
Out of a total of 16 putative membrane-bounddesaturase- and hydroxylase-encoding genes foundin C. reinhardtii, only three showed a change in tran-script abundance that is greater than 2-fold. Transcriptabundance for microsomal D12-desaturase was morethan 3-fold higher following N deprivation, as wasthat for the plastidic acyl-ACP-D9-desaturase, whichintroduces the first double bond in an acyl chain.Other microsomal desaturase-encoding transcripts,such as that encoding FAD13, an v13/D5-desaturase,were also slightly increased in abundance, whereas theplastid desaturase-encoding genes were not affected.
Of all lipid-related genes, those encoding putativelipases showed the strongest differences in transcript
Figure 5. Selected changes in glycerolipid metabolism transcriptabundance. Numbers indicate log2 fold change of transcript abundancefollowing N deprivation. Enzymes labeled with an asterisk cannot beunequivocally assigned to a specific step in the metabolic pathway andare hypothetical.
Miller et al.
1744 Plant Physiol. Vol. 154, 2010

abundance between the two conditions tested. Bysearching for “lipase,” “phospholipase,” or “patatin”through the version 4.0 genome sequence data, 130proteins containing the GXSXG motif common tohydrolases were identified. Among the respectivegenes, 35 (27%) showed increased and 11 (8.5%)showed decreased transcript levels by 2-fold or morefollowing N deprivation. Supplemental Table S8 liststhese 46 most strongly differentially regulated lipasecandidates. In addition, many potential lipases may beconsidered constitutively expressed. Seventy-four outof 130 (57%) lipase candidates were expressed atslightly higher levels following N deprivation. Someof these genes may encode lipases that are importantfor the turnover or replacement of membranes duringcell growth or gamete fusion.
Changes in RNA Abundance for Transcription Factors
The Plant Transcription Factor Database (Perez-Rodrıguez et al., 2010) was used to identify 386 genesencoding putative transcription factors and transcrip-tional regulators in the C. reinhardtii transcript data set,which could be sorted into 53 families (Table III). Ofthe 368 genes, 83 showed a 2-fold or greater change intranscript abundance following N deprivation, with 46being up-regulated and 37 being down-regulated.To date, only a few of the putative transcription
factors identified in the C. reinhardtii genome have aknown function. Transcript abundance for the geneencoding NIT2, a transcription factor regulating nitratemetabolism, was increased 6-fold, while that for NAB1,a transcription factor regulating light-harvesting pro-teins, was decreased 16-fold, consistent with previouslydescribed physiological changes in response to N dep-rivation (Mussgnug et al., 2005; Camargo et al., 2007).The transcript level for the GSP1 mt+ gamete-specifictranscription factor was decreased 3-fold at the 48-hsample point. When looking at the changes in RNAabundance of putative transcription factor genes, noobvious trends emerged. However, transcripts fallinginto the AP2-EREBP and bHLH families were generallymore abundant following N deprivation, while those ofthe FHA family were generally decreased.
DISCUSSION
Microalgae such as C. reinhardtii undergo drasticchanges in metabolism and ultimately developmentwhenN deprived. Some of themost remarkable changesinvolve gametogenesis (Harris, 2009b) and metabolicchanges that lead to the accumulation of TAGs (Hu et al.,2008). The former aspect has been studied since the1970s. However, focus on the latter has been largelymotivated by the renewed interest in microalgae asbiofuel feedstocks (Wijffels and Barbosa, 2010). As se-quencing technology has become increasingly fast andaffordable, comparison of transcriptomic changes un-der different experimental conditions by massive par-
allel sequencing of cDNA libraries is a viable firstapproach toward identifying genes that define changesin response to N deprivation or other nutrient stresses(Gonzalez-Ballester et al., 2010). With the goal of gain-ing a better understanding of the factors underlying oreven controlling the process of TAG accumulationfollowing N deprivation, the focus has to be on metab-olism and genes that encode enzymes of relevantpathways or regulatory factors.
The validity of making inferences on metabolismfrom transcriptome data in this study has been verifiedin different ways. First, specific genes known to beinduced following N deprivation, such as genes in-volved in gametogenesis or ammonium transport,were found to be expressed as described previously.Second, major metabolic changes predicted by tran-script analysis, such as the redirection of acetate fromthe glyoxylate cycle and gluconeogenesis to fatty acidbiosyntheses following N deprivation (Fig. 3), werecorroborated by labeling experiments (Fig. 4).
By and large, gross changes in transcript abundancein response to N deprivation follow expected themes:genes encoding enzymes directly involved in N me-tabolism or N compound uptake have to be induced,protein biosynthesis is reduced to adjust to the de-creased availability of amino acids, and photosyn-thesis is down-regulated to adjust to the alteredmetabolic state of the cell. In cyanobacteria, N dep-rivation led to the degradation of the highly abun-dant phycobili light-harvesting proteins so that theycould be used as an N source for protein synthesis(Collier and Grossman, 1992). In C. reinhardtii, thereis evidence that the cytochrome subunits are de-graded not in response to the low concentrations of Nper se but rather to the changed energy content of thecell. Thus, one possible advantage for the cells todecrease photosynthesis following N deprivation isto prevent the accumulation of reactive oxygen spe-cies (Bulte and Wollman, 1992). At the same time,genes encoding proteins of the respiratory chain inmitochondria were only moderately affected follow-ing N deprivation except for those encoding alterna-tive oxidases, which showed elevated transcriptabundance. These enzymes are induced under anumber of stress conditions that affect the redoxenvironment of the cell, but these effects can be quiteindirect and are often difficult to causally connect tothe applied stress, in this case N deprivation. Itshould also be pointed out here that only the expres-sion of nuclear genes is probed in this study; theexpression levels of genes for organelle-encodedproteins relevant to respiration or photosynthesishave not been examined.
A Role for PSBS following N Deprivation?
One particular surprise was the strong up-regulationof PSBS following N deprivation in C. reinhardtii. InArabidopsis (Arabidopsis thaliana), PSBS has beenshown to play a critical role in nonphotochemical
Global Changes following N Deprivation in Chlamydomonas
Plant Physiol. Vol. 154, 2010 1745

Table III. Illumina analysis of transcripts encoding transcription factors and regulators following N deprivation
PIDa Annotationb TIDa T +Nc T 2Nc Log2FCd FDRe
Transcription factors115124 SBP 115124 3 0 226.5 4.2 3 10201
425069 CPP 399885 332 5 25.9 5.1 3 10223
126810 NAB1, involved in thelight-regulated differentialexpression of thelight-harvesting antenna, CSD
126810 23,357 1,253 24.1 3.5 3 10236
119948 MYB-related 119948 50 3 24.0 1.5 3 10207
191829 FHA 191829 221 15 23.8 1.2 3 10214
147364 CCAAT 147364 119 9 23.6 4.7 3 10210
290169 bZIP 290176 10,444 895 23.4 6.9 3 10228
154254 FHA 154254 302 26 23.4 9.0 3 10212
119194 MYB-related 119194 11 1 23.4 3.1 3 10202
285394 FHA 285401 2,150 207 23.3 4.3 3 10223
426624 bZIP 397080 10,907 1,271 23.0 2.1 3 10221
119283 MYB-related 119283 96 12 22.9 1.9 3 10208
194555 C3H 194555 1,764 336 22.3 2.9 3 10209
415440 VARL 411514 843 162 22.3 6.2 3 10211
417527 C2C2-GATA 413714 103 23 22.1 1.1 3 10205
96716 SBP 96716 12 3 21.9 8.4 3 10202
426728 MYB-related 399133 22 6 21.8 3.3 3 10202
186803 GSP1; gamete-specifictranscription factor, HB
186803 980 289 21.7 1.3 3 10204
423729 FHA 397389 391 114 21.7 1.4 3 10205
112237 MYB 112237 502 155 21.6 3.5 3 10206
407701 S1Fa-like 425995 363 120 21.5 2.0 3 10204
104804 CPP 104804 29 10 21.4 3.8 3 10202
285882 bZIP 285889 1,004 367 21.3 2.0 3 10204
149734 C2H2 149734 6,593 2,748 21.2 1.2 3 10203
171165 TIG 171165 16,705 7,723 21.0 1.8 3 10203
415443 bHLH 409330 181 332 1.0 7.9 3 10203
393055 bZIP 421105 21 39 1.0 1.0 3 10201
393622 bHLH 420168 317 593 1.0 6.7 3 10203
399062 HSF 422722 1,776 3,323 1.0 1.8 3 10203
186995 RWP-RK 186995 3,085 5,907 1.0 7.9 3 10204
416794 AP2-EREBP 410803 313 612 1.1 2.4 3 10203
426843 PLATZ 397100 80 158 1.1 6.8 3 10203
298349 MYB-related 298356 451 912 1.1 2.8 3 10203
205561 MYB-related 205566 5,271 11,132 1.1 1.4 3 10202
147286 bZIP 147286 906 1,889 1.2 2.8 3 10204
419111 C3H 412152 329 704 1.2 3.5 3 10204
342954 MYB-related 342961 757 1,636 1.2 2.2 3 10204
130971 G2-like 130971 300 680 1.3 3.5 3 10204
417388 MYB-related 413124 1,291 2,917 1.3 1.5 3 10204
187531 bZIP 187531 803 1,897 1.3 2.2 3 10204
189471 CCAAT 189471 79 189 1.4 3.8 3 10204
196473 G2-like 196473 551 1,349 1.4 1.1 3 10205
415966 MYB-related 409909 4 10 1.4 2.7 3 10201
321493 TAZ 321500 9,879 25,105 1.4 5.9 3 10204
205919 AP2-EREBP 205924 23 61 1.5 4.1 3 10203
347478 None 347485 931 2,593 1.6 1.8 3 10205
205871 C2C2-GATA 205876 1,867 5,390 1.6 3.7 3 10207
19751 AP2-EREBP 19751 297 925 1.7 1.1 3 10206
183777 bHLH 183777 6,895 21,726 1.8 1.3 3 10208
290479 SBP 290486 189 616 1.8 1.8 3 10207
195916 RWP-RK 195916 11 36 1.8 6.8 3 10203
284832 MYB-related 284839 142 532 2.0 6.3 3 10209
148404 AP2-EREBP 148404 1,324 5,634 2.2 1.4 3 10210
414856 SBP 411130 1,520 6,689 2.2 2.8 3 10212
146990 VARL 146990 14 61 2.2 3.8 3 10205
(Table continues on following page.)
Miller et al.
1746 Plant Physiol. Vol. 154, 2010

quenching (Li et al., 2000, 2002), but previous studies inC. reinhardtii have not detected either of the two PSBSproteins in the thylakoids, and nonphotochemicalquenching was shown to be independent of theseproteins (Bonente et al., 2008). Only rarely have ESTsbeen found for PSBS transcripts, with the exception ofthe cDNA stress collection II, which contains RNAsfrom different stress treatments, including the switchfrom ammonium to nitrate (Shrager et al., 2003; Bonenteet al., 2008). Our results indicate that PSBS expression inC. reinhardtii is induced by ammonium deprivation, aswas observed previously for the expression of the genefor alternative oxidase, AOX1 (Baurain et al., 2003).
Recycling of Membrane Lipids or de Novo Synthesisof TAGs?
The elevation of synthesis and export of fatty acidsfrom the chloroplast following N deprivation could
indicate that TAG is assembled from fatty acids thatare synthesized de novo. This step would require theactivation of the fatty acids by a long-chain acyl-CoAsynthetase. In fact, increased abundance of RNA en-coding a putative long-chain acyl-CoA synthetase wasobserved, and the respective protein has been identi-fied in the lipid droplet proteome (Moellering andBenning, 2010). However, another enzyme that couldcontribute to the changing spectrum of fatty acids is aputative phospholipid/glycerol acyltransferase, forwhich the transcript level decreased during N depri-vation. Long-chain acyl-CoA synthetases are likely toplay a key role in determining the fate of fatty acids inthe cell (Shockey et al., 2002). Regulation of the re-spective genes could be a major factor in controllingthe flux of fatty acids toward glycerolipid synthesisand their degradation by b-oxidation.
Table III. (Continued from previous page.)
PIDa Annotationb TIDa T +Nc T 2Nc Log2FCd FDRe
205642 NIT2, nitrate-regulatedtranscription factor
205647 1,366 7,924 2.6 7.5 3 10218
117291 MYB 117291 117 740 2.8 1.1 3 10213
195838 RWP-RK 195838 108 718 2.8 3.4 3 10216
116658 MYB-related 116658 56 452 3.1 2.9 3 10216
153934 bHLH 153934 82 705 3.2 2.5 3 10219
195891 RWP-RK 195891 404 3,825 3.3 8.9 3 10225
424240 C3H 397539 19 273 3.9 8.7 3 10219
118761 SBP 118761 1 42 5.5 2.4 3 10208
405949 bHLH 390447 10 1,821 7.6 4.3 3 10262
177225 bHLH 177225 7 1,666 8.0 1.2 3 10262
Transcriptional regulators206670 SNF2 206677 106 7 23.8 3.3 3 10209
143060 PHD 143060 332 24 23.7 2.1 3 10215
401818 PHD 417802 7 2 21.7 3.5 3 10201
325701 TRAF 325708 3,740 1,118 21.6 3.2 3 10207
146398 TRAF 146398 372 113 21.6 5.6 3 10206
169174 SNF2 169174 209 67 21.5 8.1 3 10205
287740 PHD 287747 3 1 21.5 7.9 3 10201
377090 GNAT 377097 821 290 21.4 3.9 3 10204
151030 TRAF 151030 406 156 21.3 4.1 3 10204
142283 HMG 142283 11,647 4,587 21.2 1.7 3 10203
142152 GNAT 142152 189 80 21.1 4.7 3 10203
172711 SET 172711 549 233 21.1 3.5 3 10203
115484 SET 115484 39 71 1.0 5.8 3 10202
193146 TRAF 193146 1,032 1,899 1.0 2.5 3 10203
145759 TRAF 145759 503 1,004 1.1 2.2 3 10203
154505 SET 154505 1,304 2,760 1.2 4.5 3 10204
308637 PHD 308644 20 49 1.4 1.3 3 10202
188181 TRAF 188181 265 723 1.5 3.5 3 10206
282628 GNAT 282635 584 1,684 1.6 2.1 3 10206
192899 HMG 192899 1,261 4,097 1.8 3.7 3 10208
205788 GNAT 205793 215 782 2.0 1.4 3 10209
423513 HMG 398414 149 1,178 3.1 2.5 3 10219
321619 PHD 321626 0 2 26.0 1.0 3 10+00
143723 GNAT 143723 0 3 26.6 2.5 3 10201
aPID and TID are the protein and transcript identifiers for each gene model for C. reinhardtii genome version 4.0. bAnnotation indicates genename, family, or predicted function. cT +N and T –N are the total number of hits for each gene model, from either N-replete or N-deprivedconditions. dLog2FC is the log to base 2 of the difference in hits between the two conditions, for each gene model. eFDR refers to the falsediscovery rate for each gene model.
Global Changes following N Deprivation in Chlamydomonas
Plant Physiol. Vol. 154, 2010 1747

Major intracellular changes occur following N dep-rivation, and these are likely accompanied by remod-eling of membranes. Thus, fatty acids in membranelipids might be recycled into TAGs. Consistently,some of the transcripts whose abundance changesthe most were those encoding putative lipases. Ingeneral, lipases belong to a family of enzymes thatdeesterify carboxyl esters, such as TAGs and phospho-lipids. As TAGs accumulate following N deprivation,TAG lipases would be expected to be down-regulated.However, classifying lipases with selective substratespecificity based solely on their primary sequences ischallenging, a fact that needs to be taken into consid-eration when interpreting our data set. A TAG lipasetypically contains a Ser-Asp/Glu-His catalytic triad,with the Ser catalytic center located in a GXSXG motif(Brady et al., 1990; Winkler et al., 1990). Some recentlycharacterized TAG lipases in animals, yeast, andplants contain a patatin-like, iPLA2 family Ser-Aspcatalytic dyad (Zimmermann et al., 2004; Athenstaedtand Daum, 2005; Eastmond, 2006; Kurat et al., 2006).Genes encoding lipases specific for membrane lipidswould be expected to be up-regulated, as they mightmobilize fatty acids from membrane lipids into TAGs.Moreover, signaling pathways involving lipid prod-ucts generated by lipases, such as diacyglycerol, mayalso control steady-state TAG levels (Kanoh et al.,1993). Further biochemical characterization of some ofthe most regulated lipase candidate genes will benecessary to determine their role in TAG accumulationfollowing N deprivation.
On the other hand, we recognize that lipase ex-pression or activities may also be controlled at theposttranscriptional level, including translational reg-ulation and posttranslational modifications of theencoded proteins. In mammals, a hormone-sensitivelipase is phosphorylated by protein kinase A uponcAMP elevation and consequently exhibits betteraccessibility to lipid droplets (Holm et al., 2000).Some of the C. reinhardtii TAG lipases may have asimilar regulatory pattern and hence not show sig-nificant transcriptional changes when cells are Ndeprived. Reverse genetic studies on the lipase can-didates and forward genetic screens for mutants withTAG deficiency phenotypes will disclose the bonafide TAG lipases and other lipases that impact TAGmetabolism.
It should also be noted that during the analysis ofthe lipid gene data set, the annotation ambiguities ofseveral fatty acid desaturases became obvious in theversion 4.0 genomic sequence data set: the C. reinhard-tii genome harbors four presumed paralogs of FAD5(named FAD5a–FAD5d). Based on our current predic-tion analysis (Emanuelsson et al., 1999) and previousreports (Riekhof et al., 2005; Riekhof and Benning,2009), FAD5a and FAD5b are presumed to be targetedto the chloroplast, whereas FAD5c and FAD5d arelikely located in the ER membrane. However, exper-imental corroboration is still needed.
CONCLUSION
Our interpretation of this data set places emphasison TAG metabolism and potential regulatory factors,which are undoubtedly not yet completely identified.We expect that others will be able to mine this data set,taking into account different biological processes per-taining to N deprivation. Cross-querying this data setwith a lipid droplet proteomics data set (Moelleringand Benning, 2010) should further narrow the possi-ble candidates relevant for TAG accumulation. Like-wise, a meta-analysis of this and other data sets,including those from other species, could facilitatethe identification of genes most likely involved inTAG accumulation, as was recently done for low-oxygen stress (Mustroph et al., 2010). Thus, this studyrepresents only a first step of many toward gaining amolecular understanding of TAG accumulation andother cellular changes triggered by N deprivation inC. reinhardtii.
MATERIALS AND METHODS
Strains and Growth Conditions
The Chlamydomonas reinhardtii strain used was dw15.1 (cw15, nit1, mt+),
kindly provided by Arthur Grossman. The cells were grown in liquid cultures
under continuous light (approximately 80 mmol photons m22 s21). For
N-replete growth, TAP medium (Harris, 2009a) with 10 mM NH4+ (TAP + N)
was used. For preliminary experiments, N deprivation was applied by two
methods: continuous growth in TAP with 0.5 mM NH4+ or growth in TAP + N
to 53 106 cells mL21, followed by transfer to TAPwith no NH4+ (TAP2N) for
an additional 24 or 48 h. For further experiments, N deprivation was defined
as growth in TAP + N to 5 3 106 cells mL21, followed by transfer to TAP 2 N
for 48 h.
For labeling studies, the cells were grown in 500-mL shaker flasks with a
culture volume of 50 mL with continuous shaking. For the N deprivation
experiment, cells were first grown in TAP medium with unlabeled acetate
with at least five cell doublings to mid logarithmic phase to reach a biomass
equivalent to 0.3 to 0.4 g cell dry weight L21. The cells were divided up and
transferred to TAP medium containing [U-13C]acetate (Isotec), either TAP + N
or TAP 2 N.
Sequencing Read Processing
To generate material for high-throughput sequencing, cells were grown in
100 mL of TAP + N to 5 3 106 cells mL21. The cultures were split in half, and
cells were collected by centrifugation, with one pellet being resuspended in 50
mL of TAP + N and the other in 50 mL of TAP 2 N. After 48 h, the total RNA
was harvested using a Qiagen RNeasy Plant Mini kit. The RNA samples were
treated with Qiagen RNase-free DNase I during extraction.
For 454 sequencing, full-length cDNA pools were generated with the
Clontech SMART cDNA library construction kit. cDNA was synthesized us-
ing a modified cDNA synthesis primer (5#-TAGAGACCGAGGCGGCCGA-
CATGTTTTGTTTTTTTTTCTTTTTTTTTTVN-3#). Full-length cDNAs were
amplified by PCR and pooled to increase their concentration. An SfiI digest
was performed, followed by size fractionation. Fractions with the highest
intensity and size distribution were pooled and purified. The resulting cDNA
pools were then submitted to the Michigan State University-Research Tech-
nologies Service Facility for sequencing on a 454 GSFLX Titanium Sequencer
(454 Life Sciences). For Illumina sequencing, total RNAwas submitted directly
to the Michigan State University-Research Technologies Service Facility for
sequencing on an Illumina Genome Analyzer II (Illumina).
Default parameters were used to pass reads using 454 and Illumina
quality-control tools. The filtered sequence data were deposited in the
National Center for Biotechnology Information Short Read Archive with
the reference series number GSE24367 and subseries numbers GSE24365
Miller et al.
1748 Plant Physiol. Vol. 154, 2010

and GSE24366 for the Illumina and the 454 data sets, respectively. The
filtered 454 sequencing reads were mapped to the C. reinhardtii version 4.0
assembly from the Joint Genome Institute with GMAP (Wu and Watanabe,
2005). In GMAP, the maximum intron length was set at 980 bp, which is at
the 95th percentile of annotated C. reinhardtii intron lengths. The Illumina
reads were mapped with Bowtie (Langmead et al., 2009) using parameters
as follows: two or fewer mismatches, sum of Phred quality values at all
mismatched positions at 70 or less, and excluding reads mapped to one or
more locations. Because the sequence qualities of Illumina reads degrade
quickly toward the 3# end, an alternative mapping data set was generated
with reads trimmed from the 3# end (until the 3#-end-most position with
Phred-equivalent score was 20 or greater). Trimmed reads of less than 30 bp
were excluded from further analysis. In addition to sequence quality
issues, some reads may span two exons and would not be mapped by
Bowtie correctly. We used TopHat (Trapnell et al., 2009) to identify these
exon-spanning reads to generate another set of read mapping. The infor-
mation from TopHat was used for assembling mapped reads into trans-
frags with Cufflinks (Trapnell et al., 2010). In Cufflinks, the maximum
intron length was set at 1,855 bp (99th percentile of all the intron lengths),
5% minimum isoform fraction, and 5% pre-mRNA fraction. Transfrags
within 1,855 bp of an existing C. reinhardtii version 4.0 gene model were
regarded as potential missing exons of annotated genes. The rest were
regarded as intergenic exons, and adjacent transfrags less than 1,855 bp
apart were joined into “transcriptional units.”
Northern-Blot Analysis and RT-PCR
Total RNAwas harvested from N-replete or N-deprived cells as described
above, and 4 mg of each total RNAwas separated on a 1% formaldehyde gel
and transferred to a Hybond-N+ nylon membrane (GE Healthcare). Probes
were synthesized from cDNA and labeled with 32P using the Amersham
Megaprime labeling kit (GE Healthcare). The blots were hybridized with the
labeled probes in Ambion ULTRAhybe (Applied Biosystems/Ambion) at
42�C overnight. The blots were washed twice for 5 min with low-stringency
buffer (13 SSC and 0.1% SDS) at 60�C and then twice for 5 min with high-
stringency buffer (0.13 SSC and 0.1% SDS) at 60�C. The blots were exposed
to a Molecular Dynamics phosphor screen (GE Healthcare) overnight and
visualized with a Storm 820 phosphor imager (GE Healthcare). Probes
were synthesized from cDNA for AMT4 (5#-GTATTGCGTCCGATCTGC-3#and 5#-CGTGGAAATGCTGTAGGG-3#), DGTT2 (5#-TAAAGCACCGA-
CAAATGTGC-3# and 5#-CATGATCTGGCATTCTGTGG-3#), and DGTT3
(5#-GGTGGTGCTCTCCTACTGGA-3# and 5#-CCATGTACATCTCGGCA-
ATG-3#).For RT-PCR, RNAwas extracted from N-replete and N-deprived cultures
using TRIzol reagent (Invitrogen) and subjected to DNase treatment with the
Turbo DNA-free kit from Ambion. A total of 1 mg of DNA-free RNAwas used
for cDNA synthesis with the Invitrogen Moloney murine leukemia virus
reverse transcriptase. A total of 0.5 mg of oligo(dT)12–18 primer (Invitrogen) and
0.5 mg of random hexamer primers (Promega) were added to the RNA, and
the volume was adjusted to 20 mL final volume. After heating the samples at
70�C for 10 min, they were incubated on ice for 5 min. Twenty units of RNase
inhibitor (Applied Biosystems), 20 nmol of deoxyribonucleotide triphosphates
(Invitrogen), 4 mL of first-strand buffer, and 0.2 mmol of dithiothreitol were
added to the reaction. The reaction mixture was incubated at 37�C for 10 min
for primer annealing. A total of 200 units of Moloney murine leukemia virus
reverse transcriptase was added, and the reaction was incubated at 37�C for
1 h followed by deactivation at 70�C for 10 min. A total of 1 mL of a 1:10
dilution of the respective cDNAwas used as template for a PCR using GoTaq
polymerase (Promega). The reaction mixture (25 mL) contained 13 buffer, 5
nmol of deoxyribonucleotide triphosphates, 12.5 pmol of each primer, and
1 unit of polymerase. PCR cycle conditions were 3 min of initial denaturation
at 94�C, following 40 cycles of 30 s of denaturation, 30 s of annealing at 60�C,and 3min of elongation at 72�C. Final elongation was performed at 72�C for 10
min. The PSBS-specific primers (5#-ATGGCCATGACTCTGTCGAC-3# and
5#-TTAGGCGGACTCCTCGTCC-3#) amplify both PSBS1 and PSBS2. The
IDA5 gene (5#-GCCAGGTCTCTGCTCTGGTG-3# and 5#-TACTCGGACTTGGC-
GATCCA-3#) served as a control.
Analysis of Differential Gene Expression
Differential expression between C. reinhardtii cultured in N-replete and
N-depleted medium was determined using the numbers of mapped reads
overlapped with annotated C. reinhardtii genes as inputs to EdgeR (Robinson
et al., 2010). In the Joint Genome Institute database, multiple sets of C.
reinhardtii version 4 gene models are available. We used the “filtered” gene
models, which contain the best gene model for each locus. Genes were
regarded as differentially expressed if they have 2-fold or greater change
between N-replete and N-deprived samples and 5% or less false discovery
rate. Differential expressed genes were regarded as up-regulated if their
expression levels in N-deprived samples were significantly higher than those
in N-replete samples. Conversely, down-regulated genes were those with
significantly lower levels of expression following N deprivation.
In addition to EdgeR, we used three other methods to evaluate differential
expression: Fisher’s exact test (Bloom et al., 2009), likelihood ratio test
(Marioni et al., 2008), and a method based on intensity ratio and average
intensity (MARS; Wang et al., 2010). All three methods were implemented in
the DEGexp package (Wang et al., 2010). We found that among 4,004
differentially expressed genes called by EdgeR, 99.7% to 100% were regarded
as differentially expressed by the other three methods. On the other hand,
EdgeR calls overlap with 96.6%, 94.7%, and 95.8% of calls by Fisher’s exact
test, likelihood ratio test, and MARS, respectively. Our findings indicate that
EdgeR is more conservative than the other methods, but the overall differen-
tial expression calls are highly similar among methods. We should note that
methods other than EdgeR did not explicitly consider variance between
replicates and, as a result, will likely have a higher false-positive differential
expression call rate than that of EdgeR. Therefore, in all subsequent analyses,
we used only EdgeR-based differential expression calls.
GO annotation for the C. reinhardtii version 4.0 genome was acquired from
the Joint Genome Institute. Enrichment of differentially regulated genes in
each GO category was determined using Fisher’s exact test. To account for
multiple testing, the P values from Fisher’s exact tests were adjusted (Storey,
2003) and a false discovery rate of 5% was used as the threshold for enriched
GO terms.
GC-MS Analysis
To quantify 13C-labeling patterns such as mass-isotopomer distributions
and fractional 13C enrichment, samples were analyzed using GC-MS using an
HP 6890 GC apparatus (Hewlett-Packard) equipped with DB-5MS column
(5% phenyl-methyl-siloxan-diphenylpolysiloxan; 30 m 3 0.251 mm 3 0.25
mm; Agilent) and a quadrupole mass spectrometer (MS 5975; Agilent).
Electron ionization was carried out at 70 eV. The obtained mass spectrometric
data were corrected for the natural abundance of the elements to give
fractional 13C labeling.
Sampling, Extraction, and Analysis of IntracellularAmino Acid
Cells from TAP + N and TAP 2 N cultures were harvested after 24 h. This
time point was chosen for these labeling experiments because at the required
cell concentration (approximately 0.2 g cell dry weight L21) for metabolite
extraction, acetate depletion occurs in cells grown in TAP + N at later time
points due to the high initial inoculum.
The harvested cells (approximately 25 mg cell dry weight) were centri-
fuged at 3,000g for 1 min, and the supernatant was removed and quenched
with 5 mL of cold 100% methanol (Winder et al., 2008). The metabolites were
harvested by vortexing the cells. A second extraction was performed with 5
mL of chloroform:methanol (1:2). The extracts were then pooled. Water was
slowly added to the pooled extracts for phase separation. The polar metab-
olites, which include the amino acids, were present in the aqueous phase.
The aqueous phase was then dried under N2 and converted to its t-butyldi-
methylsilyl derivative using N-methyl-N-(t-butyldimethylsilyl)trifluoroacet-
amide (Mawhinney et al., 1986). The GC and MS conditions for this analysis
were as described previously (Deshpande et al., 2009).
Extraction and Analysis of Rib
Rib for analysis was obtained from the RNA as described (Boren et al.,
2003). RNAwas extracted from cells (0.1–0.2 g L21) at the same time point as
the intracellular amino acids using the Tri reagent as described in the protocol
(Molecular Research Center). The RNAwas acid hydrolyzed to its monomers
and dried under N. It was further analyzed using GC-MS by derivatizing it to
its per-O-trimethylsilyl-O-ethyl oxime (MacLeod et al., 2001). The ions 481 to
Global Changes following N Deprivation in Chlamydomonas
Plant Physiol. Vol. 154, 2010 1749

486 (mass-to-charge ratio), corresponding to the whole carbon backbone of the
Rib molecule (C1–C5), were monitored using single ion monitoring of the MS
data.
Extraction and Analysis of Carbohydrate
The carbohydrates in the cells were acid hydrolyzed by 2 N HCl at 102�C,and the monomeric compounds were analyzed by GC-MS after the sample
was dried under N2. The sample was then converted to its di-O-isopropyli-
dene acetate derivative for analysis by GC-MS (Hachey et al., 1999). The ions
287 to 293 (mass-to-charge ratio), corresponding to the whole carbon backbone
of Glc (C1–C6), were monitored.
Sequence data from this article can be found in the National Center for
Biotechnology Information Gene Expression Omnibus under accession num-
bers GSE24367, GSE2466, and GSE2465.
Supplemental Data
The following materials are available in the online version of this article.
Supplemental Table S1. Illumina analysis of transcripts related to game-
togenesis.
Supplemental Table S2. Illumina analysis of transcripts related to N
metabolism.
Supplemental Table S3. Illumina analysis of transcripts encoding chloro-
plast ribosomal proteins.
Supplemental Table S4. Illumina analysis of transcripts encoding cyto-
solic 80S ribosomal proteins.
Supplemental Table S5. Illumina analysis of transcripts encoding L22
ribosomal proteins.
Supplemental Table S6. Illumina analysis of transcripts encoding proteins
of central metabolism.
Supplemental Table S7. Illumina analysis of transcripts related to photo-
synthesis.
Supplemental Table S8. Illumina analysis of transcripts related to lipid
metabolism.
Supplemental Spreadsheet S1. Complete data set of all genes analyzed by
454 and Illumina.
ACKNOWLEDGMENTS
We thank Titus Brown, Gaurav Moghe, and Cheng Zou for help with
analysis of Illumina data, James Bullard for help with comparing differential
expression call methods, and the Joint Genome Institute for providing C.
reinhardtii sequences and gene annotation.
Received August 31, 2010; accepted October 7, 2010; published October 8,
2010.
LITERATURE CITED
Athenstaedt K, Daum G (2005) Tgl4p and Tgl5p, two triacylglycerol
lipases of the yeast Saccharomyces cerevisiae are localized to lipid
particles. J Biol Chem 280: 37301–37309
Baurain D, Dinant M, Coosemans N, Matagne RF (2003) Regulation of the
alternative oxidase Aox1 gene in Chlamydomonas reinhardtii: role of the
nitrogen source on the expression of a reporter gene under the control of
the Aox1 promoter. Plant Physiol 131: 1418–1430
Bloom JS, Khan Z, Kruglyak L, Singh M, Caudy AA (2009) Measuring
differential gene expression by short read sequencing: quantitative
comparison to 2-channel gene expression microarrays. BMC Genomics
10: 221
Bonente G, Passarini F, Cazzaniga S, Mancone C, Buia MC, Tripodi M,
Bassi R, Caffarri S (2008) The occurrence of the psbS gene product in
Chlamydomonas reinhardtii and in other photosynthetic organisms and its
correlation with energy quenching. Photochem Photobiol 84: 1359–1370
Boren J, Lee WN, Bassilian S, Centelles JJ, Lim S, Ahmed S, Boros LG,
Cascante M (2003) The stable isotope-based dynamic metabolic profile
of butyrate-induced HT29 cell differentiation. J Biol Chem 278: 28395–
28402
Brady L, Brzozowski AM, Derewenda ZS, Dodson E, Dodson G, Tolley S,
Turkenburg JP, Christiansen L, Huge-Jensen B, Norskov L, et al (1990)
A serine protease triad forms the catalytic centre of a triacylglycerol
lipase. Nature 343: 767–770
Bullard JH, Purdom E, Hansen KD, Dudoit S (2010) Evaluation of
statistical methods for normalization and differential expression in
mRNA-Seq experiments. BMC Bioinformatics 11: 94
Bulte L, Wollman FA (1992) Evidence for a selective destabilization of an
integral membrane protein, the cytochrome b6/f complex, during
gametogenesis in Chlamydomonas reinhardtii. Eur J Biochem 204:
327–336
Camargo A, Llamas A, Schnell RA, Higuera JJ, Gonzalez-Ballester D,
Lefebvre PA, Fernandez E, Galvan A (2007) Nitrate signaling by the
regulatory gene NIT2 in Chlamydomonas. Plant Cell 19: 3491–3503
Carman GM, Han GS (2006) Roles of phosphatidate phosphatase enzymes
in lipid metabolism. Trends Biochem Sci 31: 694–699
Collier JL, Grossman AR (1992) Chlorosis induced by nutrient deprivation
in Synechococcus sp. strain PCC 7942: not all bleaching is the same. J
Bacteriol 174: 4718–4726
Deshpande R, Yang TH, Heinzle E (2009) Towards a metabolic and
isotopic steady state in CHO batch cultures for reliable isotope-based
metabolic profiling. Biotechnol J 4: 247–263
Eastmond PJ (2006) SUGAR-DEPENDENT1 encodes a patatin domain
triacylglycerol lipase that initiates storage oil breakdown in germinating
Arabidopsis seeds. Plant Cell 18: 665–675
Emanuelsson O, Nielsen H, von Heijne G (1999) ChloroP, a neural
network-based method for predicting chloroplast transit peptides and
their cleavage sites. Protein Sci 8: 978–984
Fernandez E, Llamas A, Galvan A (2009) Nitrogen assimilation and its
regulation. In D Stern, EH Harris, eds, The Chlamydomonas Sourcebook:
Organellar and Metabolic Processes, Ed 2, Vol 2. Elsevier, Dordrecht, The
Netherlands, pp 69–113
Fisslthaler B, Meyer G, Bohnert HJ, Schmitt JM (1995) Age-dependent
induction of pyruvate, orthophosphate dikinase in Mesembryanthe-
mum crystallinum L. Planta 196: 492–500
Gonzalez-Ballester D, Camargo A, Fernandez E (2004) Ammonium trans-
porter genes in Chlamydomonas: the nitrate-specific regulatory gene
Nit2 is involved in Amt1;1 expression. Plant Mol Biol 56: 863–878
Gonzalez-Ballester D, Casero D, Cokus S, Pellegrini M, Merchant SS,
Grossman AR (2010) RNA-seq analysis of sulfur-deprived Chlamydo-
monas cells reveals aspects of acclimation critical for cell survival. Plant
Cell 22: 2058–2084
Hachey DL, Parsons WR, McKay S, Haymond MW (1999) Quantitation
of monosaccharide isotopic enrichment in physiologic fluids by elec-
tron ionization or negative chemical ionization GC/MS using di-O-
isopropylidene derivatives. Anal Chem 71: 4734–4739
Hamel P, Olive J, Pierre Y, Wollman FA, de Vitry C (2000) A new subunit of
cytochrome b6f complex undergoes reversible phosphorylation upon
state transition. J Biol Chem 275: 17072–17079
Harris EH (2009a) Chlamydomonas in the laboratory. In D Stern, EH Harris,
eds, The Chlamydomonas Sourcebook: Introduction to Chlamydomo-
nas and Its Laboratory Use, Ed 2, Vol 1. Elsevier, Dordrecht, The
Netherlands, pp 241–302
Harris EH (2009b) The sexual cycle. In D Stern, EH Harris, eds, The
Chlamydomonas Sourcebook: Introduction to Chlamydomonas and Its
Laboratory Use, Ed 2, Vol 1. Elsevier, Dordrecht, The Netherlands, pp
119–157
Holm C, Osterlund T, Laurell H, Contreras JA (2000) Molecular mecha-
nisms regulating hormone-sensitive lipase and lipolysis. Annu Rev
Nutr 20: 365–393
Hu Q, Sommerfeld M, Jarvis E, Ghirardi M, Posewitz M, Seibert M,
Darzins A (2008) Microalgal triacylglycerols as feedstocks for biofuel
production: perspectives and advances. Plant J 54: 621–639
Jamers A, Van der Ven K, Moens L, Robbens J, Potters G, Guisez Y, Blust
R, De Coen W (2006) Effect of copper exposure on gene expression
Miller et al.
1750 Plant Physiol. Vol. 154, 2010

profiles in Chlamydomonas reinhardtii based on microarray analysis.
Aquat Toxicol 80: 249–260
Kanoh H, Sakane F, Imai S, Wada I (1993) Diacylglycerol kinase and
phosphatidic acid phosphatase: enzymes metabolizing lipid second
messengers. Cell Signal 5: 495–503
Kurat CF, Natter K, Petschnigg J, Wolinski H, Scheuringer K, Scholz H,
Zimmermann R, Leber R, Zechner R, Kohlwein SD (2006) Obese yeast:
triglyceride lipolysis is functionally conserved frommammals to yeast. J
Biol Chem 281: 491–500
Kurvari V, Grishin NV, Snell WJ (1998) A gamete-specific, sex-limited
homeodomain protein in Chlamydomonas. J Cell Biol 143: 1971–1980
Langmead B, Trapnell C, Pop M, Salzberg SL (2009) Ultrafast and
memory-efficient alignment of short DNA sequences to the human
genome. Genome Biol 10: R25
Ledford HK, Baroli I, Shin JW, Fischer BB, Eggen RI, Niyogi KK (2004)
Comparative profiling of lipid-soluble antioxidants and transcripts
reveals two phases of photo-oxidative stress in a xanthophyll-deficient
mutant of Chlamydomonas reinhardtii. Mol Genet Genomics 272:
470–479
Ledford HK, Chin BL, Niyogi KK (2007) Acclimation to singlet oxygen
stress in Chlamydomonas reinhardtii. Eukaryot Cell 6: 919–930
Li XP, Bjorkman O, Shih C, Grossman AR, Rosenquist M, Jansson S,
Niyogi KK (2000) A pigment-binding protein essential for regulation of
photosynthetic light harvesting. Nature 403: 391–395
Li XP, Gilmore AM, Niyogi KK (2002) Molecular and global time-resolved
analysis of a psbS gene dosage effect on pH- and xanthophyll cycle-
dependent nonphotochemical quenching in photosystem II. J Biol Chem
277: 33590–33597
MacLeod JK, Flanigan IL, Williams JF, Collins JG (2001) Mass spectro-
metric studies of the path of carbon in photosynthesis: positional
isotopic analysis of (13)C-labelled C(4) to C(7) sugar phosphates. J
Mass Spectrom 36: 500–508
MajeranW, Wollman FA, Vallon O (2000) Evidence for a role of ClpP in the
degradation of the chloroplast cytochrome b(6)f complex. Plant Cell 12:
137–150
Mamedov TG, Moellering ER, Chollet R (2005) Identification and expres-
sion analysis of two inorganic C- and N-responsive genes encoding
novel and distinct molecular forms of eukaryotic phosphoenolpyruvate
carboxylase in the green microalga Chlamydomonas reinhardtii. Plant J
42: 832–843
Marioni JC, Mason CE, Mane SM, Stephens M, Gilad Y (2008) RNA-seq:
an assessment of technical reproducibility and comparison with gene
expression arrays. Genome Res 18: 1509–1517
Martin NC, Chiang KS, Goodenough UW (1976) Turnover of chloroplast
and cytoplasmic ribosomes during gametogenesis in Chlamydomonas
reinhardtii. Dev Biol 51: 190–201
Martin NC, Goodenough UW (1975) Gametic differentiation in Chlamy-
domonas reinhardtii. I. Production of gametes and their fine structure.
J Cell Biol 67: 587–605
Mattingly SJ, Dipersio JR, Higgins ML, Shockman GD (1976) Unbalanced
growth and macromolecular synthesis in Streptococcus mutans FA-1.
Infect Immun 13: 941–948
Mawhinney TP, Robinett RS, Atalay A, Madson MA (1986) Analysis of
amino acids as their tert.-butyldimethylsilyl derivatives by gas-liquid
chromatography and mass spectrometry. J Chromatogr A 358: 231–242
Merchant SS, Prochnik SE, Vallon O, Harris EH, Karpowicz SJ, Witman
GB, Terry A, Salamov A, Fritz-Laylin LK, Marechal-Drouard L, et al
(2007) The Chlamydomonas genome reveals the evolution of key animal
and plant functions. Science 318: 245–250
Moellering ER, Benning C (2010) RNA interference silencing of a major
lipid droplet protein affects lipid droplet size in Chlamydomonas
reinhardtii. Eukaryot Cell 9: 97–106
Mus F, Dubini A, Seibert M, Posewitz MC, Grossman AR (2007) Anaer-
obic acclimation in Chlamydomonas reinhardtii: anoxic gene expres-
sion, hydrogenase induction, and metabolic pathways. J Biol Chem 282:
25475–25486
Mussgnug JH, Wobbe L, Elles I, Claus C, Hamilton M, Fink A, Kahmann
U, Kapazoglou A, Mullineaux CW, Hippler M, et al (2005) NAB1 is an
RNA binding protein involved in the light-regulated differential ex-
pression of the light-harvesting antenna of Chlamydomonas reinhardtii.
Plant Cell 17: 3409–3421
Mustroph A, Lee SC, Oosumi T, Zanetti ME, Yang H, Ma K, Yaghoubi-
Masihi A, Fukao T, Bailey-Serres J (2010) Cross-kingdom comparison
of transcriptomic adjustments to low-oxygen stress highlights con-
served and plant-specific responses. Plant Physiol 152: 1484–1500
Nguyen AV, Thomas-Hall SR, Malnoe A, Timmins M, Mussgnug JH,
Rupprecht J, Kruse O, Hankamer B, Schenk PM (2008) Transcriptome
for photobiological hydrogen production induced by sulfur deprivation
in the green alga Chlamydomonas reinhardtii. Eukaryot Cell 7:
1965–1979
Oshlack A, Wakefield MJ (2009) Transcript length bias in RNA-seq data
confounds systems biology. Biol Direct 4: 14
Osteras M, Driscoll BT, Finan TM (1997) Increased pyruvate orthophos-
phate dikinase activity results in an alternative gluconeogenic pathway
in Rhizobium (Sinorhizobium) meliloti. Microbiology 143: 1639–1648
Peltier G, Schmidt GW (1991) Chlororespiration: an adaptation to nitrogen
deficiency in Chlamydomonas reinhardtii. Proc Natl Acad Sci USA 88:
4791–4795
Perez-Rodrıguez P, Riano-Pachon DM, Correa LG, Rensing SA, Kersten
B, Mueller-Roeber B (2010) PlnTFDB: updated content and new fea-
tures of the plant transcription factor database. Nucleic Acids Res 38:
D822–D827
Plumley FG, Schmidt GW (1989) Nitrogen-dependent regulation of pho-
tosynthetic gene expression. Proc Natl Acad Sci USA 86: 2678–2682
Pollard M, Ohlrogge J (1999) Testing models of fatty acid transfer and lipid
synthesis in spinach leaf using in vivo oxygen-18 labeling. Plant Physiol
121: 1217–1226
Riekhof WR, Benning C (2009) Glycerolipid biosynthesis. In DB Stern, EH
Harris, eds, The Chlamydomonas Sourcebook: Organellar and Meta-
bolic Processes, Ed 2, Vol 2. Elsevier, Dordrecht, The Netherlands, pp
41–68
Riekhof WR, Sears BB, Benning C (2005) Annotation of genes involved in
glycerolipid biosynthesis in Chlamydomonas reinhardtii: discovery of
the betaine lipid synthase BTA1Cr. Eukaryot Cell 4: 242–252
Robinson MD, McCarthy DJ, Smyth GK (2010) EdgeR: a Bioconductor
package for differential expression analysis of digital gene expression
data. Bioinformatics 26: 139–140
Schnell RA, Lefebvre PA (1993) Isolation of the Chlamydomonas regula-
tory gene NIT2 by transposon tagging. Genetics 134: 737–747
Shockey JM, Fulda MS, Browse JA (2002) Arabidopsis contains nine long-
chain acyl-coenzyme A synthetase genes that participate in fatty acid
and glycerolipid metabolism. Plant Physiol 129: 1710–1722
Shrager J, Hauser C, Chang CW, Harris EH, Davies J, McDermott J, Tamse
R, Zhang Z, Grossman AR (2003) Chlamydomonas reinhardtii genome
project: a guide to the generation and use of the cDNA information.
Plant Physiol 131: 401–408
Siersma PW, Chiang KS (1971) Conservation and degradation of cyto-
plasmic and chloroplast ribosomes in Chlamydomonas reinhardtii.
J Mol Biol 58: 167–172
Simon DF, Descombes P, Zerges W,Wilkinson KJ (2008) Global expression
profiling of Chlamydomonas reinhardtii exposed to trace levels of free
cadmium. Environ Toxicol Chem 27: 1668–1675
Storey JD (2003) The positive false discovery rate: a Bayesian interpretation
and the q-value. Ann Stat 31: 2013–2035
Taylor L, Nunes-Nesi A, Parsley K, Leiss A, Leach G, Coates S, Wingler A,
Fernie AR, Hibberd JM (2010) Cytosolic pyruvate,orthophosphate
dikinase functions in nitrogen remobilization during leaf senescence
and limits individual seed growth and nitrogen content. Plant J 62:
641–652
Trapnell C, Pachter L, Salzberg SL (2009) TopHat: discovering splice
junctions with RNA-Seq. Bioinformatics 25: 1105–1111
Trapnell C, Williams BA, Pertea G, Mortazavi A, Kwan G, van Baren
MJ, Salzberg SL, Wold BJ, Pachter L (2010) Transcript assembly
and quantification by RNA-Seq reveals unannotated transcripts and
isoform switching during cell differentiation. Nat Biotechnol 28:
511–515
Wang L, Feng Z, Wang X, Wang X, Zhang X (2010) DEGseq: an R package
for identifying differentially expressed genes from RNA-seq data.
Bioinformatics 26: 136–138
Wang ZT, Ullrich N, Joo S, Waffenschmidt S, Goodenough U (2009) Algal
lipid bodies: stress induction, purification and biochemical char-
acterizatioon in wild-type and starch less Chlamydomonas reinhardtii.
Eukaryot Cell 8: 1856–1868
Weber AP, Weber KL, Carr K, Wilkerson C, Ohlrogge JB (2007) Sampling
the Arabidopsis transcriptome with massively parallel pyrosequencing.
Plant Physiol 144: 32–42
Global Changes following N Deprivation in Chlamydomonas
Plant Physiol. Vol. 154, 2010 1751

Wijffels RH, Barbosa MJ (2010) An outlook on microalgal biofuels. Science
329: 796–799
Winder CL, Dunn WB, Schuler S, Broadhurst D, Jarvis R, Stephens GM,
Goodacre R (2008) Global metabolic profiling of Escherichia coli cul-
tures: an evaluation of methods for quenching and extraction of intra-
cellular metabolites. Anal Chem 80: 2939–2948
Winkler FK, D’Arcy A, Hunziker W (1990) Structure of human pancreatic
lipase. Nature 343: 771–774
Wu TD, Watanabe CK (2005) GMAP: a genomic mapping and
alignment program for mRNA and EST sequences. Bioinformatics
21: 1859–1875
Yamano T, Miura K, Fukuzawa H (2008) Expression analysis of genes
associated with the induction of the carbon-concentrating mechanism in
Chlamydomonas reinhardtii. Plant Physiol 147: 340–354
Zimmermann R, Strauss JG, Haemmerle G, Schoiswohl G, Birner-
Gruenberger R, Riederer M, Lass A, Neuberger G, Eisenhaber F,
Hermetter A, et al (2004) Fat mobilization in adipose tissue is promoted
by adipose triglyceride lipase. Science 306: 1383–1386
Miller et al.
1752 Plant Physiol. Vol. 154, 2010


![Changes in Transcript Abundance in Chlamydomonas ... · Changes in Transcript Abundance inChlamydomonas reinhardtii following Nitrogen Deprivation Predict Diversion of Metabolism1[W][OA]](https://img.pdfslide.us/doc/110x75/5f8b246401a2802aaa396c92/changes-in-transcript-abundance-in-chlamydomonas-changes-in-transcript-abundance.jpg)
![Cell-type specific light-mediated transcript regulation in the ......unicellular Chlamydomonas [3,10,12-14], little is known about the molecular background of light reception mecha-nisms](https://img.pdfslide.us/doc/110x75/60f7823bde6f2b209b6a0aad/cell-type-specific-light-mediated-transcript-regulation-in-the-unicellular.jpg)
![Transcript Abundance of Photorhabdus Insect-Related (Pir) Toxin …centaur.reading.ac.uk/67414/1/Transcript Abundance of Photorhabdu… · another [4,5]. Once a suitable insect host](https://img.pdfslide.us/doc/110x75/5f8e2c986fb3a1288f4e6734/transcript-abundance-of-photorhabdus-insect-related-pir-toxin-abundance-of-photorhabdu.jpg)