Embed Size (px)
Citation preview

Changes in the TRMM version 7 space/time averaged level 3 data products based onGPROF TMI swath-based precipitation retrievals
Erich Stocker 1 , Owen Kelley2, Christian Kummerow 3 , Joyce Chou 2, and Lawrence Woltz 4
1 NASA/GSFC, Code 610.2, Greenbelt, MD 20771, USA2 George Mason University, Fairfax, VA 22030, USA
3 Colorado State University, Ft. Collins, CO 80523, USA4 Wyle Information Systems, Greenbelt, MD 20771, USA
AbstractTRMM has three level 3 (space/time averaged) dataproducts that aggregate level 2 TRMM MicrowaveImager (TMI) GPROF precipitation retrievals. Thesethree products are TRMM 3A12, which is a monthlyaccumulation of 2A12 the GPROF swath retrievalproduct; TRMM 3B31, which is a monthlyaccumulation of 2A12 and 2B31 the combined retrievalproduct that uses both Precipitation Radar (PR) andTMI data; and 3G68 and its variants, which providehourly retrievals for TMI, PR and combined. The 3G68products are packaged as daily files but provide hourlyinformation at 0.5° x 0.5 ° resolution globally, 0.25 ° x0.25 ° globally, or 0.1 ° x 0.1 ° over Africa, Australia andSouth America. This paper will present earlyinformation of the changes in the v7 TMI GPROF level2 retrievals that have an impact on the level 3accumulations. This paper provides an analysis of theeffect the 2A12 GPROF changes have on 3G68products. In addition, it provides a comparison betweenthe TRMM level 3 products that use the TMI GPROFswath retrievals.
1. IntroductionIn space since 1997, the Tropical Rainfall
Measuring Mission (TRMM) satellite is the firstsatellite to carry both passive microwave and radar forobserving the detailed three-dimensional structure ofprecipitation. In 2010, algorithms are being tested forthe version 7 (v7) reprocessing of TRMM data. To agreater degree than ever before, the v7 algorithms willtake advantage of the possible synergies between activeand passive precipitation sensors. This new version ofthe algorithms introduces techniques that may be usedby the at-launch algorithms of the Global PrecipitationMeasurement (GPM) mission. The core GPM satelliteis scheduled for a 2013 launch, so the version 7algorithms currently being tested may be the lastreprocessing cycle prior to the GPM launch.
The Precipitation Processing System (PPS) atNASA Goddard generates three levels of TRMMstandard data products. The level 1 products reportvalues at the instrument field of view (IFOV):brightness temperature for the radiometer and returnedpower and radar reflectivity for the Precipitation Radar(PR). Level 2 products contain the swath-orientedgeophysical precipitation retrievals at the same IFOV asthe Level 1 products. Level 3 products containtime/space accumulations or averages for varioushorizontal resolutions and for accumulation periods ofvarying durations.
This paper describes TRMM v7 changes in theTMI level 2 product that have an impact on the level 3time/space averaged data products. It concentratesparticularly on the daily level 3 product with theTRMM designation 3G68. A description of the 3G68format is available on the trmmopen FTP site [1] andthe formats of other TRMM standard products areavailable on the PPS web site [2]. The paper alsocompares the current test v7 implementation of 3G68with the other level 3 products that average the TRMMMicrowave Imager (TMI) precipitation retrievals onmonthly basis.
Of particular importance to this analysis arethe v7 changes in the GPROF precipitation retrievalsfrom TMI observations. Versions 5 and 6 of GPROFhave been described elsewhere [3,4]. In the context ofTRMM, GPROF is referred to as the TRMM 2A12algorithm.
The V7 GPROF uses a substantially improveda priori database over oceans compared to previousversions. Specifically, previous versions used onlycloud resolving models to construct the a prioridatabases while V7 uses PR observations along withphysical adjustments to make the profiles consistentwith both PR and TMI observations [5].
Page 1
European Geosciences UnionStocker et al., paper #10830
May 2010 General Assembly, Vienna, Austria
While this new database is believed toimprove GPROF's surface precipitation estimates, thenew database cannot overcome the limited sensitivity ofthe PR that prevents PR from detecting very lightprecipitation. This detection limit means that TMIocean observations based on the v7 GPROF database,cannot distinguish between light precipitation and noprecipitation.
Unlike v6 GPROF, the v7 GPROF databasecontains profiles with zero surface precipitation becausev7 GPROF is observationally based. The surfaceprecipitation rate that v7 GPROF reports at a pixel isthe average of the surface precipitation rate in all of theprecipitating and non-precipitating profiles that matchthe observed TMI brightness temperature at this pixel.As a diagnostic variable, v7 GPROF algorithm alsoreports a precipitation probability. This probability issimply calculated as the percent of matching databaseprofiles that have a non-zero surface precipitation rate.For example, if ten profiles in the database matched theobserved brightness temperature at a pixel and only fiveof them had non-zero surface precipitation, then thereported precipitation probability would be 50%.
This new approach is a significant changefrom the historic rain/no-rain decisions based onempirical thresholds. Specifically, almost all pixelsnow contain some small probability of rain in the newscheme. The low-probability pixels, while easilyfiltered from the instantaneous precipitation, should notbe filtered before monthly averages are calculated, orthe monthly averages will lose some of the informationin the instantaneous values. The issue of whether tofilter, when to filter, and which variables to filter offerschallenges to any level 3 algorithm based on v7GPROF swath retrievals.
The approach adopted by the three major level3 products that use the GPROF retrievals for theiraccumulation and averaging is described in thefollowing paragraphs. Two other TRMM level 3algorithms are not included in this study (3B42 and3B43) because, while they read GPROF swath data,these algorithms do not output GPROF-only averages.Another TRMM level 3 algorithm is excluded from thisstudy because it reads 1B11 instead of 2A12 and itsgrid is much coarser than the 3G68 grid, i.e., theTRMM 3A11 algorithm has a 5 ° x 5° grid. The three
algorithms are included in this study are designatedTRMM 3A12, 3B31, and 3G68.
3A12 is a monthly 0.5 ° x 0.5° gridded averageof 2A12 parameters. In discussions with the GPROFdevelopers, the decision was made not to filter low-probability precipitation rates from the 3A12 averagesover the ocean. Had 3A12 omitted instantaneoussurface precipitation rates that had probabilities of 50%or less, it would have resulted in an underestimation ofthe monthly-average precipitation rate. In thecalculation of the number of precipitation pixels, 3A12does not count instantaneous precipitation rates with a50% or lower probability.
3B31 is the monthly gridded accumulation ofthe combined radar/radiometer swath product 2B31. Inv7, 3B31 is still a straight accumulation of 2A12 and
2B31 parameters but now at a 0.5 ° x 0.5° resolutionrather than the former 5 ° x 5° resolution. Of interest inthis study are the "wide swath" accumulations of the3B31 product which include all data in the wide swathof the TMI instrument. 3B31 does no filtering ofinstantaneous precipitation rates. As in 3A12, 3B31does not provide a precipitation pixel count or totalpixel count in the grid box.
3G68 is an ASCII text product that containsaverage surface precipitation rates in hourly gridspackaged as a daily product. The 3G68 daily product isversatile because it can be used to determine diurnalvariation in average precipitation rate over months,seasons, years, or decades. Alternatively, climatologiesof precipitation rate can be calculated from 3G68 dailyfiles for arbitrary start and end dates. Despite thisflexibility, it is important that the 3G68 product give thesame monthly-average precipitation rates as the otherlevel 3 TRMM products when the same GPROF level 2data are used as input. Care was taken to minimize anyvariability in 3G68 that is due to deviations between theaveraging algorithm of 3G68 and the other level 3TRMM algorithms.
While this study uses the standard 3G68product on the 0.5° x 0.5° grid, there is actually afamily of related products with finer resolution [6]:
3G68.25 has 0.25 ° resolution and 3G68Land has 0.1 °
resolution for South America, Africa, and Australia.For each hour, all 3G68 variants calculate the average,unconditioned, mean precipitation rate from TMI
Page 2
European Geosciences UnionStocker et al., paper #10830
May 2010 General Assembly, Vienna, Austria
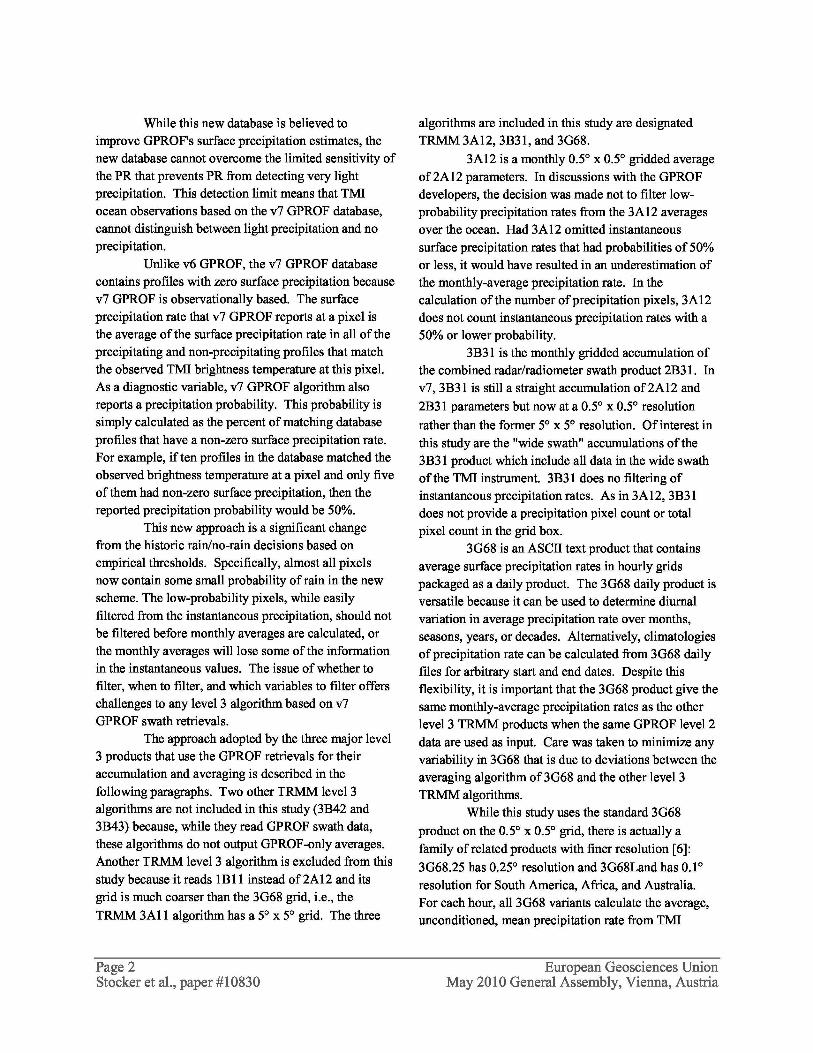
GPROF swath data (2A12), the TRMM Precipitation of the impact of v7 TMI precipitation retrieval changes
Radar (2A25), and the combined radiometer/radar over the ocean.
algorithm (2B31). 3G68 also provides precipitation Initially, it was thought that, because 3G68 is
pixel counts, total counts, and the percent of the designed to be a simple product, low-probabilityprecipitation that is falling as convective rather than precipitation over the ocean (when the GPROF
Fig 1. Single-orbit GPROF Precipitation A comparison of v6 and v7
. . . . . . . . .. • . .. ..2A12 and v7 3G68.v6 of the TRMM 2A12
a) In
•.!^ IU-S A' ' ' ' ' ''
:::,r^+ westerrnAtlantic.—^ n - .. algorithm, most of the
Precipitation F'' 1 :^ 0 1 ^'^ '^ '`^ntip surface precipitation rate
Rate (mm h-J) mm h - . n over most of the ocean isr = -. ;' zero. Where it is
r• ,,
:•T. n .,,,,_ 1All precipitating, the
20,.x precipitation rate is general
1" • ' ' ' "' "' ' ' ' "' between 0.1 and 10 mm h-a.: 2A.12 V6 Precipitation Rate; 1. The data were collected
0.01 ` ' on 1 January 2001 (b) In v7^. TRMM 2A12, the frequency
10-4 ...... of precipitation over land
s . •• has changed little, but over0.01-0.1 mm h ocean, the algorithm
0 estimates that it is nearlyalways precipitating. (c)
^3`cyTL.: " . . . . .. . .. . . . . .. .• . r10.1
10v7 2A12 gives some of the
• ' ' '' "new" ocean precipitation a
• • • b.. 2A,12 V7. P,reci itation,F2at'e. °Precipiation
p ' ' ' ' ' ' 100 /° probability.rd .:... ' '
.
.... .
-' ' ..... ' ' Probability in this context
Probability (%) - - . 70; W1 ....• . , 60.VV .. • • • . •.50 ;W', refers to the fraction of100` 'tip " ` •i•=;^-' ' ' GPROF database profiles
%0
n,r^00( n -_ • .. with non-zero surface75 _ precipitation out of the set50 ^_ -^""'r;, of GPROF database
f_ ,^ , profiles that match the TMI
25 . f y'r " ,^- observed brightness
0 - 1 temperatures. (d) A single-
.... V7.Rrobability•n
• f hour 3G68 grid that was
it 0 ,.n n n n 1 n n n n n n n n n , , , , , , , , , , , , , generated from v7 2A12. -99 ... .... 1 :::::: :::., with no filtering on
missing ^ r _ precipitation rates.Essentially the sameprecipitation rates are
-. •, obtained as in v7 2A12.
k i` '
MEN
d 3G68 V7 Prgcipitatiori Rate
stratiform precipitation. The recently-implementedrefinements to 3G68 to accommodate v7 input dataform the basis of this paper and of the present analysis
probability for the instantaneous precipitation rate isless than 50%) would be set to zero inside 3G68.However, this plan was changed when analysis showed
Page 3
European Geosciences UnionStocker et al., paper #10830
May 2010 General Assembly, Vienna, Austria

that the original plan would have led to the loss ofapproximately 3.5% of the global total precipitationaccumulation during a month. In the tropicalsubsidence regions, the monthly-average precipitationrate would be lowered by 15%, and in a few smallregions of the ocean with extremely low averageprecipitation rates, the monthly-average precipitationrate would be lowered by over 50%.
2. AnalysisWhen the abstract of this paper was originally
submitted, the figures were to show data from theofficial version 7 algorithms. This plan had to bechanged due to continued testing of the version 7algorithms that is leading to a later start to the version 7reprocessing cycle. For this reason, the figures in thispaper are generated with a test version of v7 data.These test data are believed to be close enough to theeventual official v7 data products to validate the v73G68 algorithm.
Based on brightness temperature and becauseof limitations in the detectability threshold of the radar
Fig. 2. Filtering vs. No Filtering in a Monthly average Precipitation Rate
A comparison of monthly-average v7 3G68 precipitation rates when low probability precipitation is filtered out orincluded in the calculation. Both 3G68 files are calculated from v7 2A12 files for January 2001. (a) Filtering:Instantaneous precipitation with a probability of 50% or less is set to zero and counted as non-precipitating. The fournumbered regions are defined in the text. (b) No filtering: All instantaneous precipitation measurements are averagedto obtain the monthly-average precipitation rates.
Page 4 European Geosciences UnionStocker et al., paper #10830 May 2010 General Assembly, Vienna, Austria

which is inherent in the a priori database, GPROFversion 6 or 7 cannot definitively distinguish betweenlight precipitation and no precipitation. In v6, GPROFsimply reported zero precipitation over most of theocean where precipitation was possible but not certain.In v7, GPROF reports a small but non-zeroprecipitation rate and an associated probability almosteverywhere over the ocean, with zero precipitationalmost never reported over ocean. This extrainformation in the v7 GPROF enables end users tochoose an appropriate threshold for screening outuncertain precipitation based on how they intend onusing the GPROF output.
To illustrate this difference between v6 and v7GPROF, Figure 1 shows a portion of TRMM orbit#17821 that observed the western Atlantic early onJanuary 1, 2001. Figure 1a shows that, in v6 GPROF,most of the non-zero precipitation rates in are light tomoderate (1 to 10 mm h-1), shown in shades of yellow-orange. In v7 GPROF, Figures 1b and 1c show that thewestern portion of the scene is filled with 0.01 to 0.1mm h-1 precipitation rates shown in yellow-green thatare assigned 100% probability, while the easternportion of the scene is filled with even lighterprecipitation (10-4 to 10-3 mm h-1) in blue-green that is
assigned low probability of 1−4%.Originally, it was thought that 3G68 should
filter out the low-probability precipitation whengenerating a single-hour grid. Such filtering in thesingle-hour grid would mean that all low-probabilityprecipitation would also be excluded from any monthlyor longer-duration 3G68 average that were generatedfrom the single-hour grid. To implement this plan, afilter was constructed that checked if a pixel was overthe ocean, had non-zero precipitation, and had aprobability of less than or equal to 50%. When thisfilter was satisfied, the precipitation rate was set to zeroand the pixel was counted as a non-precipitating pixelin the 3G68 pixel count. Using this filter always lowersthe average precipitation rate to some degree.
Figure 2a shows the January 2001 monthly-average precipitation rates in 3G68 when this filter isused. Figure 2b shows the same month of data when nofiltering is used. In regions where precipitation ismoderate to heavy, there is little visible difference inthe filtered and unfiltered image. However, the regionsof light precipitation show larger differences. More
Page 5Stocker et al., paper #10830
specifically, just west of equatorial Africa, in theArabian Sea, and in the Bay of Bengal (regions 1 and2), the monthly-average precipitation rates areconsistently zero (shown in cyan) when filtering is doneand 10-5 to 10-4 mm h-1 (blue-purple in Figure 2b) whenno filtering is done. Similarly, in the ocean "deserts"downwind of continents (regions 3 and 4), there is ascattering of zero precipitation rates when filtering isdone and heaver precipitation rates of 0.1 mm h -1 (blue-green in Figure 2b) when no filtering is done.
Despite the initial plan, analysis showed that,with the filtering, the 3G68 product no longer matchedthe monthly retrievals stored in the TRMM 3A12product. For this reason, the filtering on precipitationrate was removed from the v7 3G68 software. Just asfor 3A12, 3G68 now includes all precipitationobservations when calculating average precipitationand, also as 3A12 does, 3G68 now excludes low-probability precipitation when calculating precipitationcounts.
After removing the filter in the precipitation-rate calculation, the 3G68 hourly grid was checkedagainst the instantaneous 2A12 swath. It was importantto substantiate that the 3G68 hourly grid was properlycapturing the instantaneous precipitation rate. Figure1b presents a precipitation feature in an orbit of v72A12. Figure 1d shows this same feature in theappropriate hour of a daily 3G68 file. This examplesuggests that the 3G68 algorithm is correctly capturingthe instantaneous precipitation rates in the 2A12 swath.
A next step was to compare the number ofprecipitation pixels that 3A12 and 3G68 find in a month
in each 0.5 ° by 0.5° grid box. The goal of thiscomparison was to ensure that the two level 3 productsare consistent. Figure 3a shows the count ofprecipitating pixels from v7 3A12 for January 2001observations. Figure 3b shows what the precipitatingpixel count would be in 3G68 if all of the non-zero2A12 precipitation were counted as precipitating pixels.Clearly, there is a mismatch between 3G68 and 3A12when this is done because there are large difference inFigures 3a and 3b. Figure 3c shows the v7 3G68precipitation pixel count when low-probabilityprecipitation is excluded. Comparing Figures 3a and 3csuggests that 3G68 now arrives at the same answer as3A12 in terms of the number of precipitating pixels.
European Geosciences UnionMay 2010 General Assembly, Vienna, Austria

At the end of this study, 3G68 applies no filter precipitation observations. An advantage of thiswhen calculating average precipitation rate but does approach is that it provides the researcher with aapply a filter when calculating the total number of “filtering” technique. Specifically, the researcher can
Fig 3. Monthly Precipitation Counts
............. ... ................. ...,-^ ... .........
The number of precipitation observations in each half degree grid box for the ITE202 test of TRMM v7 for January2001. (a) In v7 3A12, the precipitation count includes only the pixels that have a probability of precipitation greaterthan 50%. This means that although almost all ocean observations are used to calculate the monthly-averagesurface precipitation rate, many of these ocean observations are not included in the official count of precipitationobservations. (b) If v7 3G68 were to include in precipitation counts all of the observations included in the monthly-average precipitation-rate calculation, then v7 3G68 would report a much higher precipitation count than does v73A12. (c) When v7 3G68 uses the same threshold as v7 3A12, v7 3G68 calculates essentially the same value forprecipitation counts.
Page 6 European Geosciences UnionStocker et al., paper #10830 May 2010 General Assembly, Vienna, Austria

filter out grid boxes that only contain low-probabilityprecipitation by ignoring grid boxes that have non-zeroprecipitation and zero precipitation pixels. Such acombination of values in a monthly 3G68 grid boxindicates that all of the precipitation observations thatwent into that grid box were low-probabilityobservations.
The last step in this study was to look for anysmall differences in the monthly-average GPROFsurface precipitation estimates calculated by 3A12,3B31, and 3G68 (Figure 4). All three of thesealgorithms use the same basic method to calculatemonthly averages so only small differences should existin the results. The comparison is performed for theJanuary 2001 version 7 monthly TMI precipitation rate.Figure 4a shows that the monthly-average precipitationrate in the 3A12 product is typically about 0.1 mm h-1.Figure 4a also shows that the monthly-averageprecipitation rate is less than 10 -3 mm h-1 in only a fewlocations: west of equatorial Africa, in the Arabian Sea,and in the Bay of Bengal.
Figure 4b shows that the absolute differencebetween 3A12 and 3G68 is generally on the order of 10-3 mm h-1 , which is small compared with the typicalmonthly-average oceanic surface precipitation rate of0.1 mm h-1 . Figure 4c shows that the differencebetween 3A12 and 3G68 is under 1% in most of thetropics (the white regions of the figure). The percentdifference in Figure 4c exceeds 20% only in the threeabove-mentioned regions of the ocean where theaverage precipitation rate is extremely low, i.e., under10-3 mm h-1 in Figure 4a. The reason for the largepercent differences in Figure 4c in these three smallregions is that the hourly 3G68 grids storedprecipitation rate only to the nearest 10 -4 mm h-1 , whichintroduces a considerable round-off error only inregions where the typical rate rates are 10-3 mm h-1 asthey are in these three small regions.
Figure 4d shows that the percent differencebetween 3B31 and 3G68 is under 1% in most locationsin the ocean. The only places where it is consistentlygreater than 1% is the same three places noted abovewhere 3A12 and 3G68 differ by more than 1%. The3B31 product actually stores monthly accumulatedprecipitation in units of millimeters per month. To
generate Figure 4d, these units were converted intomonthly-average precipitation rates by dividing by themonthly accumulation by the number of hours in themonth. After this unit conversion, it is possible tocompare 3B31 and 3G68 precipitation values.
It might be possible to eliminate the above-mentioned three small regions of the ocean where 3G68has a >_20% difference in average surface precipitationrate relative to 3A12 and 3B31, but that would requireadding additional decimal places in the 3G68 formatbeyond the v7 increased 4 decimal places stored in thehourly 3G68 files and v7 increased 5 decimal placesstored in the monthly 3G68 files. At this time, it hasbeen decided that the increase in the 3G68 file size thatwould result from storing extra decimal placesoutweighs the advantage of closer agreement between3G68 and the other level 3 algorithms.
3. ConclusionFiltering out low precipitation rates with low
probability leads to an underestimation of the globalaverage precipitation rate by 3.5%. In some areas, theunderestimation could be 20% or more where theoceanic precipitation rate is low.
For this reason, the decision has been madenot to filter precipitation rates during the calculation ofTMI monthly-average precipitation rates in the TRMM3A12, 3B31, and 3G68 algorithms. These algorithmswill, however, filter out low-probability rain in thecalculation of the monthly count of precipitating pixels.It is felt that the end-user of these data products are in abetter position to make the appropriate determination ofif, and if so, how to filter out low-probabilityprecipitation or very light precipitation.
The level 3 monthly accumulations areconsistent with one another in how they treatprecipitation rates and the precipitation pixel counts.
Acknowledgements
Page 7
European Geosciences UnionStocker et al., paper #10830
May 2010 General Assembly, Vienna, Austria

Fig. 4. Monthly Average Surface Precipitation: V7 3G68 vs. V7 3A12 and V7 3B31
When 3G68, 3A12, and 3B31 use the same method to calculate monthly-average surface precipitation rate, the threealgorithms obtain nearly the same result. These images show data from the ITE202 test of TRMM Version 7 forobservations from January 2001. (a) 3A12 surface precipitation rate. (b) 3G68 and 3A12 differ generally by lessthan 0.001 mm h-1 . (c) As the percent of the 3G68 monthly average, the difference between 3A12 and 3G68 over theocean is less than 1% everywhere except in a few small regions where the precipitation rate is very low. At theselocations, some round-off error is to be expected because the monthly average precipitation rate there is near 10 -4
mm h-1 , which is the precision of 3G68 hourly grids. (d) The same except comparing 3B31 to 3G68.
Dave Randel provided helpful informationabout how version 7 GPROF works andrecommendations on how to use GPROF output in level3 products. John Kwiatkowski helped the authorsdevelop some of the ideas in this study, particularlywith regard to rainy pixel counts. The PPS Team ranmultiple versions of 3G68 and other version 7algorithms in an expeditious fashion so that the analysis
for this study could be completed in time. Specialthanks to the co-author Owen Kelley for generating thefigures in the paper and doing the detailed analysis formany of the issues.
References
Page 8 European Geosciences UnionStocker et al., paper #10830 May 2010 General Assembly, Vienna, Austria

[1] Stocker, E., 2000. Summary Information about3G68, NASA Goddard, Greenbelt. Availableonline at ftp://trmmopen.gsfc.nasa.gov/pub/README.3G68.
[2] PPS, 2007. PPS Interface Control Specification,Volume 4: Levels 2 and 3 File Specification,NASA Goddard, Greenbelt. Available online athttp://pps.gsfc.nasa.gov/.
[3] Kummerow, C., Y. Hong, W.S. Olson, S. Yang,R.F. Adler, J. McCollum, R. Ferraro, G. Petty,D.B. Shin, and T.T. Wilheit, 2001. The evolutionof the Goddard Profiling Algorithm (GPROF) forrainfall estimation from passive MicrowaveSensors. J. Appl. Meteor., 40, 1801–1820.[Describes GPROF version 5]
[4] Olson, William S., and co-authors, 2006.Precipitation and latent heating distributions fromsatellite passive microwave radiometry. Part I:Improved method and uncertainties, J. Appl.Meteor. and Climate, 45, 702–720. [DescribesGPROF version 6]
[5] Kummerow, C. D., S. Ringerud, J. Crook, D.Randel and W. Berg, 2010. An observationallygenerated A-Priori database for microwave rainfallretrievals, J. Atmos. Oceanic Tech., in review.[Describes GPROF version 7].
[6] Stocker, E. F., J. Kwiatkowski, and O. Kelley, 2001.Gridded hourly text product: A TRMM datareduction approach, IGARSS, Australia.
Page 9 European Geosciences UnionStocker et al., paper #10830 May 2010 General Assembly, Vienna, Austria


![TRMM Key TRMM Facts - NASA · 244 [ Missions: TRMM ] Earth Science Reference Handbook TRMM Science Goals • Obtain and study multiyear science data sets of tropical and subtropical](https://img.pdfslide.us/doc/110x75/5edb4b20ad6a402d66657010/trmm-key-trmm-facts-nasa-244-missions-trmm-earth-science-reference-handbook.jpg)