Embed Size (px)
Citation preview

1
Changes in the dynamics of Mexicans multinationals vis-á-vis the reforms on finance, energy and telecommunications in the midst of the crisis
Mexico City and New York, June 4, 2015 The Institute for Economic Research (IIEc) of the National Autonomous University of Mexico (UNAM) and the Columbia Center on Sustainable Investment (CCSI), a joint center of Columbia Law School and the Earth Institute at Columbia University in New York, are releasing the results of their sixth survey of Mexican multinationals today.1 The survey, conducted during 2014, is part of a long-term study of the rapid global expansion of multinational enterprises (MNEs) from emerging markets.2 The present report focuses on 2013 data.
Highlights
In 2013 the 20 largest Mexican MNEs had foreign assets of US$ 142 billion (Table 1), foreign revenue of US$ 98 billion, and 313,147 foreign employees (Annex I, Table 1). The two largest companies (América Móvil and CEMEX) together controlled US$ 88 billion, constituting 62% of total foreign assets of the MNEs on the list. The largest four MNEs (including Grupo México and Grupo FEMSA) held US$ 116 billion, representing 82% of the total. In terms of number of companies, the food and beverage industry leads the list with five firms, followed by diversified companies with four.
Only two companies are not listed on a stock market: PEMEX, an oil company wholly-owned by the Mexican State, and XIGNUX, a family-controlled conglomerate.
The 20 MNEs have 311 subsidiaries overseas. Since the 1990s, the highest concentration of subsidiaries has been in Latin America, followed by North America, primarily the United States; but this year Western Europe appears in second place (see Annex I, Figure 2, denoted “Other Europe”), slightly over North America, a continuation of the trend observed in our last EMGP report “Updated Features of Large Mexican Multinationals, 2012”.
1 This report was prepared by Dr. Jorge Basave Kunhardt and Dr. María Teresa Gutiérrez-Haces, Senior researchers at IIEc, UNAM. The authors of this report ask that this work be cited properly. Technical support was provided by Carmen Irene Rodríguez, Carmen Uribe Rangel and Iris Velasco. 2 Known as the Emerging Market Global Players” (EMGP) project, led internationally by CCSI.

2
Eastern Europe and Central Asia is in fourth place followed by South-East and Pacific Asia. None of the ranked firms are present in sub-Saharan Africa.
Table 1. Mexico: The top 20 non-financiala multinationals, by foreign assets, 2013 (US$ million)b
Rank Name Industry Statusc Foreign Assets 1 América Móvil Telecommunications Listed (Nil) 56,000 2 CEMEX Non-metallic minerals Listed (Nil) 32,234 3 Grupo México Mining Listed (Nil) 14,083 4 Grupo FEMSA Beverages Listed (Nil) 13,604 5 Grupo BIMBO Food products Listed (Nil) 7,094
6 Mexichem Chemical& petrochemicals Listed (Nil) 4,229
7 Grupo ALFA Diversified Listed (Nil) 3,054 8 GRUMA Food products Listed (Nil) 2,388 9 PEMEX Oil & gas Unlisted (100) 1,786 10 ARCA Beverages Listed (Nil) 1,554 11 Industria CH Steel & metal products Listed (Nil) 1,445 12 Cementos Chihuahua Non-metallic minerals Listed (Nil) 1,041 13 XIGNUX Diversified Unlisted (Nil) 922 14 Grupo ELEKTRA Retail trade Listed (Nil) 721
15 ICA Engineering & construction services Listed (Nil) 697
16 KUO Diversified Listed (Nil) 603 17 Grupo CARSO Diversified Listed (Nil) 426 18 ALSEA Food products Listed (Nil) 184
19 Altos Hornos de México Steel & metal products Listed (Nil) 164
20 San Luis Corp. Auto parts Listed (Nil) 147 Total 142,376
Source: Basave and Gutiérrez-Haces, IIEc-CCSI survey of Mexican multinationals, 2014, and company reports and websites. a Financial firms are excluded from the ranking as per the methodology of the Emerging Market Global Players project. b The exchange rate used is the IMF rate of December 31, 2013: US$ 1= Pesos 13.0098. c The percentage in parentheses shows the percentage of state-owned shares.
Profiles of the top 20 MNEs
• Changes to the list
Between 20123 and 2013 there were no changes in the first half of the list of the top 20 MNEs but there were various changes in the second half of the list. The most significant ones are: Industrias CH (steel and metal products), which climbed four notches, from 15th to 11th place; VITRO (non-metallic minerals), which fell out of the top 20 and is now ranked 25th (Annex I, Table 1a); Bachoco (food products), which similarly fell out of the top 20 and is now ranked 21st; and ALSEA (food products) and San Luis Corp. (auto parts),
3 IIEc and CCSI, Update Features of Large Mexican Multinationals, 2012, (December 11, 2013), Annex I, Table 1.

3
which both entered the top 20 in 18th and 20th places respectively. Other changes are the climb by Altos Hornos de México (steel and metal products) from 20th to 19th place, and the falls by ICA (engineering and construction services) from 13th to 15th, XIGNUX (diversified) from 12th to 13th, and Cementos Chihuahua (Non-metallic minerals) from 11th to 12th.
In order to present additional information on Mexican MNEs, Annex I, Table 1a, contains the same information as Annex 1, Table 1, but for the five runners-up that did not make it into the top 20. On this list appear Bachoco (food products) in 21st place and four other MNEs that were similarly part of this same runners-up list in 2011: Interceramic (non-metallic minerals), Accel (food products), VITRO (non-metallic minerals) and Bio Pappel (paper). HOMEX (construction) that appeared in our 2013 report was not included in this ranking because it did not provide relevant information.
• Driving factors of Mexican outward FDI
Outward FDI from Mexico continued expanding into various markets. Nevertheless, in contrast to the previous year, 2013 was relatively conservative. In comparison with the 2012 ranking, acquisitions by Mexican MNEs in 2013 were fewer but still significant.
The purchases made by some MNEs highlight the tendency of companies to diversify their investments in different industries. For example, FEMSA (beverages) has entered the food industry through the purchase of “Gorditas Doña Tota”.4
The main determinant of Mexican FDI continues to be broadening markets; however, Mexican MNEs also made various investments in the United States and Europe in order to increase the quality of their products through the acquisition of more sophisticated technological know-how. For instance, Mexichem, which belongs to the petrochemical industry and has acquired assets at a strong pace, increased its growth in markets where it had little participation through such transactions as the acquisition of US company PolyOne.5
During 2013, three ranked Mexican MNEs – América Móvil, FEMSA and ALSEA – continued acquiring companies in Latin America, which undoubtedly constitutes a regional expansion plan.
• Main industries
4 It is worthwhile mentioning that this family-owned company operates 204 units in Mexico and 11 in the state of Texas in the US. Out of the total, 30% operates with the franchise model, thus implying that FEMSA is looking for a higher participation in the market of southern US and in the north of Mexico. 5According to Carlos Manrique, CEO of Mexichem chlorine-vinyl division, this purchase represents participation in the US market with highly specialized and specific market niches. Also, one of the attractions of this purchase is the technological development of solutions tailored for different customers and the range of special resins which will significantly complement Mexichem’s product portfolio. He explained that the acquisition of PolyOne furthers Mexichem’s strategy of vertical integration with a focus on higher value-added products, for which currently Mexichem has a small market share.
4
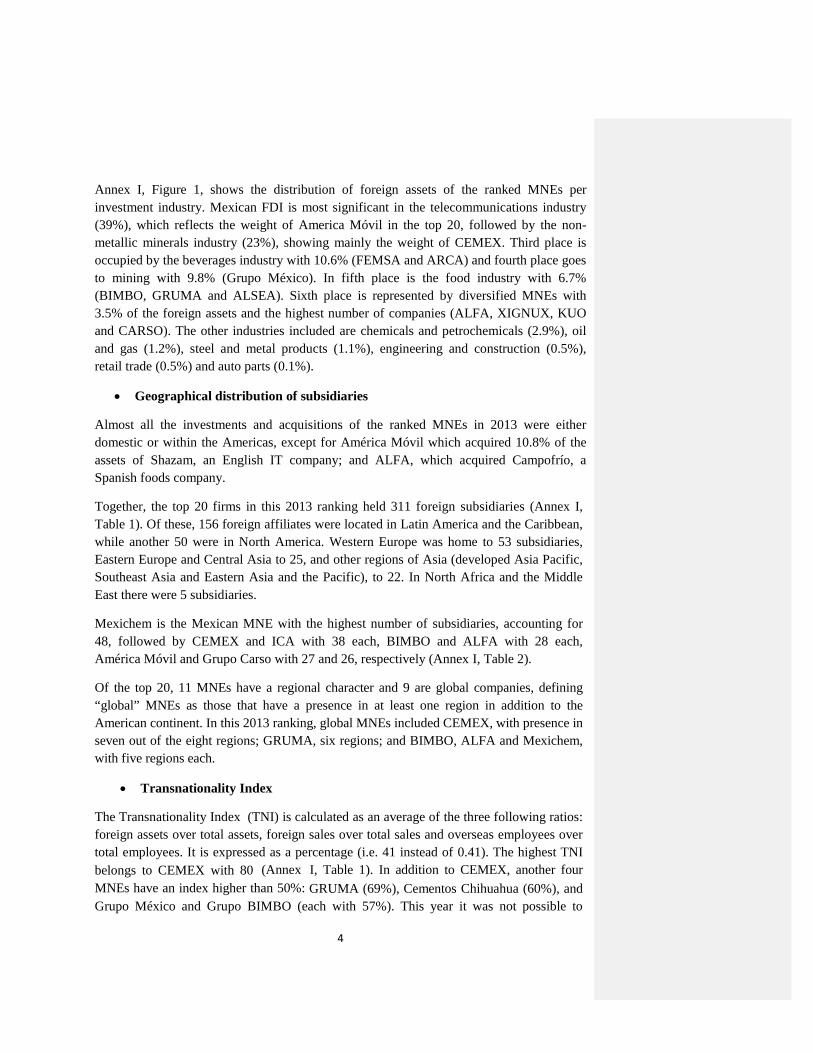
Annex I, Figure 1, shows the distribution of foreign assets of the ranked MNEs per investment industry. Mexican FDI is most significant in the telecommunications industry (39%), which reflects the weight of America Móvil in the top 20, followed by the non-metallic minerals industry (23%), showing mainly the weight of CEMEX. Third place is occupied by the beverages industry with 10.6% (FEMSA and ARCA) and fourth place goes to mining with 9.8% (Grupo México). In fifth place is the food industry with 6.7% (BIMBO, GRUMA and ALSEA). Sixth place is represented by diversified MNEs with 3.5% of the foreign assets and the highest number of companies (ALFA, XIGNUX, KUO and CARSO). The other industries included are chemicals and petrochemicals (2.9%), oil and gas (1.2%), steel and metal products (1.1%), engineering and construction (0.5%), retail trade (0.5%) and auto parts (0.1%).
• Geographical distribution of subsidiaries
Almost all the investments and acquisitions of the ranked MNEs in 2013 were either domestic or within the Americas, except for América Móvil which acquired 10.8% of the assets of Shazam, an English IT company; and ALFA, which acquired Campofrío, a Spanish foods company.
Together, the top 20 firms in this 2013 ranking held 311 foreign subsidiaries (Annex I, Table 1). Of these, 156 foreign affiliates were located in Latin America and the Caribbean, while another 50 were in North America. Western Europe was home to 53 subsidiaries, Eastern Europe and Central Asia to 25, and other regions of Asia (developed Asia Pacific, Southeast Asia and Eastern Asia and the Pacific), to 22. In North Africa and the Middle East there were 5 subsidiaries.
Mexichem is the Mexican MNE with the highest number of subsidiaries, accounting for 48, followed by CEMEX and ICA with 38 each, BIMBO and ALFA with 28 each, América Móvil and Grupo Carso with 27 and 26, respectively (Annex I, Table 2).
Of the top 20, 11 MNEs have a regional character and 9 are global companies, defining “global” MNEs as those that have a presence in at least one region in addition to the American continent. In this 2013 ranking, global MNEs included CEMEX, with presence in seven out of the eight regions; GRUMA, six regions; and BIMBO, ALFA and Mexichem, with five regions each.
• Transnationality Index
The Transnationality Index (TNI) is calculated as an average of the three following ratios: foreign assets over total assets, foreign sales over total sales and overseas employees over total employees. It is expressed as a percentage (i.e. 41 instead of 0.41). The highest TNI belongs to CEMEX with 80 (Annex I, Table 1). In addition to CEMEX, another four MNEs have an index higher than 50%: GRUMA (69%), Cementos Chihuahua (60%), and Grupo México and Grupo BIMBO (each with 57%). This year it was not possible to

5
thoroughly calculate the TNI for seven companies due to insufficient information on the number of employees, sales and/or assets abroad. These seven companies are Mexichem, ALFA, XIGNUS, ICA, KUO, AHMSA and San Luis Corp., most of which belonged to the diversified sector.
• Ownership status
PEMEX is the only MNE fully owned by the Mexican State. It and XIGNUX, a family-owned company (Garza-Herrera), are the only two MNEs in the ranking that are not listed on the Mexican Stock Exchange (BMV). The rest of the 18 MNEs are listed on the Mexican Stock Exchange and seven of them are also listed on the New York Stock Exchange and/or Latibex, the Spanish Stock Exchange (Annex I, Chart 3).
• The ten largest mergers and acquisitions (M&As), 2011-2013
The most important purchases in 2013 were those of FEMSA (2), which acquired Grupo Spaipa S.A and Companhia Fluminense de Refrigerantes in Brazil; and Mexichem (1) acquiring PolyOne Corp in the United States. Most (5) of the largest acquisitions occurred in 2012: América Móvil (2) in the Netherlands with KPN N.V and in Austria with Telecom Austria A.G.; Grupo ELEKTRA (1) in the United States with Advance America; FEMSA (1) in the Phillipines with Coca-Cola Bottlers Philippines Inc.; Mexichem (1) in the Netherlands with Wavin; and ARCA (2) in the United States and Ecuador, respectively, with Wise Foods Inc and Inalesa (Annex I, Chart 4).
• The 10 largest greenfield investments, 2010-2012, 2011-2013
The largest greenfield investments were by América Móvil with eight deals from 2011 to 2013 in Chile, Argentina, Brazil and Puerto Rico with an approximate total value of US$ 6.5 billion. The other two greenfield investments in this ranking were conducted by Grupo ALFA in the US and TV Azteca in Colombia.
• Location of headquarters and official language
Ten of the top 20 MNEs are headquartered in Mexico City, six in Nuevo León, one in Chihuahua, two in Estado de México and one in Coahuila (Annex I, Graph 3). The official language for all of the companies is Spanish.
• Changes in volume of assets, sales, and number of employees
As can be seen in Table 2 below, between 2011 and 2013 the foreign assets of the 20 largest Mexican MNEs increased by 11%. While significant, this is less than the growth in total assets, which rose by 19%. The ratio of foreign assets to total assets in 2013 was 57%, more than the ratio in 2012 (55%) but still below 2011 (61%).
In 2013 the ratio of foreign sales to total sales was 56%, four points higher than that in the previous two years. In the three years from 2011 through 2013, the MNEs’ foreign sales

6
increased by 34%, eleven points over the growth in total sales, which rose by 23%. These results reflect the increasing importance of foreign markets to Mexican MNEs.
In terms of employment, from 2011 to 2013, foreign employment grew by 17%, against a reduction of 16% in total employment. In 2013, the ratio of foreign employment was 37%, a substantial increase as compared to previous years.
Table 2. Mexico: A snapshot of the top 20 multinationals, 2011-2013 (US$ million)a
Variable 2011 2012 2013 % change, 2011-2013
Assets Foreign 126,376 131,475 140,590 11.25 Total 208,106 240,308 247,792 19.07 Share of foreign in total (%) 60.72 54.71 56.74 Sales Foreign 73,369 92,158 98,450 34.18 Total 142,115 177,265 174,491 22.78 Share of foreign in total (%) 51.63 51.99 56.42 Employment Foreign 266,715 273,998 311,447 16.77 Total 1,010,532 958,912 850,142 (15.87) Share of foreign in total (%) 26.39 28.57 36.63
Source: Basave and Gutiérrez-Haces, IIEc-CCSI survey of Mexican multinationals, 2014, and company reports and websites. a PEMEX is excluded from all three variables in order to avoid distortions due to the considerable weight that it represents in the aggregate data. If it were included, the share of foreign assets in total would be 40% in 2011, 34% in 2012 and 38% in 2013. In the case of employment, Mexichem, ALFA, XIGNUX, ICA, KUO, Altos Hornos and San Luis were excluded in 2013, Industria CH, KUO, ICA, XIGNUX and Altos Hornos in 2012, ALFA, XIGNUX, KUO, VITRO and Altos Hornos in 2011, because information on their foreign employment was unavailable.
The Big Picture
Mexican MNEs have been pursuing international expansion for more than two decades and, with a few exceptions, continued this trend during the recent crisis. Many of the largest MNEs continued acquiring other companies, expanding their reach and potential in and out of Mexican soil.
The expansion of Mexican MNEs is a result of Mexico’s stable economy and inward FDI that provides not only capital, but also knowledge and networks. Since 1994, Mexico has gained significant economic stability, which has been crucial for attracting foreign investments and developing certain economic sectors in the country, some of which represent strong and fast-growing sectors, such as auto parts, chemical, pharmaceutical, mining, telecommunications, and food and beverages.
FDI into Mexico has maintained relatively steady levels, providing a unique source of capital, knowledge and global networks for global expansion of Mexican MNEs. During 2013, FDI continued to flow to Mexico even when the economy did not grow as expected.

7
The GNP grew only 2% only and, according to the Bank of Mexico, has remained under 2.5% for 2014.
While the flows of FDI have remained relatively stable, the destinations have diversified slightly over the years, including by expanding into non-traditional sectors such as state-of-the-art technological services.
Reforms in Mexico
A series of legal reforms in Mexico have changed the institutional landscape of the Mexican economy and outward FDI activities. The most critical legislative economic reforms initiated during 2013 took place with regard to areas such as energy, taxes, finances and telecommunications. Significant political and education reforms were also adopted, including those related to transparency of government information.
Table 3. Selected Legal Reforms
Reforms Description
Energy Reform
In August 2013, President Enrique Peña Nieto (EPN) presented a bill to reform the energy sector. In December 21, 2013 Congress passed a Constitutional amendment to overhaul the Mexican energy sector. On August 12, 2014, the energy reform in its entirety was implemented in Mexico. It includes nine new laws as well as amendments to existing laws, and establishes a new legal framework for Mexico’s energy industry. The secondary legislation for the energy reform entered into force on October 31, 2014.
Telecommunications Reform
In March 11, 2013, President EPN introduced a bill to reform government regulations of the telecommunications industry. On May 22, 2013, Congress approved the reform law. It entered into force on June 10, 2013. In March 2014 the President EPN presented a bill to reform secondary legislation for the telecommunications industry. The secondary legislation for the telecommunications reform was implemented on July 14, 2014.
Financial Reform
The financial reform bill was filed on May 8, 2013 by President EPN under the Pact for Mexico.6 Congress approved financial reform on November 27, 2013. The financial reform entered into force in January 2014.
Fiscal Reform
Additional tax on dividends (October 2013) Foreign residents and Mexican individuals were be subject to an additional tax on dividends of 10% of profits generated as from 2014. These are to be withheld by the corporation paying the dividend and shall be considered as a final payment. This additional tax also applies to Mexican individuals who receive dividends from companies abroad. The Double Taxation Treaties will provide relief from these payment obligations in many cases. Excise Tax Law (IEPS) (December 2013)
6 The Pact for Mexico is an agreement signed between the main political forces and President Enrique Peña Nieto on December 2, 2012. Based on three central pillars – the strengthening of the Mexican state, political and economic democratization, and protection and expansion of social rights – and setting forth 95 principles, the Pact for Mexico aimed to advance approval of various reforms that had previously been obstructed by political gridlock.

8
Non-staple food with caloric density of 275 kcal or more per 100 grams will be taxed at the rate of 8%. Value Added Tax (VAT) Law (December 2013) Acts or activities carried out in the border region will be subject to the general rate of 16% (increased from 11% at the border zones) Mining rights (December 2013) 7.5% applied to the positive difference (profit) defined as the profit income from the disposal or sale of minerals arising from extraction activities and allowable deductions in the income tax law, excluding deductions relating to investments (e.g., depreciation) other than those made for prospecting and exploration of minerals, and profitability.
Educational Reform
The President EPN presented the education reform bill in 2012. In February 2013, both Chambers adopted the reform. Congress adopted the reform. On August 13, 2013, the President was presented the three regulatory initiatives related to implementing education reform. In September they were implemented.
Political and
Electoral Reform
The Political and Electoral Reform Bill was presented in 2013 by President EPN under the Pact for Mexico. The reform law entered into force on January 31, 2014 and was implemented on February 10, 2014.
Transparency Reform
President EPN presented the Transparency Reform Bill in 2013 under the Pact for Mexico. The reform law entered into force on February 7, 2014.
Fuente: Gutiérrez-Haces, Informes del congreso mexicano
Although most of these reforms were approved in 2013, in some cases the secondary laws are yet to be defined. When adopted, these will grant operational mechanisms and clear rules for each of the actors involved, among which are the majority of the enterprises analyzed in this ranking.
Two important reforms caused particularly heightened debate and significant moves at the Mexican Stock Exchange: the fiscal reform and the telecommunications reform. The tax reform directly affects the Mexican Stock Exchange and its investors since it places a 10% additional tax on individuals’ profits from stock sales and dividends; according to some commentators, this may discourage both national and foreign portfolio investments. The telecommunications laws were reformed through an anti-trust law intended in part to limit the power of companies offering telephone and cable TV. This law will harm large MNE América Móvil in the medium term; the law and its secondary laws have been in force since late 2014.
In light of these changes, América Móvil took proactive steps to comply with the reform, making significant internal changes in his companies in order to not be considered as “preponderant”. Under the reforms, a company is “preponderant” and subject to particularly strong regulation and government oversight if it controls “substantial market power” (a requirement that is automatically satisfied if the company controls at least 50 percent of the relevant market). In order to move below that 50 percent threshold, América Móvil has announced plans for the sale of a package of assets valued at more than US$ 20 billion.
Mexican Outward FDI (OFDI)

9
A key development that altered the markets and FDI in 2013 was the possibility that the US central bank would reduce its economic incentive program. This seriously disrupted the markets between the months of May and June of 2013 and, although uncertainty regarding such tapering by the US is still present, this fear has begun to gradually dissipate. While the data is mixed regarding the improvement of the world’s biggest economy, recent data concerning the labor sector show that the United States is still recovering. In addition, as it has been noted previously, fears regarding the European crisis have continued. The slow recovery in that region has also led to a slowdown of economies like the Chinese. In addition, various MNEs decided to take advantage of the European crisis and penetrate its markets.
Undoubtedly, Mexichem represents one of the best examples of how a company can take advantage of the European economic situation and acquire companies. With the purchase of German Vestolit and Dutch Wavin in 2013, the petrochemical company will make Europe one of its main source of income abroad. From 2013, roughly a third of Mexichem’s income came from their operations in Europe. CEMEX already reported similar numbers, likewise generating roughly one third of its income from European operations.
The legal battles of the Mexican MNEs abroad
As mentioned in previous reports, some Mexican MNEs have encountered serious problems with the governments in host countries in recent years. Nationalizations have given rise to conflicts affecting the assets of companies whose economic activities are in sectors especially sensitive in political and social terms, as is the case of the construction and food sectors. Companies like GRUMA and CEMEX resolved their disputes with Venezuela; however, these conflicts resulted in asset losses and millions of dollars of litigation expenses incurred in pursuing international arbitration. Those losses and costs unquestionably affected not only these companies’ finances, but also their profit expectations.
CEMEX has been the Mexican MNE that has faced the highest number of severe adverse actions. Apart from issues it faced in Venezuela, it has encountered difficulties in other countries such as Egypt where, since 1999, it has owned a production plant with an installed capacity of 5.4 million tons every year. CEMEX’s operations in Egypt represented 3 percent of its total sales in 2012, which amounted to US$ 461 million. In September 2012, CEMEX was notified of a decision issued by a civil court of first instance that invalidated CEMEX’s purchase of its investment from the Egyptian government 13 years before. CEMEX challenged that decision and, as of December 31, 2014, still faced legal uncertainty regarding the validity of its purchase of the Egyptian company.
There are important distinctions between the issues faced by CEMEX in Egypt and those faced by CEMEX and GRUMA in Venezuela. CEMEX’s challenges in Egypt arose out of

10
a lawsuit by former workers of Assiut Cement Company who disagreed with the privatization of the parastatal company. The Egyptian government did not initiate the dispute, and there do not appear to be allegations that the government has improperly interfered with the courts’ resolution of the case. In contrast, the challenges faced by CEMEX and GRUMA in Venezuela arose directly out of actions taken by the government through decisions to nationalize the firms’ assets.

11
For further information please contact:
Institute for Economic Research (IIEc), National Autonomous University of Mexico (UNAM) Jorge Basave Kunhardt Senior Researcher, IIEc, UNAM Mexican Coordinator Emerging Market Global Players Project 56230110 Ext. 42436 [email protected] María Teresa Gutiérrez-Haces Senior Researcher, IIEc, UNAM Mexican Coordinator Emerging Market Global Players Project 56230100 Ext. 42421 [email protected], [email protected]
Columbia Center on Sustainable Investment (CCSI) Lisa Sachs Director, CCSI [email protected] +1(212) 854-0691 Lise Johnson Head, Investment Law and Policy, CCSI [email protected] Victor Zitian Chen Assistant Professor in International Management Belk College of Business University of North Carolina at Charlotte Global Coordinator and Editor Emerging Market Global Players Project, CCSI [email protected]
Emerging Markets Global Players Project This report on Mexican multinationals was prepared in the framework of the Emerging Markets Global Players (EMGP) Project, an international collaborative effort led by the Columbia Center on Sustainable Investment (CCSI). It brings together researchers on FDI from leading institutions in emerging markets to generate annual reports on the leading multinationals in each participating country. Since 2007, reports have been published on 14 countries: Argentina, Brazil, Chile, China, Hungary, India, Israel, Republic of Korea, Mexico, Poland, Russia, Slovenia, Taiwan and Turkey. For further information, visit: http://ccsi.columbia.edu/publications/emgp/. Institute for Economic Research, UNAM The Institute for Economic Research (IIEc) is an academic institution of the National Autonomous University of Mexico (UNAM). Its main functions are research into, and circulation of, information on issues related to the economy. Participating in the IIEc are more than 110 academic specialists involved in 14 research units. Annually, the IIEc publishes three specialized journals on economic questions and several books. For further information visit: www.iiec.unam.mx. The UNAM is a public university and the largest in Latin America. For further information visit: www.unam.mx. Columbia Center on Sustainable Investment The Columbia Center on Sustainable Investment (CCSI), a joint center of Columbia Law School and the Earth Institute at Columbia University, is a leading applied research center and forum dedicated to the study, practice and discussion of sustainable international investment. Our mission is to develop and disseminate practical approaches and solutions, as well as to analyze topical policy-oriented issues, in order to maximize the impact of international investment for sustainable development. The Center undertakes its mission through interdisciplinary research, advisory projects, multi-stakeholder dialogue, educational programs, and the development of resources and tools. For more information, visit http://www.ccsi.columbia.edu/.
Código de campo cambiado
Código de campo cambiado

12
Annex I, table 1: Mexico: The top 20 multinationals: Key variables, 2013 (US$ milliona and number of employees)
(Ranked by foreign assets)
Rank Name Industry Assets Sales Employment TNI (%)
Number of
foreign affiliates
Number of host
countries
Foreign Total Foreign Total Foreign Total
1 América Móvil
Telecommunications 56,000(b) 79,568 39,240 60,424 90,929 173,174 63 25 19
2 CEMEX Non-metallic minerals
32,234 38,135 12,009 15,040 32,000 43,000 80 38 32
3 Grupo México Mining 14,083(b) 20,307 7,311 9,398 7,200 29,980 57 3 2
4 Grupo FEMSA
Beverages 13,604 27,609 7,312 19,839 70,856 220,062 39 9 9
5 Grupo BIMBO
Food products 7,094 10,356 7,907 13,531 55,000 129,000 57 28 18
6 Mexichem Chemical& petrochemicals
4,229(d) 7,885 3,324(b) 5,194 na 17,000(d) (59) 48 39
7 Grupo ALFA Diversified 3,054(b) 12,713 9,620 15,639 na 60,000 (43) 28 17
8 GRUMA Food products 2,388 3,275 2,945(c) 4,159 12,245 19,202 69 16 16
9 PEMEX Oil & gas 1,786(b)
(e) 126,22
8 na 118,197 1,700(b) 155,022 1 1 1
10 ARCA Beverages 1,554 5,100 1,296 4,640 7,683 39,273 26 2 2
11 Industria CH Steel & metal products
1,445 3,062 1,288(c) 2,125 2,422 6,174 49 7 3
12 Cementos Chihuahua
Non-metallic minerals
1,041 1,673 438 646 1,283 2,628 60 6 1
13 XIGNUX Diversified 922(b) 2,117 1,506(c) 2,823 na 18,352 (32) 5 6
14 Grupo ELEKTRA
Retail trade 721(b) (f) 13,434 1,394 5,437 18,874 84,334 18 7 7
15 ICA Engineering & construction services
697(b) 7,802 608 2,272 na 31,982(g) (12) 38 15

13
16 KUO Diversified 603(b) 1,635 887(b) 1,886 na 17,203 (42) 8 5
17 Grupo CARSO Diversified 426(d) 6,605 409 6,600 3,628(d) 70,953 6 26 16
18 ALSEA Food products 184 952 324 1,208 9,327 32,362 25 8 3
19 Altos Hornos de México
Steel & metal products 164(d) 4,859 2 2,834 na 20,958(d) (2) 4 2
20 San Luis Corp. Auto parts 147(b) 705 630(c) 796 na 4,600 (50) 4 2
Total 142,376 374,020 98,450 292,688 313,147 1,175,259 33(h) 311 215
Source: Basave and Gutiérrez-Haces, Survey of Mexican multinational, 2014, IIEc-CCSI, and consolidated company reports and websites.
a The exchange rate used is the IMF rate of December 31, 2013: US$ 1= Pesos 13.0098. b Estimated. c Exports included. d As of 2012. e Represents 50% of the joint venture with Shell Oil Co. in Deer Park Refining Ltd. of Texas. f Financial assets excluded. g Approximately 30% are permanent. By the nature of its activities, the number of temporary employees is very high. h The TNI is calculated as the average of the following three ratios: foreign assets to total assets, foreign sales to total sales and foreign employment to total employment. It is expressed as a percentage (i.e., “41” rather than “0.41”). When the TNI appears in parentheses, it has been calculated without the employment data

14
Annex I, Table 1a. Mexico: Key variables for runners-up, 2013 (US$ milliona and number of employees)
Rank Name Industry Assets Sales Employment
TNI (%)
Number of foreign
affiliates
Number of host
countries Foreign Total Foreign Total Foreign Total
1 Bachoco Food products 138 2,212 655 3,052 3,082 24,486 13 2 1
2 Interceramic Non-metallic minerals 136 415 157 513 554 4,320 25 1 1
3 Accel Food products 127 236 270 318 283 2,117 51 2 1
4 Bio Pappel Paper & paper products 75 1,329 171 901 185 8,120 9 1 1
5 Grupo VITRO
Non- metallic minerals 38(b) 2,570 52 1,656 600(b) 15,730 3 7 7
Total (average for the TNI percentage) 514 6,762 1,305 6,440 4,704 54,773 12(c) 13 11
Source: Basave and Gutiérrez-Haces, Survey of Mexican multinational, 2014, IIEc-CCSI, and consolidated company reports and websites.
a The exchange rate used is the IMF rate of December 31, 2013: US$ 1= Pesos 13.0098. b Estimated. c The TNI is calculated as the average of the following three ratios: foreign assets to total assets, foreign sales to total sales and foreign employment to total employment. It is expressed as a percentage (i.e., “41” rather than “0.41”). When the TNI appears in parentheses, it has been calculated without the employment data.

15
Annex I, Table 2. Mexico: The top 20 multinationals: Regionality Index, 2013 (percentages, except for the last column)
Company Middle East
& North Africa
East Asia & the Pacific South Asia Developed
Asia Pacific
East Europe & Central
Other Europe
Latin America & the Caribbean
North America
Number of foreign
affiliates
América Móvil 8 88 4 25 CEMEX 8 13 8 11 29 24 8 38 Grupo México 33 67 3 Grupo FEMSA 11 89 9 Grupo BIMBO 7 7 18 54 14 28 Mexichem 2 2 2 26 31 31 6 48 Grupo ALFA 7 14 32 18 29 28 GRUMA 13 6 19 19 38 6 16 PEMEX 100 1 ARCA 100 2 Industria CH 14 86 7 Cementos Chihuahua 100 6
XIGNUX 80 20 5 Grupo ELEKTRA 86 14 7 ICA 11 74 16 38 KUO 38 38 24 8 Grupo CARSO 4 92 4 26 ALSEA 100 8 Altos Hornos de México 50 50 4
San Luis Corp. 50 50 4 Total 58 80 10 19 77 190 971 598 311
Source: Basave and Gutiérrez-Haces, Survey of Mexican multinational, 2014, IIEc-CCSI, and consolidated company reports and websites.
a The regionality index is calculated by dividing the number of a firm’s foreign affiliates in a particular region of the world by its total number of foreign affiliates and multiplying the result by 100. Sub-Saharan Africa is not included among the regions as there is no Mexican presence there.

16
Annex I, Table 3. Mexico: The top 20 multinationals: Stock exchange listings, 2013
Company Domestic Foreign
América Móvil Mexican Stock Exchange New York Stock Exchange; Latibex in the Madrid Stock Exchange
CEMEX Mexican Stock Exchange New York Stock Exchange
Grupo México Mexican Stock Exchange None
Grupo FEMSA Mexican Stock Exchange New York Stock Exchange
Grupo BIMBO Mexican Stock Exchange None
Mexichem Mexican Stock Exchange None
Grupo ALFA Mexican Stock Exchange Latibex in the Madrid Stock Exchange
GRUMA Mexican Stock Exchange New York Stock Exchange
PEMEX None None
ARCA Mexican Stock Exchange None
Industria CH Mexican Stock Exchange None
Cementos Chihuahua Mexican Stock Exchange None
XIGNUX None None
Grupo ELEKTRA Mexican Stock Exchange Latibex in the Madrid Stock Exchange
ICA Mexican Stock Exchange New York Stock Exchange
KUO Mexican Stock Exchange None
Grupo CARSO Mexican Stock Exchange None
ALSEA Mexican Stock Exchange None
Altos Hornos de México Mexican Stock Exchange None
San Luis Corp. Mexican Stock Exchange None
Source: Basave and Gutiérrez-Haces, Survey of Mexican multinational, 2014, IIEc-CCSI, and consolidated company reports and websites.

17
Annex I, Table 3a. Mexico: The runners-up multinationals: Stock exchange listings, 2013
Company Domestic Foreign
Bachoco Mexican Stock Exchange New York Stock Exchange
Interceramic Mexican Stock Exchange None
Accel Mexican Stock Exchange None
Bio Pappel Mexican Stock Exchange None
Grupo VITRO Mexican Stock Exchange None
Source: Basave and Gutiérrez-Haces, Survey of Mexican multinational, 2014, IIEc-CCSI, and consolidated company reports and websites.

18
Annex I, Table 4. Mexico: Top 10 outward M&A transactions, 2011-2013 (US$ million)
Date Acquirer’s name Target company Target Industry Target country %of shares acquired
Value of transaction
12/2012 América Móvil KPN N.V Telecommunications Netherlands 29.77 4,281
03/2011 Grupo FEMSA Grupo Industrias Lácteas Beverages Panama 50 2,154
10/2013 Grupo FEMSA Grupo Spaipa SA Beverages Brazil 100 1,855
12/2012 América Móvil Telecom Austria A.G Telecommunications Austria 23.69 1,304
04/2012 Grupo ELEKTRA Advance America Consumer non-bank loans USA 100 780
01/2012 Grupo FEMSA Coca-Cola Bottlers Philippines, Inc. Beverages Philippines 51 689
05/2012 Mexichem Wavin Plastics Netherlands 87 620
08/2013 Grupo FEMSA Companhia Fluminense de Refrigerantes Beverages Brazil 100 448
11/2012 ARCA Wise Foods Inc. and Inalesa Food USA & Ecuador 100 330
05/2013 Mexichem PolyOne Corporation Plastics USA 100 250
Total 12,711
Source: Basave and Gutiérrez-Haces, Survey of Mexican multinational, 2014, IIEc-CCSI, and consolidated company reports and websites.

19
Annex I, Table 5. Mexico: Top 10 outward greenfield transactions announceda, 2011-2013 (US$ million)
Date Company Destination Industry Value of transaction
04/2011 América Móvil Chile ICT & Internet infrastructure 2,000
04/2011 América Móvil Argentina ICT & Internet infrastructure 1,500
06/2011 América Móvil Brazil ICT & Internet infrastructure 1,200
07/2012 América Móvil Brazil ICT & Electronics 600.7
12/2013 América Móvil Brazil ICT & Internet infrastructure 562.4
08/2012 Grupo ALFA United States Plastics 400.0
07/2012 América Móvil Argentina ICT & Electronics 249.0
11/2012 América Móvil Puerto Rico ICT & Electronics 239.9
12/2013 América Móvil Puerto Rico ICT & Internet infrastructure 220.6
07/2013 TV Azteca Colombia Communications 199.3
Total 7,171.9
Source: Adapted from fDi Intelligence, a service from the Financial Times Ltd.
a Note that these transactions may not have materialized exactly as listed here.

20
Annex I, figure 1. Mexico: Breakdown of the foreign assets of the top 20 multinational, by main industry, 2013 (percentages)
Industry Foreign
(US$ million) Number of companies Companies
Telecommunications 56,000 1 América Móvil Non-metallic minerals 33,275 2 CEMEX, Cementos Chihuahua Beverages 15,158 2 Grupo FEMSA, ARCA Mining 14,083 1 Grupo México Food 9,666 3 Grupo BIMBO, GRUMA, ALSEA Diversified 5,005 4 Grupo ALFA, XIGNUX, KUO, Grupo CARSO Chemical & petrochemicals 4,229 1 Mexichem Oil & gas 1,786 1 PEMEX Steel & metal products 1,609 2 Industria CH, Altos Hornos de México Retail trade 721 1 Grupo ELEKTRA Engineering & construction services 697 1 ICA Auto parts 147 1 San Luis Corp. TOTAL 142,376 20
Source: Basave and Gutiérrez-Haces, Survey of Mexican multinational, 2014, IIEc-CCSI, and consolidated company reports and websites.
Telecommunications 39%
Non-metallic minerals
23%
Beverages 10.6%
Mining 9.8%
Food 6.7%
Diversified 3.5% Chemical &
petrochemicals 2.9%
Oil & gas 1.2%
Steel & metal products
1.1%
Retail trade 0.5%
Engineering & construction
services 0.5%
Auto parts 0.1%
Others 2.2%

21
Annex I, Figure 2. Mexico: Foreign affiliates of the top 20 multinationals, by region 2013
Source: Basave and Gutiérrez-Haces, Survey of Mexican multinational, 2014, IIEc-CCSI, and consolidated company reports and websites.

22
Annex I, Figure 3. Mexico: Headquarter locations of the top 20 multinationals, 2013
Source: Basave and Gutiérrez-Haces, Survey of Mexican multinational, 2014, IIEc-CCSI, and consolidated company reports and websites.

23
Annex I, Figure 4. Mexico: Inward and outward FDI flows, 1980-2013 (US$ million)
Source: United Nations Conference on Trade and Development (UNCTAD), FDI STAT On-line database, (Geneva: United Nations Conference on Trade and Development), http://unctadstat.unctad.org, accessed October 8, 2014.
-5000
0
5000
10000
15000
20000
25000
30000
35000
40000
1980
1981
1982
1983
1984
1985
1986
1987
1988
1989
1990
1991
1992
1993
1994
1995
1996
1997
1998
1999
2000
2001
2002
2003
2004
2005
2006
2007
2008
2009
2010
2011
2012
2013
OFDI FDI

24
Annex I, Figure 5. Mexico: Inward and outward FDI stock, 1980-2013 (US$ million)
Source: United Nations Conference on Trade and Development (UNCTAD), FDI STAT On-line database, (Geneva: United Nations Conference on Trade and Development), http://unctadstat.unctad.org, accessed October 8, 2014
0
50000
100000
150000
200000
250000
300000
350000
400000
450000
1980
1981
1982
1983
1984
1985
1986
1987
1988
1989
1990
1991
1992
1993
1994
1995
1996
1997
1998
1999
2000
2001
2002
2003
2004
2005
2006
2007
2008
2009
2010
2011
2012
2013
Outward Inward